Embed Size (px)
Citation preview

FIELD ALIGNED E- AND F-LAYER BACKSýATTER OBSERVATIONS
by
NSUNANDA BASU
ROBERT L. VESPRINI
E1MMANUEL COLLEGE400O THE FENWAY
BOSTON, 1MASSACHUSET1tS 02115
Contract No. F19628-71-C.-0250
Project No. 414L
NATIONAL TECHNICAL
INFORMATION SlilC
Scientific Report No. 1 D C) l
January 1972 I MAY ~ i1
Contract Monitor: Jules Aarons
Ionospheric Physics Laboratory
This research was supported by theElectronics Systems Division.
Approved for public release; distribution unlimited.
Prepared for
AIR FORCE CAMBRIDGE RESEARCH LABORATORIESAIR FORCE SYSTEMS COMMANDUNITED STATES AIR FORCE
BEDFORD, MASSACHUSETTS 01730

ajn Itn2ici fi CA
DOCUMENT CONTROL DATA-R&D
Emmanuel College fine ncii f ce4400 The FenwaySRn~tnn •.t1ch•seTti• 21715l
S• all[P~K O*?T T~tGr. .. .. . .. .. .
FIELD ALIGNED E- AND F-LAYER BACKSCATTER OBSERVATIONS
S4~~~. Og $c Imp,. ID t C fl£ O tts p2J el .. w 4.4 igj/w9@ •ese.
Scientific. Interim.
Sunanda BasuRobert L. Vesprini4 40A .ea, gayS. TOTAL. NO OF PAG61 1T&. 5t..O UEPas
Ja.."c•un-ary 1977 ..50.., SS..oo, .. 3-,.51~~f CA€O*T"•C:T OR o•LLa•T "0 00 Qn.C...16irs41OoI"•lRr• T .40.09041
F19628-71-C-0250PROJECT. TASK. AND 001 UNITI Scientific Report No. I414L N/A N/A
C. ** ~E~ . to 0 .ENArpo"y 5.031e (Aly ~Whoom t 40 5 l. "
12417FO OOSUPI(EL= 67414L AFCRL-72-0128S|0. oIsM.To.. $ va67 14
A - Approved for public release; distribution unlimited.
This research was supported y Air Force Cambridgethe Electronics Systems Divi ion 1Research aboratories(LI__ __ _ _ _ L.G. Hlanscom FieldL.. *T...AC? Bedford. Massachusetts 01730
""'In a reanalysis of the 11F (19Mhlz) backscatter datafrom Plum Island MA, the occurrence of field aligned echoesfrom the E and F layers, called FAE(E) and FAE(F) respec-tively, was studied in-detail. FAE(E) during quietmagnetic conditions (K'rO- 3 ) is a nighttime phenomenon with
definite maximum during the summer, when it is accompanieby groundscattered Es. A weaker miximum is observed inthe winter. ].c.•onagnetic activity increases the occurrenceof FAE(E) whe&'-to seasonal control is evident. Durinigquiet magnetic conditions, FAE(F) are confined primarily tc[ sunset hours. The equinoxes show more activity than the""solstices, and the FAE(F) are generally accompanied byF-layer supported graundscatter echoes. FAE(F) shows apositive correlation with solar cycle. The incidence olS~FAE(F) increases m•onotonically w'ith KFr until a threshold
value is reached (KFr> 4 ), beyond which the depletion inthe background ionization causes it to decrease, with
1complete cut-off for KFr>7.
DD ,'.:.,1473 Unclass ified _,its
= 1 54
Unclassified= Secuntv Cstslfarat,.e
SmRev aOROS
NOL.C f ? OLC T W OLY f
Aurora
Ionosphere
Radar
II
IIIIIWE1
I ~ II ~ II
I I
I III I
Unclassi fied
•s55

ArcRL- '2-012S
FIELD ALIGNED E- AND F-LAYER BACKSCATTER OBSERVATIONS
by
iUNA"DA BASU
ROBERT L. VESPRINI
EMMANUEL COLLEGE400 THE FE.XAY
BOSTON, M1ASSACHIUSETTS 0211S
Contract No. F19628-71-C:0250
Project No. 414L
ft
Scientific Report No. 1
A •January 1972
Contract Monitor: Jules Aarons
Ionospheric Physics Laboratory
This research was supported by theElectronics Systems Division.
Approved for public release; distribution unlimited.
Prepared for
AIR FORCE CAMBRIDGE RESEARCH LABORATORIESAIR FORCE SYSTEM!S COM4AND
UNITED STATES AIR FORCEBEDFORD, MASSACiHUSETTS 01730

ABSTRACT
In a reanalysis of the IfF (19 Mh1z) backscatter data from
Plum Ieland MA, the occurrence of field aligned echoes from the
E and F layers, called FAE(E) and FAE(F) respectively, was
studied in detail. From this site, direct orthogonality with
the magnetic field can be achieved only at E-layer heights,
whereas refraction is necessary for the F layer. FAE(E) during
quiet magnetic conditions (KFrO- 3 ) is a nighttine phenomenon
with a definite maximum during the summer, when it is accom-
panied by groundscattered Es. A weaker maximum is observed in
the winter. Geomagnetic activity increases tha occurrence of
FAE(E) when no seasonal control is evident. rDuring quiet
magnetic conditions, FAE(F) are confined privarily to sunsethours. The equinoxes show more activity than the solstices,
f •and the FAE(F) are generally accompanied by F-layer 3upported
groundscatter echoes. FAE(F) shows a positive ;crrelation
with solar cycle. The incidence of FAE(F) increases monotonically
with XFr until a threshold value is reached (KFr> 4 ), beyond
which the depletion in the background ionization causes it-f to decrevtse, with complete .cut-off for KFr>7.
In t"e next sCient.ific report, the occurrence characteristics
of various groundscattered ec'.'oes will be presented and these
will be used to explain qualitatively the observed characteristics
of FAE.
2

TABLE OF CONTENTS
ItI1 Introduction2. Equipment
3. Data Reduction
4. Data Presentation
4.1 Occurrence of FAE(E) Ij
4.2 Occurrence of FAE(F)
S. Range Distribution of FAE
6. Average Seasonal Behavior of FAE[ 7. FAE as a Function of .Magnetic Activity
8. Solar Cycle Dependence of FAEI9. Summary and Conclusions
9.1 FAE(E)
9.2 FAE(F)
10. Future Work
* ii II "
I-- - _ =- = _ _ . .. . . . .. . ..

LIST OF FIGURES
Figure
I
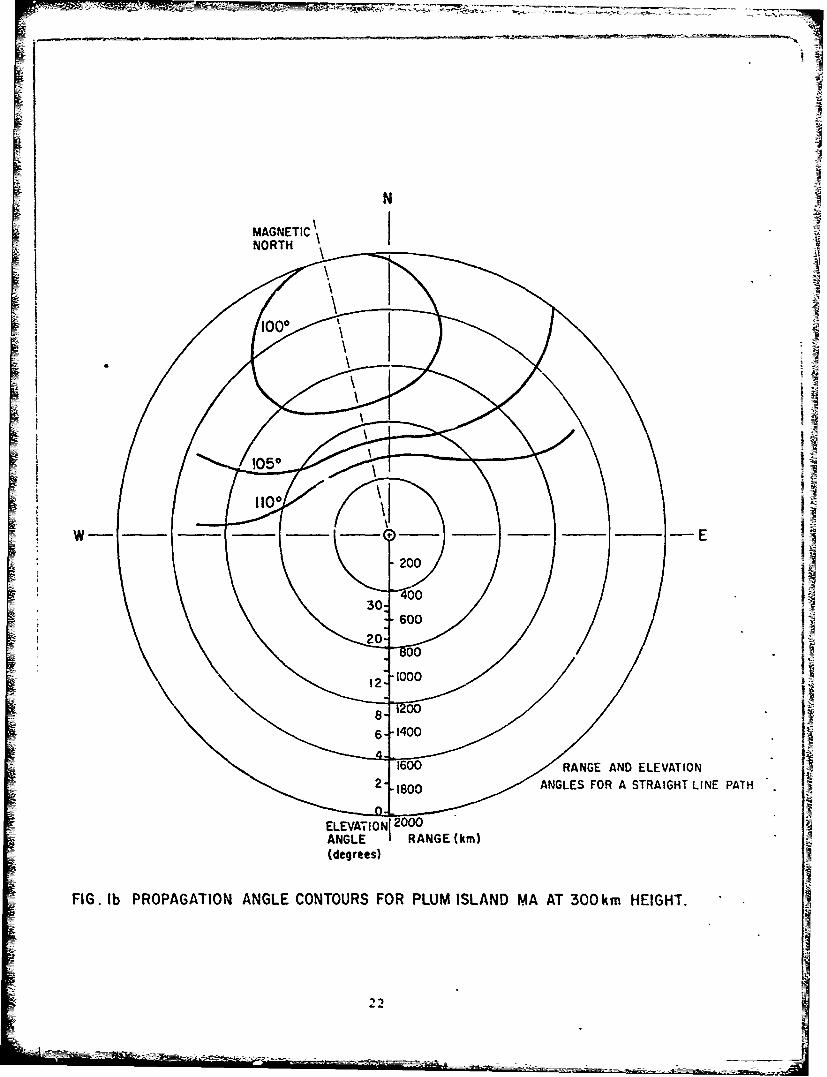
la Propagation angle contours for Plum Island MA at
110 km height
lb Propagation angle contours for Plum Island MA at
300 km height
2 Backscatter from field aligned irregularities at
E-layer heiihts for KFr 0-3 during 1961
3 Backscatter from field aligned irregularities at
E-layer heights for KFr 0-3 during 1962
4 Backscatter from field aligned irregularities at
E-layer heights for KFr 0-3 during 1963
5 Backscatter from field aligned irregularities at
E-layer heights for KFr 0-3 during 1964
6 Backscatter from field aligned irregularities at
E-layer heights for KFr 0-3 during 1965
7 Average E-layer backscatter for each month for
8 KFr 4-9 during the period 1961-1965
S8 Backscatter from field aligned irregularities at F-layer
heights for KFr 0-3 during 1961
9 aackscatter from field aligned irregularities at F-layer
heights for KFr 0-3 during 196210 Backscatter from field aligned irregularities at F-layer
heigrns for KFr 0-3 during 1963
11 Backscatter from field al.gned iriegularities at F-layer
heights for KFr 0-3 during 1964
12 Backscatter from field aligned irregularities at F-layer
heights for KFr 0-3 during 1965
13 Average F-layer backscatter for each month for KFr 4-9
during the period 1961-1965
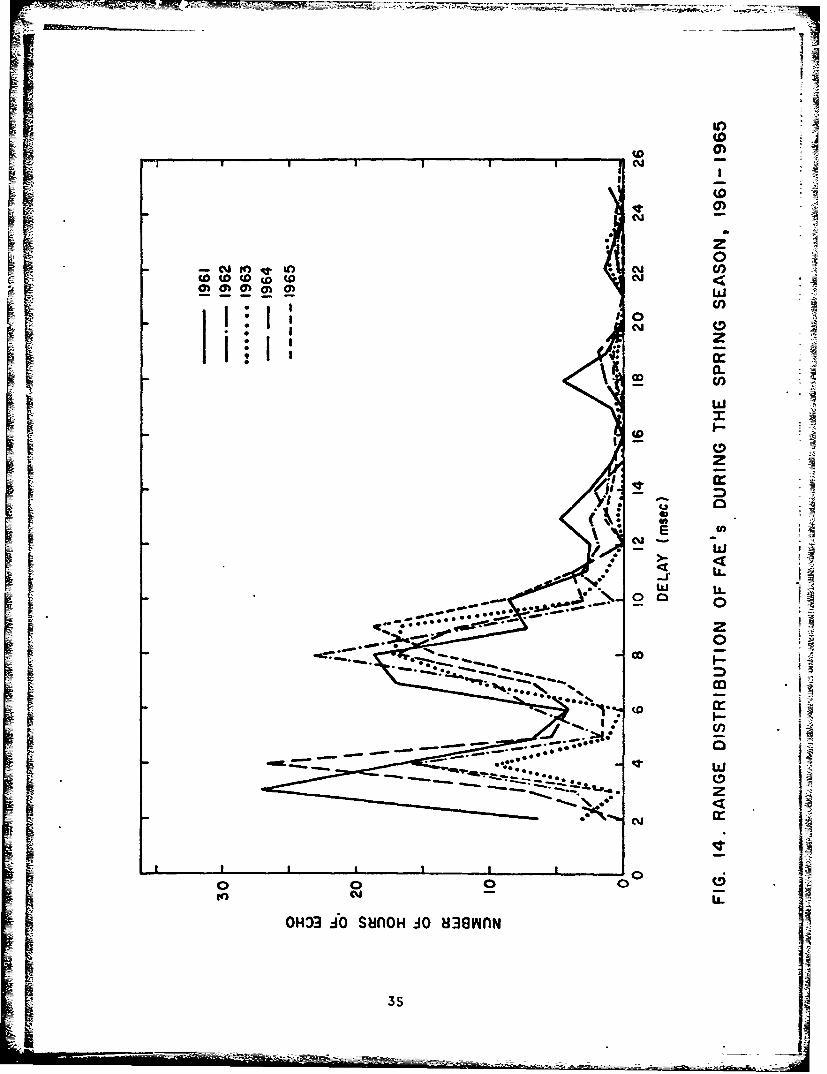
14 Range distribution of FAE's during the spring season,
1961-1965
4
4 M
= -~ -- -- -2

Figure
15 Possible muti-hop propagation modes and direct scatter
from field aligned irregularities in the E and F layers16 Range distribution of FAE's during the summer season,
1961-1965
17 Range distribution of FAE's during the fall season,
1961-1965
18 Range distribution of FAE's during the winter season,
1961-1965
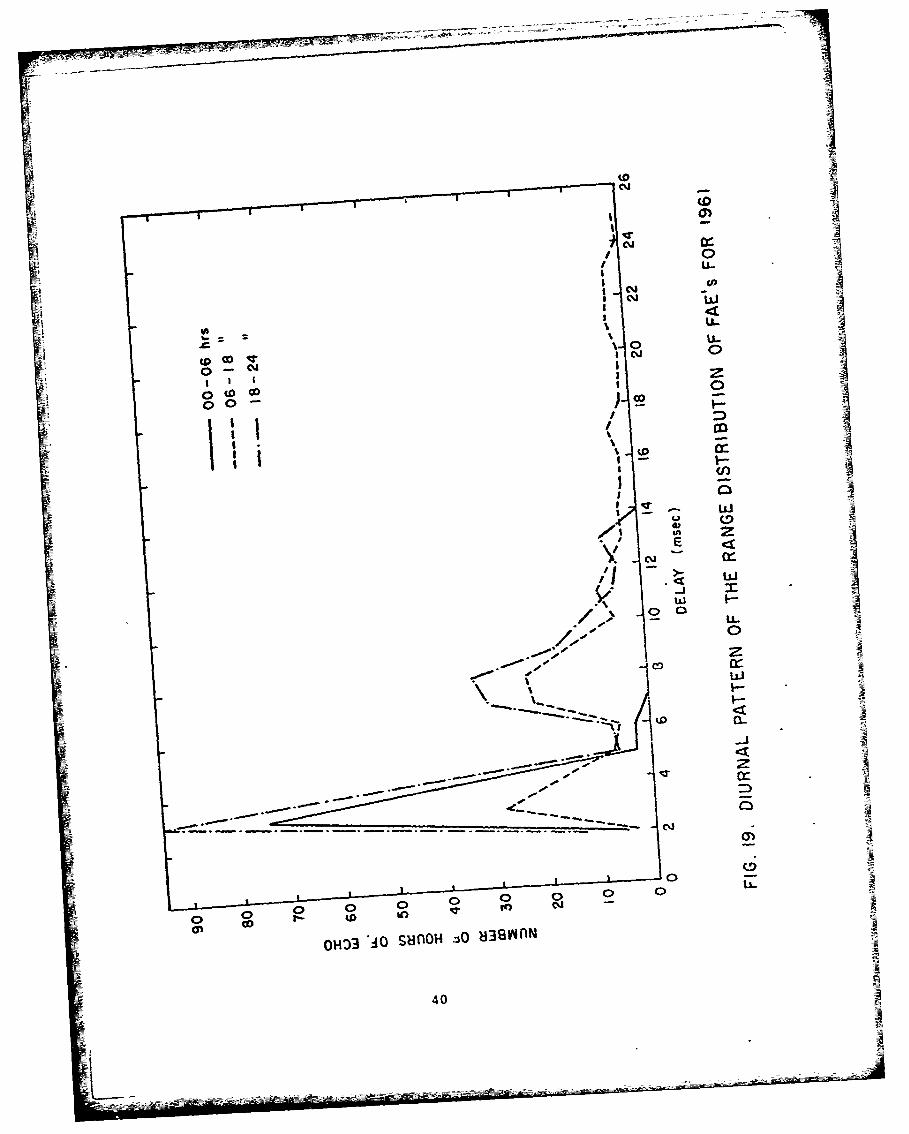
19 Diurnal pattern of the range distribution of FAE's
for 1961
20 Diurnal pattern of the range distribution of FAE's
for 1964
21 Percentage range distribution of all FAE occurrence
for 1961 & 1964
22 Average seasonal behavior of FAE(E) during magnetically
quiet and disturbed periods, 1961-1965
23 Average seasonal behavior of FAE(F) during magnetically
quiet and disturbed periods, 1961-1965
24 FAE(E) as a function of magnetic index KFr
25 FAE(F) as a function of magnetic index KFr
26 Percentage occurrence contours of E-layer echoes for
KFr 0-3 for 1961-1965
27 Percentage occurrence contours of F-layer echoes for
KFr 0-3 for 1961-1965
28 Mean Zurich sunspot numbers for 1961-1965
I
I4

1. INTRODUCTION
A !-onti-aous series of fixed frequency oblique backscatter
observi.:?ons -was conducted at the Plum Island site (42,630 N,70,8 20 6;j of the Sagamore Hill Radio Observatory between January
1961 and December 1965. The primary objective of this programwas to study the field aligned irregularities in the ionization
density at both E-layer and F-layer heights. These irregularities
are responsible for the auroral clutter which affects the per-
fermance vf HF, and even VHF and UHF, high latitude radars whose
pu-'jose is to detect and track aircraft and missiles (Leadabrand,
f,-4, . A prelminary analysis of a part of this data has been
p'c:_•:.ed by Mali i. and Aakions (1964) in which they noted the
f1equent occurrence of auroral echoes over a three year period.
A more recent analysis of the data has been made by Aarons (1971).
Studies of radar echoes from field aligned irregularities
hove been made for many years. However, studies of the fieldaligned E-region irregularities .to be henceforth referred to
as FAE(E)) have been more numerous as indicated in the review
articles by Booker (19(0), Chamberlain (1961) and Bowles (1964).
This is primarily because it is possible to achieve direct
orthogonality at E-layer heights from most mid-latitude and
sub-auroral stations. The condition that the earth's magnetic
field be perpendicular to the probing radar signal, also refer--ed
to as the aspect sensitivity requirement, is a necessary condition
for sufficient backscatter to occur. Recent work (Bates, 1971)
has shown that the intensity of the backscattered signal falls
off 5-6 dB per degree off orthogonality.
The detection of field aligned F-region irregularities
(FAL(F)) from most mid-latitude stations, however, will requiresufficient refraction in the underlying layers to achieve orthog-
onality at F-layer heights. In order that the amount of refrac-
tion be adequate, frequencies in the HF range have to be used.
The geometrical situation for the Plum Island site is shown in
6-A
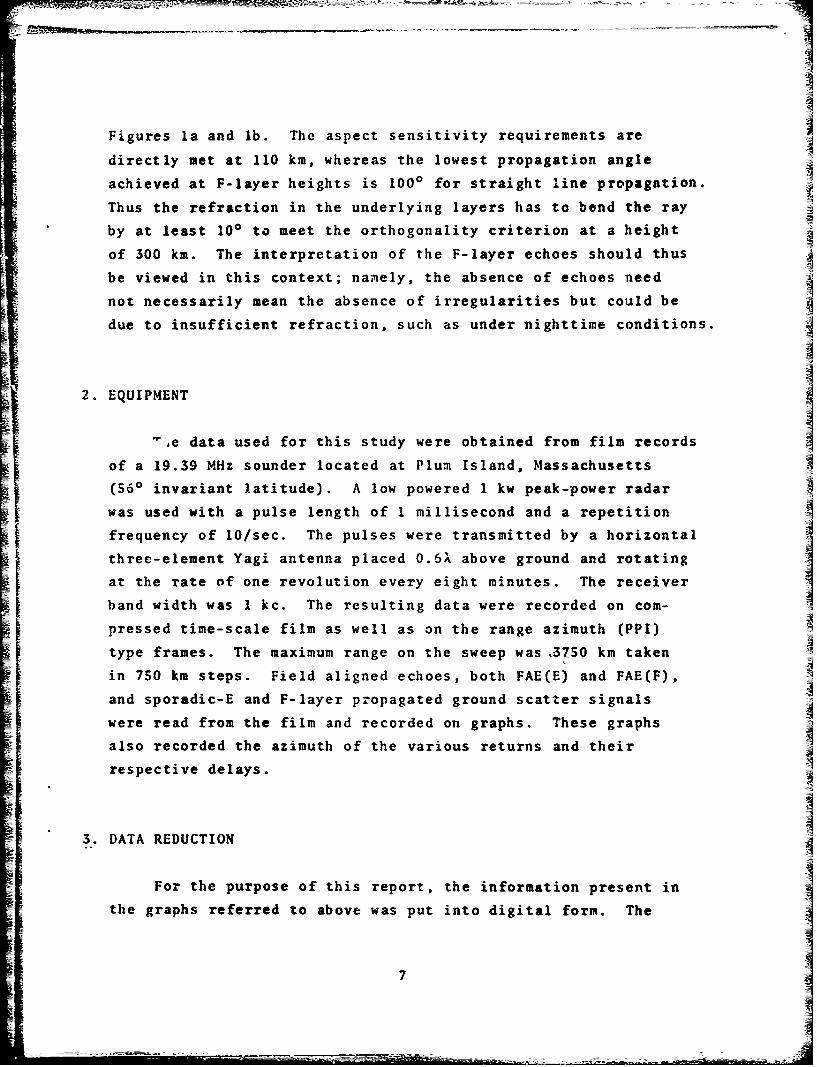
Figures la and lb. The aspect sensitivity requirements are
directly met at 110 kin, whereas the lowest propagation angle
achieved at F-layer heights is 1000 for straight line propagation.
Thus the refraction in the underlying layers has to bend the ray
by at least 100 to meet the orthogonality criterion at a height
of 300 km. The interpretation of the F-layer echoes should thus
be viewed in this context; namely, the absence of echoes need
not necessarily mean the absence of irregularities but could be
due to insufficient refraction, such as under nighttime conditions.
2. EQUIPMENT
V- ,e data used for this study were obtained from film records
of a 19.39 MHz sounder located at Plum Island, Massachusetts
(56 0 invariant latitude). A low powered 1 kw peak-power radar
was used with a pulse length of 1 millisecond and a repetition
frequency of 10/sec. The pulses were transmitted by a horizontal
three-element Yagi antenna placed 0.5A above ground and rotating
at the rate of one revolution every eight minutes. The receiverband width was 1 kc. The resulting data were recorded on com-
pressed time-scale film as well as on the range azimuth (PPI)
type frames. The maximum range on the sweep was ,37S0 km taken
in 750 km steps. Field aligned echoes, both FAE(E) and FAE(F),
and sporadic-E and F-layer propagated ground scatter signals
were read from the film and recorded on graphs. These graphs
also recorded the azimuth of the various returns and their
respective delays.
3. DATA REDUCTION
For the purpose of this report, the information present in
the graphs referred to above was put into digital form. The
7

basic procedure was to record on punch cards the duration of the
FAE and average delay, correct to the nearest millisecond foreach hour of the day. The azimuth of these echoes, i.e., obtainedfrom either the NW or NE quadrant, was also recorded. The
quadrant behavior, however, is to be treated with caution due to
the broad beamwidth (about 45 0 ) of the antenna used. When FA's
were observed, it was noted from the graphs whether sporadic-Eor F-layer supported groundscatter was simultaneously present inthe same quadrant. Results were recorded on the cards. The
3-hour magnetic activity index KFr obtained from Fredericksburg,
Virginia or Fort Belvoir, Virginia was also put on these cards.
It is to be mentioned that Fredericksburg is a few degrees to
the south of the station whereas the FAE t s are d from the
north. However, Fredericksburg is in the same longitude zone as
the observing site and this is considered important in the
separation of diurnal and magnetic activity dependence of FAE's.
The hours in which there was equipment failure were excluded
from the analysis.
The punch cards were first sorted by range to distinguish
between FAE(E) and FAE(F). It was found - and range scatter
plots will also show this - that echoes which were obtained with
delays less than six milliseconds (msec) were E-layer echoes.I Any echoes obtained at greater ranges are presumed to be either
direct F-layer echoes or a combination of multi-hop propagation
and field alignment. Each of these two broad categories are
then subdivided according to the Kpr index. A range of Kpr from
0-3 is considered to represent average quiet conditions, whereas
KFr ranging from 4-9 represents di 3 turbed conditions. Later
sorting on the basis of KFr alone will justify this grouping.
The data, after being divided into the four categories
mentioned above, were sorted to yield the percentage occurrence
in each hour for a particular month. This is an actual percentage
of occurrence obtained by dividing the number of hours the FAE
was present in that particular hour of the month by the total

number of samples available for the same month. Other groups,
•-_ such as that working at Washington State University (Keck and
flower, 1968) have used a definition whereby an occurrence of
FAE for more than 5 minutes in an hour is considered to be an
occurrence for the whole of that hour. Thus it is difficult
to compare occurrence statistics among various groups of workers.
4. DATA PRESENTATION
The behavior of the FAE's observed at Plum Island throughout
the years 1961-65 is presented in the form of a series of
histograms showing the diurnal variation of their percentage
occurrence. We shall discuss the characteristics of each type
of echo separately.
4.1 Occurrence of FAE(E)
The occurrence of FAE(L) for the five years of observation
is shown in Figures 2 through 7. Each diagram represents 12
nmonths of data. The first half of each hour represents per-
centage occurrence of echoes obtained from the NW quadrant in
tha* entire hour, whereas the second half represents the echoes
from the NE quadrant for that same hour. The shading within
the occurrence blocks shows the fraction of time for which
sporadic-E supported groundscatter was simultaneously present.
Figures 2 through 6 represent individual months for quiet
conditions, whereas Figure 7 represents average disturbed months
over the five years of observation, the samrles being statisti-
cally insignificant for each month separately. The number of
samples in Figures 2 through 6 range from a low of 18 (when
there were many disturbed periods) to a maximum of 31. The
month of December 1965 has about half as much data as the othe_
months because the observations were terminated in the middle
of the month. Equipment failure occurred very rarely. Figure 7,
9

even though an average over 5 years, has a similar number of
samples in each block except for a few daytime blocks when there
are less than ten samples.
The first obvious pattern of the quiet day FAE(E) is its
occurrence in the evening, nighttime, and early morning hours.fi
There is virtually no daktime FAE(li). There is a greater
incidence during the soistices than during the equinoxes, with
* the summer maximum being higher than that in the winter. The
winter months, having a longer period of darkness, showlecho
activity more :uniformly distributed over a longer period of
time than do the summer months. The increased occurrence
during the solstice period is usually accompanied by increased
sporadic-E supported propagation occurring simultaneously.
This leads us to believe that there ius a high degree of field-
alignment in the sporadic-E patches that appear to the north Of
the station during the evening hours of the summer and winter
months. The eq'uinoctial periods are characterized by little
or no occurrence at "ail, and very little of the FAE(E) that is
present is accompanied by thý sporadic-E type propagation so
common in the summer. Thus there is'a distinct seasonal.j
idependenice as well as diurnal dependence of quiet time FAE(E).
One other obvious feature in these diagrams is the greater
incidence of echo activity from the NW as compared to the NE.
This asymmetry becomes self-explanatory when the geometry of
the station as shown in Figure 1 is taken into consideration.
Since the magnetic pole is to the NW of the station, a much
greater degree of field alig,-ment 'is possible 'in that direction.
Figure 7, representing the average monthly behavior oft
FAE(E)'s over the five years of observation during magnetically.
disturbed conditions (KFr 4-9)', shows many features whi:ch are
differen.t from the quiet time behavior. A uniformly higher
nighttime percentage occurrente is obtained throughout the year,
thus obliterating any seasonal differences. in addition, much
more daytime activity is evident in the afternoon hours. The
10

summer and winter months, even though they have greater echo
activity, have much less supporting sporadic-E propagation.
This suggests that periods of magnetic activity tend to inhibit
the formation of sporadic E. A similar E-W asymmetry is some-
what reduced, leading us to believe that during periods of
greater magnetic activity the irregularities have a greater
density and are received by a broaa beam angle antenna at all
northern azimuths. o
4.2 Occurrence of FAE(F)4 The characteristics of the field aligned F-layer echoes
j• are discussed in *this section. This is a more complex phenom-
enon than the E-layer backscat~ter where orthogona&lity consider-
ations are universally met. The monthly percentage occurrenceI curves are presented in Figures 8 through 13 following the same
- general procedure as for the FAE(E). The only difference is
- that the shading in this case represents the fraction of time
for which the FAE(F) were accompanied by F-layer propagated
groundscatter. This gives us an idea af the amount of
refraction available. to produce orthogonality at F-layer
heights. The most obvious feature of the quiet day histograms
(Figures 8-12) is the sunset peak of occurrence of these echoes.
The peak is present throughout the year, but the equinoxes show
more activity than the solstices. It must be remembered that
, there is a great deal of FAE(E) during the solstices which
I reduces the energy reaching F-layer heights.,
A closer look at the diagrams shows that the peak echo
activity shifts with the tire of sunset - the peak occurs
earlier in winter and much later in summer, a fact already
pointed out by Malik and Aarons (19(;4). The supporting ground-scatte;r pattern follows the echo pattern, and it is the gradual
decrease of the groundscatter later in the evening that is
responsible for the tapering off seen in the e'cho activity.
This will be more clearly seen in the groundscatter contour
11R
JA

diagrams to be preseitted in a later report. From scintillation Iboundary concepts (Aarons and Allen, 1971), we know that the
late evening and midnight hours are precisely those during which
we expect an increased probability of finding F-layer field
aligned irregularities at the latitudes of interest. However,
the decay in underlying ionization at these hours makes it
impossible for the ray to achieve orthogonality at the higher
heights.I Some daytime backscatter is evident, almost all of it
entirely supported by groundscatter. This shows that during
the daytime refraction is adequate, but the absence of irreg- Iularities is the usual limiting factor. It is interesting to
note that there is hardly any daytime backscatter activity
during the summer which is probably due to the high incidence Iof Es. We shall see later that most of the daytime FAE(F) observed
have large delay times. There is a great deal of year-to-year
variability in the occurrence statistics - in general the
higher sunspot years showing greater activity.
The average behavior of the disturbed day FAE(F) is shown
in Figure 13. As in Figure 7, each month represents the w, ean
over five years of observation. There is an increase in the
daytime backscatter throughout the year except during the
summer months. There is also a shift in the sunset peak towards
earlier hours of the afternoon. We shall further discuss the
disturbed day features later in the report.
5. RANGE DISTRIBUTION OF FAE.
The range distribution of FAE's is presented in Figures 14and 16 through 18 on an individual seasonal basis to determine,
if possible, the most probable ranges for FAE(E) and FAE(F).
The diagrams include backscatter from both quiet and disturbed
days in each season. The seasons are defined such that spring
12

represents Feb-Apr; summcr, May-July; fall, Aug-Oct; and winter,
Nov-Jan. The ordinate represents the total number of hours of
backscatter echo obtained with delays ranging between 2 and
25 msec. It is to be emphasized that these are not percentage
occurrence curves, but each seasonal curve shows the total
number of hours of echo obtained in a particular season out of
a possible maximum of roughly 90 x 24 = 2160 hours. The graphs
are not shown as histograms in order to facilitate the super-
position of data obtained during the five consecutive years.
SEach seasonal curve clearly shows a maximum around 3-4 msec
delay and again around 7-9 msec delay with a distinct minimum
at 5 msec. Thus it is quite reasonable to assume that the
echoes represented by delays less than 6 msec are FAE(E), whereas
E-athe echoes obtained at delays o 6 msec originate in the F layer.
The range corresponding to each millisecond is 150 km for free
space propagation. Referring to Figure la, we find that for anS~E-layer height of 110 km, delays of 3-4 msec correspond to
elevation angles of 6-10*, and for azimuths centered around
magnetic north, these delays correspond to propagation angles
ranging betweea 89°-91. A direct comparison wtith Figure lb is
unjustified for the i'-layer echoes, as considerable refraction
makes the ray paths deviate greatly from idealized straight
line paths on which this diagram is based. In addition, there
is a much greater variability in the height of the F layer.
The long range fi-ld aligned echoes, though only a small
fraction of the regulax FAE(F), show certain interestingS4
features. All the seasons show small peaks around 13-14 msec,
another close to 18-19 msec, and a very small one near
22-23 msec. The first two of these roughly correspond to a
2FIE mode and a 3F2E mode respectively, in terms of their
observed delay as shown in Figure 15. It should be noted that
F for the 2FME mode the field alignment is in the E layer, whereas
for the 3F2E mode the field alignnent is in the F layer. Laterdiagrams will show that these long range echoes are observed
13

only in the daytime when there is sufficient ionization in the
E layer and the F layer. The possibility of observing such modes
of propagation has been demonstrated by Agy (1971) using raytracings through a model high-latitude ionosphere. The radarused being of low power, these mordes have the added advantageof a minimum number of traversals through the absorbing D region.
SFigures 16 through 18 show similar characteristics for the
three other seasons. Figure 16 which represents summer conditions
is somewhat different in as much as no long-range echoes are
observed. The decrease in F-layer activity may be attributed totwo causes: (1) the summer decrease in foF2 which decreases
refraction and (2) the high incidence of sporadic E which
severely decreases the energy reaching F-layer heights. Figure 18
representing winter conditions has only four graphs superposed
cn it since winter 1965 was not complete, observations having
been stopped in the middle of December. The interesting point
to note on this graph is the relatively large peak at 22 msec
which is probably due to the ground supported 3F mode with field
alignment in the F layer as shown in Figure 15. The winter
foF2 being the Iiighest and foE being the lowest of any seasonin the year, conditions for observing such a mode should be
most favorable in the winter.
To show the diurnal variation of the range of echoes in
any given year, the day was divided into 3 different time
periods: a daytime period between 0600 and 1800 hours, a sunsetand pre-midnight period between 1800 and 2400 hours, and
finally the post-midnight period between 0000 and 0600 hours.
The resulting graphs for the years 1961 and 1964 are shown in
Figures 19 and 20. All the long-range echoes are confined to
the daytime period, the evening hours show both E-layer andF-layer activity, whereas the post-midnight period shows only
E-layer activity. It is interesting to note that tCe horizonfor an altitude of 300 km is represented by a distance ofapproximately 2000 km which corresponds to a delay of 13 msec.
14ME

As such, all the activity in the evening hours can be explained
F E in terms of direct reflections from the E and F layers, and
those in the post-midnight period from the E layer alone. The
daytime long-range echoes are, however, obtained from distancesF far beyond the northern horizon where the probability of
encountering daytime irregularities is much enhanced. The year
1964 (Figure 20) shows reduced long range echo activity because
of the reduced solar activity being indicated by the very low
sunspot numbers (Figure 28). The perct-ntage of all echoes
obtained with a particular delay are shown in Figure 21 for the
years 1961 and 1964. The other years, with sunspot numbers
intermediate to those of these two years, have comparable
behavior. In order to get an idea of the total occurrence of
backscatter, it should be mentioned that backscatter occurred
for only 6% of the time throughout 1961, and of all the
occurrence noted, only 5% was of the long range kind, i.e., with
delays greater than 13 msec.
6. AVERAGE SEASONAL BEHAVIOR OF FAE
The average seasonal behavior c_" FAE(E) during both quiet
and disturbed magnetic periods is shown in Figure 22. The
quiet periods represent approximately 400 hours of data while
the disturbed periods range from 25 to 100 hours with the
majority of time-blocks ranging between 40-60 hours. As pointed
out earlier, the increased occurrence of FAE(E) during magnetic
storms is very prominent in all four seasons. In addition to
the increased evening and nighttime occurrence, there is a greatFdeal of daytime occurrence. In fact, virtually all the daytime
occurrence during these five years is during disturbed periods.The other interesting feature is the decrease of simultaneous
E r-supported propagation that accompanies the increase of
FAE(E)'s during storms. This suggests that magnetic storms

inhibit the formation of Es clouds. However, an influx of
charged particles at E-layer heights is responsible for the
enhanced FAE(E) (Paulikas, 1971).
A similar diagram for FAE(F) is shown in Figure 23. Here,
too, we find the same obvious increase with increased magnetic
activity, except during the summer where the opposite seems to
be trae. The summer storms at these latitudes are usually
followed by a large depletion of the F layer (Mendillo et al,
1969), and this reduced ionization seems to be responsible for
the decreased FAE(F). There is some daytime occurrence of
*:'gh backscatter even during quiet days. As a matter of fact,
all the long-range backscatter (> 13 msec) shown in Figures 14.
1[ 17, and 18 were obtained during quiet pericds. There is an
[ increase of daytime backscatter during disturbed periods but
they are all of the direct-F kind. It seems that during any
magnetic storm situation there is some depletion of the bottom-side F layer as well as increased absorption which is adequateto block out the long-range echoes.
7. FAE AS A FUNCTION OF MAGNETIC ACTIVITY
We have seen that generally both FAE(E) and FAE(F) increase
with magnetic activity. So far, however, we have considered tworanges of activity only. To study in detail the dependence of
backscatter on the level of magnetic activity, the FAE data
was sorted according to the KFr index. The result for the case
of E-layer irregularities is shown in Figure 24a, in which the
percentage occurrence of echoes is plotted as a function of
KFr. The data represents the entire five year period under
consideration, and the number of hours of observation belonging
to each K interval are indicated on the diagram. As before,
the first half of each K interval represents returns coming from
the NW, and the second half from the NE. The sample size becomes
16
--

rather small for K indices ranging 7-9. It is very obvious from
this graph that the E-layer backscatter is a very sensitive
function of the K index. Between K indices of 0-3 there is the
usual E-W asymmetry in the incidence of echoes, but the percentage
occurrence remains small. Beyond KFr > 4, the percentage
occurrence increases with each integral increase of K. It
finally levels off for KFr > 6, and the degree of asymmetry
levels off also, because irregularities appear at all northern
azimuths during severe magnetic storms. Figures 24b and 24c
show the same data when separated into daytime (0600-1800) and
nighttime (1800-0600) hours. Figure 24b shows the total lack
of FAE(E) during the daytime for K range 0-3, and a pronounced
increase beyond that range. The nighttime hours show a gradual
iij-crease for the low indices with the same prominent increase
for the high ones.
Similar diagrams for the F-lzyer backscatter are shown in
Figures 25a-c. The total occurrence characteristics are greatly
reduced - note the magnified occurrence scale. However it is
interesting to note the monotonic increase of occurrence with
K index up to a value of K=4, beyond which the occurrence tapers
off becoming zero for K > 7. Now, from scintillation studies
(Aarons et al, 1963), it is a well known fact that the incidence
of irregularities increases with KFr. Thus the decrease in the
FAlE-(F) is to be attributed to the depletion in the underlying
ionization during severe magnetic storms. The daytime situation
alone (Figure 25b) represents the 24 hour picture, as the
nighttime occurrence (Figure 2Sc) is insignificant. We have
seen earlier (Figures 19 and 20) that all of this low nighttime
occurrence takes place in the pre-midnight hours. The shading
within the histograms, which represents supporting F-layer
propag--ted groundscatter echoes, shows a behavior similar to
that of the field aligned echoes, i.e., increasing in proportion
to' the increased echo occurrence and then tapering off during
severe storms.
17

8. SOLAR CYCLE DEPENDENCE OF FAE i
To study the solar cycle dependence of the field aligned
echoes, if any, percentage occurrence contours of both E-layer A
and F-layer echoes were drawn for the entire five year period
of observation. The data base was restricted to quiet magnetic
conditions, and the occurrence statistics in the NW quadrant
were used for drawing the contours.
The FAE(E) contours are shown in Figure 26. The yearly
summer maximum during the evening and nighttime hours is theSmost distinctive feature. There is a much weaker but quite
definite secondary winter maximum. No definite solar cycle
dependence is discernible from the contours. A reference to
Figures 19 and 20 shows that there were more hours o. FAE(E) in
1961 than in 1964. However, it is difficult to come to a
definite conclusion with the limited solar cycle coverage
available.
The FAE(F) contours (Figure 27), show a positive dependence
on the solar cycle. There is a gradual decrease in the incidence
of echoes from 1961 to 1964, and then an upward trend is observed
in 1965. The rough sinusoidal pattern of echo occurrence is
evident as it follows the time of sunset throughout the seasons,
the echo onset being much earlier in winter than in summer. TheII mean monthly Zurich sunspct numbers for the period 1961-65 are
shown in Figure 28. Though a general trend is clearly visible,there is much mo.,th-to-month variability indicating that this
kind of variability should be expected in the FAE data also.
9. SUM•HARY AND CONCLUSIONSI This detailed study of field aligned irregularities in the
E and F layers of the ionosphere has yielded valuable information
regarding the diurnal, seasonal, and geomagnetic control of theoccurrence statistics. The i-nortant characteristics of each
1
l 18I --
- - - -- "

type of echo will be summarized below.
9.1 FAE(E)1. FAE(E) mostly occur at delays of 3-4 msec and are more
numerous in the NW quadrant which contains the magnetic
pole.
2. During quiet magnetic conditions (KFr 0-3), FAE(E) are
confined to the late evening and nighttime hours.
3. FAE(E) shows a very definite maximum during the summer
months. A weaker maximum is observed in the winter.
However, the diurnal variation mentioned in (2) is
always observed irrespective of season. The summer
FAE(E) is mostly accompanied by simultaneous ground-
scattered Es echoes.
4. Geomagnetic activity increases the occurrence of FAE(E).
A great deal of daytime activity as well as increased
nighttime activity is seen. No seasonal control is
evident. A marked decrease of simultaneous ground-
scattered Es echoes is observed.
S. There is no clearly defined solar-cycle dependence
of FAE(E) observed in the data.
9.2 FAE(F)
1. This type of echo is obtained only when sufficient
underlying ionization makes it possible for the ray
to achieve orthogonality with the geomagnetic field
at F-layer heights. FAE(F) are mostly observed at
delays of 7-9 msec and, like the FAE(E), occur mostly
in the NW.
2. During quiet magnetic conditions FAE(F) are confined
primarily to the sunset hours. Some daytime activity
is observed with delay times ranging between 15-25 msec.These long-range echoes can be explained in terms of
multi-hop propagation and field alignment.
19

IM
3. The equinoxes show more activity than the solstices-
~ I this can be explained in part by the greater FAE(E)
activity seen during the summer and winter, which
decreases the amount of energy reaching the F layer.
The time of the sunset peak naturally varies from
season to season. The FAE(F) is generally accompanied
by F-layer supported groundscatter echoes.
4. The dependence of FAE(F) on geomagnetic activity is
very interesting. A monotonic increase of the daytime
FAE(F) with KFr is observed until a threshold value
is reached (KFr= 4 ), beyond which the depletion of
F-layer background ionization causes it to decrease.
Complete cut-off is attained un~der severely disturbed
conditions (KFr> 7 ).
5. The incidence of FAE(F) shows a positive correlation
with the solar cycle.
10. FUTURE WORK
In the next report the occurrence characteristics of Es-
layer and F-layer supported groundscattered echoes will be
presented. In addition, fEs and foF2 of relevent ionospheric
stations will be studied in an effort to explain the observed
characteristics of field aligned echoes as well as ground-
scattered echoes. It is hoped that the FAE(E) can be explained
in terms of both the occurrence statistics of Es and the
equatorward movement of the auroral cval in times of magneticdisturbances. On the other hand, the diurnal pattern of the
scintillation boundary under quiet and disturbed conditions,and the change in F-layer ionization as a function of time,
latitude, season, and magnetic conditions, will be used to
explain qualitatively the observed incidence of FAE(F).
20

MAGNETICNORTH
I5S• > 880 900 3
R ANGETAN EL T
8-.600 i
800-2-lO00 RANGE AND ELEVATION :
ANGLES FOR A STRAIGHTELEVATION 1200 "LINE PATH !
ANGLE RANGE (kin) i(deg,'% rees)
•
FIG. Ia PROPAGATION ANGLE CONTOURS FOR IPLUM ISLAND MA AT IlOkm HEIGHT.
I4
21
NMAGNETIC \\ --
NORTH •
1000~
1051
1100I
W_--E
30. 00
S~600
S~~12-"!000
16 0 RANGE AND ELEVATION2 80 ANGLES FOR A STRAIGHT LINE PATH
ELEVAuION 2000ANGLE RANGE(km)(degrees)
FIG. lb PROPAGATION ANGLE CONTOURS FOR PLUM ISLAND MA AT 300km HEIGHT.
22

-1C=
wz
I M-
ww
0
I, -A
04
ODi
0000 0000 L 0 0 0 001') W~ - i rJt
IL.S 23
C3 w

H I-
Io 3Iii
4 4 W
Di C
___ __ <4O --j .4,
I I1=J ~.J L2~i~i--
14 0 *
Ii-ý ., (
Nf I V i
0=
0 0 00 0 0 00 0 00 0 00 0
30NJ~ufnooo IN3083d IL
24

I Cuj
z1 EM Cu
34 p 1)-
Gii
z~ GoIxI
C32k- 0 0
w~ W wc
LLa
0J 0
a) &L U)0w D 0
L---
cu, U-
~~~E)~~ Cu)I) (J ~ uV[ 3ONJ~flDO 1NDLiI
2I5

.1 I 1(I)
a-j
z '44
0 LL
co~
1. 1 . W IAI J -I LL.
4qI
4~ A ~
00~ 000 00 0 00
24 0ID ___L
7A _o
-- __ -~--

IULL
i J10H IAI OWI CD'
Z (n 2D1
-! 0LU
U.I
c nn 0
LL < (0 z 0
ILSI0
11 T
-L-
too
0s 0 0 000 000
-~ -,
27

II
-4
W 10
LL.L
La
>~ U9
w 0U. z .4
*1 w
-1 -r
-I 4
I * I, * * I * * .* ~I * I * o J
0 0 0 0 0 0 0 0 0 00000
~- f) N P~ N N 1') NWI
zD3IlD iNDr
(28

C3,I IAJ
z 2D
U. 0m( 0 AJ
L L A -i ~-
WI
0 000 _LL. uI z3O~~LLO Zn 0i~
294ý

TMI
-. w
4M w~
LL-j F-
w Cr)w 3
LL. _X -f)
U)- LIL
Oz
0 >-~0 >w U (. D0
U . U) i J o c lIe~~( If,5* .5
w a)1TJU
LI 1 C,
cu cn 4
300

clii
I cr
mJJJ
M4 <
W~~( zJ0L.wi
w 1c) 0 >~IU 03 H0
LL 4p
0
3 L31

Cl)
M C,
I Z 0.
p A-
IrILLF4
LW -J cLL IL,
LLA. ._
0
IL. IL ) ML4 4
w ON
4L E
1w
*.4 (D 0
0 00 00 0000 0 000 0000 0~~~r C4e i) CJ - - fto w -
30N3munfl3oo IN3ON3d
32

II1I CD
1~3 w
Cf)1 zz w
0- 0
cis IA. U).
AJ W 0 LL. -UlI. U. J 4
aZ w
Z z0~ >.00
w 4 0 -
100
=1i LL0
*1 * ~ ~ * ~ *: ii_____ ____ * ____ z
IL cSONLL- d

E4 I
-fil(D C
Iz(L ~0Q
I C0)
rL z ZD 0
Ir r
00Xa
t- 4 MC3a
Im LL- - - -->.I_
:,oI J.4 4 .4, >-z 14 <.
4 I ~14 ~
00 0 00 0 0 0 0Co 0 0 00>0 0~J to - CM - ' ) N -
3ON3urnnooo 1N3O0i3d
34A AN
AI
(.0
ClD
0
0 z
CL1D
z
0 < 3
0
qc z
000
Cr)
'000,;wI
Nj cr-
NN
oK~ H O zosunfoH qo 8i38V'nN
3SI

LL1
uIi
I-- --
Ir-
4 w
IL N La.IA-
zC
to
3G=

CDD1D 0
_ _ _ _ _ __ _ _ _ __ _ _ (
NrI' I I CCD
CC,
10 -.
zzzz
* Nj LLI0 H 3 :f SldOH 4 133i~w
35I

Ar-.
........ ...
LIU CD
I- w
* / (/)U
LLIcr.o
00
36

110-
100 - :
90-
1961- - 1962S80 ... 1963-
"--- 1964---- 1965
o 70-wIo I i:
- u 60 -I
o 50
40 II
30- IA232
30
10 22 4. 1
V= DELAY (msec)
FIG. 16 -RANGE DISTRIBUTION or FAE's DURING THE FlSUMMER SEASON, .96 1965.
SI~-- _ - --- i--'
-:A0u a I37

C~C
ld*)
-LJ
I-i
40
* - . P -OD*-
400
01133 3OS~JfOH 30O 8I39VAN

C~CD
M* 0) 0
w
CD
LL.
LL.
CD d
NO6 0a 0 0 00 0
CM cc
-:2
U-1e~j -
0I La..
00
C> 0
O~CDell
Ia-
zI* q~* -
- U Q
03
404

vIA
cl1i
1(~ 0
II
CD,
z7
979
C-iiI-j
OD .ý C- -n rn - cu . -. . c.
0 03040 0uO :0 03 w 0 N.
41

--ill
C~j 0
C~CD
00
OD w
00
-1 WA
Lii
Ii 0
co z<
-j-
r CD
L. z
rrL I
CM'
0 L) 0 I) 0 I) 0 U
S3~NJufl3o IIV 30 39V1N3?J~d
42

-D 0
2 - I rWo-- LU wo
LL.
10 1
a2,
Al -0 ILNIr00
4 --
-'~~ - -LIU
CL - to Al~Z
LL z w a z 7Fr)~F W 0 L.- rj
434
-- n I--= -- ~--~-
CM-C - CM - -

IOD Zwwj
0-
0)0
a~- ir w -
z -J - LL'
Cl) U)0i
(I) I .1 (
;< < I i* I. I
4 4 .F- _j•7L X U)M
La.. (nO< w
z *I 111 Li
Uf) 4U) L it O-' II lo
0000o 0 00 0 00 00 00 0coN - Nu - U O
30N3Nifno-oo IN3U0d
44

w
co w
C1 0IcIz

LLi
CDI
U .~ z
LL.
0/'
_i 0
C- o
an
('a CM)
K)~
to IT 0
30N388noooO % a
46

w0)0Z Z
u wjZ
= ~ 0 4 - 11111 111
AD 0
0 w W if 1 1111, 1Z1
1-II I I i,1iii ll~l;
IaI0 111 1 l
LL.L0 -0
--I
0 z
ILL.
o
CA ciL(.0 ID10 CJ - 0
3DN3ufl3oo %
47

a: A
rc i7K I
z 0
I-- CDIr Lia
0 -ý
0.
0 W CD .
333Ifl3
c48

cn
LL
2 IS
w
I-In
OR Clb
C.)I1ncr
I n w -5
InI
I, M~ CD r-( 0 VD% MWU
49w

Ini
o 0W~)-
on I
Ur-
0
CC.
42
.cn WFD
0 j w
('J~2 e3 0' I
II
so

i0
CDj
0 ODCM
0)
0 0IiD LO I f,)~MH NV3WAIHINO
51w

REFERENCES
Aarons, J., H.F. Auroral Backscatter and the Scintillation
Boundary in "Radar Propagation in the Arctic", AGARD
Symposium, Lindau, Germany, Sept., 1971.
Aarons, J., and R.S. Allen, "Scintillation Boundary during
Quiet and Disturbed Magnetic Conditions",
J. Geophys. Res., 76, 170, 1971.
Aarons, J., J.P. Mullen, and Sunanda Basu, "Geomagnetic
Control of Satellite Scintillations", J. Geophys. Res.,
68, 3159, 1963.
Agy, V., A Model for the Study and Prediction of Auroral
Effects on HF Radar in "Radar Propagation in the
A-rctic", AGARD Symposium, Lindau, Germany, Sept., 1971.
Bates, H.H., "The Aspect Sensitivity of Spread-F
Irregularities", J. Atmos. Terr. Phys., 33, 111, 1971.
Booker, H.G., "Radar Studies of the Aurora", Physics of
the Upper Atmosphere, edited by J. A. Ratcliffe,
Academic Press, New York, 1960.
Bowles, K.L., "Radio Wave Scattering in the Ionosphere",
Advances in Electronic and Electron Physics, edited
by L. Morton, Academic Press, New York, 1964.
Chamberlain, J.W., Physics of the Aurora and Airglow,
Academic Press, New York, 1961.
Keck, R.D., and G. L. Hower, "Backscatter Radar Observations
at WSU - 1957-1966", Washington State University,
College of Engineering, Research Report 68/16-45,
Pullman, Washington, 1968.
Leadabrand, R.L., Electromagnetic Measurements of Auroras
in "Symposium on Auroras", Palo Alto, California,
January, 1964.
Malik, C., and J. Aarons, "A Study of Auroral Echoes at
19.4 M4egacycles per Second", J. Geophys. Res., 69,
2731, 1964.
52

- - _• -•j ._=•_ - _ •I_ • ;: = _ - -- : - -... . . .: . ..... -- -
Mendillo, M.. M.D. Papagianis, and J.A. Klobuchar, "A Seasonal
Effect in the Mid-latitude Slab Thickness Variations
During Magnetic Disturbances", J. Atmos. Terr. Phys.,
31, 1359, 1969.
Paulikas, G.A., "The Patterns and Sources of High Latitude
Particle Precipitation", Rev. Geophys. Space Phys.,
9, 659, 1971. I
__
I
53
:_--i~~--