Embed Size (px)
Citation preview
April 2012
Non-Discrimination Policy
The U.S. Department of Agriculture (USDA) prohibits discrimination in all of its programs and activities on the basis of race, color, national origin, age, disability, and where applicable, sex, marital status, familial status, parental status, religion, sexual orientation, political beliefs, genetic information, reprisal, or because all or part of an individual’s income is derived from any public assistance program. (Not all prohibited bases apply to all programs.) Persons with disabilities who require alternative means for communication of program information (Braille, large print, audiotape, etc.) should contact USDA’s TARGET Center at (202) 720-2600 (voice and TDD). To file a complaint of discrimination, write: USDA, Director, Office of Adjudication, 1400 Independence Ave., SW, Washington, DC 20250-9410 or call (866) 632-9992 (Toll-free Customer Service), (800) 877-8339 (Local or Federal relay), (866) 377-8642 (Relay voice users). USDA is an equal opportunity provider and employer.
NNaattiioonnaall SSuurrvveeyy ooff WWIICC PPaarrttiicciippaannttss IIII
VVoolluummee 11:: PPaarrttiicciippaanntt CChhaarraacctteerriissttiiccss ((FFiinnaall RReeppoorrtt))
Authors:
Daniel M. Geller, Marcia Harrington, Gary Huang, et al.
Submitted by:
ICF Macro 11785 Beltsville Drive, Suite 300 Calverton, Maryland 20705
Submitted to:
USDA, Food and Nutrition Service 3101 Park Center Drive Alexandria, Virginia 22302
Project Director:
Daniel M. Geller
Project Officer:
Sheku Kamara. Karen Castellanos-Brown
This study was conducted under contract number: AG-3198-D-07-0105 with the Food and Nutrition Service.
This report is available on the Food and Nutrition Service website: http://www.fns.usda.gov/ora.
Suggested citation:
U.S. Department of Agriculture, Food and Nutrition Service, Office of Research and Analysis, National Survey of WIC Participants II: Participant Characteristics Report, by Daniel M. Geller, Ph.D., et al. Project Officers: Sheku G. Kamara, Karen Castellanos-Brown, Alexandria, VA: 2012.D
April 2012 Special Nutrition Programs
Report No. CN-10-NSWP2-R2

iii National Survey of WIC Participants II
ACKNOWLEDGMENTS
ICF Macro would like to thank each of the State Special Supplemental Nutrition Program for Women, Infants, and Children (WIC) agencies who provided sampling frame information and participant data from local entities that were selected during sampling. We also would like to thank local clinics/agencies who supported our field interviewers by acknowledging the importance of their work and helping them obtain updated contact information for participants, when possible. In addition, we want to thank State agencies in West Virginia and the District of Columbia, who supported pretesting activities. Directors and IT leads and others from several State agencies provided extra support along the way in various capacities: Cynthia Melde (Arizona), Ruth Caldwell (California), Richard Bates (Colorado), Debbie Eibeck (Florida), Tim Mooney and Holly Esford (New York), and many others, too numerous to name. Finally, we would like to thank all of those at Food and Nutrition Service who helped us accomplish so many things necessary to the completion of the National Survey of WIC Participants II.

v National Survey of WIC Participants II
CONTENTS Acknowledgments ............................................................................................................................. iii
Executive Summary .......................................................................................................................... vii
Introduction ............................................................................................................................... vii
Survey Methodology ................................................................................................................. vii
Findings .................................................................................................................................... viii
Chapter 1. Overview of the WIC Program and Program Eligibility ........................................... 1
1.1 Objectives of the Study .................................................................................................... 3
1.2 Effect of the New Food Package on the NSWP-II Study ................................................ 4
Chapter 2. Survey Methodology ........................................................................................................ 5
2.1 Source of Data .................................................................................................................. 7
2.2 Sample Design .................................................................................................................. 8
2.3 Non-Response Bias Analysis ......................................................................................... 16
Chapter 3. Characteristics of WIC Participants and Households .............................................. 21
3.1 Caseload Composition and Growth ................................................................................ 22
3.2 Characteristics of WIC Participants ............................................................................... 25
3.3 Factors Affecting Enrollment and Continued Participation ........................................... 27
3.4 Participation in Other Food Assistance Programs and Health Insurance Coverage ...... 57
3.5 Food Security among WIC Participants ......................................................................... 66
3.6 Incidence and Duration of Breastfeeding ....................................................................... 72
3.7 Nutrition Education and Impact on Behavior ................................................................ 80
Appendices
Appendix A: Telephone Survey Instruments A1: Telephone Survey Instrument (Pregnant, Breastfeeding, and Postpartum Version) A2: Telephone Survey Instrument (Infant and Child Version)
Appendix B: In-person Survey Instrument—Partial Appendix C: Technical Appendix Appendix D: Non-Response Bias Analysis
D1: Response and Cooperation Rates, (All Telephone Survey Items) D2: Item Non-Response (All Telephone Survey Items) D3: Differences Between Original Weights and Raked Weights on Selected Measures D4: Race/Ethnicity (Using California Coding), by Primary Measures
Appendix E: Additional Data Tables (with p values)

vii National Survey of WIC Participants II
EXECUTIVE SUMMARY
Introduction
For 35 years the Special Supplemental Nutrition Program for Women, Infants, and Children (WIC) has provided benefits to low-income pregnant and postpartum women, and to infants and young children who are at nutritional risk. The WIC Program, the United States Department of Agriculture’s (USDA) third largest food and nutrition assistance program, serves more than 9 million participants monthly and continues to grow. Half of the participants are comprised of children between ages 1 and 5 years; one-fourth consist of infants; and the remaining fourth consist of, in descending order, pregnant, nonbreastfeeding postpartum1, and breastfeeding women.
This report, the first of three, addresses the first objective of the study, which is to explore the characteristics and experiences of WIC participants. The first National Survey of WIC Participants (NSWP-I) provided similar information in 2001. The National Surveys of WIC Participants augment the data collected in the biennial Participant and Program Characteristics reports, but the approaches and data sources differ. The National Surveys of WIC Participants are based on participant samples and include participants’ use of and satisfaction with the WIC program and services; the value of the program; and an assessment of food security. In contrast, the biennial Participant and Program Characteristics reports are based on information gathered by States on all participants during certification (a near-census) and reported in the Minimum Data Set (MDS) and the Supplemental Data Set (SDS).
This National Survey of WIC Participants II (NSWP-II) is based on surveys conducted largely in the last quarter of 2009, 11 years after NSWP-I surveys were conducted in 1998.2 This first report focuses on an assessment of the characteristics of participants who received WIC services, and their experiences with the WIC Program from their perspectives.
A second report will provide information on the policies, procedures, and operations at State and local WIC agencies. A third report on erroneous payments will verify the data reported during certification of eligibility. Specifically, household income, a major criterion for WIC eligibility (along with participant category, nutritional need, and residence) will be substantiated based on either direct proof of qualifying income or adjunctive eligibility—that is, participation in another benefit program such as Temporary Assistance for Needy Families (TANF), Medicaid, or the Supplemental Nutrition Assistance Program (SNAP) formerly known as Food Stamps.
Survey Methodology
The survey of WIC participants consisted of two interviews: one by telephone with the full sample of 2,538 WIC participants, and the second conducted in person with 1,210 of the respondents from the first group. The sample was selected using a multi-stage approach, with probability proportional to size (PPS). First, 40 sample clusters were selected from the 48 contiguous States and the District of Columbia based on the number of WIC participants with Probability Minimum
1 Henceforth, the term postpartum will refer to postpartum women participants who did not breasfeed. 2 The report for the 1998 fieldwork was published in 2001.
Volume 1: Participant Characteristics (Final Report)
National Survey of WIC Participants II viii
Replacement. The clusters were identified in 23 separate States, with 7 States selected multiple times. For efficiency in interviewing, States were divided into geographic clusters of local WIC agencies; the number of clusters from which participants in a State were interviewed corresponded to the number of sample clusters selected in that State. Within the sampled clusters, local agencies were sampled (two per cluster, except at one very large agency that was sampled three times), then clinics (two per local agency, with a few exceptions due to small clinic size), and finally participants in proportion to the numerical size of the participant category in the sampled clinic.
A field interviewer was assigned to each sample cluster to complete 60 telephone interviews and 30 in-person interviews. The purpose of the in-person interview was to review supporting documentation from the participant that would verify whether their eligibility was correctly determined. So that respondents would be able to gather supporting documentation and present it to the interviewer, the interviews were normally conducted in the participant’s home. The interviews were conducted using computer-assisted personal interviewing between late September 2009 and January 2010 by 40 interviewers (25 of whom were bilingual English-Spanish).
A response rate of 51.3 percent was achieved, which translated to a cooperation rate of 78.0 percent among potential respondents that were actually reached. Non-response analysis revealed no selection bias.
Data for the sample selection were obtained from the 23 sampled States.3 Detailed participant-level data were requested for all participants in the sampled WIC clinics who received food issuances for use during the target month of May 2009. The data included WIC participant category, participant identification numbers and contact information, food issuances, dates of certification, types of eligibility proofs provided at certification, and size of the family economic unit.
Findings
Caseload Composition and Growth
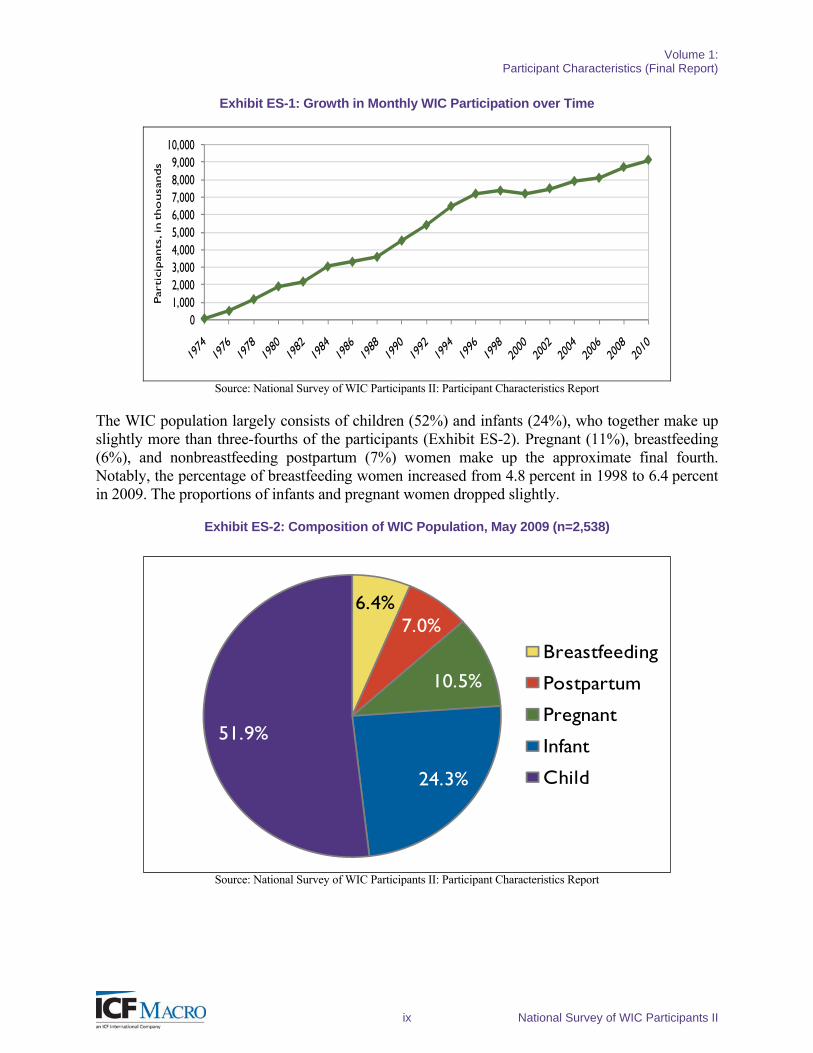
Monthly participation in WIC has grown tremendously since the program’s inception in the mid-1970’s, making it USDA’s third-largest nutrition assistance program after SNAP and the National School Lunch program (NSLP). The trend continues to show a steady upward growth (Exhibit ES-1).
3 Alabama, Arizona, California, Colorado, Florida, Georgia, Illinois, Indiana, Kansas, Louisiana, Maryland, Massachusetts, Michigan, Missouri, New Jersey, New York, North Carolina, Ohio, Pennsylvania, Tennessee, Texas, Virginia, and Washington.
Volume 1: Participant Characteristics (Final Report)
ix National Survey of WIC Participants II
Exhibit ES-1: Growth in Monthly WIC Participation over Time
01,0002,0003,0004,0005,0006,0007,0008,0009,000
10,000Par
tici
pan
ts, i
n tho
usa
nds
Source: National Survey of WIC Participants II: Participant Characteristics Report
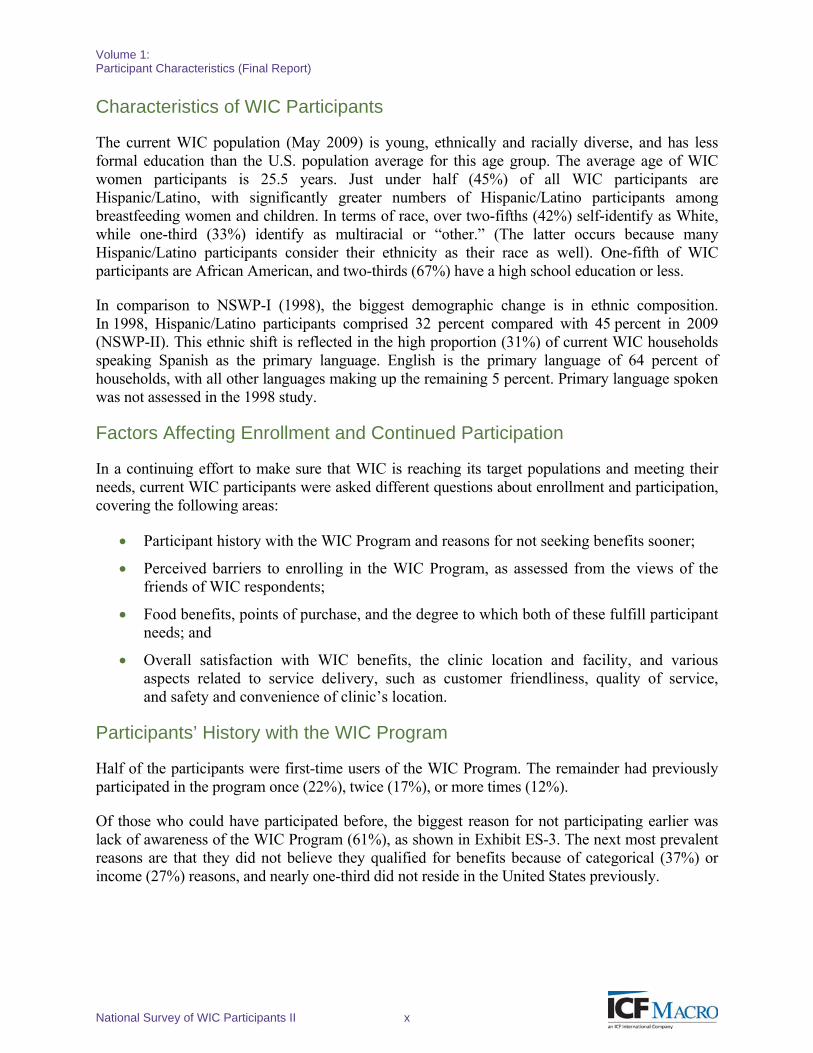
The WIC population largely consists of children (52%) and infants (24%), who together make up slightly more than three-fourths of the participants (Exhibit ES-2). Pregnant (11%), breastfeeding (6%), and nonbreastfeeding postpartum (7%) women make up the approximate final fourth. Notably, the percentage of breastfeeding women increased from 4.8 percent in 1998 to 6.4 percent in 2009. The proportions of infants and pregnant women dropped slightly.
Exhibit ES-2: Composition of WIC Population, May 2009 (n=2,538)
Source: National Survey of WIC Participants II: Participant Characteristics Report
6.4%7.0%
10.5%
24.3%
51.9%
Breastfeeding
Postpartum
Pregnant
Infant
Child
Volume 1: Participant Characteristics (Final Report)
National Survey of WIC Participants II x
Characteristics of WIC Participants
The current WIC population (May 2009) is young, ethnically and racially diverse, and has less formal education than the U.S. population average for this age group. The average age of WIC women participants is 25.5 years. Just under half (45%) of all WIC participants are Hispanic/Latino, with significantly greater numbers of Hispanic/Latino participants among breastfeeding women and children. In terms of race, over two-fifths (42%) self-identify as White, while one-third (33%) identify as multiracial or “other.” (The latter occurs because many Hispanic/Latino participants consider their ethnicity as their race as well). One-fifth of WIC participants are African American, and two-thirds (67%) have a high school education or less.
In comparison to NSWP-I (1998), the biggest demographic change is in ethnic composition. In 1998, Hispanic/Latino participants comprised 32 percent compared with 45 percent in 2009 (NSWP-II). This ethnic shift is reflected in the high proportion (31%) of current WIC households speaking Spanish as the primary language. English is the primary language of 64 percent of households, with all other languages making up the remaining 5 percent. Primary language spoken was not assessed in the 1998 study.
Factors Affecting Enrollment and Continued Participation
In a continuing effort to make sure that WIC is reaching its target populations and meeting their needs, current WIC participants were asked different questions about enrollment and participation, covering the following areas:
Participant history with the WIC Program and reasons for not seeking benefits sooner;
Perceived barriers to enrolling in the WIC Program, as assessed from the views of the friends of WIC respondents;
Food benefits, points of purchase, and the degree to which both of these fulfill participant needs; and
Overall satisfaction with WIC benefits, the clinic location and facility, and various aspects related to service delivery, such as customer friendliness, quality of service, and safety and convenience of clinic’s location.
Participants’ History with the WIC Program
Half of the participants were first-time users of the WIC Program. The remainder had previously participated in the program once (22%), twice (17%), or more times (12%).
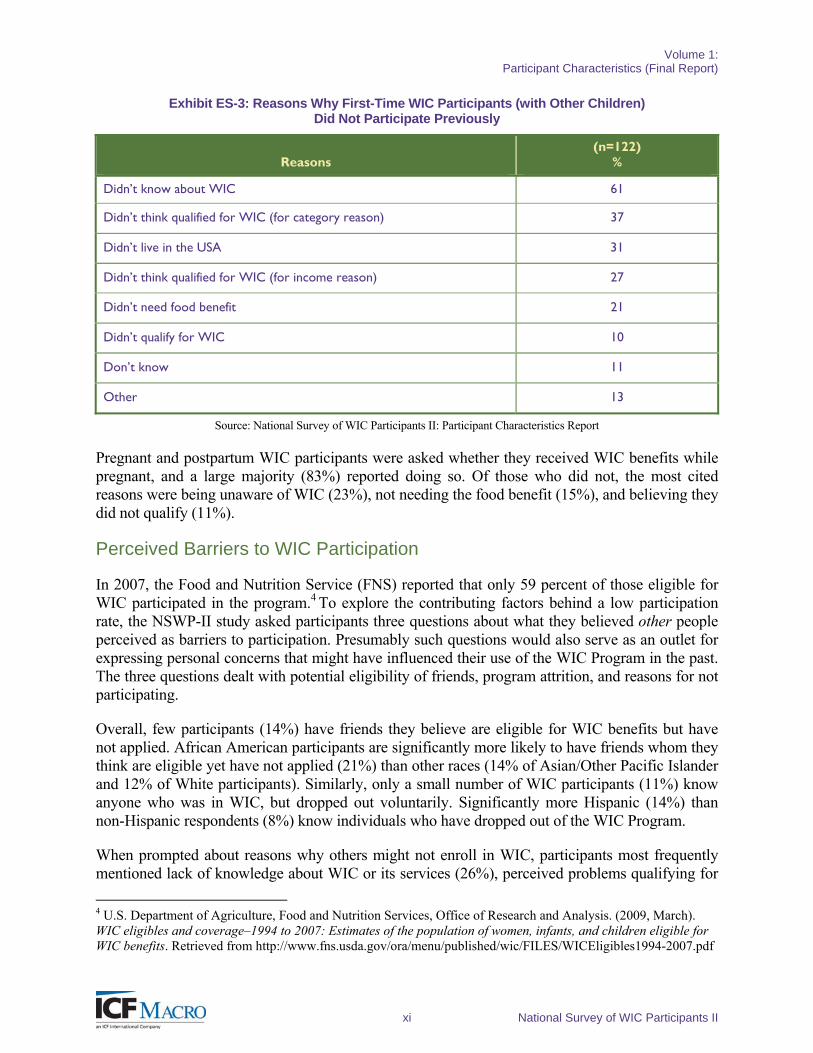
Of those who could have participated before, the biggest reason for not participating earlier was lack of awareness of the WIC Program (61%), as shown in Exhibit ES-3. The next most prevalent reasons are that they did not believe they qualified for benefits because of categorical (37%) or income (27%) reasons, and nearly one-third did not reside in the United States previously.
Volume 1: Participant Characteristics (Final Report)
xi National Survey of WIC Participants II
Exhibit ES-3: Reasons Why First-Time WIC Participants (with Other Children) Did Not Participate Previously
Reasons (n=122)
%
Didn’t know about WIC 61
Didn’t think qualified for WIC (for category reason) 37
Didn’t live in the USA 31
Didn’t think qualified for WIC (for income reason) 27
Didn’t need food benefit 21
Didn’t qualify for WIC 10
Don’t know 11
Other 13
Source: National Survey of WIC Participants II: Participant Characteristics Report
Pregnant and postpartum WIC participants were asked whether they received WIC benefits while pregnant, and a large majority (83%) reported doing so. Of those who did not, the most cited reasons were being unaware of WIC (23%), not needing the food benefit (15%), and believing they did not qualify (11%).
Perceived Barriers to WIC Participation
In 2007, the Food and Nutrition Service (FNS) reported that only 59 percent of those eligible for WIC participated in the program.4 To explore the contributing factors behind a low participation rate, the NSWP-II study asked participants three questions about what they believed other people perceived as barriers to participation. Presumably such questions would also serve as an outlet for expressing personal concerns that might have influenced their use of the WIC Program in the past. The three questions dealt with potential eligibility of friends, program attrition, and reasons for not participating.
Overall, few participants (14%) have friends they believe are eligible for WIC benefits but have not applied. African American participants are significantly more likely to have friends whom they think are eligible yet have not applied (21%) than other races (14% of Asian/Other Pacific Islander and 12% of White participants). Similarly, only a small number of WIC participants (11%) know anyone who was in WIC, but dropped out voluntarily. Significantly more Hispanic (14%) than non-Hispanic respondents (8%) know individuals who have dropped out of the WIC Program.
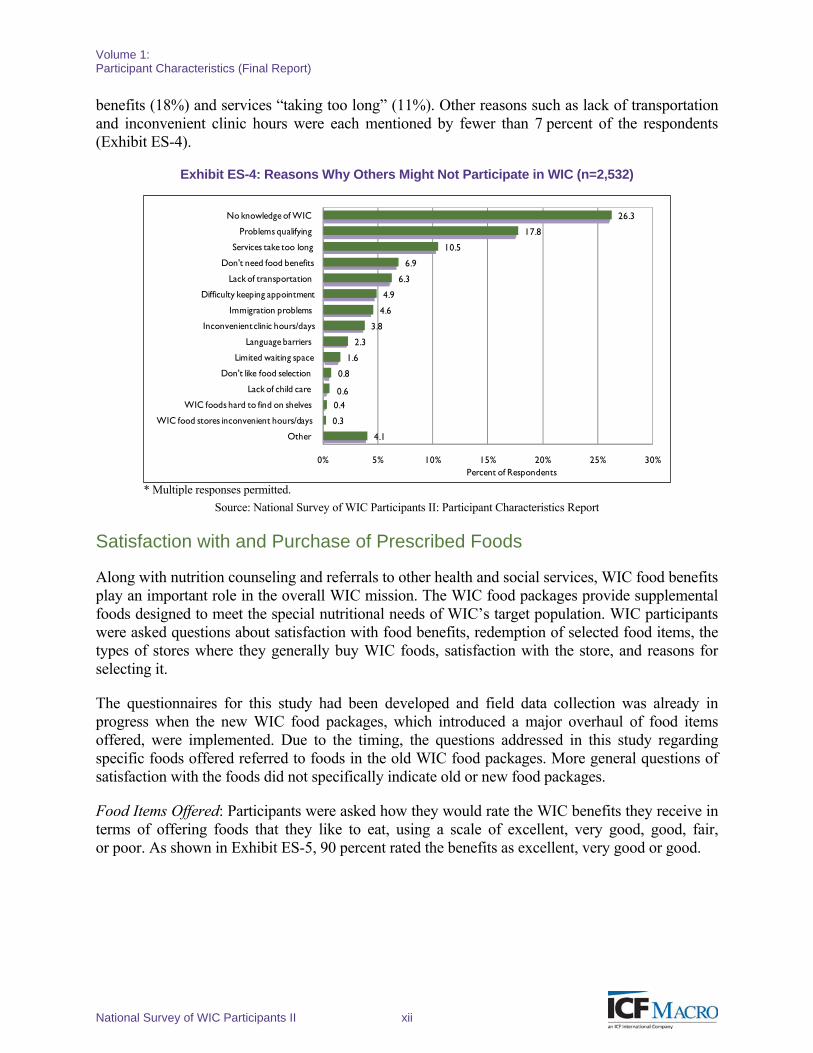
When prompted about reasons why others might not enroll in WIC, participants most frequently mentioned lack of knowledge about WIC or its services (26%), perceived problems qualifying for
4 U.S. Department of Agriculture, Food and Nutrition Services, Office of Research and Analysis. (2009, March). WIC eligibles and coverage–1994 to 2007: Estimates of the population of women, infants, and children eligible for WIC benefits. Retrieved from http://www.fns.usda.gov/ora/menu/published/wic/FILES/WICEligibles1994-2007.pdf
Volume 1: Participant Characteristics (Final Report)
National Survey of WIC Participants II xii
benefits (18%) and services “taking too long” (11%). Other reasons such as lack of transportation and inconvenient clinic hours were each mentioned by fewer than 7 percent of the respondents (Exhibit ES-4).
Exhibit ES-4: Reasons Why Others Might Not Participate in WIC (n=2,532)
* Multiple responses permitted.
Source: National Survey of WIC Participants II: Participant Characteristics Report
Satisfaction with and Purchase of Prescribed Foods
Along with nutrition counseling and referrals to other health and social services, WIC food benefits play an important role in the overall WIC mission. The WIC food packages provide supplemental foods designed to meet the special nutritional needs of WIC’s target population. WIC participants were asked questions about satisfaction with food benefits, redemption of selected food items, the types of stores where they generally buy WIC foods, satisfaction with the store, and reasons for selecting it.
The questionnaires for this study had been developed and field data collection was already in progress when the new WIC food packages, which introduced a major overhaul of food items offered, were implemented. Due to the timing, the questions addressed in this study regarding specific foods offered referred to foods in the old WIC food packages. More general questions of satisfaction with the foods did not specifically indicate old or new food packages.
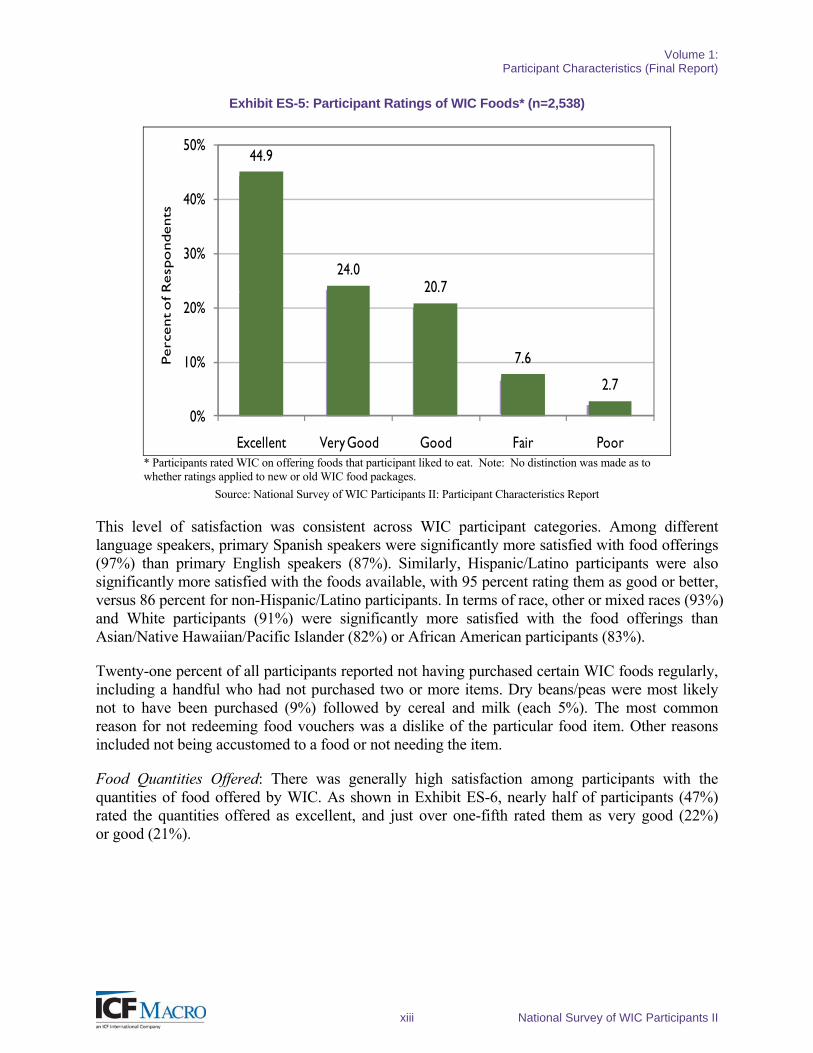
Food Items Offered: Participants were asked how they would rate the WIC benefits they receive in terms of offering foods that they like to eat, using a scale of excellent, very good, good, fair, or poor. As shown in Exhibit ES-5, 90 percent rated the benefits as excellent, very good or good.
4.1
0.3
0.40.6
0.8
1.6
2.3
3.8
4.6
4.9
6.3
6.9
10.5
17.8
26.3
0% 5% 10% 15% 20% 25% 30%
Other
WIC food stores inconvenient hours/days
WIC foods hard to find on shelves
Lack of child care
Don't like food selection
Limited waiting space
Language barriers
Inconvenient clinic hours/days
Immigration problems
Difficulty keeping appointment
Lack of transportation
Don't need food benefits
Services take too long
Problems qualifying
No knowledge of WIC
Percent of Respondents
Volume 1: Participant Characteristics (Final Report)
xiii National Survey of WIC Participants II
Exhibit ES-5: Participant Ratings of WIC Foods* (n=2,538)
44.9
24.020.7
7.6
2.7
0%
10%
20%
30%
40%
50%
Excellent Very Good Good Fair Poor
Perc
ent o
f R
esp
ondents
* Participants rated WIC on offering foods that participant liked to eat. Note: No distinction was made as to whether ratings applied to new or old WIC food packages.
Source: National Survey of WIC Participants II: Participant Characteristics Report
This level of satisfaction was consistent across WIC participant categories. Among different language speakers, primary Spanish speakers were significantly more satisfied with food offerings (97%) than primary English speakers (87%). Similarly, Hispanic/Latino participants were also significantly more satisfied with the foods available, with 95 percent rating them as good or better, versus 86 percent for non-Hispanic/Latino participants. In terms of race, other or mixed races (93%) and White participants (91%) were significantly more satisfied with the food offerings than Asian/Native Hawaiian/Pacific Islander (82%) or African American participants (83%).
Twenty-one percent of all participants reported not having purchased certain WIC foods regularly, including a handful who had not purchased two or more items. Dry beans/peas were most likely not to have been purchased (9%) followed by cereal and milk (each 5%). The most common reason for not redeeming food vouchers was a dislike of the particular food item. Other reasons included not being accustomed to a food or not needing the item.
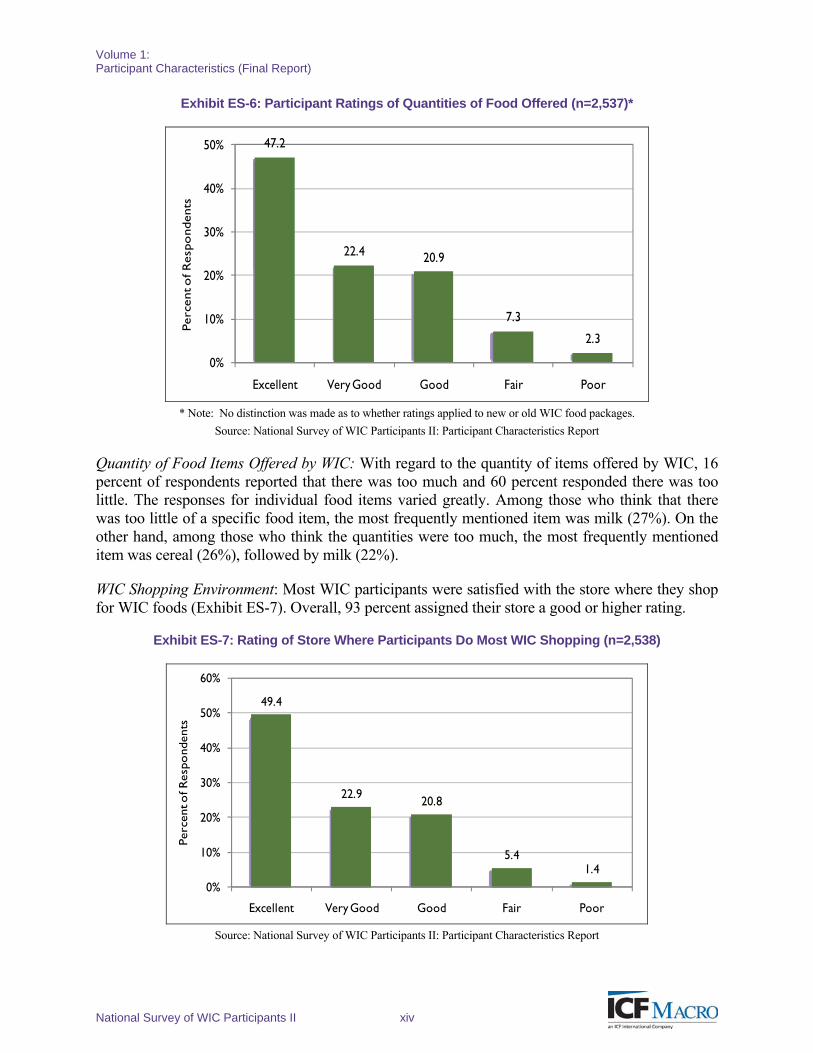
Food Quantities Offered: There was generally high satisfaction among participants with the quantities of food offered by WIC. As shown in Exhibit ES-6, nearly half of participants (47%) rated the quantities offered as excellent, and just over one-fifth rated them as very good (22%) or good (21%).
Volume 1: Participant Characteristics (Final Report)
National Survey of WIC Participants II xiv
Exhibit ES-6: Participant Ratings of Quantities of Food Offered (n=2,537)*
47.2
22.4 20.9
7.3
2.3
0%
10%
20%
30%
40%
50%
Excellent Very Good Good Fair Poor
Perc
ent o
f Res
pond
ents
* Note: No distinction was made as to whether ratings applied to new or old WIC food packages.
Source: National Survey of WIC Participants II: Participant Characteristics Report
Quantity of Food Items Offered by WIC: With regard to the quantity of items offered by WIC, 16 percent of respondents reported that there was too much and 60 percent responded there was too little. The responses for individual food items varied greatly. Among those who think that there was too little of a specific food item, the most frequently mentioned item was milk (27%). On the other hand, among those who think the quantities were too much, the most frequently mentioned item was cereal (26%), followed by milk (22%).
WIC Shopping Environment: Most WIC participants were satisfied with the store where they shop for WIC foods (Exhibit ES-7). Overall, 93 percent assigned their store a good or higher rating.
Exhibit ES-7: Rating of Store Where Participants Do Most WIC Shopping (n=2,538)
49.4
22.9 20.8
5.41.4
0%
10%
20%
30%
40%
50%
60%
Excellent Very Good Good Fair Poor
Perc
ent o
f Res
pond
ents
Source: National Survey of WIC Participants II: Participant Characteristics Report
Volume 1: Participant Characteristics (Final Report)
xv National Survey of WIC Participants II
A large majority of WIC participants (85%) redeem their vouchers primarily at large stores—either large grocery stores/supermarkets (63%), or combination food store/retail outlets (22%) such as Walmart or Target. Only 7 percent redeem vouchers primarily at small grocery stores.
Similarly, a large majority (84%) of participants buy WIC items at the same store where they do most of their other food shopping. For those who do not shop at their usual store (16%), the main reasons cited are the location and convenience of the store (44%) and the prices/cost (32%). Most WIC participants consider multiple attributes important in their selection of the store where they make most of their WIC purchases. The two most important factors are safe location and having the right sizes and brands of WIC foods (84% and 81%, respectively).
WIC Participant Satisfaction
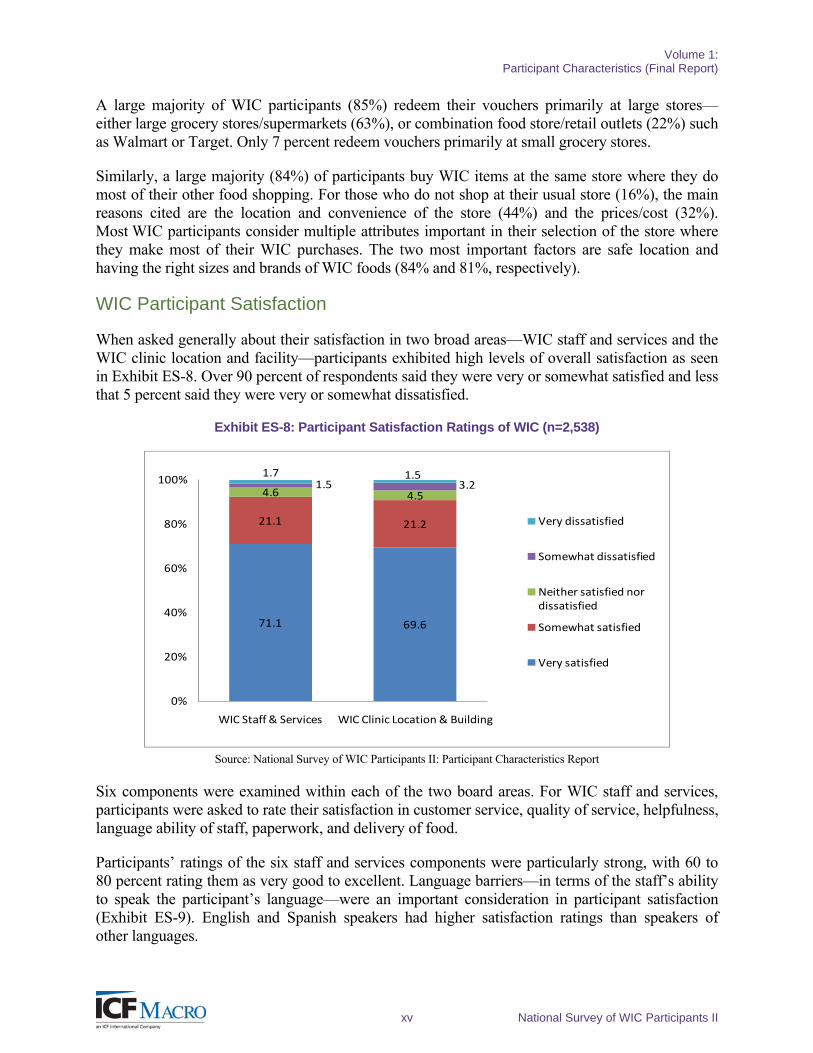
When asked generally about their satisfaction in two broad areas—WIC staff and services and the WIC clinic location and facility—participants exhibited high levels of overall satisfaction as seen in Exhibit ES-8. Over 90 percent of respondents said they were very or somewhat satisfied and less that 5 percent said they were very or somewhat dissatisfied.
Exhibit ES-8: Participant Satisfaction Ratings of WIC (n=2,538)
71.1 69.6
21.1 21.2
4.6 4.51.5 3.2
1.7 1.5
0%
20%
40%
60%
80%
100%
WIC Staff & Services WIC Clinic Location & Building
Very dissatisfied
Somewhat dissatisfied
Neither satisfied nor dissatisfied
Somewhat satisfied
Very satisfied
Source: National Survey of WIC Participants II: Participant Characteristics Report
Six components were examined within each of the two board areas. For WIC staff and services, participants were asked to rate their satisfaction in customer service, quality of service, helpfulness, language ability of staff, paperwork, and delivery of food.
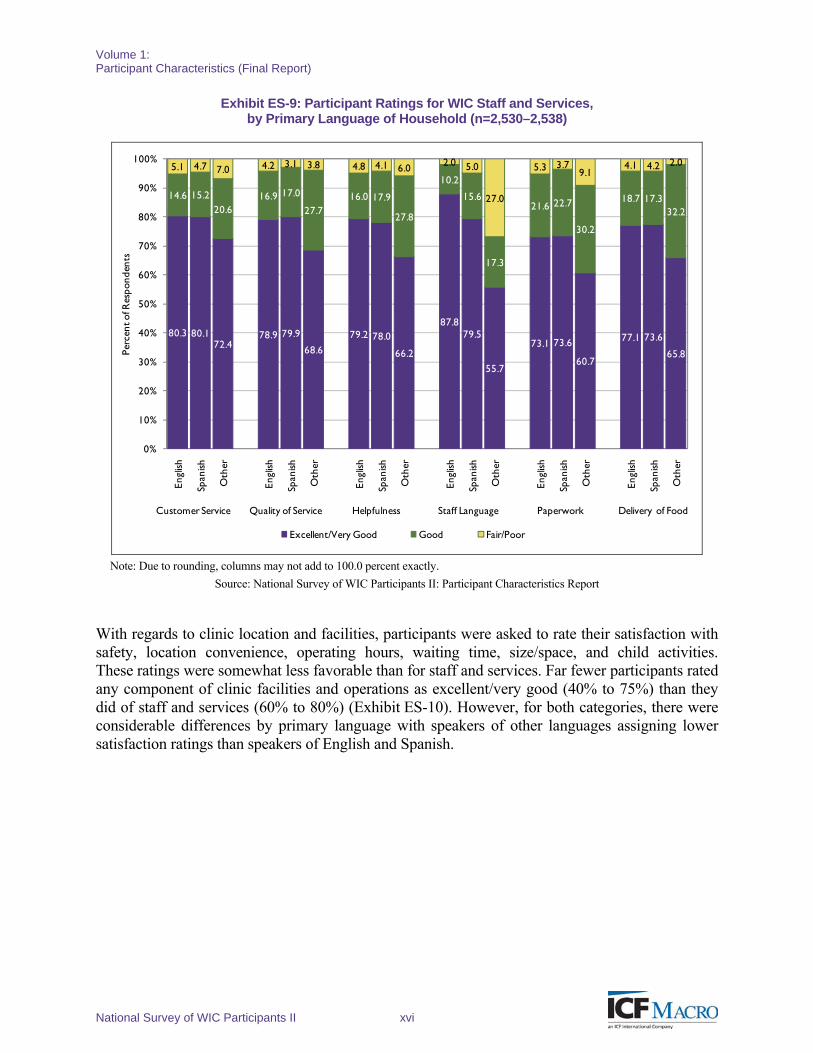
Participants’ ratings of the six staff and services components were particularly strong, with 60 to 80 percent rating them as very good to excellent. Language barriers—in terms of the staff’s ability to speak the participant’s language—were an important consideration in participant satisfaction (Exhibit ES-9). English and Spanish speakers had higher satisfaction ratings than speakers of other languages.
Volume 1: Participant Characteristics (Final Report)
National Survey of WIC Participants II xvi
Exhibit ES-9: Participant Ratings for WIC Staff and Services, by Primary Language of Household (n=2,530–2,538)
80.3 80.172.4
78.9 79.9
68.6
79.2 78.0
66.2
87.879.5
55.7
73.1 73.6
60.7
77.1 73.6
65.8
14.6 15.220.6
16.9 17.0
27.716.0 17.9
27.8
10.2
15.6
17.3
21.6 22.7
30.2
18.7 17.332.2
5.1 4.7 7.0 4.2 3.1 3.8 4.8 4.1 6.0 2.0 5.0
27.0
5.3 3.79.1
4.1 4.2 2.0
0%
10%
20%
30%
40%
50%
60%
70%
80%
90%
100%
Engl
ish
Span
ish
Oth
er
Engl
ish
Span
ish
Oth
er
Engl
ish
Span
ish
Oth
er
Engl
ish
Span
ish
Oth
er
Engl
ish
Span
ish
Oth
er
Engl
ish
Span
ish
Oth
er
Perc
ent o
f Res
pond
ents
Excellent/Very Good Good Fair/Poor
Customer Service Quality of Service Helpfulness Staff Language Paperwork Delivery of Food
Note: Due to rounding, columns may not add to 100.0 percent exactly.
Source: National Survey of WIC Participants II: Participant Characteristics Report
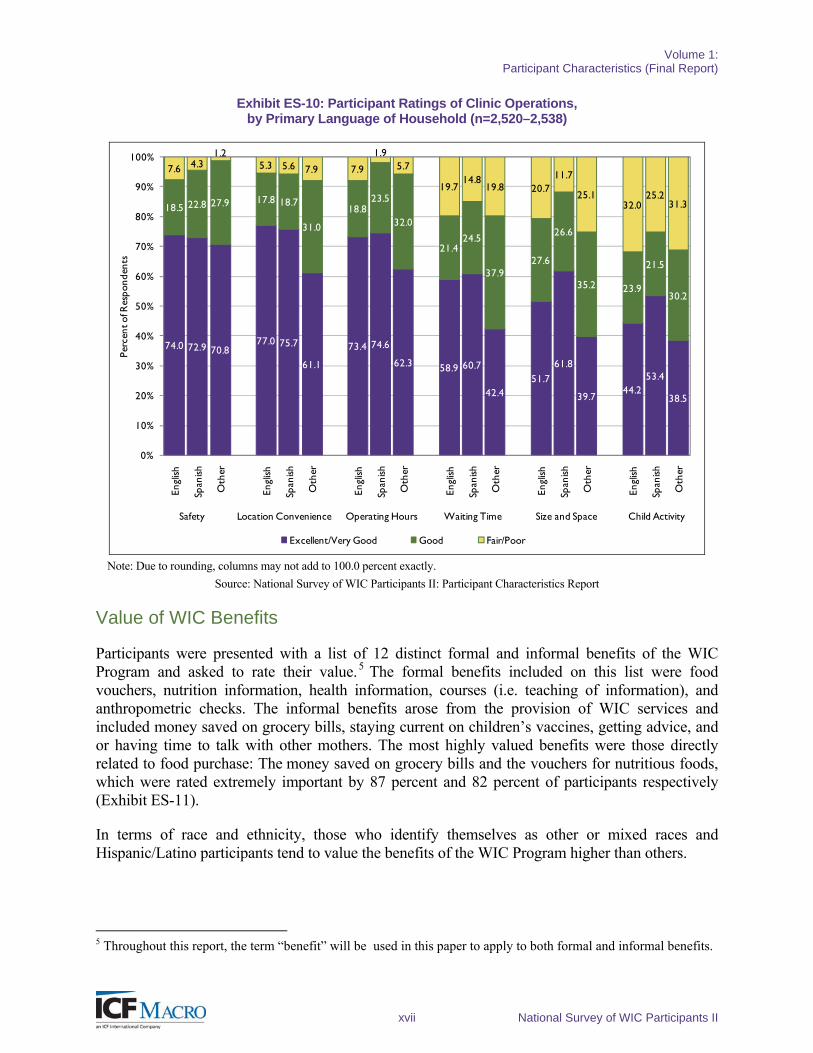
With regards to clinic location and facilities, participants were asked to rate their satisfaction with safety, location convenience, operating hours, waiting time, size/space, and child activities. These ratings were somewhat less favorable than for staff and services. Far fewer participants rated any component of clinic facilities and operations as excellent/very good (40% to 75%) than they did of staff and services (60% to 80%) (Exhibit ES-10). However, for both categories, there were considerable differences by primary language with speakers of other languages assigning lower satisfaction ratings than speakers of English and Spanish.
Volume 1: Participant Characteristics (Final Report)
xvii National Survey of WIC Participants II
Exhibit ES-10: Participant Ratings of Clinic Operations, by Primary Language of Household (n=2,520–2,538)
74.0 72.9 70.877.0 75.7
61.1
73.4 74.6
62.3 58.9 60.7
42.451.7
61.8
39.744.2
53.4
38.5
18.5 22.8 27.9 17.8 18.7
31.0
18.823.5
32.0
21.424.5
37.927.6
26.6
35.2 23.9
21.5
30.2
7.6 4.31.2
5.3 5.6 7.9 7.9
1.95.7
19.714.8
19.8 20.711.7
25.132.0
25.231.3
0%
10%
20%
30%
40%
50%
60%
70%
80%
90%
100%
Engl
ish
Span
ish
Oth
er
Engl
ish
Span
ish
Oth
er
Engl
ish
Span
ish
Oth
er
Engl
ish
Span
ish
Oth
er
Engl
ish
Span
ish
Oth
er
Engl
ish
Span
ish
Oth
er
Perc
ent o
f Res
pond
ents
Excellent/Very Good Good Fair/Poor
Safety Location Convenience Operating Hours Waiting Time Size and Space Child Activity
Note: Due to rounding, columns may not add to 100.0 percent exactly.
Source: National Survey of WIC Participants II: Participant Characteristics Report
Value of WIC Benefits
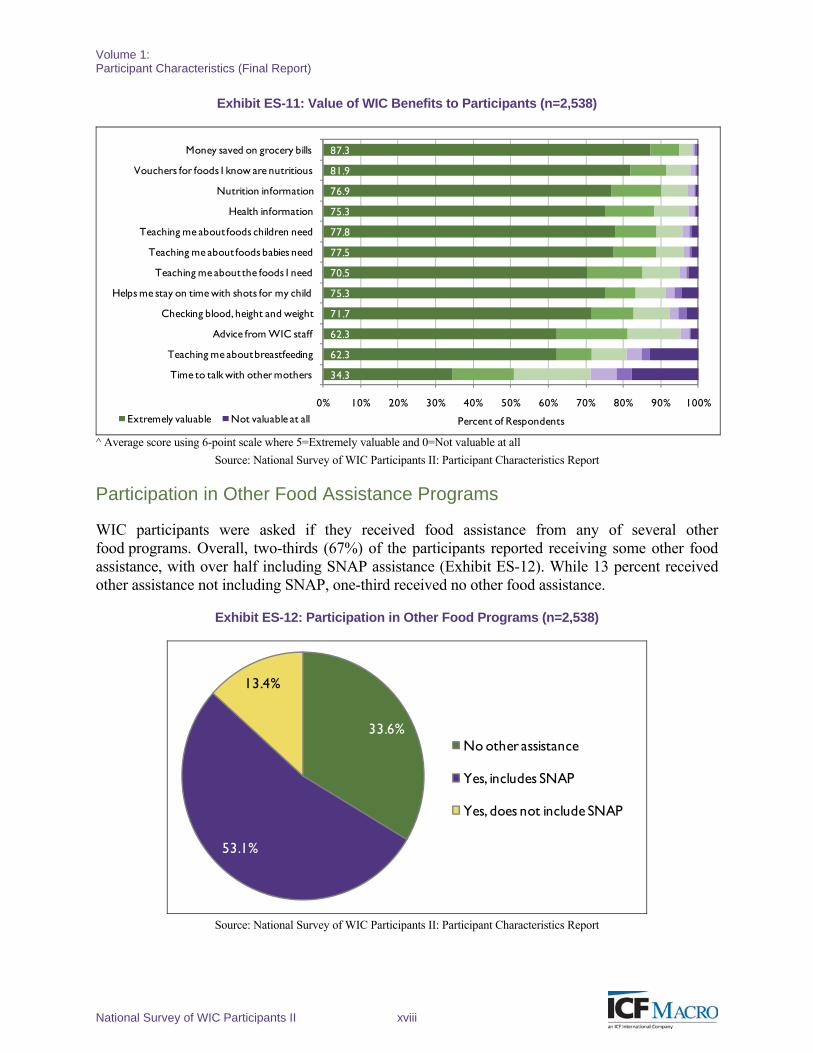
Participants were presented with a list of 12 distinct formal and informal benefits of the WIC Program and asked to rate their value.5 The formal benefits included on this list were food vouchers, nutrition information, health information, courses (i.e. teaching of information), and anthropometric checks. The informal benefits arose from the provision of WIC services and included money saved on grocery bills, staying current on children’s vaccines, getting advice, and or having time to talk with other mothers. The most highly valued benefits were those directly related to food purchase: The money saved on grocery bills and the vouchers for nutritious foods, which were rated extremely important by 87 percent and 82 percent of participants respectively (Exhibit ES-11).
In terms of race and ethnicity, those who identify themselves as other or mixed races and Hispanic/Latino participants tend to value the benefits of the WIC Program higher than others.
5 Throughout this report, the term “benefit” will be used in this paper to apply to both formal and informal benefits.
Volume 1: Participant Characteristics (Final Report)
National Survey of WIC Participants II xviii
Exhibit ES-11: Value of WIC Benefits to Participants (n=2,538)
34.3
62.3
62.3
71.7
75.3
70.5
77.5
77.8
75.3
76.9
81.9
87.3
0% 10% 20% 30% 40% 50% 60% 70% 80% 90% 100%
Time to talk with other mothers
Teaching me about breastfeeding
Advice from WIC staff
Checking blood, height and weight
Helps me stay on time with shots for my child
Teaching me about the foods I need
Teaching me about foods babies need
Teaching me about foods children need
Health information
Nutrition information
Vouchers for foods I know are nutritious
Money saved on grocery bills
Percent of RespondentsExtremely valuable Not valuable at all
^ Average score using 6-point scale where 5=Extremely valuable and 0=Not valuable at all
Source: National Survey of WIC Participants II: Participant Characteristics Report
Participation in Other Food Assistance Programs
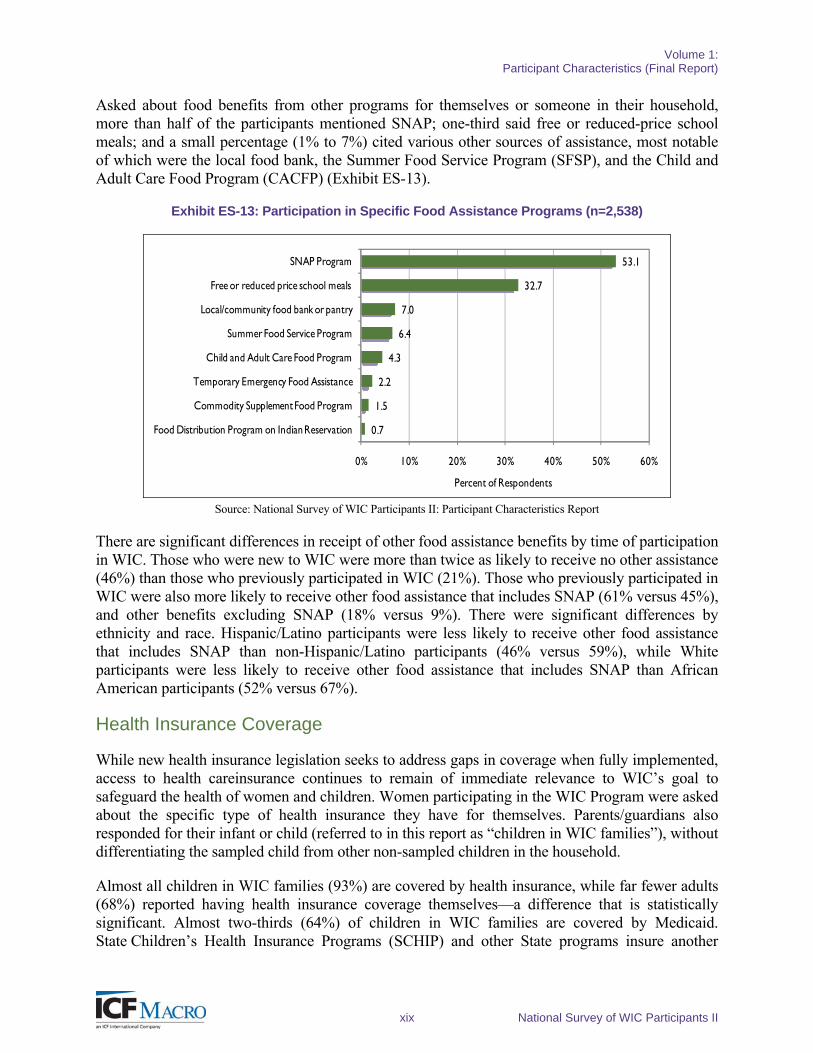
WIC participants were asked if they received food assistance from any of several other food programs. Overall, two-thirds (67%) of the participants reported receiving some other food assistance, with over half including SNAP assistance (Exhibit ES-12). While 13 percent received other assistance not including SNAP, one-third received no other food assistance.
Exhibit ES-12: Participation in Other Food Programs (n=2,538)
33.6%
53.1%
13.4%
No other assistance
Yes, includes SNAP
Yes, does not include SNAP
Source: National Survey of WIC Participants II: Participant Characteristics Report
Volume 1: Participant Characteristics (Final Report)
xix National Survey of WIC Participants II
Asked about food benefits from other programs for themselves or someone in their household, more than half of the participants mentioned SNAP; one-third said free or reduced-price school meals; and a small percentage (1% to 7%) cited various other sources of assistance, most notable of which were the local food bank, the Summer Food Service Program (SFSP), and the Child and Adult Care Food Program (CACFP) (Exhibit ES-13).
Exhibit ES-13: Participation in Specific Food Assistance Programs (n=2,538)
0.7
1.5
2.2
4.3
6.4
7.0
32.7
53.1
0% 10% 20% 30% 40% 50% 60%
Food Distribution Program on Indian Reservation
Commodity Supplement Food Program
Temporary Emergency Food Assistance
Child and Adult Care Food Program
Summer Food Service Program
Local/community food bank or pantry
Free or reduced price school meals
SNAP Program
Percent of Respondents
Source: National Survey of WIC Participants II: Participant Characteristics Report
There are significant differences in receipt of other food assistance benefits by time of participation in WIC. Those who were new to WIC were more than twice as likely to receive no other assistance (46%) than those who previously participated in WIC (21%). Those who previously participated in WIC were also more likely to receive other food assistance that includes SNAP (61% versus 45%), and other benefits excluding SNAP (18% versus 9%). There were significant differences by ethnicity and race. Hispanic/Latino participants were less likely to receive other food assistance that includes SNAP than non-Hispanic/Latino participants (46% versus 59%), while White participants were less likely to receive other food assistance that includes SNAP than African American participants (52% versus 67%).
Health Insurance Coverage
While new health insurance legislation seeks to address gaps in coverage when fully implemented, access to health careinsurance continues to remain of immediate relevance to WIC’s goal to safeguard the health of women and children. Women participating in the WIC Program were asked about the specific type of health insurance they have for themselves. Parents/guardians also responded for their infant or child (referred to in this report as “children in WIC families”), without differentiating the sampled child from other non-sampled children in the household.
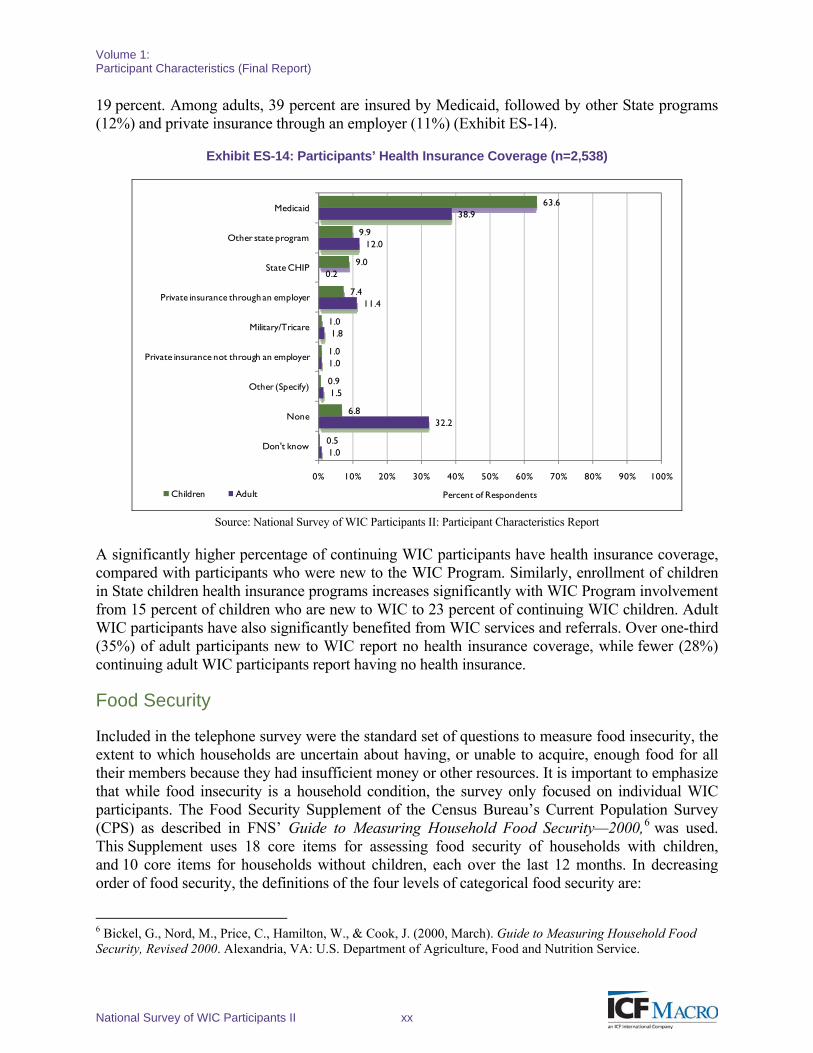
Almost all children in WIC families (93%) are covered by health insurance, while far fewer adults (68%) reported having health insurance coverage themselves—a difference that is statistically significant. Almost two-thirds (64%) of children in WIC families are covered by Medicaid. State Children’s Health Insurance Programs (SCHIP) and other State programs insure another
Volume 1: Participant Characteristics (Final Report)
National Survey of WIC Participants II xx
19 percent. Among adults, 39 percent are insured by Medicaid, followed by other State programs (12%) and private insurance through an employer (11%) (Exhibit ES-14).
Exhibit ES-14: Participants’ Health Insurance Coverage (n=2,538)
1.0
32.2
1.5
1.0
1.8
11.4
0.2
12.0
38.9
0.5
6.8
0.9
1.0
1.0
7.4
9.0
9.9
63.6
0% 10% 20% 30% 40% 50% 60% 70% 80% 90% 100%
Don't know
None
Other (Specify)
Private insurance not through an employer
Military/Tricare
Private insurance through an employer
State CHIP
Other state program
Medicaid
Percent of RespondentsChildren Adult
Source: National Survey of WIC Participants II: Participant Characteristics Report
A significantly higher percentage of continuing WIC participants have health insurance coverage, compared with participants who were new to the WIC Program. Similarly, enrollment of children in State children health insurance programs increases significantly with WIC Program involvement from 15 percent of children who are new to WIC to 23 percent of continuing WIC children. Adult WIC participants have also significantly benefited from WIC services and referrals. Over one-third (35%) of adult participants new to WIC report no health insurance coverage, while fewer (28%) continuing adult WIC participants report having no health insurance.
Food Security
Included in the telephone survey were the standard set of questions to measure food insecurity, the extent to which households are uncertain about having, or unable to acquire, enough food for all their members because they had insufficient money or other resources. It is important to emphasize that while food insecurity is a household condition, the survey only focused on individual WIC participants. The Food Security Supplement of the Census Bureau’s Current Population Survey (CPS) as described in FNS’ Guide to Measuring Household Food Security—2000,6 was used. This Supplement uses 18 core items for assessing food security of households with children, and 10 core items for households without children, each over the last 12 months. In decreasing order of food security, the definitions of the four levels of categorical food security are:
6 Bickel, G., Nord, M., Price, C., Hamilton, W., & Cook, J. (2000, March). Guide to Measuring Household Food Security, Revised 2000. Alexandria, VA: U.S. Department of Agriculture, Food and Nutrition Service.
Volume 1: Participant Characteristics (Final Report)
xxi National Survey of WIC Participants II
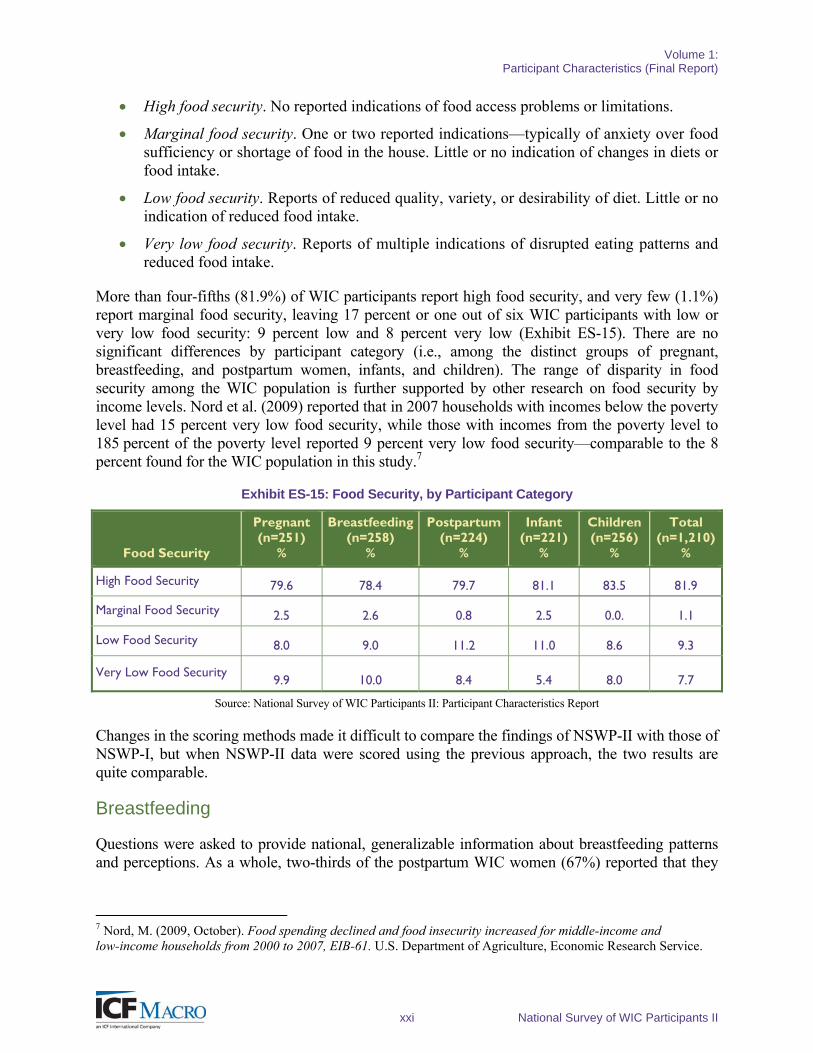
High food security. No reported indications of food access problems or limitations.
Marginal food security. One or two reported indications—typically of anxiety over food sufficiency or shortage of food in the house. Little or no indication of changes in diets or food intake.
Low food security. Reports of reduced quality, variety, or desirability of diet. Little or no indication of reduced food intake.
Very low food security. Reports of multiple indications of disrupted eating patterns and reduced food intake.
More than four-fifths (81.9%) of WIC participants report high food security, and very few (1.1%) report marginal food security, leaving 17 percent or one out of six WIC participants with low or very low food security: 9 percent low and 8 percent very low (Exhibit ES-15). There are no significant differences by participant category (i.e., among the distinct groups of pregnant, breastfeeding, and postpartum women, infants, and children). The range of disparity in food security among the WIC population is further supported by other research on food security by income levels. Nord et al. (2009) reported that in 2007 households with incomes below the poverty level had 15 percent very low food security, while those with incomes from the poverty level to 185 percent of the poverty level reported 9 percent very low food security—comparable to the 8 percent found for the WIC population in this study.7
Exhibit ES-15: Food Security, by Participant Category
Food Security
Pregnant (n=251)
%
Breastfeeding (n=258)
%
Postpartum (n=224)
%
Infant (n=221)
%
Children (n=256)
%
Total (n=1,210)
%
High Food Security 79.6 78.4 79.7 81.1 83.5 81.9
Marginal Food Security 2.5 2.6 0.8 2.5 0.0. 1.1
Low Food Security 8.0 9.0 11.2 11.0 8.6 9.3
Very Low Food Security 9.9 10.0 8.4 5.4 8.0 7.7
Source: National Survey of WIC Participants II: Participant Characteristics Report
Changes in the scoring methods made it difficult to compare the findings of NSWP-II with those of NSWP-I, but when NSWP-II data were scored using the previous approach, the two results are quite comparable.
Breastfeeding
Questions were asked to provide national, generalizable information about breastfeeding patterns and perceptions. As a whole, two-thirds of the postpartum WIC women (67%) reported that they
7 Nord, M. (2009, October). Food spending declined and food insecurity increased for middle-income and low-income households from 2000 to 2007, EIB-61. U.S. Department of Agriculture, Economic Research Service.
Volume 1: Participant Characteristics (Final Report)
National Survey of WIC Participants II xxii
had breastfed or were breastfeeding their most recent baby or child. For pregnant women who had not yet delivered, 70 percent had plans to breastfeed.
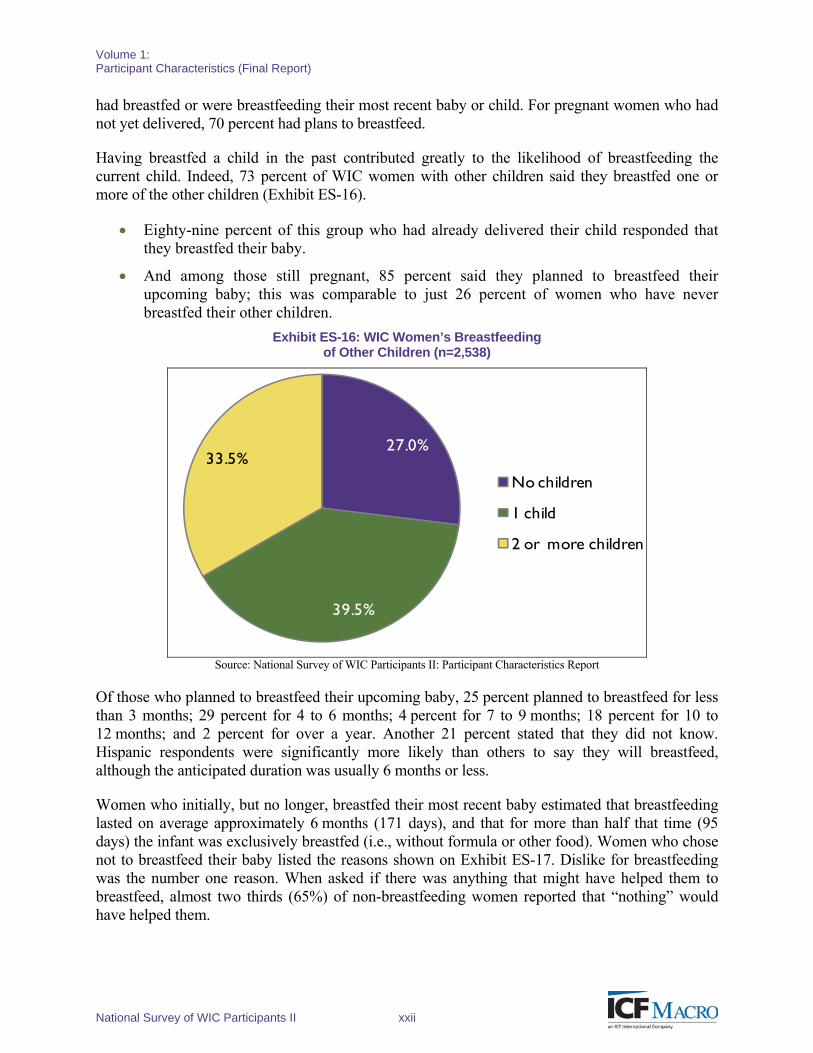
Having breastfed a child in the past contributed greatly to the likelihood of breastfeeding the current child. Indeed, 73 percent of WIC women with other children said they breastfed one or more of the other children (Exhibit ES-16).
Eighty-nine percent of this group who had already delivered their child responded that they breastfed their baby.
And among those still pregnant, 85 percent said they planned to breastfeed their upcoming baby; this was comparable to just 26 percent of women who have never breastfed their other children.
Exhibit ES-16: WIC Women’s Breastfeeding of Other Children (n=2,538)
27.0%
39.5%
33.5%No children
1 child
2 or more children
Source: National Survey of WIC Participants II: Participant Characteristics Report
Of those who planned to breastfeed their upcoming baby, 25 percent planned to breastfeed for less than 3 months; 29 percent for 4 to 6 months; 4 percent for 7 to 9 months; 18 percent for 10 to 12 months; and 2 percent for over a year. Another 21 percent stated that they did not know. Hispanic respondents were significantly more likely than others to say they will breastfeed, although the anticipated duration was usually 6 months or less.
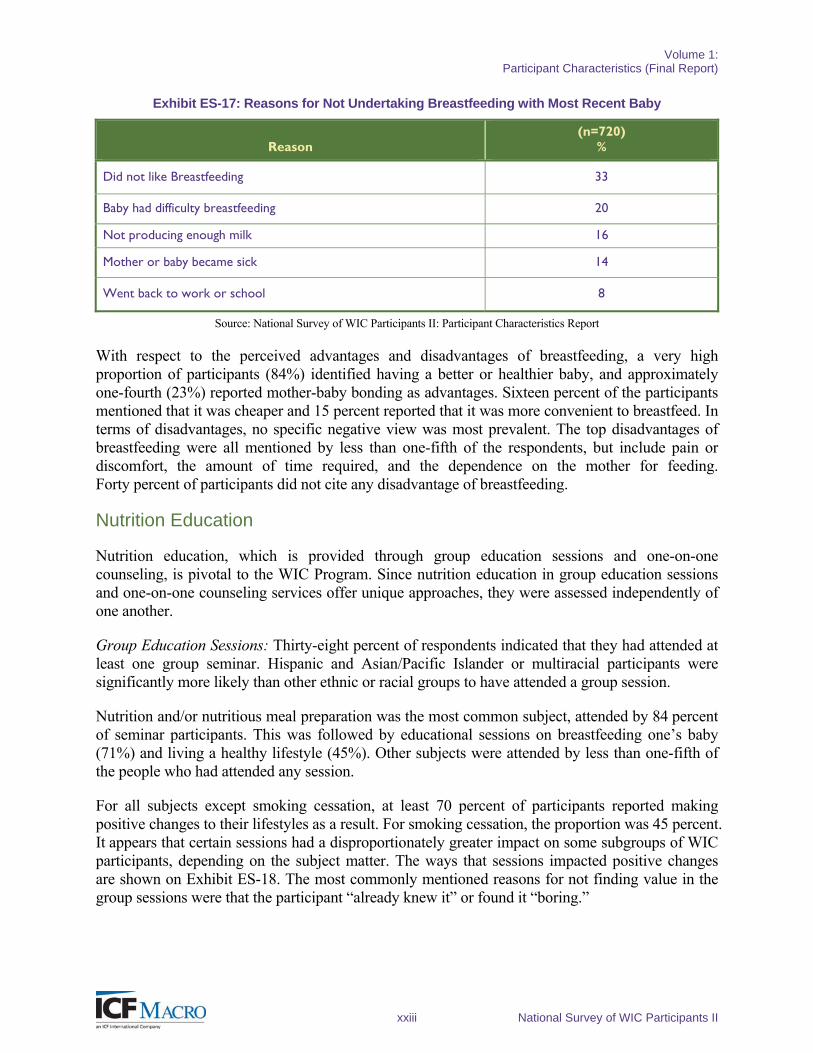
Women who initially, but no longer, breastfed their most recent baby estimated that breastfeeding lasted on average approximately 6 months (171 days), and that for more than half that time (95 days) the infant was exclusively breastfed (i.e., without formula or other food). Women who chose not to breastfeed their baby listed the reasons shown on Exhibit ES-17. Dislike for breastfeeding was the number one reason. When asked if there was anything that might have helped them to breastfeed, almost two thirds (65%) of non-breastfeeding women reported that “nothing” would have helped them.
Volume 1: Participant Characteristics (Final Report)
xxiii National Survey of WIC Participants II
Exhibit ES-17: Reasons for Not Undertaking Breastfeeding with Most Recent Baby
Reason (n=720)
%
Did not like Breastfeeding 33
Baby had difficulty breastfeeding 20
Not producing enough milk 16
Mother or baby became sick 14
Went back to work or school 8
Source: National Survey of WIC Participants II: Participant Characteristics Report
With respect to the perceived advantages and disadvantages of breastfeeding, a very high proportion of participants (84%) identified having a better or healthier baby, and approximately one-fourth (23%) reported mother-baby bonding as advantages. Sixteen percent of the participants mentioned that it was cheaper and 15 percent reported that it was more convenient to breastfeed. In terms of disadvantages, no specific negative view was most prevalent. The top disadvantages of breastfeeding were all mentioned by less than one-fifth of the respondents, but include pain or discomfort, the amount of time required, and the dependence on the mother for feeding. Forty percent of participants did not cite any disadvantage of breastfeeding.
Nutrition Education
Nutrition education, which is provided through group education sessions and one-on-one counseling, is pivotal to the WIC Program. Since nutrition education in group education sessions and one-on-one counseling services offer unique approaches, they were assessed independently of one another.
Group Education Sessions: Thirty-eight percent of respondents indicated that they had attended at least one group seminar. Hispanic and Asian/Pacific Islander or multiracial participants were significantly more likely than other ethnic or racial groups to have attended a group session.
Nutrition and/or nutritious meal preparation was the most common subject, attended by 84 percent of seminar participants. This was followed by educational sessions on breastfeeding one’s baby (71%) and living a healthy lifestyle (45%). Other subjects were attended by less than one-fifth of the people who had attended any session.
For all subjects except smoking cessation, at least 70 percent of participants reported making positive changes to their lifestyles as a result. For smoking cessation, the proportion was 45 percent. It appears that certain sessions had a disproportionately greater impact on some subgroups of WIC participants, depending on the subject matter. The ways that sessions impacted positive changes are shown on Exhibit ES-18. The most commonly mentioned reasons for not finding value in the group sessions were that the participant “already knew it” or found it “boring.”
Volume 1: Participant Characteristics (Final Report)
National Survey of WIC Participants II xxiv
Exhibit ES-18: Participants Saying Group Session Changed Their Behavior
Session Topic % The Main Change(s) Cited
Educating one’s child (n=164) 87.1 Better parenting, new techniques
Nutrition (n=825) 84.0 Eating more healthy
Living a healthy lifestyle (n=447) 82.8 Eating more healthy
Accessing other social services (n=155) 81.6 Learning what they are, getting services
Disciplining one’s child (n=126) 79.8 Better parenting, learning what works, being more patient
Breastfeeding (n=692) 70.3 How to do it, dealing with problems
Smoking cessation (n=115) 44.5 Stopped/cut back smoking, reduced second hand smoke
Source: National Survey of WIC Participants II: Participant Characteristics Report
One-on-One Nutrition Counseling: A larger number of WIC participants have obtained nutrition education through one-on-one counseling than group training (64% versus 38%) for the current period, and most of these participants (48%) attended two or more sessions. The average duration of one-on-one WIC nutrition counseling sessions was 23 minutes.
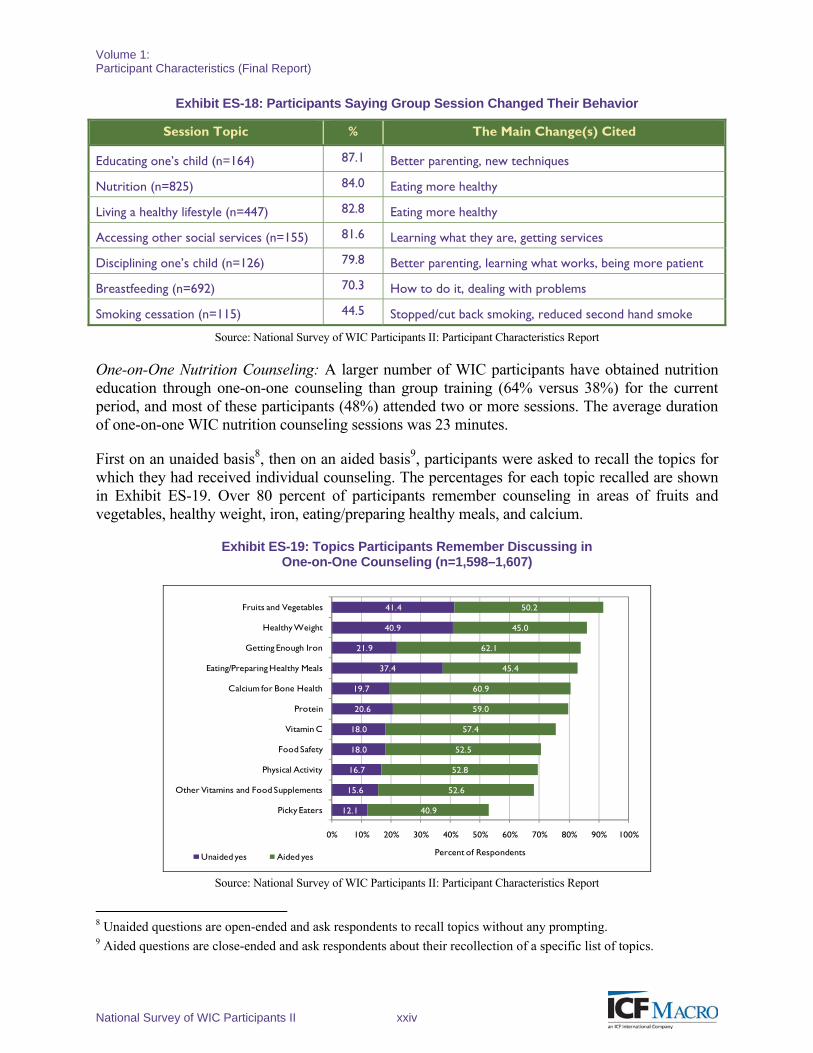
First on an unaided basis8, then on an aided basis9, participants were asked to recall the topics for which they had received individual counseling. The percentages for each topic recalled are shown in Exhibit ES-19. Over 80 percent of participants remember counseling in areas of fruits and vegetables, healthy weight, iron, eating/preparing healthy meals, and calcium.
Exhibit ES-19: Topics Participants Remember Discussing in One-on-One Counseling (n=1,598–1,607)
12.1
15.6
16.7
18.0
18.0
20.6
19.7
37.4
21.9
40.9
41.4
40.9
52.6
52.8
52.5
57.4
59.0
60.9
45.4
62.1
45.0
50.2
0% 10% 20% 30% 40% 50% 60% 70% 80% 90% 100%
Picky Eaters
Other Vitamins and Food Supplements
Physical Activity
Food Safety
Vitamin C
Protein
Calcium for Bone Health
Eating/Preparing Healthy Meals
Getting Enough Iron
Healthy Weight
Fruits and Vegetables
Percent of RespondentsUnaided yes Aided yes
Source: National Survey of WIC Participants II: Participant Characteristics Report
8 Unaided questions are open-ended and ask respondents to recall topics without any prompting. 9 Aided questions are close-ended and ask respondents about their recollection of a specific list of topics.
Volume 1: Participant Characteristics (Final Report)
xxv National Survey of WIC Participants II
As with the group sessions, attendees of these individual counseling sessions overwhelmingly reported that the sessions were useful (94%); that they learned new things; and that the sessions helped them eat or become healthier.

1 National Survey of WIC Participants II
CHAPTER 1. OVERVIEW OF THE WIC PROGRAM AND PROGRAM ELIGIBILITY
The Special Supplemental Nutrition Program for Women, Infants, and Children (WIC) is the United States Department of Agriculture’s (USDA) third largest food and nutrition assistance program. In existence for over 35 years, the WIC Program provides benefits to low-income, pregnant, and new mothers and their young children (up to age 5) who are at nutritional risk. The benefits consist primarily of nutritious supplemental foods, nutrition education, and referrals to health care and social services. The WIC Program is funded by USDA’s Food and Nutrition Service, and is administered by it in partnership with state and local agencies. Although research on the effectiveness of the WIC Program has often been narrow in scope,10 and much of it dated, the Program is still widely credited for increasing access to prenatal care,11 improving birth outcomes, 12 , 13 reducing the incidence of anemia, 14 and enhancing the nutritional quality of participants’ diets.15
Expansion of the WIC Program has been dramatic, rising from 88,000 participants per month in 197416 to over 9 million per month in 2010. Today almost half of all infants and one-fourth of children under 5 years old participate in the WIC Program. The WIC Program serves to safeguard the health of low-income women, infants, & children up to age 5 who are at nutritional risk by providing nutritious foods to supplement diets, information on healthy eating, and referrals to health care.17 Recently, the WIC Program rolled out new food packages, which were to be fully implemented in all states by October 2009. Reflecting the first significant revisions since 1980, the food packages are designed to promote greater health by offering fruits and vegetables as well as foods that have more fiber and less saturated fat and cholesterol. In addition, foods allocated to breastfeeding mothers and infants have been increased to more strongly promote breastfeeding as the healthiest nourishment for infants.
10 U.S. Department of Agriculture, Economic Research Service. (2009). The WIC Program: Background, trends, and economic issues. Retrieved from http://www.ers.usda.gov/publications/err73/ 11 Devaney, B., Bilheimer, L., et al. (1992). Medicaid costs and birth outcomes: The effects of prenatal WIC participation and the use of prenatal care. Journal of Policy Analysis and Management, 11(4) Autumn, 573–592. 12 Moss, N., & Carver, K. (1998). The effect of WIC and Medicaid on infant mortality in the United States. American Journal of Public Health, 88, 1354–1361. 13 Buescher P., Larson L., et al. (1993). Prenatal WIC participation can reduce low birth weight and newborn medical costs: A cost benefits analysis of WIC participation in North Carolina. J Am Diet Assoc., 93, 163–166. 14 Miller, V., Swaney, S. et al. (1985). Impact of the WIC Program on the iron status of infants. Pediatrics, 75(1), January, 100–105. 15 Siega-Riz, A., Kranz, S., et al. (2004). The effect of participation in the WIC Program on preschoolers’ diets. The Journal of Pediatrics, 144(2) February, 229–234. 16 Oliveira, V., Racine, E., Olmsted, et al. The WIC Program: Background, trends, and issues, 11. Retrieved from http://www.ers.usda.gov/publications/fanrr27/fanrr27c.pdf 17 U.S. Department of Agriculture, Food & Nutrition Service. (2009). About WIC. Retrieved from http://www.fns.usda.gov/wic/aboutwic/
Volume 1: Participant Characteristics (Final Report)
National Survey of WIC Participants II 2
To qualify for WIC benefits, applicants must meet all of the following four requirements:
1. Categorical Eligibility—The applicant must be either a pregnant woman (or must have been recently pregnant and be within 6 weeks post-pregnancy), a breastfeeding woman with an infant no more than 12 months old, a postpartum woman (up to 6 months post-pregnancy), an infant under 12 months, or a child between 1 and 5 years old.
2. Residential Requirement—The applicant must live in the State where the application is made. Some States require that applicants apply to the WIC clinic that serves the local area where they live. Applicants living in areas where WIC is administered by an Indian Tribal Organization (ITO) must meet residency requirements set by the ITO.
3. Income or Adjunctive Income—The applicant must show proof of either household income at or below 185 percent of the Federal Poverty Guidelines or adjunctive program eligibility. The latter is demonstrated if the family can show proof of participation in Medicaid, Temporary Assistance to Needy Families (TANF) or Supplemental Nutrition Assistance Program (SNAP). In some states, applicants may be considered automatically eligible through other State-administered programs that document income and have income eligibility guidelines at or below the WIC threshold. Examples of these include Children’s Medicaid, Supplemental Security Income, Food Distribution Program on Indian Reservations (FDPIR).
4. Nutritional Risk—A WIC health professional, such as a physician, physician’s assistant, nurse, or dietitian, must determine at certification that the applicant is at nutritional risk based on a medical condition and/or diet. Medical conditions include anemia, obesity, underweight, a history of pregnancy or delivery complications, and child growth problems. Dietary risk usually stems from poor dietary patterns.
WIC participants are eligible to receive benefits for specified periods, after which they must be recertified in order to continue getting benefits. FNS regulations specify a certification period of “approximately 6 months” for postpartum women, infants, and children; however, pregnant women are certified for the duration of their pregnancy and up to 6 weeks postpartum, and most infants are certified up to their first birthday. Children are generally recertified every 6 months. WIC State agencies are given leeway to “establish shorter certification periods… (if they) issue guidance for use by local agencies in establishing the shorter periods.”18 Accordingly, a shorter certification period is sometimes applied to temporary low-income persons, such as strikers. States can also determine when the certification period begins19 and they can extend certification periods by 30 days, which many do under certain circumstances. The important point here is that within the regulations, FNS gives a fair amount of discretion to States to decide certification periods.
18 Federal Regulations 339 PART 246—Special Supplemental Nutrition Program for Women, Infants, and Children (1-1-10 Edition), p. 367. 19 For example, when the applicant walks in the door versus when all proofs are submitted.
Volume 1: Participant Characteristics (Final Report)
3 National Survey of WIC Participants II
1.1 Objectives of the Study
This study, the Second National Survey of WIC Participants (NSWP-II), was started in the summer of 2007. The goals were to:
1. Explore the characteristics and experiences of WIC participants,
2. Provide information on the policies, procedures, operations, and staff at State and local WIC agencies,
3. Estimate the annual cost of erroneous payments in the program, and
4. Develop a model for updating estimates for the next 10 years.
The research is a follow up to the first National Survey of WIC Participants (NSWP-I), for which data were collected in 1998 and a report issued in 2001. In the NSWP-I Study, as with NSWP-II, FNS gathered demographic information about WIC participants and their households, and developed national estimates of the case error rate and dollar error within the WIC Program.
In the 10 years since publication of the NSWP-I report, FNS has conducted numerous other studies on WIC such as, but not limited to, studies related to program activities, participation patterns, WIC food cost containment practices, diets of participating children compared with other children, breastfeeding intervention, vendor characteristics and management practices, WIC improper payments estimation, and analysis of food packages.
One consistent source of information is the biennial data that FNS has collected from WIC State management information systems since 1992—the WIC Participant and Program Characteristics series. A virtual census of all WIC participants, the items reported in that study include participants’ category, age, and race; basic anthropomorphic measures; participants’ nutritional risks; income and migrant status; and participation in TANF, Medicaid, and/or SNAP. Starting in 1998, data for the WIC Participants study expanded to include breastfeeding status and food package prescriptions. Many State data systems have also been able to report health care, education, number of people in household on WIC, and birth weight.20,21,22
NSWP-II aims to add to the current body of WIC knowledge by providing updated information on participants’ satisfaction and use of WIC services, and collecting data not covered by the other studies—especially in the area of State and local WIC agency operations. Most importantly, it also fulfills the requirements of the 2002 Improper Payments Information Act (IPIA). This law and
20 U.S. Department of Agriculture, Food and Nutrition Service Office of Analysis, Nutrition and Evaluation, Food and Nutrition Service. (2006, March). WIC participant and program characteristics 2004: Summary. Retrieved from http://www.abtassociates.com/reports/ ESwicpartpc2004.pdf 21 U.S. Department of Agriculture, Food and Nutrition Service. (2010). Guidance for states providing participant data study of WIC participant and program characteristics 2010: PC2010. Retrieved from http://www.fns.usda.gov/wic/PC2010Guidance.pdf 22 U.S. Department of Agriculture, Food and Nutrition Service. (2010, May). WIC Participant and Program Characteristics 2002: Summary and Highlights. Retrieved from http://www.fns.usda.gov/ora/menu/Published/WIC/FILES/PC2002.htm
Volume 1: Participant Characteristics (Final Report)
National Survey of WIC Participants II 4
subsequent Office of Management and Budget (OMB) and executive directives23 stipulate that agencies must review all programs and activities and identify significant erroneous payments, defined as annual payment errors exceeding both 2.5 percent of program payments and US $10 million.
This volume addresses the first objective of the study—exploring the characteristics and experiences of WIC participants. The other objectives will be covered in three additional, separate reports.
1.2 Effect of the New Food Package on the NSWP-II Study
As noted earlier, WIC food packages underwent a major change in 2009. Based on the recommendations in the Institute of Medicine report, WIC Food Packages: Time for a Change, and aligning with the 2005 Dietary Guidelines for Americans and the guidelines of the American Academy of Pediatrics on infant feeding practices, the new food packages were implemented by all the States in October 2009. The food package revisions are substantial, changing the number of basic packages offered as well as quantity and types of food. Overall, the new packages aim to improve the health of participants by reducing the amount of saturated fat and cholesterol, and adding whole grains and fruits and vegetables, and increasing options to accommodate cultural preferences such as tortillas and soy-based beverages. The food packages for breastfeeding infant-mother pairs provide stronger incentives for continued breastfeeding, including providing less formula to partially breastfed infants and additional quantities and types of food for breastfeeding mothers.
In summer 2007, when this study was at the planning stages, it was anticipated that data collection from WIC participants would occur before implementing major changes to the WIC food packages. However data collection took place right at the time that States were required to have implemented the new packages. This affected the food benefits section in two direct ways: (1) it is hard to know if participants were rating new food packages, old packages or some combination thereof, and (2) since food questions were constructed before the new packages were designed, specific foods assessed do not include new items, most notably the cash-value vouchers for fruits and vegetables.
23 Federal Register, Executive Order 13520 of November 20, 2009. (2009). Retrieved from http://www.whitehouse.gov/omb/assets/financial_improper/11202009_improper_payments.pdf
5 National Survey of WIC Participants II
CHAPTER 2. SURVEY METHODOLOGY
This first report of the NSWP-II provides information on the characteristics and experiences of WIC applicants and participants. It augments the biennial WIC Participant and Program Characteristics report (most recently completed for 2008) but its approach and source of data are quite different. The NSWP-II report is based on a survey of a sample of participants; in contrast, the report of the biennial study on Participant Characteristics is based on the information gathered by States on all participants during certification and reported in the Minimum Data Set (MDS) and the Supplemental Data Set (SDS).
While there is some overlap in the content of the two reports, the NSWP-II report includes data on some additional characteristics: previous use of WIC; experiences with and use of benefits offered by WIC; food assistance, food satisfaction, and food security; satisfaction with WIC (including facility, location, and clinic staff); use and helpfulness of nutrition education; breastfeeding experiences; WIC shopping patterns/benefit redemption; and health insurance coverage.
In addition to this report, two subsequent reports of the NSWP-II Study will cover the policies, procedures, operations, and staff at WIC agencies—both local agencies and State agencies—and estimates of the rate and amount of erroneous payments as required by the Improper Payments Information Act of 2002. The latter verifies data reported during certification of eligibility. Household income, a major criterion for eligibility for WIC (along with category, nutritional need, and residence), may be substantiated based on either adjunctive eligibility—participation in another benefit program (such as TANF, Medicaid, or SNAP) that has similar income requirements—or direct proof of qualifying income.
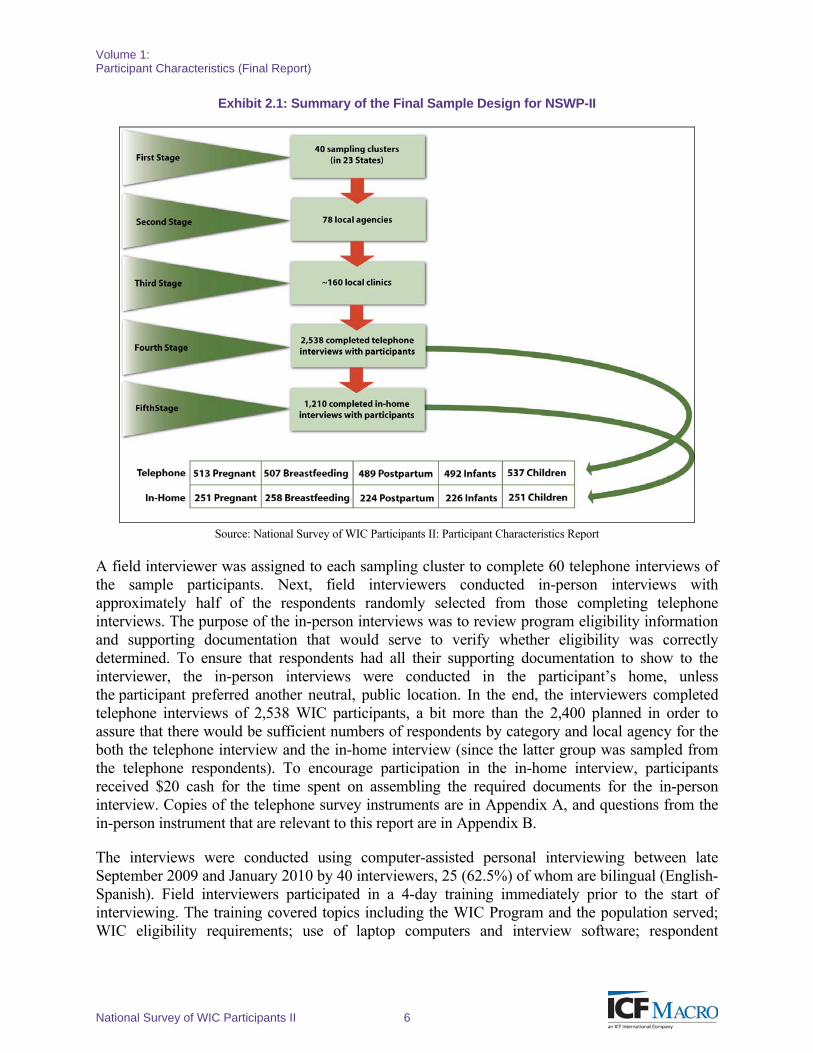
The NSWP-II survey consisted of interviews with 2,538 WIC participants selected in a multi-stage sample, with probability proportional to size. First, a sample of 40 sample clusters—located in 23 separate States as some States were selected multiple times—was selected from the 48 contiguous States and the District of Columbia with Probability Proportional to Size (PPS) based on the number of WIC participants, with Probability Minimum Replacement. For efficiency in interviewing, States were divided into clusters of local WIC agencies. Within clusters local agencies were selected (two per cluster, with the exception of one very large agency that was sampled three times); then clinics (two per local agency, with some exceptions described below); and finally participants in proportion to the number of participants within each category (i.e., pregnant, breastfeeding, postpartum, infants, and children) in the sampled clinic. The overall sample size and the stages of the multi-stage sampling procedure are discussed under the Sample Design section and depicted in Exhibit 2.1.
Volume 1: Participant Characteristics (Final Report)
National Survey of WIC Participants II 6
Exhibit 2.1: Summary of the Final Sample Design for NSWP-II
Source: National Survey of WIC Participants II: Participant Characteristics Report
A field interviewer was assigned to each sampling cluster to complete 60 telephone interviews of the sample participants. Next, field interviewers conducted in-person interviews with approximately half of the respondents randomly selected from those completing telephone interviews. The purpose of the in-person interviews was to review program eligibility information and supporting documentation that would serve to verify whether eligibility was correctly determined. To ensure that respondents had all their supporting documentation to show to the interviewer, the in-person interviews were conducted in the participant’s home, unless the participant preferred another neutral, public location. In the end, the interviewers completed telephone interviews of 2,538 WIC participants, a bit more than the 2,400 planned in order to assure that there would be sufficient numbers of respondents by category and local agency for the both the telephone interview and the in-home interview (since the latter group was sampled from the telephone respondents). To encourage participation in the in-home interview, participants received $20 cash for the time spent on assembling the required documents for the in-person interview. Copies of the telephone survey instruments are in Appendix A, and questions from the in-person instrument that are relevant to this report are in Appendix B.
The interviews were conducted using computer-assisted personal interviewing between late September 2009 and January 2010 by 40 interviewers, 25 (62.5%) of whom are bilingual (English-Spanish). Field interviewers participated in a 4-day training immediately prior to the start of interviewing. The training covered topics including the WIC Program and the population served; WIC eligibility requirements; use of laptop computers and interview software; respondent
Volume 1: Participant Characteristics (Final Report)
7 National Survey of WIC Participants II
cooperation; professional conduct; protection of confidential information and secure data transfer; and record-keeping. Demand for other languages for interviewing was limited and scattered; telephone interpreting was offered for Chinese (both Mandarin and Cantonese) and Vietnamese for approximately five interviews. Telephone interpreting was also made available in Spanish for non-bilingual interviewers.
Based on the completion status of the interviews, respondents to the telephone interview were classified into four groups: complete, partially complete, refused, or unreachable. Due to problems associated with incomplete or out-of-date addresses and telephone numbers provided by the States (not entirely surprising for a mobile population), a 51.3 percent response rate was achieved, resulting in 2,538 completed and usable telephone interviews. Excluding those persons who were unreachable from the denominator24 the results yielded a cooperation rate of 78.0 percent. (A more detailed explanation of telephone response rates is included in Appendix C.)
2.1 Source of Data
The source of data for the sample was participants’ WIC records from the 23 sampled States: Alabama, Arizona, California, Colorado, Florida, Georgia, Illinois, Indiana, Kansas, Louisiana, Maryland, Massachusetts, Michigan, Missouri, New Jersey, New York, North Carolina, Ohio, Pennsylvania, Tennessee, Texas, Virginia, and Washington. In July 2009, States were asked to submit detailed participant-level data for all participants in sampled WIC clinics who received food issuances for use during April or May 2009. The sample was selected from participants who received food issuances or vouchers that were valid for redemption at any time during May 2009. Subsequently, in December 2009, data were also requested from the States for the same participants on redemption of the food vouchers issued—specifically the dollar value redeemed and the maximum dollar value of the voucher issued.25 Terminated participants were identified by comparing April data with May data. The following data were requested and received:
WIC category (pregnant, breastfeeding, postpartum, infant, child);
Type of food package issued and valid dates of use;
Participant ID, name, contact information, date of birth, gender, race/ethnicity;
Family Economic Unit/Household ID number (if available);
Parent/guardian of WIC participant (if infant or child);
Proof of identification/residency/adjunctive eligibility/income provided;
24 Eight telephone attempts were completed before replacing a sampled participant. Whenever possible, interviewers tried to locate participants with non-working or missing telephone numbers in person, at the provided address. Many persons were not at the address provided or were difficult to locate in large multi-unit apartment buildings when no apartment number was provided. Through the investigative efforts of the interviewers, many of these persons were located successfully and interviewed. Those who completed the telephone portion of the interview in person received a $10 gift card to their choice of Walmart or Target by mail. In addition, gift cards were provided to those who expressed concern about cell phone charges before scheduling or at a time during the telephone interview screening. 25 One State, North Carolina, was unable to provide redemption data due to ongoing system and database problems. This had no impact on the participant characteristics in this report, but it did for improper payments. We discuss the solution in that volume of the final report.
Volume 1: Participant Characteristics (Final Report)
National Survey of WIC Participants II 8
Dates of original and most recent certification;
Language spoken by WIC participant (if known); and
Number of persons in family economic unit.
Key data were also obtained on denied applicants if available from State databases (as was potentially the case in six States: Alabama, Arizona, Florida, Louisiana, New York, and Virginia). Subsequently, in December 2009, data were also requested from the States for the same participants on redemption of the food vouchers issued—specifically the dollar value redeemed and the maximum dollar value of the voucher issued.26
During the data collection period, a problem was encountered which was not anticipated: the contact information of participants (addresses and telephone numbers) was frequently out of date. While policies on what is required differ among the States, participants do not always provide telephone and address changes to local WIC offices, although all States do require some proof of residence during the original certification. Since vouchers are picked up in person, changes in telephone numbers and addresses would not necessarily get recorded until the next certification. As a result, locating sampled participants to schedule an interview was often a challenge. If data collectors could not reach a person by phone, they would make an in-person call at the address, and if they did not have an apartment number or if the person had moved, they inquired of neighbors. Data collectors were instructed to attempt calls at different times of the day (within an 8 a.m. to 8 p.m. window) and at different times of the week. They were also told not to leave more than two voicemail messages within a 4 day period to avoid appearance of harassment. If the data collector could not locate a participant by these means, they were instructed to see if more current information could be obtained from the local WIC clinic. This latter step was taken by about a half dozen of the data collectors, but ultimately did not yield much improved information.
As might be expected, it was much more difficult finding participants in large urban areas than in suburban areas, smaller towns, or rural areas. As data collection proceeded, data collectors were reassigned to put some of our most accomplished staff in areas where participants were most difficult to reach.
2.2 Sample Design
The sample design process started first with sample allocations, and then the selection of the sample of States; creation and selection of clusters; selections of agencies, clinics, and participants; and weighting.
Sample Allocations
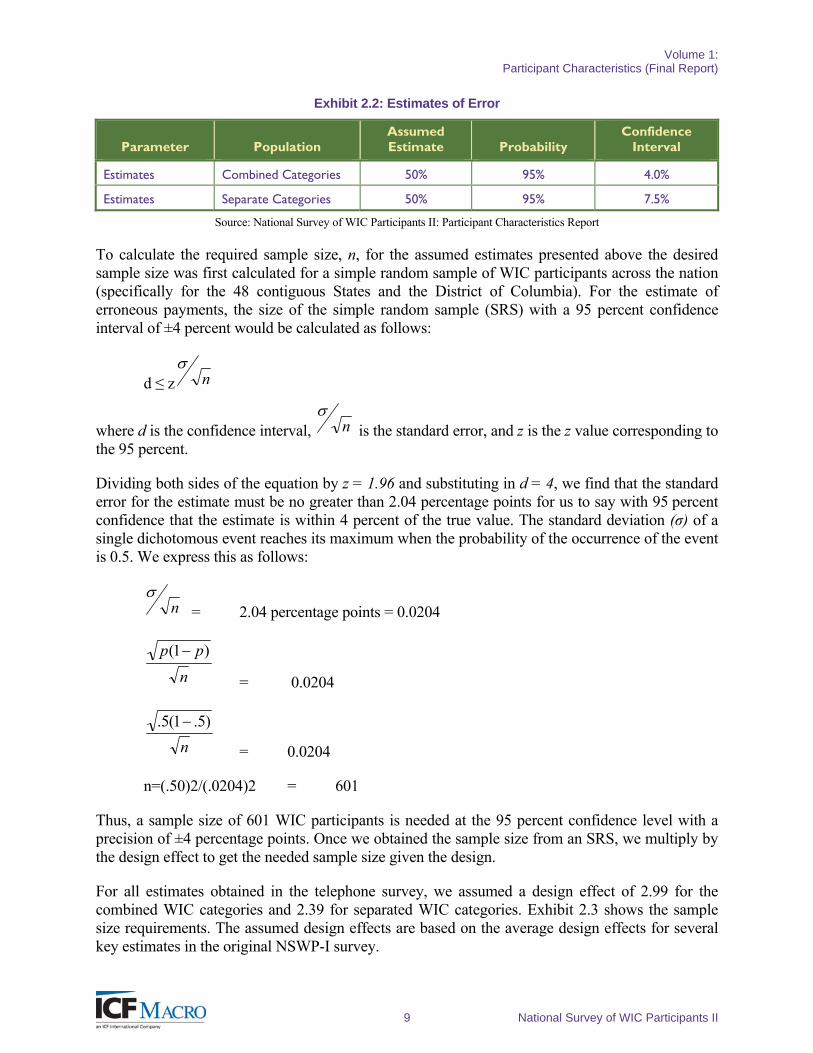
The sampling design and sample sizes required for this study were driven by the required estimates of case error and improper payments. Exhibit 2.2 presents the assumed estimates of error rate and other estimates used to calculate the sample size.
Volume 1: Participant Characteristics (Final Report)
9 National Survey of WIC Participants II
Exhibit 2.2: Estimates of Error
Parameter Population Assumed Estimate Probability
Confidence Interval
Estimates Combined Categories 50% 95% 4.0%
Estimates Separate Categories 50% 95% 7.5%
Source: National Survey of WIC Participants II: Participant Characteristics Report
To calculate the required sample size, n, for the assumed estimates presented above the desired sample size was first calculated for a simple random sample of WIC participants across the nation (specifically for the 48 contiguous States and the District of Columbia). For the estimate of erroneous payments, the size of the simple random sample (SRS) with a 95 percent confidence interval of ±4 percent would be calculated as follows:
d ≤ z n
where d is the confidence interval, n
is the standard error, and z is the z value corresponding to the 95 percent.
Dividing both sides of the equation by z = 1.96 and substituting in d = 4, we find that the standard error for the estimate must be no greater than 2.04 percentage points for us to say with 95 percent confidence that the estimate is within 4 percent of the true value. The standard deviation (σ) of a single dichotomous event reaches its maximum when the probability of the occurrence of the event is 0.5. We express this as follows:
n
= 2.04 percentage points = 0.0204
n
pp )1(
= 0.0204
n
)5.1(5.
= 0.0204
n=(.50)2/(.0204)2 = 601
Thus, a sample size of 601 WIC participants is needed at the 95 percent confidence level with a precision of ±4 percentage points. Once we obtained the sample size from an SRS, we multiply by the design effect to get the needed sample size given the design.
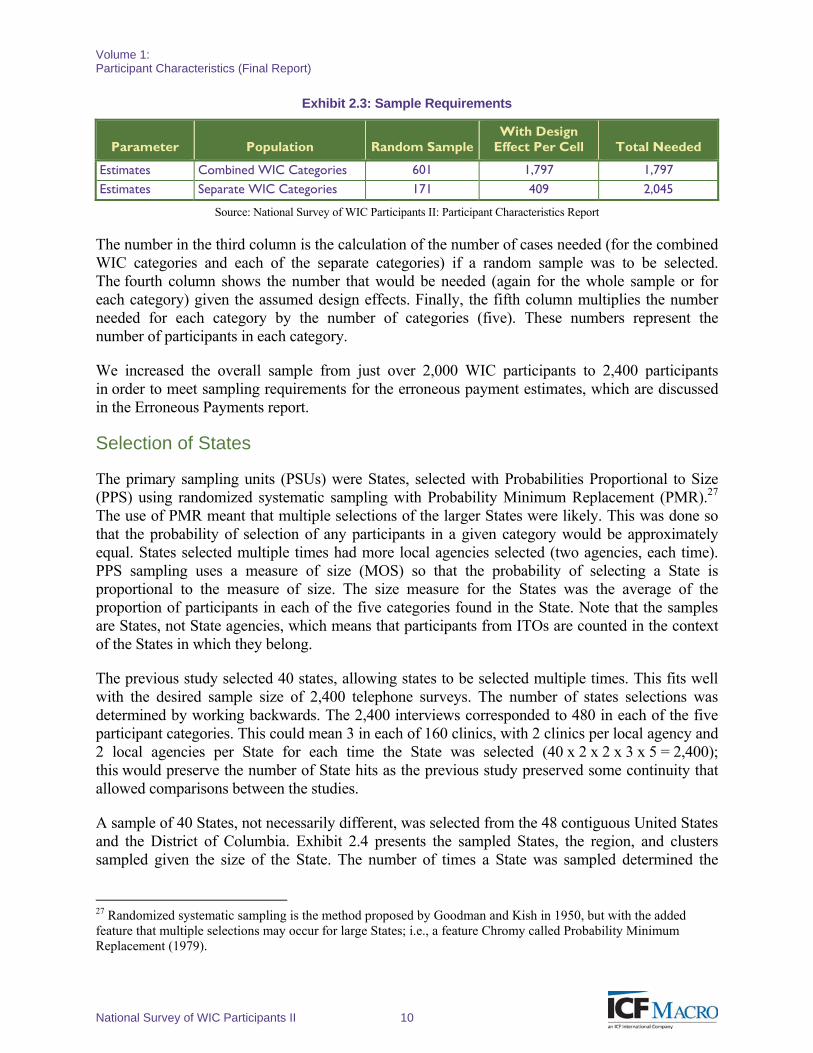
For all estimates obtained in the telephone survey, we assumed a design effect of 2.99 for the combined WIC categories and 2.39 for separated WIC categories. Exhibit 2.3 shows the sample size requirements. The assumed design effects are based on the average design effects for several key estimates in the original NSWP-I survey.
Volume 1: Participant Characteristics (Final Report)
National Survey of WIC Participants II 10
Exhibit 2.3: Sample Requirements
Parameter Population Random Sample With Design
Effect Per Cell Total Needed
Estimates Combined WIC Categories 601 1,797 1,797 Estimates Separate WIC Categories 171 409 2,045
Source: National Survey of WIC Participants II: Participant Characteristics Report
The number in the third column is the calculation of the number of cases needed (for the combined WIC categories and each of the separate categories) if a random sample was to be selected. The fourth column shows the number that would be needed (again for the whole sample or for each category) given the assumed design effects. Finally, the fifth column multiplies the number needed for each category by the number of categories (five). These numbers represent the number of participants in each category.
We increased the overall sample from just over 2,000 WIC participants to 2,400 participants in order to meet sampling requirements for the erroneous payment estimates, which are discussed in the Erroneous Payments report.
Selection of States
The primary sampling units (PSUs) were States, selected with Probabilities Proportional to Size (PPS) using randomized systematic sampling with Probability Minimum Replacement (PMR).27 The use of PMR meant that multiple selections of the larger States were likely. This was done so that the probability of selection of any participants in a given category would be approximately equal. States selected multiple times had more local agencies selected (two agencies, each time). PPS sampling uses a measure of size (MOS) so that the probability of selecting a State is proportional to the measure of size. The size measure for the States was the average of the proportion of participants in each of the five categories found in the State. Note that the samples are States, not State agencies, which means that participants from ITOs are counted in the context of the States in which they belong.
The previous study selected 40 states, allowing states to be selected multiple times. This fits well with the desired sample size of 2,400 telephone surveys. The number of states selections was determined by working backwards. The 2,400 interviews corresponded to 480 in each of the five participant categories. This could mean 3 in each of 160 clinics, with 2 clinics per local agency and 2 local agencies per State for each time the State was selected (40 x 2 x 2 x 3 x 5 = 2,400); this would preserve the number of State hits as the previous study preserved some continuity that allowed comparisons between the studies.
A sample of 40 States, not necessarily different, was selected from the 48 contiguous United States and the District of Columbia. Exhibit 2.4 presents the sampled States, the region, and clusters sampled given the size of the State. The number of times a State was sampled determined the
27 Randomized systematic sampling is the method proposed by Goodman and Kish in 1950, but with the added feature that multiple selections may occur for large States; i.e., a feature Chromy called Probability Minimum Replacement (1979).
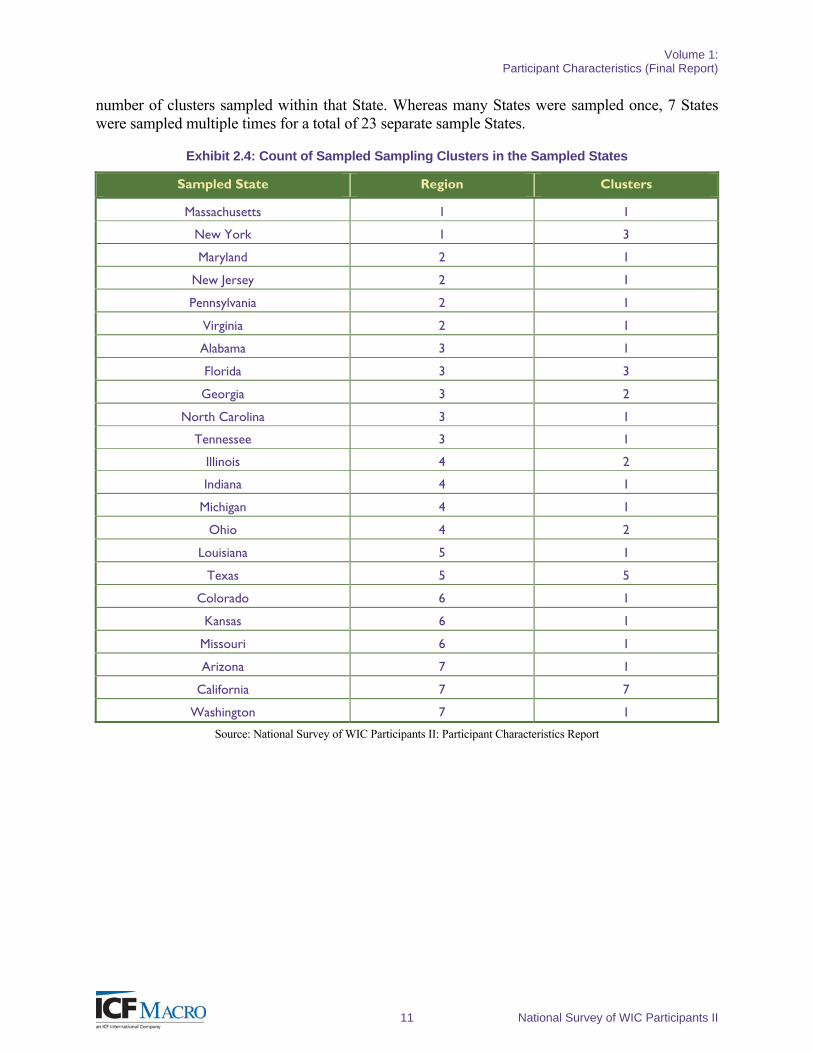
Volume 1: Participant Characteristics (Final Report)
11 National Survey of WIC Participants II
number of clusters sampled within that State. Whereas many States were sampled once, 7 States were sampled multiple times for a total of 23 separate sample States.
Exhibit 2.4: Count of Sampled Sampling Clusters in the Sampled States
Sampled State Region Clusters
Massachusetts 1 1
New York 1 3
Maryland 2 1
New Jersey 2 1
Pennsylvania 2 1
Virginia 2 1
Alabama 3 1
Florida 3 3
Georgia 3 2
North Carolina 3 1
Tennessee 3 1
Illinois 4 2
Indiana 4 1
Michigan 4 1
Ohio 4 2
Louisiana 5 1
Texas 5 5
Colorado 6 1
Kansas 6 1
Missouri 6 1
Arizona 7 1
California 7 7
Washington 7 1
Source: National Survey of WIC Participants II: Participant Characteristics Report
Volume 1: Participant Characteristics (Final Report)
National Survey of WIC Participants II 12
The approach is as follows:
Let Ti be the measure of size for State i. Let T be the sum of all the measures of size for the 49 States, including the District of Columbia. Now we define—
ei = 40Ti / T
—to be the expectation of State i.
The expectation is the same as a probability if ei < 1, and if it is greater than 1, the integer part of e represents the minimum number of times the State can be selected, and the fractional part represents the probability that it will be selected an additional time.
Now to order the 49 PSUs, grouping together the ones in the same WIC region, given that the States are in the desired order (the order guarantees proportional representation by the ordering variable), we select a random number r between 0 and 1.
If lim(x) means the largest integer less than or equal to x, then we can define—
c0 = r and
ci = e1 + e2 + … + ei.
Finally, let si = lim(ci) – lim(ci-1) and si defines the number of times PSU i is selected.
Creation and Selection of Clusters
For efficiency in interviewing, the sampled States were divided into clusters. Clusters are combinations of local agencies within a sampled State. Clusters were created such that no single local agency constituted more than half of the total cluster size and, to the extent possible, they were geographically compact. Similar to the State measure of size, the cluster measure of size (MOS) was defined as the average of the proportions of each category of WIC participants within a cluster relative to the State total of each category.
The equation is the following:
5
State
cluster
State
cluster
State
cluster
State
cluster
State
cluster
C
C
I
I
N
N
B
B
P
P
SizeCluster
Where, P = Pregnant,
B = Breastfeeding,
N=Postpartum Non-breastfeeding,
I = Infants, and
C = Children
Volume 1: Participant Characteristics (Final Report)
13 National Survey of WIC Participants II
As previously stated, the number of times a State was sampled determined the number of clusters sampled in that State. Most of the 23 States sampled only had one cluster sampled with probability proportional to size based on the cluster size described earlier. In seven of the States, two or more clusters were sampled with PPS: California, Texas, Florida, New York, Georgia, Illinois, and Ohio. In preparation for sampling of clusters, States were generally divided into geographic clusters based on administrative regions (if applicable), and number of local agencies. The number of clusters per State ranged from 2 to 11, with most having four to seven clusters. Arizona was divided into only two clusters to ensure that no single local agency constituted more than half of the cluster size. New York was divided into 11 clusters, with four in New York City alone. Geographic clustering was not done in California and Texas due to the large number of clusters to be sampled in each (seven and five, respectively) and the magnitude of local agencies. These local agencies were sampled directly and arranged into groups to facilitate interview assignments. Clustering would have been difficult and would not have yielded any gains in efficiency.
Selection of Agencies
Two local agencies were sampled with PPS from each cluster. Calculations of the local agency MOS were similar to the State and cluster size calculations. Instead of applying the proportions of each category of WIC participants within a cluster relative to the State totals, the cluster totals were used in the calculations of proportions. The size measure was multiplied by two to ensure the sampling of two local agencies from each sampling cluster. For example, with three clusters in New York, six local agencies were selected.
As noted, agencies were sampled directly in California and Texas, with two agencies sampled for each time the State was sampled with probability proportional to size. Calculations for the local agency MOS were done based on State totals instead of cluster totals. Sampling of agencies in these States occurred with probability minimum replacement, so that sampling of very large local agencies could occur more than once. One very large California local agency was sampled three times. Thus, across all States and clusters, 78 separate local agencies were sampled.
Selection of Clinics
Prior to the selection of the clinics, a total of 2,400 WIC participants were allocated across all local agencies sampled, with each of the five categories of WIC participants receiving 480 participants. For all but the one local agency sampled multiple times, 30 participants were sampled across the five categories within each local agency. (The large California local agency received 90 WIC participants, or three times the normal allocation.) Allocation of the 30 participants per local agency occurred according to their distribution across categories of participants in the local agency relative to the distribution of participants among all sampled local agencies.
Volume 1: Participant Characteristics (Final Report)
National Survey of WIC Participants II 14
The initial allocation was defined as:
5
1
30
i i
i
i
i
i
Where Ai = the allocation to category i, and i equals one of the five categories of WIC participants:
Ni = the number of participants in category i for the sampled local agency
Ti = the number of participants in category i across all sampled local agencies
An iterative rounding algorithm was used in order to obtain exactly 480 participants per category.
Thus, if, for example, a local agency had more participants in one category compared with the remaining four categories, or more in a category compared with the remaining sampled local agencies, a greater share of the 30 participants would be allocated to that category.
Once sampling of local agencies occurred, clinic-level data were obtained for each of the five categories of WIC participants. The clinic size is similar to the other size calculations above with a few major differences. Each clinic-level proportion was weighted by the local agency allocation within category. The adjusted proportions were then divided by 15—half the number of participants within each local agency.
Wherever possible, two clinics were sampled with PPS from each local agency. If a local agency had only one clinic, sampling of that clinic was automatic and the participant allocation at the local agency level remained as before. When local agencies had one extremely large clinic and several small clinics, they were collapsed at the local agency level. If a local agency had only two clinics and the clinics were both sufficiently large (greater than 60 total participants per clinic), the 30 participants were allocated 15 to each clinic. However, the partial allocations (i.e., the number of participants in each category) could vary from clinic to clinic, with a rounding algorithm used to decide the final allocations. In local agencies with multiple clinics, two clinics were sampled with PPS, and the same total number of participants was allocated to each. However, if one of the two sufficiently large clinics selected had 70 percent or more of the total participants in the local agency, researchers allocated the 30 participants proportionally among the two clinics. This occurred once.
Selection of Participants
After the selection of WIC clinics and several months before data collection, lists of participants enrolled during two consecutive months (April and May 2009) were obtained from all clinics sampled. The later month was to be the target month.
Volume 1: Participant Characteristics (Final Report)
15 National Survey of WIC Participants II
Participants were classified into the five categories. If a participant changed categories within the target month, the most recent category was used. Thus, if an infant became a child during the month, he was considered a child for sampling purposes.
Each participant in a clinic was assigned a random number. Sorted by that number, participants underwent a selection process by the first n from each category (where n is the allocation of participants at the clinic level described earlier). The remaining participants in a category remained in their order of selection and acted as replacements, so that if a participant (or the participant’s parent/guardian) refused to respond or could not be located, the next one in line was selected.
Weighting
Each State was sampled with PPS, using a size measure that was the average of the proportion of participants in each of the five categories. This average was then multiplied by the number of States allocated to the sample (40) and its inverse was used as the PSU weight. Note that the result would be smaller than 1.00 if selection of the PSU occurred more than once. PSU weights that were lower than 1 were set to 1.
Similarly the clusters were also sampled with PPS, using a similar measure of size (MOS). The MOS was then multiplied by the number of sampled clusters. For California and Texas, where no clustering occurred, this weight was 1. Local agency probabilities of selection were two times the local agency MOS. In California and Texas the local agency probabilities of selection were twice the number of clusters selected (14 and 10, respectively) times the local agency MOS. When selection of clinics occurred, their probabilities of selection were two times the local agency MOS.
For the participants, calculations for the probability of selection were the number of participants sampled from the category divided by the total number of participants from the category receiving issuance each month. Calculations for intermediate probability of selection of the clinic also may have occurred.
Therefore, the initial weight for a participant was the inverse of their probability of selection. The probability of selecting a participant Pijkrt, is the probability of selection of a participant in State i, cluster j, agency k, clinic r, and participant category t. This would be equal to Pijkrt = Pi Pj Pk Pr Pt, where Pi is the probability of selecting the State, Pj the probability of selecting the cluster given the selection of the State, Pk the probability of selecting the agency given the selection of the cluster, Pr the probability of selecting the clinic (or 1 if clinics are not sampled) given the selection of the agency, and Pt is the probability of selecting the participant given the selection of the agency or clinic.
Trimming of weights is desirable here because extreme weights lead to large variances. For each category, weights will max at three times the median weight, and the reduction will spread out over the entire category.
Potential problems for the telephone survey by weight adjustments were addressed via post-stratification. The idea in post-stratification is to use relevant population parameters as the reference (specifically each variable’s marginal totals known as control totals) to adjust the survey data weight and correct the cell frequency distributions of the key variables that are biased or
Volume 1: Participant Characteristics (Final Report)
National Survey of WIC Participants II 16
unreliable because of undercoverage and/or non-response (Battaglia, et al., 2005). With that adjustment, it was possible to generate estimates with less bias and greater precision. National totals of participants by WIC category were obtained and the final weights were adjusted to sum to the known totals.
2.3 Non-Response Bias Analysis
The Office of Management and Budget (OMB) requires non-response bias analysis whenever the survey response rate is less than 80 percent. The response rate for the telephone survey of participants in this study was 51.3 percent (Exhibit 2.3-1).28 To a large extent, the response rate reflects the source of information for the sampling frame. States obtain contact information on applicants during initial application and/or at recertification. Participants, however, receive their vouchers, exchangeable for nutritious food, at WIC offices in person. Since vouchers are picked up at WIC offices, the need to maintain current contact information is minimized and contact information in State files may legitimately be 6 to 18 months out of date. In conducting the telephone survey among WIC participants, it was found that 4.4 percent of telephone numbers were no longer current, being either disconnected (temporarily or otherwise) or not in service at all. Another 14.0 percent of participants could not be reached by phone. Attempts made to locate sampled participants by other means,including visiting their reported residences,were sometimes successful.However, addresses also changed. In this case, a follow-up was done, as specified in the research design, asking whoever resided at that address or a neighbor to help locate the sampled participant. Sometimes, this was achieved with the help of an updated telephone number, but frequently the interview was conducted in person at the discovered address, or at yet another address where the sampled participants were located.
This process was quite effective as a whole, as suggested by the difference between the response rate and the ultimately achieved cooperation rate of 78.0 percent. The response rate was determined using AAPOR29 calculation RR1, defined as the number of completed interviews divided by the sum of (1) completed interviews plus partial interviews, and (2) refusals and non-contacts. (Note that RR1 also includes cases of unknown eligibility in the denominator, but we had no such cases.) The cooperation rate, using AAPOR calculation COOP1, is the number of completed interviews divided by the sum of (1) completed and partial interviews, (2) refusals, and (3) others who could be identified and contacted (thus excluding those for whom current contact information was unavailable).
Despite the efforts to locate respondents for whom contact information was no longer current, both the response rate and the cooperation rate (excluding those who could not be located) remained below 80 percent. Thus, non-response bias analysis was conducted in order to examine both the amount of non-response and the extent to which respondents differed from non-respondents on key background variables.
28 Non-response bias analysis for the in-person survey results is included in Report 3. 29 American Association for Public Opinion Research. Standard Definitions: Final Dispositions of Case Codes and Outcome Rates for Surveys, 2009 Revision. (2009). Retrieved from http://www.aapor.org/Content/NavigationMenu/ResourcesforResearchers/StandardDefinitions/StandardDefinitions2009new.pdf
Volume 1: Participant Characteristics (Final Report)
17 National Survey of WIC Participants II
The non-response bias analysis relied on participant category, which was part of the sampling frame, and on several characteristics available for both respondents and non-respondents 30 including: race/ethnicity, gender, family size, months since the recent certification, and whether the participant lived in a metropolitan statistical area (MSA) or a non-MSA (Appendix D1). Two additional variables were examined (participants’ category and region of the country), but the response rates for these were irrelevant. That is because the design included sequential replacements of non-respondents, meaning that each non-respondent was replaced by a participant from the same WIC Category and Local Agency (and thereby, region). As a result, the number in each WIC category (i.e., pregnant women, postpartum, breastfeeding, infant and child) and the number in each Local Agency were held constant by the replacement procedure. And, since every non-respondent was replaced by another participant from the same region, that would not have introduced any response-rate bias by region.
The response rates were compared for each of the categories in these variables, and the differences within categories were tested for significance (see Appendix D-1).
In addition, these items were used to ascertain whether those variables related to responding would affect estimates of at least some substantive variables. Had any variable been significantly related to responding, we would have investigated further. Race/ethnicity was the only variable related to both responding and to key outcome variables.
The key outcome variables were chosen to represent the most relevant outcomes that could have a potential relationship to the response rates. The following key outcome variables were chosen:
Item #7: Satisfaction with WIC staff and services (Very Satisfied/Satisfied vs. Neither/ Somewhat Dissatisfied/Very Dissatisfied)
Item #7A: Satisfaction with location and building facility services (Very Satisfied/ Satisfied vs. Neither/Somewhat Dissatisfied/Very Dissatisfied)
Item 8: Ratings of the various aspects of WIC staff, services, and facilities (Excellent/Very Good/Good vs. Fair/Poor)
Item #9: Satisfaction with various food benefits (Excellent/Very Good/Good vs. Fair/Poor)
Item #18: Attendance at any group education session (Yes vs. No)
Item #24: One-on-one nutrition counseling (Yes vs. No)
Item #32: Various food programs received (Yes vs. No)
Item #33: Food security screener status (Have enough to eat vs. Sometimes do not have enough to eat/Often do not have enough to eat)
30 States were able to provide only limited demographic data on the sample frame, including both respondents and non-respondents. While we collected additional data on respondents, these were not available for non-respondents, and could not be used for the non-response bias analysis.
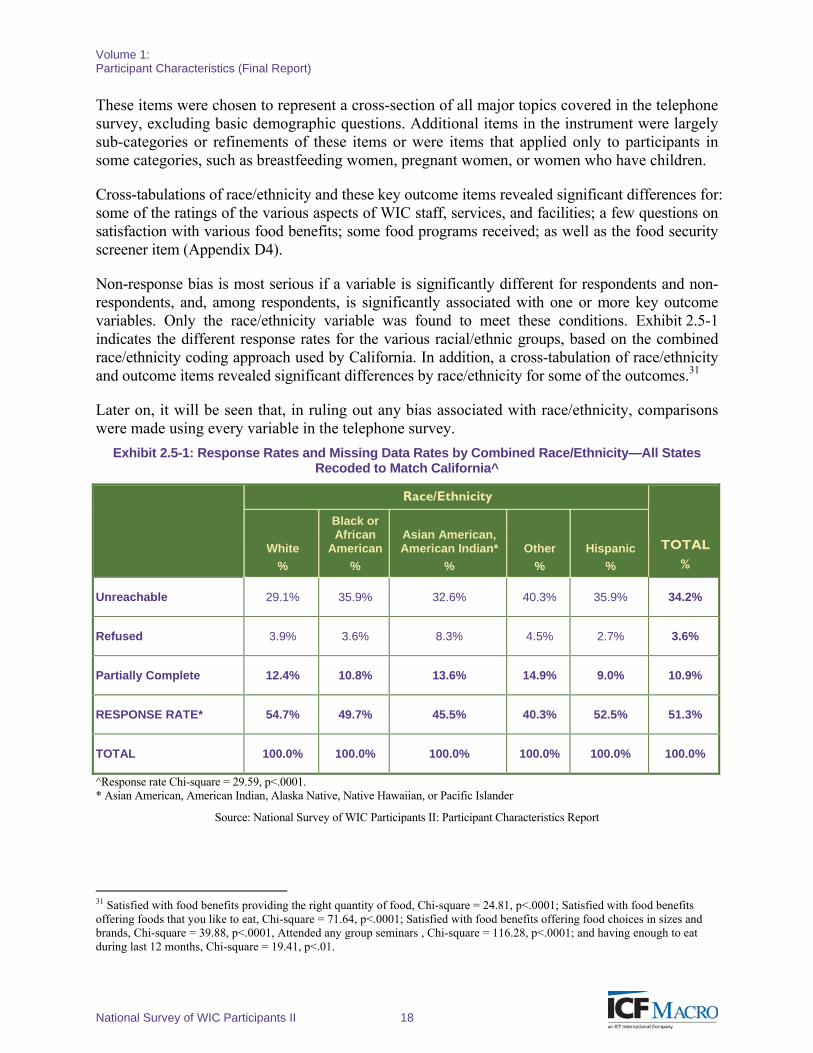
Volume 1: Participant Characteristics (Final Report)
National Survey of WIC Participants II 18
These items were chosen to represent a cross-section of all major topics covered in the telephone survey, excluding basic demographic questions. Additional items in the instrument were largely sub-categories or refinements of these items or were items that applied only to participants in some categories, such as breastfeeding women, pregnant women, or women who have children.
Cross-tabulations of race/ethnicity and these key outcome items revealed significant differences for: some of the ratings of the various aspects of WIC staff, services, and facilities; a few questions on satisfaction with various food benefits; some food programs received; as well as the food security screener item (Appendix D4).
Non-response bias is most serious if a variable is significantly different for respondents and non-respondents, and, among respondents, is significantly associated with one or more key outcome variables. Only the race/ethnicity variable was found to meet these conditions. Exhibit 2.5-1 indicates the different response rates for the various racial/ethnic groups, based on the combined race/ethnicity coding approach used by California. In addition, a cross-tabulation of race/ethnicity and outcome items revealed significant differences by race/ethnicity for some of the outcomes.31
Later on, it will be seen that, in ruling out any bias associated with race/ethnicity, comparisons were made using every variable in the telephone survey.
Exhibit 2.5-1: Response Rates and Missing Data Rates by Combined Race/Ethnicity—All States Recoded to Match California^
Race/Ethnicity
TOTAL
% White
%
Black or African
American
%
Asian American, American Indian*
%
Other
%
Hispanic
%
Unreachable 29.1% 35.9% 32.6% 40.3% 35.9% 34.2%
Refused 3.9% 3.6% 8.3% 4.5% 2.7% 3.6%
Partially Complete 12.4% 10.8% 13.6% 14.9% 9.0% 10.9%
RESPONSE RATE* 54.7% 49.7% 45.5% 40.3% 52.5% 51.3%
TOTAL 100.0% 100.0% 100.0% 100.0% 100.0% 100.0%
^Response rate Chi-square = 29.59, p<.0001. * Asian American, American Indian, Alaska Native, Native Hawaiian, or Pacific Islander
Source: National Survey of WIC Participants II: Participant Characteristics Report
31 Satisfied with food benefits providing the right quantity of food, Chi-square = 24.81, p<.0001; Satisfied with food benefits offering foods that you like to eat, Chi-square = 71.64, p<.0001; Satisfied with food benefits offering food choices in sizes and brands, Chi-square = 39.88, p<.0001, Attended any group seminars , Chi-square = 116.28, p<.0001; and having enough to eat during last 12 months, Chi-square = 19.41, p<.01.

Volume 1: Participant Characteristics (Final Report)
19 National Survey of WIC Participants II
As seen in Exhibit 2.5-1, in order to include the entire sample, Hispanic origin and race were combined in this analysis. This is because California provided its data on race/ethnicity as a single variable in which Hispanic was treated as a race, rather than following the usual practice asking respondents if they are Hispanic after identifying their race in a separate question. The other states were therefore recoded to match the California race/ethnicity approach. At this point, it was also determined that the state-provided ethnicity and the self-reported ethnicity did not always match. The overall match rate was 68.7 percent, which means 31.3 percent of the state-provided ethnicity did not match the self-reported ethnicity. If California is removed, the match rate goes up to 80.5 percent.
Exhibit 2.5-2 provides non-response information using current practice for race/ethnicity (and thus, data) for all States except California. Since the results did not differ from those including California, our subsequent procedures and weighting included California.
Exhibit 2.5-2: Response Rates and Missing Data Rates by Race/Ethnicity— All States except California^
Race/Ethnicity
TOTAL
% White Black or African
American
Asian American, American
Indian* Other Hispanic
No
%
Yes
%
No
%
Yes
%
No
%
Yes
%
No
%
Yes
%
No
%
Yes
%
Unreachable 33.6 32.6 32.3 35.4 33.6 26.0 32.6 36.3 32.0 34.8 33.0
Refused 3.3 3.4 3.4 3.1 3.4 2.4 3.2 4.2 3.8 2.6 3.3
Partially Complete
12.7 10.5 11.4 11.4 11.4 12.0 10.8 16.5 12.5 9.5 11.4
RESPONSE RATE* 50.4 53.5 52.8 50.1 51.6 59.6 53.4 43.0 51.7 53.1 52.2
TOTAL 100.0 100.0 100.0 100.0 100.0 100.0 100.0 100.0 100.0 100.0 100.0
^Note: Chi-Square=26.16, p<.0001
* Asian American, American Indian, Alaska Native, Native Hawaiian, or Pacific Islander
Source: National Survey of WIC Participants II: Participant Characteristics Report
The sample of respondents was weighted using preliminary weights, and the estimates using self-reported race/ethnicity were closer (within 4 percentage points) to the percentages found in the FNS’s WIC Participant and Program Characteristics report (2008) than those using the state-provided race/ethnicity. This discrepancy persisted, even when race/ethnicity from the initial sample (sampled respondents and non-respondents without including replacements) was used instead of the final sample (with respondents only, including replacements). In addition, to include data from California, the state-provided data did not permit separation of Hispanic participants by race. These factors made non-response adjustments less appealing than post-stratification or
Volume 1: Participant Characteristics (Final Report)
National Survey of WIC Participants II 20
raking. 32 Since FNS reports presented race and ethnicity separately, raking was the more appropriate technique. Some respondents declined to answer the questions on race or Hispanic origin. Hotdeck imputation was performed for these cases so the raking could be done effectively. This procedure is commonly used, and can be found in the documentation of the State and Local Youth Risk Behavior Surveys Weighting Procedures,33 or in the National Household Education Surveys.34 The weights were raked on race and Hispanic status separately and all key outcome variable estimates were calculated using the two sets of weights: the original unadjusted weights and the raked weights.
The largest difference between the results of the two different weighting procedures was 1.5 percent, and the bulk of the differences were under 1 percent (Appendix D3). None of the differences were such that they would have led to substantively incorrect conclusions. Given that there is no guarantee that the self-reported survey of race and Hispanic status would match the administrative data, that we have two sources for race and ethnicity that do not fully agree, and that raked weights and unadjusted weights provided very similar results, we recommend using the original unadjusted weights—and, as stated, including a comparison of Responses and Non-response Rates by Relevant Characteristics (Appendix D1) and Difference Between Original Weights and Raked Weights on Relevant Measures (Appendix D3).
Finally, we examined item non-response for every item to fulfill Guideline 3.2.10 of the Office of Management and Budget’s Standards and Guidelines for Statistical Surveys35 that requires item non-response analysis if the item response rate is less than 70 percent. We recoded data so that a missing value indicated item non-response rather than being due to a skip pattern. We did not find any item that had a response rate lower than 70 percent. In fact, none of the items had a missing value more than 2.5 percent (Appendix D2). As the rate of item non-response was not found to be lower than 70 percent for any individual item, item non-response bias analysis was not conducted.
32 Raking is a form of iterative post-stratification, frequently used when totals come from different tables. In this case different tables presented race and Hispanic status. 33 Retrieved from http://www.cdphe.state.co.us/hs/yrbs/2007%20YRBS%20Weighting%20Procedures.pdf 34 NCES. (1997). An overview of the National Household Education Surveys: 1991, 1993, 1995 and 1996. 35 Retrieved from http://www.whitehouse.gov/sites/default/files/omb/inforeg/statpolicy/standards_stat_surveys.pdf
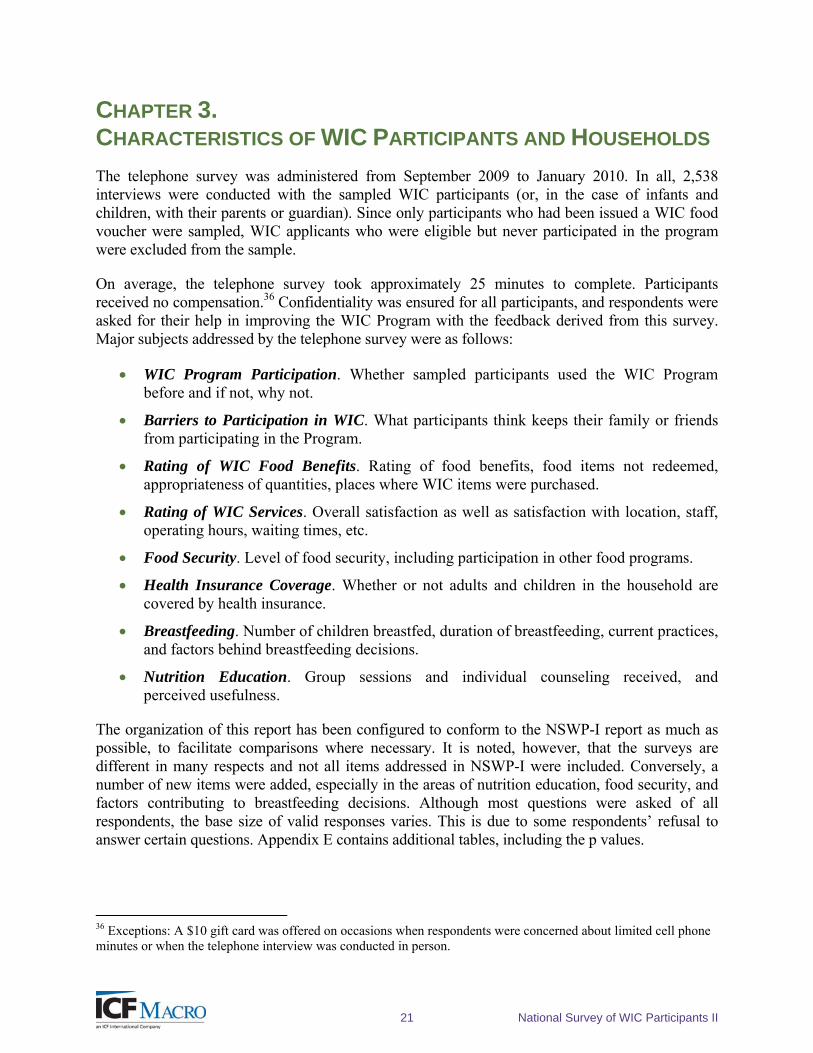
21 National Survey of WIC Participants II
CHAPTER 3. CHARACTERISTICS OF WIC PARTICIPANTS AND HOUSEHOLDS
The telephone survey was administered from September 2009 to January 2010. In all, 2,538 interviews were conducted with the sampled WIC participants (or, in the case of infants and children, with their parents or guardian). Since only participants who had been issued a WIC food voucher were sampled, WIC applicants who were eligible but never participated in the program were excluded from the sample.
On average, the telephone survey took approximately 25 minutes to complete. Participants received no compensation.36 Confidentiality was ensured for all participants, and respondents were asked for their help in improving the WIC Program with the feedback derived from this survey. Major subjects addressed by the telephone survey were as follows:
WIC Program Participation. Whether sampled participants used the WIC Program before and if not, why not.
Barriers to Participation in WIC. What participants think keeps their family or friends from participating in the Program.
Rating of WIC Food Benefits. Rating of food benefits, food items not redeemed, appropriateness of quantities, places where WIC items were purchased.
Rating of WIC Services. Overall satisfaction as well as satisfaction with location, staff, operating hours, waiting times, etc.
Food Security. Level of food security, including participation in other food programs.
Health Insurance Coverage. Whether or not adults and children in the household are covered by health insurance.
Breastfeeding. Number of children breastfed, duration of breastfeeding, current practices, and factors behind breastfeeding decisions.
Nutrition Education. Group sessions and individual counseling received, and perceived usefulness.
The organization of this report has been configured to conform to the NSWP-I report as much as possible, to facilitate comparisons where necessary. It is noted, however, that the surveys are different in many respects and not all items addressed in NSWP-I were included. Conversely, a number of new items were added, especially in the areas of nutrition education, food security, and factors contributing to breastfeeding decisions. Although most questions were asked of all respondents, the base size of valid responses varies. This is due to some respondents’ refusal to answer certain questions. Appendix E contains additional tables, including the p values.
36 Exceptions: A $10 gift card was offered on occasions when respondents were concerned about limited cell phone minutes or when the telephone interview was conducted in person.
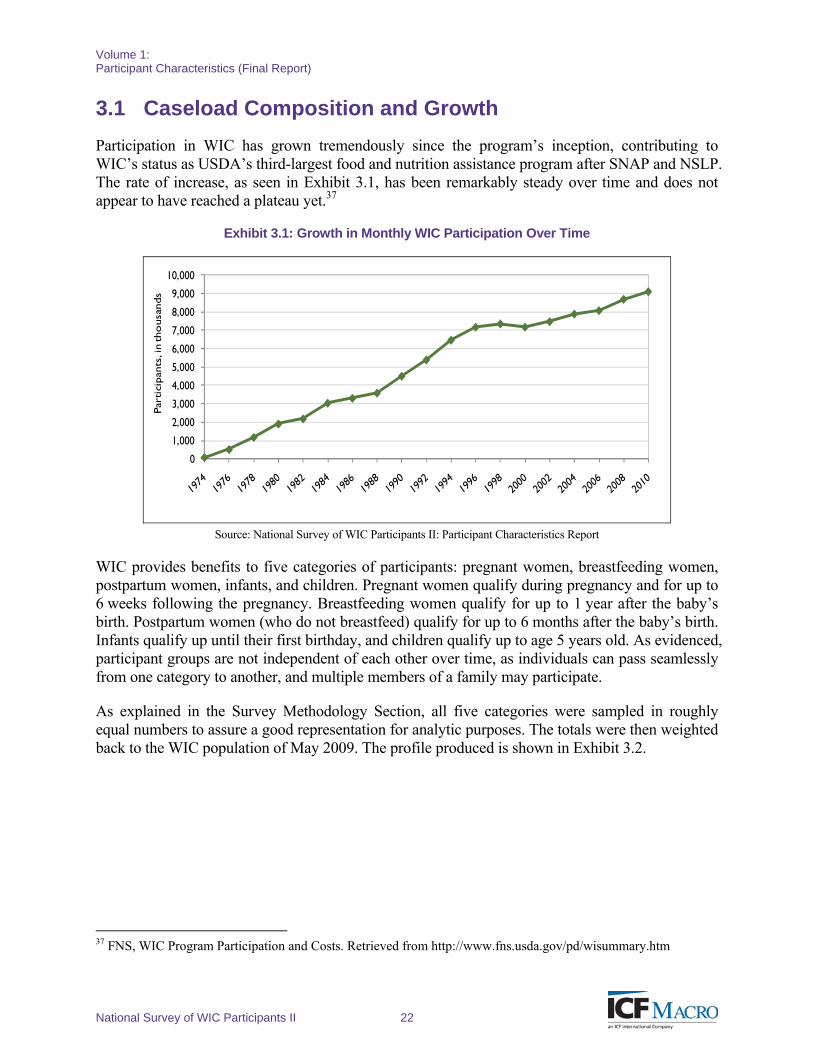
Volume 1: Participant Characteristics (Final Report)
National Survey of WIC Participants II 22
3.1 Caseload Composition and Growth
Participation in WIC has grown tremendously since the program’s inception, contributing to WIC’s status as USDA’s third-largest food and nutrition assistance program after SNAP and NSLP. The rate of increase, as seen in Exhibit 3.1, has been remarkably steady over time and does not appear to have reached a plateau yet.37
Exhibit 3.1: Growth in Monthly WIC Participation Over Time
0
1,000
2,000
3,000
4,000
5,000
6,000
7,000
8,000
9,000
10,000
Par
tici
pan
ts, i
n tho
usa
nds
Source: National Survey of WIC Participants II: Participant Characteristics Report
WIC provides benefits to five categories of participants: pregnant women, breastfeeding women, postpartum women, infants, and children. Pregnant women qualify during pregnancy and for up to 6 weeks following the pregnancy. Breastfeeding women qualify for up to 1 year after the baby’s birth. Postpartum women (who do not breastfeed) qualify for up to 6 months after the baby’s birth. Infants qualify up until their first birthday, and children qualify up to age 5 years old. As evidenced, participant groups are not independent of each other over time, as individuals can pass seamlessly from one category to another, and multiple members of a family may participate.
As explained in the Survey Methodology Section, all five categories were sampled in roughly equal numbers to assure a good representation for analytic purposes. The totals were then weighted back to the WIC population of May 2009. The profile produced is shown in Exhibit 3.2.
37 FNS, WIC Program Participation and Costs. Retrieved from http://www.fns.usda.gov/pd/wisummary.htm
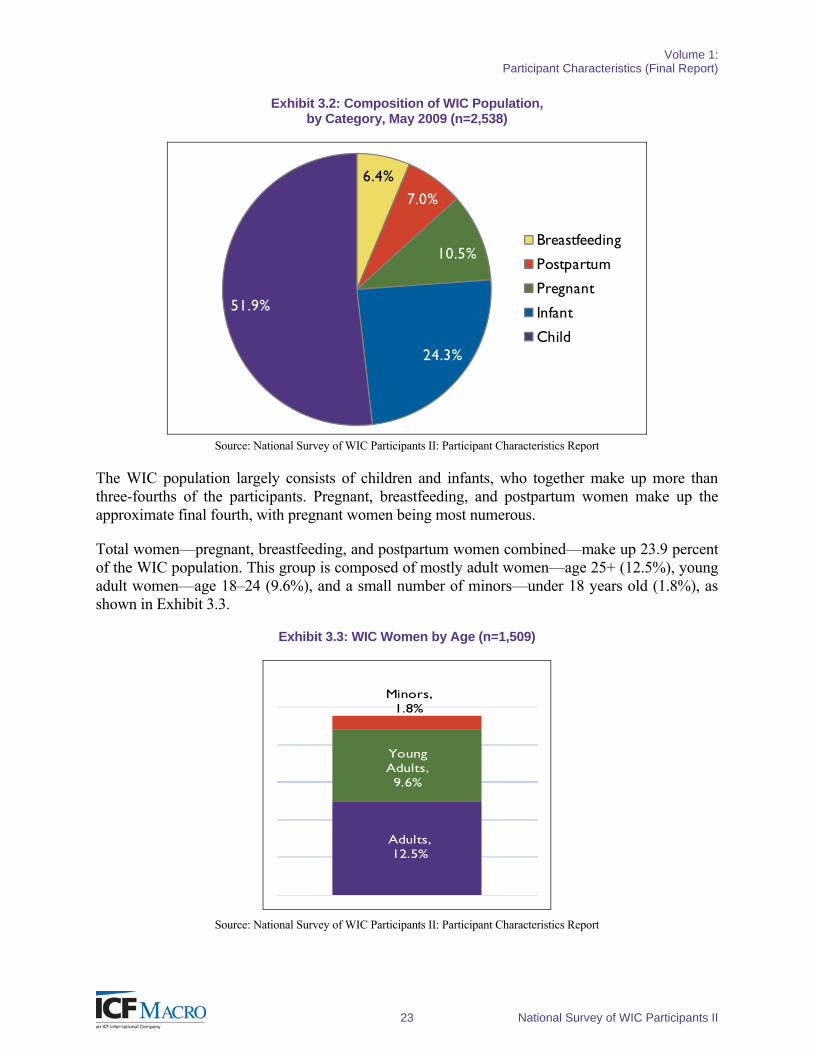
Volume 1: Participant Characteristics (Final Report)
23 National Survey of WIC Participants II
Exhibit 3.2: Composition of WIC Population, by Category, May 2009 (n=2,538)
6.4%
7.0%
10.5%
24.3%
51.9%
Breastfeeding
Postpartum
Pregnant
Infant
Child
Source: National Survey of WIC Participants II: Participant Characteristics Report
The WIC population largely consists of children and infants, who together make up more than three-fourths of the participants. Pregnant, breastfeeding, and postpartum women make up the approximate final fourth, with pregnant women being most numerous.
Total women—pregnant, breastfeeding, and postpartum women combined—make up 23.9 percent of the WIC population. This group is composed of mostly adult women—age 25+ (12.5%), young adult women—age 18–24 (9.6%), and a small number of minors—under 18 years old (1.8%), as shown in Exhibit 3.3.
Exhibit 3.3: WIC Women by Age (n=1,509)
Adults, 12.5%
Young Adults, 9.6%
Minors, 1.8%
Source: National Survey of WIC Participants II: Participant Characteristics Report
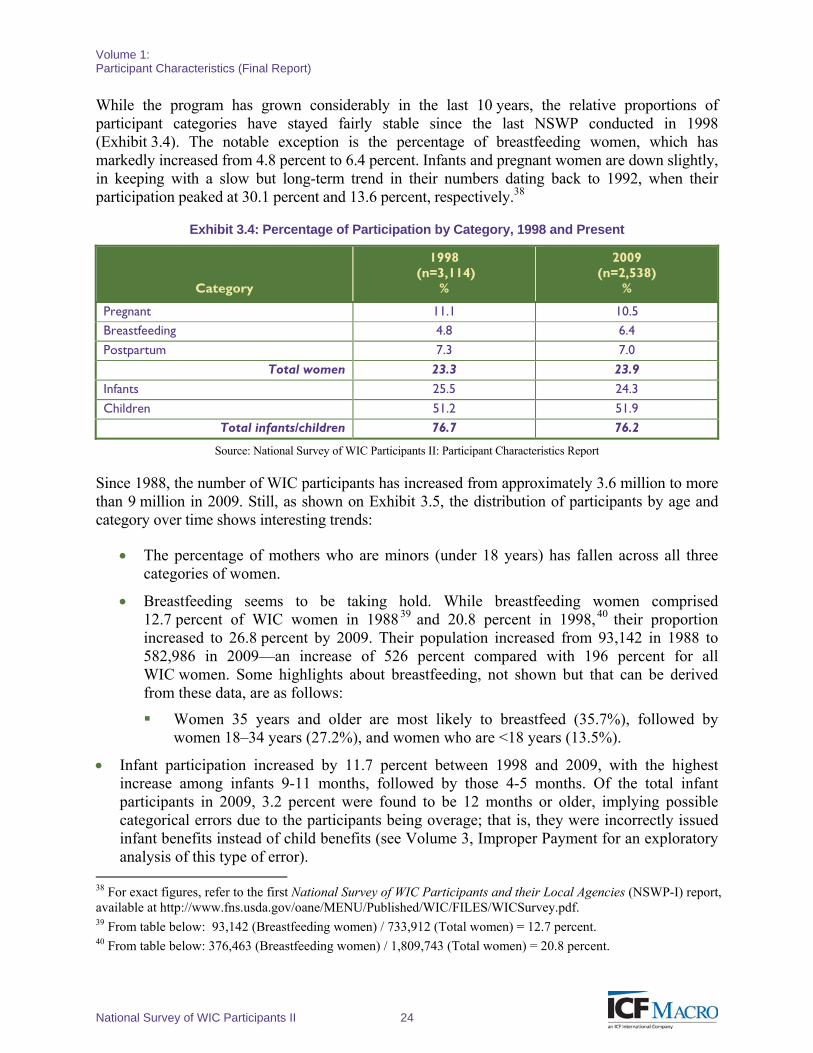
Volume 1: Participant Characteristics (Final Report)
National Survey of WIC Participants II 24
While the program has grown considerably in the last 10 years, the relative proportions of participant categories have stayed fairly stable since the last NSWP conducted in 1998 (Exhibit 3.4). The notable exception is the percentage of breastfeeding women, which has markedly increased from 4.8 percent to 6.4 percent. Infants and pregnant women are down slightly, in keeping with a slow but long-term trend in their numbers dating back to 1992, when their participation peaked at 30.1 percent and 13.6 percent, respectively.38
Exhibit 3.4: Percentage of Participation by Category, 1998 and Present
Category
1998 (n=3,114)
%
2009 (n=2,538)
%
Pregnant 11.1 10.5 Breastfeeding 4.8 6.4
Postpartum 7.3 7.0
Total women 23.3 23.9
Infants 25.5 24.3
Children 51.2 51.9 Total infants/children 76.7 76.2
Source: National Survey of WIC Participants II: Participant Characteristics Report
Since 1988, the number of WIC participants has increased from approximately 3.6 million to more than 9 million in 2009. Still, as shown on Exhibit 3.5, the distribution of participants by age and category over time shows interesting trends:
The percentage of mothers who are minors (under 18 years) has fallen across all three categories of women.
Breastfeeding seems to be taking hold. While breastfeeding women comprised 12.7 percent of WIC women in 1988 39 and 20.8 percent in 1998,40 their proportion increased to 26.8 percent by 2009. Their population increased from 93,142 in 1988 to 582,986 in 2009—an increase of 526 percent compared with 196 percent for all WIC women. Some highlights about breastfeeding, not shown but that can be derived from these data, are as follows:
Women 35 years and older are most likely to breastfeed (35.7%), followed by women 18–34 years (27.2%), and women who are <18 years (13.5%).
Infant participation increased by 11.7 percent between 1998 and 2009, with the highest increase among infants 9-11 months, followed by those 4-5 months. Of the total infant participants in 2009, 3.2 percent were found to be 12 months or older, implying possible categorical errors due to the participants being overage; that is, they were incorrectly issued infant benefits instead of child benefits (see Volume 3, Improper Payment for an exploratory analysis of this type of error).
38 For exact figures, refer to the first National Survey of WIC Participants and their Local Agencies (NSWP-I) report, available at http://www.fns.usda.gov/oane/MENU/Published/WIC/FILES/WICSurvey.pdf. 39 From table below: 93,142 (Breastfeeding women) / 733,912 (Total women) = 12.7 percent. 40 From table below: 376,463 (Breastfeeding women) / 1,809,743 (Total women) = 20.8 percent.
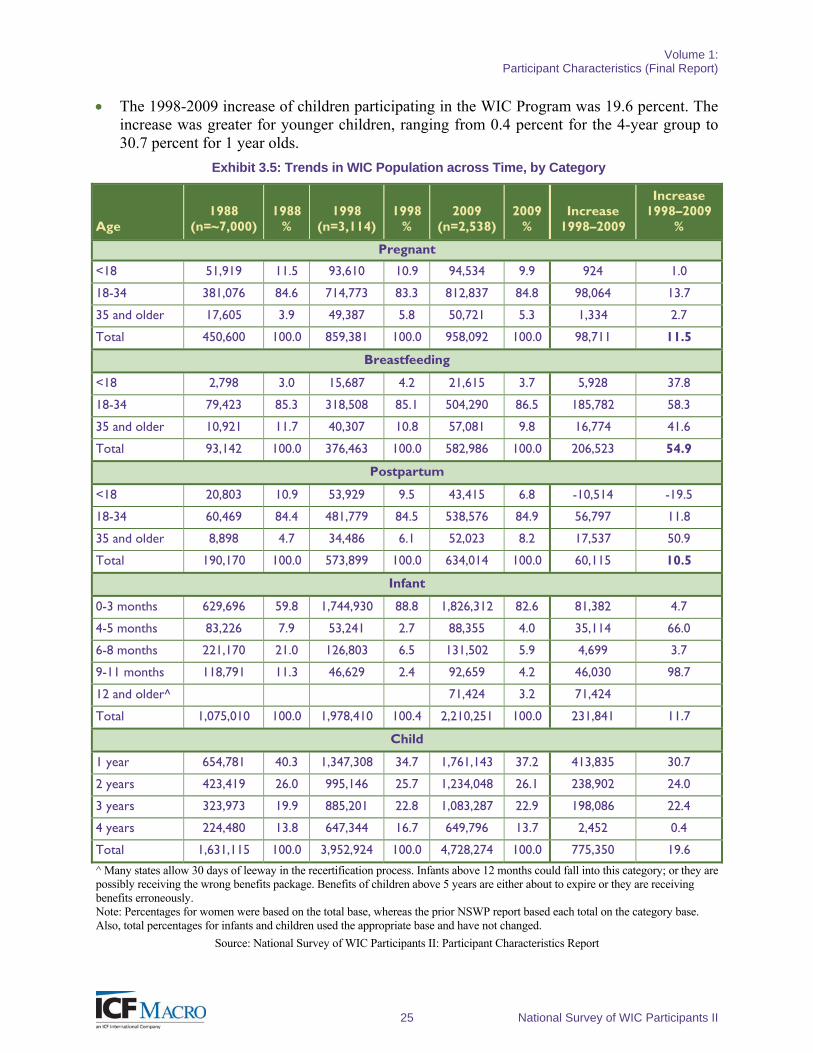
Volume 1: Participant Characteristics (Final Report)
25 National Survey of WIC Participants II
The 1998-2009 increase of children participating in the WIC Program was 19.6 percent. The increase was greater for younger children, ranging from 0.4 percent for the 4-year group to 30.7 percent for 1 year olds.
Exhibit 3.5: Trends in WIC Population across Time, by Category
Age 1988
(n=~7,000) 1988
% 1998
(n=3,114) 1998
% 2009
(n=2,538) 2009
% Increase
1998–2009
Increase 1998–2009
%
Pregnant
<18 51,919 11.5 93,610 10.9 94,534 9.9 924 1.0
18-34 381,076 84.6 714,773 83.3 812,837 84.8 98,064 13.7
35 and older 17,605 3.9 49,387 5.8 50,721 5.3 1,334 2.7
Total 450,600 100.0 859,381 100.0 958,092 100.0 98,711 11.5
Breastfeeding
<18 2,798 3.0 15,687 4.2 21,615 3.7 5,928 37.8
18-34 79,423 85.3 318,508 85.1 504,290 86.5 185,782 58.3
35 and older 10,921 11.7 40,307 10.8 57,081 9.8 16,774 41.6
Total 93,142 100.0 376,463 100.0 582,986 100.0 206,523 54.9
Postpartum
<18 20,803 10.9 53,929 9.5 43,415 6.8 -10,514 -19.5
18-34 60,469 84.4 481,779 84.5 538,576 84.9 56,797 11.8
35 and older 8,898 4.7 34,486 6.1 52,023 8.2 17,537 50.9
Total 190,170 100.0 573,899 100.0 634,014 100.0 60,115 10.5
Infant
0-3 months 629,696 59.8 1,744,930 88.8 1,826,312 82.6 81,382 4.7
4-5 months 83,226 7.9 53,241 2.7 88,355 4.0 35,114 66.0
6-8 months 221,170 21.0 126,803 6.5 131,502 5.9 4,699 3.7
9-11 months 118,791 11.3 46,629 2.4 92,659 4.2 46,030 98.7
12 and older^ 71,424 3.2 71,424
Total 1,075,010 100.0 1,978,410 100.4 2,210,251 100.0 231,841 11.7
Child
1 year 654,781 40.3 1,347,308 34.7 1,761,143 37.2 413,835 30.7
2 years 423,419 26.0 995,146 25.7 1,234,048 26.1 238,902 24.0
3 years 323,973 19.9 885,201 22.8 1,083,287 22.9 198,086 22.4
4 years 224,480 13.8 647,344 16.7 649,796 13.7 2,452 0.4
Total 1,631,115 100.0 3,952,924 100.0 4,728,274 100.0 775,350 19.6
^ Many states allow 30 days of leeway in the recertification process. Infants above 12 months could fall into this category; or they are possibly receiving the wrong benefits package. Benefits of children above 5 years are either about to expire or they are receiving benefits erroneously. Note: Percentages for women were based on the total base, whereas the prior NSWP report based each total on the category base. Also, total percentages for infants and children used the appropriate base and have not changed.
Source: National Survey of WIC Participants II: Participant Characteristics Report
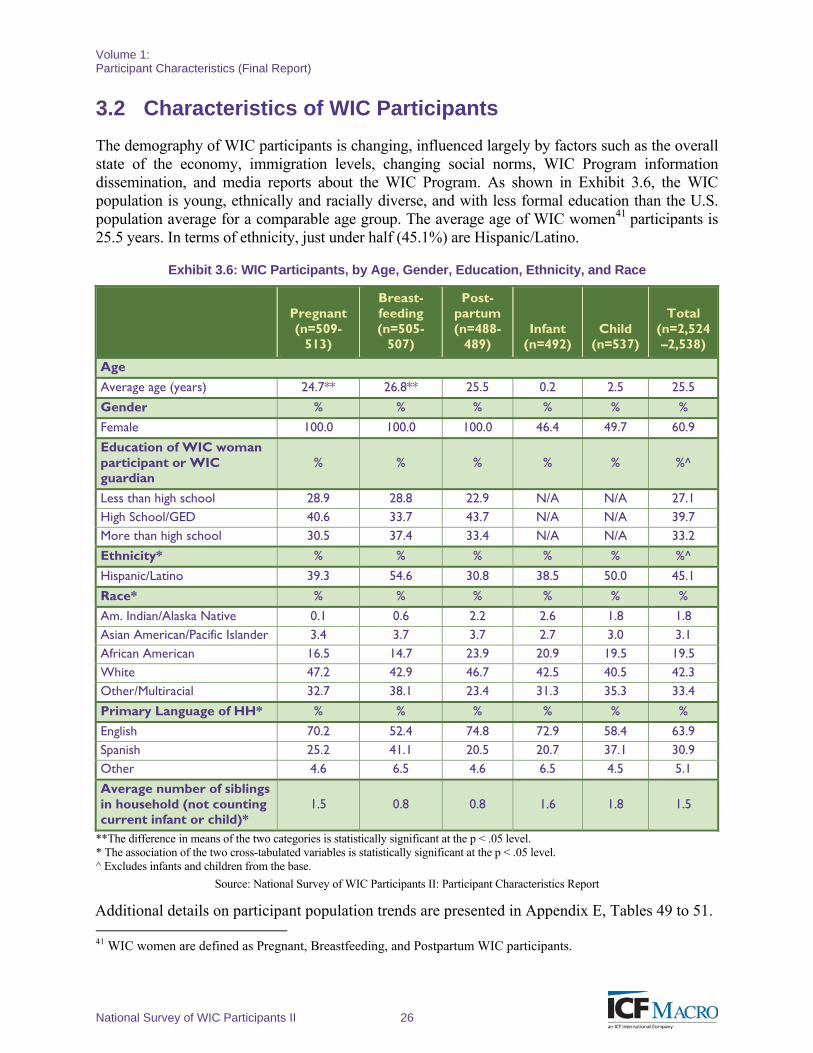
Volume 1: Participant Characteristics (Final Report)
National Survey of WIC Participants II 26
3.2 Characteristics of WIC Participants
The demography of WIC participants is changing, influenced largely by factors such as the overall state of the economy, immigration levels, changing social norms, WIC Program information dissemination, and media reports about the WIC Program. As shown in Exhibit 3.6, the WIC population is young, ethnically and racially diverse, and with less formal education than the U.S. population average for a comparable age group. The average age of WIC women41 participants is 25.5 years. In terms of ethnicity, just under half (45.1%) are Hispanic/Latino.
Exhibit 3.6: WIC Participants, by Age, Gender, Education, Ethnicity, and Race
Pregnant (n=509-
513)
Breast-feeding (n=505-
507)
Post-partum (n=488-
489) Infant
(n=492) Child
(n=537)
Total (n=2,524–2,538)
Age
Average age (years) 24.7** 26.8** 25.5 0.2 2.5 25.5
Gender % % % % % %
Female 100.0 100.0 100.0 46.4 49.7 60.9
Education of WIC woman participant or WIC guardian
% % % % % %^
Less than high school 28.9 28.8 22.9 N/A N/A 27.1 High School/GED 40.6 33.7 43.7 N/A N/A 39.7 More than high school 30.5 37.4 33.4 N/A N/A 33.2
Ethnicity* % % % % % %^
Hispanic/Latino 39.3 54.6 30.8 38.5 50.0 45.1
Race* % % % % % %
Am. Indian/Alaska Native 0.1 0.6 2.2 2.6 1.8 1.8 Asian American/Pacific Islander 3.4 3.7 3.7 2.7 3.0 3.1 African American 16.5 14.7 23.9 20.9 19.5 19.5 White 47.2 42.9 46.7 42.5 40.5 42.3 Other/Multiracial 32.7 38.1 23.4 31.3 35.3 33.4
Primary Language of HH* % % % % % %
English 70.2 52.4 74.8 72.9 58.4 63.9 Spanish 25.2 41.1 20.5 20.7 37.1 30.9 Other 4.6 6.5 4.6 6.5 4.5 5.1
Average number of siblings in household (not counting current infant or child)*
1.5 0.8 0.8 1.6 1.8 1.5
**The difference in means of the two categories is statistically significant at the p < .05 level. * The association of the two cross-tabulated variables is statistically significant at the p < .05 level. ^ Excludes infants and children from the base.
Source: National Survey of WIC Participants II: Participant Characteristics Report
41 WIC women are defined as Pregnant, Breastfeeding, and Postpartum WIC participants.
Additional details on participant population trends are presented in Appendix E, Tables 49 to 51.
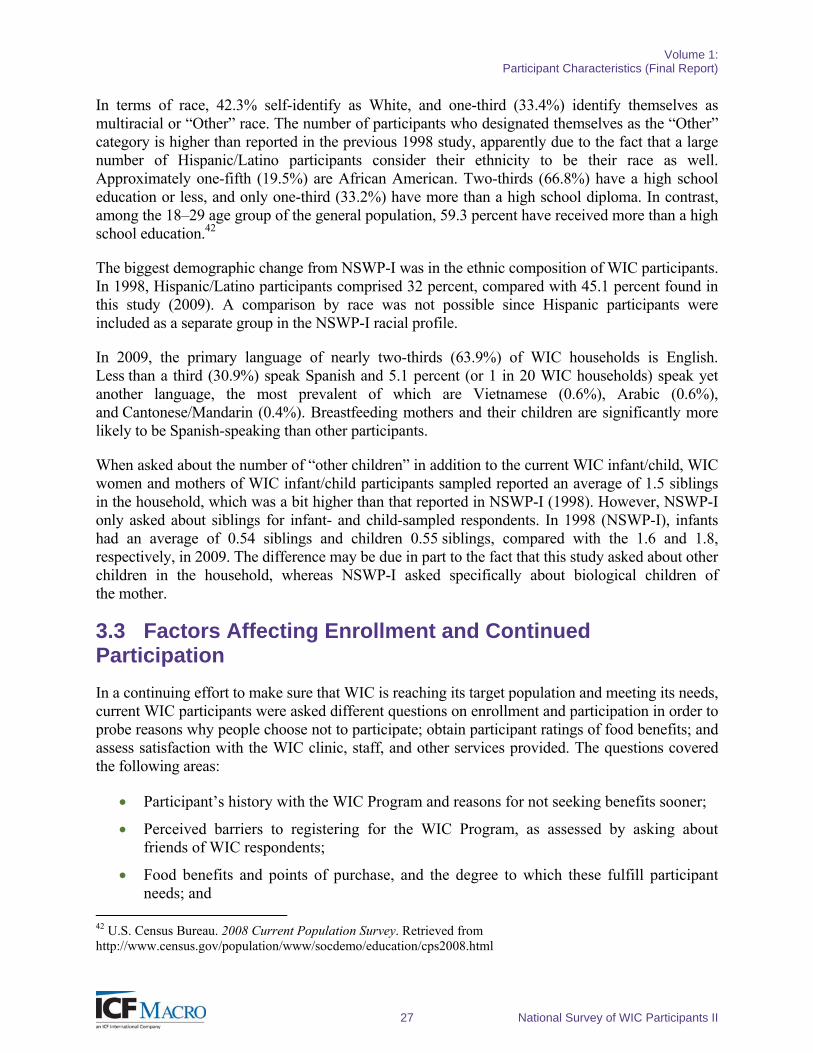
Volume 1: Participant Characteristics (Final Report)
27 National Survey of WIC Participants II
In terms of race, 42.3% self-identify as White, and one-third (33.4%) identify themselves as multiracial or “Other” race. The number of participants who designated themselves as the “Other” category is higher than reported in the previous 1998 study, apparently due to the fact that a large number of Hispanic/Latino participants consider their ethnicity to be their race as well. Approximately one-fifth (19.5%) are African American. Two-thirds (66.8%) have a high school education or less, and only one-third (33.2%) have more than a high school diploma. In contrast, among the 18–29 age group of the general population, 59.3 percent have received more than a high school education.42
The biggest demographic change from NSWP-I was in the ethnic composition of WIC participants. In 1998, Hispanic/Latino participants comprised 32 percent, compared with 45.1 percent found in this study (2009). A comparison by race was not possible since Hispanic participants were included as a separate group in the NSWP-I racial profile.
In 2009, the primary language of nearly two-thirds (63.9%) of WIC households is English. Less than a third (30.9%) speak Spanish and 5.1 percent (or 1 in 20 WIC households) speak yet another language, the most prevalent of which are Vietnamese (0.6%), Arabic (0.6%), and Cantonese/Mandarin (0.4%). Breastfeeding mothers and their children are significantly more likely to be Spanish-speaking than other participants.
When asked about the number of “other children” in addition to the current WIC infant/child, WIC women and mothers of WIC infant/child participants sampled reported an average of 1.5 siblings in the household, which was a bit higher than that reported in NSWP-I (1998). However, NSWP-I only asked about siblings for infant- and child-sampled respondents. In 1998 (NSWP-I), infants had an average of 0.54 siblings and children 0.55 siblings, compared with the 1.6 and 1.8, respectively, in 2009. The difference may be due in part to the fact that this study asked about other children in the household, whereas NSWP-I asked specifically about biological children of the mother.
3.3 Factors Affecting Enrollment and Continued Participation
In a continuing effort to make sure that WIC is reaching its target population and meeting its needs, current WIC participants were asked different questions on enrollment and participation in order to probe reasons why people choose not to participate; obtain participant ratings of food benefits; and assess satisfaction with the WIC clinic, staff, and other services provided. The questions covered the following areas:
Participant’s history with the WIC Program and reasons for not seeking benefits sooner;
Perceived barriers to registering for the WIC Program, as assessed by asking about friends of WIC respondents;
Food benefits and points of purchase, and the degree to which these fulfill participant needs; and
42 U.S. Census Bureau. 2008 Current Population Survey. Retrieved from http://www.census.gov/population/www/socdemo/education/cps2008.html
Volume 1: Participant Characteristics (Final Report)
National Survey of WIC Participants II 28
Overall satisfaction with WIC benefits as well as with the clinic location and facility, and various aspects related to service delivery.
Participants’ History with the WIC Program
Half of the participants (49.8%) were first-time users of the WIC Program. The other half had previously participated in the program once (22.0%), twice (16.6%), or more (11.5%).
As a means of examining potential barriers to participation, first-time participants were asked on an unaided basis why they had not previously participated. Over three-fourths (78.4%) reported that this was their first child/pregnancy. Since this effectively makes participation at an earlier time impossible, this group was excluded from further probing on barriers. Reasons given by the remaining 21.6 percent were analyzed for possible barriers to participation. The most common reason cited by this group was lack of awareness of the WIC Program (60.7%). As shown in Exhibit 3.7, a sizable number of respondents said they did not participate in WIC previously because they did not believe they qualified for benefits for categorical (37.3%) or income (27.4%) reasons. Just under one-third listed not residing in the United States at the time as the reason, while one-fifth cited not needing the food benefit at the time (Appendix E, Tables 1 to 3).
Participation barriers under the “Other” category included the following:
Lack of transportation,
Schedule difficulties, and
Problems qualifying for benefits.
Exhibit 3.7: Reasons Why First-Time WIC Participants* (with Other Children) Did Not Participate Previously
Reasons Given (n=221)
%
Didn’t know about WIC 60.7 Didn’t think qualified for WIC (for category reason) 37.3
Didn’t live in the USA 30.9
Didn’t think qualified for WIC (for income reason) 27.4 Didn’t need food benefit 21.0
Didn’t qualify for WIC 9.7
Don’t know 11.0 Other 13.1
*People who did not participate in WIC previously and are not pregnant with their first child (n=122).
Source: National Survey of WIC Participants II: Participant Characteristics Report
WIC breastfeeding and postpartum participants were asked whether they received WIC benefits while pregnant and a majority (83.1%) reported doing so. Those who reported not receiving benefits were asked for reasons why they did not participate while pregnant. As illustrated in Exhibit 3.8, the most cited reason was being unaware of WIC (23.4%), followed by not needing the food benefit. Other inhibiting factors were the perceived difficulties and inconvenience of applying for WIC benefits while pregnant, such as scheduling and transportation difficulties.
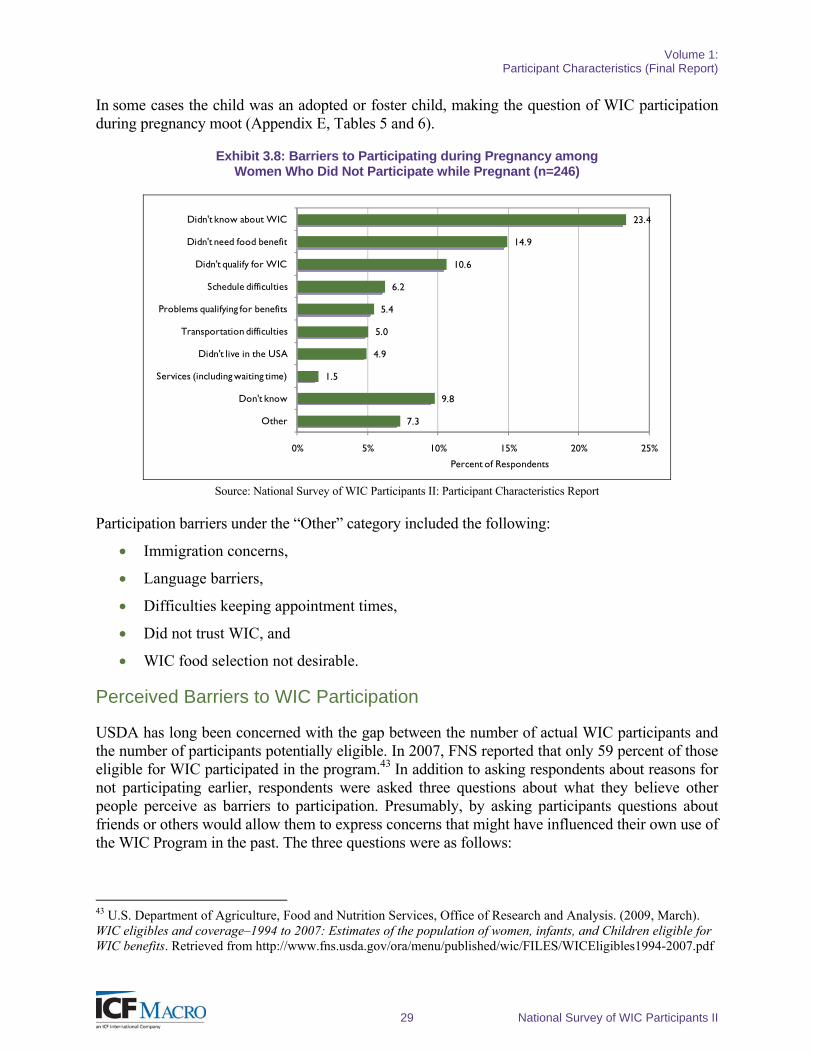
Volume 1: Participant Characteristics (Final Report)
29 National Survey of WIC Participants II
In some cases the child was an adopted or foster child, making the question of WIC participation during pregnancy moot (Appendix E, Tables 5 and 6).
Exhibit 3.8: Barriers to Participating during Pregnancy among Women Who Did Not Participate while Pregnant (n=246)
7.3
9.8
1.5
4.9
5.0
5.4
6.2
10.6
14.9
23.4
0% 5% 10% 15% 20% 25%
Other
Don't know
Services (including waiting time)
Didn't live in the USA
Transportation difficulties
Problems qualifying for benefits
Schedule difficulties
Didn't qualify for WIC
Didn't need food benefit
Didn't know about WIC
Percent of Respondents
Source: National Survey of WIC Participants II: Participant Characteristics Report
Participation barriers under the “Other” category included the following:
Immigration concerns,
Language barriers,
Difficulties keeping appointment times,
Did not trust WIC, and
WIC food selection not desirable.
Perceived Barriers to WIC Participation
USDA has long been concerned with the gap between the number of actual WIC participants and the number of participants potentially eligible. In 2007, FNS reported that only 59 percent of those eligible for WIC participated in the program.43 In addition to asking respondents about reasons for not participating earlier, respondents were asked three questions about what they believe other people perceive as barriers to participation. Presumably, by asking participants questions about friends or others would allow them to express concerns that might have influenced their own use of the WIC Program in the past. The three questions were as follows:
43 U.S. Department of Agriculture, Food and Nutrition Services, Office of Research and Analysis. (2009, March). WIC eligibles and coverage–1994 to 2007: Estimates of the population of women, infants, and Children eligible for WIC benefits. Retrieved from http://www.fns.usda.gov/ora/menu/published/wic/FILES/WICEligibles1994-2007.pdf
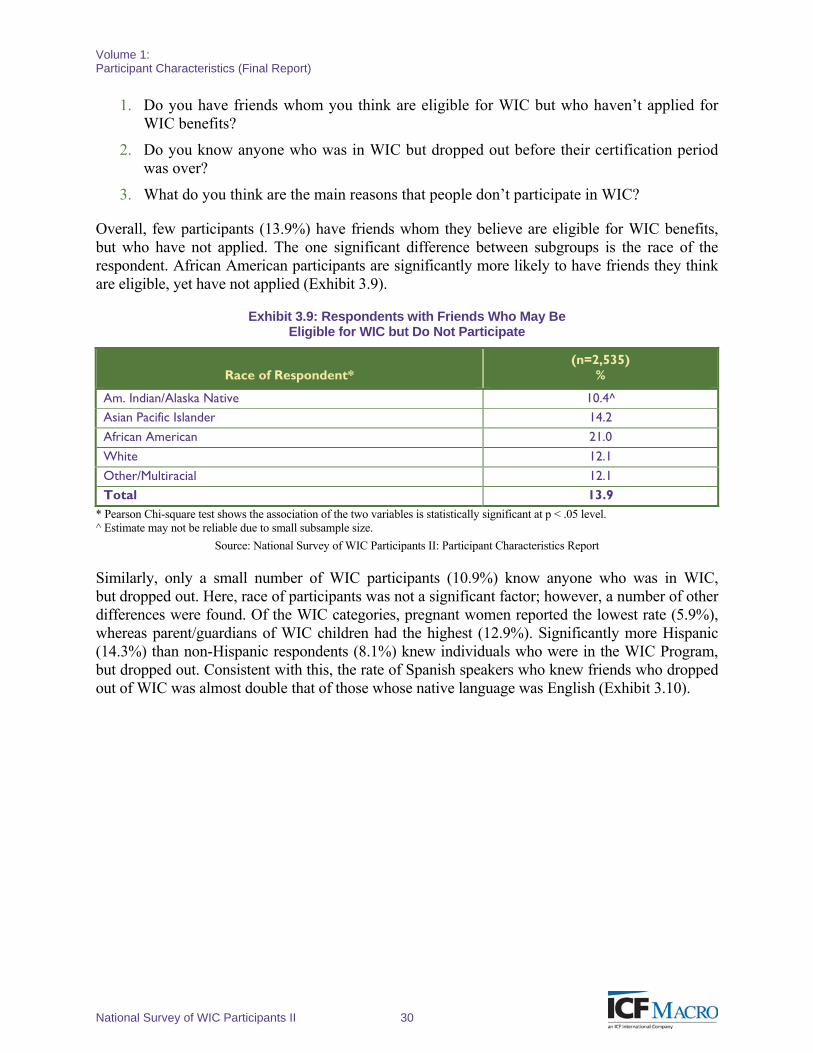
Volume 1: Participant Characteristics (Final Report)
National Survey of WIC Participants II 30
1. Do you have friends whom you think are eligible for WIC but who haven’t applied for WIC benefits?
2. Do you know anyone who was in WIC but dropped out before their certification period was over?
3. What do you think are the main reasons that people don’t participate in WIC?
Overall, few participants (13.9%) have friends whom they believe are eligible for WIC benefits, but who have not applied. The one significant difference between subgroups is the race of the respondent. African American participants are significantly more likely to have friends they think are eligible, yet have not applied (Exhibit 3.9).
Exhibit 3.9: Respondents with Friends Who May Be Eligible for WIC but Do Not Participate
Race of Respondent* (n=2,535)
%
Am. Indian/Alaska Native 10.4^ Asian Pacific Islander 14.2
African American 21.0
White 12.1
Other/Multiracial 12.1 Total 13.9
* Pearson Chi-square test shows the association of the two variables is statistically significant at p < .05 level. ^ Estimate may not be reliable due to small subsample size.
Source: National Survey of WIC Participants II: Participant Characteristics Report
Similarly, only a small number of WIC participants (10.9%) know anyone who was in WIC, but dropped out. Here, race of participants was not a significant factor; however, a number of other differences were found. Of the WIC categories, pregnant women reported the lowest rate (5.9%), whereas parent/guardians of WIC children had the highest (12.9%). Significantly more Hispanic (14.3%) than non-Hispanic respondents (8.1%) knew individuals who were in the WIC Program, but dropped out. Consistent with this, the rate of Spanish speakers who knew friends who dropped out of WIC was almost double that of those whose native language was English (Exhibit 3.10).
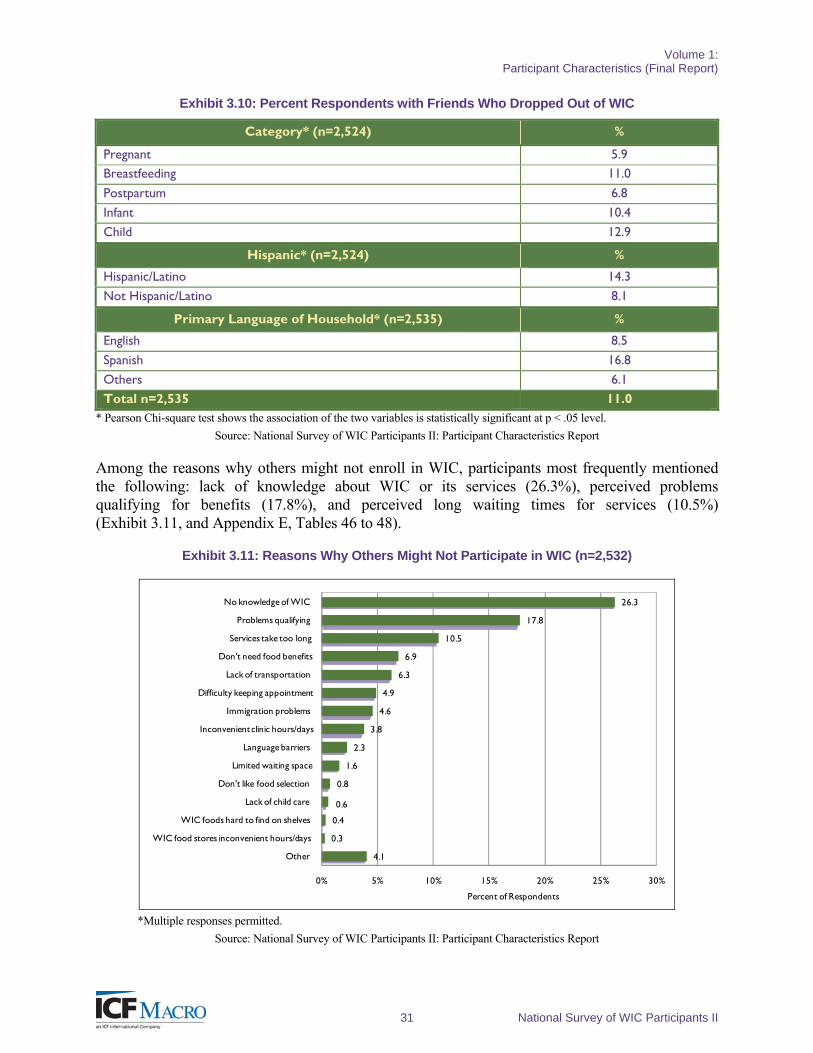
Volume 1: Participant Characteristics (Final Report)
31 National Survey of WIC Participants II
Exhibit 3.10: Percent Respondents with Friends Who Dropped Out of WIC
Category* (n=2,524) %
Pregnant 5.9 Breastfeeding 11.0
Postpartum 6.8
Infant 10.4
Child 12.9
Hispanic* (n=2,524) %
Hispanic/Latino 14.3
Not Hispanic/Latino 8.1
Primary Language of Household* (n=2,535) %
English 8.5
Spanish 16.8
Others 6.1
Total n=2,535 11.0 * Pearson Chi-square test shows the association of the two variables is statistically significant at p < .05 level.
Source: National Survey of WIC Participants II: Participant Characteristics Report
Among the reasons why others might not enroll in WIC, participants most frequently mentioned the following: lack of knowledge about WIC or its services (26.3%), perceived problems qualifying for benefits (17.8%), and perceived long waiting times for services (10.5%) (Exhibit 3.11, and Appendix E, Tables 46 to 48).
Exhibit 3.11: Reasons Why Others Might Not Participate in WIC (n=2,532)
4.1
0.3
0.4
0.6
0.8
1.6
2.3
3.8
4.6
4.9
6.3
6.9
10.5
17.8
26.3
0% 5% 10% 15% 20% 25% 30%
Other
WIC food stores inconvenient hours/days
WIC foods hard to find on shelves
Lack of child care
Don't like food selection
Limited waiting space
Language barriers
Inconvenient clinic hours/days
Immigration problems
Difficulty keeping appointment
Lack of transportation
Don't need food benefits
Services take too long
Problems qualifying
No knowledge of WIC
Percent of Respondents
*Multiple responses permitted.
Source: National Survey of WIC Participants II: Participant Characteristics Report
Volume 1: Participant Characteristics (Final Report)
National Survey of WIC Participants II 32
Participants’ beliefs about why others might not enroll in WIC are fairly uniform across different demographic groups with three exceptions. Compared with non-Hispanic and non-Latino participants, Hispanic/Latino participants are—
More likely to mention immigration concerns (9.9% versus 0.5%);
More likely to cite language barriers as an issue (4.2% versus 0.5%); and
Less likely to identify WIC services as taking too long (8.5% versus 12.0%).
Satisfaction with and Purchase of Prescribed Foods
Along with nutrition counseling and referrals to other health and social services, WIC food benefits play an important role in the overall WIC mission. Not only do they serve to attract targeted populations but they also supply healthy foods—rich in protein, iron, calcium, fiber, and vitamins among other things—to participants, all of whom are deemed to be at nutritional risk.
WIC participants were asked a series of questions about satisfaction with food benefits, redemption of selected food items, the types of stores where they buy WIC foods, and reasons for selecting the store. The results are discussed in the following three component areas:
Food items offered,
Quantities of food, and
Shopping experience where WIC items are purchased.
Subsequent to the design and final approval of the NSWP-II study instruments, there was a major overhaul of WIC food packages, the implementation of which occurred in the midst of field data collection. As such, the questions in the survey instruments for this study centered on the specific foods offered in the old food packages. Also, regarding foods offered under both old and new packages but whose quantities changed (e.g., juice), it may not always be clear which package the participant was evaluating, although researchers believe participants were largely rating quantities in the old packages because the new packages had been so recently implemented. In any case, these limitations must be considered when reviewing the data presented in this section. (The complete data related to the food packages are in Appendix E, Tables 9 and 13).
Food Items Offered
Participants were asked to rate the food vouchers (benefits) they receive on a scale of “excellent,” “very good,” “good,” “fair,” or “poor” in terms of offering foods that they like to eat. Nearly 90 percent (89.6%) responded that the food benefits were excellent, very good, or good (Exhibit 3.12). Of those, half (44.9%) rated them excellent, while roughly similar percentages rated them very good or fair (24.0% and 20.7%, respectively).
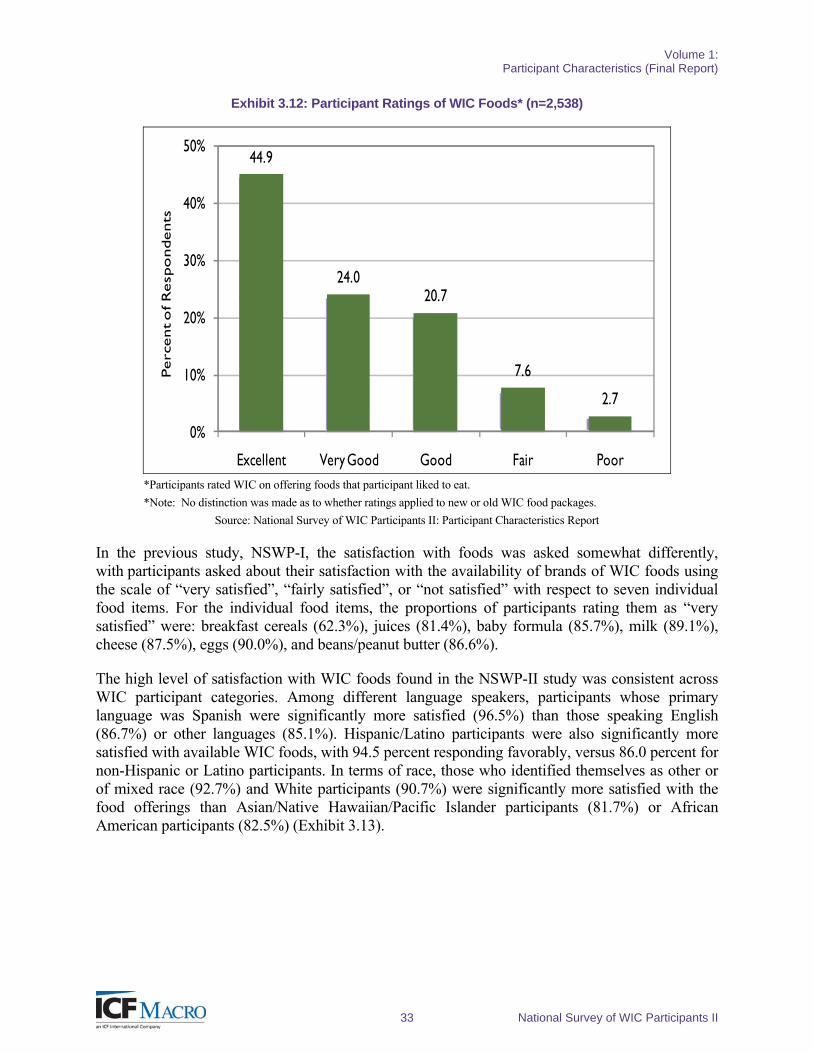
Volume 1: Participant Characteristics (Final Report)
33 National Survey of WIC Participants II
Exhibit 3.12: Participant Ratings of WIC Foods* (n=2,538)
44.9
24.020.7
7.6
2.7
0%
10%
20%
30%
40%
50%
Excellent Very Good Good Fair Poor
Perc
ent o
f R
esp
ondents
*Participants rated WIC on offering foods that participant liked to eat.
*Note: No distinction was made as to whether ratings applied to new or old WIC food packages.
Source: National Survey of WIC Participants II: Participant Characteristics Report
In the previous study, NSWP-I, the satisfaction with foods was asked somewhat differently, with participants asked about their satisfaction with the availability of brands of WIC foods using the scale of “very satisfied”, “fairly satisfied”, or “not satisfied” with respect to seven individual food items. For the individual food items, the proportions of participants rating them as “very satisfied” were: breakfast cereals (62.3%), juices (81.4%), baby formula (85.7%), milk (89.1%), cheese (87.5%), eggs (90.0%), and beans/peanut butter (86.6%).
The high level of satisfaction with WIC foods found in the NSWP-II study was consistent across WIC participant categories. Among different language speakers, participants whose primary language was Spanish were significantly more satisfied (96.5%) than those speaking English (86.7%) or other languages (85.1%). Hispanic/Latino participants were also significantly more satisfied with available WIC foods, with 94.5 percent responding favorably, versus 86.0 percent for non-Hispanic or Latino participants. In terms of race, those who identified themselves as other or of mixed race (92.7%) and White participants (90.7%) were significantly more satisfied with the food offerings than Asian/Native Hawaiian/Pacific Islander participants (81.7%) or African American participants (82.5%) (Exhibit 3.13).
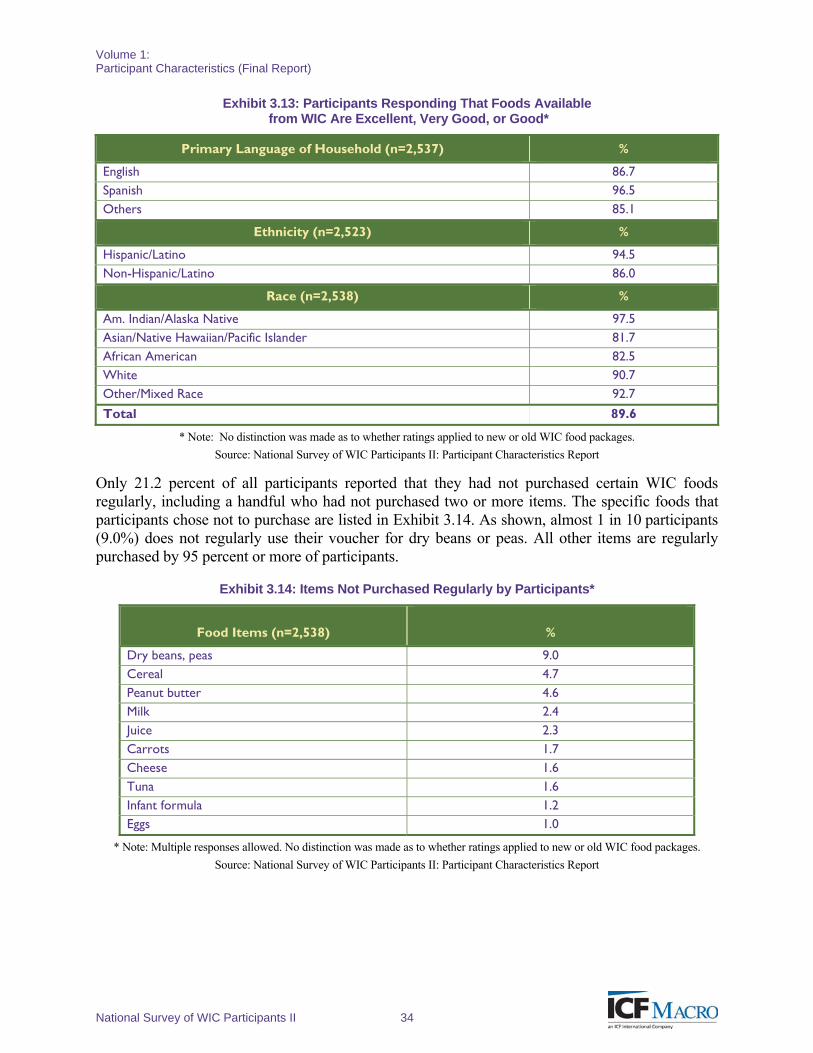
Volume 1: Participant Characteristics (Final Report)
National Survey of WIC Participants II 34
Exhibit 3.13: Participants Responding That Foods Available from WIC Are Excellent, Very Good, or Good*
Primary Language of Household (n=2,537) %
English 86.7 Spanish 96.5 Others 85.1
Ethnicity (n=2,523) %
Hispanic/Latino 94.5 Non-Hispanic/Latino 86.0
Race (n=2,538) %
Am. Indian/Alaska Native 97.5 Asian/Native Hawaiian/Pacific Islander 81.7 African American 82.5 White 90.7 Other/Mixed Race 92.7
Total 89.6
* Note: No distinction was made as to whether ratings applied to new or old WIC food packages.
Source: National Survey of WIC Participants II: Participant Characteristics Report
Only 21.2 percent of all participants reported that they had not purchased certain WIC foods regularly, including a handful who had not purchased two or more items. The specific foods that participants chose not to purchase are listed in Exhibit 3.14. As shown, almost 1 in 10 participants (9.0%) does not regularly use their voucher for dry beans or peas. All other items are regularly purchased by 95 percent or more of participants.
Exhibit 3.14: Items Not Purchased Regularly by Participants*
Food Items (n=2,538)
%
Dry beans, peas 9.0 Cereal 4.7 Peanut butter 4.6 Milk 2.4 Juice 2.3 Carrots 1.7 Cheese 1.6 Tuna 1.6 Infant formula 1.2 Eggs 1.0
* Note: Multiple responses allowed. No distinction was made as to whether ratings applied to new or old WIC food packages.
Source: National Survey of WIC Participants II: Participant Characteristics Report
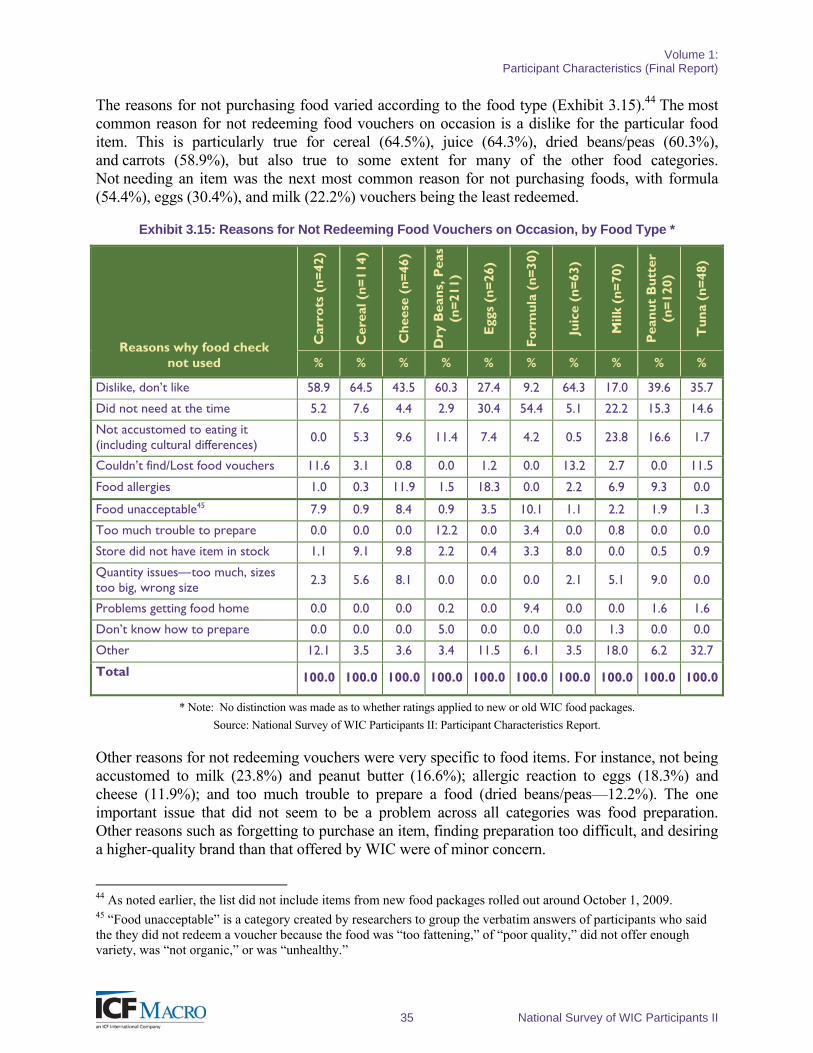
Volume 1: Participant Characteristics (Final Report)
35 National Survey of WIC Participants II
The reasons for not purchasing food varied according to the food type (Exhibit 3.15).44 The most common reason for not redeeming food vouchers on occasion is a dislike for the particular food item. This is particularly true for cereal (64.5%), juice (64.3%), dried beans/peas (60.3%), and carrots (58.9%), but also true to some extent for many of the other food categories. Not needing an item was the next most common reason for not purchasing foods, with formula (54.4%), eggs (30.4%), and milk (22.2%) vouchers being the least redeemed.
Exhibit 3.15: Reasons for Not Redeeming Food Vouchers on Occasion, by Food Type *
Reasons why food check not used
Car
rots
(n
=42
)
Cer
eal (
n=
114)
Ch
eese
(n
=46
)
Dry
Bea
ns,
Pea
s (n
=21
1)
Egg
s (n
=26
)
Fo
rmu
la (
n=
30)
Juic
e (n
=63
)
Milk
(n
=70
)
Pea
nu
t B
utt
er
(n=
120)
Tu
na
(n=
48)
% % % % % % % % % %
Dislike, don’t like 58.9 64.5 43.5 60.3 27.4 9.2 64.3 17.0 39.6 35.7
Did not need at the time 5.2 7.6 4.4 2.9 30.4 54.4 5.1 22.2 15.3 14.6
Not accustomed to eating it (including cultural differences) 0.0 5.3 9.6 11.4 7.4 4.2 0.5 23.8 16.6 1.7
Couldn’t find/Lost food vouchers 11.6 3.1 0.8 0.0 1.2 0.0 13.2 2.7 0.0 11.5
Food allergies 1.0 0.3 11.9 1.5 18.3 0.0 2.2 6.9 9.3 0.0
Food unacceptable45 7.9 0.9 8.4 0.9 3.5 10.1 1.1 2.2 1.9 1.3
Too much trouble to prepare 0.0 0.0 0.0 12.2 0.0 3.4 0.0 0.8 0.0 0.0
Store did not have item in stock 1.1 9.1 9.8 2.2 0.4 3.3 8.0 0.0 0.5 0.9
Quantity issues—too much, sizes too big, wrong size 2.3 5.6 8.1 0.0 0.0 0.0 2.1 5.1 9.0 0.0
Problems getting food home 0.0 0.0 0.0 0.2 0.0 9.4 0.0 0.0 1.6 1.6
Don’t know how to prepare 0.0 0.0 0.0 5.0 0.0 0.0 0.0 1.3 0.0 0.0
Other 12.1 3.5 3.6 3.4 11.5 6.1 3.5 18.0 6.2 32.7
Total 100.0 100.0 100.0 100.0 100.0 100.0 100.0 100.0 100.0 100.0
* Note: No distinction was made as to whether ratings applied to new or old WIC food packages.
Source: National Survey of WIC Participants II: Participant Characteristics Report.
Other reasons for not redeeming vouchers were very specific to food items. For instance, not being accustomed to milk (23.8%) and peanut butter (16.6%); allergic reaction to eggs (18.3%) and cheese (11.9%); and too much trouble to prepare a food (dried beans/peas—12.2%). The one important issue that did not seem to be a problem across all categories was food preparation. Other reasons such as forgetting to purchase an item, finding preparation too difficult, and desiring a higher-quality brand than that offered by WIC were of minor concern.
44 As noted earlier, the list did not include items from new food packages rolled out around October 1, 2009. 45 “Food unacceptable” is a category created by researchers to group the verbatim answers of participants who said the they did not redeem a voucher because the food was “too fattening,” of “poor quality,” did not offer enough variety, was “not organic,” or was “unhealthy.”
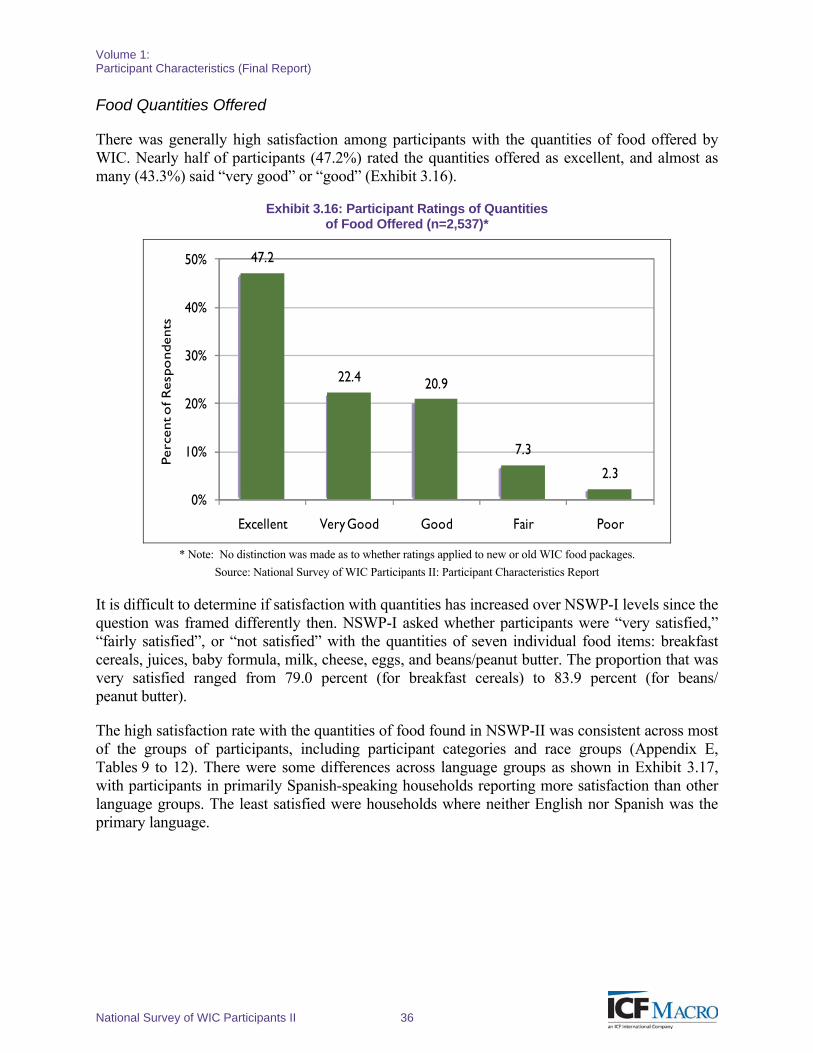
Volume 1: Participant Characteristics (Final Report)
National Survey of WIC Participants II 36
Food Quantities Offered
There was generally high satisfaction among participants with the quantities of food offered by WIC. Nearly half of participants (47.2%) rated the quantities offered as excellent, and almost as many (43.3%) said “very good” or “good” (Exhibit 3.16).
Exhibit 3.16: Participant Ratings of Quantities of Food Offered (n=2,537)*
47.2
22.4 20.9
7.3
2.3
0%
10%
20%
30%
40%
50%
Excellent Very Good Good Fair Poor
Perc
ent o
f Res
pond
ents
* Note: No distinction was made as to whether ratings applied to new or old WIC food packages.
Source: National Survey of WIC Participants II: Participant Characteristics Report
It is difficult to determine if satisfaction with quantities has increased over NSWP-I levels since the question was framed differently then. NSWP-I asked whether participants were “very satisfied,” “fairly satisfied”, or “not satisfied” with the quantities of seven individual food items: breakfast cereals, juices, baby formula, milk, cheese, eggs, and beans/peanut butter. The proportion that was very satisfied ranged from 79.0 percent (for breakfast cereals) to 83.9 percent (for beans/ peanut butter).
The high satisfaction rate with the quantities of food found in NSWP-II was consistent across most of the groups of participants, including participant categories and race groups (Appendix E, Tables 9 to 12). There were some differences across language groups as shown in Exhibit 3.17, with participants in primarily Spanish-speaking households reporting more satisfaction than other language groups. The least satisfied were households where neither English nor Spanish was the primary language.
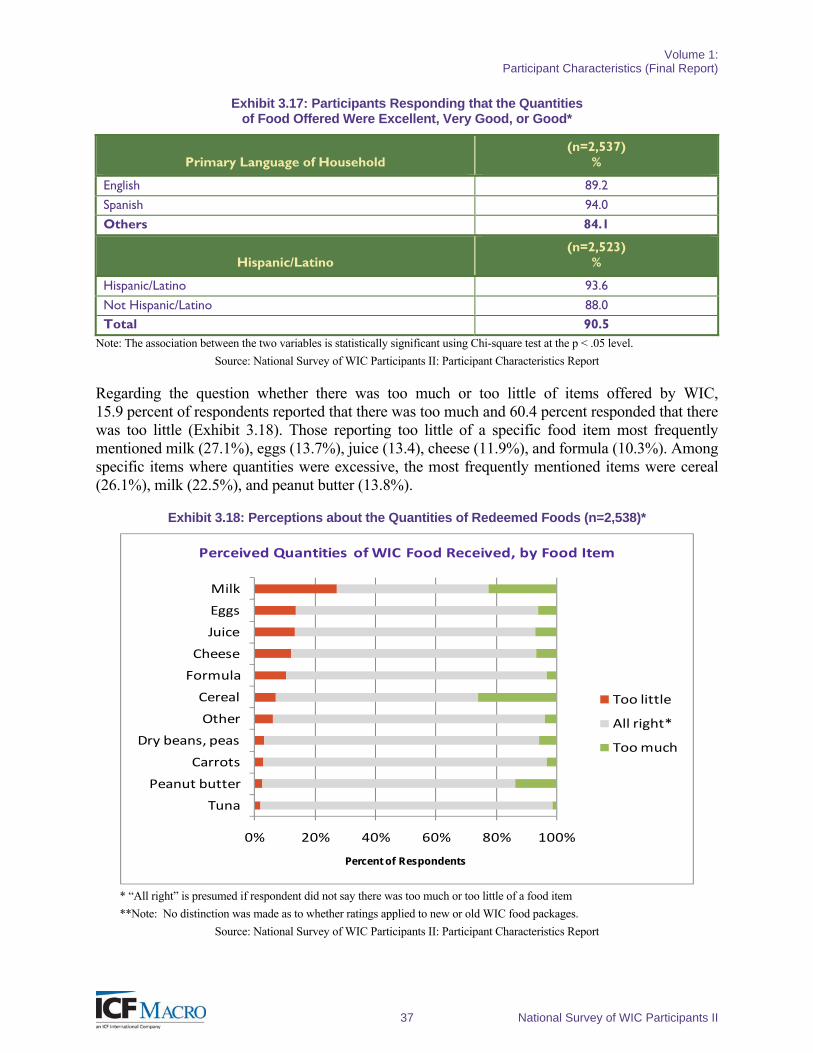
Volume 1: Participant Characteristics (Final Report)
37 National Survey of WIC Participants II
Exhibit 3.17: Participants Responding that the Quantities of Food Offered Were Excellent, Very Good, or Good*
Primary Language of Household (n=2,537)
%
English 89.2
Spanish 94.0
Others 84.1
Hispanic/Latino (n=2,523)
%
Hispanic/Latino 93.6
Not Hispanic/Latino 88.0 Total 90.5
Note: The association between the two variables is statistically significant using Chi-square test at the p < .05 level.
Source: National Survey of WIC Participants II: Participant Characteristics Report
Regarding the question whether there was too much or too little of items offered by WIC, 15.9 percent of respondents reported that there was too much and 60.4 percent responded that there was too little (Exhibit 3.18). Those reporting too little of a specific food item most frequently mentioned milk (27.1%), eggs (13.7%), juice (13.4), cheese (11.9%), and formula (10.3%). Among specific items where quantities were excessive, the most frequently mentioned items were cereal (26.1%), milk (22.5%), and peanut butter (13.8%).
Exhibit 3.18: Perceptions about the Quantities of Redeemed Foods (n=2,538)*
0% 20% 40% 60% 80% 100%
Tuna
Peanut butter
Carrots
Dry beans, peas
Other
Cereal
Formula
Cheese
Juice
Eggs
Milk
Percent of Respondents
Perceived Quantities of WIC Food Received, by Food Item
Too little
All right*
Too much
* “All right” is presumed if respondent did not say there was too much or too little of a food item
**Note: No distinction was made as to whether ratings applied to new or old WIC food packages.
Source: National Survey of WIC Participants II: Participant Characteristics Report
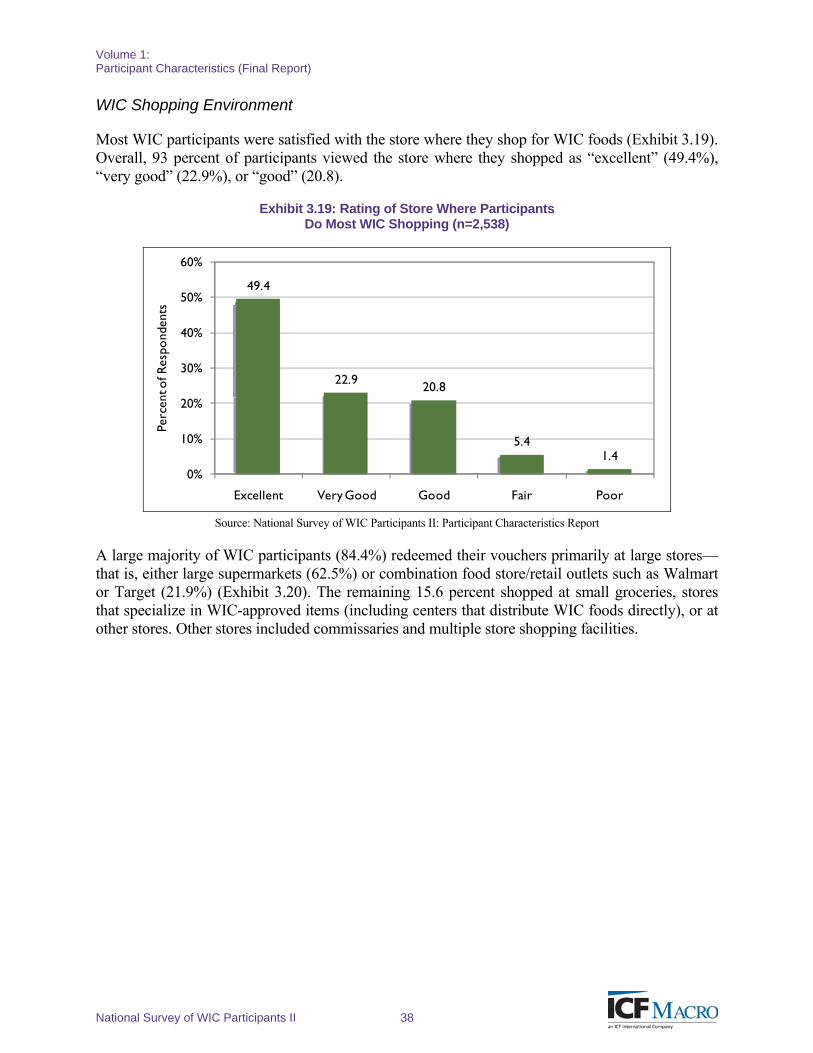
Volume 1: Participant Characteristics (Final Report)
National Survey of WIC Participants II 38
WIC Shopping Environment
Most WIC participants were satisfied with the store where they shop for WIC foods (Exhibit 3.19). Overall, 93 percent of participants viewed the store where they shopped as “excellent” (49.4%), “very good” (22.9%), or “good” (20.8).
Exhibit 3.19: Rating of Store Where Participants Do Most WIC Shopping (n=2,538)
49.4
22.9 20.8
5.41.4
0%
10%
20%
30%
40%
50%
60%
Excellent Very Good Good Fair Poor
Perc
ent o
f Res
pond
ents
Source: National Survey of WIC Participants II: Participant Characteristics Report
A large majority of WIC participants (84.4%) redeemed their vouchers primarily at large stores—that is, either large supermarkets (62.5%) or combination food store/retail outlets such as Walmart or Target (21.9%) (Exhibit 3.20). The remaining 15.6 percent shopped at small groceries, stores that specialize in WIC-approved items (including centers that distribute WIC foods directly), or at other stores. Other stores included commissaries and multiple store shopping facilities.
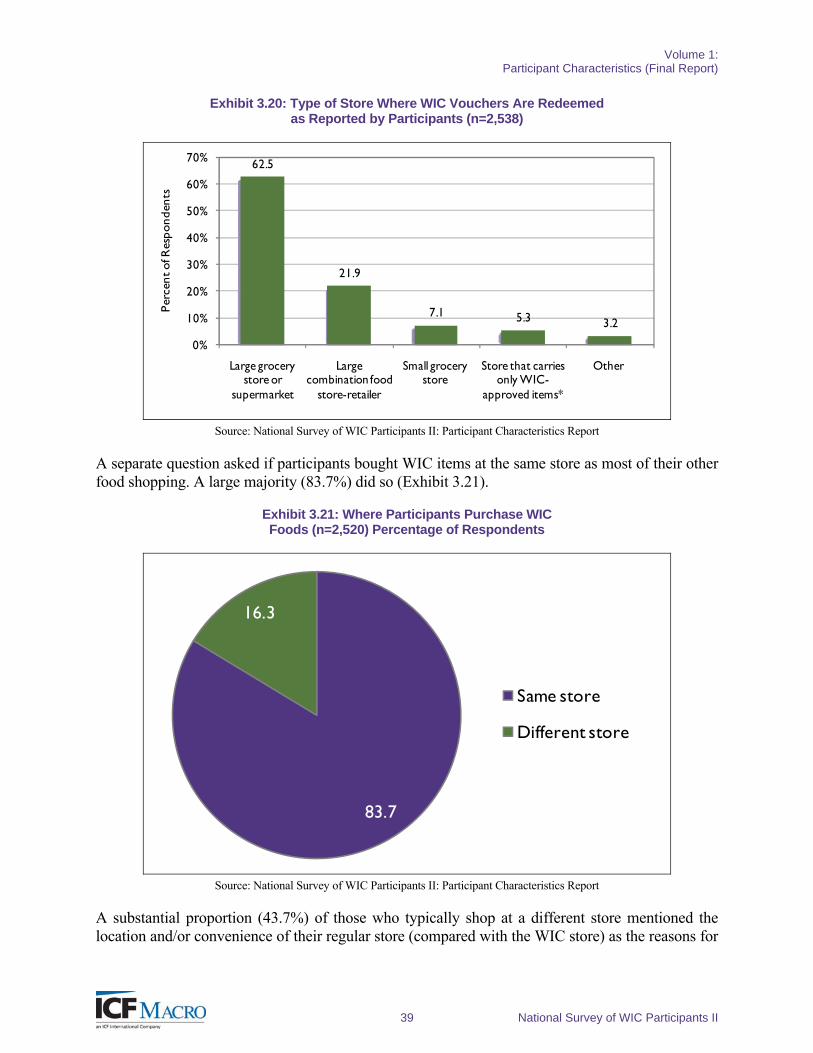
Volume 1: Participant Characteristics (Final Report)
39 National Survey of WIC Participants II
Exhibit 3.20: Type of Store Where WIC Vouchers Are Redeemed as Reported by Participants (n=2,538)
62.5
21.9
7.1 5.3 3.2
0%
10%
20%
30%
40%
50%
60%
70%
Large grocery store or
supermarket
Large combination food
store-retailer
Small grocery store
Store that carries only WIC-
approved items*
Other
Perc
ent o
f Res
pond
ents
Source: National Survey of WIC Participants II: Participant Characteristics Report
A separate question asked if participants bought WIC items at the same store as most of their other food shopping. A large majority (83.7%) did so (Exhibit 3.21).
Exhibit 3.21: Where Participants Purchase WIC Foods (n=2,520) Percentage of Respondents
83.7
16.3
Same store
Different store
Source: National Survey of WIC Participants II: Participant Characteristics Report
A substantial proportion (43.7%) of those who typically shop at a different store mentioned the location and/or convenience of their regular store (compared with the WIC store) as the reasons for
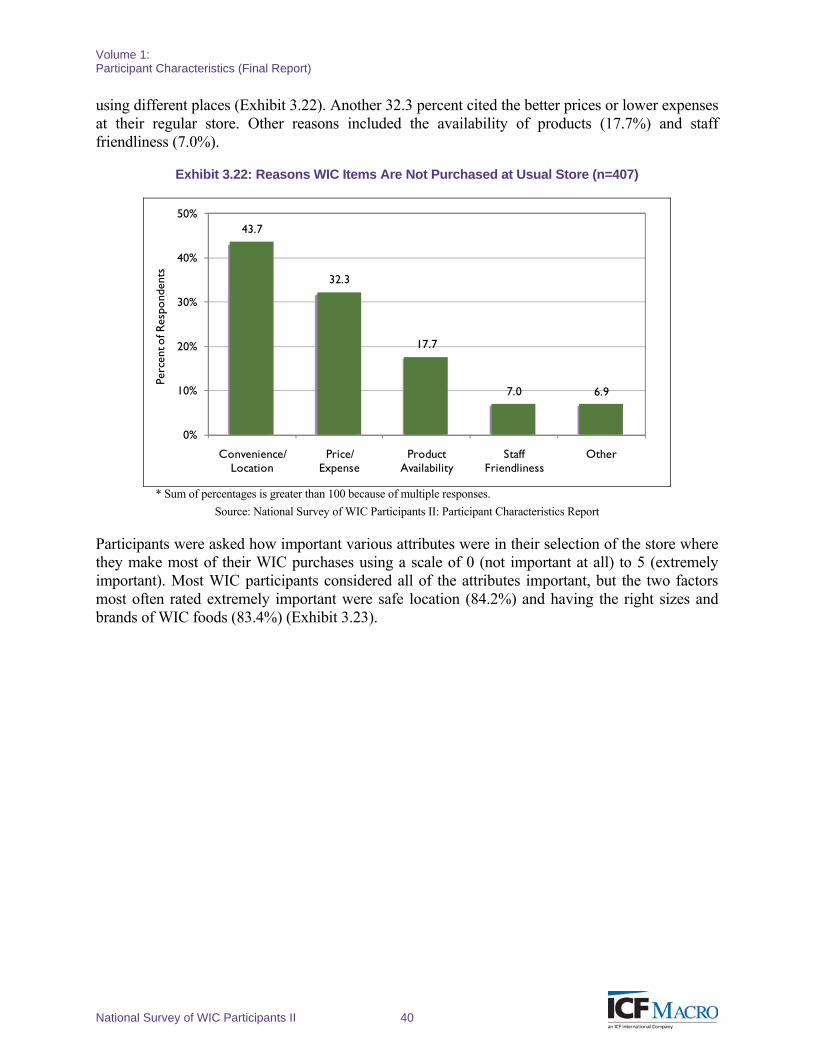
Volume 1: Participant Characteristics (Final Report)
National Survey of WIC Participants II 40
using different places (Exhibit 3.22). Another 32.3 percent cited the better prices or lower expenses at their regular store. Other reasons included the availability of products (17.7%) and staff friendliness (7.0%).
Exhibit 3.22: Reasons WIC Items Are Not Purchased at Usual Store (n=407)
43.7
32.3
17.7
7.0 6.9
0%
10%
20%
30%
40%
50%
Convenience/Location
Price/Expense
ProductAvailability
StaffFriendliness
Other
Perc
ent o
f Res
pond
ents
* Sum of percentages is greater than 100 because of multiple responses.
Source: National Survey of WIC Participants II: Participant Characteristics Report
Participants were asked how important various attributes were in their selection of the store where they make most of their WIC purchases using a scale of 0 (not important at all) to 5 (extremely important). Most WIC participants considered all of the attributes important, but the two factors most often rated extremely important were safe location (84.2%) and having the right sizes and brands of WIC foods (83.4%) (Exhibit 3.23).
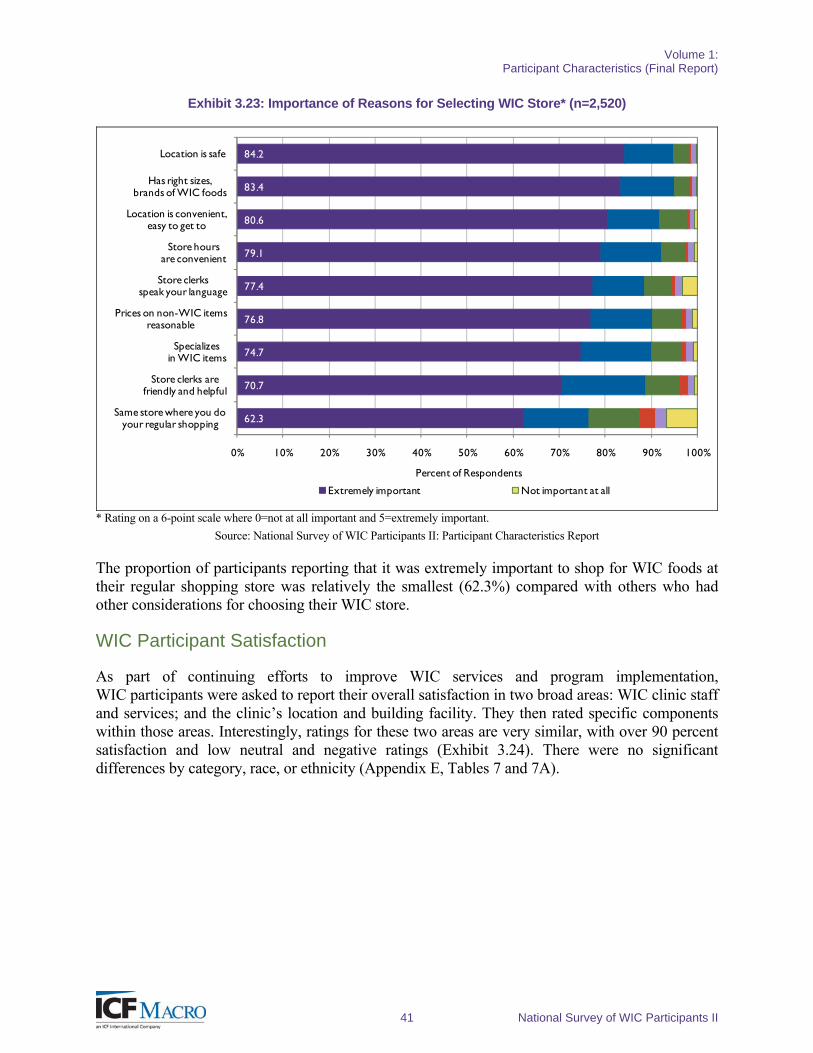
Volume 1: Participant Characteristics (Final Report)
41 National Survey of WIC Participants II
Exhibit 3.23: Importance of Reasons for Selecting WIC Store* (n=2,520)
62.3
70.7
74.7
76.8
77.4
79.1
80.6
83.4
84.2
0% 10% 20% 30% 40% 50% 60% 70% 80% 90% 100%
Same store where you doyour regular shopping
Store clerks arefriendly and helpful
Specializesin WIC items
Prices on non-WIC itemsreasonable
Store clerksspeak your language
Store hoursare convenient
Location is convenient,easy to get to
Has right sizes,brands of WIC foods
Location is safe
Percent of Respondents
Extremely important Not important at all
* Rating on a 6-point scale where 0=not at all important and 5=extremely important.
Source: National Survey of WIC Participants II: Participant Characteristics Report
The proportion of participants reporting that it was extremely important to shop for WIC foods at their regular shopping store was relatively the smallest (62.3%) compared with others who had other considerations for choosing their WIC store.
WIC Participant Satisfaction
As part of continuing efforts to improve WIC services and program implementation, WIC participants were asked to report their overall satisfaction in two broad areas: WIC clinic staff and services; and the clinic’s location and building facility. They then rated specific components within those areas. Interestingly, ratings for these two areas are very similar, with over 90 percent satisfaction and low neutral and negative ratings (Exhibit 3.24). There were no significant differences by category, race, or ethnicity (Appendix E, Tables 7 and 7A).
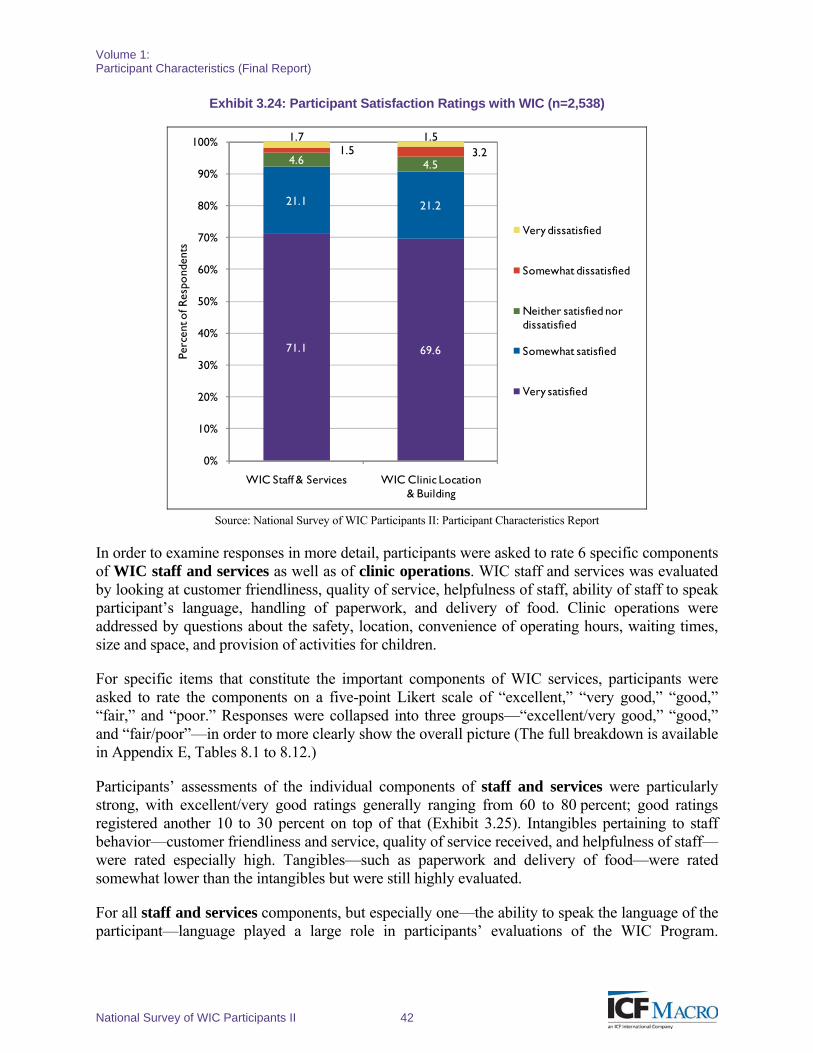
Volume 1: Participant Characteristics (Final Report)
National Survey of WIC Participants II 42
Exhibit 3.24: Participant Satisfaction Ratings with WIC (n=2,538)
71.1 69.6
21.1 21.2
4.6 4.51.5 3.2
1.7 1.5
0%
10%
20%
30%
40%
50%
60%
70%
80%
90%
100%
WIC Staff & Services WIC Clinic Location& Building
Perc
ent o
f Res
pond
ents
Very dissatisfied
Somewhat dissatisfied
Neither satisfied nor dissatisfied
Somewhat satisfied
Very satisfied
Source: National Survey of WIC Participants II: Participant Characteristics Report
In order to examine responses in more detail, participants were asked to rate 6 specific components of WIC staff and services as well as of clinic operations. WIC staff and services was evaluated by looking at customer friendliness, quality of service, helpfulness of staff, ability of staff to speak participant’s language, handling of paperwork, and delivery of food. Clinic operations were addressed by questions about the safety, location, convenience of operating hours, waiting times, size and space, and provision of activities for children.
For specific items that constitute the important components of WIC services, participants were asked to rate the components on a five-point Likert scale of “excellent,” “very good,” “good,” “fair,” and “poor.” Responses were collapsed into three groups—“excellent/very good,” “good,” and “fair/poor”—in order to more clearly show the overall picture (The full breakdown is available in Appendix E, Tables 8.1 to 8.12.)
Participants’ assessments of the individual components of staff and services were particularly strong, with excellent/very good ratings generally ranging from 60 to 80 percent; good ratings registered another 10 to 30 percent on top of that (Exhibit 3.25). Intangibles pertaining to staff behavior—customer friendliness and service, quality of service received, and helpfulness of staff—were rated especially high. Tangibles—such as paperwork and delivery of food—were rated somewhat lower than the intangibles but were still highly evaluated.
For all staff and services components, but especially one—the ability to speak the language of the participant—language played a large role in participants’ evaluations of the WIC Program.
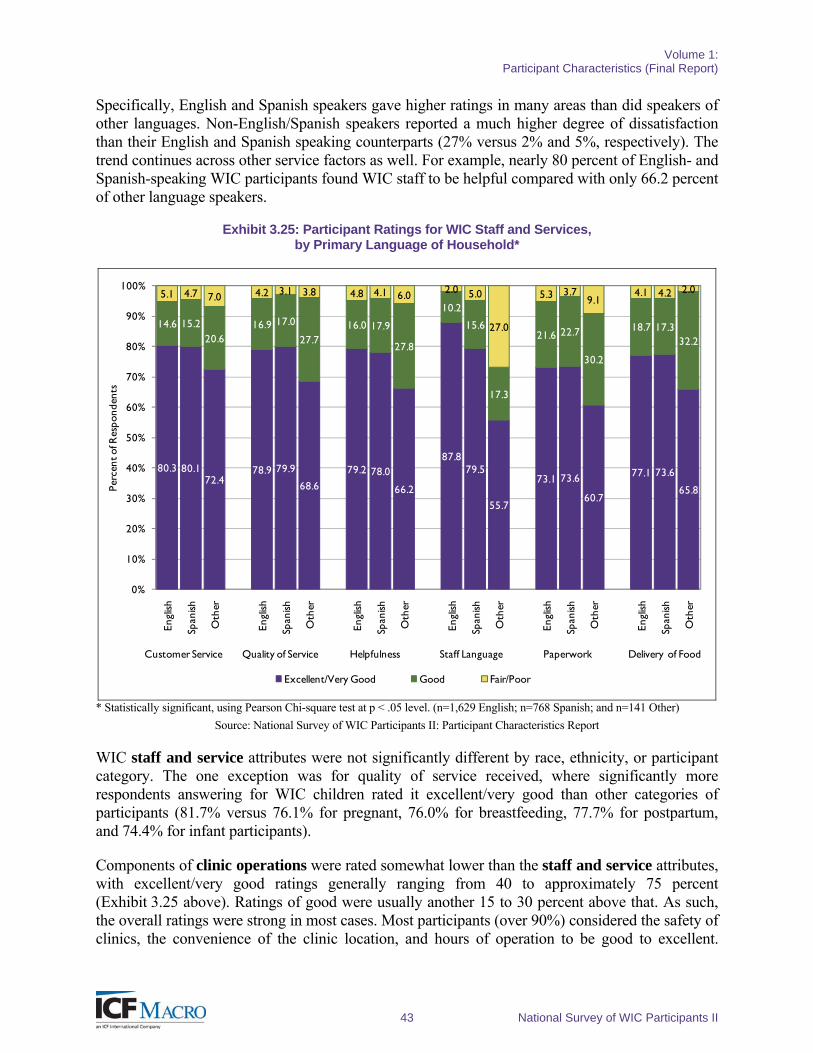
Volume 1: Participant Characteristics (Final Report)
43 National Survey of WIC Participants II
Specifically, English and Spanish speakers gave higher ratings in many areas than did speakers of other languages. Non-English/Spanish speakers reported a much higher degree of dissatisfaction than their English and Spanish speaking counterparts (27% versus 2% and 5%, respectively). The trend continues across other service factors as well. For example, nearly 80 percent of English- and Spanish-speaking WIC participants found WIC staff to be helpful compared with only 66.2 percent of other language speakers.
Exhibit 3.25: Participant Ratings for WIC Staff and Services, by Primary Language of Household*
80.3 80.172.4
78.9 79.9
68.6
79.2 78.0
66.2
87.879.5
55.7
73.1 73.6
60.7
77.1 73.6
65.8
14.6 15.220.6
16.9 17.0
27.716.0 17.9
27.8
10.2
15.6
17.3
21.6 22.7
30.2
18.7 17.332.2
5.1 4.7 7.0 4.2 3.1 3.8 4.8 4.1 6.0 2.0 5.0
27.0
5.3 3.79.1
4.1 4.2 2.0
0%
10%
20%
30%
40%
50%
60%
70%
80%
90%
100%
Engl
ish
Span
ish
Oth
er
Engl
ish
Span
ish
Oth
er
Engl
ish
Span
ish
Oth
er
Engl
ish
Span
ish
Oth
er
Engl
ish
Span
ish
Oth
er
Engl
ish
Span
ish
Oth
er
Perc
ent o
f Res
pond
ents
Excellent/Very Good Good Fair/Poor
Customer Service Quality of Service Helpfulness Staff Language Paperwork Delivery of Food
* Statistically significant, using Pearson Chi-square test at p < .05 level. (n=1,629 English; n=768 Spanish; and n=141 Other)
Source: National Survey of WIC Participants II: Participant Characteristics Report
WIC staff and service attributes were not significantly different by race, ethnicity, or participant category. The one exception was for quality of service received, where significantly more respondents answering for WIC children rated it excellent/very good than other categories of participants (81.7% versus 76.1% for pregnant, 76.0% for breastfeeding, 77.7% for postpartum, and 74.4% for infant participants).
Components of clinic operations were rated somewhat lower than the staff and service attributes, with excellent/very good ratings generally ranging from 40 to approximately 75 percent (Exhibit 3.25 above). Ratings of good were usually another 15 to 30 percent above that. As such, the overall ratings were strong in most cases. Most participants (over 90%) considered the safety of clinics, the convenience of the clinic location, and hours of operation to be good to excellent.
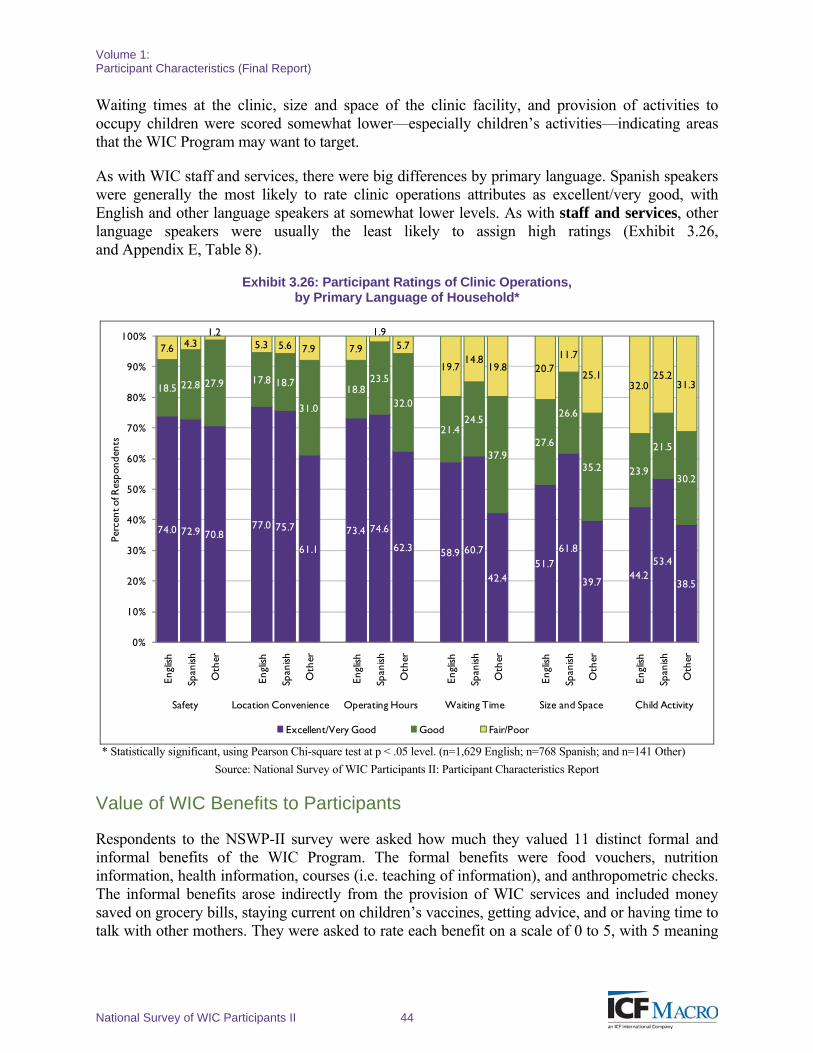
Volume 1: Participant Characteristics (Final Report)
National Survey of WIC Participants II 44
Waiting times at the clinic, size and space of the clinic facility, and provision of activities to occupy children were scored somewhat lower—especially children’s activities—indicating areas that the WIC Program may want to target.
As with WIC staff and services, there were big differences by primary language. Spanish speakers were generally the most likely to rate clinic operations attributes as excellent/very good, with English and other language speakers at somewhat lower levels. As with staff and services, other language speakers were usually the least likely to assign high ratings (Exhibit 3.26, and Appendix E, Table 8).
Exhibit 3.26: Participant Ratings of Clinic Operations, by Primary Language of Household*
74.0 72.9 70.877.0 75.7
61.1
73.4 74.6
62.3 58.9 60.7
42.451.7
61.8
39.744.2
53.4
38.5
18.5 22.8 27.9 17.8 18.7
31.0
18.823.5
32.0
21.424.5
37.927.6
26.6
35.2 23.9
21.5
30.2
7.6 4.31.2
5.3 5.6 7.9 7.9
1.95.7
19.714.8
19.8 20.711.7
25.132.0
25.231.3
0%
10%
20%
30%
40%
50%
60%
70%
80%
90%
100%
Engl
ish
Span
ish
Oth
er
Engl
ish
Span
ish
Oth
er
Engl
ish
Span
ish
Oth
er
Engl
ish
Span
ish
Oth
er
Engl
ish
Span
ish
Oth
er
Engl
ish
Span
ish
Oth
er
Perc
ent o
f Res
pond
ents
Excellent/Very Good Good Fair/Poor
Safety Location Convenience Operating Hours Waiting Time Size and Space Child Activity
* Statistically significant, using Pearson Chi-square test at p < .05 level. (n=1,629 English; n=768 Spanish; and n=141 Other)
Source: National Survey of WIC Participants II: Participant Characteristics Report
Value of WIC Benefits to Participants
Respondents to the NSWP-II survey were asked how much they valued 11 distinct formal and informal benefits of the WIC Program. The formal benefits were food vouchers, nutrition information, health information, courses (i.e. teaching of information), and anthropometric checks. The informal benefits arose indirectly from the provision of WIC services and included money saved on grocery bills, staying current on children’s vaccines, getting advice, and or having time to talk with other mothers. They were asked to rate each benefit on a scale of 0 to 5, with 5 meaning
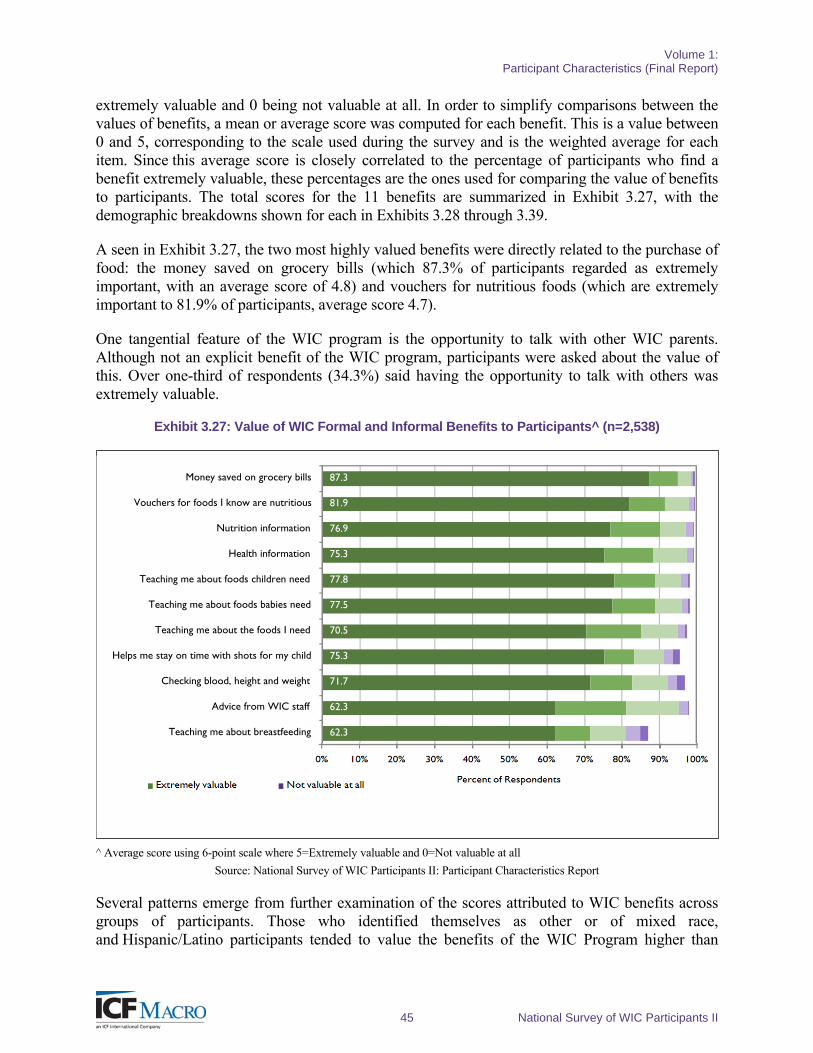
Volume 1: Participant Characteristics (Final Report)
45 National Survey of WIC Participants II
extremely valuable and 0 being not valuable at all. In order to simplify comparisons between the values of benefits, a mean or average score was computed for each benefit. This is a value between 0 and 5, corresponding to the scale used during the survey and is the weighted average for each item. Since this average score is closely correlated to the percentage of participants who find a benefit extremely valuable, these percentages are the ones used for comparing the value of benefits to participants. The total scores for the 11 benefits are summarized in Exhibit 3.27, with the demographic breakdowns shown for each in Exhibits 3.28 through 3.39.
A seen in Exhibit 3.27, the two most highly valued benefits were directly related to the purchase of food: the money saved on grocery bills (which 87.3% of participants regarded as extremely important, with an average score of 4.8) and vouchers for nutritious foods (which are extremely important to 81.9% of participants, average score 4.7).
One tangential feature of the WIC program is the opportunity to talk with other WIC parents. Although not an explicit benefit of the WIC program, participants were asked about the value of this. Over one-third of respondents (34.3%) said having the opportunity to talk with others was extremely valuable.
Exhibit 3.27: Value of WIC Formal and Informal Benefits to Participants^ (n=2,538)
^ Average score using 6-point scale where 5=Extremely valuable and 0=Not valuable at all
Source: National Survey of WIC Participants II: Participant Characteristics Report
Several patterns emerge from further examination of the scores attributed to WIC benefits across groups of participants. Those who identified themselves as other or of mixed race, and Hispanic/Latino participants tended to value the benefits of the WIC Program higher than
34.3
62.3
62.3
71.7
75.3
70.5
77.5
77.8
75.3
76.9
81.9
87.3
0% 10% 20% 30% 40% 50% 60% 70% 80% 90% 100%
Time to talk with other mothers
Teaching me about breastfeeding
Advice from WIC staff
Checking blood, height and weight
Helps me stay on time with shots for my child
Teaching me about the foods I need
Teaching me about foods babies need
Teaching me about foods children need
Health information
Nutrition information
Vouchers for foods I know are nutritious
Money saved on grocery bills
Percent of RespondentsExtremely valuable Not valuable at all
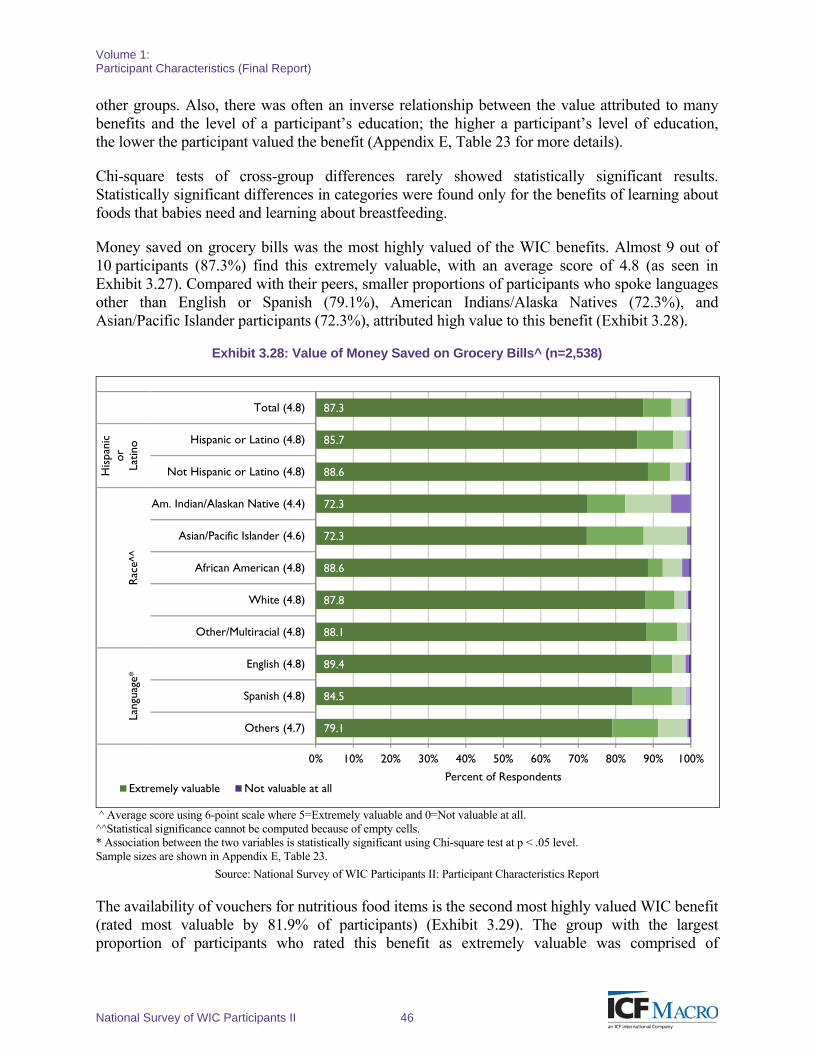
Volume 1: Participant Characteristics (Final Report)
National Survey of WIC Participants II 46
other groups. Also, there was often an inverse relationship between the value attributed to many benefits and the level of a participant’s education; the higher a participant’s level of education, the lower the participant valued the benefit (Appendix E, Table 23 for more details).
Chi-square tests of cross-group differences rarely showed statistically significant results. Statistically significant differences in categories were found only for the benefits of learning about foods that babies need and learning about breastfeeding.
Money saved on grocery bills was the most highly valued of the WIC benefits. Almost 9 out of 10 participants (87.3%) find this extremely valuable, with an average score of 4.8 (as seen in Exhibit 3.27). Compared with their peers, smaller proportions of participants who spoke languages other than English or Spanish (79.1%), American Indians/Alaska Natives (72.3%), and Asian/Pacific Islander participants (72.3%), attributed high value to this benefit (Exhibit 3.28).
Exhibit 3.28: Value of Money Saved on Grocery Bills^ (n=2,538)
79.1
84.5
89.4
88.1
87.8
88.6
72.3
72.3
88.6
85.7
87.3
0% 10% 20% 30% 40% 50% 60% 70% 80% 90% 100%
Others (4.7)
Spanish (4.8)
English (4.8)
Other/Multiracial (4.8)
White (4.8)
African American (4.8)
Asian/Pacific Islander (4.6)
Am. Indian/Alaskan Native (4.4)
Not Hispanic or Latino (4.8)
Hispanic or Latino (4.8)
Total (4.8)
Lang
uage
*R
ace^
^
His
pani
cor
Latin
o
Percent of RespondentsExtremely valuable Not valuable at all
^ Average score using 6-point scale where 5=Extremely valuable and 0=Not valuable at all. ^^Statistical significance cannot be computed because of empty cells. * Association between the two variables is statistically significant using Chi-square test at p < .05 level. Sample sizes are shown in Appendix E, Table 23.
Source: National Survey of WIC Participants II: Participant Characteristics Report
The availability of vouchers for nutritious food items is the second most highly valued WIC benefit (rated most valuable by 81.9% of participants) (Exhibit 3.29). The group with the largest proportion of participants who rated this benefit as extremely valuable was comprised of
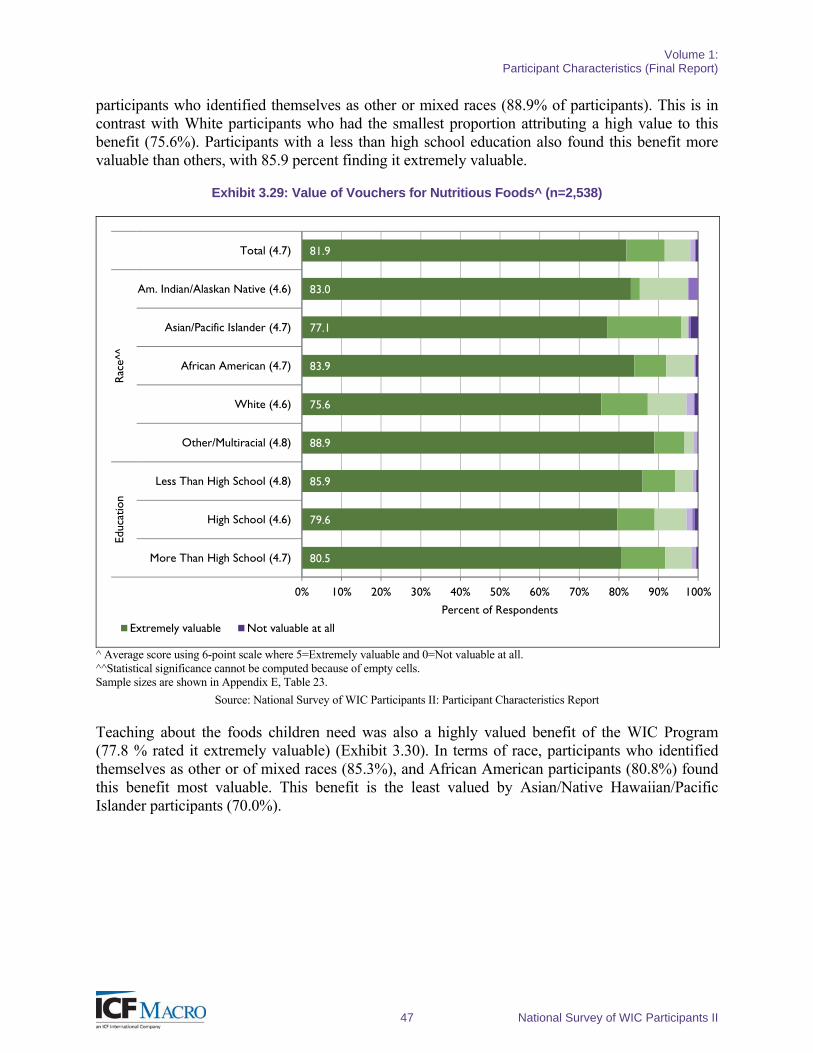
Volume 1: Participant Characteristics (Final Report)
47 National Survey of WIC Participants II
participants who identified themselves as other or mixed races (88.9% of participants). This is in contrast with White participants who had the smallest proportion attributing a high value to this benefit (75.6%). Participants with a less than high school education also found this benefit more valuable than others, with 85.9 percent finding it extremely valuable.
Exhibit 3.29: Value of Vouchers for Nutritious Foods^ (n=2,538)
80.5
79.6
85.9
88.9
75.6
83.9
77.1
83.0
81.9
0% 10% 20% 30% 40% 50% 60% 70% 80% 90% 100%
More Than High School (4.7)
High School (4.6)
Less Than High School (4.8)
Other/Multiracial (4.8)
White (4.6)
African American (4.7)
Asian/Pacific Islander (4.7)
Am. Indian/Alaskan Native (4.6)
Total (4.7)
Educ
atio
nR
ace^
^
Percent of Respondents
Extremely valuable Not valuable at all
^ Average score using 6-point scale where 5=Extremely valuable and 0=Not valuable at all. ^^Statistical significance cannot be computed because of empty cells. Sample sizes are shown in Appendix E, Table 23.
Source: National Survey of WIC Participants II: Participant Characteristics Report
Teaching about the foods children need was also a highly valued benefit of the WIC Program (77.8 % rated it extremely valuable) (Exhibit 3.30). In terms of race, participants who identified themselves as other or of mixed races (85.3%), and African American participants (80.8%) found this benefit most valuable. This benefit is the least valued by Asian/Native Hawaiian/Pacific Islander participants (70.0%).
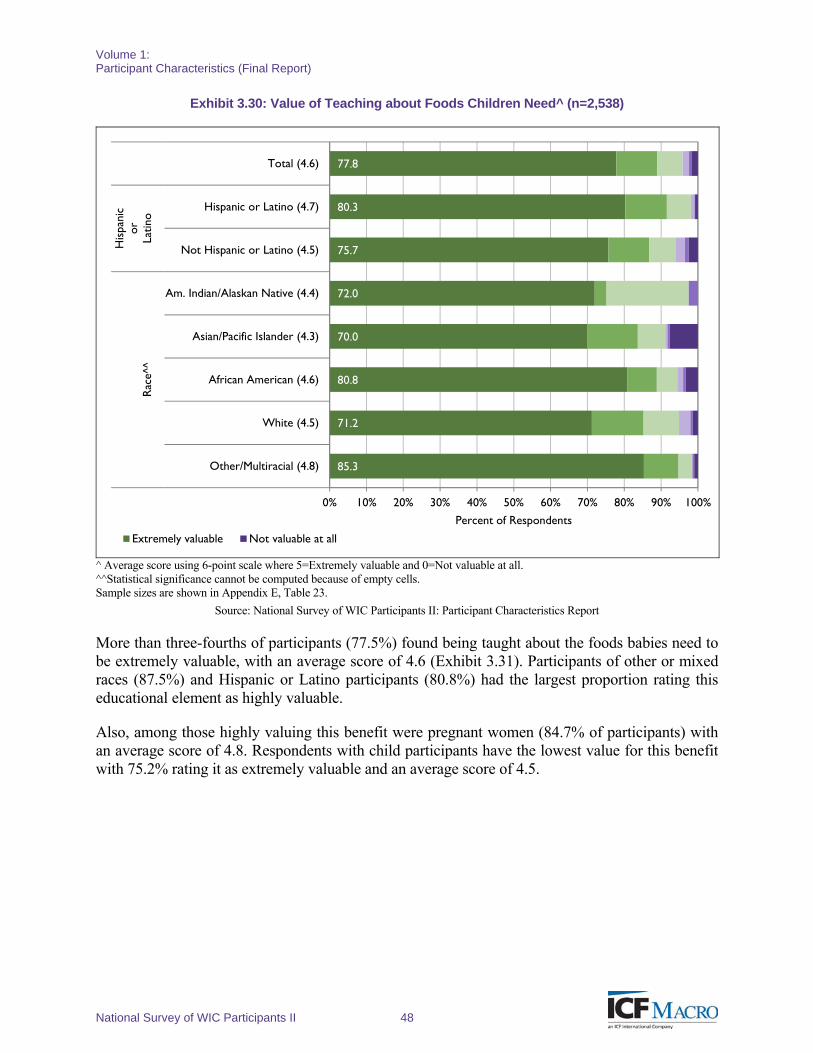
Volume 1: Participant Characteristics (Final Report)
National Survey of WIC Participants II 48
Exhibit 3.30: Value of Teaching about Foods Children Need^ (n=2,538)
85.3
71.2
80.8
70.0
72.0
75.7
80.3
77.8
0% 10% 20% 30% 40% 50% 60% 70% 80% 90% 100%
Other/Multiracial (4.8)
White (4.5)
African American (4.6)
Asian/Pacific Islander (4.3)
Am. Indian/Alaskan Native (4.4)
Not Hispanic or Latino (4.5)
Hispanic or Latino (4.7)
Total (4.6)R
ace^
^
His
pani
cor
Latin
o
Percent of Respondents
Extremely valuable Not valuable at all
^ Average score using 6-point scale where 5=Extremely valuable and 0=Not valuable at all. ^^Statistical significance cannot be computed because of empty cells. Sample sizes are shown in Appendix E, Table 23.
Source: National Survey of WIC Participants II: Participant Characteristics Report
More than three-fourths of participants (77.5%) found being taught about the foods babies need to be extremely valuable, with an average score of 4.6 (Exhibit 3.31). Participants of other or mixed races (87.5%) and Hispanic or Latino participants (80.8%) had the largest proportion rating this educational element as highly valuable.
Also, among those highly valuing this benefit were pregnant women (84.7% of participants) with an average score of 4.8. Respondents with child participants have the lowest value for this benefit with 75.2% rating it as extremely valuable and an average score of 4.5.
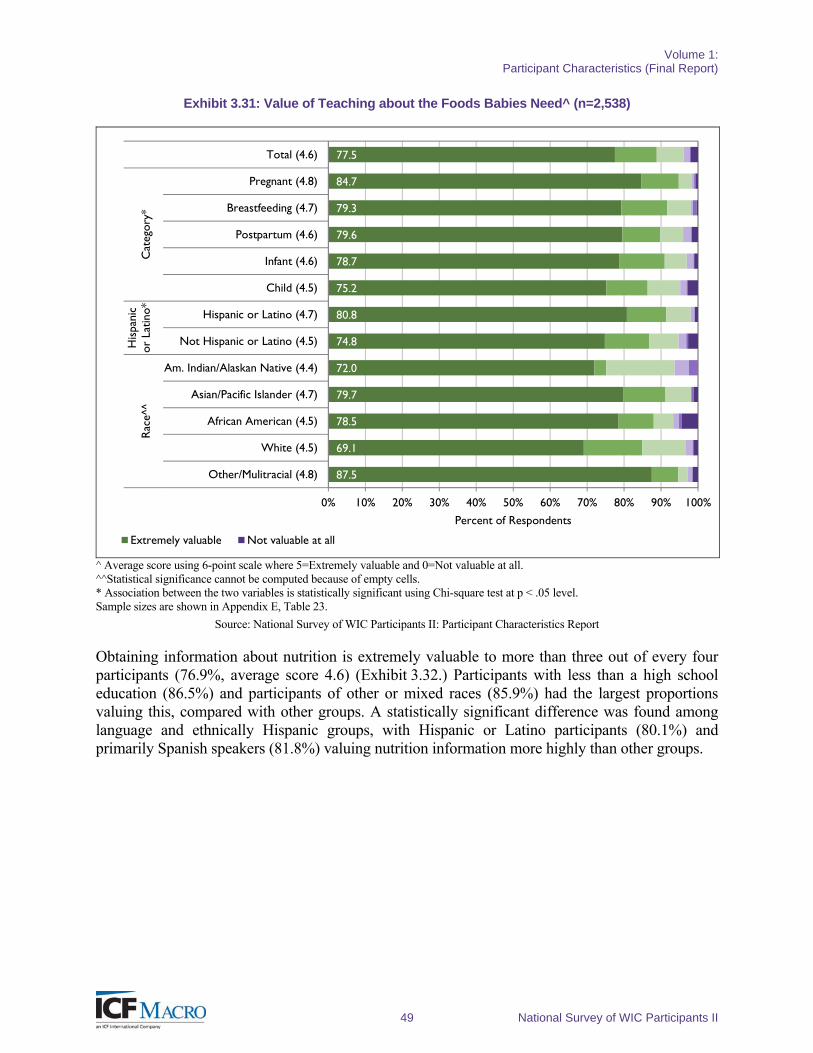
Volume 1: Participant Characteristics (Final Report)
49 National Survey of WIC Participants II
Exhibit 3.31: Value of Teaching about the Foods Babies Need^ (n=2,538)
87.5
69.1
78.5
79.7
72.0
74.8
80.8
75.2
78.7
79.6
79.3
84.7
77.5
0% 10% 20% 30% 40% 50% 60% 70% 80% 90% 100%
Other/Mulitracial (4.8)
White (4.5)
African American (4.5)
Asian/Pacific Islander (4.7)
Am. Indian/Alaskan Native (4.4)
Not Hispanic or Latino (4.5)
Hispanic or Latino (4.7)
Child (4.5)
Infant (4.6)
Postpartum (4.6)
Breastfeeding (4.7)
Pregnant (4.8)
Total (4.6)R
ace^
^H
ispa
nic
or L
atin
o*C
ateg
ory*
Percent of Respondents
Extremely valuable Not valuable at all
^ Average score using 6-point scale where 5=Extremely valuable and 0=Not valuable at all. ^^Statistical significance cannot be computed because of empty cells. * Association between the two variables is statistically significant using Chi-square test at p < .05 level. Sample sizes are shown in Appendix E, Table 23.
Source: National Survey of WIC Participants II: Participant Characteristics Report
Obtaining information about nutrition is extremely valuable to more than three out of every four participants (76.9%, average score 4.6) (Exhibit 3.32.) Participants with less than a high school education (86.5%) and participants of other or mixed races (85.9%) had the largest proportions valuing this, compared with other groups. A statistically significant difference was found among language and ethnically Hispanic groups, with Hispanic or Latino participants (80.1%) and primarily Spanish speakers (81.8%) valuing nutrition information more highly than other groups.
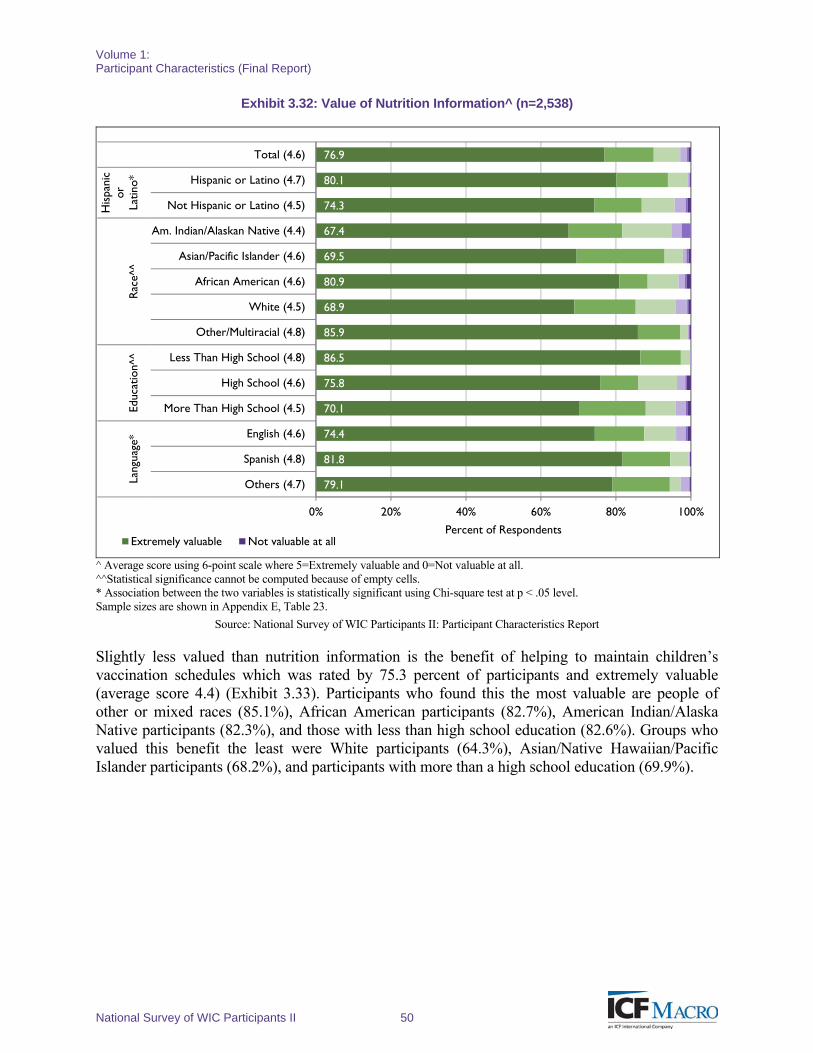
Volume 1: Participant Characteristics (Final Report)
National Survey of WIC Participants II 50
Exhibit 3.32: Value of Nutrition Information^ (n=2,538)
79.1
81.8
74.4
70.1
75.8
86.5
85.9
68.9
80.9
69.5
67.4
74.3
80.1
76.9
0% 20% 40% 60% 80% 100%
Others (4.7)
Spanish (4.8)
English (4.6)
More Than High School (4.5)
High School (4.6)
Less Than High School (4.8)
Other/Multiracial (4.8)
White (4.5)
African American (4.6)
Asian/Pacific Islander (4.6)
Am. Indian/Alaskan Native (4.4)
Not Hispanic or Latino (4.5)
Hispanic or Latino (4.7)
Total (4.6)
Lang
uage
*Ed
ucat
ion^
^R
ace^
^
His
pani
cor
Latin
o*
Percent of RespondentsExtremely valuable Not valuable at all
^ Average score using 6-point scale where 5=Extremely valuable and 0=Not valuable at all. ^^Statistical significance cannot be computed because of empty cells. * Association between the two variables is statistically significant using Chi-square test at p < .05 level. Sample sizes are shown in Appendix E, Table 23.
Source: National Survey of WIC Participants II: Participant Characteristics Report
Slightly less valued than nutrition information is the benefit of helping to maintain children’s vaccination schedules which was rated by 75.3 percent of participants and extremely valuable (average score 4.4) (Exhibit 3.33). Participants who found this the most valuable are people of other or mixed races (85.1%), African American participants (82.7%), American Indian/Alaska Native participants (82.3%), and those with less than high school education (82.6%). Groups who valued this benefit the least were White participants (64.3%), Asian/Native Hawaiian/Pacific Islander participants (68.2%), and participants with more than a high school education (69.9%).
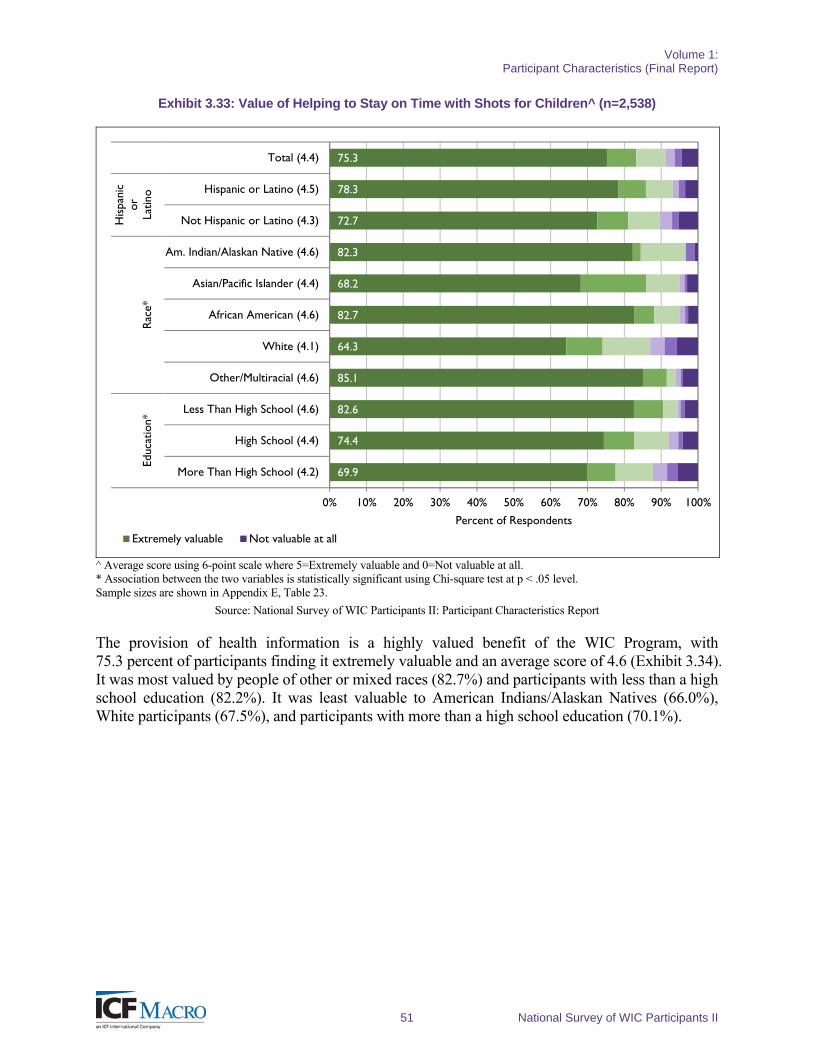
Volume 1: Participant Characteristics (Final Report)
51 National Survey of WIC Participants II
Exhibit 3.33: Value of Helping to Stay on Time with Shots for Children^ (n=2,538)
69.9
74.4
82.6
85.1
64.3
82.7
68.2
82.3
72.7
78.3
75.3
0% 10% 20% 30% 40% 50% 60% 70% 80% 90% 100%
More Than High School (4.2)
High School (4.4)
Less Than High School (4.6)
Other/Multiracial (4.6)
White (4.1)
African American (4.6)
Asian/Pacific Islander (4.4)
Am. Indian/Alaskan Native (4.6)
Not Hispanic or Latino (4.3)
Hispanic or Latino (4.5)
Total (4.4)Ed
ucat
ion*
Rac
e*
His
pani
cor
Latin
o
Percent of Respondents
Extremely valuable Not valuable at all
^ Average score using 6-point scale where 5=Extremely valuable and 0=Not valuable at all. * Association between the two variables is statistically significant using Chi-square test at p < .05 level. Sample sizes are shown in Appendix E, Table 23.
Source: National Survey of WIC Participants II: Participant Characteristics Report
The provision of health information is a highly valued benefit of the WIC Program, with 75.3 percent of participants finding it extremely valuable and an average score of 4.6 (Exhibit 3.34). It was most valued by people of other or mixed races (82.7%) and participants with less than a high school education (82.2%). It was least valuable to American Indians/Alaskan Natives (66.0%), White participants (67.5%), and participants with more than a high school education (70.1%).
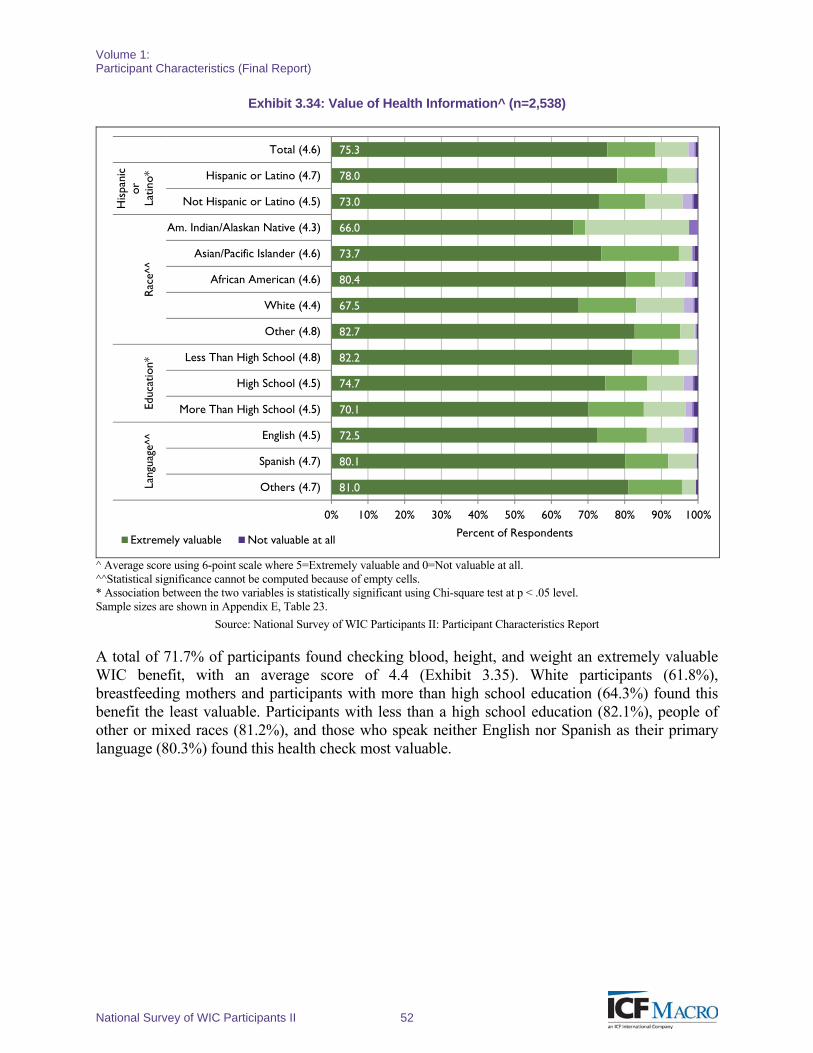
Volume 1: Participant Characteristics (Final Report)
National Survey of WIC Participants II 52
Exhibit 3.34: Value of Health Information^ (n=2,538)
81.0
80.1
72.5
70.1
74.7
82.2
82.7
67.5
80.4
73.7
66.0
73.0
78.0
75.3
0% 10% 20% 30% 40% 50% 60% 70% 80% 90% 100%
Others (4.7)
Spanish (4.7)
English (4.5)
More Than High School (4.5)
High School (4.5)
Less Than High School (4.8)
Other (4.8)
White (4.4)
African American (4.6)
Asian/Pacific Islander (4.6)
Am. Indian/Alaskan Native (4.3)
Not Hispanic or Latino (4.5)
Hispanic or Latino (4.7)
Total (4.6)La
ngua
ge^^
Educ
atio
n*R
ace^
^
His
pani
cor
Latin
o*
Percent of RespondentsExtremely valuable Not valuable at all
^ Average score using 6-point scale where 5=Extremely valuable and 0=Not valuable at all. ^^Statistical significance cannot be computed because of empty cells. * Association between the two variables is statistically significant using Chi-square test at p < .05 level. Sample sizes are shown in Appendix E, Table 23.
Source: National Survey of WIC Participants II: Participant Characteristics Report
A total of 71.7% of participants found checking blood, height, and weight an extremely valuable WIC benefit, with an average score of 4.4 (Exhibit 3.35). White participants (61.8%), breastfeeding mothers and participants with more than high school education (64.3%) found this benefit the least valuable. Participants with less than a high school education (82.1%), people of other or mixed races (81.2%), and those who speak neither English nor Spanish as their primary language (80.3%) found this health check most valuable.
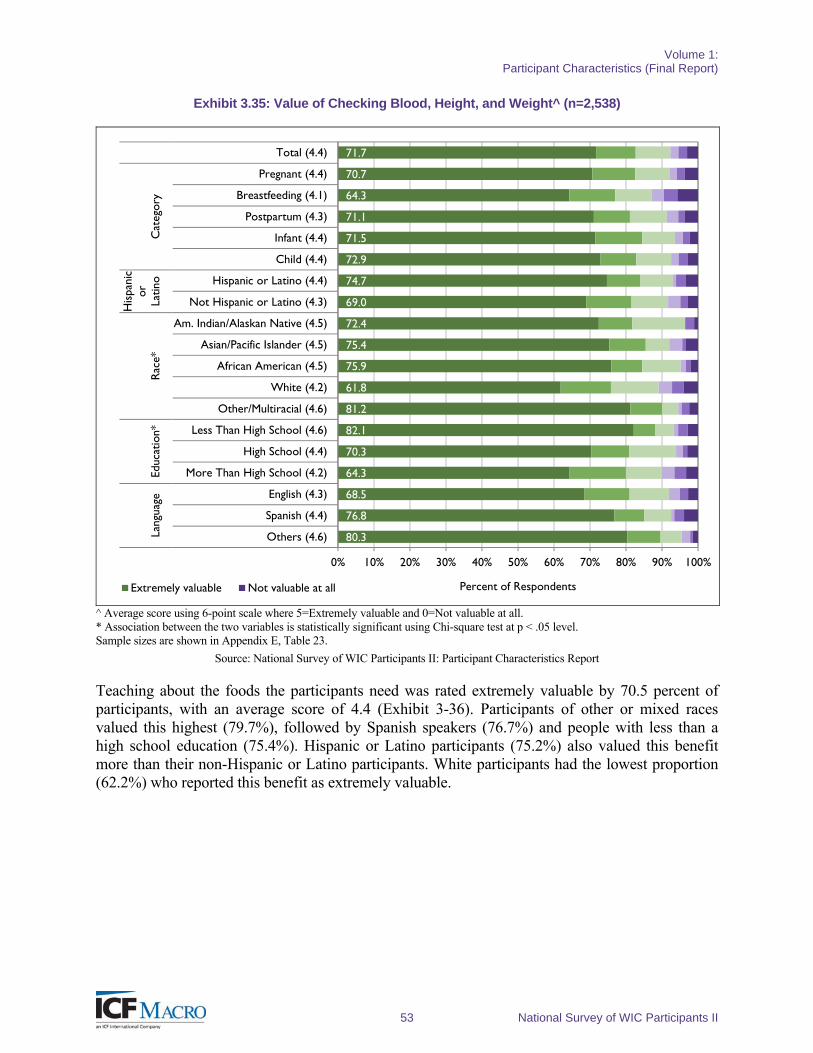
Volume 1: Participant Characteristics (Final Report)
53 National Survey of WIC Participants II
Exhibit 3.35: Value of Checking Blood, Height, and Weight^ (n=2,538)
80.3
76.8
68.5
64.3
70.3
82.1
81.2
61.8
75.9
75.4
72.4
69.0
74.7
72.9
71.5
71.1
64.3
70.7
71.7
0% 10% 20% 30% 40% 50% 60% 70% 80% 90% 100%
Others (4.6)
Spanish (4.4)
English (4.3)
More Than High School (4.2)
High School (4.4)
Less Than High School (4.6)
Other/Multiracial (4.6)
White (4.2)
African American (4.5)
Asian/Pacific Islander (4.5)
Am. Indian/Alaskan Native (4.5)
Not Hispanic or Latino (4.3)
Hispanic or Latino (4.4)
Child (4.4)
Infant (4.4)
Postpartum (4.3)
Breastfeeding (4.1)
Pregnant (4.4)
Total (4.4)La
ngua
geEd
ucat
ion*
Rac
e*
His
pani
cor
Latin
oC
ateg
ory
Percent of RespondentsExtremely valuable Not valuable at all
^ Average score using 6-point scale where 5=Extremely valuable and 0=Not valuable at all. * Association between the two variables is statistically significant using Chi-square test at p < .05 level. Sample sizes are shown in Appendix E, Table 23.
Source: National Survey of WIC Participants II: Participant Characteristics Report
Teaching about the foods the participants need was rated extremely valuable by 70.5 percent of participants, with an average score of 4.4 (Exhibit 3-36). Participants of other or mixed races valued this highest (79.7%), followed by Spanish speakers (76.7%) and people with less than a high school education (75.4%). Hispanic or Latino participants (75.2%) also valued this benefit more than their non-Hispanic or Latino participants. White participants had the lowest proportion (62.2%) who reported this benefit as extremely valuable.
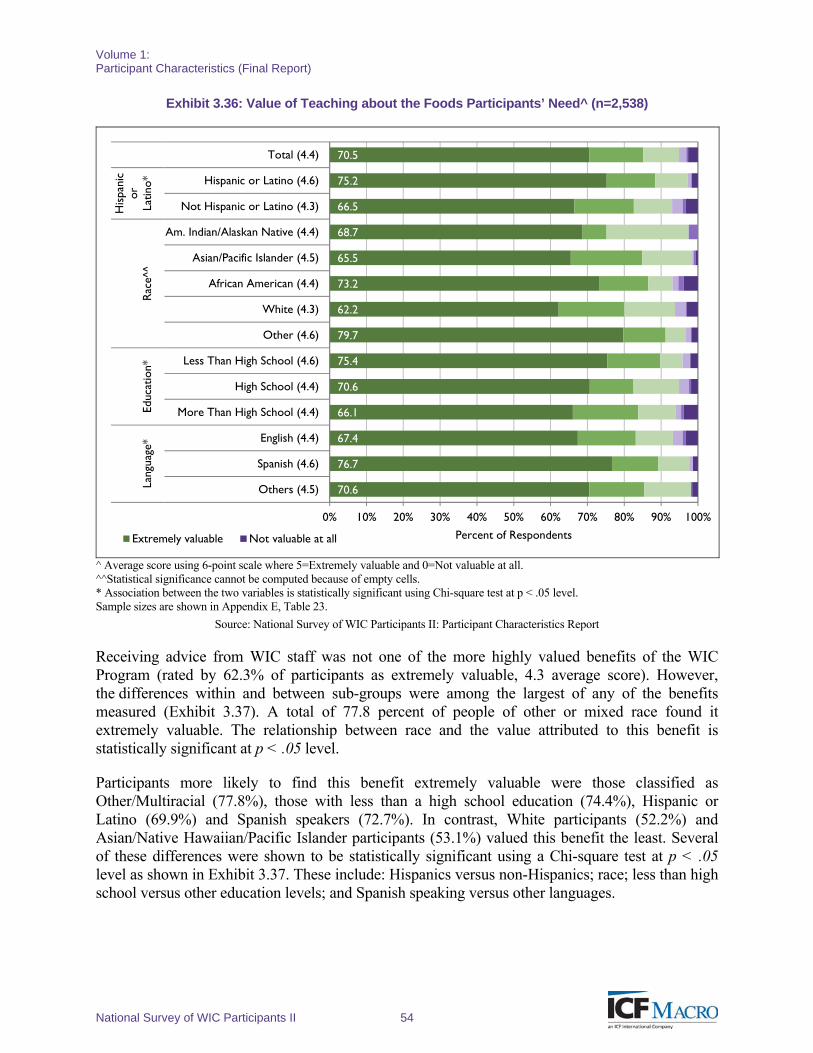
Volume 1: Participant Characteristics (Final Report)
National Survey of WIC Participants II 54
Exhibit 3.36: Value of Teaching about the Foods Participants’ Need^ (n=2,538)
70.6
76.7
67.4
66.1
70.6
75.4
79.7
62.2
73.2
65.5
68.7
66.5
75.2
70.5
0% 10% 20% 30% 40% 50% 60% 70% 80% 90% 100%
Others (4.5)
Spanish (4.6)
English (4.4)
More Than High School (4.4)
High School (4.4)
Less Than High School (4.6)
Other (4.6)
White (4.3)
African American (4.4)
Asian/Pacific Islander (4.5)
Am. Indian/Alaskan Native (4.4)
Not Hispanic or Latino (4.3)
Hispanic or Latino (4.6)
Total (4.4)La
ngua
ge*
Educ
atio
n*R
ace^
^
His
pani
cor
Latin
o*
Percent of RespondentsExtremely valuable Not valuable at all
^ Average score using 6-point scale where 5=Extremely valuable and 0=Not valuable at all. ^^Statistical significance cannot be computed because of empty cells. * Association between the two variables is statistically significant using Chi-square test at p < .05 level. Sample sizes are shown in Appendix E, Table 23.
Source: National Survey of WIC Participants II: Participant Characteristics Report
Receiving advice from WIC staff was not one of the more highly valued benefits of the WIC Program (rated by 62.3% of participants as extremely valuable, 4.3 average score). However, the differences within and between sub-groups were among the largest of any of the benefits measured (Exhibit 3.37). A total of 77.8 percent of people of other or mixed race found it extremely valuable. The relationship between race and the value attributed to this benefit is statistically significant at p < .05 level.
Participants more likely to find this benefit extremely valuable were those classified as Other/Multiracial (77.8%), those with less than a high school education (74.4%), Hispanic or Latino (69.9%) and Spanish speakers (72.7%). In contrast, White participants (52.2%) and Asian/Native Hawaiian/Pacific Islander participants (53.1%) valued this benefit the least. Several of these differences were shown to be statistically significant using a Chi-square test at p < .05 level as shown in Exhibit 3.37. These include: Hispanics versus non-Hispanics; race; less than high school versus other education levels; and Spanish speaking versus other languages.
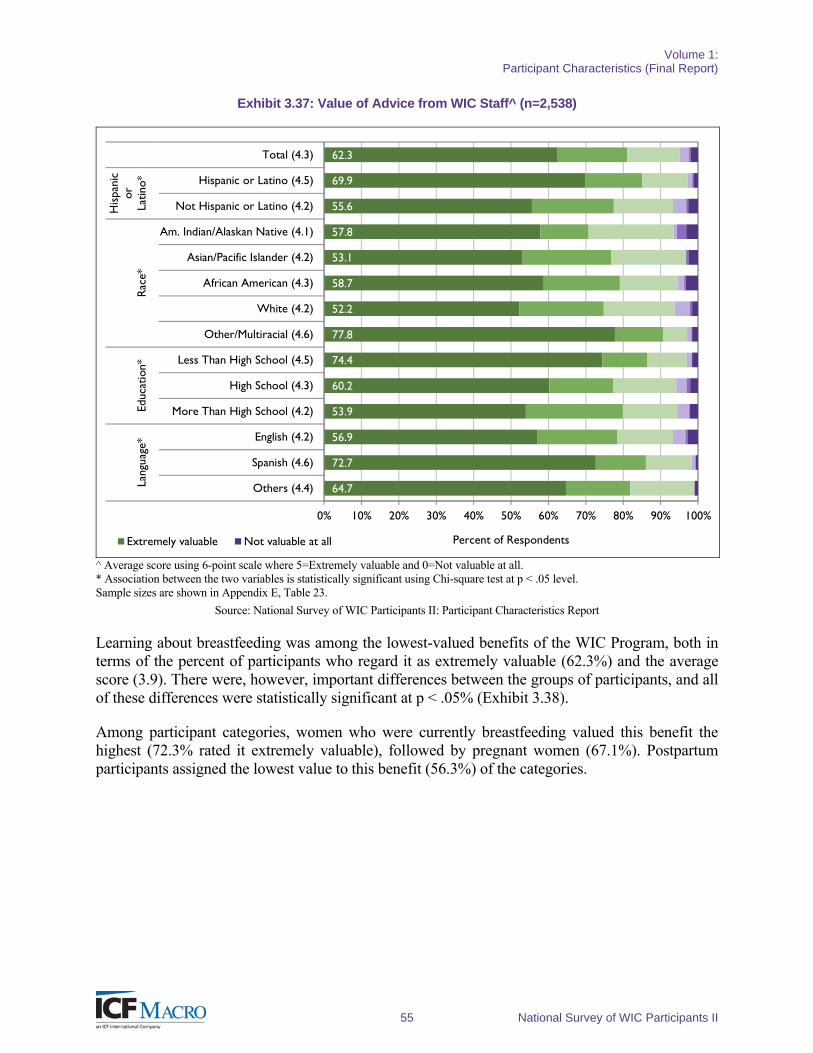
Volume 1: Participant Characteristics (Final Report)
55 National Survey of WIC Participants II
Exhibit 3.37: Value of Advice from WIC Staff^ (n=2,538)
64.7
72.7
56.9
53.9
60.2
74.4
77.8
52.2
58.7
53.1
57.8
55.6
69.9
62.3
0% 10% 20% 30% 40% 50% 60% 70% 80% 90% 100%
Others (4.4)
Spanish (4.6)
English (4.2)
More Than High School (4.2)
High School (4.3)
Less Than High School (4.5)
Other/Multiracial (4.6)
White (4.2)
African American (4.3)
Asian/Pacific Islander (4.2)
Am. Indian/Alaskan Native (4.1)
Not Hispanic or Latino (4.2)
Hispanic or Latino (4.5)
Total (4.3)La
ngua
ge*
Educ
atio
n*R
ace*
His
pani
cor
Latin
o*
Percent of RespondentsExtremely valuable Not valuable at all
^ Average score using 6-point scale where 5=Extremely valuable and 0=Not valuable at all. * Association between the two variables is statistically significant using Chi-square test at p < .05 level. Sample sizes are shown in Appendix E, Table 23.
Source: National Survey of WIC Participants II: Participant Characteristics Report
Learning about breastfeeding was among the lowest-valued benefits of the WIC Program, both in terms of the percent of participants who regard it as extremely valuable (62.3%) and the average score (3.9). There were, however, important differences between the groups of participants, and all of these differences were statistically significant at p < .05% (Exhibit 3.38).
Among participant categories, women who were currently breastfeeding valued this benefit the highest (72.3% rated it extremely valuable), followed by pregnant women (67.1%). Postpartum participants assigned the lowest value to this benefit (56.3%) of the categories.
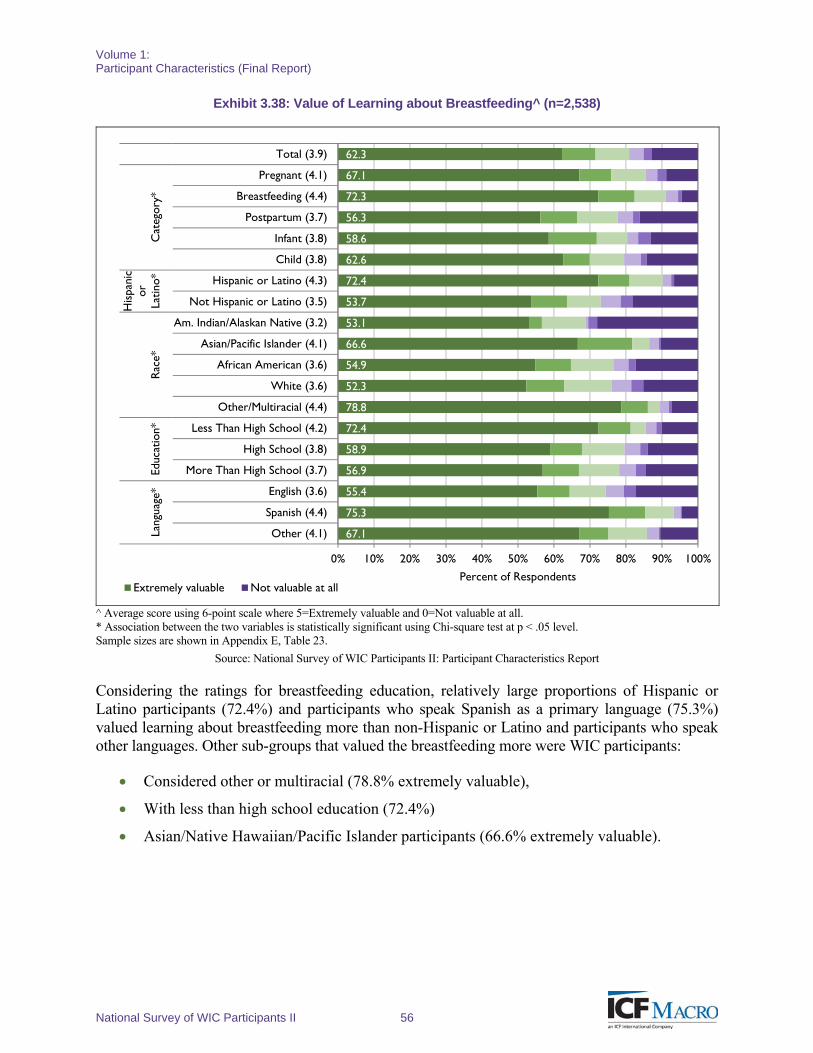
Volume 1: Participant Characteristics (Final Report)
National Survey of WIC Participants II 56
Exhibit 3.38: Value of Learning about Breastfeeding^ (n=2,538)
67.1
75.3
55.4
56.9
58.9
72.4
78.8
52.3
54.9
66.6
53.1
53.7
72.4
62.6
58.6
56.3
72.3
67.1
62.3
0% 10% 20% 30% 40% 50% 60% 70% 80% 90% 100%
Other (4.1)
Spanish (4.4)
English (3.6)
More Than High School (3.7)
High School (3.8)
Less Than High School (4.2)
Other/Multiracial (4.4)
White (3.6)
African American (3.6)
Asian/Pacific Islander (4.1)
Am. Indian/Alaskan Native (3.2)
Not Hispanic or Latino (3.5)
Hispanic or Latino (4.3)
Child (3.8)
Infant (3.8)
Postpartum (3.7)
Breastfeeding (4.4)
Pregnant (4.1)
Total (3.9)La
ngua
ge*
Educ
atio
n*R
ace*
His
pani
cor
Latin
o*C
ateg
ory*
Percent of RespondentsExtremely valuable Not valuable at all
^ Average score using 6-point scale where 5=Extremely valuable and 0=Not valuable at all. * Association between the two variables is statistically significant using Chi-square test at p < .05 level. Sample sizes are shown in Appendix E, Table 23.
Source: National Survey of WIC Participants II: Participant Characteristics Report
Considering the ratings for breastfeeding education, relatively large proportions of Hispanic or Latino participants (72.4%) and participants who speak Spanish as a primary language (75.3%) valued learning about breastfeeding more than non-Hispanic or Latino and participants who speak other languages. Other sub-groups that valued the breastfeeding more were WIC participants:
Considered other or multiracial (78.8% extremely valuable),
With less than high school education (72.4%)
Asian/Native Hawaiian/Pacific Islander participants (66.6% extremely valuable).
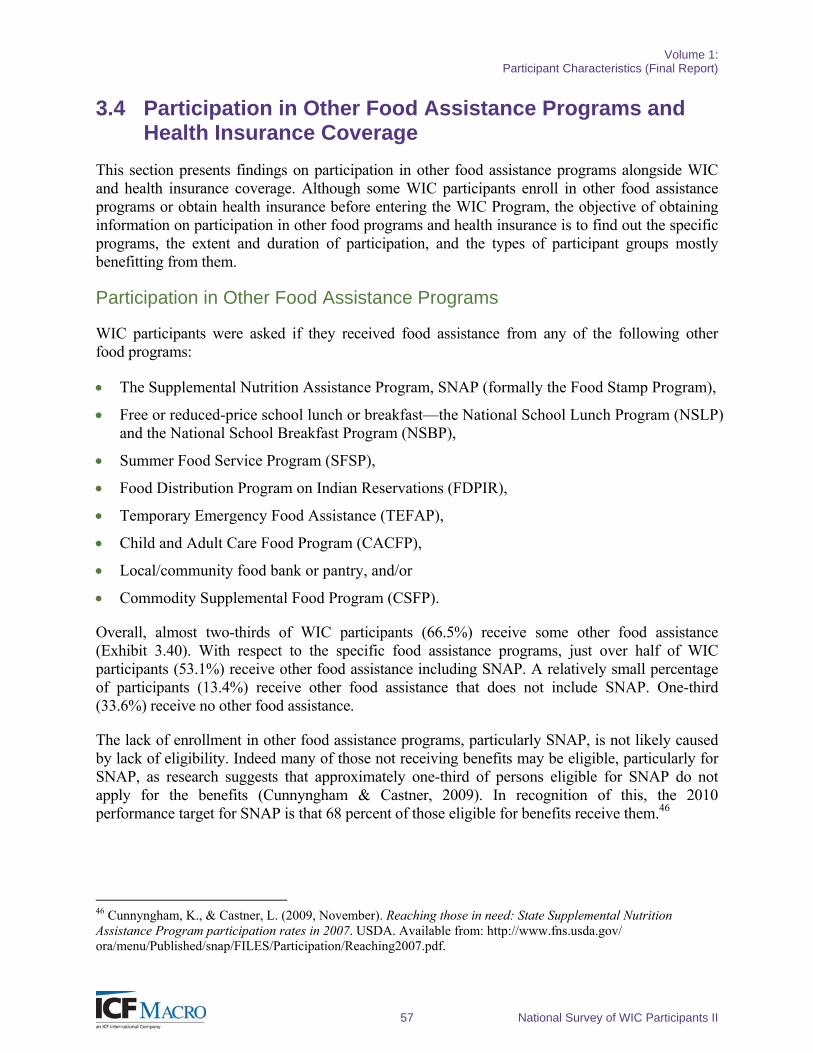
Volume 1: Participant Characteristics (Final Report)
57 National Survey of WIC Participants II
3.4 Participation in Other Food Assistance Programs and Health Insurance Coverage
This section presents findings on participation in other food assistance programs alongside WIC and health insurance coverage. Although some WIC participants enroll in other food assistance programs or obtain health insurance before entering the WIC Program, the objective of obtaining information on participation in other food programs and health insurance is to find out the specific programs, the extent and duration of participation, and the types of participant groups mostly benefitting from them.
Participation in Other Food Assistance Programs
WIC participants were asked if they received food assistance from any of the following other food programs:
The Supplemental Nutrition Assistance Program, SNAP (formally the Food Stamp Program),
Free or reduced-price school lunch or breakfast—the National School Lunch Program (NSLP) and the National School Breakfast Program (NSBP),
Summer Food Service Program (SFSP),
Food Distribution Program on Indian Reservations (FDPIR),
Temporary Emergency Food Assistance (TEFAP),
Child and Adult Care Food Program (CACFP),
Local/community food bank or pantry, and/or
Commodity Supplemental Food Program (CSFP).
Overall, almost two-thirds of WIC participants (66.5%) receive some other food assistance (Exhibit 3.40). With respect to the specific food assistance programs, just over half of WIC participants (53.1%) receive other food assistance including SNAP. A relatively small percentage of participants (13.4%) receive other food assistance that does not include SNAP. One-third (33.6%) receive no other food assistance.
The lack of enrollment in other food assistance programs, particularly SNAP, is not likely caused by lack of eligibility. Indeed many of those not receiving benefits may be eligible, particularly for SNAP, as research suggests that approximately one-third of persons eligible for SNAP do not apply for the benefits (Cunnyngham & Castner, 2009). In recognition of this, the 2010 performance target for SNAP is that 68 percent of those eligible for benefits receive them.46
46 Cunnyngham, K., & Castner, L. (2009, November). Reaching those in need: State Supplemental Nutrition Assistance Program participation rates in 2007. USDA. Available from: http://www.fns.usda.gov/ ora/menu/Published/snap/FILES/Participation/Reaching2007.pdf.
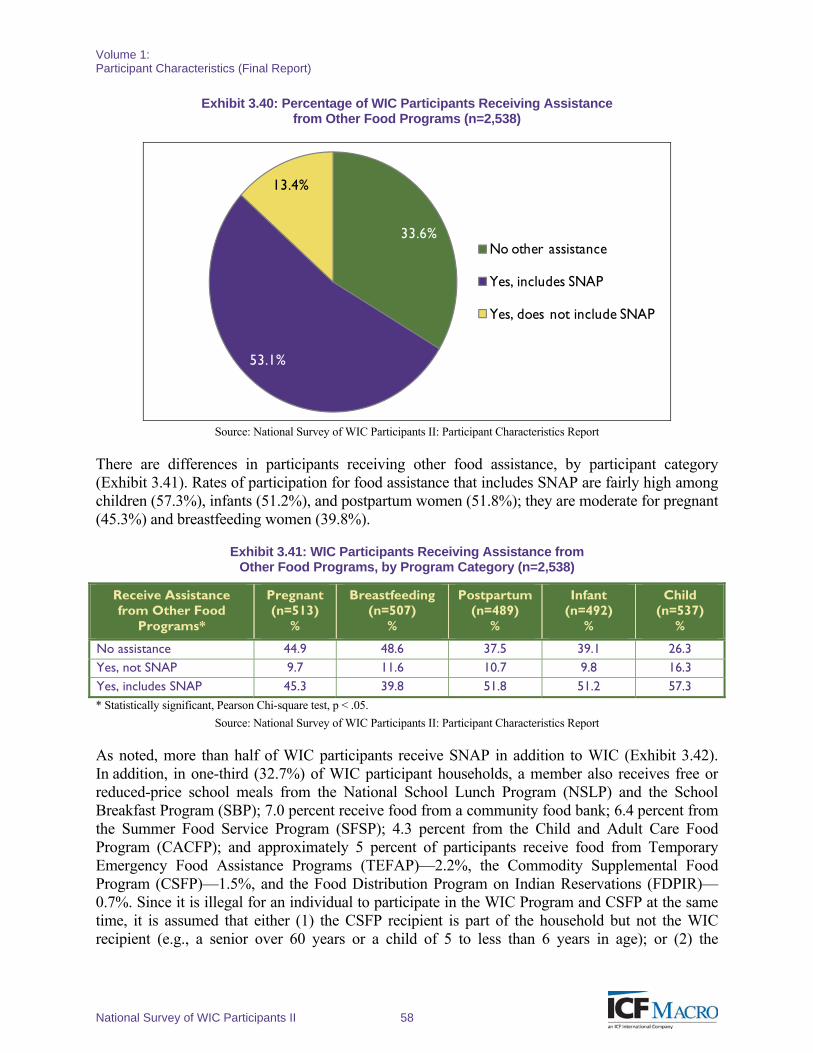
Volume 1: Participant Characteristics (Final Report)
National Survey of WIC Participants II 58
Exhibit 3.40: Percentage of WIC Participants Receiving Assistance from Other Food Programs (n=2,538)
33.6%
53.1%
13.4%
No other assistance
Yes, includes SNAP
Yes, does not include SNAP
Source: National Survey of WIC Participants II: Participant Characteristics Report
There are differences in participants receiving other food assistance, by participant category (Exhibit 3.41). Rates of participation for food assistance that includes SNAP are fairly high among children (57.3%), infants (51.2%), and postpartum women (51.8%); they are moderate for pregnant (45.3%) and breastfeeding women (39.8%).
Exhibit 3.41: WIC Participants Receiving Assistance from Other Food Programs, by Program Category (n=2,538)
Receive Assistance from Other Food
Programs*
Pregnant (n=513)
%
Breastfeeding (n=507)
%
Postpartum (n=489)
%
Infant (n=492)
%
Child (n=537)
%
No assistance 44.9 48.6 37.5 39.1 26.3 Yes, not SNAP 9.7 11.6 10.7 9.8 16.3 Yes, includes SNAP 45.3 39.8 51.8 51.2 57.3 * Statistically significant, Pearson Chi-square test, p < .05.
Source: National Survey of WIC Participants II: Participant Characteristics Report
As noted, more than half of WIC participants receive SNAP in addition to WIC (Exhibit 3.42). In addition, in one-third (32.7%) of WIC participant households, a member also receives free or reduced-price school meals from the National School Lunch Program (NSLP) and the School Breakfast Program (SBP); 7.0 percent receive food from a community food bank; 6.4 percent from the Summer Food Service Program (SFSP); 4.3 percent from the Child and Adult Care Food Program (CACFP); and approximately 5 percent of participants receive food from Temporary Emergency Food Assistance Programs (TEFAP)—2.2%, the Commodity Supplemental Food Program (CSFP)—1.5%, and the Food Distribution Program on Indian Reservations (FDPIR)—0.7%. Since it is illegal for an individual to participate in the WIC Program and CSFP at the same time, it is assumed that either (1) the CSFP recipient is part of the household but not the WIC recipient (e.g., a senior over 60 years or a child of 5 to less than 6 years in age); or (2) the
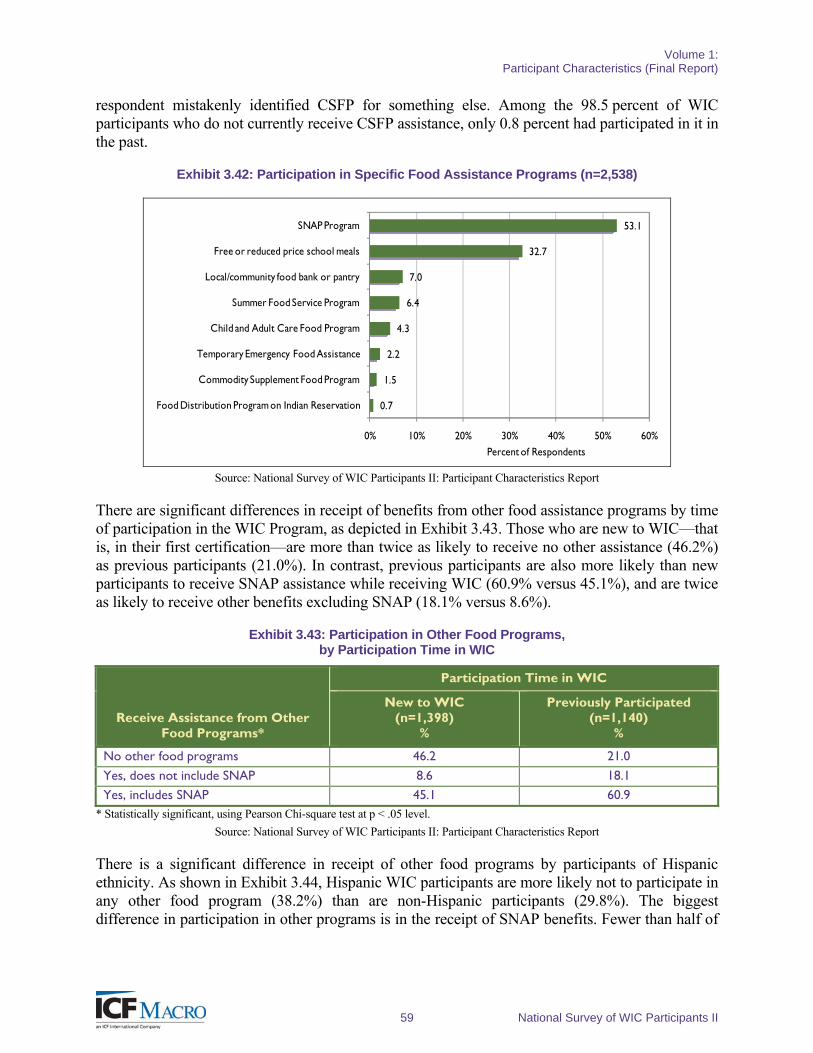
Volume 1: Participant Characteristics (Final Report)
59 National Survey of WIC Participants II
respondent mistakenly identified CSFP for something else. Among the 98.5 percent of WIC participants who do not currently receive CSFP assistance, only 0.8 percent had participated in it in the past.
Exhibit 3.42: Participation in Specific Food Assistance Programs (n=2,538)
0.7
1.5
2.2
4.3
6.4
7.0
32.7
53.1
0% 10% 20% 30% 40% 50% 60%
Food Distribution Program on Indian Reservation
Commodity Supplement Food Program
Temporary Emergency Food Assistance
Child and Adult Care Food Program
Summer Food Service Program
Local/community food bank or pantry
Free or reduced price school meals
SNAP Program
Percent of Respondents
Source: National Survey of WIC Participants II: Participant Characteristics Report
There are significant differences in receipt of benefits from other food assistance programs by time of participation in the WIC Program, as depicted in Exhibit 3.43. Those who are new to WIC—that is, in their first certification—are more than twice as likely to receive no other assistance (46.2%) as previous participants (21.0%). In contrast, previous participants are also more likely than new participants to receive SNAP assistance while receiving WIC (60.9% versus 45.1%), and are twice as likely to receive other benefits excluding SNAP (18.1% versus 8.6%).
Exhibit 3.43: Participation in Other Food Programs, by Participation Time in WIC
Receive Assistance from Other Food Programs*
Participation Time in WIC
New to WIC (n=1,398)
%
Previously Participated (n=1,140)
%
No other food programs 46.2 21.0
Yes, does not include SNAP 8.6 18.1
Yes, includes SNAP 45.1 60.9 * Statistically significant, using Pearson Chi-square test at p < .05 level.
Source: National Survey of WIC Participants II: Participant Characteristics Report
There is a significant difference in receipt of other food programs by participants of Hispanic ethnicity. As shown in Exhibit 3.44, Hispanic WIC participants are more likely not to participate in any other food program (38.2%) than are non-Hispanic participants (29.8%). The biggest difference in participation in other programs is in the receipt of SNAP benefits. Fewer than half of
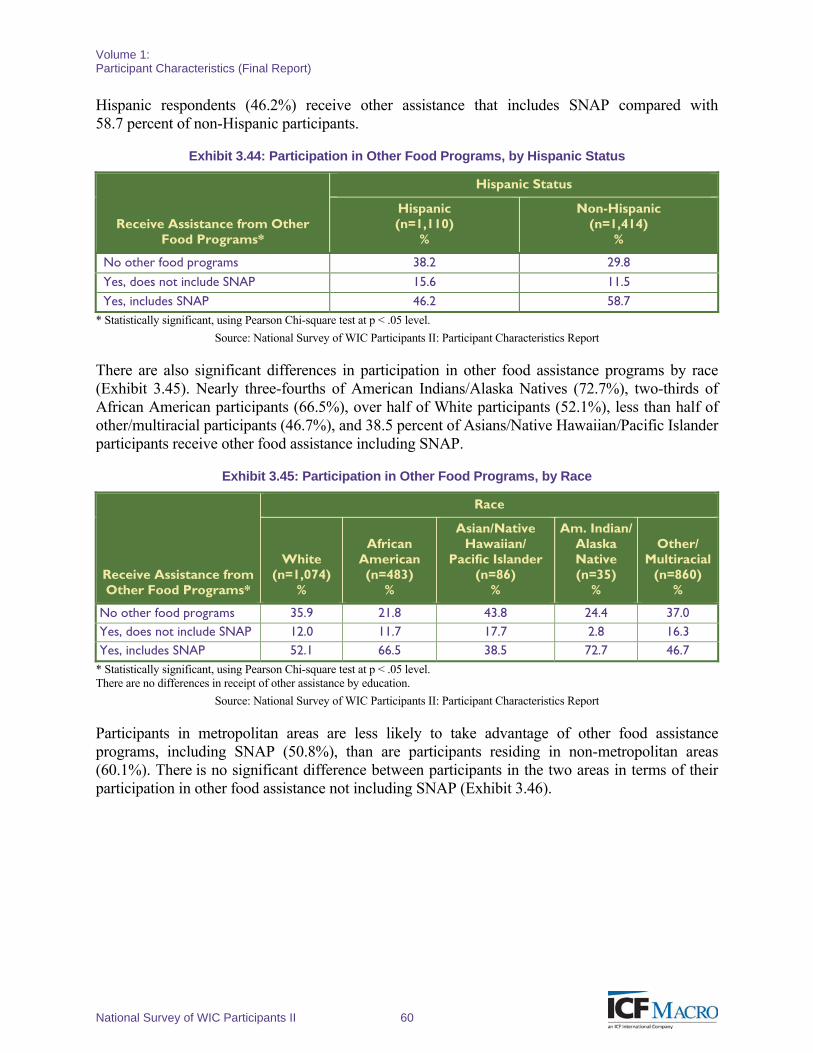
Volume 1: Participant Characteristics (Final Report)
National Survey of WIC Participants II 60
Hispanic respondents (46.2%) receive other assistance that includes SNAP compared with 58.7 percent of non-Hispanic participants.
Exhibit 3.44: Participation in Other Food Programs, by Hispanic Status
Receive Assistance from Other Food Programs*
Hispanic Status
Hispanic (n=1,110)
%
Non-Hispanic (n=1,414)
%
No other food programs 38.2 29.8
Yes, does not include SNAP 15.6 11.5
Yes, includes SNAP 46.2 58.7 * Statistically significant, using Pearson Chi-square test at p < .05 level.
Source: National Survey of WIC Participants II: Participant Characteristics Report
There are also significant differences in participation in other food assistance programs by race (Exhibit 3.45). Nearly three-fourths of American Indians/Alaska Natives (72.7%), two-thirds of African American participants (66.5%), over half of White participants (52.1%), less than half of other/multiracial participants (46.7%), and 38.5 percent of Asians/Native Hawaiian/Pacific Islander participants receive other food assistance including SNAP.
Exhibit 3.45: Participation in Other Food Programs, by Race
Receive Assistance from Other Food Programs*
Race
White (n=1,074)
%
African American (n=483)
%
Asian/Native Hawaiian/
Pacific Islander (n=86)
%
Am. Indian/ Alaska Native (n=35)
%
Other/ Multiracial
(n=860) %
No other food programs 35.9 21.8 43.8 24.4 37.0 Yes, does not include SNAP 12.0 11.7 17.7 2.8 16.3 Yes, includes SNAP 52.1 66.5 38.5 72.7 46.7
* Statistically significant, using Pearson Chi-square test at p < .05 level. There are no differences in receipt of other assistance by education.
Source: National Survey of WIC Participants II: Participant Characteristics Report
Participants in metropolitan areas are less likely to take advantage of other food assistance programs, including SNAP (50.8%), than are participants residing in non-metropolitan areas (60.1%). There is no significant difference between participants in the two areas in terms of their participation in other food assistance not including SNAP (Exhibit 3.46).
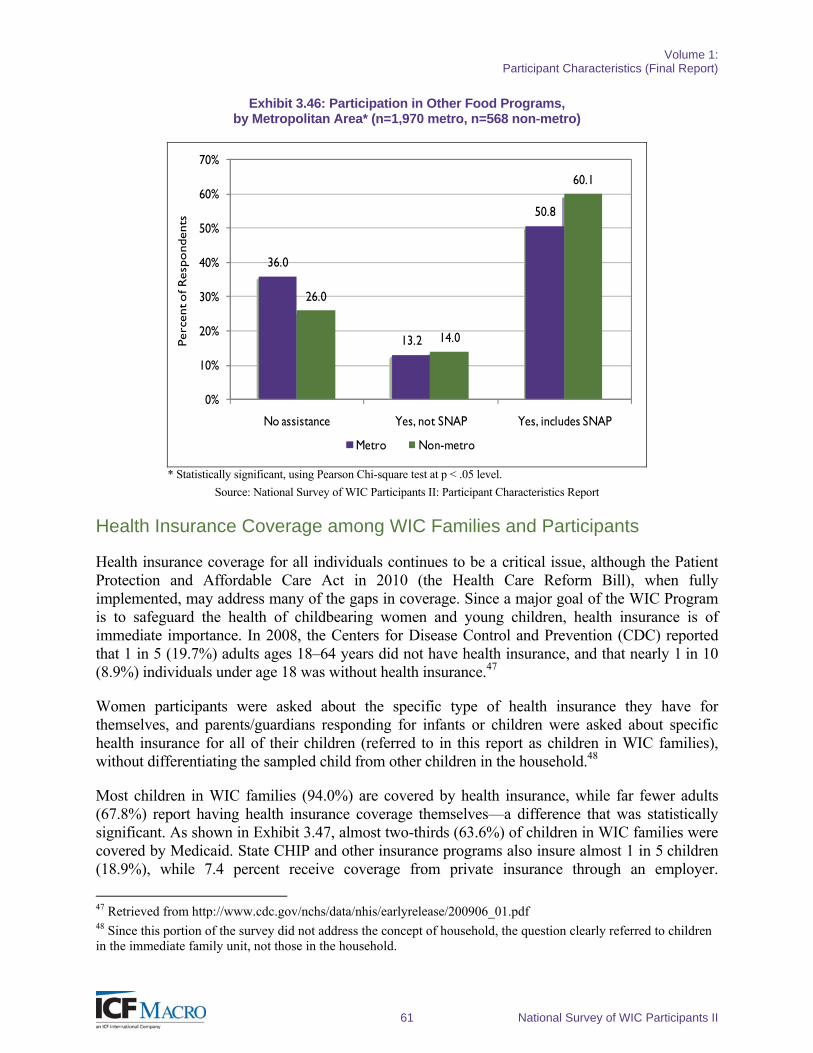
Volume 1: Participant Characteristics (Final Report)
61 National Survey of WIC Participants II
Exhibit 3.46: Participation in Other Food Programs, by Metropolitan Area* (n=1,970 metro, n=568 non-metro)
36.0
13.2
50.8
26.0
14.0
60.1
0%
10%
20%
30%
40%
50%
60%
70%
No assistance Yes, not SNAP Yes, includes SNAP
Perc
ent o
f Res
pond
ents
Metro Non-metro
* Statistically significant, using Pearson Chi-square test at p < .05 level.
Source: National Survey of WIC Participants II: Participant Characteristics Report
Health Insurance Coverage among WIC Families and Participants
Health insurance coverage for all individuals continues to be a critical issue, although the Patient Protection and Affordable Care Act in 2010 (the Health Care Reform Bill), when fully implemented, may address many of the gaps in coverage. Since a major goal of the WIC Program is to safeguard the health of childbearing women and young children, health insurance is of immediate importance. In 2008, the Centers for Disease Control and Prevention (CDC) reported that 1 in 5 (19.7%) adults ages 18–64 years did not have health insurance, and that nearly 1 in 10 (8.9%) individuals under age 18 was without health insurance.47
Women participants were asked about the specific type of health insurance they have for themselves, and parents/guardians responding for infants or children were asked about specific health insurance for all of their children (referred to in this report as children in WIC families), without differentiating the sampled child from other children in the household.48
Most children in WIC families (94.0%) are covered by health insurance, while far fewer adults (67.8%) report having health insurance coverage themselves—a difference that was statistically significant. As shown in Exhibit 3.47, almost two-thirds (63.6%) of children in WIC families were covered by Medicaid. State CHIP and other insurance programs also insure almost 1 in 5 children (18.9%), while 7.4 percent receive coverage from private insurance through an employer.
47 Retrieved from http://www.cdc.gov/nchs/data/nhis/earlyrelease/200906_01.pdf 48 Since this portion of the survey did not address the concept of household, the question clearly referred to children in the immediate family unit, not those in the household.
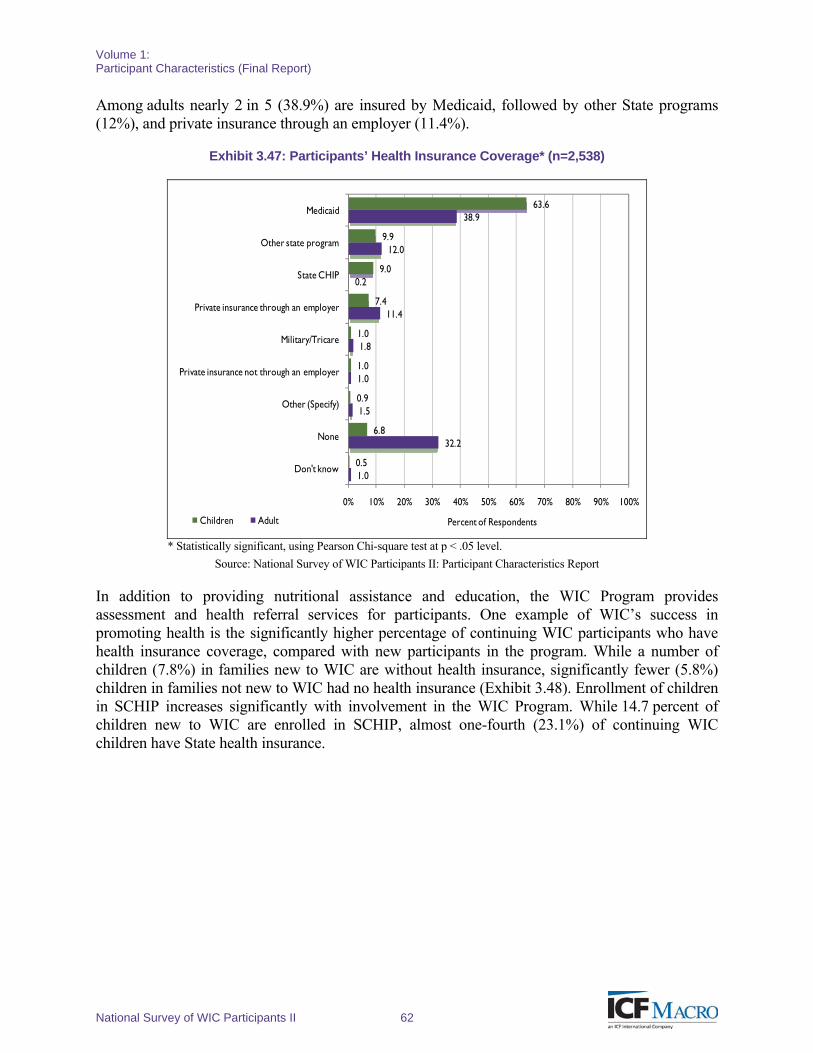
Volume 1: Participant Characteristics (Final Report)
National Survey of WIC Participants II 62
Among adults nearly 2 in 5 (38.9%) are insured by Medicaid, followed by other State programs (12%), and private insurance through an employer (11.4%).
Exhibit 3.47: Participants’ Health Insurance Coverage* (n=2,538)
1.0
32.2
1.5
1.0
1.8
11.4
0.2
12.0
38.9
0.5
6.8
0.9
1.0
1.0
7.4
9.0
9.9
63.6
0% 10% 20% 30% 40% 50% 60% 70% 80% 90% 100%
Don't know
None
Other (Specify)
Private insurance not through an employer
Military/Tricare
Private insurance through an employer
State CHIP
Other state program
Medicaid
Percent of RespondentsChildren Adult
* Statistically significant, using Pearson Chi-square test at p < .05 level.
Source: National Survey of WIC Participants II: Participant Characteristics Report
In addition to providing nutritional assistance and education, the WIC Program provides assessment and health referral services for participants. One example of WIC’s success in promoting health is the significantly higher percentage of continuing WIC participants who have health insurance coverage, compared with new participants in the program. While a number of children (7.8%) in families new to WIC are without health insurance, significantly fewer (5.8%) children in families not new to WIC had no health insurance (Exhibit 3.48). Enrollment of children in SCHIP increases significantly with involvement in the WIC Program. While 14.7 percent of children new to WIC are enrolled in SCHIP, almost one-fourth (23.1%) of continuing WIC children have State health insurance.
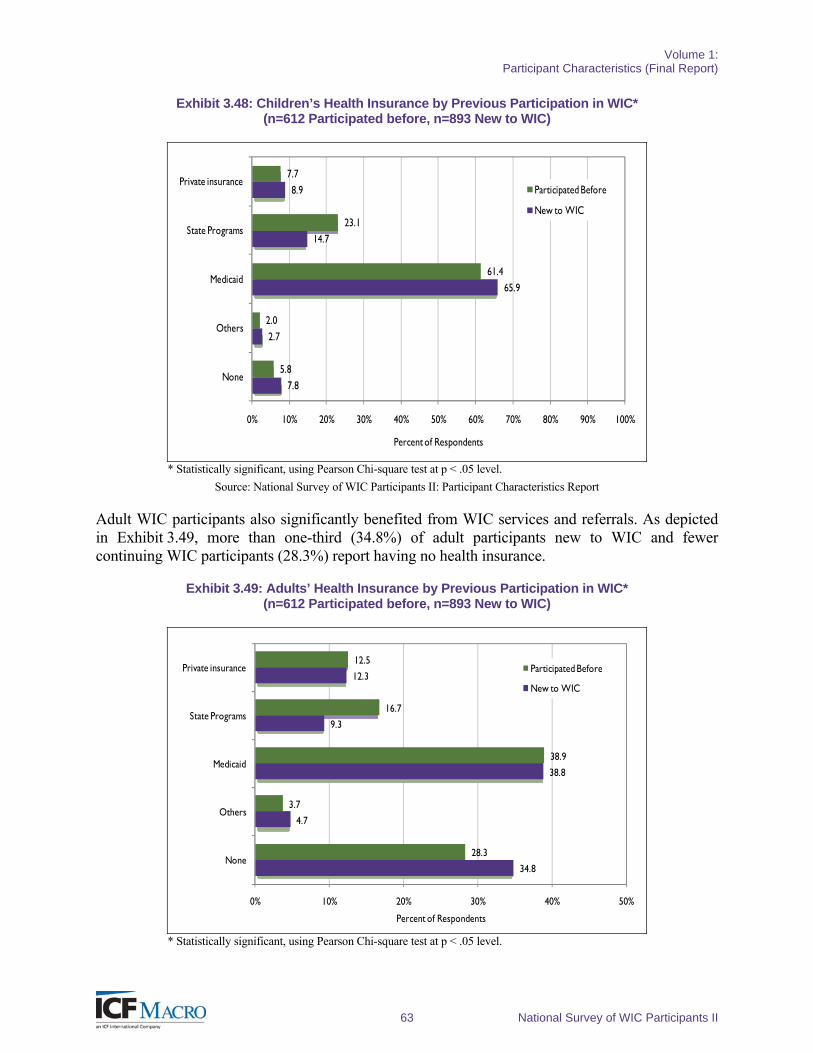
Volume 1: Participant Characteristics (Final Report)
63 National Survey of WIC Participants II
Exhibit 3.48: Children’s Health Insurance by Previous Participation in WIC* (n=612 Participated before, n=893 New to WIC)
7.8
2.7
65.9
14.7
8.9
5.8
2.0
61.4
23.1
7.7
0% 10% 20% 30% 40% 50% 60% 70% 80% 90% 100%
None
Others
Medicaid
State Programs
Private insurance
Percent of Respondents
Participated Before
New to WIC
* Statistically significant, using Pearson Chi-square test at p < .05 level.
Source: National Survey of WIC Participants II: Participant Characteristics Report
Adult WIC participants also significantly benefited from WIC services and referrals. As depicted in Exhibit 3.49, more than one-third (34.8%) of adult participants new to WIC and fewer continuing WIC participants (28.3%) report having no health insurance.
Exhibit 3.49: Adults’ Health Insurance by Previous Participation in WIC* (n=612 Participated before, n=893 New to WIC)
34.8
4.7
38.8
9.3
12.3
28.3
3.7
38.9
16.7
12.5
0% 10% 20% 30% 40% 50%
None
Others
Medicaid
State Programs
Private insurance
Percent of Respondents
Participated Before
New to WIC
* Statistically significant, using Pearson Chi-square test at p < .05 level.
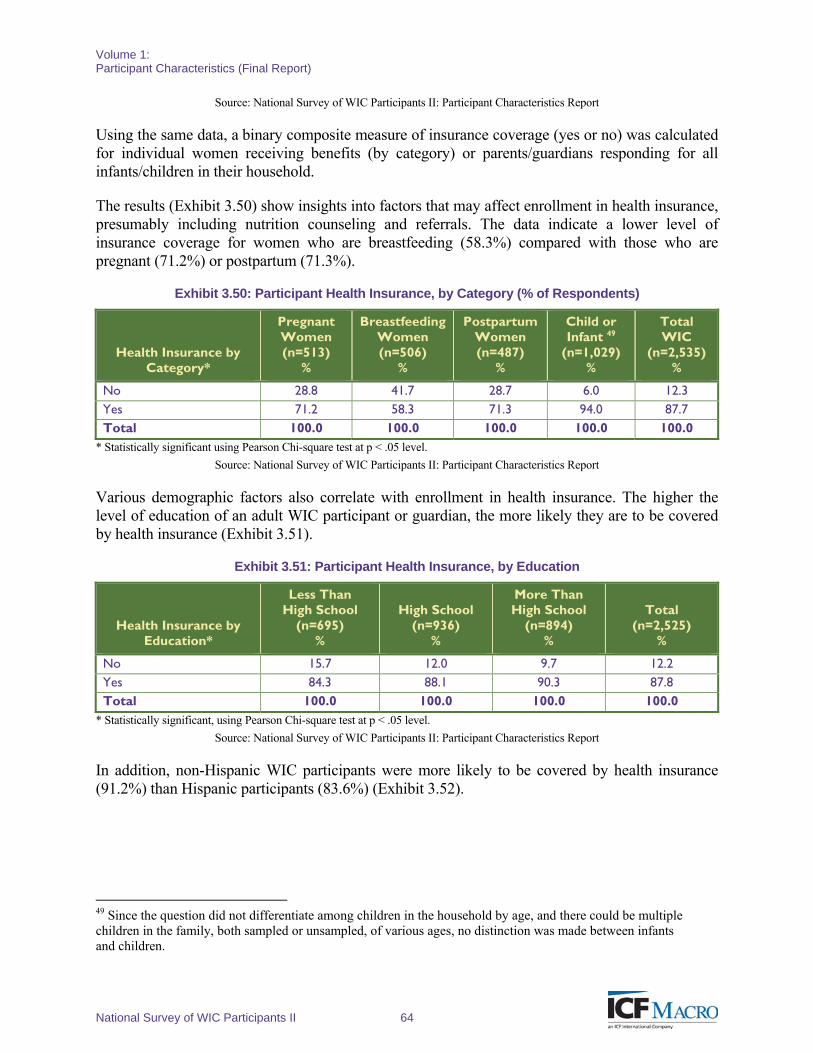
Volume 1: Participant Characteristics (Final Report)
National Survey of WIC Participants II 64
Source: National Survey of WIC Participants II: Participant Characteristics Report
Using the same data, a binary composite measure of insurance coverage (yes or no) was calculated for individual women receiving benefits (by category) or parents/guardians responding for all infants/children in their household.
The results (Exhibit 3.50) show insights into factors that may affect enrollment in health insurance, presumably including nutrition counseling and referrals. The data indicate a lower level of insurance coverage for women who are breastfeeding (58.3%) compared with those who are pregnant (71.2%) or postpartum (71.3%).
Exhibit 3.50: Participant Health Insurance, by Category (% of Respondents)
Health Insurance by Category*
Pregnant Women (n=513)
%
Breastfeeding Women (n=506)
%
Postpartum Women (n=487)
%
Child or Infant 49
(n=1,029) %
Total WIC
(n=2,535) %
No 28.8 41.7 28.7 6.0 12.3 Yes 71.2 58.3 71.3 94.0 87.7 Total 100.0 100.0 100.0 100.0 100.0
* Statistically significant using Pearson Chi-square test at p < .05 level.
Source: National Survey of WIC Participants II: Participant Characteristics Report
Various demographic factors also correlate with enrollment in health insurance. The higher the level of education of an adult WIC participant or guardian, the more likely they are to be covered by health insurance (Exhibit 3.51).
Exhibit 3.51: Participant Health Insurance, by Education
Health Insurance by Education*
Less Than High School
(n=695) %
High School (n=936)
%
More Than High School
(n=894) %
Total (n=2,525)
%
No 15.7 12.0 9.7 12.2 Yes 84.3 88.1 90.3 87.8 Total 100.0 100.0 100.0 100.0
* Statistically significant, using Pearson Chi-square test at p < .05 level.
Source: National Survey of WIC Participants II: Participant Characteristics Report
In addition, non-Hispanic WIC participants were more likely to be covered by health insurance (91.2%) than Hispanic participants (83.6%) (Exhibit 3.52).
49 Since the question did not differentiate among children in the household by age, and there could be multiple children in the family, both sampled or unsampled, of various ages, no distinction was made between infants and children.
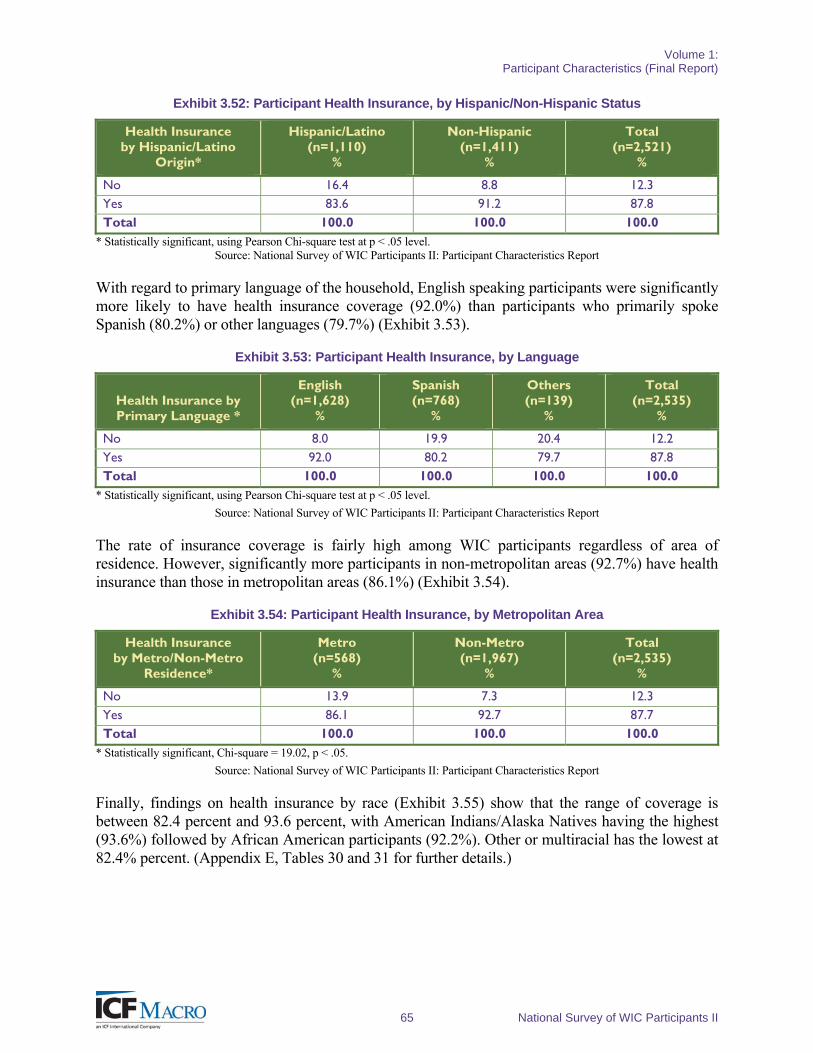
Volume 1: Participant Characteristics (Final Report)
65 National Survey of WIC Participants II
Exhibit 3.52: Participant Health Insurance, by Hispanic/Non-Hispanic Status
Health Insurance by Hispanic/Latino
Origin*
Hispanic/Latino (n=1,110)
%
Non-Hispanic (n=1,411)
%
Total (n=2,521)
%
No 16.4 8.8 12.3 Yes 83.6 91.2 87.8 Total 100.0 100.0 100.0
* Statistically significant, using Pearson Chi-square test at p < .05 level. Source: National Survey of WIC Participants II: Participant Characteristics Report
With regard to primary language of the household, English speaking participants were significantly more likely to have health insurance coverage (92.0%) than participants who primarily spoke Spanish (80.2%) or other languages (79.7%) (Exhibit 3.53).
Exhibit 3.53: Participant Health Insurance, by Language
Health Insurance by Primary Language *
English (n=1,628)
%
Spanish (n=768)
%
Others (n=139)
%
Total (n=2,535)
%
No 8.0 19.9 20.4 12.2 Yes 92.0 80.2 79.7 87.8 Total 100.0 100.0 100.0 100.0
* Statistically significant, using Pearson Chi-square test at p < .05 level.
Source: National Survey of WIC Participants II: Participant Characteristics Report
The rate of insurance coverage is fairly high among WIC participants regardless of area of residence. However, significantly more participants in non-metropolitan areas (92.7%) have health insurance than those in metropolitan areas (86.1%) (Exhibit 3.54).
Exhibit 3.54: Participant Health Insurance, by Metropolitan Area
Health Insurance by Metro/Non-Metro
Residence*
Metro (n=568)
%
Non-Metro (n=1,967)
%
Total (n=2,535)
%
No 13.9 7.3 12.3 Yes 86.1 92.7 87.7 Total 100.0 100.0 100.0
* Statistically significant, Chi-square = 19.02, p < .05.
Source: National Survey of WIC Participants II: Participant Characteristics Report
Finally, findings on health insurance by race (Exhibit 3.55) show that the range of coverage is between 82.4 percent and 93.6 percent, with American Indians/Alaska Natives having the highest (93.6%) followed by African American participants (92.2%). Other or multiracial has the lowest at 82.4% percent. (Appendix E, Tables 30 and 31 for further details.)
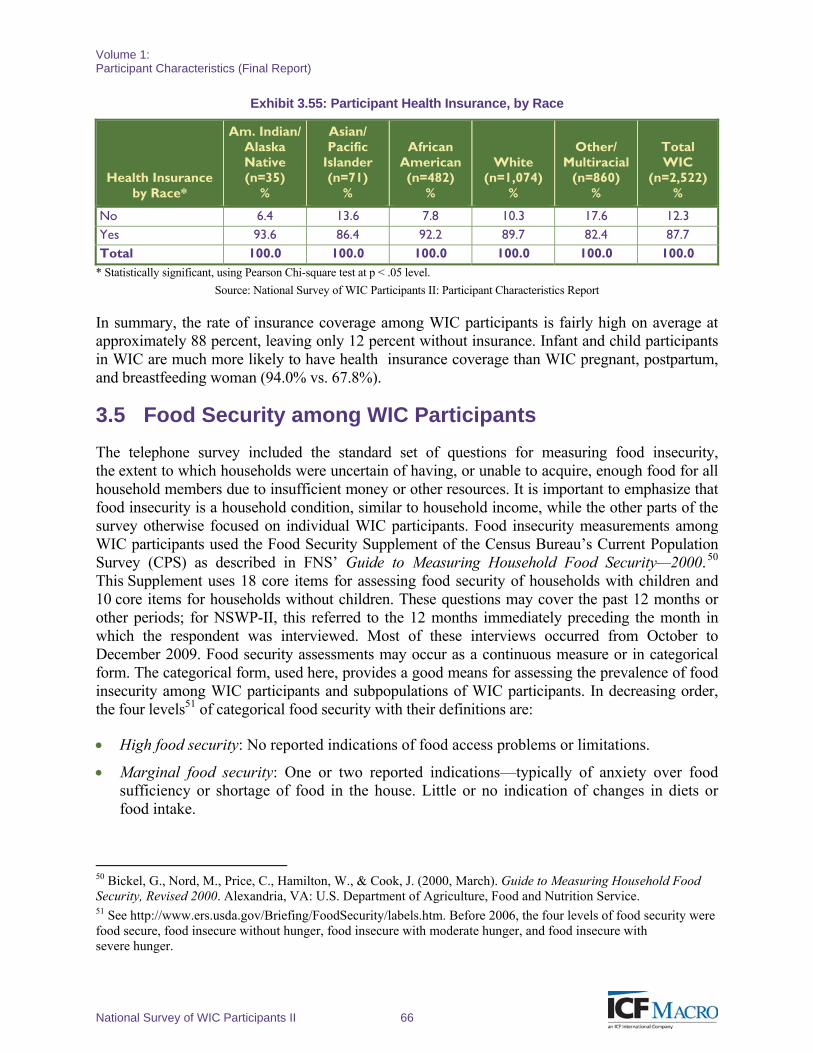
Volume 1: Participant Characteristics (Final Report)
National Survey of WIC Participants II 66
Exhibit 3.55: Participant Health Insurance, by Race
Health Insurance by Race*
Am. Indian/ Alaska Native (n=35)
%
Asian/ Pacific
Islander (n=71)
%
African American (n=482)
%
White (n=1,074)
%
Other/ Multiracial
(n=860) %
Total WIC
(n=2,522) %
No 6.4 13.6 7.8 10.3 17.6 12.3 Yes 93.6 86.4 92.2 89.7 82.4 87.7 Total 100.0 100.0 100.0 100.0 100.0 100.0
* Statistically significant, using Pearson Chi-square test at p < .05 level.
Source: National Survey of WIC Participants II: Participant Characteristics Report
In summary, the rate of insurance coverage among WIC participants is fairly high on average at approximately 88 percent, leaving only 12 percent without insurance. Infant and child participants in WIC are much more likely to have health insurance coverage than WIC pregnant, postpartum, and breastfeeding woman (94.0% vs. 67.8%).
3.5 Food Security among WIC Participants
The telephone survey included the standard set of questions for measuring food insecurity, the extent to which households were uncertain of having, or unable to acquire, enough food for all household members due to insufficient money or other resources. It is important to emphasize that food insecurity is a household condition, similar to household income, while the other parts of the survey otherwise focused on individual WIC participants. Food insecurity measurements among WIC participants used the Food Security Supplement of the Census Bureau’s Current Population Survey (CPS) as described in FNS’ Guide to Measuring Household Food Security—2000. 50 This Supplement uses 18 core items for assessing food security of households with children and 10 core items for households without children. These questions may cover the past 12 months or other periods; for NSWP-II, this referred to the 12 months immediately preceding the month in which the respondent was interviewed. Most of these interviews occurred from October to December 2009. Food security assessments may occur as a continuous measure or in categorical form. The categorical form, used here, provides a good means for assessing the prevalence of food insecurity among WIC participants and subpopulations of WIC participants. In decreasing order, the four levels51 of categorical food security with their definitions are:
High food security: No reported indications of food access problems or limitations.
Marginal food security: One or two reported indications—typically of anxiety over food sufficiency or shortage of food in the house. Little or no indication of changes in diets or food intake.
50 Bickel, G., Nord, M., Price, C., Hamilton, W., & Cook, J. (2000, March). Guide to Measuring Household Food Security, Revised 2000. Alexandria, VA: U.S. Department of Agriculture, Food and Nutrition Service. 51 See http://www.ers.usda.gov/Briefing/FoodSecurity/labels.htm. Before 2006, the four levels of food security were food secure, food insecure without hunger, food insecure with moderate hunger, and food insecure with severe hunger.
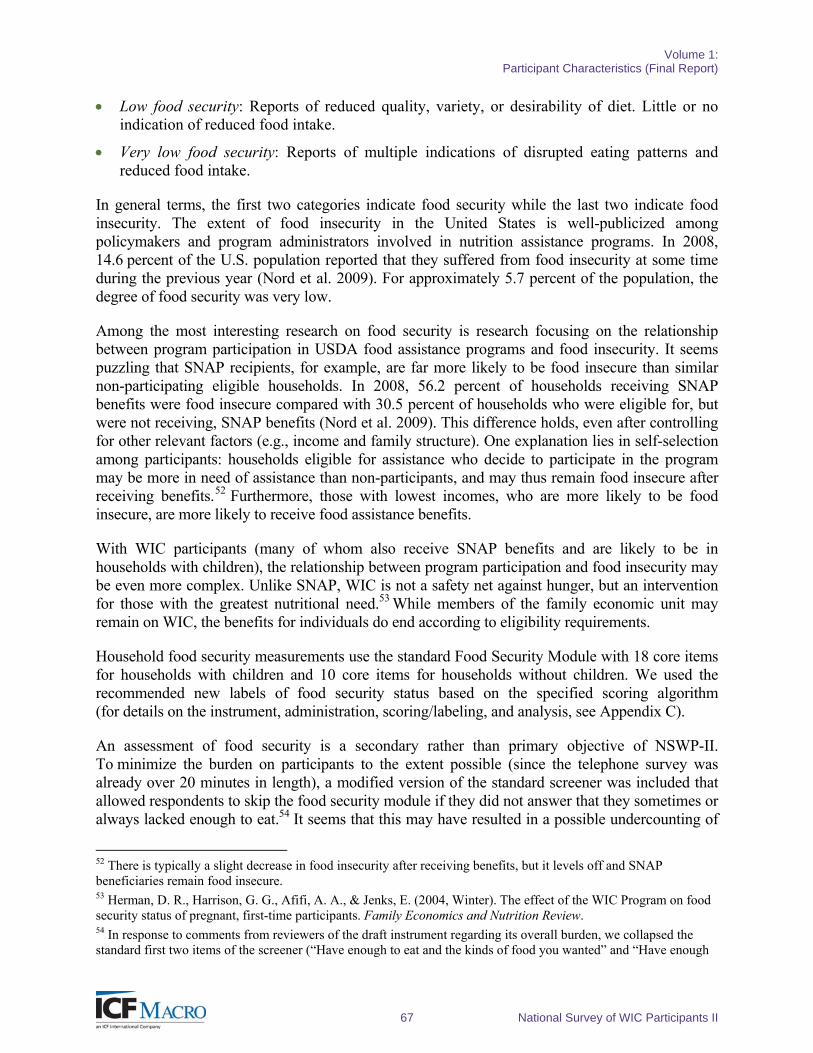
Volume 1: Participant Characteristics (Final Report)
67 National Survey of WIC Participants II
Low food security: Reports of reduced quality, variety, or desirability of diet. Little or no indication of reduced food intake.
Very low food security: Reports of multiple indications of disrupted eating patterns and reduced food intake.
In general terms, the first two categories indicate food security while the last two indicate food insecurity. The extent of food insecurity in the United States is well-publicized among policymakers and program administrators involved in nutrition assistance programs. In 2008, 14.6 percent of the U.S. population reported that they suffered from food insecurity at some time during the previous year (Nord et al. 2009). For approximately 5.7 percent of the population, the degree of food security was very low.
Among the most interesting research on food security is research focusing on the relationship between program participation in USDA food assistance programs and food insecurity. It seems puzzling that SNAP recipients, for example, are far more likely to be food insecure than similar non-participating eligible households. In 2008, 56.2 percent of households receiving SNAP benefits were food insecure compared with 30.5 percent of households who were eligible for, but were not receiving, SNAP benefits (Nord et al. 2009). This difference holds, even after controlling for other relevant factors (e.g., income and family structure). One explanation lies in self-selection among participants: households eligible for assistance who decide to participate in the program may be more in need of assistance than non-participants, and may thus remain food insecure after receiving benefits.52 Furthermore, those with lowest incomes, who are more likely to be food insecure, are more likely to receive food assistance benefits.
With WIC participants (many of whom also receive SNAP benefits and are likely to be in households with children), the relationship between program participation and food insecurity may be even more complex. Unlike SNAP, WIC is not a safety net against hunger, but an intervention for those with the greatest nutritional need.53 While members of the family economic unit may remain on WIC, the benefits for individuals do end according to eligibility requirements.
Household food security measurements use the standard Food Security Module with 18 core items for households with children and 10 core items for households without children. We used the recommended new labels of food security status based on the specified scoring algorithm (for details on the instrument, administration, scoring/labeling, and analysis, see Appendix C).
An assessment of food security is a secondary rather than primary objective of NSWP-II. To minimize the burden on participants to the extent possible (since the telephone survey was already over 20 minutes in length), a modified version of the standard screener was included that allowed respondents to skip the food security module if they did not answer that they sometimes or always lacked enough to eat.54 It seems that this may have resulted in a possible undercounting of
52 There is typically a slight decrease in food insecurity after receiving benefits, but it levels off and SNAP beneficiaries remain food insecure. 53 Herman, D. R., Harrison, G. G., Afifi, A. A., & Jenks, E. (2004, Winter). The effect of the WIC Program on food security status of pregnant, first-time participants. Family Economics and Nutrition Review. 54 In response to comments from reviewers of the draft instrument regarding its overall burden, we collapsed the standard first two items of the screener (“Have enough to eat and the kinds of food you wanted” and “Have enough
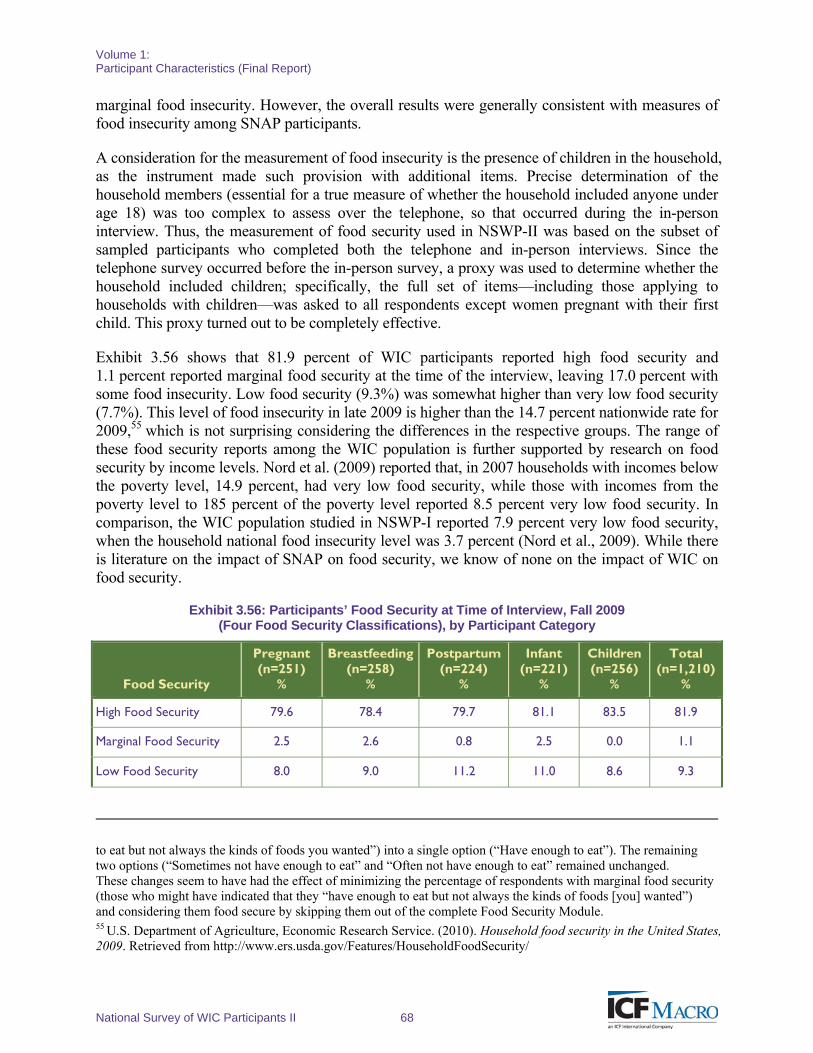
Volume 1: Participant Characteristics (Final Report)
National Survey of WIC Participants II 68
marginal food insecurity. However, the overall results were generally consistent with measures of food insecurity among SNAP participants.
A consideration for the measurement of food insecurity is the presence of children in the household, as the instrument made such provision with additional items. Precise determination of the household members (essential for a true measure of whether the household included anyone under age 18) was too complex to assess over the telephone, so that occurred during the in-person interview. Thus, the measurement of food security used in NSWP-II was based on the subset of sampled participants who completed both the telephone and in-person interviews. Since the telephone survey occurred before the in-person survey, a proxy was used to determine whether the household included children; specifically, the full set of items—including those applying to households with children—was asked to all respondents except women pregnant with their first child. This proxy turned out to be completely effective.
Exhibit 3.56 shows that 81.9 percent of WIC participants reported high food security and 1.1 percent reported marginal food security at the time of the interview, leaving 17.0 percent with some food insecurity. Low food security (9.3%) was somewhat higher than very low food security (7.7%). This level of food insecurity in late 2009 is higher than the 14.7 percent nationwide rate for 2009,55 which is not surprising considering the differences in the respective groups. The range of these food security reports among the WIC population is further supported by research on food security by income levels. Nord et al. (2009) reported that, in 2007 households with incomes below the poverty level, 14.9 percent, had very low food security, while those with incomes from the poverty level to 185 percent of the poverty level reported 8.5 percent very low food security. In comparison, the WIC population studied in NSWP-I reported 7.9 percent very low food security, when the household national food insecurity level was 3.7 percent (Nord et al., 2009). While there is literature on the impact of SNAP on food security, we know of none on the impact of WIC on food security.
Exhibit 3.56: Participants’ Food Security at Time of Interview, Fall 2009 (Four Food Security Classifications), by Participant Category
Food Security
Pregnant (n=251)
%
Breastfeeding (n=258)
%
Postpartum (n=224)
%
Infant (n=221)
%
Children (n=256)
%
Total (n=1,210)
%
High Food Security 79.6 78.4 79.7 81.1 83.5 81.9
Marginal Food Security 2.5 2.6 0.8 2.5 0.0 1.1
Low Food Security 8.0 9.0 11.2 11.0 8.6 9.3
to eat but not always the kinds of foods you wanted”) into a single option (“Have enough to eat”). The remaining two options (“Sometimes not have enough to eat” and “Often not have enough to eat” remained unchanged. These changes seem to have had the effect of minimizing the percentage of respondents with marginal food security (those who might have indicated that they “have enough to eat but not always the kinds of foods [you] wanted”) and considering them food secure by skipping them out of the complete Food Security Module. 55 U.S. Department of Agriculture, Economic Research Service. (2010). Household food security in the United States, 2009. Retrieved from http://www.ers.usda.gov/Features/HouseholdFoodSecurity/
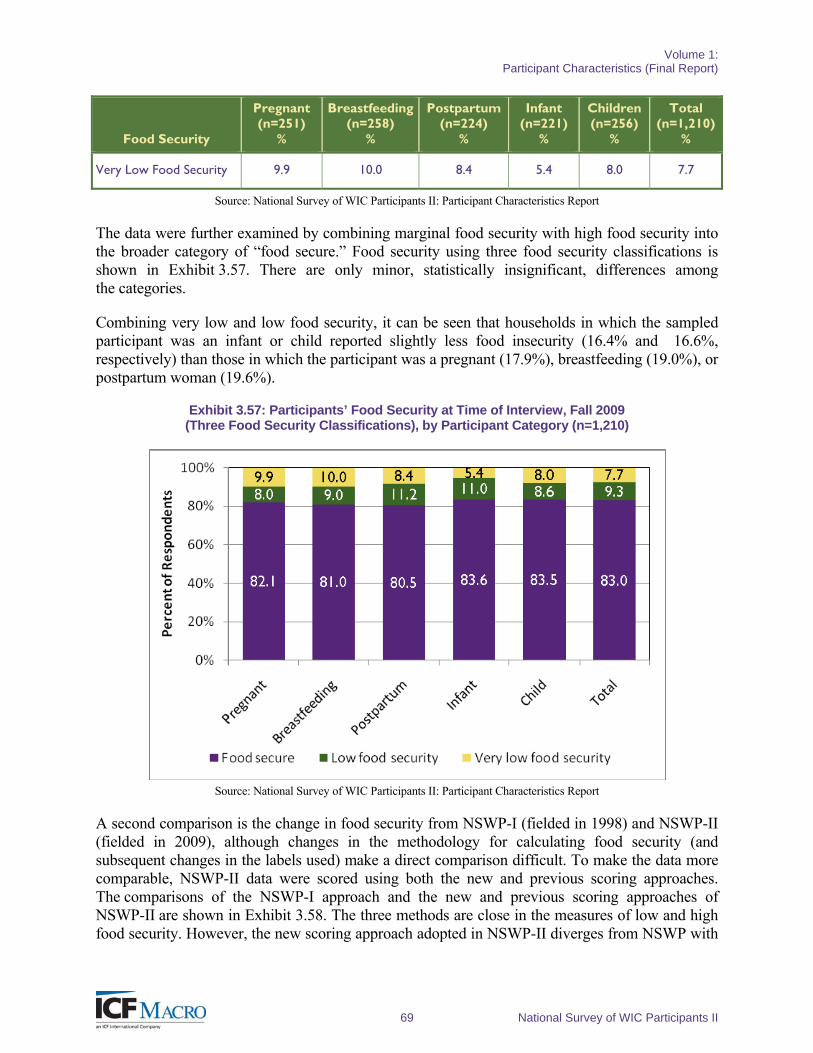
Volume 1: Participant Characteristics (Final Report)
69 National Survey of WIC Participants II
Food Security
Pregnant (n=251)
%
Breastfeeding (n=258)
%
Postpartum (n=224)
%
Infant (n=221)
%
Children (n=256)
%
Total (n=1,210)
%
Very Low Food Security 9.9 10.0 8.4 5.4 8.0 7.7
Source: National Survey of WIC Participants II: Participant Characteristics Report
The data were further examined by combining marginal food security with high food security into the broader category of “food secure.” Food security using three food security classifications is shown in Exhibit 3.57. There are only minor, statistically insignificant, differences among the categories.
Combining very low and low food security, it can be seen that households in which the sampled participant was an infant or child reported slightly less food insecurity (16.4% and 16.6%, respectively) than those in which the participant was a pregnant (17.9%), breastfeeding (19.0%), or postpartum woman (19.6%).
Exhibit 3.57: Participants’ Food Security at Time of Interview, Fall 2009 (Three Food Security Classifications), by Participant Category (n=1,210)
Source: National Survey of WIC Participants II: Participant Characteristics Report
A second comparison is the change in food security from NSWP-I (fielded in 1998) and NSWP-II (fielded in 2009), although changes in the methodology for calculating food security (and subsequent changes in the labels used) make a direct comparison difficult. To make the data more comparable, NSWP-II data were scored using both the new and previous scoring approaches. The comparisons of the NSWP-I approach and the new and previous scoring approaches of NSWP-II are shown in Exhibit 3.58. The three methods are close in the measures of low and high food security. However, the new scoring approach adopted in NSWP-II diverges from NSWP with
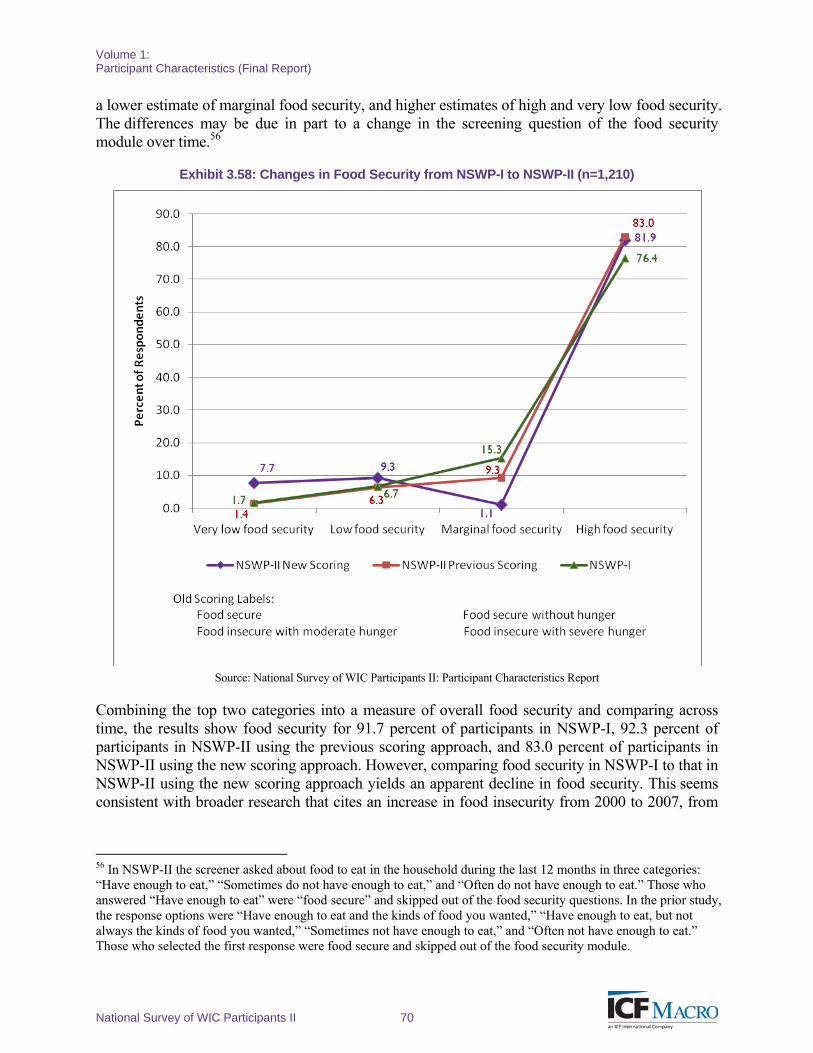
Volume 1: Participant Characteristics (Final Report)
National Survey of WIC Participants II 70
a lower estimate of marginal food security, and higher estimates of high and very low food security. The differences may be due in part to a change in the screening question of the food security module over time.56
Exhibit 3.58: Changes in Food Security from NSWP-I to NSWP-II (n=1,210)
Source: National Survey of WIC Participants II: Participant Characteristics Report
Combining the top two categories into a measure of overall food security and comparing across time, the results show food security for 91.7 percent of participants in NSWP-I, 92.3 percent of participants in NSWP-II using the previous scoring approach, and 83.0 percent of participants in NSWP-II using the new scoring approach. However, comparing food security in NSWP-I to that in NSWP-II using the new scoring approach yields an apparent decline in food security. This seems consistent with broader research that cites an increase in food insecurity from 2000 to 2007, from
56 In NSWP-II the screener asked about food to eat in the household during the last 12 months in three categories: “Have enough to eat,” “Sometimes do not have enough to eat,” and “Often do not have enough to eat.” Those who answered “Have enough to eat” were “food secure” and skipped out of the food security questions. In the prior study, the response options were “Have enough to eat and the kinds of food you wanted,” “Have enough to eat, but not always the kinds of food you wanted,” “Sometimes not have enough to eat,” and “Often not have enough to eat.” Those who selected the first response were food secure and skipped out of the food security module.
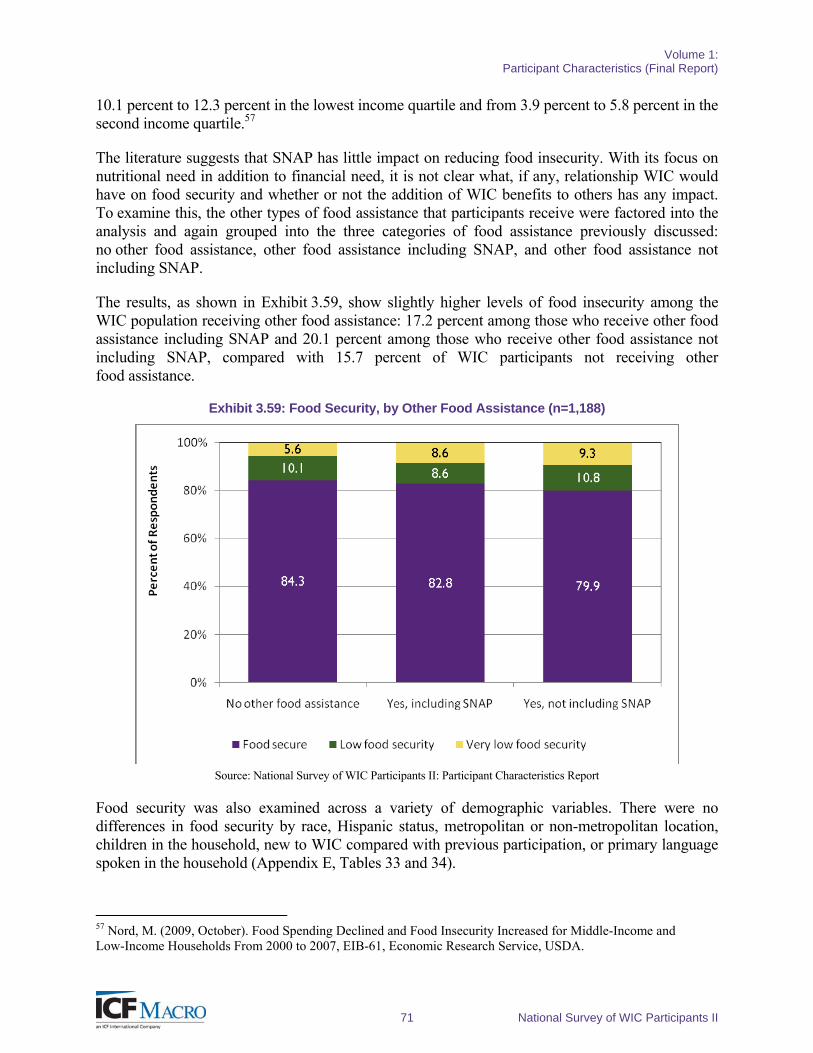
Volume 1: Participant Characteristics (Final Report)
71 National Survey of WIC Participants II
10.1 percent to 12.3 percent in the lowest income quartile and from 3.9 percent to 5.8 percent in the second income quartile.57
The literature suggests that SNAP has little impact on reducing food insecurity. With its focus on nutritional need in addition to financial need, it is not clear what, if any, relationship WIC would have on food security and whether or not the addition of WIC benefits to others has any impact. To examine this, the other types of food assistance that participants receive were factored into the analysis and again grouped into the three categories of food assistance previously discussed: no other food assistance, other food assistance including SNAP, and other food assistance not including SNAP.
The results, as shown in Exhibit 3.59, show slightly higher levels of food insecurity among the WIC population receiving other food assistance: 17.2 percent among those who receive other food assistance including SNAP and 20.1 percent among those who receive other food assistance not including SNAP, compared with 15.7 percent of WIC participants not receiving other food assistance.
Exhibit 3.59: Food Security, by Other Food Assistance (n=1,188)
Source: National Survey of WIC Participants II: Participant Characteristics Report
Food security was also examined across a variety of demographic variables. There were no differences in food security by race, Hispanic status, metropolitan or non-metropolitan location, children in the household, new to WIC compared with previous participation, or primary language spoken in the household (Appendix E, Tables 33 and 34).
57 Nord, M. (2009, October). Food Spending Declined and Food Insecurity Increased for Middle-Income and Low-Income Households From 2000 to 2007, EIB-61, Economic Research Service, USDA.
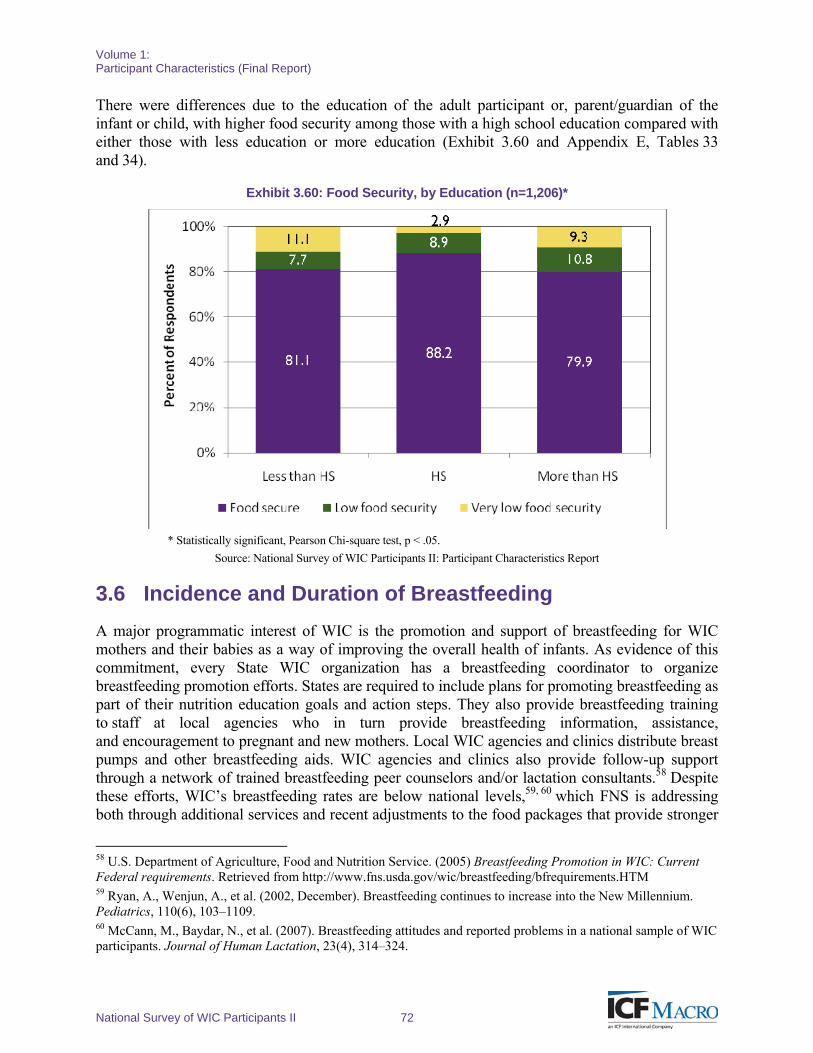
Volume 1: Participant Characteristics (Final Report)
National Survey of WIC Participants II 72
There were differences due to the education of the adult participant or, parent/guardian of the infant or child, with higher food security among those with a high school education compared with either those with less education or more education (Exhibit 3.60 and Appendix E, Tables 33 and 34).
Exhibit 3.60: Food Security, by Education (n=1,206)*
* Statistically significant, Pearson Chi-square test, p < .05.
Source: National Survey of WIC Participants II: Participant Characteristics Report
3.6 Incidence and Duration of Breastfeeding
A major programmatic interest of WIC is the promotion and support of breastfeeding for WIC mothers and their babies as a way of improving the overall health of infants. As evidence of this commitment, every State WIC organization has a breastfeeding coordinator to organize breastfeeding promotion efforts. States are required to include plans for promoting breastfeeding as part of their nutrition education goals and action steps. They also provide breastfeeding training to staff at local agencies who in turn provide breastfeeding information, assistance, and encouragement to pregnant and new mothers. Local WIC agencies and clinics distribute breast pumps and other breastfeeding aids. WIC agencies and clinics also provide follow-up support through a network of trained breastfeeding peer counselors and/or lactation consultants.58 Despite these efforts, WIC’s breastfeeding rates are below national levels,59, 60 which FNS is addressing both through additional services and recent adjustments to the food packages that provide stronger
58 U.S. Department of Agriculture, Food and Nutrition Service. (2005) Breastfeeding Promotion in WIC: Current Federal requirements. Retrieved from http://www.fns.usda.gov/wic/breastfeeding/bfrequirements.HTM 59 Ryan, A., Wenjun, A., et al. (2002, December). Breastfeeding continues to increase into the New Millennium. Pediatrics, 110(6), 103–1109. 60 McCann, M., Baydar, N., et al. (2007). Breastfeeding attitudes and reported problems in a national sample of WIC participants. Journal of Human Lactation, 23(4), 314–324.
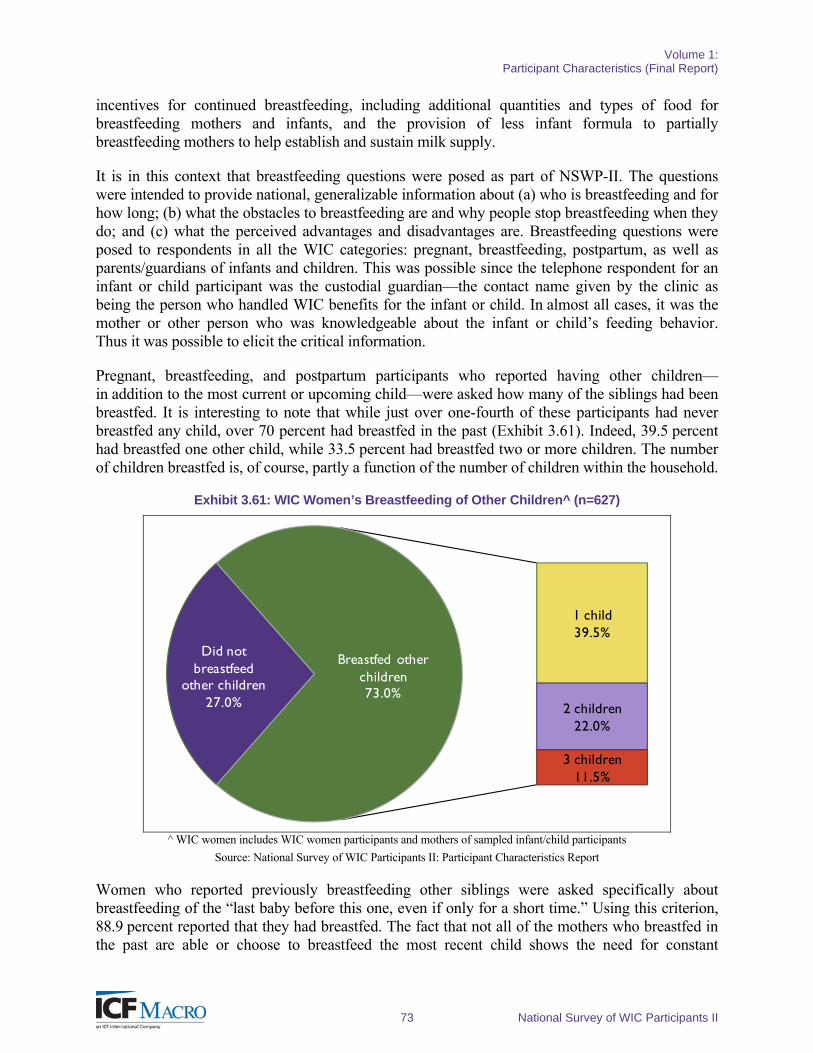
Volume 1: Participant Characteristics (Final Report)
73 National Survey of WIC Participants II
incentives for continued breastfeeding, including additional quantities and types of food for breastfeeding mothers and infants, and the provision of less infant formula to partially breastfeeding mothers to help establish and sustain milk supply.
It is in this context that breastfeeding questions were posed as part of NSWP-II. The questions were intended to provide national, generalizable information about (a) who is breastfeeding and for how long; (b) what the obstacles to breastfeeding are and why people stop breastfeeding when they do; and (c) what the perceived advantages and disadvantages are. Breastfeeding questions were posed to respondents in all the WIC categories: pregnant, breastfeeding, postpartum, as well as parents/guardians of infants and children. This was possible since the telephone respondent for an infant or child participant was the custodial guardian—the contact name given by the clinic as being the person who handled WIC benefits for the infant or child. In almost all cases, it was the mother or other person who was knowledgeable about the infant or child’s feeding behavior. Thus it was possible to elicit the critical information.
Pregnant, breastfeeding, and postpartum participants who reported having other children—in addition to the most current or upcoming child—were asked how many of the siblings had been breastfed. It is interesting to note that while just over one-fourth of these participants had never breastfed any child, over 70 percent had breastfed in the past (Exhibit 3.61). Indeed, 39.5 percent had breastfed one other child, while 33.5 percent had breastfed two or more children. The number of children breastfed is, of course, partly a function of the number of children within the household.
Exhibit 3.61: WIC Women’s Breastfeeding of Other Children^ (n=627)
Did not breastfeed
other children27.0%
1 child39.5%
2 children22.0%
3 children11.5%
Breastfed other children73.0%
^ WIC women includes WIC women participants and mothers of sampled infant/child participants
Source: National Survey of WIC Participants II: Participant Characteristics Report
Women who reported previously breastfeeding other siblings were asked specifically about breastfeeding of the “last baby before this one, even if only for a short time.” Using this criterion, 88.9 percent reported that they had breastfed. The fact that not all of the mothers who breastfed in the past are able or choose to breastfeed the most recent child shows the need for constant
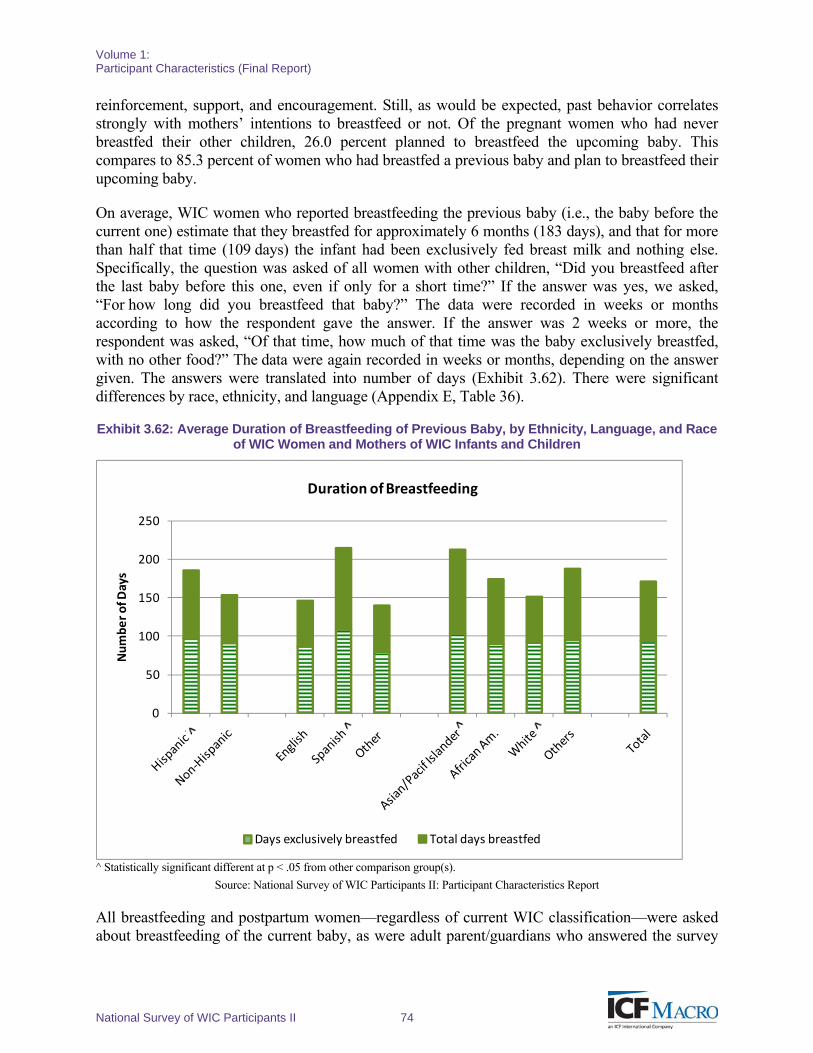
Volume 1: Participant Characteristics (Final Report)
National Survey of WIC Participants II 74
reinforcement, support, and encouragement. Still, as would be expected, past behavior correlates strongly with mothers’ intentions to breastfeed or not. Of the pregnant women who had never breastfed their other children, 26.0 percent planned to breastfeed the upcoming baby. This compares to 85.3 percent of women who had breastfed a previous baby and plan to breastfeed their upcoming baby.
On average, WIC women who reported breastfeeding the previous baby (i.e., the baby before the current one) estimate that they breastfed for approximately 6 months (183 days), and that for more than half that time (109 days) the infant had been exclusively fed breast milk and nothing else. Specifically, the question was asked of all women with other children, “Did you breastfeed after the last baby before this one, even if only for a short time?” If the answer was yes, we asked, “For how long did you breastfeed that baby?” The data were recorded in weeks or months according to how the respondent gave the answer. If the answer was 2 weeks or more, the respondent was asked, “Of that time, how much of that time was the baby exclusively breastfed, with no other food?” The data were again recorded in weeks or months, depending on the answer given. The answers were translated into number of days (Exhibit 3.62). There were significant differences by race, ethnicity, and language (Appendix E, Table 36).
Exhibit 3.62: Average Duration of Breastfeeding of Previous Baby, by Ethnicity, Language, and Race of WIC Women and Mothers of WIC Infants and Children
0
50
100
150
200
250
Number of D
ays
Duration of Breastfeeding
Days exclusively breastfed Total days breastfed
^ Statistically significant different at p < .05 from other comparison group(s).
Source: National Survey of WIC Participants II: Participant Characteristics Report
All breastfeeding and postpartum women—regardless of current WIC classification—were asked about breastfeeding of the current baby, as were adult parent/guardians who answered the survey
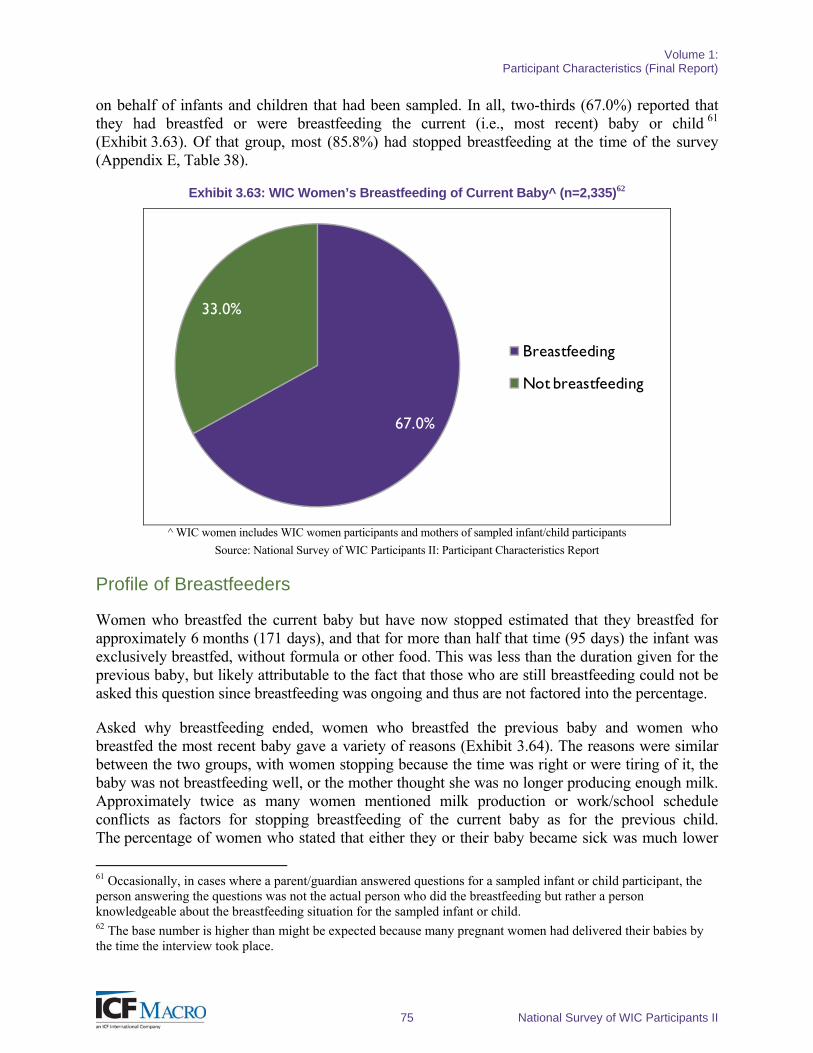
Volume 1: Participant Characteristics (Final Report)
75 National Survey of WIC Participants II
on behalf of infants and children that had been sampled. In all, two-thirds (67.0%) reported that they had breastfed or were breastfeeding the current (i.e., most recent) baby or child 61 (Exhibit 3.63). Of that group, most (85.8%) had stopped breastfeeding at the time of the survey (Appendix E, Table 38).
Exhibit 3.63: WIC Women’s Breastfeeding of Current Baby^ (n=2,335)62
67.0%
33.0%
Breastfeeding
Not breastfeeding
^ WIC women includes WIC women participants and mothers of sampled infant/child participants
Source: National Survey of WIC Participants II: Participant Characteristics Report
Profile of Breastfeeders
Women who breastfed the current baby but have now stopped estimated that they breastfed for approximately 6 months (171 days), and that for more than half that time (95 days) the infant was exclusively breastfed, without formula or other food. This was less than the duration given for the previous baby, but likely attributable to the fact that those who are still breastfeeding could not be asked this question since breastfeeding was ongoing and thus are not factored into the percentage.
Asked why breastfeeding ended, women who breastfed the previous baby and women who breastfed the most recent baby gave a variety of reasons (Exhibit 3.64). The reasons were similar between the two groups, with women stopping because the time was right or were tiring of it, the baby was not breastfeeding well, or the mother thought she was no longer producing enough milk. Approximately twice as many women mentioned milk production or work/school schedule conflicts as factors for stopping breastfeeding of the current baby as for the previous child. The percentage of women who stated that either they or their baby became sick was much lower
61 Occasionally, in cases where a parent/guardian answered questions for a sampled infant or child participant, the person answering the questions was not the actual person who did the breastfeeding but rather a person knowledgeable about the breastfeeding situation for the sampled infant or child. 62 The base number is higher than might be expected because many pregnant women had delivered their babies by the time the interview took place.
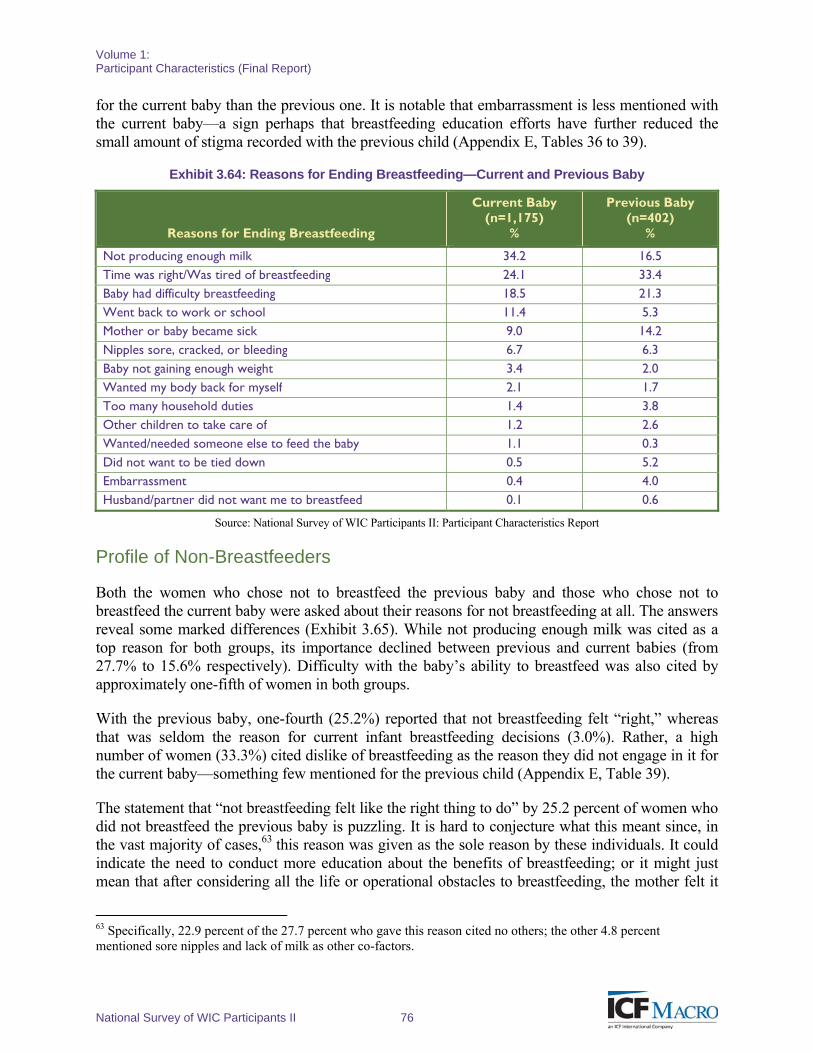
Volume 1: Participant Characteristics (Final Report)
National Survey of WIC Participants II 76
for the current baby than the previous one. It is notable that embarrassment is less mentioned with the current baby—a sign perhaps that breastfeeding education efforts have further reduced the small amount of stigma recorded with the previous child (Appendix E, Tables 36 to 39).
Exhibit 3.64: Reasons for Ending Breastfeeding—Current and Previous Baby
Reasons for Ending Breastfeeding
Current Baby (n=1,175)
%
Previous Baby (n=402)
%
Not producing enough milk 34.2 16.5 Time was right/Was tired of breastfeeding 24.1 33.4 Baby had difficulty breastfeeding 18.5 21.3 Went back to work or school 11.4 5.3 Mother or baby became sick 9.0 14.2 Nipples sore, cracked, or bleeding 6.7 6.3 Baby not gaining enough weight 3.4 2.0 Wanted my body back for myself 2.1 1.7 Too many household duties 1.4 3.8 Other children to take care of 1.2 2.6 Wanted/needed someone else to feed the baby 1.1 0.3 Did not want to be tied down 0.5 5.2 Embarrassment 0.4 4.0 Husband/partner did not want me to breastfeed 0.1 0.6
Source: National Survey of WIC Participants II: Participant Characteristics Report
Profile of Non-Breastfeeders
Both the women who chose not to breastfeed the previous baby and those who chose not to breastfeed the current baby were asked about their reasons for not breastfeeding at all. The answers reveal some marked differences (Exhibit 3.65). While not producing enough milk was cited as a top reason for both groups, its importance declined between previous and current babies (from 27.7% to 15.6% respectively). Difficulty with the baby’s ability to breastfeed was also cited by approximately one-fifth of women in both groups.
With the previous baby, one-fourth (25.2%) reported that not breastfeeding felt “right,” whereas that was seldom the reason for current infant breastfeeding decisions (3.0%). Rather, a high number of women (33.3%) cited dislike of breastfeeding as the reason they did not engage in it for the current baby—something few mentioned for the previous child (Appendix E, Table 39).
The statement that “not breastfeeding felt like the right thing to do” by 25.2 percent of women who did not breastfeed the previous baby is puzzling. It is hard to conjecture what this meant since, in the vast majority of cases,63 this reason was given as the sole reason by these individuals. It could indicate the need to conduct more education about the benefits of breastfeeding; or it might just mean that after considering all the life or operational obstacles to breastfeeding, the mother felt it
63 Specifically, 22.9 percent of the 27.7 percent who gave this reason cited no others; the other 4.8 percent mentioned sore nipples and lack of milk as other co-factors.
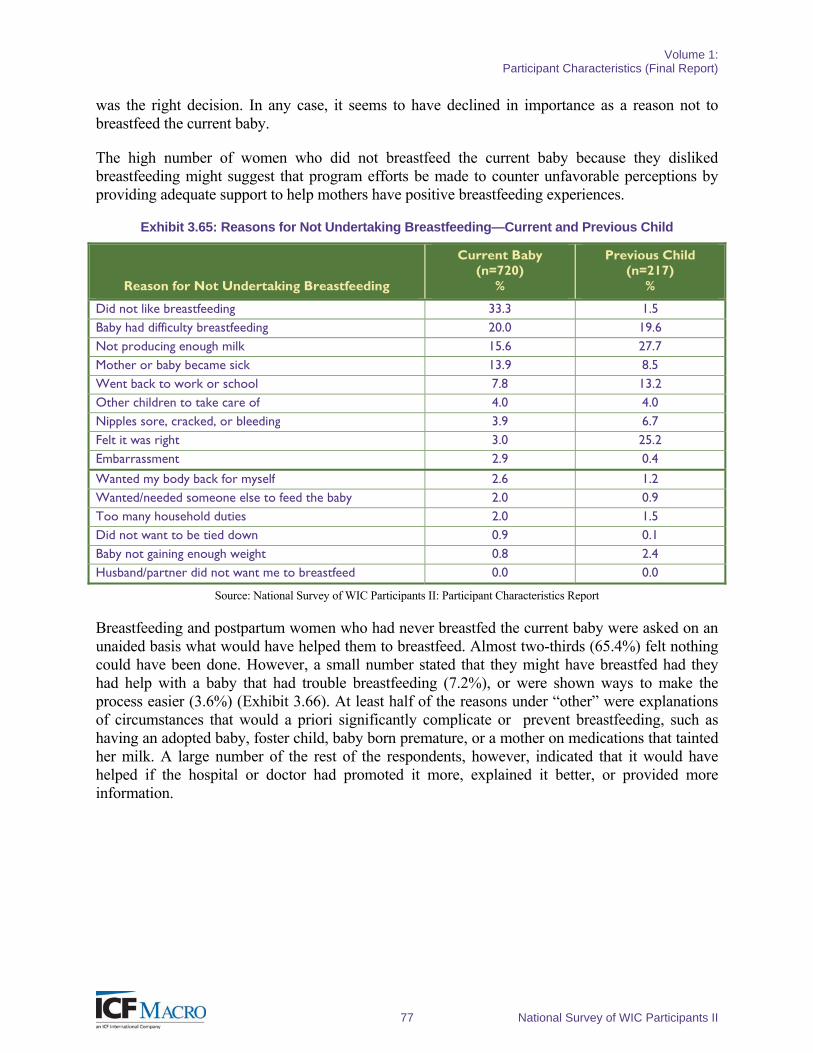
Volume 1: Participant Characteristics (Final Report)
77 National Survey of WIC Participants II
was the right decision. In any case, it seems to have declined in importance as a reason not to breastfeed the current baby.
The high number of women who did not breastfeed the current baby because they disliked breastfeeding might suggest that program efforts be made to counter unfavorable perceptions by providing adequate support to help mothers have positive breastfeeding experiences.
Exhibit 3.65: Reasons for Not Undertaking Breastfeeding—Current and Previous Child
Reason for Not Undertaking Breastfeeding
Current Baby (n=720)
%
Previous Child (n=217)
%
Did not like breastfeeding 33.3 1.5 Baby had difficulty breastfeeding 20.0 19.6 Not producing enough milk 15.6 27.7 Mother or baby became sick 13.9 8.5 Went back to work or school 7.8 13.2 Other children to take care of 4.0 4.0 Nipples sore, cracked, or bleeding 3.9 6.7 Felt it was right 3.0 25.2 Embarrassment 2.9 0.4
Wanted my body back for myself 2.6 1.2 Wanted/needed someone else to feed the baby 2.0 0.9 Too many household duties 2.0 1.5 Did not want to be tied down 0.9 0.1 Baby not gaining enough weight 0.8 2.4 Husband/partner did not want me to breastfeed 0.0 0.0
Source: National Survey of WIC Participants II: Participant Characteristics Report
Breastfeeding and postpartum women who had never breastfed the current baby were asked on an unaided basis what would have helped them to breastfeed. Almost two-thirds (65.4%) felt nothing could have been done. However, a small number stated that they might have breastfed had they had help with a baby that had trouble breastfeeding (7.2%), or were shown ways to make the process easier (3.6%) (Exhibit 3.66). At least half of the reasons under “other” were explanations of circumstances that would a priori significantly complicate or prevent breastfeeding, such as having an adopted baby, foster child, baby born premature, or a mother on medications that tainted her milk. A large number of the rest of the respondents, however, indicated that it would have helped if the hospital or doctor had promoted it more, explained it better, or provided more information.

Volume 1: Participant Characteristics (Final Report)
National Survey of WIC Participants II 78
Exhibit 3.66: What Could Have Helped Non-Breastfeeding Women to Breastfeed
Items Mentioned
Non-Breastfeeding Women (n=738)
%
Nothing 65.4 Help with a baby that had trouble breastfeeding 7.2 Show me ways to make it easier 3.6 Tell me how to work it into my schedule 2.2 Show me ways to make it hurt less 2.1 Show me how to pump milk 1.2 Other 18.3 Total 100.0
Source: National Survey of WIC Participants II: Participant Characteristics Report
Plans to Breastfeed
Between the time that the sample was drawn and when data collection took place, 63.0 percent of the pregnant respondents had, in fact, delivered their babies. Of those classified as “Pregnant” who had not yet delivered, 70.2 percent reported that they planned to breastfeed. As seen in Exhibit 3.67, most of these women (54.4%) planned to breastfeed 6 months or less, and very few (2.3%) planned to exceed 1 year. Interestingly, a sizable minority (21.3%) had not decided. It seemed that this group would be taking their breastfeeding a day at a time, continuing as long as it worked out from a logistical perspective.
Exhibit 3.67: Months that Pregnant WIC Participants’ Plan to Breastfeed (n=133)*
25.3%
29.1%
4.1%
17.8%
2.3%
21.3%< 3 months
4-6 months
7-9 months
10-12 months
1 year +
Don't know
* Base is Pregnant women who have not yet delivered.
Source: National Survey of WIC Participants II: Participant Characteristics Report
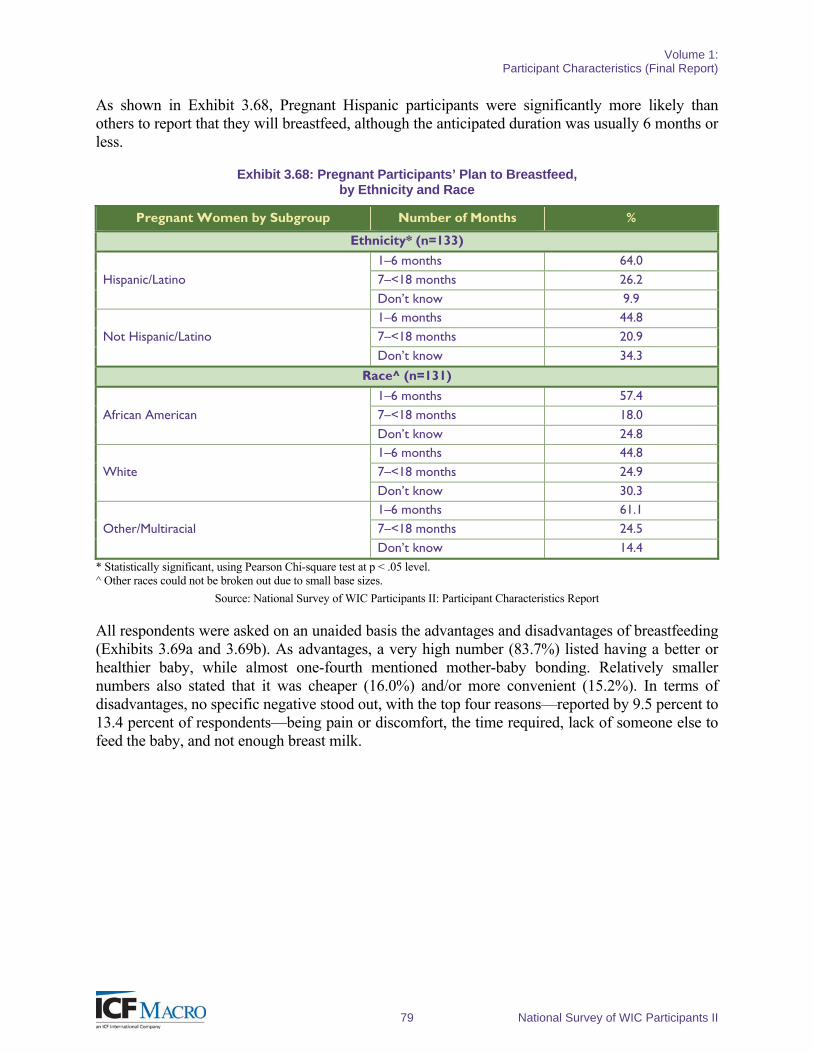
Volume 1: Participant Characteristics (Final Report)
79 National Survey of WIC Participants II
As shown in Exhibit 3.68, Pregnant Hispanic participants were significantly more likely than others to report that they will breastfeed, although the anticipated duration was usually 6 months or less.
Exhibit 3.68: Pregnant Participants’ Plan to Breastfeed, by Ethnicity and Race
Pregnant Women by Subgroup Number of Months %
Ethnicity* (n=133)
Hispanic/Latino 1–6 months 64.0 7–<18 months 26.2 Don’t know 9.9
Not Hispanic/Latino 1–6 months 44.8 7–<18 months 20.9 Don’t know 34.3
Race^ (n=131)
African American 1–6 months 57.4 7–<18 months 18.0 Don’t know 24.8
White 1–6 months 44.8 7–<18 months 24.9 Don’t know 30.3
Other/Multiracial 1–6 months 61.1 7–<18 months 24.5 Don’t know 14.4
* Statistically significant, using Pearson Chi-square test at p < .05 level. ^ Other races could not be broken out due to small base sizes.
Source: National Survey of WIC Participants II: Participant Characteristics Report
All respondents were asked on an unaided basis the advantages and disadvantages of breastfeeding (Exhibits 3.69a and 3.69b). As advantages, a very high number (83.7%) listed having a better or healthier baby, while almost one-fourth mentioned mother-baby bonding. Relatively smaller numbers also stated that it was cheaper (16.0%) and/or more convenient (15.2%). In terms of disadvantages, no specific negative stood out, with the top four reasons—reported by 9.5 percent to 13.4 percent of respondents—being pain or discomfort, the time required, lack of someone else to feed the baby, and not enough breast milk.
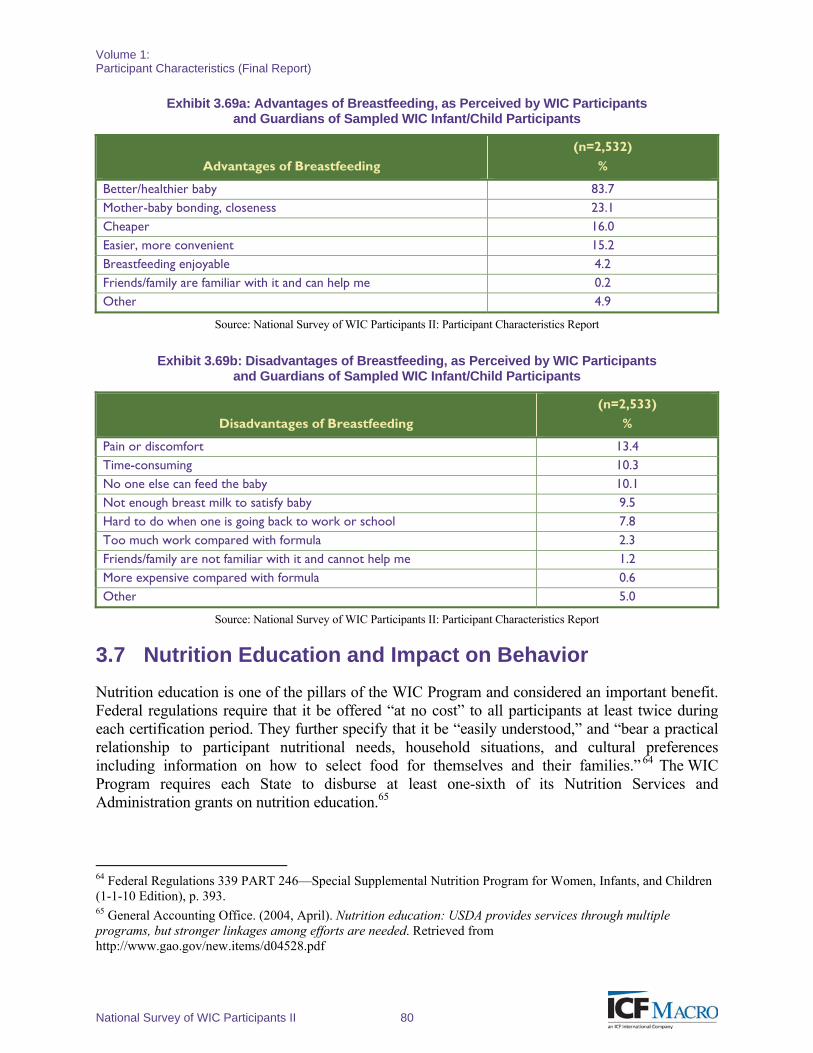
Volume 1: Participant Characteristics (Final Report)
National Survey of WIC Participants II 80
Exhibit 3.69a: Advantages of Breastfeeding, as Perceived by WIC Participants and Guardians of Sampled WIC Infant/Child Participants
Advantages of Breastfeeding
(n=2,532)
%
Better/healthier baby 83.7 Mother-baby bonding, closeness 23.1 Cheaper 16.0 Easier, more convenient 15.2 Breastfeeding enjoyable 4.2 Friends/family are familiar with it and can help me 0.2 Other 4.9
Source: National Survey of WIC Participants II: Participant Characteristics Report
Exhibit 3.69b: Disadvantages of Breastfeeding, as Perceived by WIC Participants and Guardians of Sampled WIC Infant/Child Participants
Disadvantages of Breastfeeding
(n=2,533)
%
Pain or discomfort 13.4 Time-consuming 10.3 No one else can feed the baby 10.1 Not enough breast milk to satisfy baby 9.5 Hard to do when one is going back to work or school 7.8 Too much work compared with formula 2.3 Friends/family are not familiar with it and cannot help me 1.2 More expensive compared with formula 0.6 Other 5.0
Source: National Survey of WIC Participants II: Participant Characteristics Report
3.7 Nutrition Education and Impact on Behavior
Nutrition education is one of the pillars of the WIC Program and considered an important benefit. Federal regulations require that it be offered “at no cost” to all participants at least twice during each certification period. They further specify that it be “easily understood,” and “bear a practical relationship to participant nutritional needs, household situations, and cultural preferences including information on how to select food for themselves and their families.” 64 The WIC Program requires each State to disburse at least one-sixth of its Nutrition Services and Administration grants on nutrition education.65
64 Federal Regulations 339 PART 246—Special Supplemental Nutrition Program for Women, Infants, and Children (1-1-10 Edition), p. 393. 65 General Accounting Office. (2004, April). Nutrition education: USDA provides services through multiple programs, but stronger linkages among efforts are needed. Retrieved from http://www.gao.gov/new.items/d04528.pdf
Volume 1: Participant Characteristics (Final Report)
81 National Survey of WIC Participants II
Generally offered through group training sessions and one-on-one counseling, nutrition services are pivotal in educating communities about the important role good nutrition plays in the development of healthy children and prevention of diet-related conditions, such as diabetes and hypertension. WIC clinics provide nutrition education at the time of certification and throughout the enrollment period.
Attendance at Group Education Sessions
Respondents were asked if they had attended any group education sessions that were recommended by WIC staff. As shown in Exhibit 3.70, more than one-third of the respondents (37.9%) indicated that they had attended at least one such seminar. These respondents were asked about the topics of the sessions, whether the session had influenced them to make any lifestyle changes, and then either what lifestyle changes they had made or reasons for not making changes.66 While differences in attendance were found among various demographic groups, no statistically significant differences were found across WIC participant categories. The highest attendance was among participants whose primary language was Spanish (50.3%)—or, Hispanic/Latino participants (49.2%)—and participants classified as other or mixed races (49.4%). Among the racial groups, the lowest percentages attending any group session were American Indian participants (18.1%) and African American participants (31.8%).
Topics Chosen
The topic areas covered during the education session included meal preparation, breastfeeding, healthy lifestyle, educating one’s child, accessing or making use of other social services, disciplining one’s child, and smoking cessation. The topic with highest attendance, 83.5 percent, was nutrition/nutritious meal preparation; the high attendance for this topic was consistent across all demographic groups, with no significant differences observed (Appendix E, Tables 18 and 19).
66 Estimates for changes in lifestyle resulting from participation in educational sessions among American Indians cannot be included because only eight unweighted respondents in the race category participated.
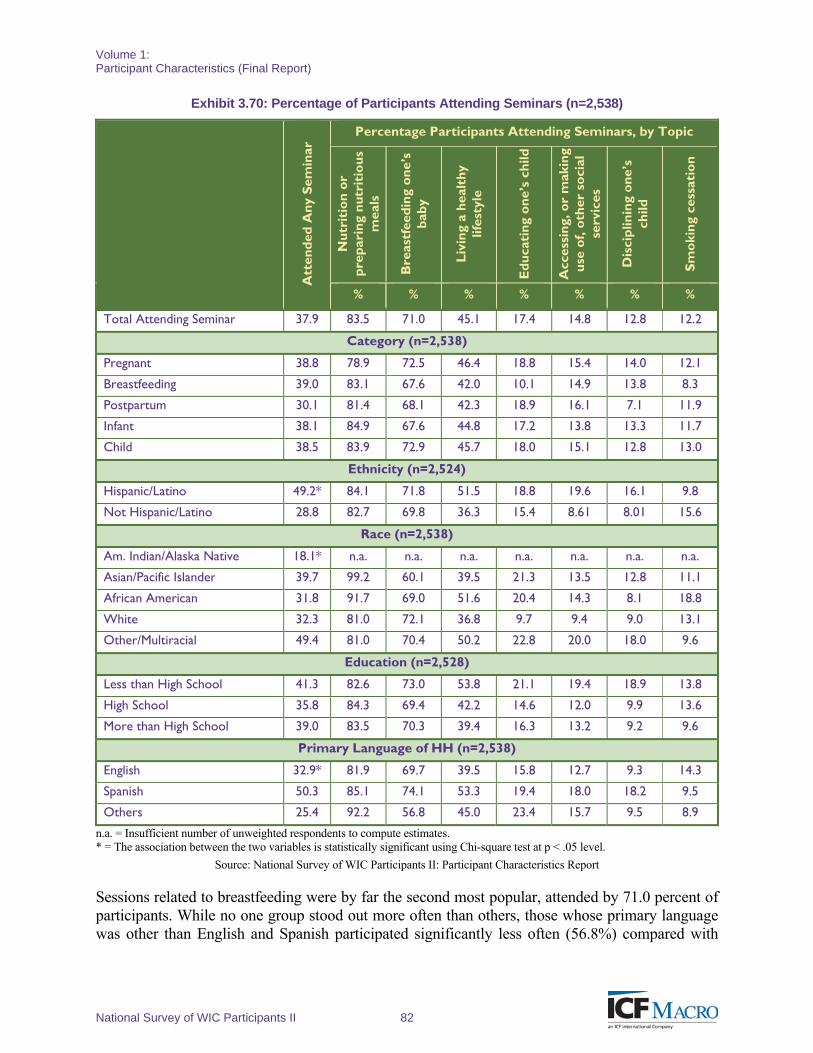
Volume 1: Participant Characteristics (Final Report)
National Survey of WIC Participants II 82
Exhibit 3.70: Percentage of Participants Attending Seminars (n=2,538)
A
tten
ded
An
y S
emin
ar Percentage Participants Attending Seminars, by Topic
Nu
trit
ion
or
pre
par
ing
nut
riti
ou
s m
eals
Bre
astf
eed
ing
on
e’s
bab
y
Liv
ing
a h
ealt
hy
lifes
tyle
Ed
uca
ting
on
e’s
child
Acc
essi
ng,
or
mak
ing
use
of,
oth
er s
oci
al
serv
ices
Dis
cip
linin
g o
ne’
s ch
ild
Sm
oki
ng
cess
atio
n
% % % % % % %
Total Attending Seminar 37.9 83.5 71.0 45.1 17.4 14.8 12.8 12.2
Category (n=2,538)
Pregnant 38.8 78.9 72.5 46.4 18.8 15.4 14.0 12.1
Breastfeeding 39.0 83.1 67.6 42.0 10.1 14.9 13.8 8.3
Postpartum 30.1 81.4 68.1 42.3 18.9 16.1 7.1 11.9
Infant 38.1 84.9 67.6 44.8 17.2 13.8 13.3 11.7
Child 38.5 83.9 72.9 45.7 18.0 15.1 12.8 13.0
Ethnicity (n=2,524)
Hispanic/Latino 49.2* 84.1 71.8 51.5 18.8 19.6 16.1 9.8
Not Hispanic/Latino 28.8 82.7 69.8 36.3 15.4 8.61 8.01 15.6
Race (n=2,538)
Am. Indian/Alaska Native 18.1* n.a. n.a. n.a. n.a. n.a. n.a. n.a.
Asian/Pacific Islander 39.7 99.2 60.1 39.5 21.3 13.5 12.8 11.1
African American 31.8 91.7 69.0 51.6 20.4 14.3 8.1 18.8
White 32.3 81.0 72.1 36.8 9.7 9.4 9.0 13.1
Other/Multiracial 49.4 81.0 70.4 50.2 22.8 20.0 18.0 9.6
Education (n=2,528)
Less than High School 41.3 82.6 73.0 53.8 21.1 19.4 18.9 13.8
High School 35.8 84.3 69.4 42.2 14.6 12.0 9.9 13.6
More than High School 39.0 83.5 70.3 39.4 16.3 13.2 9.2 9.6
Primary Language of HH (n=2,538)
English 32.9* 81.9 69.7 39.5 15.8 12.7 9.3 14.3
Spanish 50.3 85.1 74.1 53.3 19.4 18.0 18.2 9.5
Others 25.4 92.2 56.8 45.0 23.4 15.7 9.5 8.9
n.a. = Insufficient number of unweighted respondents to compute estimates. * = The association between the two variables is statistically significant using Chi-square test at p < .05 level.
Source: National Survey of WIC Participants II: Participant Characteristics Report
Sessions related to breastfeeding were by far the second most popular, attended by 71.0 percent of participants. While no one group stood out more often than others, those whose primary language was other than English and Spanish participated significantly less often (56.8%) compared with
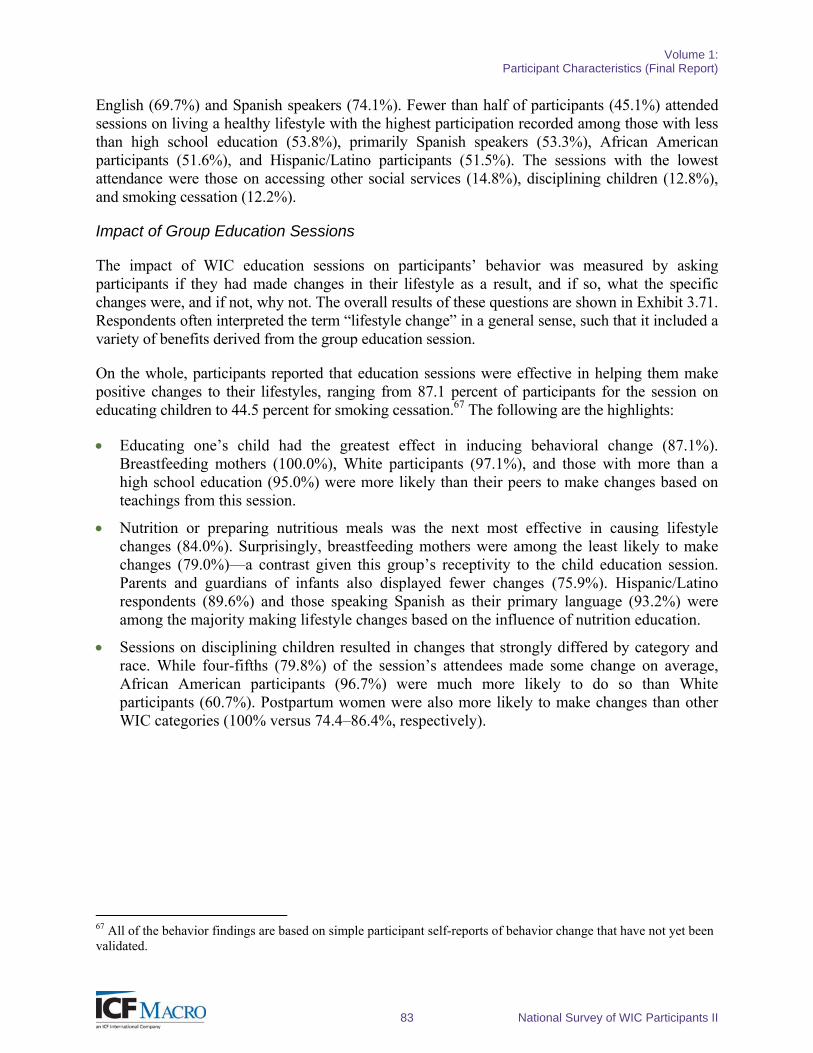
Volume 1: Participant Characteristics (Final Report)
83 National Survey of WIC Participants II
English (69.7%) and Spanish speakers (74.1%). Fewer than half of participants (45.1%) attended sessions on living a healthy lifestyle with the highest participation recorded among those with less than high school education (53.8%), primarily Spanish speakers (53.3%), African American participants (51.6%), and Hispanic/Latino participants (51.5%). The sessions with the lowest attendance were those on accessing other social services (14.8%), disciplining children (12.8%), and smoking cessation (12.2%).
Impact of Group Education Sessions
The impact of WIC education sessions on participants’ behavior was measured by asking participants if they had made changes in their lifestyle as a result, and if so, what the specific changes were, and if not, why not. The overall results of these questions are shown in Exhibit 3.71. Respondents often interpreted the term “lifestyle change” in a general sense, such that it included a variety of benefits derived from the group education session.
On the whole, participants reported that education sessions were effective in helping them make positive changes to their lifestyles, ranging from 87.1 percent of participants for the session on educating children to 44.5 percent for smoking cessation.67 The following are the highlights:
Educating one’s child had the greatest effect in inducing behavioral change (87.1%). Breastfeeding mothers (100.0%), White participants (97.1%), and those with more than a high school education (95.0%) were more likely than their peers to make changes based on teachings from this session.
Nutrition or preparing nutritious meals was the next most effective in causing lifestyle changes (84.0%). Surprisingly, breastfeeding mothers were among the least likely to make changes (79.0%)—a contrast given this group’s receptivity to the child education session. Parents and guardians of infants also displayed fewer changes (75.9%). Hispanic/Latino respondents (89.6%) and those speaking Spanish as their primary language (93.2%) were among the majority making lifestyle changes based on the influence of nutrition education.
Sessions on disciplining children resulted in changes that strongly differed by category and race. While four-fifths (79.8%) of the session’s attendees made some change on average, African American participants (96.7%) were much more likely to do so than White participants (60.7%). Postpartum women were also more likely to make changes than other WIC categories (100% versus 74.4–86.4%, respectively).
67 All of the behavior findings are based on simple participant self-reports of behavior change that have not yet been validated.
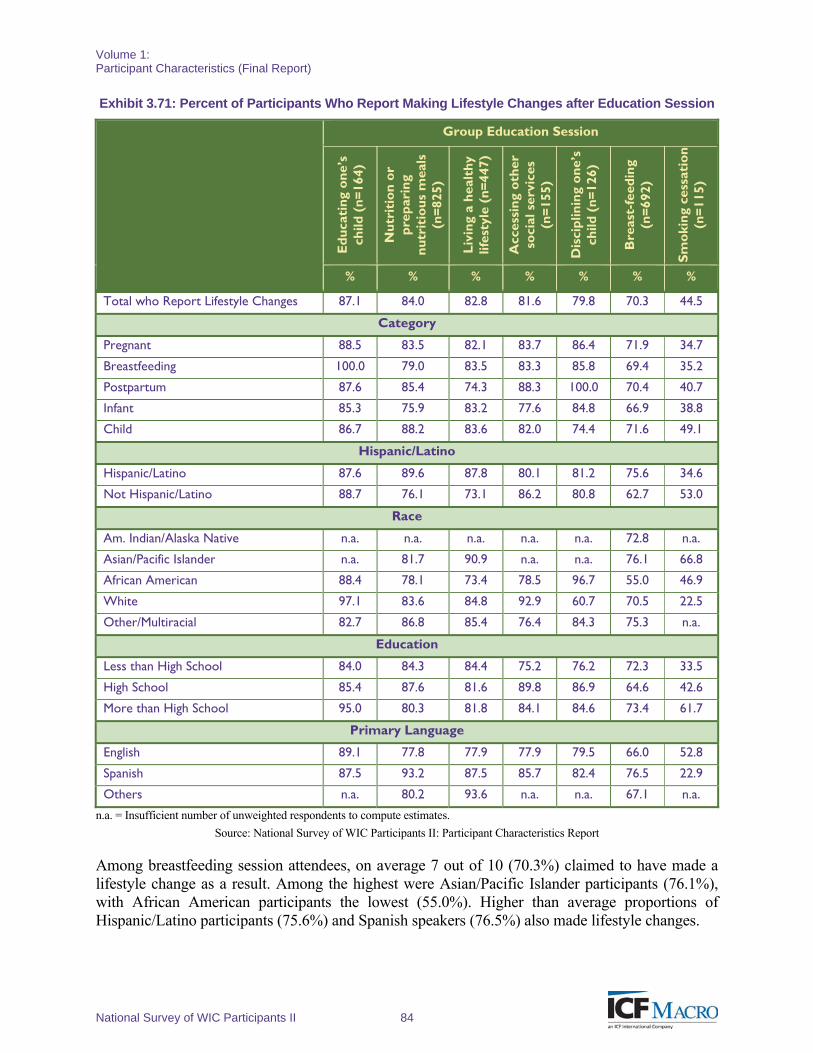
Volume 1: Participant Characteristics (Final Report)
National Survey of WIC Participants II 84
Exhibit 3.71: Percent of Participants Who Report Making Lifestyle Changes after Education Session
Group Education Session
Ed
uca
ting
on
e’s
child
(n
=16
4)
Nu
trit
ion
or
pre
par
ing
nu
trit
iou
s m
eals
(n
=82
5)
Liv
ing
a h
ealt
hy
lifes
tyle
(n
=44
7)
Acc
essi
ng
oth
er
soci
al s
ervi
ces
(n=
155)
Dis
cip
linin
g o
ne’
s ch
ild (
n=
126)
Bre
ast-
feed
ing
(n=
692)
Sm
oki
ng
cess
atio
n (n
=11
5)
% % % % % % %
Total who Report Lifestyle Changes 87.1 84.0 82.8 81.6 79.8 70.3 44.5
Category
Pregnant 88.5 83.5 82.1 83.7 86.4 71.9 34.7
Breastfeeding 100.0 79.0 83.5 83.3 85.8 69.4 35.2
Postpartum 87.6 85.4 74.3 88.3 100.0 70.4 40.7
Infant 85.3 75.9 83.2 77.6 84.8 66.9 38.8
Child 86.7 88.2 83.6 82.0 74.4 71.6 49.1
Hispanic/Latino
Hispanic/Latino 87.6 89.6 87.8 80.1 81.2 75.6 34.6
Not Hispanic/Latino 88.7 76.1 73.1 86.2 80.8 62.7 53.0
Race
Am. Indian/Alaska Native n.a. n.a. n.a. n.a. n.a. 72.8 n.a.
Asian/Pacific Islander n.a. 81.7 90.9 n.a. n.a. 76.1 66.8
African American 88.4 78.1 73.4 78.5 96.7 55.0 46.9
White 97.1 83.6 84.8 92.9 60.7 70.5 22.5
Other/Multiracial 82.7 86.8 85.4 76.4 84.3 75.3 n.a.
Education
Less than High School 84.0 84.3 84.4 75.2 76.2 72.3 33.5
High School 85.4 87.6 81.6 89.8 86.9 64.6 42.6
More than High School 95.0 80.3 81.8 84.1 84.6 73.4 61.7
Primary Language
English 89.1 77.8 77.9 77.9 79.5 66.0 52.8
Spanish 87.5 93.2 87.5 85.7 82.4 76.5 22.9
Others n.a. 80.2 93.6 n.a. n.a. 67.1 n.a.
n.a. = Insufficient number of unweighted respondents to compute estimates.
Source: National Survey of WIC Participants II: Participant Characteristics Report
Among breastfeeding session attendees, on average 7 out of 10 (70.3%) claimed to have made a lifestyle change as a result. Among the highest were Asian/Pacific Islander participants (76.1%), with African American participants the lowest (55.0%). Higher than average proportions of Hispanic/Latino participants (75.6%) and Spanish speakers (76.5%) also made lifestyle changes.
Volume 1: Participant Characteristics (Final Report)
85 National Survey of WIC Participants II
Attendees of education sessions on smoking cessation were the least likely to make subsequent lifestyle changes on average (44.5%). For these sessions, the sub-group reporting the most impact was Asian/Pacific Islander participants (66.8%). White participants (22.5%), Hispanic/Latino participants (34.6%), and Spanish speakers (22.9%) reported the least impact. For these two related groups (Hispanic/Latino participants and Spanish speakers), this is quite a contrast with their responses to other education sessions in which they showed more likelihood than other groups to make changes resulting from these sessions.
The next sections focus on the actual lifestyle changes made for those who did make a change, and reasons why others made no change. A recurring theme among those who did not make any change was that they felt they already knew the material that was covered, suggesting that, for them, the material covered could be more advanced, or they could be provided additional assistance in selecting the most appropriate sessions. To the WIC clinics’ credit, reasons for not making lifestyle changes were never related to perceived low quality of the subject matter or teachers (Appendix E, Tables 20 to 22 for more detailed breakouts).
Nutrition or Preparing Nutritious Meals
As previously noted, among participants attending any education session, more than four out of five (83.5%) attended sessions on nutrition or the preparation of nutritious meals. And among those respondents, a large majority (84.0%) reported making some lifestyle changes as a result. As shown in Exhibit 3.72, more than three-fourths (77.6%) of participants who had made lifestyle changes had altered their eating habits to include healthier foods. Approximately 15 percent of participants learned how to cook and prepare healthier meals.
Exhibit 3.72: Lifestyle Changes Made by Participants after Session(s) on Nutrition/Preparing Nutritious Meals (n=683)
77.6%
14.9%
6.8%
0.6%
Eating more healthy
How to cook healthy meals
Avoiding bad foods
Other
Source: National Survey of WIC Participants II: Participant Characteristics Report
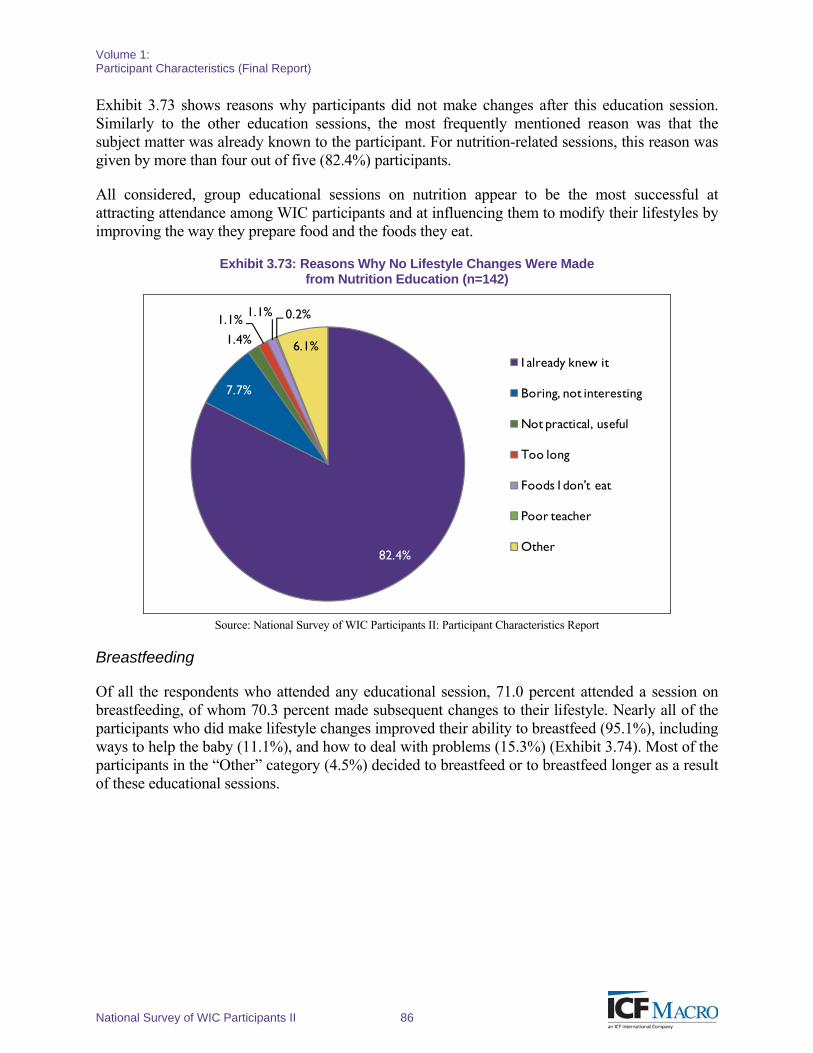
Volume 1: Participant Characteristics (Final Report)
National Survey of WIC Participants II 86
Exhibit 3.73 shows reasons why participants did not make changes after this education session. Similarly to the other education sessions, the most frequently mentioned reason was that the subject matter was already known to the participant. For nutrition-related sessions, this reason was given by more than four out of five (82.4%) participants.
All considered, group educational sessions on nutrition appear to be the most successful at attracting attendance among WIC participants and at influencing them to modify their lifestyles by improving the way they prepare food and the foods they eat.
Exhibit 3.73: Reasons Why No Lifestyle Changes Were Made from Nutrition Education (n=142)
82.4%
7.7%
1.4%
1.1%1.1% 0.2%
6.1%I already knew it
Boring, not interesting
Not practical, useful
Too long
Foods I don't eat
Poor teacher
Other
Source: National Survey of WIC Participants II: Participant Characteristics Report
Breastfeeding
Of all the respondents who attended any educational session, 71.0 percent attended a session on breastfeeding, of whom 70.3 percent made subsequent changes to their lifestyle. Nearly all of the participants who did make lifestyle changes improved their ability to breastfeed (95.1%), including ways to help the baby (11.1%), and how to deal with problems (15.3%) (Exhibit 3.74). Most of the participants in the “Other” category (4.5%) decided to breastfeed or to breastfeed longer as a result of these educational sessions.
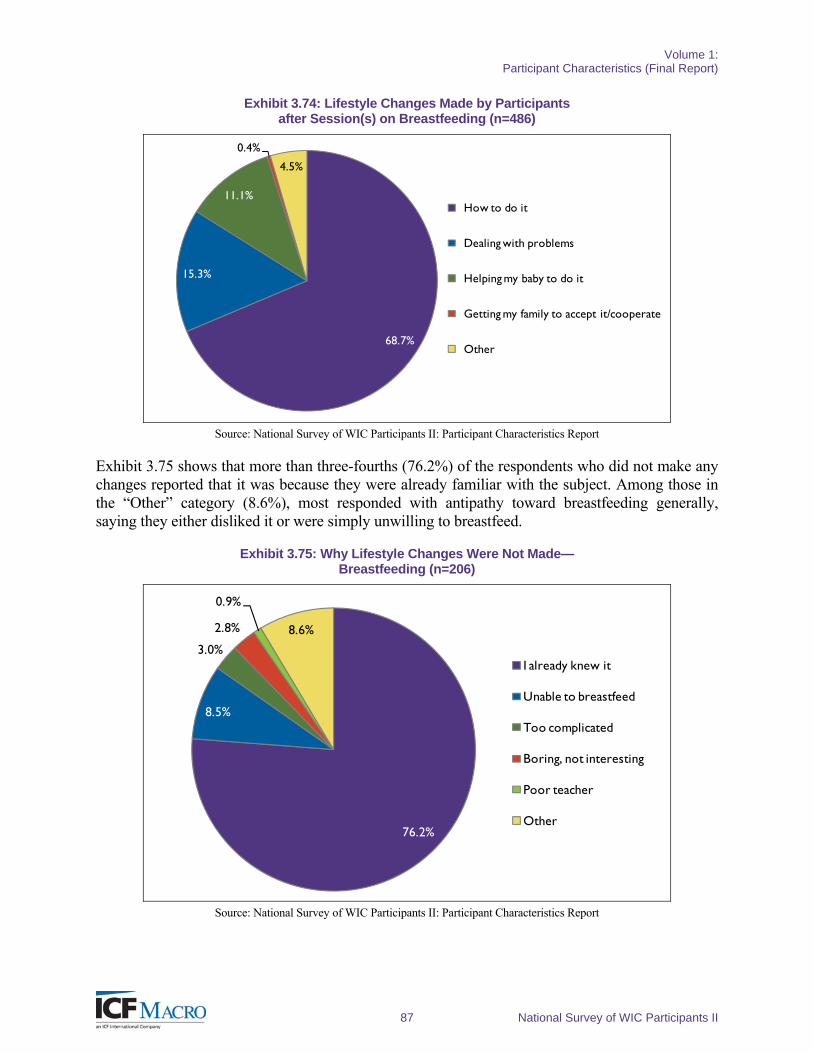
Volume 1: Participant Characteristics (Final Report)
87 National Survey of WIC Participants II
Exhibit 3.74: Lifestyle Changes Made by Participants after Session(s) on Breastfeeding (n=486)
68.7%
15.3%
11.1%
0.4%
4.5%
How to do it
Dealing with problems
Helping my baby to do it
Getting my family to accept it/cooperate
Other
Source: National Survey of WIC Participants II: Participant Characteristics Report
Exhibit 3.75 shows that more than three-fourths (76.2%) of the respondents who did not make any changes reported that it was because they were already familiar with the subject. Among those in the “Other” category (8.6%), most responded with antipathy toward breastfeeding generally, saying they either disliked it or were simply unwilling to breastfeed.
Exhibit 3.75: Why Lifestyle Changes Were Not Made— Breastfeeding (n=206)
76.2%
8.5%
3.0%
2.8%
0.9%
8.6%
I already knew it
Unable to breastfeed
Too complicated
Boring, not interesting
Poor teacher
Other
Source: National Survey of WIC Participants II: Participant Characteristics Report
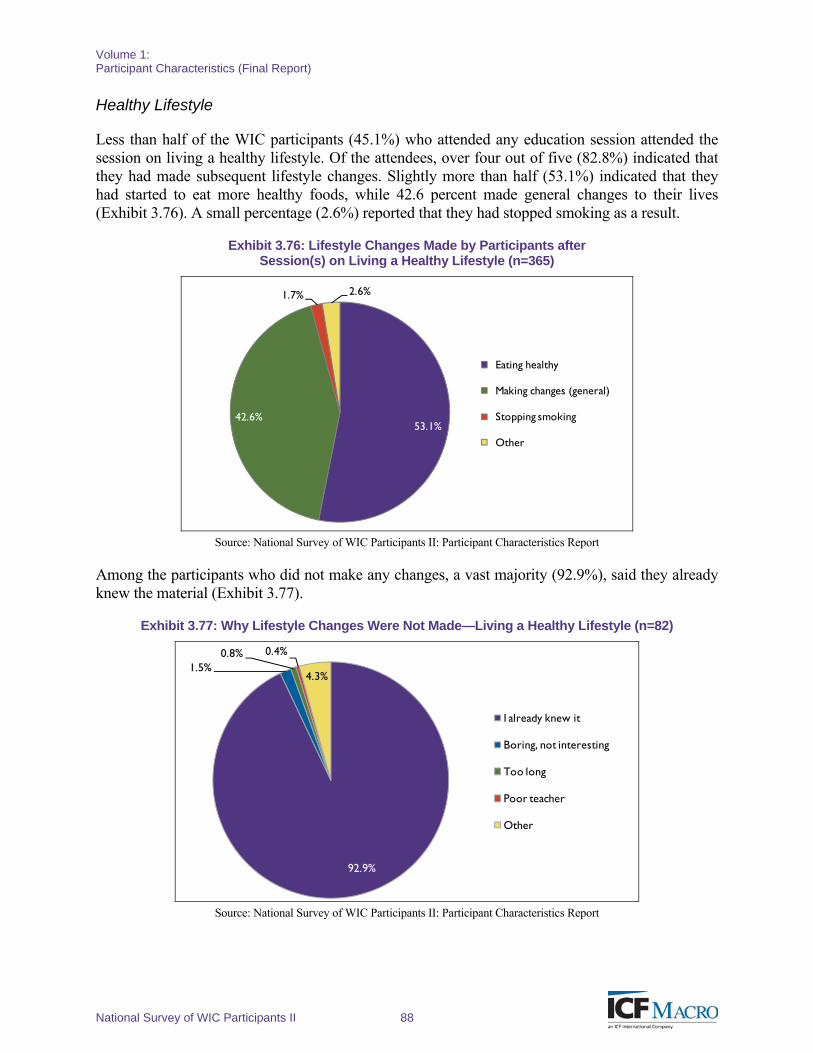
Volume 1: Participant Characteristics (Final Report)
National Survey of WIC Participants II 88
Healthy Lifestyle
Less than half of the WIC participants (45.1%) who attended any education session attended the session on living a healthy lifestyle. Of the attendees, over four out of five (82.8%) indicated that they had made subsequent lifestyle changes. Slightly more than half (53.1%) indicated that they had started to eat more healthy foods, while 42.6 percent made general changes to their lives (Exhibit 3.76). A small percentage (2.6%) reported that they had stopped smoking as a result.
Exhibit 3.76: Lifestyle Changes Made by Participants after Session(s) on Living a Healthy Lifestyle (n=365)
53.1%42.6%
1.7% 2.6%
Eating healthy
Making changes (general)
Stopping smoking
Other
Source: National Survey of WIC Participants II: Participant Characteristics Report
Among the participants who did not make any changes, a vast majority (92.9%), said they already knew the material (Exhibit 3.77).
Exhibit 3.77: Why Lifestyle Changes Were Not Made—Living a Healthy Lifestyle (n=82)
92.9%
1.5%0.8% 0.4%
4.3%
I already knew it
Boring, not interesting
Too long
Poor teacher
Other
Source: National Survey of WIC Participants II: Participant Characteristics Report
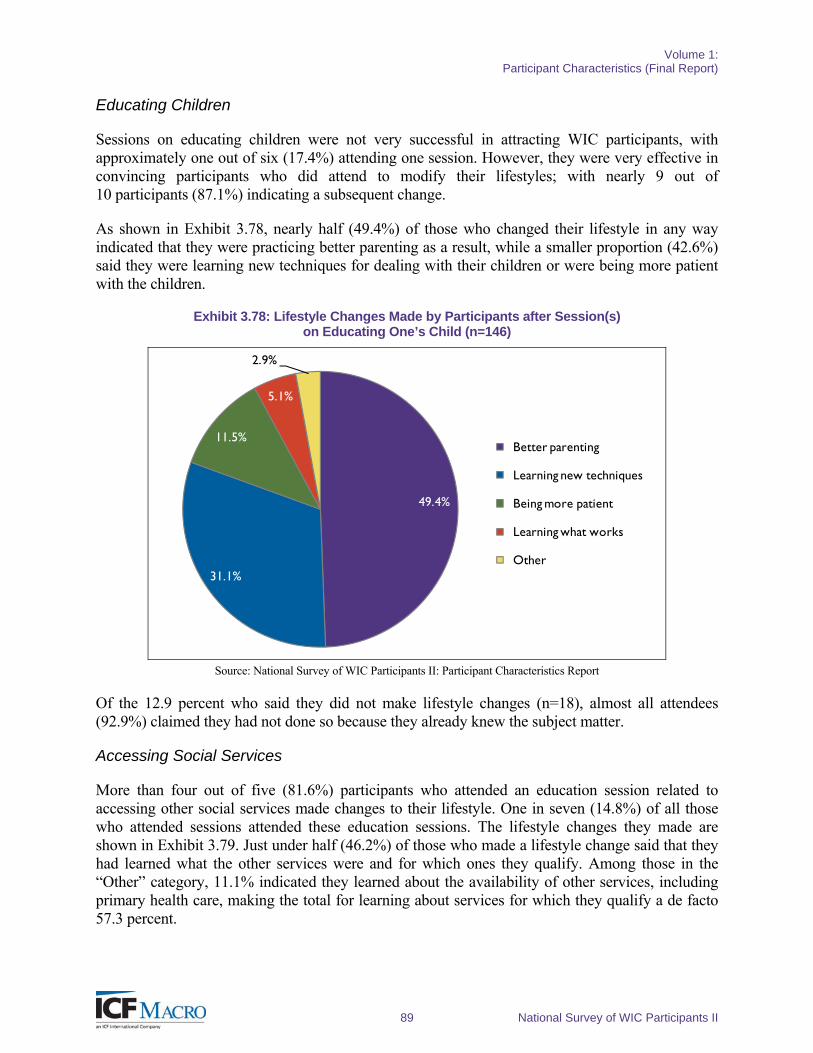
Volume 1: Participant Characteristics (Final Report)
89 National Survey of WIC Participants II
Educating Children
Sessions on educating children were not very successful in attracting WIC participants, with approximately one out of six (17.4%) attending one session. However, they were very effective in convincing participants who did attend to modify their lifestyles; with nearly 9 out of 10 participants (87.1%) indicating a subsequent change.
As shown in Exhibit 3.78, nearly half (49.4%) of those who changed their lifestyle in any way indicated that they were practicing better parenting as a result, while a smaller proportion (42.6%) said they were learning new techniques for dealing with their children or were being more patient with the children.
Exhibit 3.78: Lifestyle Changes Made by Participants after Session(s) on Educating One’s Child (n=146)
49.4%
31.1%
11.5%
5.1%
2.9%
Better parenting
Learning new techniques
Being more patient
Learning what works
Other
Source: National Survey of WIC Participants II: Participant Characteristics Report
Of the 12.9 percent who said they did not make lifestyle changes (n=18), almost all attendees (92.9%) claimed they had not done so because they already knew the subject matter.
Accessing Social Services
More than four out of five (81.6%) participants who attended an education session related to accessing other social services made changes to their lifestyle. One in seven (14.8%) of all those who attended sessions attended these education sessions. The lifestyle changes they made are shown in Exhibit 3.79. Just under half (46.2%) of those who made a lifestyle change said that they had learned what the other services were and for which ones they qualify. Among those in the “Other” category, 11.1% indicated they learned about the availability of other services, including primary health care, making the total for learning about services for which they qualify a de facto 57.3 percent.
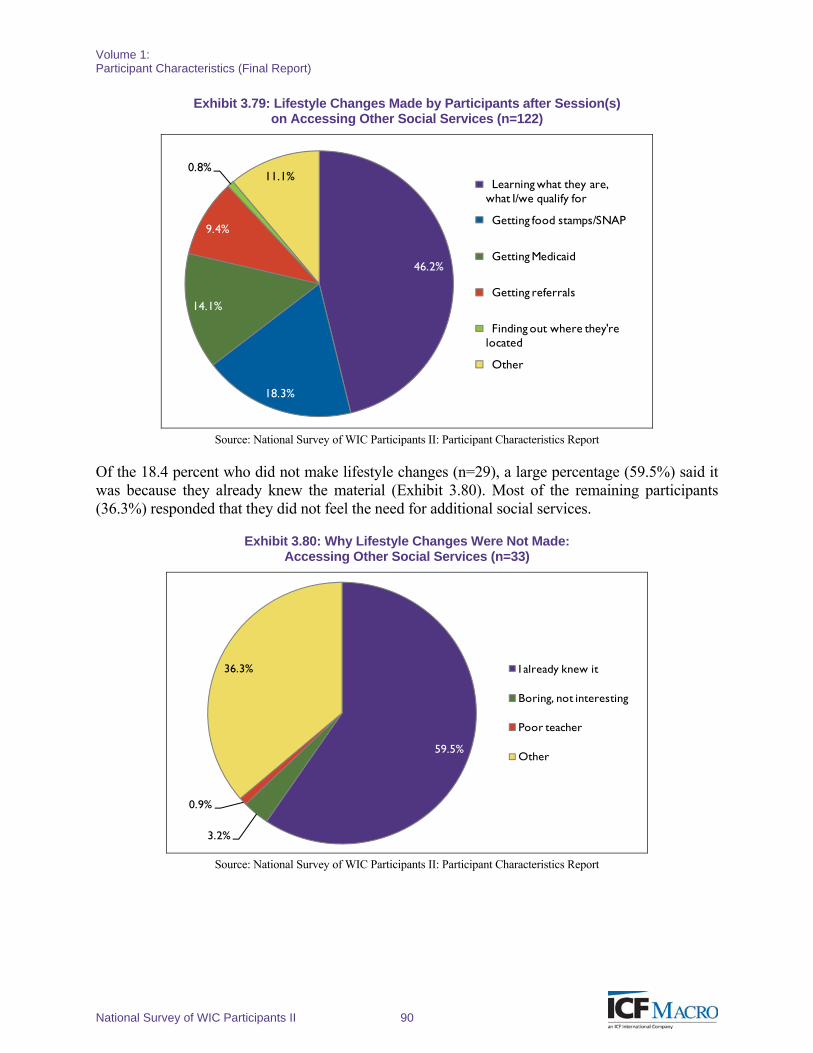
Volume 1: Participant Characteristics (Final Report)
National Survey of WIC Participants II 90
Exhibit 3.79: Lifestyle Changes Made by Participants after Session(s) on Accessing Other Social Services (n=122)
46.2%
18.3%
14.1%
9.4%
0.8%11.1%
Learning what they are, what I/we qualify for
Getting food stamps/SNAP
Getting Medicaid
Getting referrals
Finding out where they're located
Other
Source: National Survey of WIC Participants II: Participant Characteristics Report
Of the 18.4 percent who did not make lifestyle changes (n=29), a large percentage (59.5%) said it was because they already knew the material (Exhibit 3.80). Most of the remaining participants (36.3%) responded that they did not feel the need for additional social services.
Exhibit 3.80: Why Lifestyle Changes Were Not Made: Accessing Other Social Services (n=33)
59.5%
3.2%
0.9%
36.3% I already knew it
Boring, not interesting
Poor teacher
Other
Source: National Survey of WIC Participants II: Participant Characteristics Report
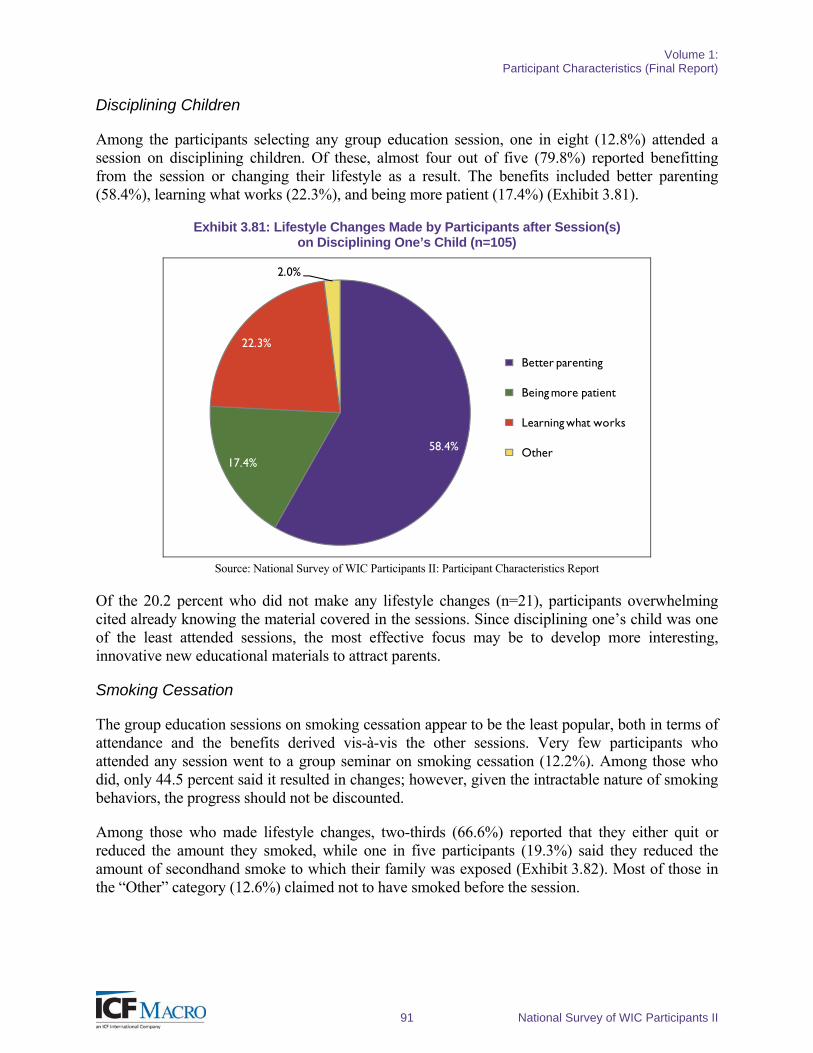
Volume 1: Participant Characteristics (Final Report)
91 National Survey of WIC Participants II
Disciplining Children
Among the participants selecting any group education session, one in eight (12.8%) attended a session on disciplining children. Of these, almost four out of five (79.8%) reported benefitting from the session or changing their lifestyle as a result. The benefits included better parenting (58.4%), learning what works (22.3%), and being more patient (17.4%) (Exhibit 3.81).
Exhibit 3.81: Lifestyle Changes Made by Participants after Session(s) on Disciplining One’s Child (n=105)
58.4%17.4%
22.3%
2.0%
Better parenting
Being more patient
Learning what works
Other
Source: National Survey of WIC Participants II: Participant Characteristics Report
Of the 20.2 percent who did not make any lifestyle changes (n=21), participants overwhelming cited already knowing the material covered in the sessions. Since disciplining one’s child was one of the least attended sessions, the most effective focus may be to develop more interesting, innovative new educational materials to attract parents.
Smoking Cessation
The group education sessions on smoking cessation appear to be the least popular, both in terms of attendance and the benefits derived vis-à-vis the other sessions. Very few participants who attended any session went to a group seminar on smoking cessation (12.2%). Among those who did, only 44.5 percent said it resulted in changes; however, given the intractable nature of smoking behaviors, the progress should not be discounted.
Among those who made lifestyle changes, two-thirds (66.6%) reported that they either quit or reduced the amount they smoked, while one in five participants (19.3%) said they reduced the amount of secondhand smoke to which their family was exposed (Exhibit 3.82). Most of those in the “Other” category (12.6%) claimed not to have smoked before the session.
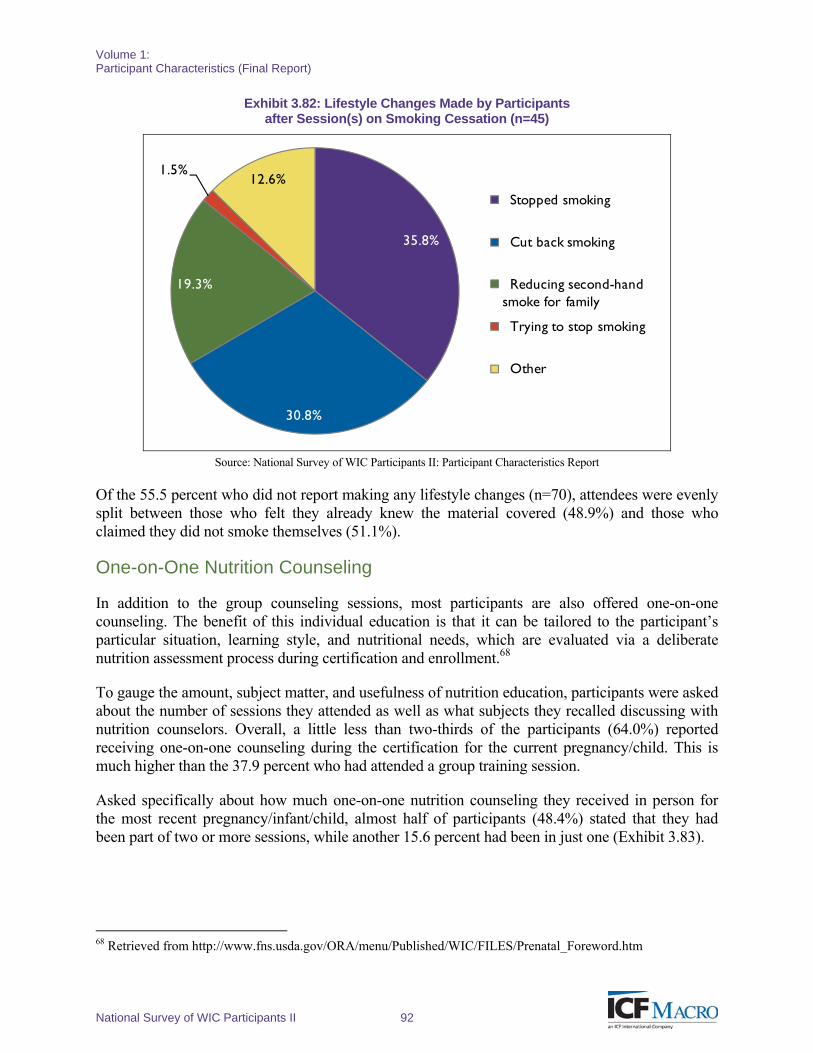
Volume 1: Participant Characteristics (Final Report)
National Survey of WIC Participants II 92
Exhibit 3.82: Lifestyle Changes Made by Participants after Session(s) on Smoking Cessation (n=45)
35.8%
30.8%
19.3%
1.5%12.6%
Stopped smoking
Cut back smoking
Reducing second-hand smoke for family
Trying to stop smoking
Other
Source: National Survey of WIC Participants II: Participant Characteristics Report
Of the 55.5 percent who did not report making any lifestyle changes (n=70), attendees were evenly split between those who felt they already knew the material covered (48.9%) and those who claimed they did not smoke themselves (51.1%).
One-on-One Nutrition Counseling
In addition to the group counseling sessions, most participants are also offered one-on-one counseling. The benefit of this individual education is that it can be tailored to the participant’s particular situation, learning style, and nutritional needs, which are evaluated via a deliberate nutrition assessment process during certification and enrollment.68
To gauge the amount, subject matter, and usefulness of nutrition education, participants were asked about the number of sessions they attended as well as what subjects they recalled discussing with nutrition counselors. Overall, a little less than two-thirds of the participants (64.0%) reported receiving one-on-one counseling during the certification for the current pregnancy/child. This is much higher than the 37.9 percent who had attended a group training session.
Asked specifically about how much one-on-one nutrition counseling they received in person for the most recent pregnancy/infant/child, almost half of participants (48.4%) stated that they had been part of two or more sessions, while another 15.6 percent had been in just one (Exhibit 3.83).
68 Retrieved from http://www.fns.usda.gov/ORA/menu/Published/WIC/FILES/Prenatal_Foreword.htm
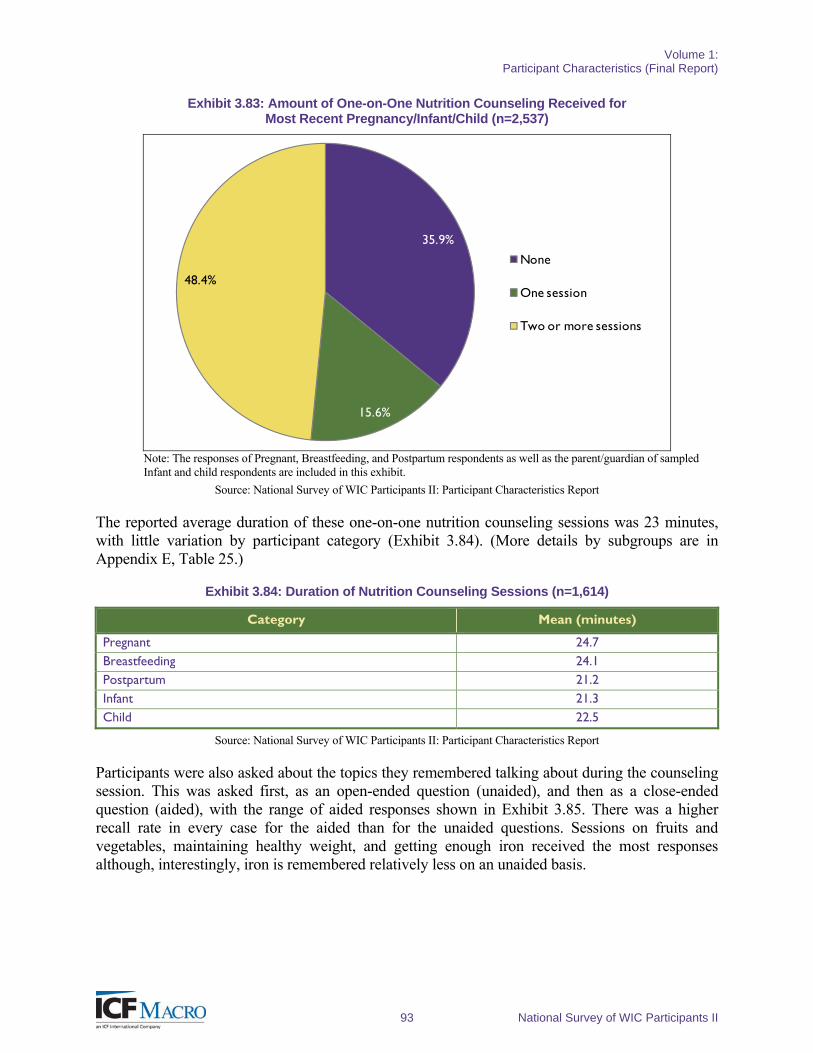
Volume 1: Participant Characteristics (Final Report)
93 National Survey of WIC Participants II
Exhibit 3.83: Amount of One-on-One Nutrition Counseling Received for Most Recent Pregnancy/Infant/Child (n=2,537)
35.9%
15.6%
48.4%
None
One session
Two or more sessions
Note: The responses of Pregnant, Breastfeeding, and Postpartum respondents as well as the parent/guardian of sampled Infant and child respondents are included in this exhibit.
Source: National Survey of WIC Participants II: Participant Characteristics Report
The reported average duration of these one-on-one nutrition counseling sessions was 23 minutes, with little variation by participant category (Exhibit 3.84). (More details by subgroups are in Appendix E, Table 25.)
Exhibit 3.84: Duration of Nutrition Counseling Sessions (n=1,614)
Category Mean (minutes)
Pregnant 24.7 Breastfeeding 24.1 Postpartum 21.2 Infant 21.3 Child 22.5
Source: National Survey of WIC Participants II: Participant Characteristics Report
Participants were also asked about the topics they remembered talking about during the counseling session. This was asked first, as an open-ended question (unaided), and then as a close-ended question (aided), with the range of aided responses shown in Exhibit 3.85. There was a higher recall rate in every case for the aided than for the unaided questions. Sessions on fruits and vegetables, maintaining healthy weight, and getting enough iron received the most responses although, interestingly, iron is remembered relatively less on an unaided basis.
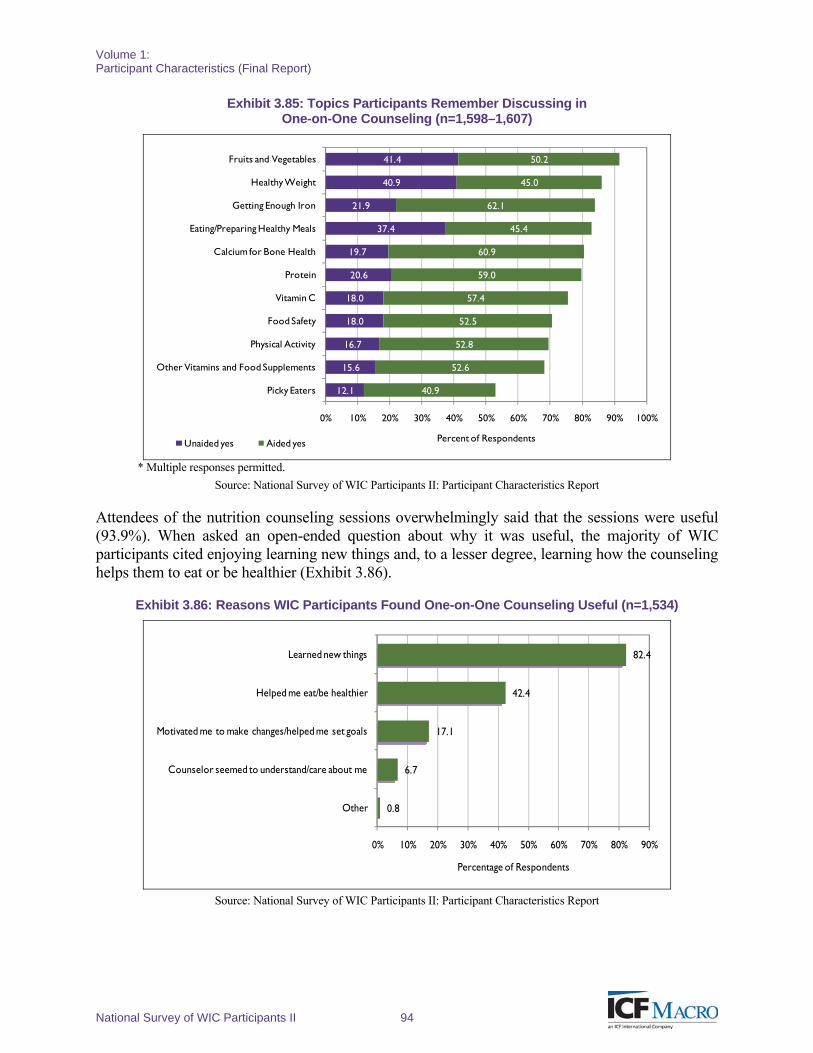
Volume 1: Participant Characteristics (Final Report)
National Survey of WIC Participants II 94
Exhibit 3.85: Topics Participants Remember Discussing in One-on-One Counseling (n=1,598–1,607)
12.1
15.6
16.7
18.0
18.0
20.6
19.7
37.4
21.9
40.9
41.4
40.9
52.6
52.8
52.5
57.4
59.0
60.9
45.4
62.1
45.0
50.2
0% 10% 20% 30% 40% 50% 60% 70% 80% 90% 100%
Picky Eaters
Other Vitamins and Food Supplements
Physical Activity
Food Safety
Vitamin C
Protein
Calcium for Bone Health
Eating/Preparing Healthy Meals
Getting Enough Iron
Healthy Weight
Fruits and Vegetables
Percent of RespondentsUnaided yes Aided yes
* Multiple responses permitted.
Source: National Survey of WIC Participants II: Participant Characteristics Report
Attendees of the nutrition counseling sessions overwhelmingly said that the sessions were useful (93.9%). When asked an open-ended question about why it was useful, the majority of WIC participants cited enjoying learning new things and, to a lesser degree, learning how the counseling helps them to eat or be healthier (Exhibit 3.86).
Exhibit 3.86: Reasons WIC Participants Found One-on-One Counseling Useful (n=1,534)
0.8
6.7
17.1
42.4
82.4
0% 10% 20% 30% 40% 50% 60% 70% 80% 90%
Other
Counselor seemed to understand/care about me
Motivated me to make changes/helped me set goals
Helped me eat/be healthier
Learned new things
Percentage of Respondents
Source: National Survey of WIC Participants II: Participant Characteristics Report
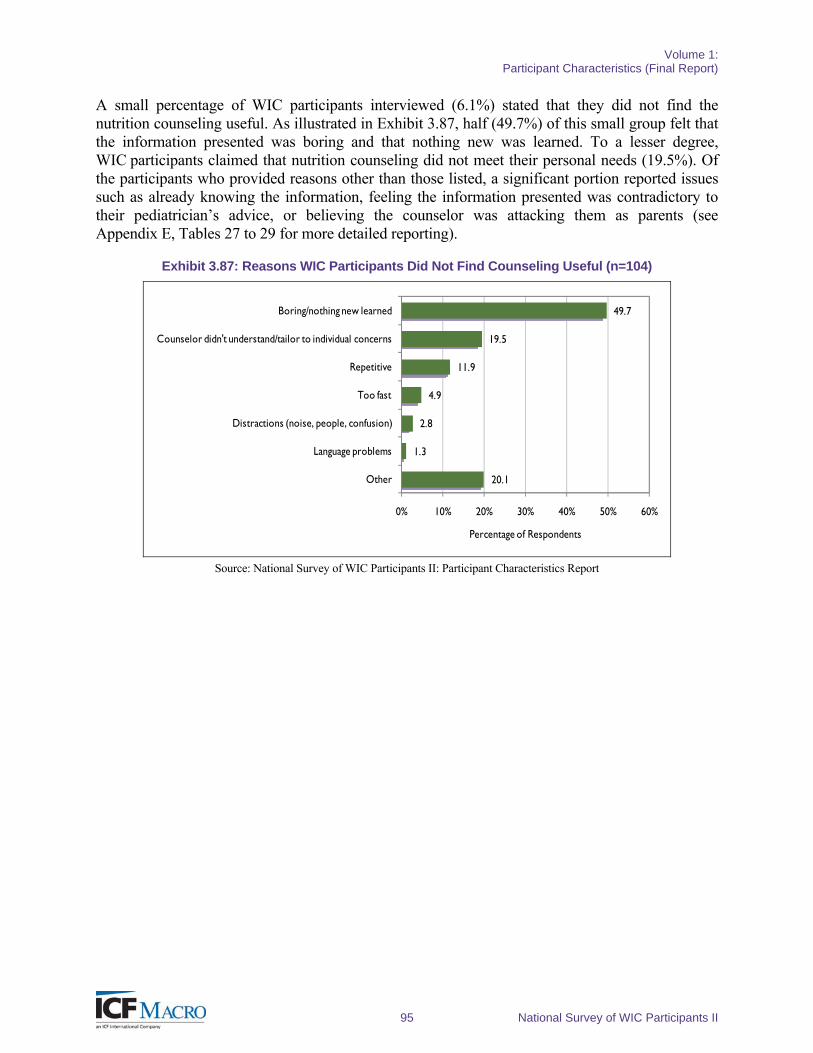
Volume 1: Participant Characteristics (Final Report)
95 National Survey of WIC Participants II
A small percentage of WIC participants interviewed (6.1%) stated that they did not find the nutrition counseling useful. As illustrated in Exhibit 3.87, half (49.7%) of this small group felt that the information presented was boring and that nothing new was learned. To a lesser degree, WIC participants claimed that nutrition counseling did not meet their personal needs (19.5%). Of the participants who provided reasons other than those listed, a significant portion reported issues such as already knowing the information, feeling the information presented was contradictory to their pediatrician’s advice, or believing the counselor was attacking them as parents (see Appendix E, Tables 27 to 29 for more detailed reporting).
Exhibit 3.87: Reasons WIC Participants Did Not Find Counseling Useful (n=104)
20.1
1.3
2.8
4.9
11.9
19.5
49.7
0% 10% 20% 30% 40% 50% 60%
Other
Language problems
Distractions (noise, people, confusion)
Too fast
Repetitive
Counselor didn't understand/tailor to individual concerns
Boring/nothing new learned
Percentage of Respondents
Source: National Survey of WIC Participants II: Participant Characteristics Report
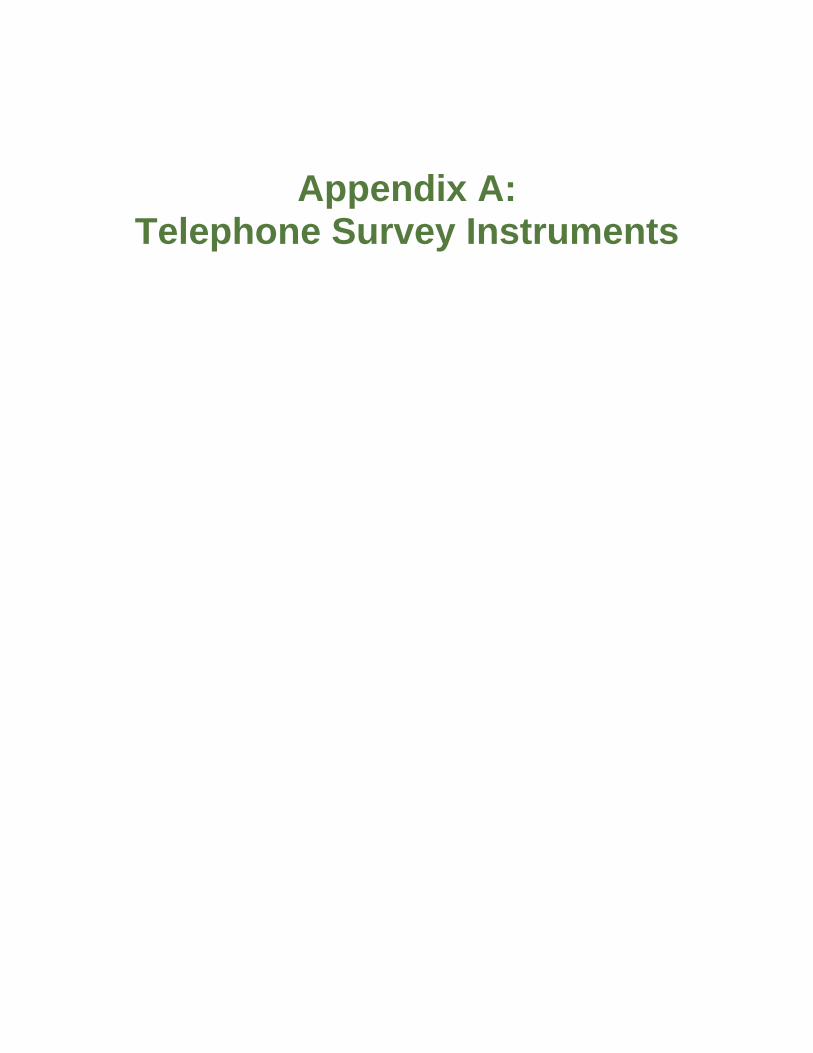
Appendix A: Telephone Survey Instruments
APPENDIX A1: TELEPHONE SURVEY INSTRUMENT
(PREGNANT, BREASTFEEDING, AND
POSTPARTUM VERSION)

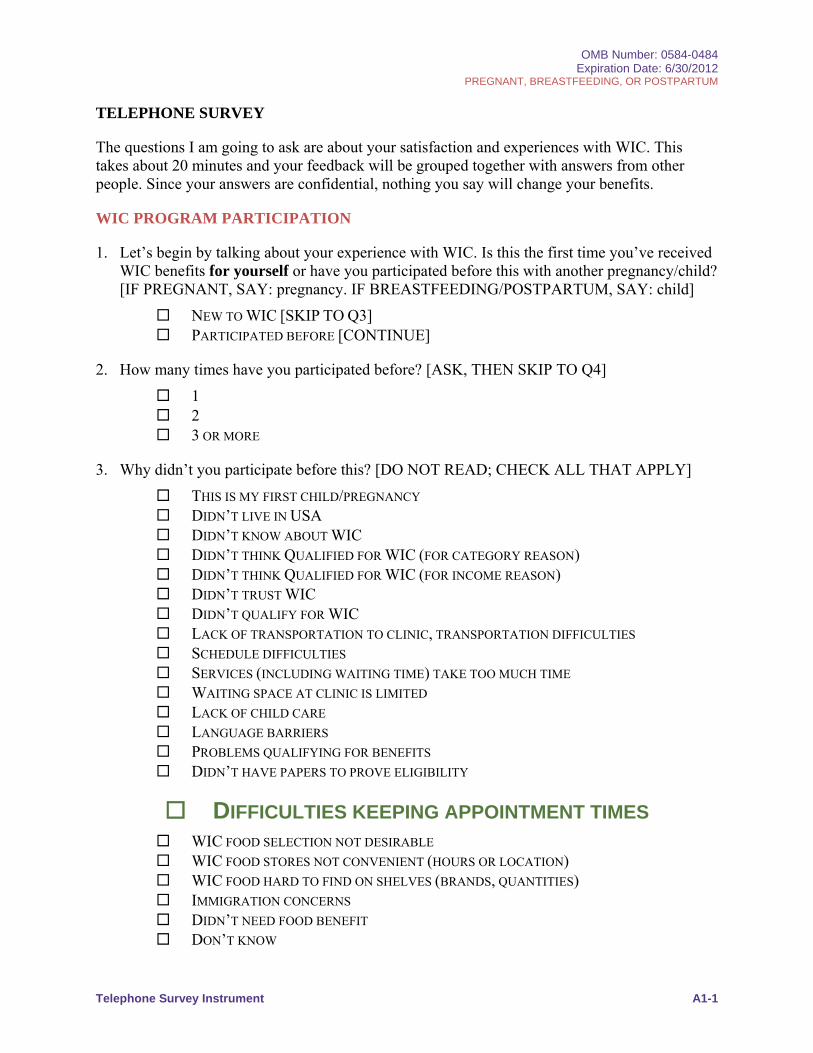
OMB Number: 0584-0484 Expiration Date: 6/30/2012
PREGNANT, BREASTFEEDING, OR POSTPARTUM
Telephone Survey Instrument A1-1
TELEPHONE SURVEY
The questions I am going to ask are about your satisfaction and experiences with WIC. This takes about 20 minutes and your feedback will be grouped together with answers from other people. Since your answers are confidential, nothing you say will change your benefits.
WIC PROGRAM PARTICIPATION
1. Let’s begin by talking about your experience with WIC. Is this the first time you’ve received WIC benefits for yourself or have you participated before this with another pregnancy/child? [IF PREGNANT, SAY: pregnancy. IF BREASTFEEDING/POSTPARTUM, SAY: child]
NEW TO WIC [SKIP TO Q3] PARTICIPATED BEFORE [CONTINUE]
2. How many times have you participated before? [ASK, THEN SKIP TO Q4]
1 2 3 OR MORE
3. Why didn’t you participate before this? [DO NOT READ; CHECK ALL THAT APPLY]
THIS IS MY FIRST CHILD/PREGNANCY DIDN’T LIVE IN USA DIDN’T KNOW ABOUT WIC DIDN’T THINK QUALIFIED FOR WIC (FOR CATEGORY REASON) DIDN’T THINK QUALIFIED FOR WIC (FOR INCOME REASON) DIDN’T TRUST WIC DIDN’T QUALIFY FOR WIC LACK OF TRANSPORTATION TO CLINIC, TRANSPORTATION DIFFICULTIES SCHEDULE DIFFICULTIES SERVICES (INCLUDING WAITING TIME) TAKE TOO MUCH TIME WAITING SPACE AT CLINIC IS LIMITED LACK OF CHILD CARE LANGUAGE BARRIERS PROBLEMS QUALIFYING FOR BENEFITS DIDN’T HAVE PAPERS TO PROVE ELIGIBILITY
DIFFICULTIES KEEPING APPOINTMENT TIMES WIC FOOD SELECTION NOT DESIRABLE WIC FOOD STORES NOT CONVENIENT (HOURS OR LOCATION) WIC FOOD HARD TO FIND ON SHELVES (BRANDS, QUANTITIES) IMMIGRATION CONCERNS DIDN’T NEED FOOD BENEFIT DON’T KNOW
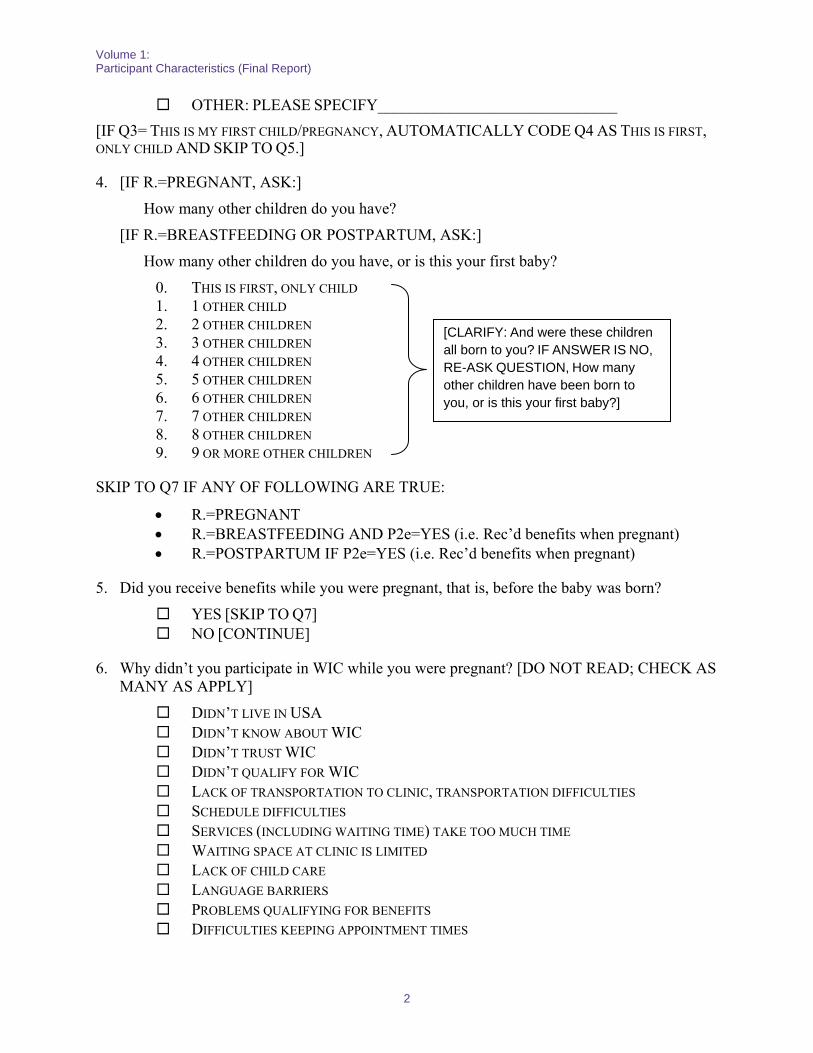
Volume 1: Participant Characteristics (Final Report)
2
OTHER: PLEASE SPECIFY______________________________
[IF Q3= THIS IS MY FIRST CHILD/PREGNANCY, AUTOMATICALLY CODE Q4 AS THIS IS FIRST, ONLY CHILD AND SKIP TO Q5.]
4. [IF R.=PREGNANT, ASK:]
How many other children do you have?
[IF R.=BREASTFEEDING OR POSTPARTUM, ASK:]
How many other children do you have, or is this your first baby?
0. THIS IS FIRST, ONLY CHILD 1. 1 OTHER CHILD 2. 2 OTHER CHILDREN 3. 3 OTHER CHILDREN 4. 4 OTHER CHILDREN 5. 5 OTHER CHILDREN 6. 6 OTHER CHILDREN 7. 7 OTHER CHILDREN 8. 8 OTHER CHILDREN 9. 9 OR MORE OTHER CHILDREN
SKIP TO Q7 IF ANY OF FOLLOWING ARE TRUE:
R.=PREGNANT R.=BREASTFEEDING AND P2e=YES (i.e. Rec’d benefits when pregnant) R.=POSTPARTUM IF P2e=YES (i.e. Rec’d benefits when pregnant)
5. Did you receive benefits while you were pregnant, that is, before the baby was born?
YES [SKIP TO Q7] NO [CONTINUE]
6. Why didn’t you participate in WIC while you were pregnant? [DO NOT READ; CHECK AS MANY AS APPLY]
DIDN’T LIVE IN USA DIDN’T KNOW ABOUT WIC DIDN’T TRUST WIC DIDN’T QUALIFY FOR WIC LACK OF TRANSPORTATION TO CLINIC, TRANSPORTATION DIFFICULTIES SCHEDULE DIFFICULTIES SERVICES (INCLUDING WAITING TIME) TAKE TOO MUCH TIME WAITING SPACE AT CLINIC IS LIMITED LACK OF CHILD CARE LANGUAGE BARRIERS PROBLEMS QUALIFYING FOR BENEFITS DIFFICULTIES KEEPING APPOINTMENT TIMES
[CLARIFY: And were these children all born to you? IF ANSWER IS NO, RE-ASK QUESTION, How many other children have been born to you, or is this your first baby?]
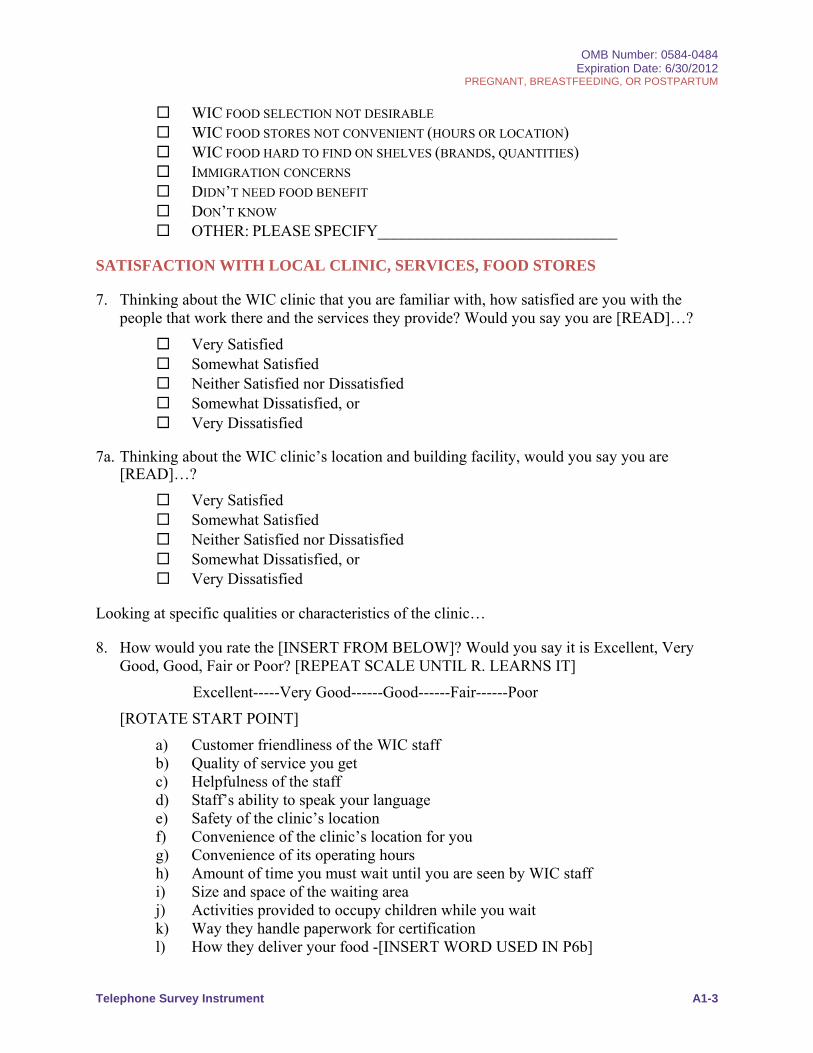
OMB Number: 0584-0484 Expiration Date: 6/30/2012
PREGNANT, BREASTFEEDING, OR POSTPARTUM
Telephone Survey Instrument A1-3
WIC FOOD SELECTION NOT DESIRABLE WIC FOOD STORES NOT CONVENIENT (HOURS OR LOCATION) WIC FOOD HARD TO FIND ON SHELVES (BRANDS, QUANTITIES) IMMIGRATION CONCERNS DIDN’T NEED FOOD BENEFIT DON’T KNOW OTHER: PLEASE SPECIFY______________________________
SATISFACTION WITH LOCAL CLINIC, SERVICES, FOOD STORES
7. Thinking about the WIC clinic that you are familiar with, how satisfied are you with the people that work there and the services they provide? Would you say you are [READ]…?
Very Satisfied Somewhat Satisfied Neither Satisfied nor Dissatisfied Somewhat Dissatisfied, or Very Dissatisfied
7a. Thinking about the WIC clinic’s location and building facility, would you say you are [READ]…?
Very Satisfied Somewhat Satisfied Neither Satisfied nor Dissatisfied Somewhat Dissatisfied, or Very Dissatisfied
Looking at specific qualities or characteristics of the clinic…
8. How would you rate the [INSERT FROM BELOW]? Would you say it is Excellent, Very Good, Good, Fair or Poor? [REPEAT SCALE UNTIL R. LEARNS IT]
Excellent-----Very Good------Good------Fair------Poor
[ROTATE START POINT]
a) Customer friendliness of the WIC staff b) Quality of service you get c) Helpfulness of the staff d) Staff’s ability to speak your language e) Safety of the clinic’s location f) Convenience of the clinic’s location for you g) Convenience of its operating hours h) Amount of time you must wait until you are seen by WIC staff i) Size and space of the waiting area j) Activities provided to occupy children while you wait k) Way they handle paperwork for certification l) How they deliver your food -[INSERT WORD USED IN P6b]
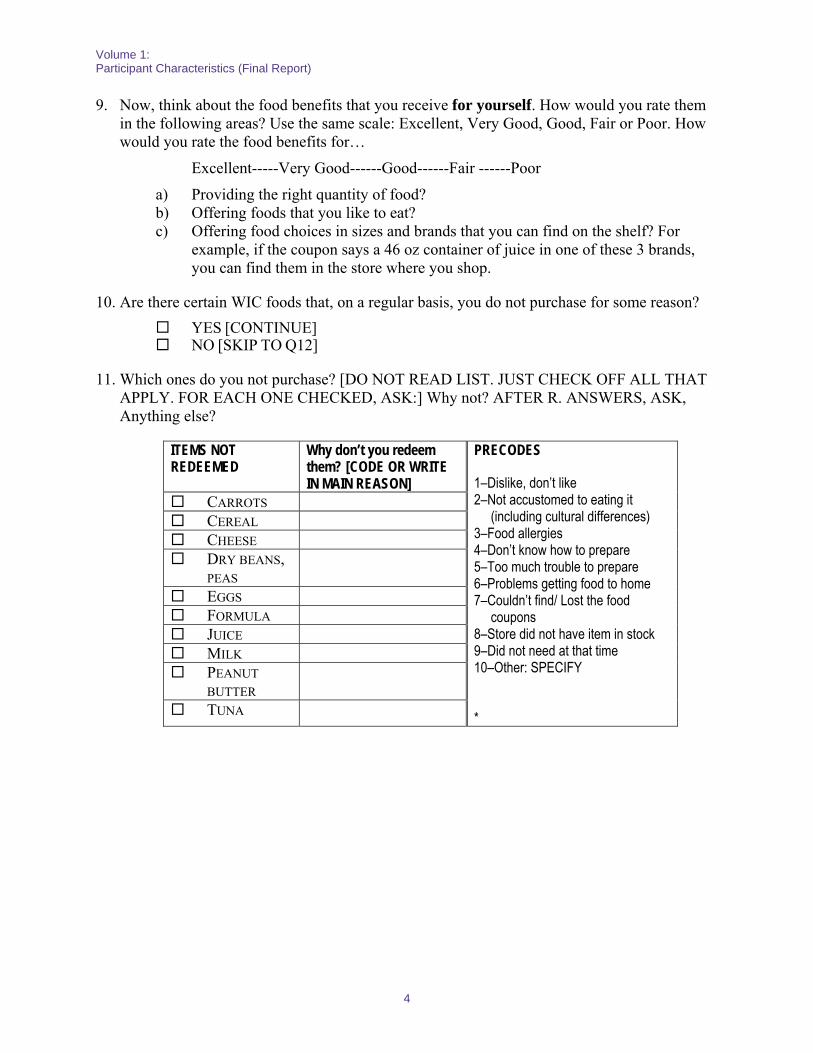
Volume 1: Participant Characteristics (Final Report)
4
9. Now, think about the food benefits that you receive for yourself. How would you rate them in the following areas? Use the same scale: Excellent, Very Good, Good, Fair or Poor. How would you rate the food benefits for…
Excellent-----Very Good------Good------Fair ------Poor
a) Providing the right quantity of food? b) Offering foods that you like to eat? c) Offering food choices in sizes and brands that you can find on the shelf? For
example, if the coupon says a 46 oz container of juice in one of these 3 brands, you can find them in the store where you shop.
10. Are there certain WIC foods that, on a regular basis, you do not purchase for some reason?
YES [CONTINUE] NO [SKIP TO Q12]
11. Which ones do you not purchase? [DO NOT READ LIST. JUST CHECK OFF ALL THAT APPLY. FOR EACH ONE CHECKED, ASK:] Why not? AFTER R. ANSWERS, ASK, Anything else?
ITEMS NOT REDEEMED
Why don’t you redeem them? [CODE OR WRITE IN MAIN REASON]
PRECODES
1–Dislike, don’t like 2–Not accustomed to eating it
(including cultural differences) 3–Food allergies 4–Don’t know how to prepare 5–Too much trouble to prepare 6–Problems getting food to home 7–Couldn’t find/ Lost the food
coupons 8–Store did not have item in stock 9–Did not need at that time 10–Other: SPECIFY *
CARROTS CEREAL CHEESE DRY BEANS,
PEAS
EGGS FORMULA JUICE MILK PEANUT
BUTTER
TUNA
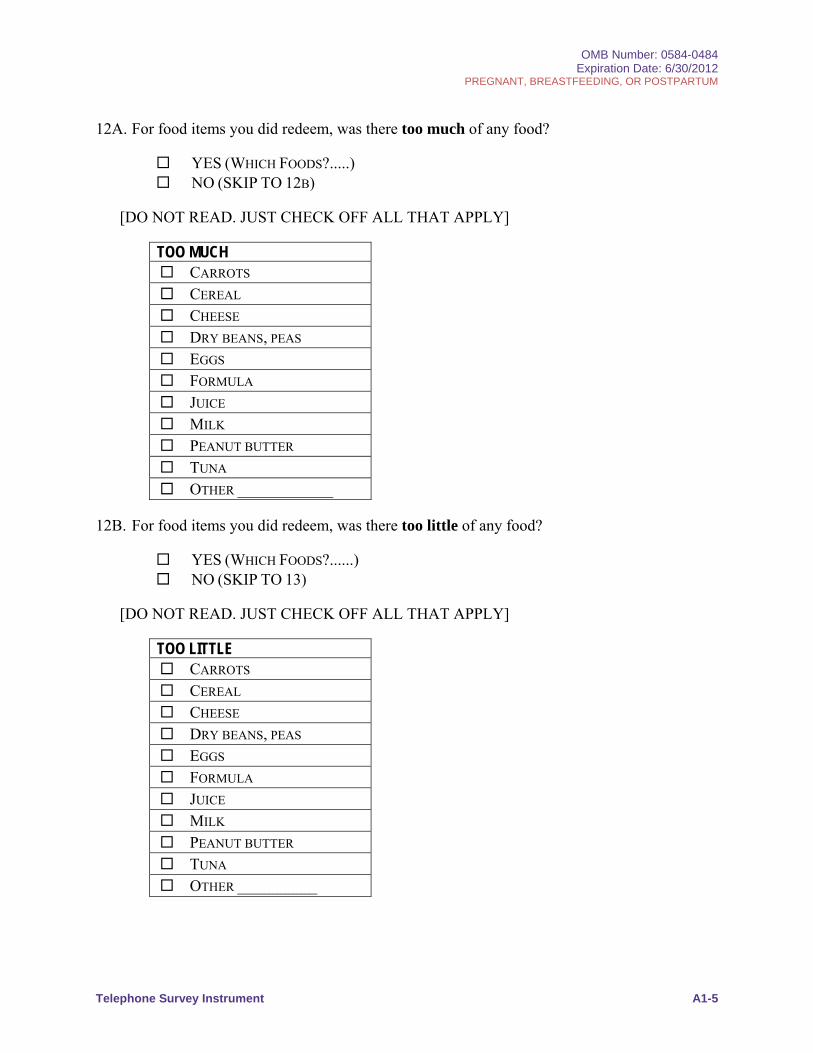
OMB Number: 0584-0484 Expiration Date: 6/30/2012
PREGNANT, BREASTFEEDING, OR POSTPARTUM
Telephone Survey Instrument A1-5
12A. For food items you did redeem, was there too much of any food?
YES (WHICH FOODS?.....) NO (SKIP TO 12B)
[DO NOT READ. JUST CHECK OFF ALL THAT APPLY]
TOO MUCH CARROTS CEREAL CHEESE DRY BEANS, PEAS EGGS FORMULA JUICE MILK PEANUT BUTTER TUNA OTHER ____________
12B. For food items you did redeem, was there too little of any food?
YES (WHICH FOODS?......) NO (SKIP TO 13)
[DO NOT READ. JUST CHECK OFF ALL THAT APPLY]
TOO LITTLE CARROTS CEREAL CHEESE DRY BEANS, PEAS EGGS FORMULA JUICE MILK PEANUT BUTTER TUNA OTHER __________
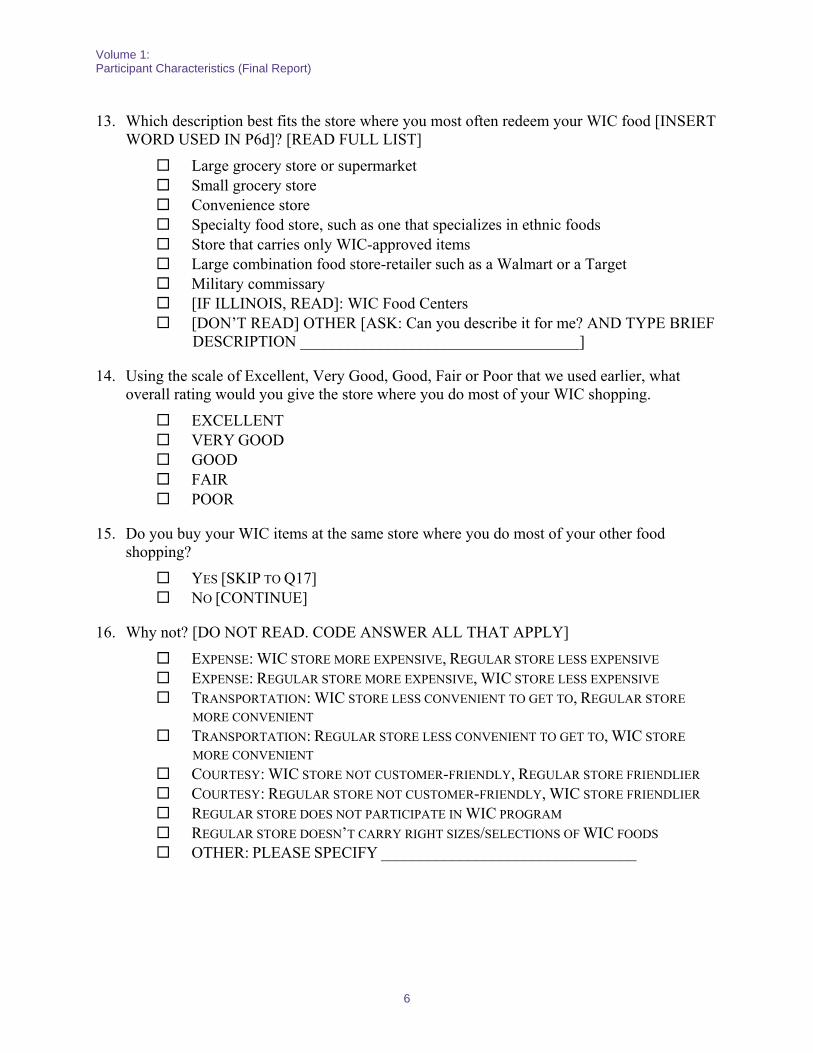
Volume 1: Participant Characteristics (Final Report)
6
13. Which description best fits the store where you most often redeem your WIC food [INSERT WORD USED IN P6d]? [READ FULL LIST]
Large grocery store or supermarket Small grocery store Convenience store Specialty food store, such as one that specializes in ethnic foods Store that carries only WIC-approved items Large combination food store-retailer such as a Walmart or a Target Military commissary [IF ILLINOIS, READ]: WIC Food Centers [DON’T READ] OTHER [ASK: Can you describe it for me? AND TYPE BRIEF
DESCRIPTION ___________________________________]
14. Using the scale of Excellent, Very Good, Good, Fair or Poor that we used earlier, what overall rating would you give the store where you do most of your WIC shopping.
EXCELLENT VERY GOOD GOOD FAIR POOR
15. Do you buy your WIC items at the same store where you do most of your other food shopping?
YES [SKIP TO Q17] NO [CONTINUE]
16. Why not? [DO NOT READ. CODE ANSWER ALL THAT APPLY]
EXPENSE: WIC STORE MORE EXPENSIVE, REGULAR STORE LESS EXPENSIVE EXPENSE: REGULAR STORE MORE EXPENSIVE, WIC STORE LESS EXPENSIVE TRANSPORTATION: WIC STORE LESS CONVENIENT TO GET TO, REGULAR STORE
MORE CONVENIENT TRANSPORTATION: REGULAR STORE LESS CONVENIENT TO GET TO, WIC STORE
MORE CONVENIENT COURTESY: WIC STORE NOT CUSTOMER-FRIENDLY, REGULAR STORE FRIENDLIER COURTESY: REGULAR STORE NOT CUSTOMER-FRIENDLY, WIC STORE FRIENDLIER REGULAR STORE DOES NOT PARTICIPATE IN WIC PROGRAM REGULAR STORE DOESN’T CARRY RIGHT SIZES/SELECTIONS OF WIC FOODS OTHER: PLEASE SPECIFY ________________________________
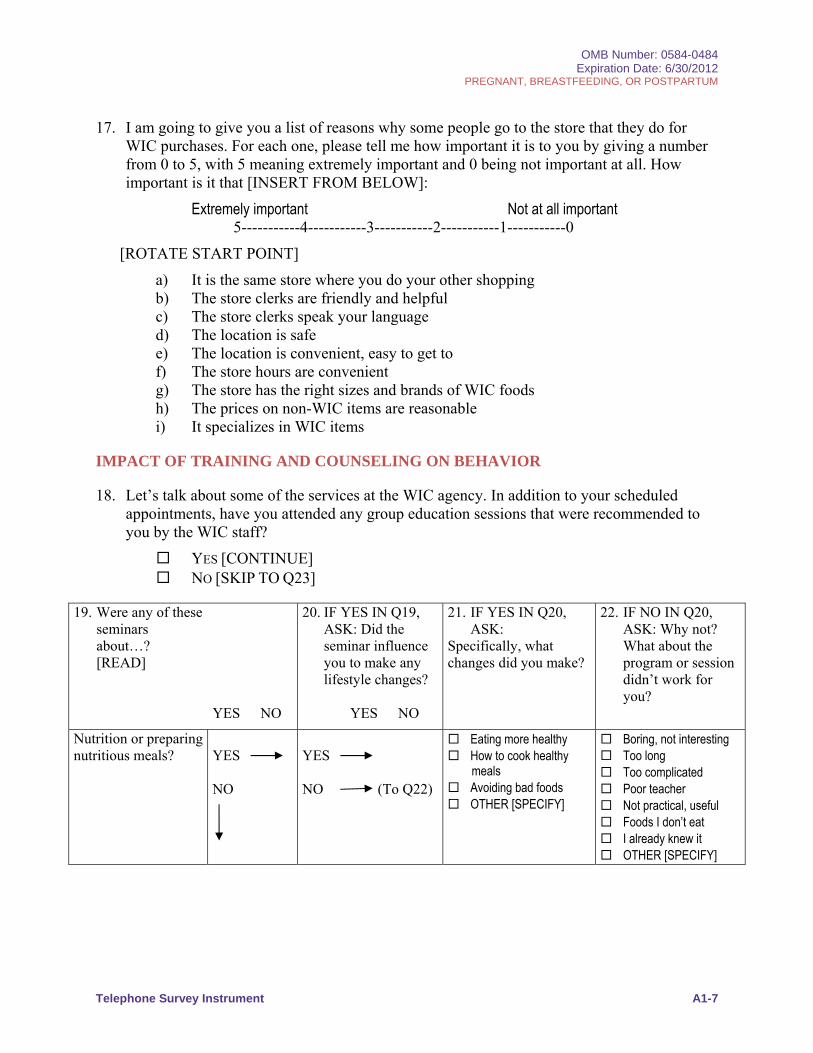
OMB Number: 0584-0484 Expiration Date: 6/30/2012
PREGNANT, BREASTFEEDING, OR POSTPARTUM
Telephone Survey Instrument A1-7
17. I am going to give you a list of reasons why some people go to the store that they do for WIC purchases. For each one, please tell me how important it is to you by giving a number from 0 to 5, with 5 meaning extremely important and 0 being not important at all. How important is it that [INSERT FROM BELOW]:
Extremely important Not at all important 5-----------4-----------3-----------2-----------1-----------0
[ROTATE START POINT]
a) It is the same store where you do your other shopping b) The store clerks are friendly and helpful c) The store clerks speak your language d) The location is safe e) The location is convenient, easy to get to f) The store hours are convenient g) The store has the right sizes and brands of WIC foods h) The prices on non-WIC items are reasonable i) It specializes in WIC items
IMPACT OF TRAINING AND COUNSELING ON BEHAVIOR
18. Let’s talk about some of the services at the WIC agency. In addition to your scheduled appointments, have you attended any group education sessions that were recommended to you by the WIC staff?
YES [CONTINUE] NO [SKIP TO Q23]
19. Were any of these seminars about…? [READ]
YES NO
20. IF YES IN Q19, ASK: Did the seminar influence you to make any lifestyle changes?
YES NO
21. IF YES IN Q20, ASK:
Specifically, what changes did you make?
22. IF NO IN Q20, ASK: Why not? What about the program or session didn’t work for you?
Nutrition or preparing nutritious meals?
YES
NO
YES
NO (To Q22)
Eating more healthy How to cook healthy
meals Avoiding bad foods OTHER [SPECIFY]
Boring, not interesting Too long Too complicated Poor teacher Not practical, useful Foods I don’t eat I already knew it OTHER [SPECIFY]
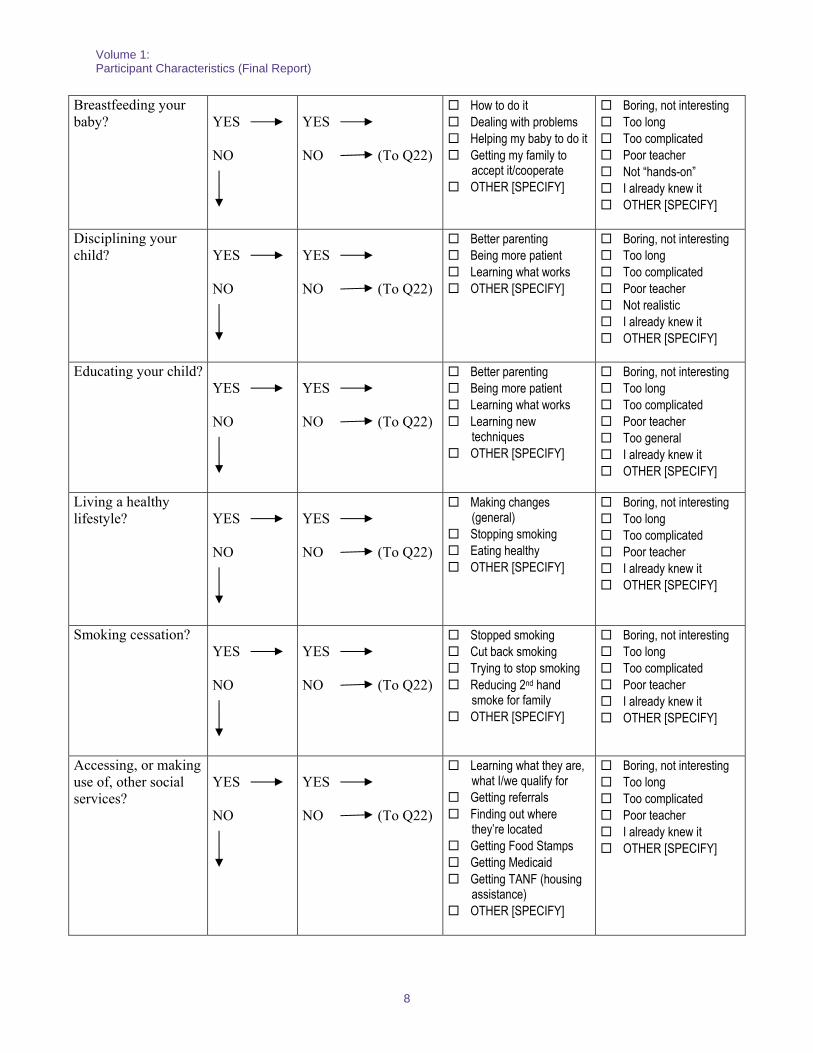
Volume 1: Participant Characteristics (Final Report)
8
Breastfeeding your baby?
YES
NO
YES
NO (To Q22)
How to do it Dealing with problems Helping my baby to do it Getting my family to
accept it/cooperate OTHER [SPECIFY]
Boring, not interesting Too long Too complicated Poor teacher Not “hands-on” I already knew it OTHER [SPECIFY]
Disciplining your child?
YES
NO
YES
NO (To Q22)
Better parenting Being more patient Learning what works OTHER [SPECIFY]
Boring, not interesting Too long Too complicated Poor teacher Not realistic I already knew it OTHER [SPECIFY]
Educating your child? YES
NO
YES
NO (To Q22)
Better parenting Being more patient Learning what works Learning new
techniques OTHER [SPECIFY]
Boring, not interesting Too long Too complicated Poor teacher Too general I already knew it OTHER [SPECIFY]
Living a healthy lifestyle?
YES
NO
YES
NO (To Q22)
Making changes (general)
Stopping smoking Eating healthy OTHER [SPECIFY]
Boring, not interesting Too long Too complicated Poor teacher I already knew it OTHER [SPECIFY]
Smoking cessation? YES
NO
YES
NO (To Q22)
Stopped smoking Cut back smoking Trying to stop smoking Reducing 2nd hand
smoke for family OTHER [SPECIFY]
Boring, not interesting Too long Too complicated Poor teacher I already knew it OTHER [SPECIFY]
Accessing, or making use of, other social services?
YES
NO
YES
NO (To Q22)
Learning what they are, what I/we qualify for
Getting referrals Finding out where
they’re located Getting Food Stamps Getting Medicaid Getting TANF (housing
assistance) OTHER [SPECIFY]
Boring, not interesting Too long Too complicated Poor teacher I already knew it OTHER [SPECIFY]
OMB Number: 0584-0484 Expiration Date: 6/30/2012
PREGNANT, BREASTFEEDING, OR POSTPARTUM
Telephone Survey Instrument A1-9
23. I am going to read you a list of potential benefits of the WIC program. Please indicate how valuable they are to you by giving me a number from 0 to 5, with 5 meaning extremely valuable and 0 being not valuable to you at all. How important is [INSERT FROM BELOW]?
Extremely valuable Not at all valuable 5--------4--------3--------2--------1--------0
[ROTATE START POINT]
a) Time to talk with other mothers b) Money saved on grocery bills c) Health information d) Nutrition information e) Checking blood, height, and weight f) Advice from WIC staff g) Vouchers for foods I know are nutritious h) Helps me stay on time with shots for my child i) Taught me about breastfeeding j) Taught me about the foods babies need k) Taught me about the foods children need l) Taught me about the foods I need
24. How much one-on-one nutrition counseling have you received in person for this most recent pregnancy/baby? [IF R.=PREGNANT, READ: pregnancy. IF R.=BREASTFEEDING/ POSTPARTUM, READ: child]. Would you say…? [READ UNTIL R. INDICATES ANSWER]
None at all [VERIFY: “You received no counseling about nutrition and healthy eating at the clinic?” IF AFFIRMED, SKIP TO Q30]
One session only 2-3 sessions 4-5 sessions 6-7 sessions 8 or more sessions
25. Not counting the paperwork or other processing time, how much time would you say the actual counseling lasted, on average? [IF AN HOUR OR MORE, VERIFY, “Is this on average?”]
___________ HOURS ___________ MINUTES
Volume 1: Participant Characteristics (Final Report)
10
26. What topics do you remember talking about with the nutrition counselor? [DO NOT READ AT FIRST—PROBE AND CHECK UNAIDED RECALL] [THEN READ LIST TO CHECK AIDED RECALL]
UNAIDED AIDED YES YES NO
a) Healthy weight b) Fruits and vegetables c) Protein d) Getting enough iron e) Calcium for bone health f) Vitamin C g) Other vitamins and food
supplements
h) Food safety i) Physical activity j) Eating/preparing healthy meals k) Picky eaters
27. Was the nutrition counseling useful to you?
YES [CONTINUE] NO [SKIP TO Q29]
28. Why? [DON’T READ LIST. CHECK ALL THAT APPLY.] [PROBE: ANYTHING ELSE?] [SKIP TO Q30 AFTER QUESTION.]
LEARNED NEW THINGS COUNSELOR SEEMED TO UNDERSTAND ME/CARE ABOUT ME IT MOTIVATED ME TO MAKE CHANGES/HELPED ME SET GOALS HELPED ME EAT/BE HEALTHIER OTHER: SPECIFY __________________________
29. Why not? [DON’T READ LIST. CHECK ALL THAT APPLY.] [PROBE: ANYTHING ELSE?]
BORING/NOTHING NEW LEARNED REPETITIVE LANGUAGE PROBLEMS TOO FAST. FELT RUSHED DISTRACTIONS (NOISE, PEOPLE, CONFUSION) COUNSELOR DIDN’T UNDERSTAND/TAILOR TO INDIVIDUAL CONCERNS OTHER: SPECIFY __________________________
OMB Number: 0584-0484 Expiration Date: 6/30/2012
PREGNANT, BREASTFEEDING, OR POSTPARTUM
Telephone Survey Instrument A1-11
CURRENT SITUATION & BEHAVIORS
30. At the current time, what, if any, health insurance do you have for your child/ren? [IF R. SAYS SOMETHING LIKE “ AETNA, BLUE CROSS/BLUE SHIELD, KAISER, OR UNITED HEALTHCARE”, CLARIFY WHETHER IT IS PRIVATE INSURANCE THROUGH AN EMPLOYER OR NOT. IF MORE THAN ONE GIVEN, ASK FOR MAIN ONE.]
NONE MEDICAID STATE CHIP – CHILDREN’S HEALTH INSURANCE PROGRAM OTHER STATE PROGRAM MILITARY/TRICARE PRIVATE INSURANCE THROUGH AN EMPLOYER PRIVATE INSURANCE NOT THROUGH AN EMPLOYER (I.E., THEIR OWN INSURANCE) OTHER: PLEASE SPECIFY: ___________________
31. What, if any health insurance, do you have for yourself? [IF MORE THAN ONE GIVEN, ASK FOR MAIN ONE.]
NONE MEDICAID OTHER STATE PROGRAM MILITARY/TRICARE PRIVATE INSURANCE THROUGH MOTHER/SPOUSE’S EMPLOYER (E.G., MILITARY) PRIVATE INSURANCE NOT THROUGH MOTHER/SPOUSE’S EMPLOYER OTHER: PLEASE SPECIFY: ___________________
Volume 1: Participant Characteristics (Final Report)
12
32. Are you, or members of your family, getting food through the… [READ LIST]?
YES NO a) Food Stamp program, also known as
[INSERT FROM P6c]?
b) Free or reduced price School Lunch or Breakfast program?
c) Summer Food Service program, for kids when not in school?
d) Food Distribution Program on Indian Reservations (FDPIR)?
e) Temporary Emergency Food Assistance program?
f) Child and Adult Care Food program, which provides free lunches for children at day care centers?
g) Local/community food bank or pantry? h) Commodity Supplemental Food Program,
which provides food packets that are distributed through State and local agencies? [IF Q32h=YES, SKIP TO Q33]
i) Have you ever participated in Commodity Supplemental Food Program in the past?
YES NO [SKIP TO Q33]
j) How long ago did your participation in that program stop?
_____________ YEARS AGO _____________ MONTHS AGO
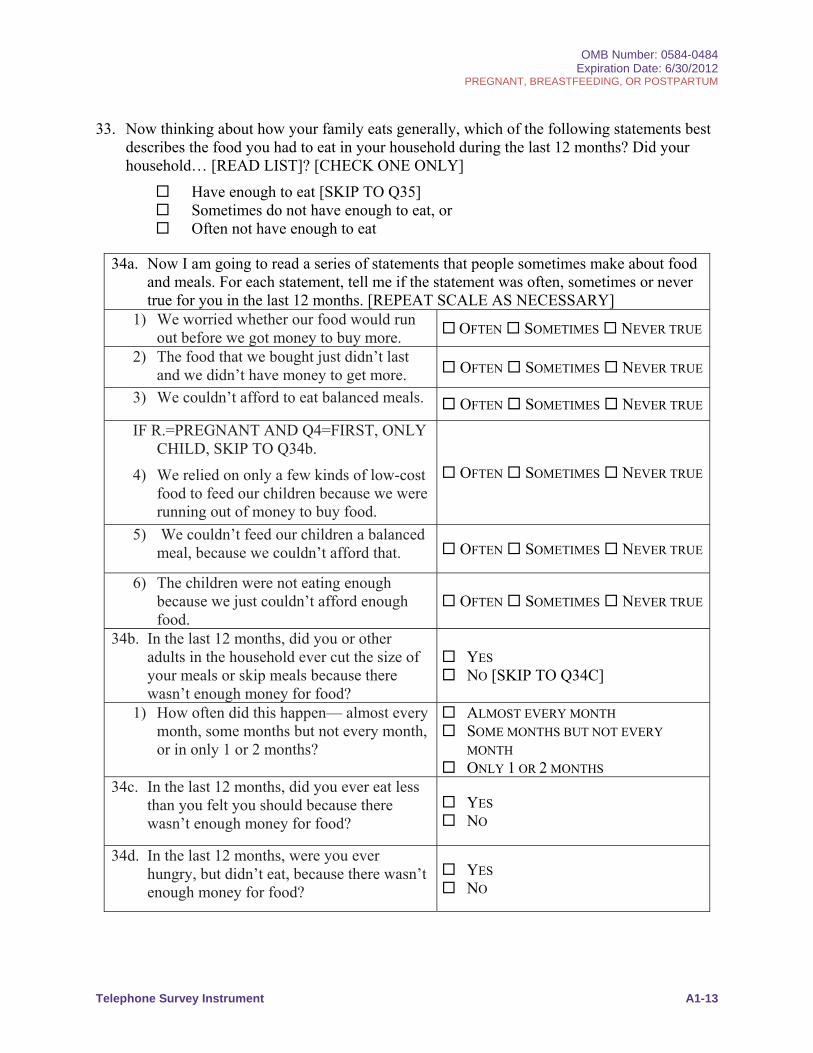
OMB Number: 0584-0484 Expiration Date: 6/30/2012
PREGNANT, BREASTFEEDING, OR POSTPARTUM
Telephone Survey Instrument A1-13
33. Now thinking about how your family eats generally, which of the following statements best describes the food you had to eat in your household during the last 12 months? Did your household… [READ LIST]? [CHECK ONE ONLY]
Have enough to eat [SKIP TO Q35] Sometimes do not have enough to eat, or Often not have enough to eat
34a. Now I am going to read a series of statements that people sometimes make about food and meals. For each statement, tell me if the statement was often, sometimes or never true for you in the last 12 months. [REPEAT SCALE AS NECESSARY]
1) We worried whether our food would run out before we got money to buy more.
OFTEN SOMETIMES NEVER TRUE
2) The food that we bought just didn’t last and we didn’t have money to get more. OFTEN SOMETIMES NEVER TRUE
3) We couldn’t afford to eat balanced meals. OFTEN SOMETIMES NEVER TRUE
IF R.=PREGNANT AND Q4=FIRST, ONLY CHILD, SKIP TO Q34b.
4) We relied on only a few kinds of low-cost food to feed our children because we were running out of money to buy food.
OFTEN SOMETIMES NEVER TRUE
5) We couldn’t feed our children a balanced meal, because we couldn’t afford that. OFTEN SOMETIMES NEVER TRUE
6) The children were not eating enough because we just couldn’t afford enough food.
OFTEN SOMETIMES NEVER TRUE
34b. In the last 12 months, did you or other adults in the household ever cut the size of your meals or skip meals because there wasn’t enough money for food?
YES NO [SKIP TO Q34C]
1) How often did this happen— almost every month, some months but not every month, or in only 1 or 2 months?
ALMOST EVERY MONTH SOME MONTHS BUT NOT EVERY
MONTH ONLY 1 OR 2 MONTHS
34c. In the last 12 months, did you ever eat less than you felt you should because there wasn’t enough money for food?
YES NO
34d. In the last 12 months, were you ever hungry, but didn’t eat, because there wasn’t enough money for food?
YES NO
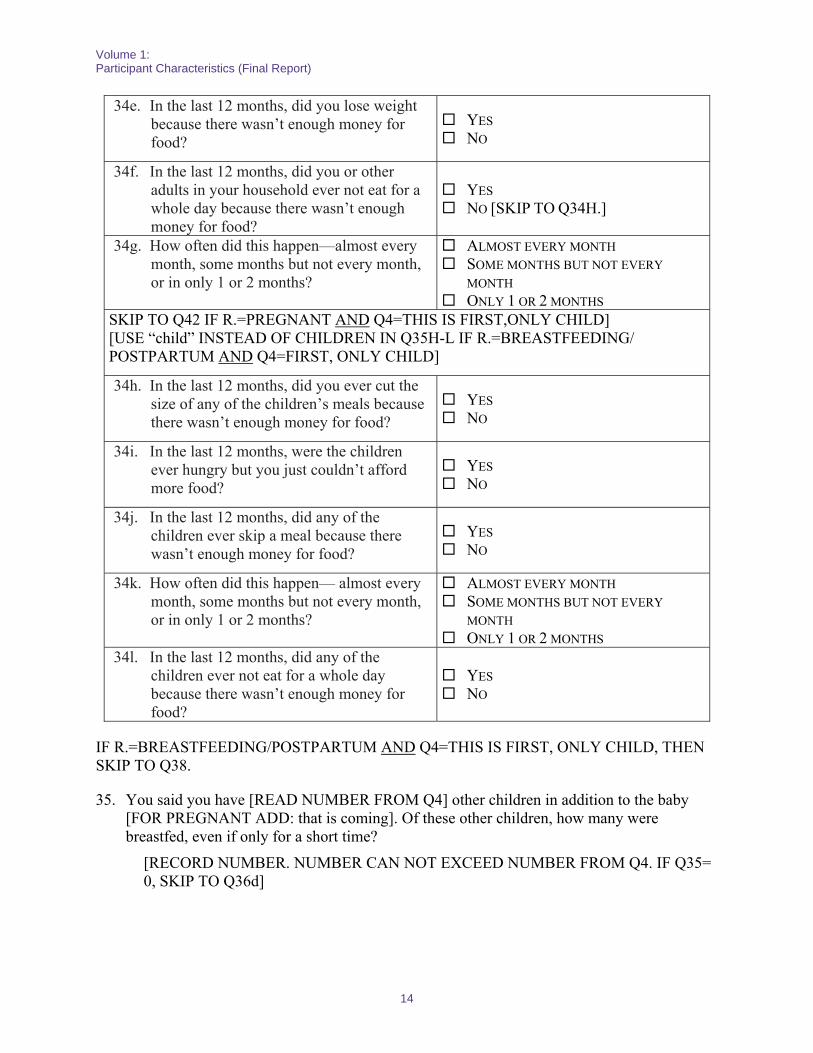
Volume 1: Participant Characteristics (Final Report)
14
34e. In the last 12 months, did you lose weight because there wasn’t enough money for food?
YES NO
34f. In the last 12 months, did you or other adults in your household ever not eat for a whole day because there wasn’t enough money for food?
YES NO [SKIP TO Q34H.]
34g. How often did this happen—almost every month, some months but not every month, or in only 1 or 2 months?
ALMOST EVERY MONTH SOME MONTHS BUT NOT EVERY
MONTH ONLY 1 OR 2 MONTHS
SKIP TO Q42 IF R.=PREGNANT AND Q4=THIS IS FIRST,ONLY CHILD] [USE “child” INSTEAD OF CHILDREN IN Q35H-L IF R.=BREASTFEEDING/ POSTPARTUM AND Q4=FIRST, ONLY CHILD]
34h. In the last 12 months, did you ever cut the size of any of the children’s meals because there wasn’t enough money for food?
YES NO
34i. In the last 12 months, were the children ever hungry but you just couldn’t afford more food?
YES NO
34j. In the last 12 months, did any of the children ever skip a meal because there wasn’t enough money for food?
YES NO
34k. How often did this happen— almost every month, some months but not every month, or in only 1 or 2 months?
ALMOST EVERY MONTH SOME MONTHS BUT NOT EVERY
MONTH ONLY 1 OR 2 MONTHS
34l. In the last 12 months, did any of the children ever not eat for a whole day because there wasn’t enough money for food?
YES NO
IF R.=BREASTFEEDING/POSTPARTUM AND Q4=THIS IS FIRST, ONLY CHILD, THEN SKIP TO Q38.
35. You said you have [READ NUMBER FROM Q4] other children in addition to the baby [FOR PREGNANT ADD: that is coming]. Of these other children, how many were breastfed, even if only for a short time?
[RECORD NUMBER. NUMBER CAN NOT EXCEED NUMBER FROM Q4. IF Q35= 0, SKIP TO Q36d]
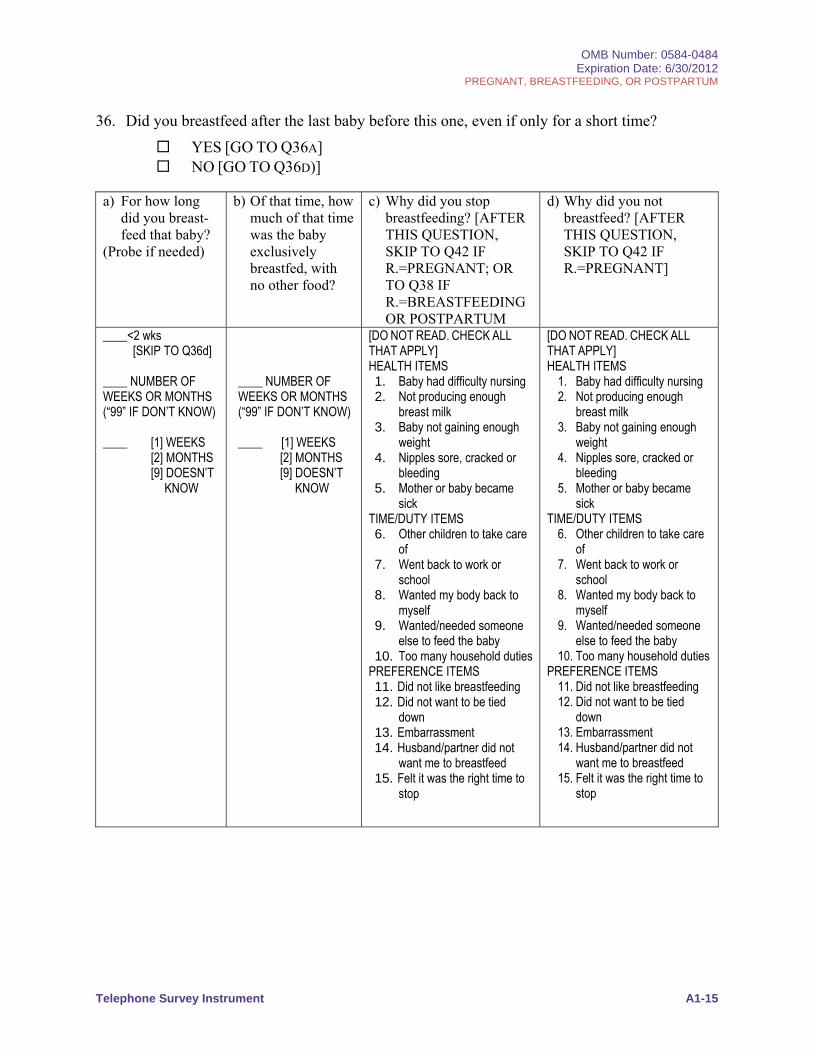
OMB Number: 0584-0484 Expiration Date: 6/30/2012
PREGNANT, BREASTFEEDING, OR POSTPARTUM
Telephone Survey Instrument A1-15
36. Did you breastfeed after the last baby before this one, even if only for a short time?
YES [GO TO Q36A] NO [GO TO Q36D)]
a) For how long did you breast-feed that baby?
(Probe if needed)
b) Of that time, how much of that time was the baby exclusively breastfed, with no other food?
c) Why did you stop breastfeeding? [AFTER THIS QUESTION, SKIP TO Q42 IF R.=PREGNANT; OR TO Q38 IF R.=BREASTFEEDING OR POSTPARTUM
d) Why did you not breastfeed? [AFTER THIS QUESTION, SKIP TO Q42 IF R.=PREGNANT]
____<2 wks [SKIP TO Q36d]
____ NUMBER OF WEEKS OR MONTHS (“99” IF DON’T KNOW) ____ [1] WEEKS
[2] MONTHS [9] DOESN’T
KNOW
____ NUMBER OF WEEKS OR MONTHS (“99” IF DON’T KNOW) ____ [1] WEEKS
[2] MONTHS [9] DOESN’T
KNOW
[DO NOT READ. CHECK ALL
THAT APPLY] HEALTH ITEMS 1. Baby had difficulty nursing 2. Not producing enough
breast milk 3. Baby not gaining enough
weight 4. Nipples sore, cracked or
bleeding 5. Mother or baby became
sick TIME/DUTY ITEMS 6. Other children to take care
of 7. Went back to work or
school 8. Wanted my body back to
myself 9. Wanted/needed someone
else to feed the baby 10. Too many household duties
PREFERENCE ITEMS 11. Did not like breastfeeding 12. Did not want to be tied
down 13. Embarrassment 14. Husband/partner did not
want me to breastfeed 15. Felt it was the right time to
stop
[DO NOT READ. CHECK ALL
THAT APPLY] HEALTH ITEMS
1. Baby had difficulty nursing 2. Not producing enough
breast milk 3. Baby not gaining enough
weight 4. Nipples sore, cracked or
bleeding 5. Mother or baby became
sick TIME/DUTY ITEMS
6. Other children to take care of
7. Went back to work or school
8. Wanted my body back to myself
9. Wanted/needed someone else to feed the baby
10. Too many household duties PREFERENCE ITEMS
11. Did not like breastfeeding 12. Did not want to be tied
down 13. Embarrassment 14. Husband/partner did not
want me to breastfeed 15. Felt it was the right time to
stop
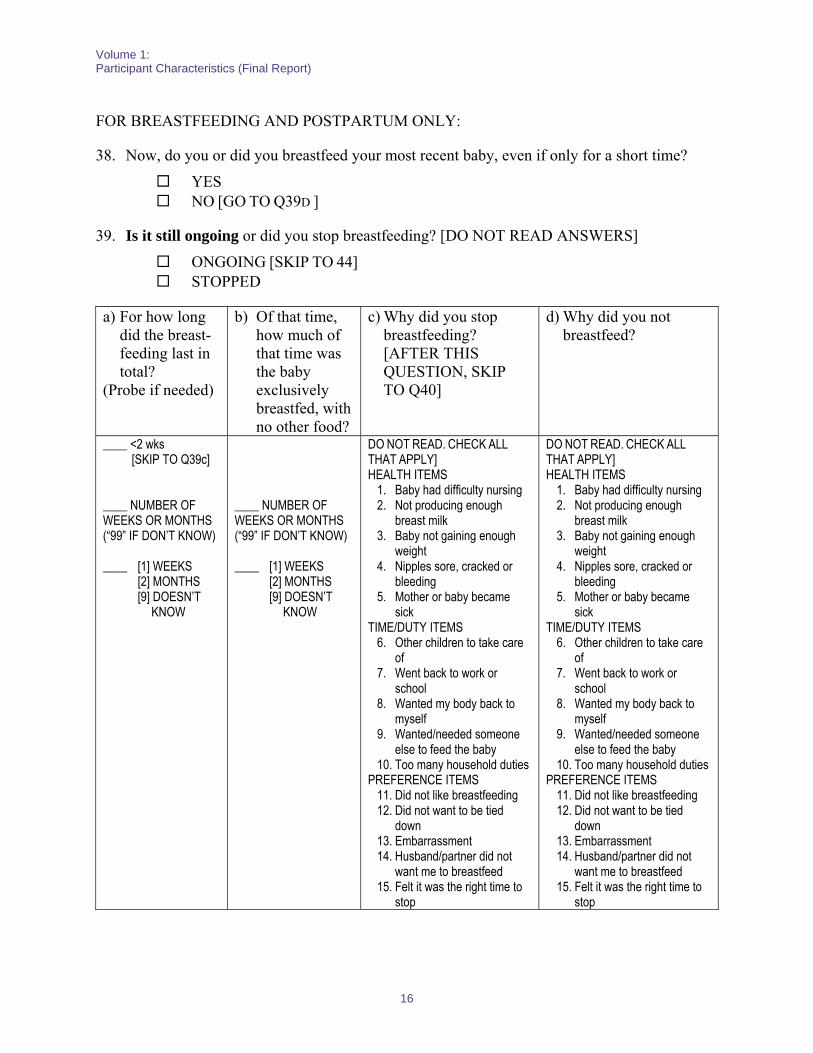
Volume 1: Participant Characteristics (Final Report)
16
FOR BREASTFEEDING AND POSTPARTUM ONLY:
38. Now, do you or did you breastfeed your most recent baby, even if only for a short time?
YES NO [GO TO Q39D ]
39. Is it still ongoing or did you stop breastfeeding? [DO NOT READ ANSWERS]
ONGOING [SKIP TO 44] STOPPED
a) For how long did the breast-feeding last in total?
(Probe if needed)
b) Of that time, how much of that time was the baby exclusively breastfed, with no other food?
c) Why did you stop breastfeeding? [AFTER THIS QUESTION, SKIP TO Q40]
d) Why did you not breastfeed?
____ <2 wks [SKIP TO Q39c]
____ NUMBER OF WEEKS OR MONTHS (“99” IF DON’T KNOW) ____ [1] WEEKS
[2] MONTHS [9] DOESN’T
KNOW
____ NUMBER OF WEEKS OR MONTHS (“99” IF DON’T KNOW) ____ [1] WEEKS
[2] MONTHS [9] DOESN’T
KNOW
DO NOT READ. CHECK ALL
THAT APPLY] HEALTH ITEMS
1. Baby had difficulty nursing 2. Not producing enough
breast milk 3. Baby not gaining enough
weight 4. Nipples sore, cracked or
bleeding 5. Mother or baby became
sick TIME/DUTY ITEMS
6. Other children to take care of
7. Went back to work or school
8. Wanted my body back to myself
9. Wanted/needed someone else to feed the baby
10. Too many household duties PREFERENCE ITEMS
11. Did not like breastfeeding 12. Did not want to be tied
down 13. Embarrassment 14. Husband/partner did not
want me to breastfeed 15. Felt it was the right time to
stop
OMB Number: 0584-0484 Expiration Date: 6/30/2012
PREGNANT, BREASTFEEDING, OR POSTPARTUM
Telephone Survey Instrument A1-17
40. What, if anything, might have helped you to breastfeed? [AFTER QUESTION, SKIP TO Q44]
1. HELP BABY THAT HAD TROUBLE NURSING 2. SHOW ME WAYS TO MAKE IT HURT LESS 3. SHOW ME WAYS TO MAKE IT EASIER 4. SHOW ME HOW TO PUMP MILK 5. TALK TO UNSUPPORTIVE HUSBAND/PARTNER 6. TALK TO UNSUPPORTIVE MOTHER/GRANDMOTHER 7. TELL ME HOW TO WORK IT INTO MY SCHEDULE 8. NOTHING 9. OTHER [SPECIFY] _____________________________
41. What one thing might have helped you breastfeed for a longer period of time? [AFTER QUESTION, SKIP TO Q44]
1. HELP BABY THAT HAD TROUBLE NURSING 2. SHOW ME WAYS TO MAKE IT HURT LESS 3. SHOW ME WAYS TO MAKE IT EASIER 4. SHOW ME HOW TO PUMP MILK 5. TALK TO UNSUPPORTIVE HUSBAND/PARTNER 6. TALK TO UNSUPPORTIVE MOTHER/GRANDMOTHER 7. TELL ME HOW TO WORK IT INTO MY SCHEDULE 8. NOTHING 9. OTHER [SPECIFY] _____________________________
FOR PREGNANT ONLY:
42. With your upcoming baby, are you planning to breastfeed?
YES [CONTINUE] NO [SKIP TO Q44]
43. For how many months in total from the baby’s birth, are you planning to breastfeed?
________ MONTHS (“99” IF DOESN’T KNOW)
Volume 1: Participant Characteristics (Final Report)
18
FOR EVERYONE:
44. What, if any, advantages do you see of breastfeeding? [UNAIDED AWARENESS. DO NOT READ. CHECK ALL THAT APPLY] [PROBE: ANYTHING ELSE?]
BETTER/HEALTHIER BABY MOTHER-BABY BONDING, CLOSENESS BREASTFEEDING ENJOYABLE EASIER, MORE CONVENIENT CHEAPER/PROVIDED FOR FREE FRIENDS/FAMILY ARE FAMILIAR WITH IT AND CAN HELP ME OTHER: SPECIFY ______________________________
45. What, if any, disadvantages do you see of breastfeeding? [UNAIDED AWARENESS. DO NOT READ. CHECK ALL THAT APPLY] [PROBE: ANYTHING ELSE?]
NOT ENOUGH BREAST MILK TO SATISFY BABY HARD TO DO WHEN ONE IS GOING BACK TO WORK OR SCHOOL PAIN OR DISCOMFORT NO ONE ELSE CAN FEED THE BABY TOO TIME-CONSUMING TOO MUCH WORK COMPARED TO FORMULA MORE EXPENSIVE COMPARED TO FORMULA FRIENDS/FAMILY ARE NOT FAMILIAR WITH IT CANNOT HELP ME OTHER: SPECIFY ______________________________
FRIENDS
46. Do you have friends who you think are eligible for WIC but who haven’t applied for WIC benefits?
YES NO
47. Do you know anyone who was in WIC but dropped out before their certification period was over?
YES NO
OMB Number: 0584-0484 Expiration Date: 6/30/2012
PREGNANT, BREASTFEEDING, OR POSTPARTUM
Telephone Survey Instrument A1-19
48. What, do you think, are the main reasons that people don’t participate in WIC? PROBE: Anything else? [DO NOT READ. CODE UP TO THREE REPLIES.]
LACK OF TRANSPORTATION TO CLINIC, TRANSPORTATION DIFFICULTIES THEY DON’T KNOW THAT WIC EXISTS INCONVENIENT HOURS/DAYS CLINIC OPEN SERVICES (INCLUDING WAITING TIME) TAKE TOO MUCH TIME WAITING SPACE AT CLINIC IS LIMITED LACK OF CHILD CARE LANGUAGE BARRIERS PROBLEMS QUALIFYING FOR BENEFITS DIFFICULTIES KEEPING APPOINTMENT TIMES WIC FOOD SELECTION NOT DESIRABLE WIC FOOD STORES NOT CONVENIENT (HOURS OR LOCATION) WIC FOOD HARD TO FIND ON SHELVES (BRANDS, QUANTITIES) IMMIGRATION CONCERNS DIDN’T NEED FOOD BENEFIT OTHER: PLEASE SPECIFY______________________________
DEMOGRAPHICS
We’re almost done with this survey. I’d like to ask a few questions for classification purposes only.
49. Are you… [READ]
Hispanic or Latino? Not Hispanic or Latino? REFUSED
50. How would you characterize yourself in terms of race? [READ ALL. CHECK AS MANY AS APPLY]
American Indian or Alaska Native Asian American Black or African American Native Hawaiian or Other Pacific Islander White REFUSED
Volume 1: Participant Characteristics (Final Report)
20
51. What is the highest level of education you have attained? [READ UNTIL R. INDICATES ANSWER]
Refused Elementary school (6 years or less of education) Some high school (7-11 years of education) High school diploma or GED Some college Associate’s degree Bachelor’s degree Advanced degree
52. What is your first language, that is, the language you speak at home?
English Arabic Cambodian Cantonese/
Mandarin Farsi French/Creole Fulani Hindi
Hmong Khmer Korean Laotian Punjabi Russian Somali
Spanish Swahili Tamil Tagalog Urdu Vietnamese Other: SPECIFY
_________
IF R. HAS NOT BEEN CHOSEN FOR IN-HOME AUDIT, READ:
Thank you so much for your help in answering this survey. Your feedback, combined with other confidential responses, will help improve the WIC program. Thanks again. Have a great day/evening.
APPENDIX A2: TELEPHONE SURVEY INSTRUMENT
(INFANT AND CHILD VERSION)

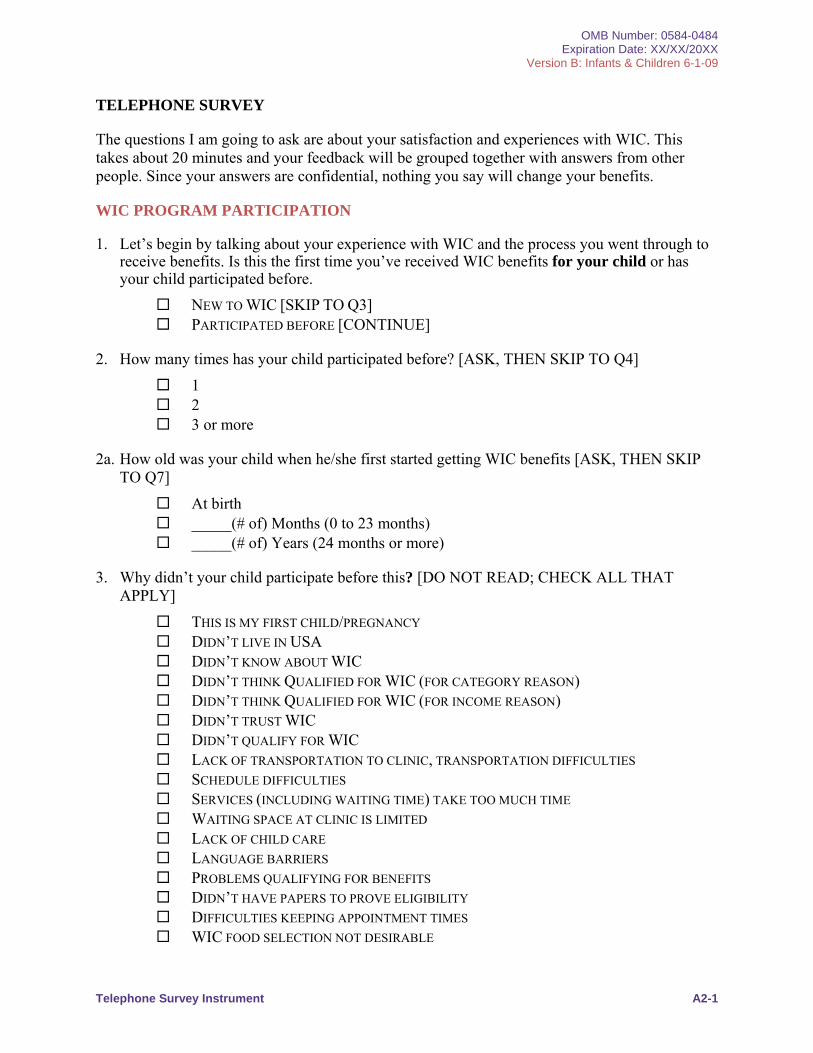
OMB Number: 0584-0484 Expiration Date: XX/XX/20XX
Version B: Infants & Children 6-1-09
Telephone Survey Instrument A2-1
TELEPHONE SURVEY
The questions I am going to ask are about your satisfaction and experiences with WIC. This takes about 20 minutes and your feedback will be grouped together with answers from other people. Since your answers are confidential, nothing you say will change your benefits.
WIC PROGRAM PARTICIPATION
1. Let’s begin by talking about your experience with WIC and the process you went through to receive benefits. Is this the first time you’ve received WIC benefits for your child or has your child participated before.
NEW TO WIC [SKIP TO Q3] PARTICIPATED BEFORE [CONTINUE]
2. How many times has your child participated before? [ASK, THEN SKIP TO Q4]
1 2 3 or more
2a. How old was your child when he/she first started getting WIC benefits [ASK, THEN SKIP TO Q7]
At birth _____(# of) Months (0 to 23 months) _____(# of) Years (24 months or more)
3. Why didn’t your child participate before this? [DO NOT READ; CHECK ALL THAT APPLY]
THIS IS MY FIRST CHILD/PREGNANCY DIDN’T LIVE IN USA DIDN’T KNOW ABOUT WIC DIDN’T THINK QUALIFIED FOR WIC (FOR CATEGORY REASON) DIDN’T THINK QUALIFIED FOR WIC (FOR INCOME REASON) DIDN’T TRUST WIC DIDN’T QUALIFY FOR WIC LACK OF TRANSPORTATION TO CLINIC, TRANSPORTATION DIFFICULTIES SCHEDULE DIFFICULTIES SERVICES (INCLUDING WAITING TIME) TAKE TOO MUCH TIME WAITING SPACE AT CLINIC IS LIMITED LACK OF CHILD CARE LANGUAGE BARRIERS PROBLEMS QUALIFYING FOR BENEFITS DIDN’T HAVE PAPERS TO PROVE ELIGIBILITY DIFFICULTIES KEEPING APPOINTMENT TIMES WIC FOOD SELECTION NOT DESIRABLE
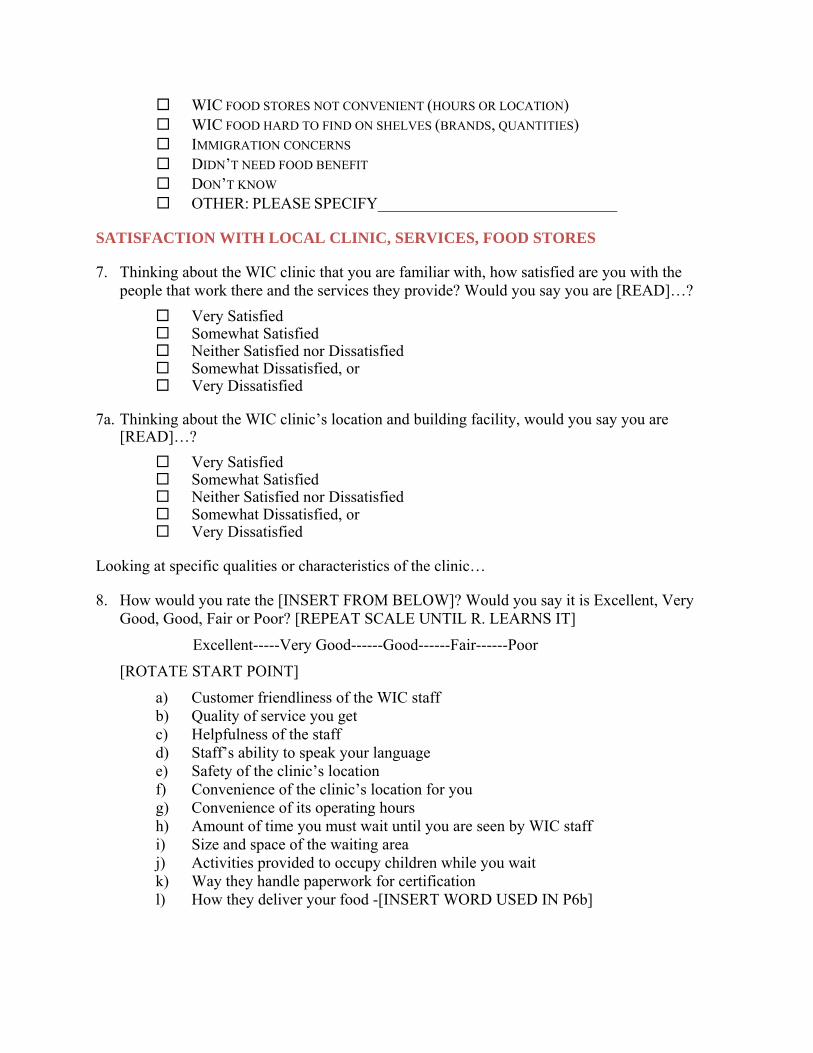
WIC FOOD STORES NOT CONVENIENT (HOURS OR LOCATION) WIC FOOD HARD TO FIND ON SHELVES (BRANDS, QUANTITIES) IMMIGRATION CONCERNS DIDN’T NEED FOOD BENEFIT DON’T KNOW OTHER: PLEASE SPECIFY______________________________
SATISFACTION WITH LOCAL CLINIC, SERVICES, FOOD STORES
7. Thinking about the WIC clinic that you are familiar with, how satisfied are you with the people that work there and the services they provide? Would you say you are [READ]…?
Very Satisfied Somewhat Satisfied Neither Satisfied nor Dissatisfied Somewhat Dissatisfied, or Very Dissatisfied
7a. Thinking about the WIC clinic’s location and building facility, would you say you are [READ]…?
Very Satisfied Somewhat Satisfied Neither Satisfied nor Dissatisfied Somewhat Dissatisfied, or Very Dissatisfied
Looking at specific qualities or characteristics of the clinic…
8. How would you rate the [INSERT FROM BELOW]? Would you say it is Excellent, Very Good, Good, Fair or Poor? [REPEAT SCALE UNTIL R. LEARNS IT]
Excellent-----Very Good------Good------Fair------Poor
[ROTATE START POINT]
a) Customer friendliness of the WIC staff b) Quality of service you get c) Helpfulness of the staff d) Staff’s ability to speak your language e) Safety of the clinic’s location f) Convenience of the clinic’s location for you g) Convenience of its operating hours h) Amount of time you must wait until you are seen by WIC staff i) Size and space of the waiting area j) Activities provided to occupy children while you wait k) Way they handle paperwork for certification l) How they deliver your food -[INSERT WORD USED IN P6b]
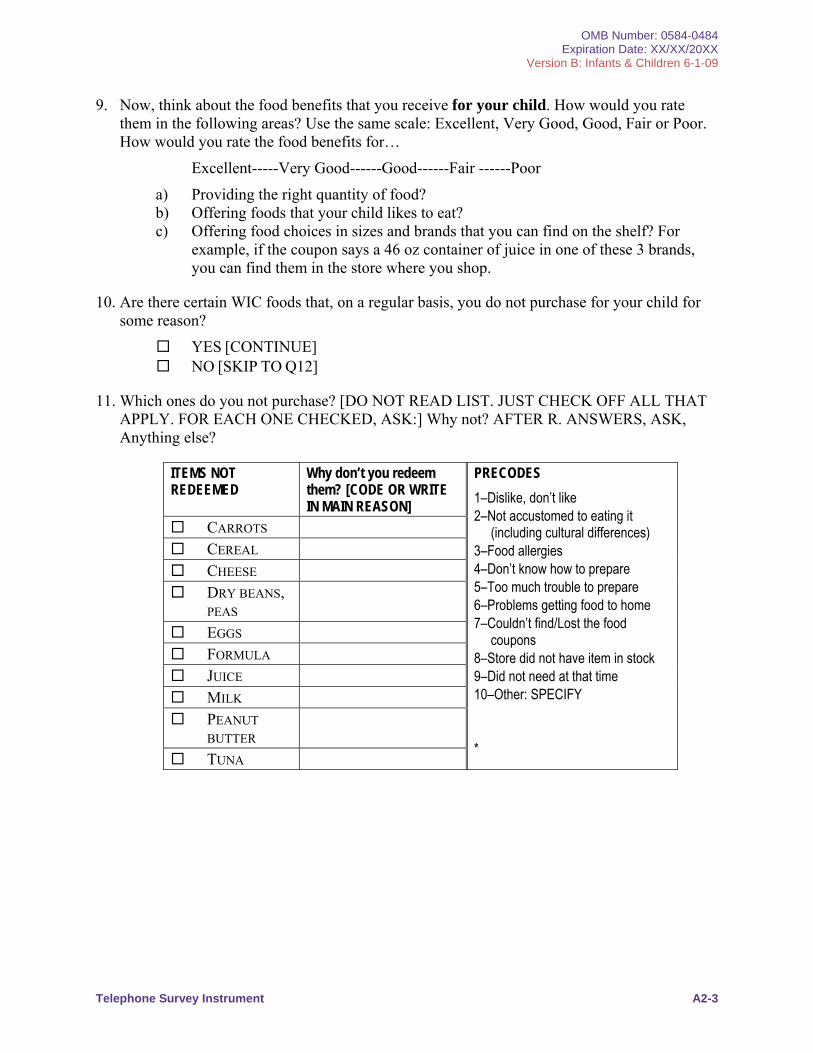
OMB Number: 0584-0484 Expiration Date: XX/XX/20XX
Version B: Infants & Children 6-1-09
Telephone Survey Instrument A2-3
9. Now, think about the food benefits that you receive for your child. How would you rate them in the following areas? Use the same scale: Excellent, Very Good, Good, Fair or Poor. How would you rate the food benefits for…
Excellent-----Very Good------Good------Fair ------Poor
a) Providing the right quantity of food? b) Offering foods that your child likes to eat? c) Offering food choices in sizes and brands that you can find on the shelf? For
example, if the coupon says a 46 oz container of juice in one of these 3 brands, you can find them in the store where you shop.
10. Are there certain WIC foods that, on a regular basis, you do not purchase for your child for some reason?
YES [CONTINUE] NO [SKIP TO Q12]
11. Which ones do you not purchase? [DO NOT READ LIST. JUST CHECK OFF ALL THAT APPLY. FOR EACH ONE CHECKED, ASK:] Why not? AFTER R. ANSWERS, ASK, Anything else?
ITEMS NOT REDEEMED
Why don’t you redeem them? [CODE OR WRITE IN MAIN REASON]
PRECODES
1–Dislike, don’t like 2–Not accustomed to eating it
(including cultural differences) 3–Food allergies 4–Don’t know how to prepare 5–Too much trouble to prepare 6–Problems getting food to home 7–Couldn’t find/Lost the food
coupons 8–Store did not have item in stock 9–Did not need at that time 10–Other: SPECIFY *
CARROTS CEREAL CHEESE DRY BEANS,
PEAS
EGGS FORMULA JUICE MILK PEANUT
BUTTER
TUNA
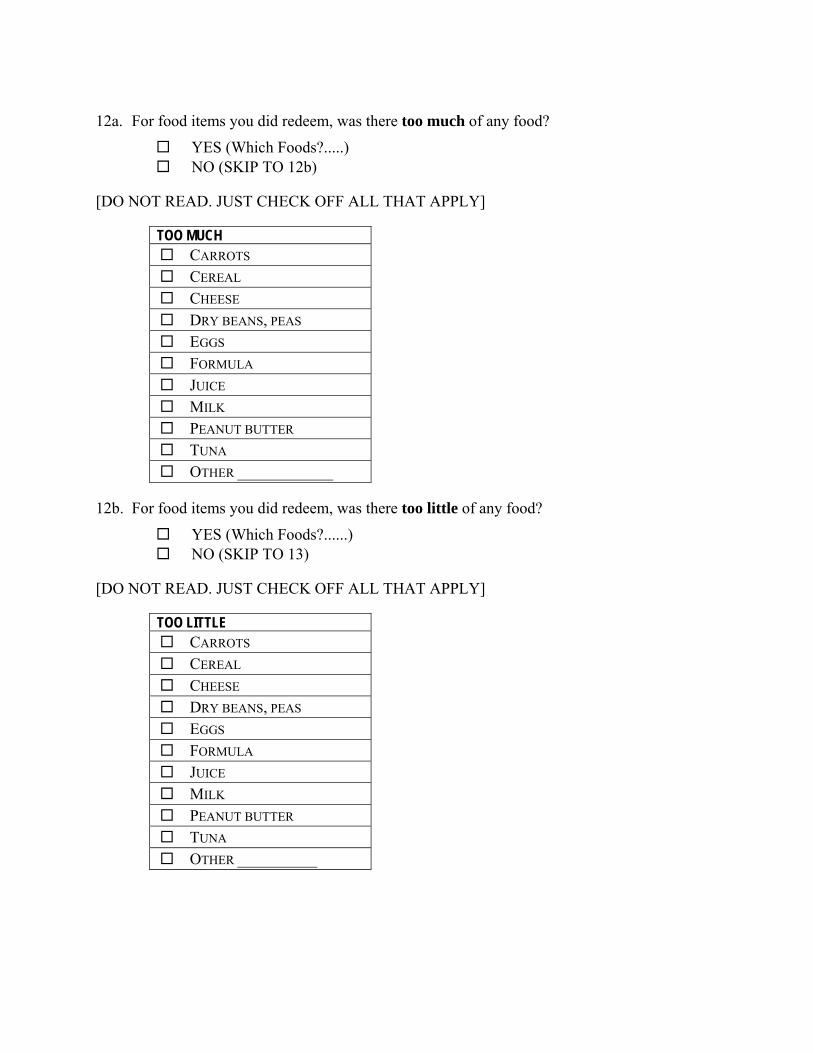
12a. For food items you did redeem, was there too much of any food?
YES (Which Foods?.....) NO (SKIP TO 12b)
[DO NOT READ. JUST CHECK OFF ALL THAT APPLY]
TOO MUCH CARROTS CEREAL CHEESE DRY BEANS, PEAS EGGS FORMULA JUICE MILK PEANUT BUTTER TUNA OTHER ____________
12b. For food items you did redeem, was there too little of any food?
YES (Which Foods?......) NO (SKIP TO 13)
[DO NOT READ. JUST CHECK OFF ALL THAT APPLY]
TOO LITTLE CARROTS CEREAL CHEESE DRY BEANS, PEAS EGGS FORMULA JUICE MILK PEANUT BUTTER TUNA OTHER __________
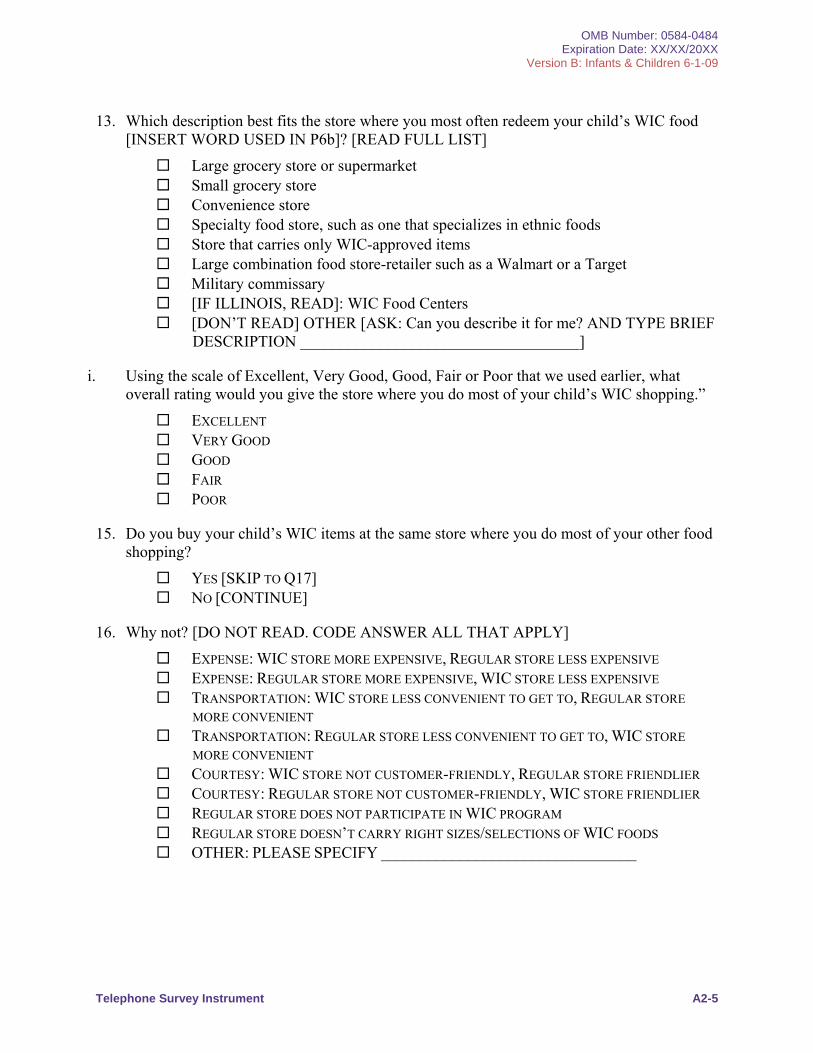
OMB Number: 0584-0484 Expiration Date: XX/XX/20XX
Version B: Infants & Children 6-1-09
Telephone Survey Instrument A2-5
13. Which description best fits the store where you most often redeem your child’s WIC food [INSERT WORD USED IN P6b]? [READ FULL LIST]
Large grocery store or supermarket Small grocery store Convenience store Specialty food store, such as one that specializes in ethnic foods Store that carries only WIC-approved items Large combination food store-retailer such as a Walmart or a Target Military commissary [IF ILLINOIS, READ]: WIC Food Centers [DON’T READ] OTHER [ASK: Can you describe it for me? AND TYPE BRIEF
DESCRIPTION ___________________________________]
i. Using the scale of Excellent, Very Good, Good, Fair or Poor that we used earlier, what overall rating would you give the store where you do most of your child’s WIC shopping.”
EXCELLENT VERY GOOD GOOD FAIR POOR
15. Do you buy your child’s WIC items at the same store where you do most of your other food shopping?
YES [SKIP TO Q17] NO [CONTINUE]
16. Why not? [DO NOT READ. CODE ANSWER ALL THAT APPLY]
EXPENSE: WIC STORE MORE EXPENSIVE, REGULAR STORE LESS EXPENSIVE EXPENSE: REGULAR STORE MORE EXPENSIVE, WIC STORE LESS EXPENSIVE TRANSPORTATION: WIC STORE LESS CONVENIENT TO GET TO, REGULAR STORE
MORE CONVENIENT TRANSPORTATION: REGULAR STORE LESS CONVENIENT TO GET TO, WIC STORE
MORE CONVENIENT COURTESY: WIC STORE NOT CUSTOMER-FRIENDLY, REGULAR STORE FRIENDLIER COURTESY: REGULAR STORE NOT CUSTOMER-FRIENDLY, WIC STORE FRIENDLIER REGULAR STORE DOES NOT PARTICIPATE IN WIC PROGRAM REGULAR STORE DOESN’T CARRY RIGHT SIZES/SELECTIONS OF WIC FOODS OTHER: PLEASE SPECIFY ________________________________
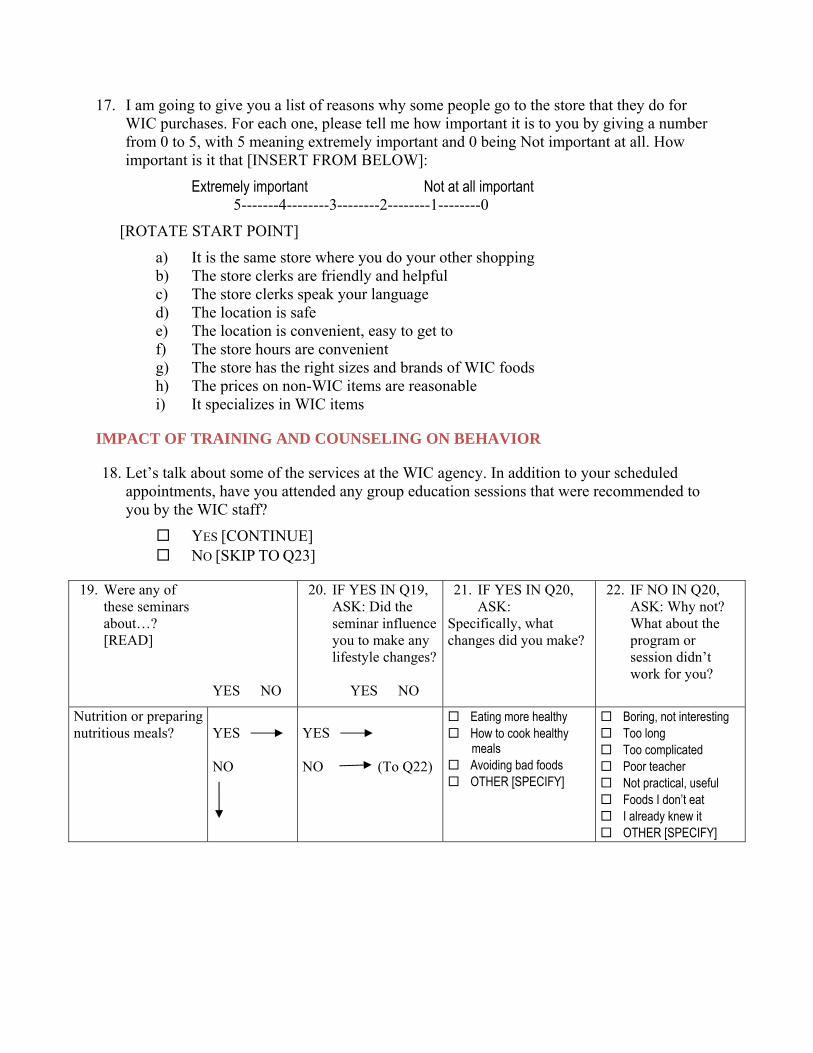
17. I am going to give you a list of reasons why some people go to the store that they do for WIC purchases. For each one, please tell me how important it is to you by giving a number from 0 to 5, with 5 meaning extremely important and 0 being Not important at all. How important is it that [INSERT FROM BELOW]:
Extremely important Not at all important 5-------4--------3--------2--------1--------0
[ROTATE START POINT]
a) It is the same store where you do your other shopping b) The store clerks are friendly and helpful c) The store clerks speak your language d) The location is safe e) The location is convenient, easy to get to f) The store hours are convenient g) The store has the right sizes and brands of WIC foods h) The prices on non-WIC items are reasonable i) It specializes in WIC items
IMPACT OF TRAINING AND COUNSELING ON BEHAVIOR
18. Let’s talk about some of the services at the WIC agency. In addition to your scheduled appointments, have you attended any group education sessions that were recommended to you by the WIC staff?
YES [CONTINUE] NO [SKIP TO Q23]
19. Were any of these seminars about…? [READ]
YES NO
20. IF YES IN Q19, ASK: Did the seminar influence you to make any lifestyle changes?
YES NO
21. IF YES IN Q20, ASK:
Specifically, what changes did you make?
22. IF NO IN Q20, ASK: Why not? What about the program or session didn’t work for you?
Nutrition or preparing nutritious meals?
YES
NO
YES
NO (To Q22)
Eating more healthy How to cook healthy
meals Avoiding bad foods OTHER [SPECIFY]
Boring, not interesting Too long Too complicated Poor teacher Not practical, useful Foods I don’t eat I already knew it OTHER [SPECIFY]
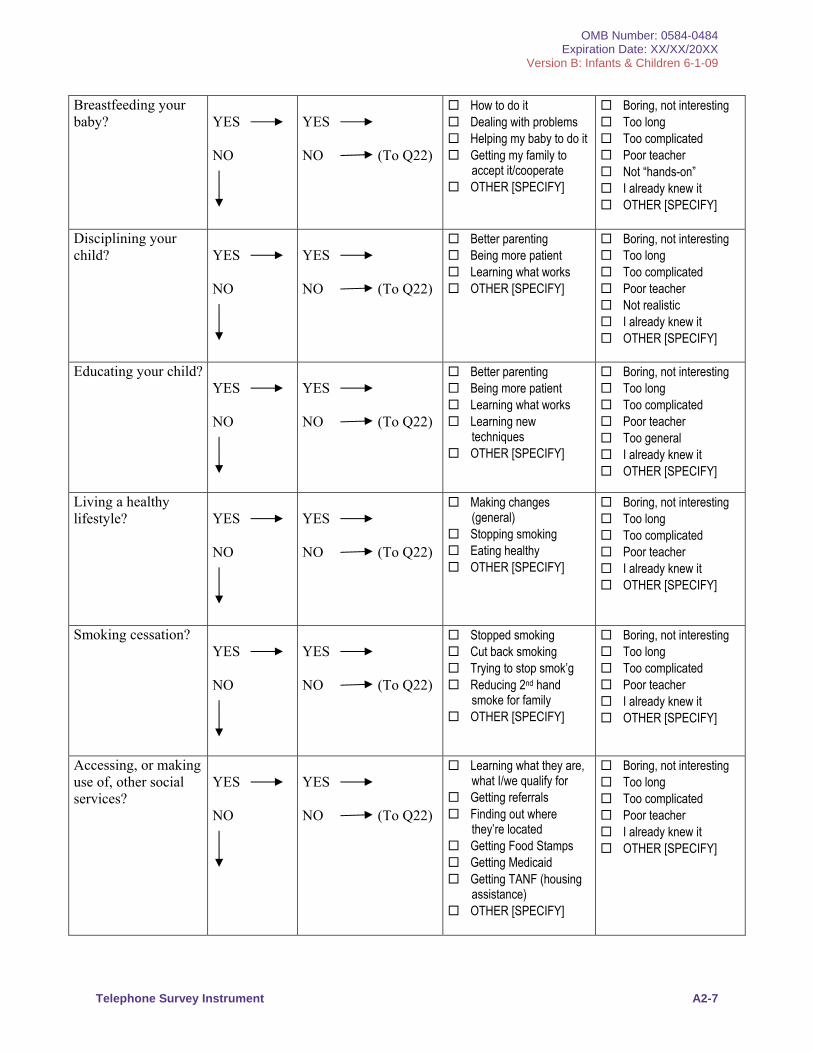
OMB Number: 0584-0484 Expiration Date: XX/XX/20XX
Version B: Infants & Children 6-1-09
Telephone Survey Instrument A2-7
Breastfeeding your baby?
YES
NO
YES
NO (To Q22)
How to do it Dealing with problems Helping my baby to do it Getting my family to
accept it/cooperate OTHER [SPECIFY]
Boring, not interesting Too long Too complicated Poor teacher Not “hands-on” I already knew it OTHER [SPECIFY]
Disciplining your child?
YES
NO
YES
NO (To Q22)
Better parenting Being more patient Learning what works OTHER [SPECIFY]
Boring, not interesting Too long Too complicated Poor teacher Not realistic I already knew it OTHER [SPECIFY]
Educating your child? YES
NO
YES
NO (To Q22)
Better parenting Being more patient Learning what works Learning new
techniques OTHER [SPECIFY]
Boring, not interesting Too long Too complicated Poor teacher Too general I already knew it OTHER [SPECIFY]
Living a healthy lifestyle?
YES
NO
YES
NO (To Q22)
Making changes (general)
Stopping smoking Eating healthy OTHER [SPECIFY]
Boring, not interesting Too long Too complicated Poor teacher I already knew it OTHER [SPECIFY]
Smoking cessation? YES
NO
YES
NO (To Q22)
Stopped smoking Cut back smoking Trying to stop smok’g Reducing 2nd hand
smoke for family OTHER [SPECIFY]
Boring, not interesting Too long Too complicated Poor teacher I already knew it OTHER [SPECIFY]
Accessing, or making use of, other social services?
YES
NO
YES
NO (To Q22)
Learning what they are, what I/we qualify for
Getting referrals Finding out where
they’re located Getting Food Stamps Getting Medicaid Getting TANF (housing
assistance) OTHER [SPECIFY]
Boring, not interesting Too long Too complicated Poor teacher I already knew it OTHER [SPECIFY]
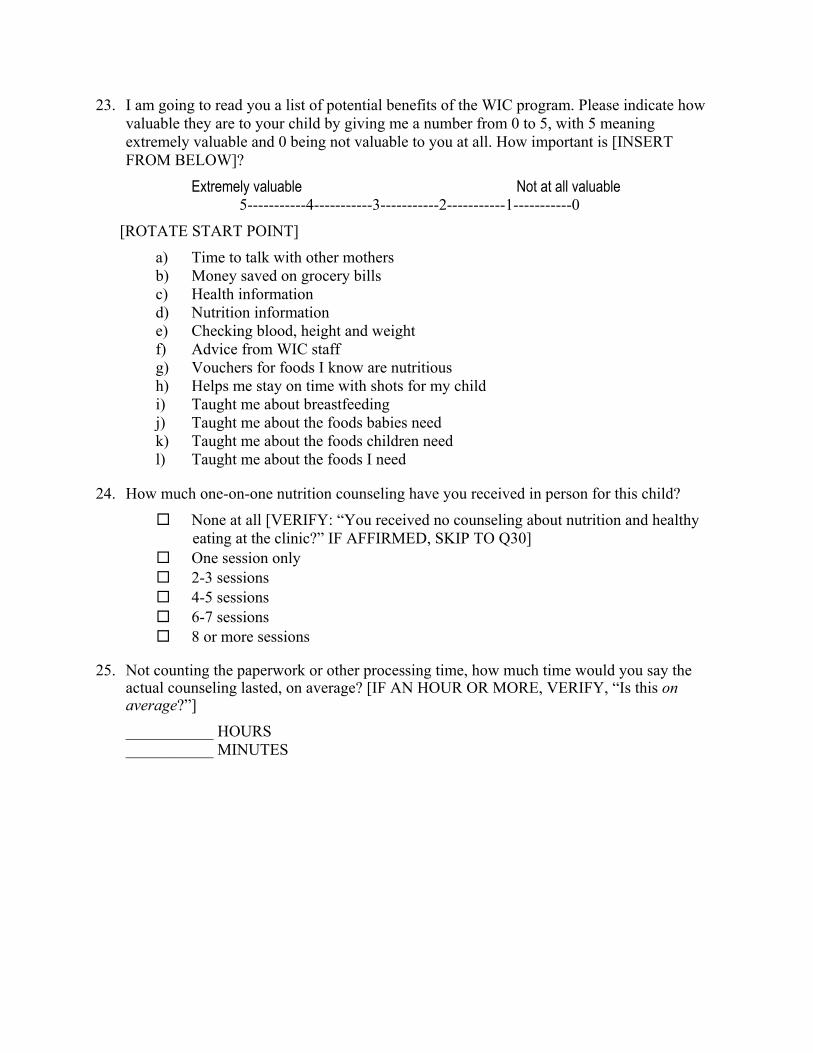
23. I am going to read you a list of potential benefits of the WIC program. Please indicate how valuable they are to your child by giving me a number from 0 to 5, with 5 meaning extremely valuable and 0 being not valuable to you at all. How important is [INSERT FROM BELOW]?
Extremely valuable Not at all valuable 5-----------4-----------3-----------2-----------1-----------0
[ROTATE START POINT]
a) Time to talk with other mothers b) Money saved on grocery bills c) Health information d) Nutrition information e) Checking blood, height and weight f) Advice from WIC staff g) Vouchers for foods I know are nutritious h) Helps me stay on time with shots for my child i) Taught me about breastfeeding j) Taught me about the foods babies need k) Taught me about the foods children need l) Taught me about the foods I need
24. How much one-on-one nutrition counseling have you received in person for this child?
None at all [VERIFY: “You received no counseling about nutrition and healthy eating at the clinic?” IF AFFIRMED, SKIP TO Q30]
One session only 2-3 sessions 4-5 sessions 6-7 sessions 8 or more sessions
25. Not counting the paperwork or other processing time, how much time would you say the actual counseling lasted, on average? [IF AN HOUR OR MORE, VERIFY, “Is this on average?”]
___________ HOURS ___________ MINUTES
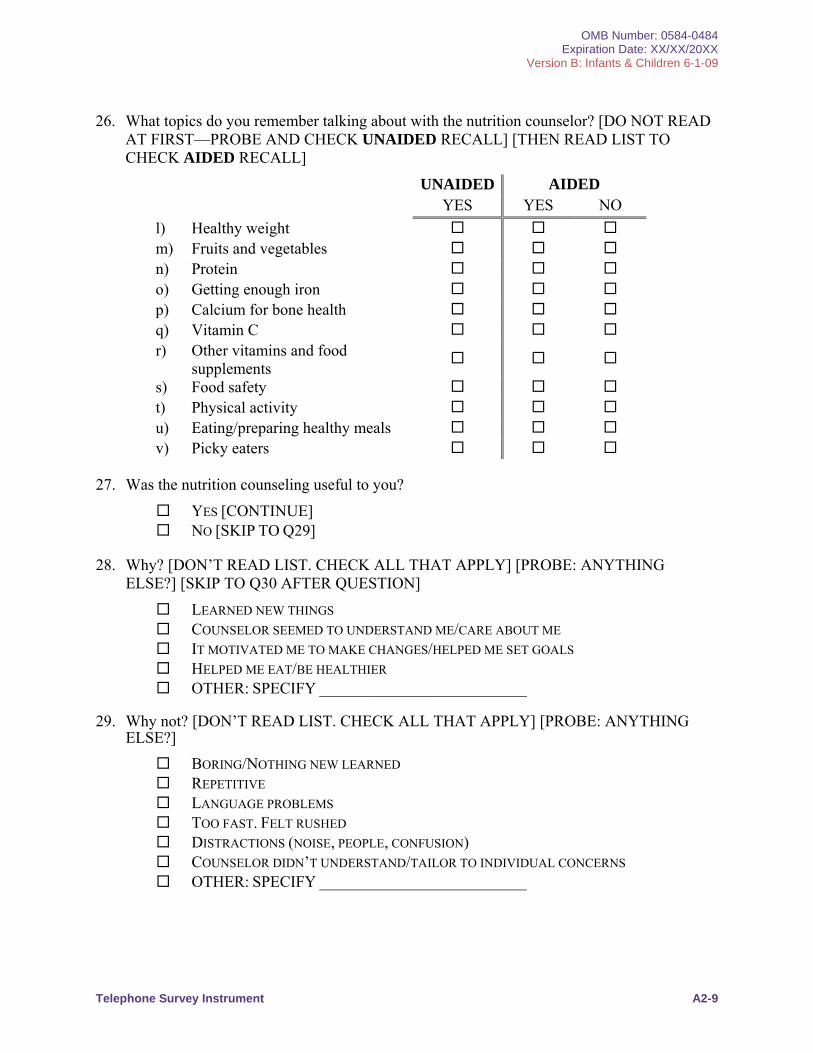
OMB Number: 0584-0484 Expiration Date: XX/XX/20XX
Version B: Infants & Children 6-1-09
Telephone Survey Instrument A2-9
26. What topics do you remember talking about with the nutrition counselor? [DO NOT READ AT FIRST—PROBE AND CHECK UNAIDED RECALL] [THEN READ LIST TO CHECK AIDED RECALL]
UNAIDED AIDED YES YES NO
l) Healthy weight m) Fruits and vegetables n) Protein o) Getting enough iron p) Calcium for bone health q) Vitamin C r) Other vitamins and food
supplements
s) Food safety t) Physical activity u) Eating/preparing healthy meals v) Picky eaters
27. Was the nutrition counseling useful to you?
YES [CONTINUE] NO [SKIP TO Q29]
28. Why? [DON’T READ LIST. CHECK ALL THAT APPLY] [PROBE: ANYTHING ELSE?] [SKIP TO Q30 AFTER QUESTION]
LEARNED NEW THINGS COUNSELOR SEEMED TO UNDERSTAND ME/CARE ABOUT ME IT MOTIVATED ME TO MAKE CHANGES/HELPED ME SET GOALS HELPED ME EAT/BE HEALTHIER OTHER: SPECIFY __________________________
29. Why not? [DON’T READ LIST. CHECK ALL THAT APPLY] [PROBE: ANYTHING ELSE?]
BORING/NOTHING NEW LEARNED REPETITIVE LANGUAGE PROBLEMS TOO FAST. FELT RUSHED DISTRACTIONS (NOISE, PEOPLE, CONFUSION) COUNSELOR DIDN’T UNDERSTAND/TAILOR TO INDIVIDUAL CONCERNS OTHER: SPECIFY __________________________
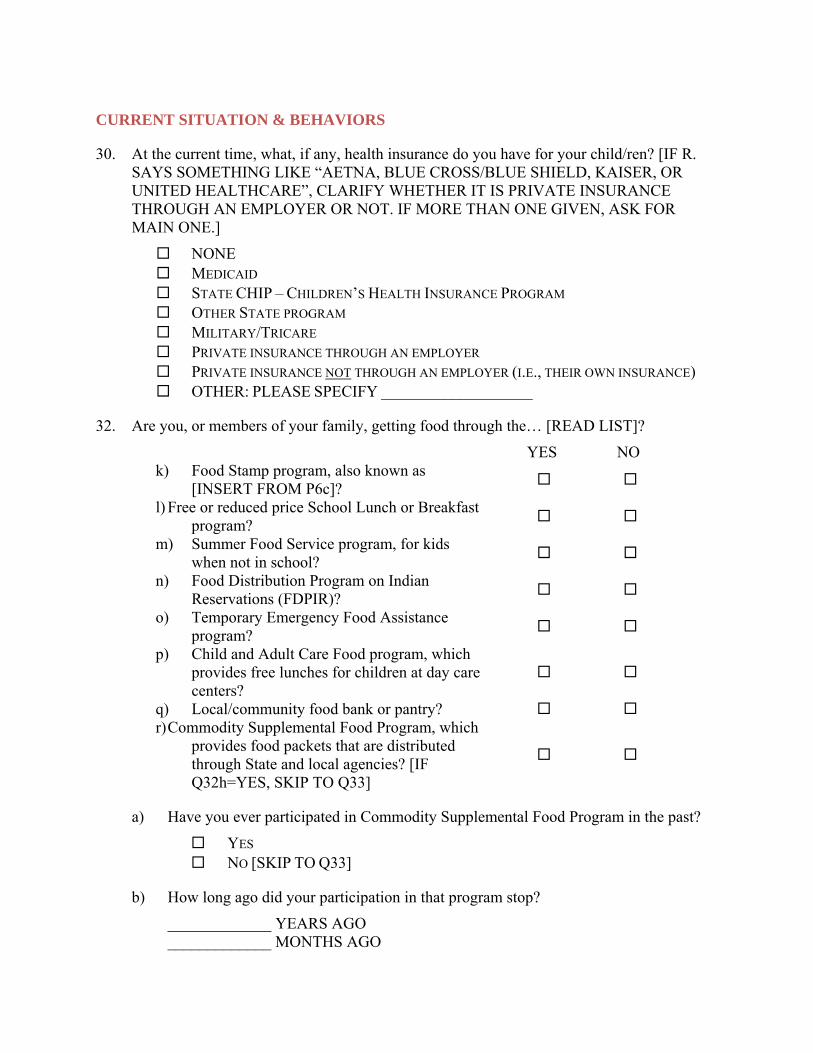
CURRENT SITUATION & BEHAVIORS
30. At the current time, what, if any, health insurance do you have for your child/ren? [IF R. SAYS SOMETHING LIKE “AETNA, BLUE CROSS/BLUE SHIELD, KAISER, OR UNITED HEALTHCARE”, CLARIFY WHETHER IT IS PRIVATE INSURANCE THROUGH AN EMPLOYER OR NOT. IF MORE THAN ONE GIVEN, ASK FOR MAIN ONE.]
NONE MEDICAID STATE CHIP – CHILDREN’S HEALTH INSURANCE PROGRAM OTHER STATE PROGRAM MILITARY/TRICARE PRIVATE INSURANCE THROUGH AN EMPLOYER PRIVATE INSURANCE NOT THROUGH AN EMPLOYER (I.E., THEIR OWN INSURANCE) OTHER: PLEASE SPECIFY ___________________
32. Are you, or members of your family, getting food through the… [READ LIST]?
YES NO k) Food Stamp program, also known as
[INSERT FROM P6c]?
l) Free or reduced price School Lunch or Breakfast program?
m) Summer Food Service program, for kids when not in school?
n) Food Distribution Program on Indian Reservations (FDPIR)?
o) Temporary Emergency Food Assistance program?
p) Child and Adult Care Food program, which provides free lunches for children at day care centers?
q) Local/community food bank or pantry? r) Commodity Supplemental Food Program, which
provides food packets that are distributed through State and local agencies? [IF Q32h=YES, SKIP TO Q33]
a) Have you ever participated in Commodity Supplemental Food Program in the past?
YES NO [SKIP TO Q33]
b) How long ago did your participation in that program stop?
_____________ YEARS AGO _____________ MONTHS AGO
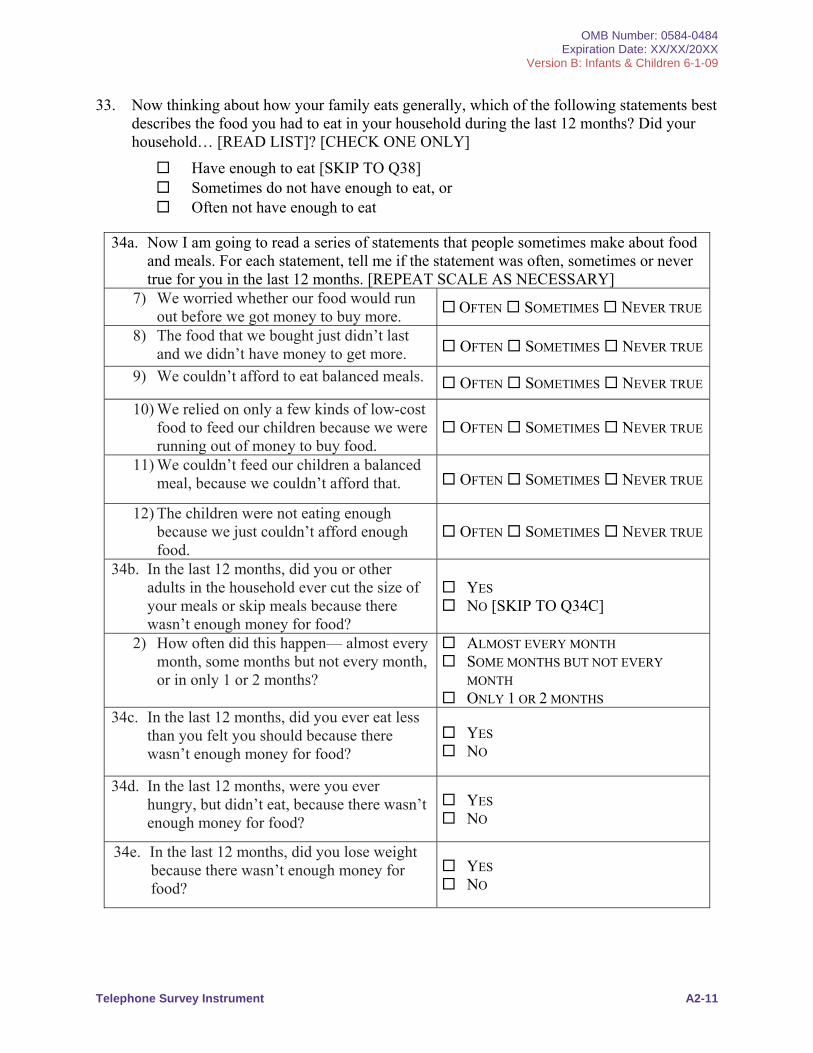
OMB Number: 0584-0484 Expiration Date: XX/XX/20XX
Version B: Infants & Children 6-1-09
Telephone Survey Instrument A2-11
33. Now thinking about how your family eats generally, which of the following statements best describes the food you had to eat in your household during the last 12 months? Did your household… [READ LIST]? [CHECK ONE ONLY]
Have enough to eat [SKIP TO Q38] Sometimes do not have enough to eat, or Often not have enough to eat
34a. Now I am going to read a series of statements that people sometimes make about food and meals. For each statement, tell me if the statement was often, sometimes or never true for you in the last 12 months. [REPEAT SCALE AS NECESSARY]
7) We worried whether our food would run out before we got money to buy more.
OFTEN SOMETIMES NEVER TRUE
8) The food that we bought just didn’t last and we didn’t have money to get more. OFTEN SOMETIMES NEVER TRUE
9) We couldn’t afford to eat balanced meals. OFTEN SOMETIMES NEVER TRUE
10) We relied on only a few kinds of low-cost food to feed our children because we were running out of money to buy food.
OFTEN SOMETIMES NEVER TRUE
11) We couldn’t feed our children a balanced meal, because we couldn’t afford that. OFTEN SOMETIMES NEVER TRUE
12) The children were not eating enough because we just couldn’t afford enough food.
OFTEN SOMETIMES NEVER TRUE
34b. In the last 12 months, did you or other adults in the household ever cut the size of your meals or skip meals because there wasn’t enough money for food?
YES NO [SKIP TO Q34C]
2) How often did this happen— almost every month, some months but not every month, or in only 1 or 2 months?
ALMOST EVERY MONTH SOME MONTHS BUT NOT EVERY
MONTH ONLY 1 OR 2 MONTHS
34c. In the last 12 months, did you ever eat less than you felt you should because there wasn’t enough money for food?
YES NO
34d. In the last 12 months, were you ever hungry, but didn’t eat, because there wasn’t enough money for food?
YES NO
34e. In the last 12 months, did you lose weight because there wasn’t enough money for food?
YES NO
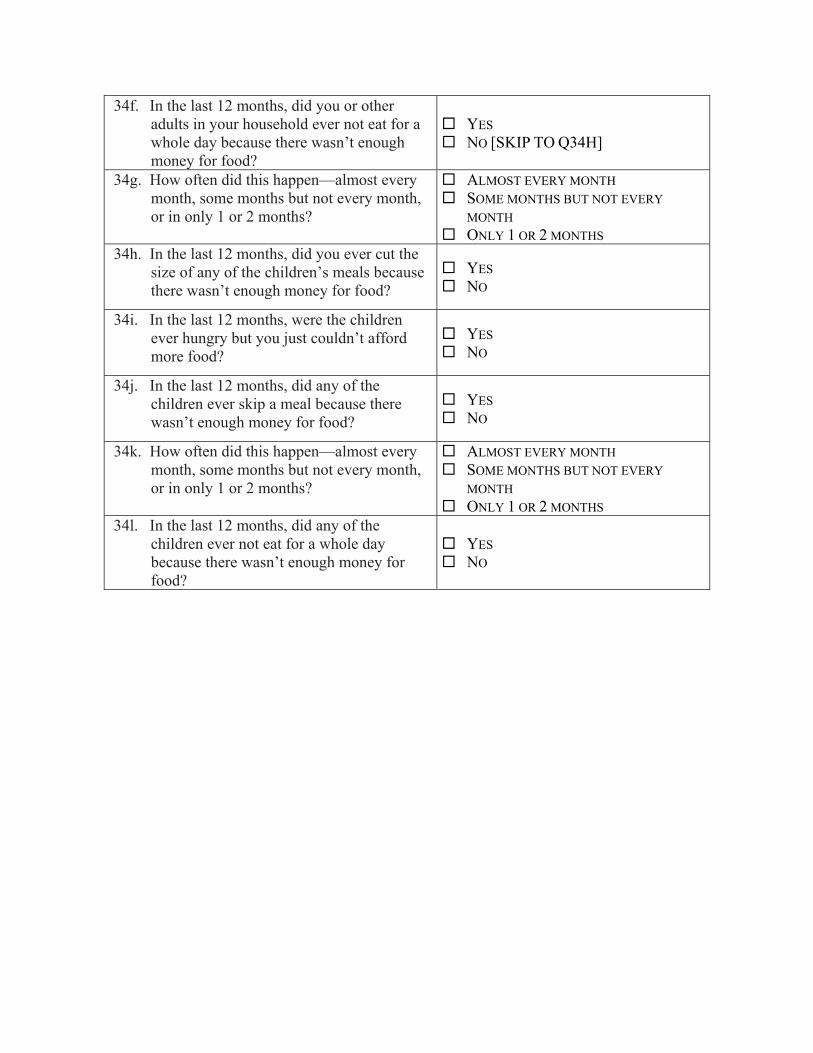
34f. In the last 12 months, did you or other adults in your household ever not eat for a whole day because there wasn’t enough money for food?
YES NO [SKIP TO Q34H]
34g. How often did this happen—almost every month, some months but not every month, or in only 1 or 2 months?
ALMOST EVERY MONTH SOME MONTHS BUT NOT EVERY
MONTH ONLY 1 OR 2 MONTHS
34h. In the last 12 months, did you ever cut the size of any of the children’s meals because there wasn’t enough money for food?
YES NO
34i. In the last 12 months, were the children ever hungry but you just couldn’t afford more food?
YES NO
34j. In the last 12 months, did any of the children ever skip a meal because there wasn’t enough money for food?
YES NO
34k. How often did this happen—almost every month, some months but not every month, or in only 1 or 2 months?
ALMOST EVERY MONTH SOME MONTHS BUT NOT EVERY
MONTH ONLY 1 OR 2 MONTHS
34l. In the last 12 months, did any of the children ever not eat for a whole day because there wasn’t enough money for food?
YES NO
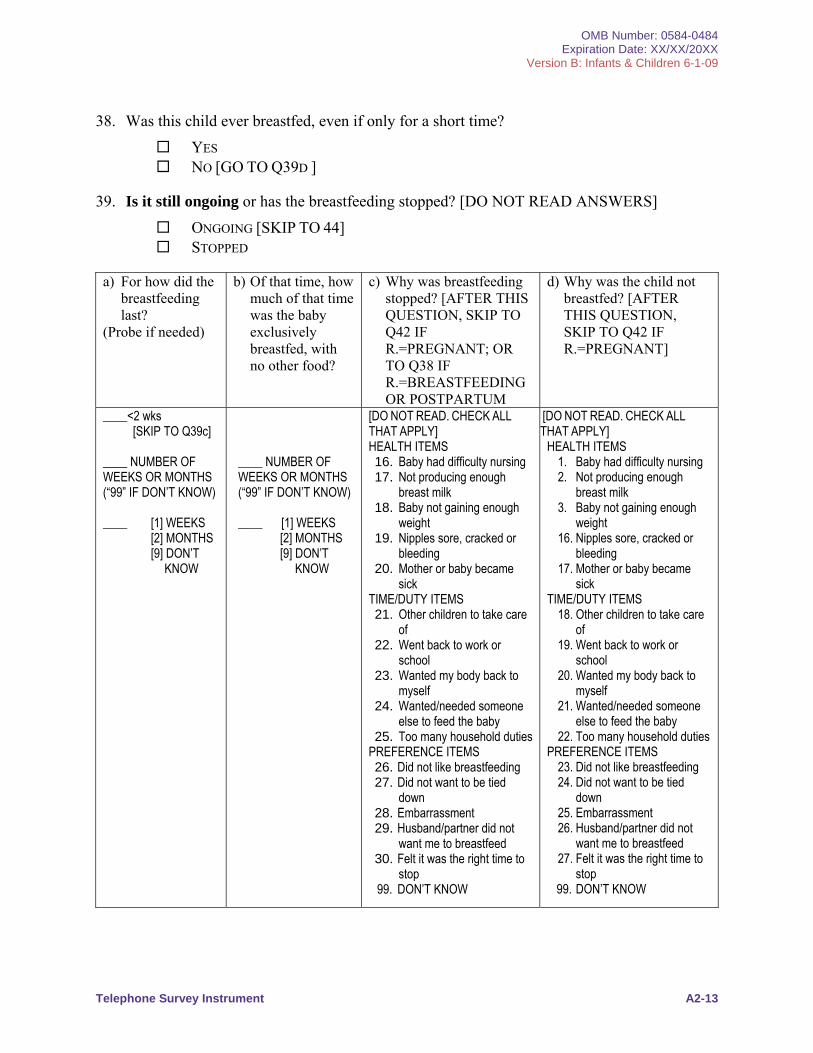
OMB Number: 0584-0484 Expiration Date: XX/XX/20XX
Version B: Infants & Children 6-1-09
Telephone Survey Instrument A2-13
38. Was this child ever breastfed, even if only for a short time?
YES NO [GO TO Q39D ]
39. Is it still ongoing or has the breastfeeding stopped? [DO NOT READ ANSWERS]
ONGOING [SKIP TO 44] STOPPED
a) For how did the breastfeeding last?
(Probe if needed)
b) Of that time, how much of that time was the baby exclusively breastfed, with no other food?
c) Why was breastfeeding stopped? [AFTER THIS QUESTION, SKIP TO Q42 IF R.=PREGNANT; OR TO Q38 IF R.=BREASTFEEDING OR POSTPARTUM
d) Why was the child not breastfed? [AFTER THIS QUESTION, SKIP TO Q42 IF R.=PREGNANT]
____<2 wks [SKIP TO Q39c]
____ NUMBER OF WEEKS OR MONTHS (“99” IF DON’T KNOW) ____ [1] WEEKS
[2] MONTHS [9] DON’T
KNOW
____ NUMBER OF WEEKS OR MONTHS (“99” IF DON’T KNOW) ____ [1] WEEKS
[2] MONTHS [9] DON’T
KNOW
[DO NOT READ. CHECK ALL
THAT APPLY] HEALTH ITEMS 16. Baby had difficulty nursing 17. Not producing enough
breast milk 18. Baby not gaining enough
weight 19. Nipples sore, cracked or
bleeding 20. Mother or baby became
sick TIME/DUTY ITEMS 21. Other children to take care
of 22. Went back to work or
school 23. Wanted my body back to
myself 24. Wanted/needed someone
else to feed the baby 25. Too many household duties
PREFERENCE ITEMS 26. Did not like breastfeeding 27. Did not want to be tied
down 28. Embarrassment 29. Husband/partner did not
want me to breastfeed 30. Felt it was the right time to
stop 99. DON’T KNOW
[DO NOT READ. CHECK ALL
THAT APPLY] HEALTH ITEMS
1. Baby had difficulty nursing 2. Not producing enough
breast milk 3. Baby not gaining enough
weight 16. Nipples sore, cracked or
bleeding 17. Mother or baby became
sick TIME/DUTY ITEMS
18. Other children to take care of
19. Went back to work or school
20. Wanted my body back to myself
21. Wanted/needed someone else to feed the baby
22. Too many household duties PREFERENCE ITEMS
23. Did not like breastfeeding 24. Did not want to be tied
down 25. Embarrassment 26. Husband/partner did not
want me to breastfeed 27. Felt it was the right time to
stop 99. DON’T KNOW
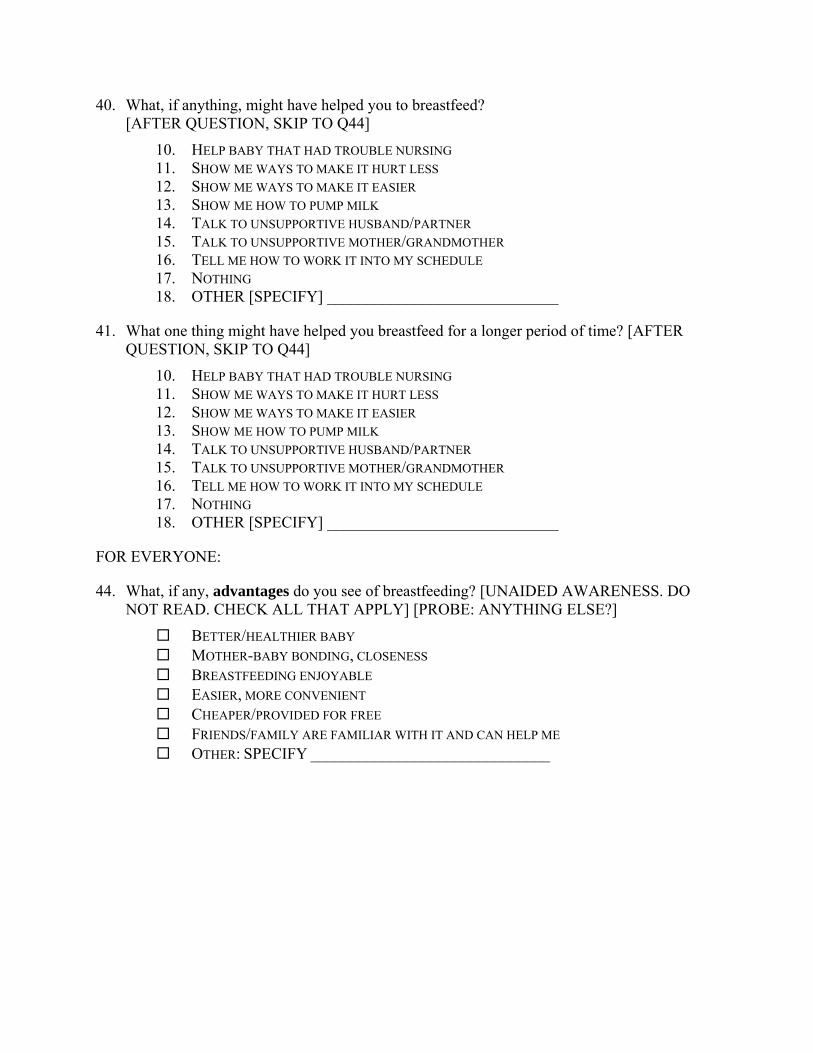
40. What, if anything, might have helped you to breastfeed? [AFTER QUESTION, SKIP TO Q44]
10. HELP BABY THAT HAD TROUBLE NURSING 11. SHOW ME WAYS TO MAKE IT HURT LESS 12. SHOW ME WAYS TO MAKE IT EASIER 13. SHOW ME HOW TO PUMP MILK 14. TALK TO UNSUPPORTIVE HUSBAND/PARTNER 15. TALK TO UNSUPPORTIVE MOTHER/GRANDMOTHER 16. TELL ME HOW TO WORK IT INTO MY SCHEDULE 17. NOTHING 18. OTHER [SPECIFY] _____________________________
41. What one thing might have helped you breastfeed for a longer period of time? [AFTER QUESTION, SKIP TO Q44]
10. HELP BABY THAT HAD TROUBLE NURSING 11. SHOW ME WAYS TO MAKE IT HURT LESS 12. SHOW ME WAYS TO MAKE IT EASIER 13. SHOW ME HOW TO PUMP MILK 14. TALK TO UNSUPPORTIVE HUSBAND/PARTNER 15. TALK TO UNSUPPORTIVE MOTHER/GRANDMOTHER 16. TELL ME HOW TO WORK IT INTO MY SCHEDULE 17. NOTHING 18. OTHER [SPECIFY] _____________________________
FOR EVERYONE:
44. What, if any, advantages do you see of breastfeeding? [UNAIDED AWARENESS. DO NOT READ. CHECK ALL THAT APPLY] [PROBE: ANYTHING ELSE?]
BETTER/HEALTHIER BABY MOTHER-BABY BONDING, CLOSENESS BREASTFEEDING ENJOYABLE EASIER, MORE CONVENIENT CHEAPER/PROVIDED FOR FREE FRIENDS/FAMILY ARE FAMILIAR WITH IT AND CAN HELP ME OTHER: SPECIFY ______________________________
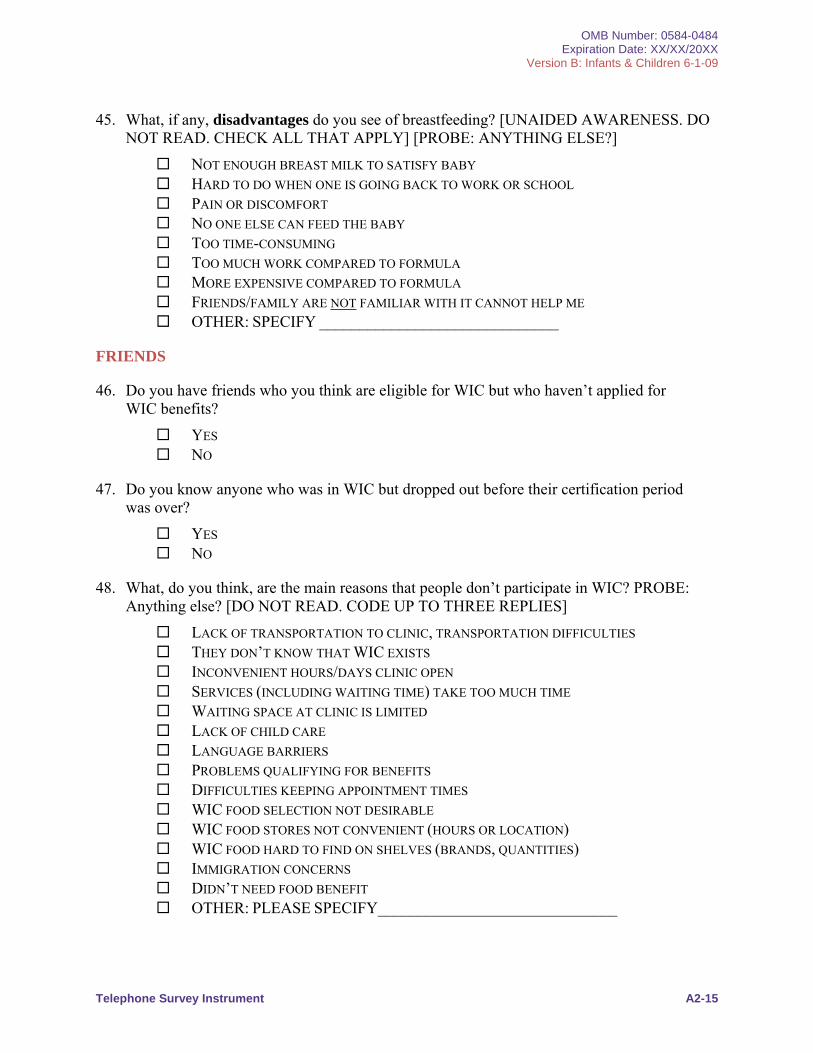
OMB Number: 0584-0484 Expiration Date: XX/XX/20XX
Version B: Infants & Children 6-1-09
Telephone Survey Instrument A2-15
45. What, if any, disadvantages do you see of breastfeeding? [UNAIDED AWARENESS. DO NOT READ. CHECK ALL THAT APPLY] [PROBE: ANYTHING ELSE?]
NOT ENOUGH BREAST MILK TO SATISFY BABY HARD TO DO WHEN ONE IS GOING BACK TO WORK OR SCHOOL PAIN OR DISCOMFORT NO ONE ELSE CAN FEED THE BABY TOO TIME-CONSUMING TOO MUCH WORK COMPARED TO FORMULA MORE EXPENSIVE COMPARED TO FORMULA FRIENDS/FAMILY ARE NOT FAMILIAR WITH IT CANNOT HELP ME OTHER: SPECIFY ______________________________
FRIENDS
46. Do you have friends who you think are eligible for WIC but who haven’t applied for WIC benefits?
YES NO
47. Do you know anyone who was in WIC but dropped out before their certification period was over?
YES NO
48. What, do you think, are the main reasons that people don’t participate in WIC? PROBE: Anything else? [DO NOT READ. CODE UP TO THREE REPLIES]
LACK OF TRANSPORTATION TO CLINIC, TRANSPORTATION DIFFICULTIES THEY DON’T KNOW THAT WIC EXISTS INCONVENIENT HOURS/DAYS CLINIC OPEN SERVICES (INCLUDING WAITING TIME) TAKE TOO MUCH TIME WAITING SPACE AT CLINIC IS LIMITED LACK OF CHILD CARE LANGUAGE BARRIERS PROBLEMS QUALIFYING FOR BENEFITS DIFFICULTIES KEEPING APPOINTMENT TIMES WIC FOOD SELECTION NOT DESIRABLE WIC FOOD STORES NOT CONVENIENT (HOURS OR LOCATION) WIC FOOD HARD TO FIND ON SHELVES (BRANDS, QUANTITIES) IMMIGRATION CONCERNS DIDN’T NEED FOOD BENEFIT OTHER: PLEASE SPECIFY______________________________
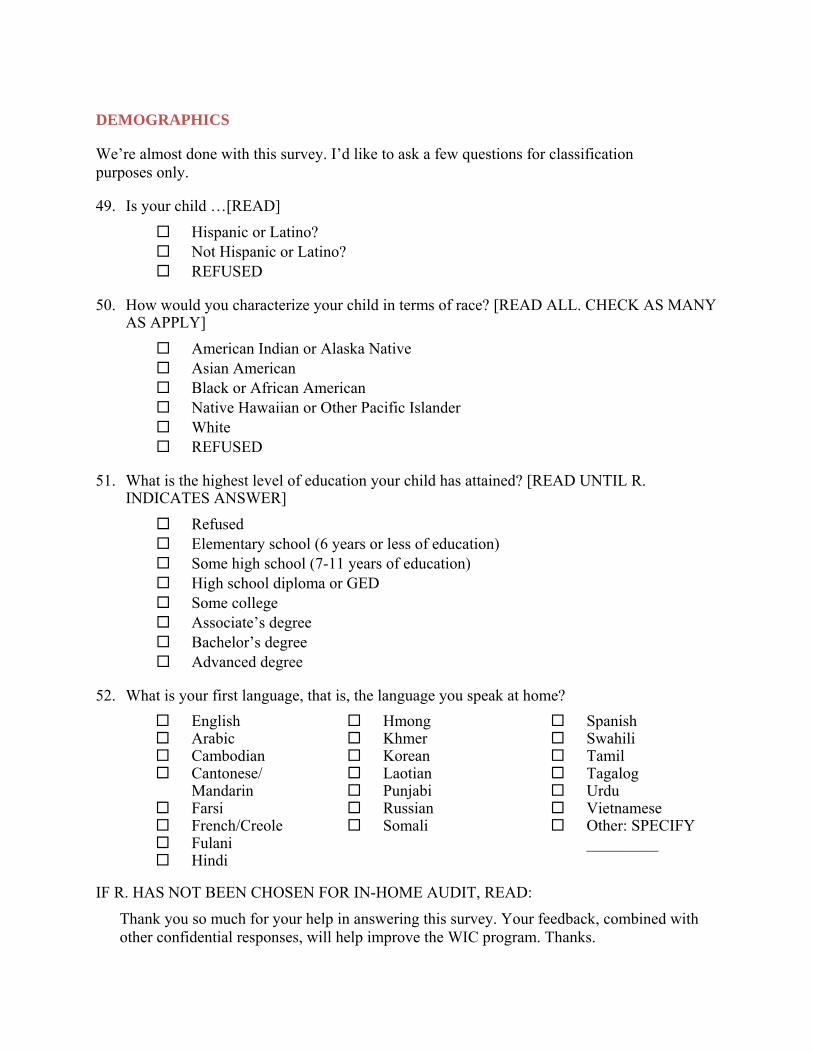
DEMOGRAPHICS
We’re almost done with this survey. I’d like to ask a few questions for classification purposes only.
49. Is your child …[READ]
Hispanic or Latino? Not Hispanic or Latino? REFUSED
50. How would you characterize your child in terms of race? [READ ALL. CHECK AS MANY AS APPLY]
American Indian or Alaska Native Asian American Black or African American Native Hawaiian or Other Pacific Islander White REFUSED
51. What is the highest level of education your child has attained? [READ UNTIL R. INDICATES ANSWER]
Refused Elementary school (6 years or less of education) Some high school (7-11 years of education) High school diploma or GED Some college Associate’s degree Bachelor’s degree Advanced degree
52. What is your first language, that is, the language you speak at home?
English Arabic Cambodian Cantonese/
Mandarin Farsi French/Creole Fulani Hindi
Hmong Khmer Korean Laotian Punjabi Russian Somali
Spanish Swahili Tamil Tagalog Urdu Vietnamese Other: SPECIFY
_________
IF R. HAS NOT BEEN CHOSEN FOR IN-HOME AUDIT, READ:
Thank you so much for your help in answering this survey. Your feedback, combined with other confidential responses, will help improve the WIC program. Thanks.
Appendix B: In-person Survey Instrument—
Partial

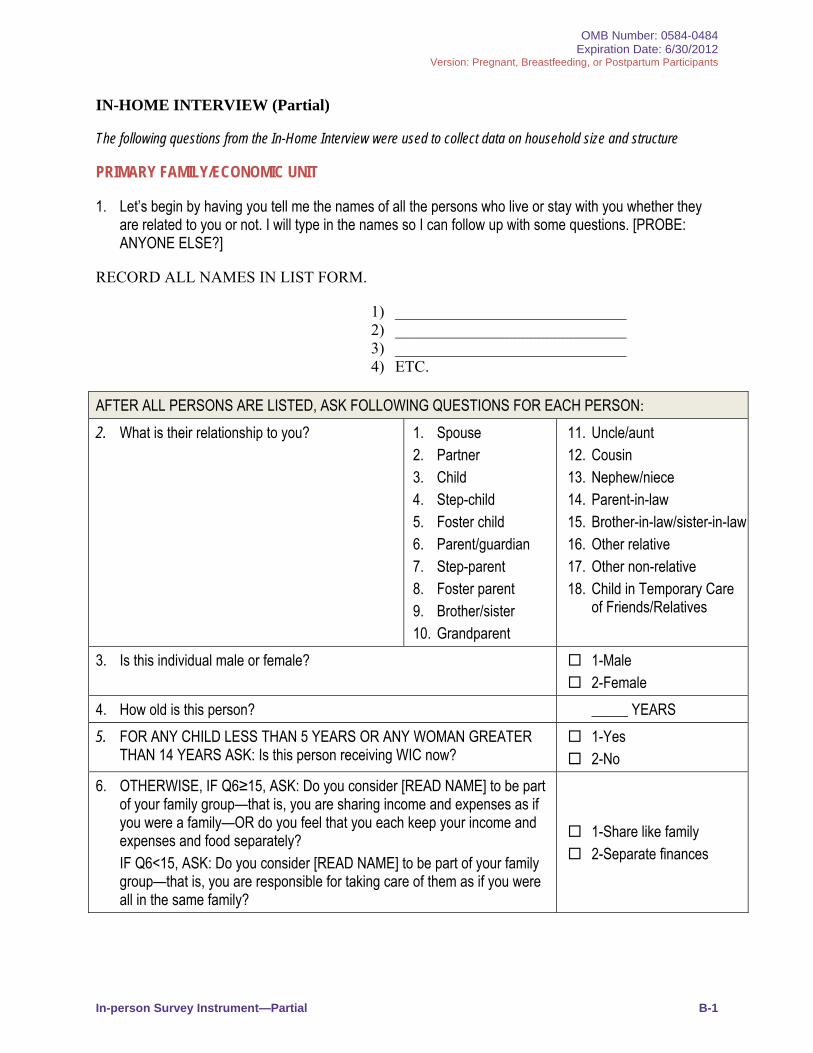
OMB Number: 0584-0484 Expiration Date: 6/30/2012
Version: Pregnant, Breastfeeding, or Postpartum Participants
In-person Survey Instrument—Partial B-1
IN-HOME INTERVIEW (Partial)
The following questions from the In-Home Interview were used to collect data on household size and structure
PRIMARY FAMILY/ECONOMIC UNIT
1. Let’s begin by having you tell me the names of all the persons who live or stay with you whether they are related to you or not. I will type in the names so I can follow up with some questions. [PROBE: ANYONE ELSE?]
RECORD ALL NAMES IN LIST FORM.
1) _____________________________ 2) _____________________________ 3) _____________________________ 4) ETC.
AFTER ALL PERSONS ARE LISTED, ASK FOLLOWING QUESTIONS FOR EACH PERSON:
2. What is their relationship to you? 1. Spouse 2. Partner 3. Child 4. Step-child 5. Foster child 6. Parent/guardian 7. Step-parent 8. Foster parent 9. Brother/sister 10. Grandparent
11. Uncle/aunt 12. Cousin 13. Nephew/niece 14. Parent-in-law 15. Brother-in-law/sister-in-law 16. Other relative 17. Other non-relative 18. Child in Temporary Care
of Friends/Relatives
3. Is this individual male or female? 1-Male 2-Female
4. How old is this person? _____ YEARS
5. FOR ANY CHILD LESS THAN 5 YEARS OR ANY WOMAN GREATER THAN 14 YEARS ASK: Is this person receiving WIC now?
1-Yes 2-No
6. OTHERWISE, IF Q6≥15, ASK: Do you consider [READ NAME] to be part of your family group—that is, you are sharing income and expenses as if you were a family—OR do you feel that you each keep your income and expenses and food separately? IF Q6<15, ASK: Do you consider [READ NAME] to be part of your family group—that is, you are responsible for taking care of them as if you were all in the same family?
1-Share like family 2-Separate finances

Appendix C: Technical Appendix

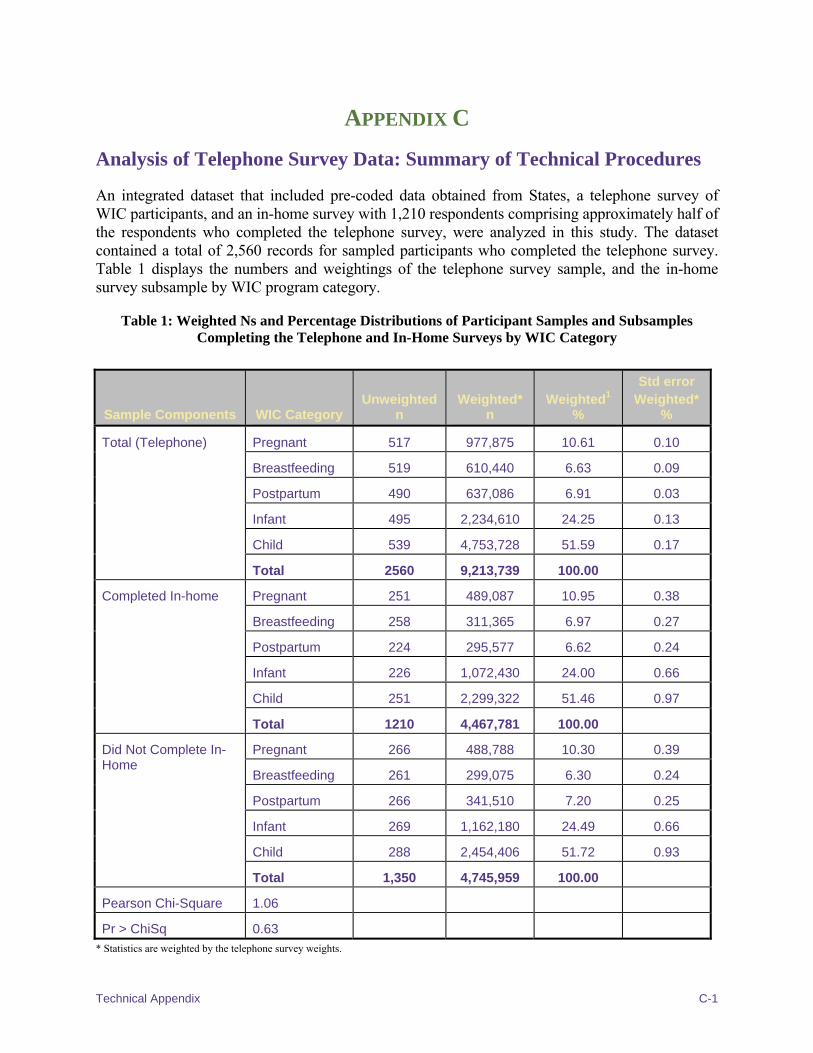
Technical Appendix C-1
APPENDIX C
Analysis of Telephone Survey Data: Summary of Technical Procedures
An integrated dataset that included pre-coded data obtained from States, a telephone survey of WIC participants, and an in-home survey with 1,210 respondents comprising approximately half of the respondents who completed the telephone survey, were analyzed in this study. The dataset contained a total of 2,560 records for sampled participants who completed the telephone survey. Table 1 displays the numbers and weightings of the telephone survey sample, and the in-home survey subsample by WIC program category.
Table 1: Weighted Ns and Percentage Distributions of Participant Samples and Subsamples Completing the Telephone and In-Home Surveys by WIC Category
Sample Components WIC Category Unweighted
n Weighted*
n Weighted1
%
Std error Weighted*
%
Total (Telephone) Pregnant 517 977,875 10.61 0.10
Breastfeeding 519 610,440 6.63 0.09
Postpartum 490 637,086 6.91 0.03
Infant 495 2,234,610 24.25 0.13
Child 539 4,753,728 51.59 0.17
Total 2560 9,213,739 100.00
Completed In-home Pregnant 251 489,087 10.95 0.38
Breastfeeding 258 311,365 6.97 0.27
Postpartum 224 295,577 6.62 0.24
Infant 226 1,072,430 24.00 0.66
Child 251 2,299,322 51.46 0.97
Total 1210 4,467,781 100.00
Did Not Complete In-Home
Pregnant 266 488,788 10.30 0.39
Breastfeeding 261 299,075 6.30 0.24
Postpartum 266 341,510 7.20 0.25
Infant 269 1,162,180 24.49 0.66
Child 288 2,454,406 51.72 0.93
Total 1,350 4,745,959 100.00
Pearson Chi-Square 1.06
Pr > ChiSq 0.63
* Statistics are weighted by the telephone survey weights.
Technical Appendix C-2
A Chi-square significance test was conducted and results show that there was no statistically significant difference between participants who completed the in-home survey and those who did not complete the in-home survey (χ2 = 1.06 and p = .63). This suggests that the characteristics of the two subsamples were similar, and there was no selection bias with sample weighting.
Data from the telephone survey were the main source for the analysis of participants’ demographic characteristics and their experiences with the program. Additional data on household size and structure were obtained from the in-home survey, whose respondents were asked to name and describe each person living in the household (up to 20) in terms of age, sex, and relationship with the sampled participant, and indicate whether or not the person was part of the family economic unit.
Data Processing and Editing
Data processing included data cleaning, formatting, labeling, and coding. Raw data items were recoded and new or composite variables were reconstructed and used in the analysis. The definitions of these variables and details of how they were manipulated in the analysis are presented below.
Participant Age
With raw data on participants’ birth day, month, year, and corresponding certification day, month, and year, the days between the birth day and the date of the survey were calculated and the results were converted into age in years and months. For children, age is presented as 1 through 5 years; for infants, months of age are presented in five levels comparable to those used in NSWP 1 (0–3 months, 4–5 months, 6–8 months, 9–11 months, and 12 months and older69).
Missing data occurred on birth day and month for a very small number of cases. Imputation was applied involving imposing a value of 15 to the missing day and a random assignment of 1 through 12 to the missing month. Out-of-range values on birth year (e.g., 8 and 9 instead of 2008 and 2009 respectively) were corrected for 9 cases as well.
Participant Race
Following Census racial categories, there were seven racial groups in the original variable on participants’ race: African American, American Indian and Alaska Native, Asian American, Native Hawaiian and Other Pacific Islander, White, Others, and Multiracial. The subgroups Asian, Native Hawaiian and Pacific Islander, Others, and Multiracial, however, had small sizes, producing low cell frequencies when breaking up a program measure (e.g., breastfeeding) by race. To address this issue, the categories of Asian and Native Hawaiian and Other Pacific Islander were combined into one subgroup labeled “Asian and Pacific Islander,” while Other and Multiracial categories were also combined into one subgroup labeled “Other/Multiracial.” Still, many measures collapsed by the recoded race indicator had low cell frequencies for smaller racial groups, particularly American Indian and Alaska Native.
69 Some states allow a transition period for infant benefits for up to 30 days beyond their first birthday.
Technical Appendix C-3
Education and Language
To consolidate information, the original eight levels of education of WIC women and parent/guardians was recoded into three categories; i.e., less than high school, high school completion, and more than high school. Likewise, participant native language background was recoded into three categories: English, Spanish, and others.
Food Program Participation
Data were collected to measure respondents’ participation in other food assistance programs. The original items, coded in binary format, indicate whether or not the respondent participated in each of the nine programs (Supplemental Nutrition Assistance Program (SNAP), National School Lunch Program (NSLP), National School Breakfast Program (NSBP), Summer Food Service program (SFSP), Food Distribution Program on Indian Reservations (FDPIR), Temporary Assistant for Needy Families (TANF), Child and Adult Care Food Program (CACFP), local/community food bank, and Commodity Supplemental Food Program (CSFP, past and present). Additionally, two composite variables were developed and used based on participation in food assistance programs. Focusing on SNAP participation, one variable identified three categories of participation: participation in no other food assistance program, participation in other food assistance programs including SNAP, and participation in other food assistance programs excluding SNAP.
Program Benefits
The value of WIC program benefits was assessed using a large set of data items relating to respondents’ perception of WIC benefits, with six levels of responses ranging from 0 (“not valuable at all”) through 5 (“extremely valuable”).
Program Satisfaction
The original variables on program satisfaction measured WIC services and location of facility using a five-point scale (1 = very satisfied, 2 = somewhat satisfied, 3 = neither satisfied nor dissatisfied, 4 = somewhat dissatisfied, 5 = very dissatisfied). Two additional sets of data items addressed food benefits (3 items, specifically dealing with quantity, foods you like to eat, and choices in sizes/brands available) and specific services (12 items dealing with clinic staff, customer service, location, and facility), all on a five-point scale (1 = excellent, 2 = very good, 3 = good, 4 = fair, and 5 = poor). The responses were tabulated by program or demographic characteristics.
As discussed in the WIC Benefits Ratings subsection of Section 3.3, the original responses relating to services and facility location were first analyzed and then collapsed into the two broad categories of “satisfied” and “dissatisfied”. Similarly, responses relating to food benefits and related specific service features, were combined into “satisfied” ( for responses of “excellent”, ”very good”, or ”good”) and “dissatisfied” for “fair” and “poor” responses. To consolidate the information, a composite measure was developed for each of the two sets of data items. Each item was reversely scaled into a low-to-high value scheme representing increasing satisfaction level (0=Poor, 1=Fair, 2=Good, 3=Very Good, and 4=Excellent). The composite variables of satisfaction with coupon and special services (named COMPSATISCP2 and COMPSATISSPEC2, respectively) were built by averaging scores for each set of original items. Further, a comprehensive indicator of program satisfaction is created (COMPSATISTOT2) by
Technical Appendix C-4
averaging the values from the two composite variables and the original items of satisfaction with WIC service and location/facilities (also reversely recoded).
Perception of Food Quantity
Two sets of data items measured respondents’ perception of whether the quantities of 11 specific food items available in food packages were too little or too much, respectively (see Appendix X for specific food items). Responses of yes or no (response indicating ‘too much’ or ‘too little’ of the food or no were recoded 1 and 0 respectively). Two composite indicators were constructed for each food item (for too much and too little, respectively) by summing the affirmative responses (Yes) of each item in each set.
Length of Breastfeeding
Four measures were created for length of breastfeeding based on the original data items, including:
days of breastfeeding of the last child by women and guardians
days of exclusive breastfeeding of the last child by women and guardians
days of breastfeeding of the current child, excluding those who were having their first pregnancy
days of exclusive breastfeeding of the current child, excluding those who were having their first pregnancy.
The original measurement of length in weeks or months was converted into days as the final measure. Another measure of number of months planning to breastfeed, asked of only pregnant women, was reported only in months.
Number of Children
Two measures on the number of children were created relevant to, respectively, the respondent’s nuclear family and the household. The nuclear family included the WIC woman and her own child(ren); or alternatively, the custodial guardian and WIC child(ren) or infants sampled in the telephone survey, and their siblings. The household, in contrast, included all the persons named by the in-home interview respondent (a WIC woman or an adult custodial guardian of a WIC child/infant): the respondent, other adults, children, and infants.
Note that the in-home interview data on household size and structure were more systematic and detailed on determining household composition than the telephone survey. In the in-home interview, respondents were asked to name all persons in the household (up to 20; the data collected showed a maximum of 14), and to describe each member in terms of age; sex; extended family relationship (grandparent, uncle, aunt, cousin, nephew, and stepchild/parent) as well as non-family relationship with the sampled WIC participant (foster child/parent and non-relatives). The number of children was determined by counting household members whose ages were under 18.
In telephone interviews, respondents were only asked about the number of their own children (including the first pregnancy/child at the time of the interview). The number of children in the nuclear family was constructed by first identifying pregnant women (in WIC category 1) who
Technical Appendix C-5
reported the first-time pregnancy (not yet undelivered at the time of the interview). For these cases, the nuclear family has no child. For respondents in other WIC categories, the family would have one or more children, as reported by WIC women or adult respondents. Consequently, nuclear families without children are identified as those of first-time pregnant women.
The binary indicator of households with children versus without children derived from the in-home interview was relevant to food security measurement, which requires determination of whether there is a household member under the age of 18. With this household indicator, FNS’ scoring protocols for households with and without children were applied to develop food security scale scores (see also Food Security measurement).
Food Security
Following FNS guidelines on food security measures (FNS, 2000), two sets of food security indicators were developed: status levels and scale scores. The procedure involved the following steps:
Assigning values to missing Level 2 screener follow-up items: the three Level-2 screeners (P0534B, P0534f, and P0534j) were first recoded into binary format with 1 indicating food insecure and 0 as non food-insecure (or food secure). Missing data on the paired follow-up items were assigned values. Specifically, if a screener was negative (indicating no food insecurity), the missing follow-up item was assigned zero (negative), whereas if the screener was positive (indicating food insecurity), then the follow-up item was missing.
Binary recoding: all 18 food security items were recoded into binary format according to the prescribed ERS protocol. For the first six items (p0534a_1-p0534a_6, referred to as the Stage 1 items by ERS), values smaller than three were coded as 1 (affirming food insecurity); otherwise zero (for food security). For the remaining four three-category items (Stage 2 items), if the values equaled three they were recoded zero (negative answer). The eight original binary variables remained binary.
Imputing missing data: possibly food insecure cases were identified by the primary screener (P0533>1). Of them, one case had missing data on all but the first two items (P0534A_1 and P0534A-2), and nine cases had missing data on one or more of the last four items (P0534H through P0534L). As the ERS Guide (Bickel et al., 2000) specifies, imputation must consider the order of food insecurity severity for the 18 items.70 Two conditions must both be met for imputing the missing data with a 1 ( indicating food insecure): (1) at least one affirmative response occurs among the more severe items relative to the item with missing data; and (2) the response on any of the less severe items is not food secure. If one or both conditions are not met, a zero (food secure) is assigned to the missing item. Missing data were coded by: (1) summing the values of items that implied more severe food insecurity-- if the sum was greater than 1, then it was coded as 1 (food insecure) since at least one item of greater severity was responded
70 We took the severity order developed by ERS based on the 1998 national population study.
Technical Appendix C-6
to affirmatively71 and the first condition was met); (2) summing the values of less severe items to identify any negative response (if the sum equals the number of these items, then the second condition was met). As appropriate, either a code of 1 (food insecure) was entered in place of the item with missing data or a code of 0 (food secure).
Generating the raw food security score: this score was obtained by adding the counts of affirmative answers (coded as 1) of all the 18 items.
Determining food security status levels: applying the two FNS schemes for determining food secure status, households with at least one child (based on information from the in-home interview data) were labeled respectively with four levels of food security. The levels were : 0 = “high,” 1 = “marginal,” 2 = “low,” and 3 = “very low” food security.
Assigning food security scale score: also applying the two different scoring schemes in the FNS guidelines, a food security scale score was developed based on the raw scores for households with and without children.
Screening out cases that are food secure: primary screening (with P0533 value = 1, “have enough food”) was used to identify households that were food secure. These households were assigned 0 for both FS status level and scale score.
The estimated food security status levels in this study may not be directly comparable with those of the prior NSWP-I study (National Survey of WIC Participants 1, USDA, 2001) because of differences in the questionnaires and scoring algorithms. The primary screening question used in this study was—
13. Now thinking about how your family eats generally, which of the following statements best describes the food you had to eat in your household during the last 12 months? Your household… [READ LIST]? [CHECK ONE ONLY]
Have enough to eat [SKIP TO Q35]
Sometimes not have enough to eat, or
Often not have enough to eat.
Respondents who selected “Have enough to eat” were considered food secure and skipped for the remaining food security questions. In the prior study, the screening question also asked about household food sufficiency over the past 12 months; but with different response wording: the response “enough to eat the kinds of food wanted” was determined as food secure and skipped for the remaining food security module (EIC Participant and Program Characteristics II, USDA, 2001).
71 If any missing data occurs on a more severe item, we assigned zero (negative) to the item, likewise with less severe items.
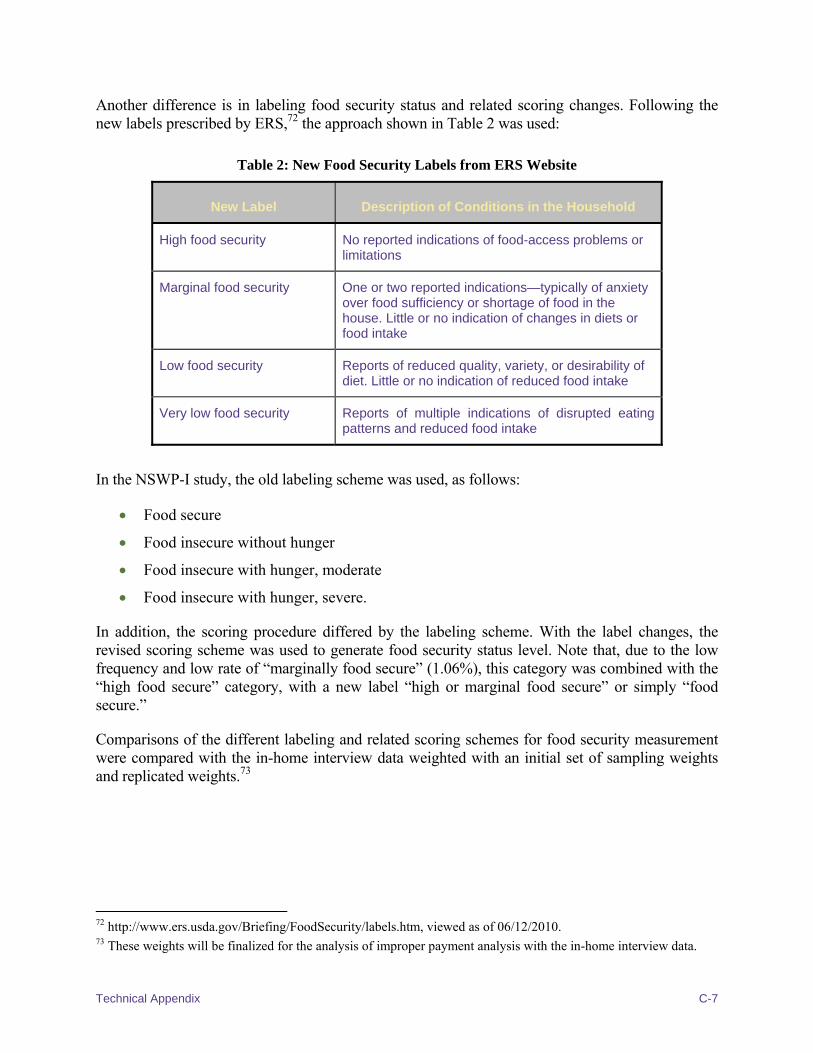
Technical Appendix C-7
Another difference is in labeling food security status and related scoring changes. Following the new labels prescribed by ERS,72 the approach shown in Table 2 was used:
Table 2: New Food Security Labels from ERS Website
New Label Description of Conditions in the Household
High food security No reported indications of food-access problems or limitations
Marginal food security One or two reported indications—typically of anxiety over food sufficiency or shortage of food in the house. Little or no indication of changes in diets or food intake
Low food security Reports of reduced quality, variety, or desirability of diet. Little or no indication of reduced food intake
Very low food security Reports of multiple indications of disrupted eating patterns and reduced food intake
In the NSWP-I study, the old labeling scheme was used, as follows:
Food secure
Food insecure without hunger
Food insecure with hunger, moderate
Food insecure with hunger, severe.
In addition, the scoring procedure differed by the labeling scheme. With the label changes, the revised scoring scheme was used to generate food security status level. Note that, due to the low frequency and low rate of “marginally food secure” (1.06%), this category was combined with the “high food secure” category, with a new label “high or marginal food secure” or simply “food secure.”
Comparisons of the different labeling and related scoring schemes for food security measurement were compared with the in-home interview data weighted with an initial set of sampling weights and replicated weights.73
72 http://www.ers.usda.gov/Briefing/FoodSecurity/labels.htm, viewed as of 06/12/2010. 73 These weights will be finalized for the analysis of improper payment analysis with the in-home interview data.
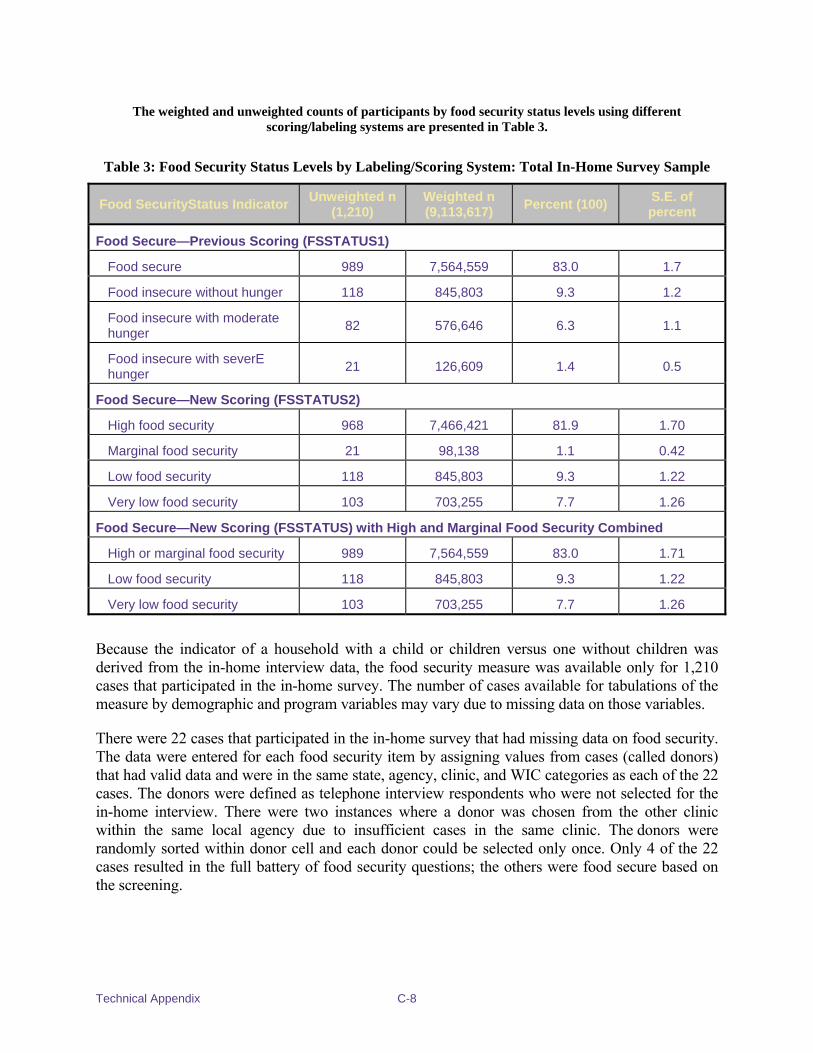
Technical Appendix C-8
The weighted and unweighted counts of participants by food security status levels using different scoring/labeling systems are presented in Table 3.
Table 3: Food Security Status Levels by Labeling/Scoring System: Total In-Home Survey Sample
Food SecurityStatus Indicator Unweighted n
(1,210) Weighted n (9,113,617)
Percent (100) S.E. of percent
Food Secure—Previous Scoring (FSSTATUS1)
Food secure 989 7,564,559 83.0 1.7
Food insecure without hunger 118 845,803 9.3 1.2
Food insecure with moderate hunger
82 576,646 6.3 1.1
Food insecure with severE hunger
21 126,609 1.4 0.5
Food Secure—New Scoring (FSSTATUS2)
High food security 968 7,466,421 81.9 1.70
Marginal food security 21 98,138 1.1 0.42
Low food security 118 845,803 9.3 1.22
Very low food security 103 703,255 7.7 1.26
Food Secure—New Scoring (FSSTATUS) with High and Marginal Food Security Combined
High or marginal food security 989 7,564,559 83.0 1.71
Low food security 118 845,803 9.3 1.22
Very low food security 103 703,255 7.7 1.26
Because the indicator of a household with a child or children versus one without children was derived from the in-home interview data, the food security measure was available only for 1,210 cases that participated in the in-home survey. The number of cases available for tabulations of the measure by demographic and program variables may vary due to missing data on those variables.
There were 22 cases that participated in the in-home survey that had missing data on food security. The data were entered for each food security item by assigning values from cases (called donors) that had valid data and were in the same state, agency, clinic, and WIC categories as each of the 22 cases. The donors were defined as telephone interview respondents who were not selected for the in-home interview. There were two instances where a donor was chosen from the other clinic within the same local agency due to insufficient cases in the same clinic. The donors were randomly sorted within donor cell and each donor could be selected only once. Only 4 of the 22 cases resulted in the full battery of food security questions; the others were food secure based on the screening.
Technical Appendix C-9
Household Structure
An array of household structure indictors were developed for use with the in-home interview data. For each named household member, relationships with the respondents were documented by two sets of variables, for WIC children/infants and WIC women. Available only for the 1,210 in-home interview cases, the indicators used to determine household size were—
Household size: the total number of household members, including relatives and nonrelatives (fostered child/parent and children under temporary care) (HHSIZE).
Number of children in the household: all household members who are under 18, including relatives and nonrelatives (KIDN).
Number of parents: parents or foster parents for the WIC child/infant, plus the spouse of the WIC woman (PARENTN).
Number of grandparents: grandparents to the WIC child/infant or the woman (GRANDN).
Number of non-biological members: members who are not relatives of the WIC child/infant or woman (NONBIO).
Number of relatives: members who are cousins, nephews, uncles, aunts, grandparents (RELATN).
Number of foster members: foster children or foster parents (FOSTERN).
Generations: Number of generations; a score of “2” if no grandparent named to the child/infant or the woman; 3 if one or more grandparents named for the WIC child/infant; 4 if one or more grandparent named for the WIC woman (GEN4). (Scores of 0 and 1 were not used.)
Single parent households: households that have only one parent (SINGLEPARENT).
WIC mother: for child or infant cases, named member who is a female parent and participated in WIC (WICMOM).
Teen mother: for child or infant cases, named member who is a female parent and age under 18 (TEENMOM).
Nuclear family: households without relatives (NUCLEARFAM).
Tabulation and Analysis
The participant characteristics analysis entailed two statistical procedures. One- or two-way cross-tabulations were run to examine, respectively, descriptive statistics of key variables and bivariate associations between two categorical variables. Pearson chi-square tests were used in two-way cross-tabulations to help determine if associations between pairs of variables were statistically significant (at p ≤ .05).
Technical Appendix C-10
Comparisons of means was performed to examine differences in continuous measures between two or more categories. To determine statistically significant differences, each category’s estimates of the means at 95 percent confidence level is presented.
SAS 9.2 PROC SURVEYFREQ and SURVEYMEANS on ICF Macro’s UNIX system used the jackknife replicate weights method to compensate for the complex sample design effects and to obtain accurate variance estimates. Adjusted sampling weights obtained via post-stratification were also used in all the procedures to correct biases generated by unproportional sampling selection and unit nonresponses.
References
Cole, N., et al. (2001). National Survey of WIC Participants: 2001 Final Report. Alexandria, VA: U.S. Department of Agriculture.
Bickel, Gary, Mark Nord, Cristofer Price, William Hamilton, and John Cook: Guide to Measuring Household Food Security, Revised 2000. U.S. Department of Agriculture, Food and Nutrition Service, Alexandria VA. March, 2000.
Appendix D: Non-response Bias Analysis


Contents
Appendix D1: Response and Cooperation Rates by Selected Characteristics
Appendix D2: Item Non-response (All Telephone Survey Items)
Appendix D3: Difference Between Original Weights and Raked Weights on Selected Measures
Appendix D4: Race/Ethnicity (Using California Coding) by Selected Measures

Appendix D1: Response and Cooperation Rates
by Selected Characteristics

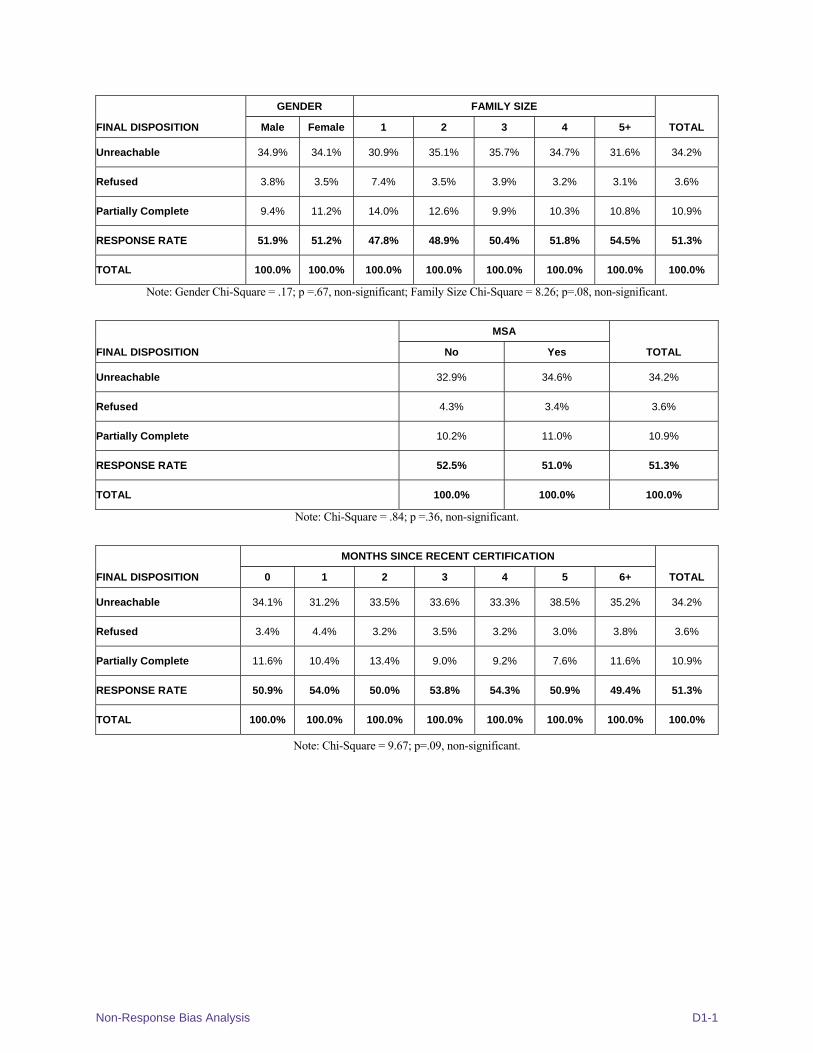
Non-Response Bias Analysis D1-1
FINAL DISPOSITION
GENDER FAMILY SIZE
TOTAL Male Female 1 2 3 4 5+
Unreachable 34.9% 34.1% 30.9% 35.1% 35.7% 34.7% 31.6% 34.2%
Refused 3.8% 3.5% 7.4% 3.5% 3.9% 3.2% 3.1% 3.6%
Partially Complete 9.4% 11.2% 14.0% 12.6% 9.9% 10.3% 10.8% 10.9%
RESPONSE RATE 51.9% 51.2% 47.8% 48.9% 50.4% 51.8% 54.5% 51.3%
TOTAL 100.0% 100.0% 100.0% 100.0% 100.0% 100.0% 100.0% 100.0%
Note: Gender Chi-Square = .17; p =.67, non-significant; Family Size Chi-Square = 8.26; p=.08, non-significant.
FINAL DISPOSITION
MSA
TOTAL No Yes
Unreachable 32.9% 34.6% 34.2%
Refused 4.3% 3.4% 3.6%
Partially Complete 10.2% 11.0% 10.9%
RESPONSE RATE 52.5% 51.0% 51.3%
TOTAL 100.0% 100.0% 100.0%
Note: Chi-Square = .84; p =.36, non-significant.
FINAL DISPOSITION
MONTHS SINCE RECENT CERTIFICATION
TOTAL 0 1 2 3 4 5 6+
Unreachable 34.1% 31.2% 33.5% 33.6% 33.3% 38.5% 35.2% 34.2%
Refused 3.4% 4.4% 3.2% 3.5% 3.2% 3.0% 3.8% 3.6%
Partially Complete 11.6% 10.4% 13.4% 9.0% 9.2% 7.6% 11.6% 10.9%
RESPONSE RATE 50.9% 54.0% 50.0% 53.8% 54.3% 50.9% 49.4% 51.3%
TOTAL 100.0% 100.0% 100.0% 100.0% 100.0% 100.0% 100.0% 100.0%
Note: Chi-Square = 9.67; p=.09, non-significant.


Appendix D2: Item Non-response
(All Telephone Survey Items)

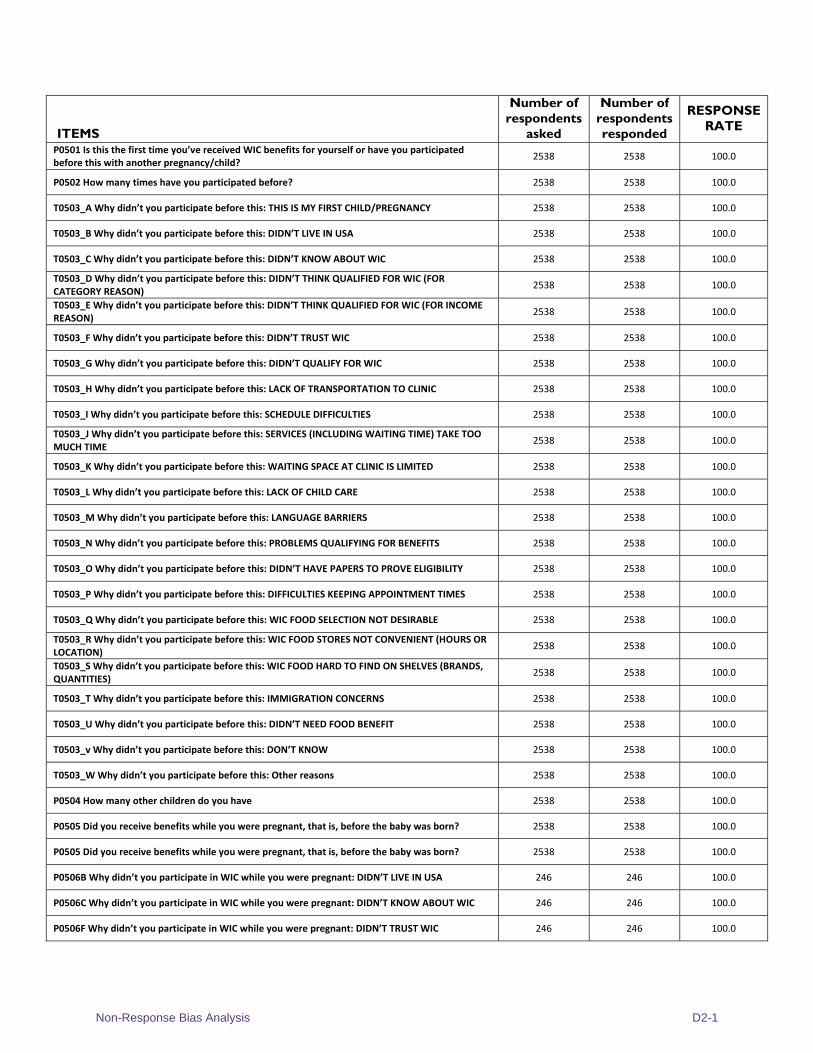
Non-Response Bias Analysis D2-1
ITEMS
Number of respondents
asked
Number of respondents responded
RESPONSE RATE
P0501 Is this the first time you’ve received WIC benefits for yourself or have you participated before this with another pregnancy/child?
2538 2538 100.0
P0502 How many times have you participated before? 2538 2538 100.0
T0503_A Why didn’t you participate before this: THIS IS MY FIRST CHILD/PREGNANCY 2538 2538 100.0
T0503_B Why didn’t you participate before this: DIDN’T LIVE IN USA 2538 2538 100.0
T0503_C Why didn’t you participate before this: DIDN’T KNOW ABOUT WIC 2538 2538 100.0
T0503_D Why didn’t you participate before this: DIDN’T THINK QUALIFIED FOR WIC (FOR CATEGORY REASON)
2538 2538 100.0
T0503_E Why didn’t you participate before this: DIDN’T THINK QUALIFIED FOR WIC (FOR INCOME REASON)
2538 2538 100.0
T0503_F Why didn’t you participate before this: DIDN’T TRUST WIC 2538 2538 100.0
T0503_G Why didn’t you participate before this: DIDN’T QUALIFY FOR WIC 2538 2538 100.0
T0503_H Why didn’t you participate before this: LACK OF TRANSPORTATION TO CLINIC 2538 2538 100.0
T0503_I Why didn’t you participate before this: SCHEDULE DIFFICULTIES 2538 2538 100.0
T0503_J Why didn’t you participate before this: SERVICES (INCLUDING WAITING TIME) TAKE TOO MUCH TIME
2538 2538 100.0
T0503_K Why didn’t you participate before this: WAITING SPACE AT CLINIC IS LIMITED 2538 2538 100.0
T0503_L Why didn’t you participate before this: LACK OF CHILD CARE 2538 2538 100.0
T0503_M Why didn’t you participate before this: LANGUAGE BARRIERS 2538 2538 100.0
T0503_N Why didn’t you participate before this: PROBLEMS QUALIFYING FOR BENEFITS 2538 2538 100.0
T0503_O Why didn’t you participate before this: DIDN’T HAVE PAPERS TO PROVE ELIGIBILITY 2538 2538 100.0
T0503_P Why didn’t you participate before this: DIFFICULTIES KEEPING APPOINTMENT TIMES 2538 2538 100.0
T0503_Q Why didn’t you participate before this: WIC FOOD SELECTION NOT DESIRABLE 2538 2538 100.0
T0503_R Why didn’t you participate before this: WIC FOOD STORES NOT CONVENIENT (HOURS OR LOCATION)
2538 2538 100.0
T0503_S Why didn’t you participate before this: WIC FOOD HARD TO FIND ON SHELVES (BRANDS, QUANTITIES)
2538 2538 100.0
T0503_T Why didn’t you participate before this: IMMIGRATION CONCERNS 2538 2538 100.0
T0503_U Why didn’t you participate before this: DIDN’T NEED FOOD BENEFIT 2538 2538 100.0
T0503_v Why didn’t you participate before this: DON’T KNOW 2538 2538 100.0
T0503_W Why didn’t you participate before this: Other reasons 2538 2538 100.0
P0504 How many other children do you have 2538 2538 100.0
P0505 Did you receive benefits while you were pregnant, that is, before the baby was born? 2538 2538 100.0
P0505 Did you receive benefits while you were pregnant, that is, before the baby was born? 2538 2538 100.0
P0506B Why didn’t you participate in WIC while you were pregnant: DIDN’T LIVE IN USA 246 246 100.0
P0506C Why didn’t you participate in WIC while you were pregnant: DIDN’T KNOW ABOUT WIC 246 246 100.0
P0506F Why didn’t you participate in WIC while you were pregnant: DIDN’T TRUST WIC 246 246 100.0
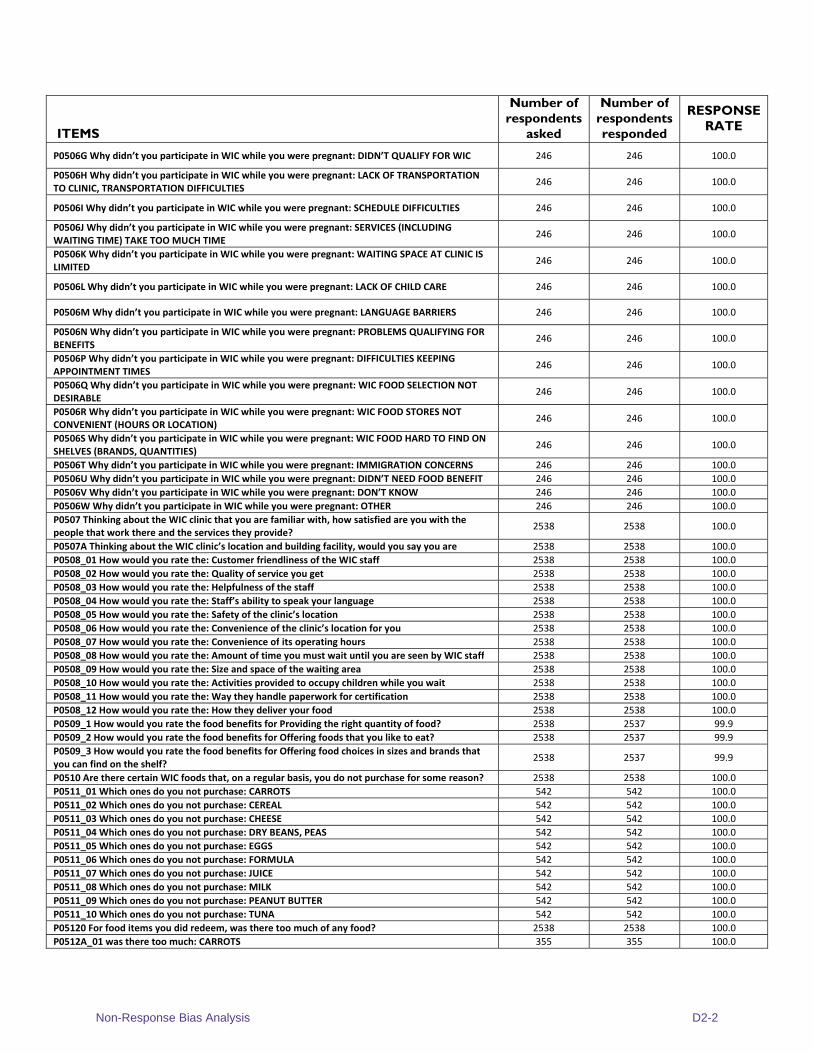
Non-Response Bias Analysis D2-2
ITEMS
Number of respondents
asked
Number of respondents responded
RESPONSE RATE
P0506G Why didn’t you participate in WIC while you were pregnant: DIDN’T QUALIFY FOR WIC 246 246 100.0
P0506H Why didn’t you participate in WIC while you were pregnant: LACK OF TRANSPORTATION TO CLINIC, TRANSPORTATION DIFFICULTIES
246 246 100.0
P0506I Why didn’t you participate in WIC while you were pregnant: SCHEDULE DIFFICULTIES 246 246 100.0
P0506J Why didn’t you participate in WIC while you were pregnant: SERVICES (INCLUDING WAITING TIME) TAKE TOO MUCH TIME
246 246 100.0
P0506K Why didn’t you participate in WIC while you were pregnant: WAITING SPACE AT CLINIC IS LIMITED
246 246 100.0
P0506L Why didn’t you participate in WIC while you were pregnant: LACK OF CHILD CARE 246 246 100.0
P0506M Why didn’t you participate in WIC while you were pregnant: LANGUAGE BARRIERS 246 246 100.0
P0506N Why didn’t you participate in WIC while you were pregnant: PROBLEMS QUALIFYING FOR BENEFITS
246 246 100.0
P0506P Why didn’t you participate in WIC while you were pregnant: DIFFICULTIES KEEPING APPOINTMENT TIMES
246 246 100.0
P0506Q Why didn’t you participate in WIC while you were pregnant: WIC FOOD SELECTION NOT DESIRABLE
246 246 100.0
P0506R Why didn’t you participate in WIC while you were pregnant: WIC FOOD STORES NOT CONVENIENT (HOURS OR LOCATION)
246 246 100.0
P0506S Why didn’t you participate in WIC while you were pregnant: WIC FOOD HARD TO FIND ON SHELVES (BRANDS, QUANTITIES)
246 246 100.0
P0506T Why didn’t you participate in WIC while you were pregnant: IMMIGRATION CONCERNS 246 246 100.0
P0506U Why didn’t you participate in WIC while you were pregnant: DIDN’T NEED FOOD BENEFIT 246 246 100.0
P0506V Why didn’t you participate in WIC while you were pregnant: DON’T KNOW 246 246 100.0
P0506W Why didn’t you participate in WIC while you were pregnant: OTHER 246 246 100.0
P0507 Thinking about the WIC clinic that you are familiar with, how satisfied are you with the people that work there and the services they provide?
2538 2538 100.0
P0507A Thinking about the WIC clinic’s location and building facility, would you say you are 2538 2538 100.0
P0508_01 How would you rate the: Customer friendliness of the WIC staff 2538 2538 100.0
P0508_02 How would you rate the: Quality of service you get 2538 2538 100.0
P0508_03 How would you rate the: Helpfulness of the staff 2538 2538 100.0
P0508_04 How would you rate the: Staff’s ability to speak your language 2538 2538 100.0
P0508_05 How would you rate the: Safety of the clinic’s location 2538 2538 100.0
P0508_06 How would you rate the: Convenience of the clinic’s location for you 2538 2538 100.0
P0508_07 How would you rate the: Convenience of its operating hours 2538 2538 100.0
P0508_08 How would you rate the: Amount of time you must wait until you are seen by WIC staff 2538 2538 100.0
P0508_09 How would you rate the: Size and space of the waiting area 2538 2538 100.0
P0508_10 How would you rate the: Activities provided to occupy children while you wait 2538 2538 100.0
P0508_11 How would you rate the: Way they handle paperwork for certification 2538 2538 100.0
P0508_12 How would you rate the: How they deliver your food 2538 2538 100.0
P0509_1 How would you rate the food benefits for Providing the right quantity of food? 2538 2537 99.9
P0509_2 How would you rate the food benefits for Offering foods that you like to eat? 2538 2537 99.9
P0509_3 How would you rate the food benefits for Offering food choices in sizes and brands that you can find on the shelf?
2538 2537 99.9
P0510 Are there certain WIC foods that, on a regular basis, you do not purchase for some reason? 2538 2538 100.0
P0511_01 Which ones do you not purchase: CARROTS 542 542 100.0
P0511_02 Which ones do you not purchase: CEREAL 542 542 100.0
P0511_03 Which ones do you not purchase: CHEESE 542 542 100.0
P0511_04 Which ones do you not purchase: DRY BEANS, PEAS 542 542 100.0
P0511_05 Which ones do you not purchase: EGGS 542 542 100.0
P0511_06 Which ones do you not purchase: FORMULA 542 542 100.0
P0511_07 Which ones do you not purchase: JUICE 542 542 100.0
P0511_08 Which ones do you not purchase: MILK 542 542 100.0
P0511_09 Which ones do you not purchase: PEANUT BUTTER 542 542 100.0
P0511_10 Which ones do you not purchase: TUNA 542 542 100.0
P05120 For food items you did redeem, was there too much of any food? 2538 2538 100.0
P0512A_01 was there too much: CARROTS 355 355 100.0
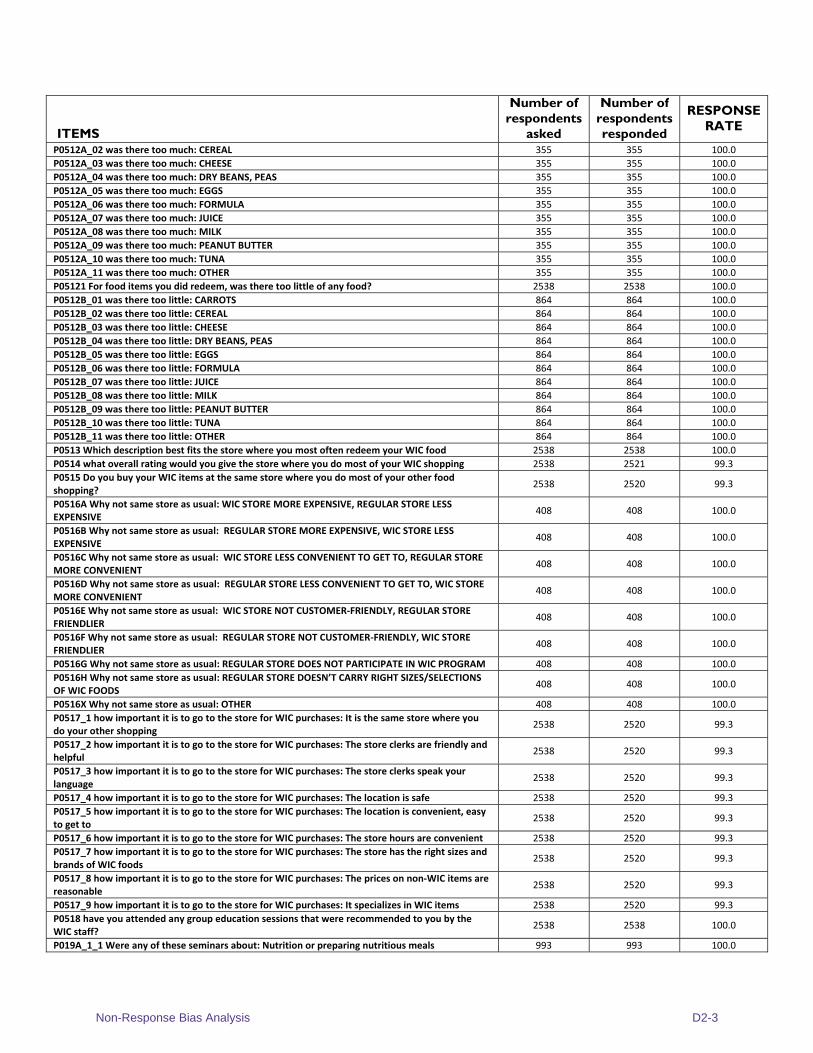
Non-Response Bias Analysis D2-3
ITEMS
Number of respondents
asked
Number of respondents responded
RESPONSE RATE
P0512A_02 was there too much: CEREAL 355 355 100.0
P0512A_03 was there too much: CHEESE 355 355 100.0
P0512A_04 was there too much: DRY BEANS, PEAS 355 355 100.0
P0512A_05 was there too much: EGGS 355 355 100.0
P0512A_06 was there too much: FORMULA 355 355 100.0
P0512A_07 was there too much: JUICE 355 355 100.0
P0512A_08 was there too much: MILK 355 355 100.0
P0512A_09 was there too much: PEANUT BUTTER 355 355 100.0
P0512A_10 was there too much: TUNA 355 355 100.0
P0512A_11 was there too much: OTHER 355 355 100.0
P05121 For food items you did redeem, was there too little of any food? 2538 2538 100.0
P0512B_01 was there too little: CARROTS 864 864 100.0
P0512B_02 was there too little: CEREAL 864 864 100.0
P0512B_03 was there too little: CHEESE 864 864 100.0
P0512B_04 was there too little: DRY BEANS, PEAS 864 864 100.0
P0512B_05 was there too little: EGGS 864 864 100.0
P0512B_06 was there too little: FORMULA 864 864 100.0
P0512B_07 was there too little: JUICE 864 864 100.0
P0512B_08 was there too little: MILK 864 864 100.0
P0512B_09 was there too little: PEANUT BUTTER 864 864 100.0
P0512B_10 was there too little: TUNA 864 864 100.0
P0512B_11 was there too little: OTHER 864 864 100.0
P0513 Which description best fits the store where you most often redeem your WIC food 2538 2538 100.0
P0514 what overall rating would you give the store where you do most of your WIC shopping 2538 2521 99.3
P0515 Do you buy your WIC items at the same store where you do most of your other food shopping?
2538 2520 99.3
P0516A Why not same store as usual: WIC STORE MORE EXPENSIVE, REGULAR STORE LESS EXPENSIVE
408 408 100.0
P0516B Why not same store as usual: REGULAR STORE MORE EXPENSIVE, WIC STORE LESS EXPENSIVE
408 408 100.0
P0516C Why not same store as usual: WIC STORE LESS CONVENIENT TO GET TO, REGULAR STORE MORE CONVENIENT
408 408 100.0
P0516D Why not same store as usual: REGULAR STORE LESS CONVENIENT TO GET TO, WIC STORE MORE CONVENIENT
408 408 100.0
P0516E Why not same store as usual: WIC STORE NOT CUSTOMER‐FRIENDLY, REGULAR STORE FRIENDLIER
408 408 100.0
P0516F Why not same store as usual: REGULAR STORE NOT CUSTOMER‐FRIENDLY, WIC STORE FRIENDLIER
408 408 100.0
P0516G Why not same store as usual: REGULAR STORE DOES NOT PARTICIPATE IN WIC PROGRAM 408 408 100.0
P0516H Why not same store as usual: REGULAR STORE DOESN’T CARRY RIGHT SIZES/SELECTIONS OF WIC FOODS
408 408 100.0
P0516X Why not same store as usual: OTHER 408 408 100.0
P0517_1 how important it is to go to the store for WIC purchases: It is the same store where you do your other shopping
2538 2520 99.3
P0517_2 how important it is to go to the store for WIC purchases: The store clerks are friendly and helpful
2538 2520 99.3
P0517_3 how important it is to go to the store for WIC purchases: The store clerks speak your language
2538 2520 99.3
P0517_4 how important it is to go to the store for WIC purchases: The location is safe 2538 2520 99.3
P0517_5 how important it is to go to the store for WIC purchases: The location is convenient, easy to get to
2538 2520 99.3
P0517_6 how important it is to go to the store for WIC purchases: The store hours are convenient 2538 2520 99.3
P0517_7 how important it is to go to the store for WIC purchases: The store has the right sizes and brands of WIC foods
2538 2520 99.3
P0517_8 how important it is to go to the store for WIC purchases: The prices on non‐WIC items are reasonable
2538 2520 99.3
P0517_9 how important it is to go to the store for WIC purchases: It specializes in WIC items 2538 2520 99.3
P0518 have you attended any group education sessions that were recommended to you by the WIC staff?
2538 2538 100.0
P019A_1_1 Were any of these seminars about: Nutrition or preparing nutritious meals 993 993 100.0
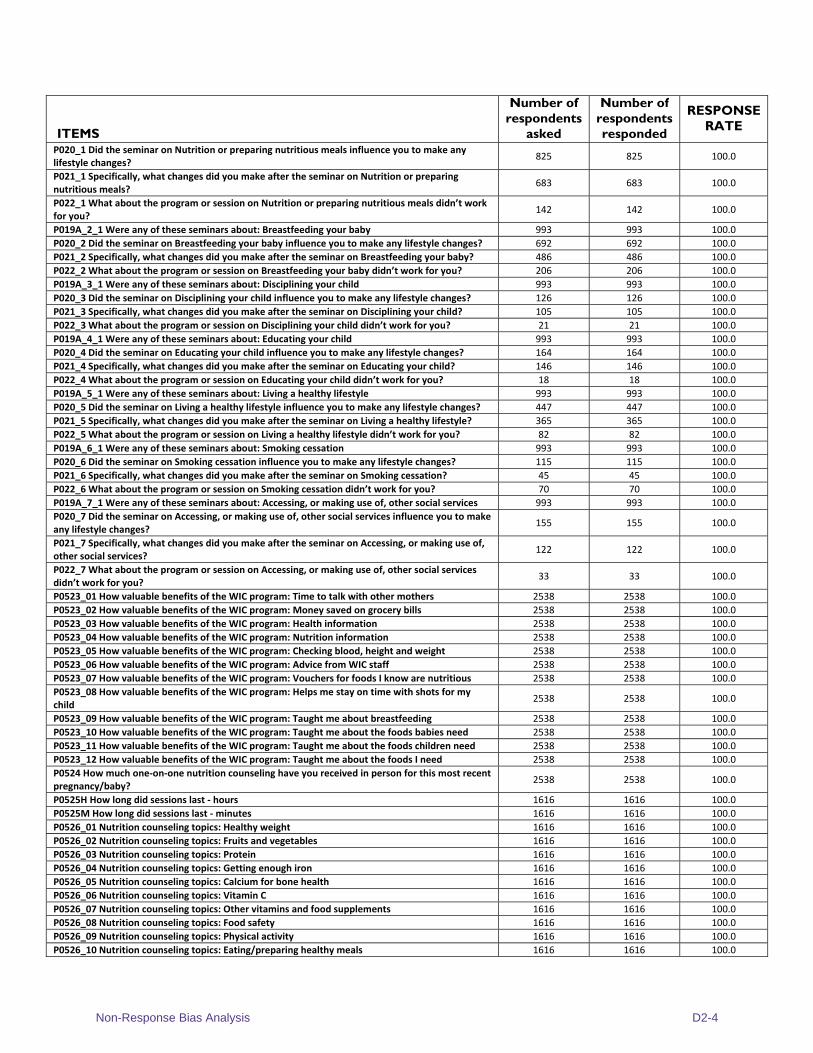
Non-Response Bias Analysis D2-4
ITEMS
Number of respondents
asked
Number of respondents responded
RESPONSE RATE
P020_1 Did the seminar on Nutrition or preparing nutritious meals influence you to make any lifestyle changes?
825 825 100.0
P021_1 Specifically, what changes did you make after the seminar on Nutrition or preparing nutritious meals?
683 683 100.0
P022_1 What about the program or session on Nutrition or preparing nutritious meals didn’t work for you?
142 142 100.0
P019A_2_1 Were any of these seminars about: Breastfeeding your baby 993 993 100.0
P020_2 Did the seminar on Breastfeeding your baby influence you to make any lifestyle changes? 692 692 100.0
P021_2 Specifically, what changes did you make after the seminar on Breastfeeding your baby? 486 486 100.0
P022_2 What about the program or session on Breastfeeding your baby didn’t work for you? 206 206 100.0
P019A_3_1 Were any of these seminars about: Disciplining your child 993 993 100.0
P020_3 Did the seminar on Disciplining your child influence you to make any lifestyle changes? 126 126 100.0
P021_3 Specifically, what changes did you make after the seminar on Disciplining your child? 105 105 100.0
P022_3 What about the program or session on Disciplining your child didn’t work for you? 21 21 100.0
P019A_4_1 Were any of these seminars about: Educating your child 993 993 100.0
P020_4 Did the seminar on Educating your child influence you to make any lifestyle changes? 164 164 100.0
P021_4 Specifically, what changes did you make after the seminar on Educating your child? 146 146 100.0
P022_4 What about the program or session on Educating your child didn’t work for you? 18 18 100.0
P019A_5_1 Were any of these seminars about: Living a healthy lifestyle 993 993 100.0
P020_5 Did the seminar on Living a healthy lifestyle influence you to make any lifestyle changes? 447 447 100.0
P021_5 Specifically, what changes did you make after the seminar on Living a healthy lifestyle? 365 365 100.0
P022_5 What about the program or session on Living a healthy lifestyle didn’t work for you? 82 82 100.0
P019A_6_1 Were any of these seminars about: Smoking cessation 993 993 100.0
P020_6 Did the seminar on Smoking cessation influence you to make any lifestyle changes? 115 115 100.0
P021_6 Specifically, what changes did you make after the seminar on Smoking cessation? 45 45 100.0
P022_6 What about the program or session on Smoking cessation didn’t work for you? 70 70 100.0
P019A_7_1 Were any of these seminars about: Accessing, or making use of, other social services 993 993 100.0
P020_7 Did the seminar on Accessing, or making use of, other social services influence you to make any lifestyle changes?
155 155 100.0
P021_7 Specifically, what changes did you make after the seminar on Accessing, or making use of, other social services?
122 122 100.0
P022_7 What about the program or session on Accessing, or making use of, other social services didn’t work for you?
33 33 100.0
P0523_01 How valuable benefits of the WIC program: Time to talk with other mothers 2538 2538 100.0
P0523_02 How valuable benefits of the WIC program: Money saved on grocery bills 2538 2538 100.0
P0523_03 How valuable benefits of the WIC program: Health information 2538 2538 100.0
P0523_04 How valuable benefits of the WIC program: Nutrition information 2538 2538 100.0
P0523_05 How valuable benefits of the WIC program: Checking blood, height and weight 2538 2538 100.0
P0523_06 How valuable benefits of the WIC program: Advice from WIC staff 2538 2538 100.0
P0523_07 How valuable benefits of the WIC program: Vouchers for foods I know are nutritious 2538 2538 100.0
P0523_08 How valuable benefits of the WIC program: Helps me stay on time with shots for my child
2538 2538 100.0
P0523_09 How valuable benefits of the WIC program: Taught me about breastfeeding 2538 2538 100.0
P0523_10 How valuable benefits of the WIC program: Taught me about the foods babies need 2538 2538 100.0
P0523_11 How valuable benefits of the WIC program: Taught me about the foods children need 2538 2538 100.0
P0523_12 How valuable benefits of the WIC program: Taught me about the foods I need 2538 2538 100.0
P0524 How much one‐on‐one nutrition counseling have you received in person for this most recent pregnancy/baby?
2538 2538 100.0
P0525H How long did sessions last ‐ hours 1616 1616 100.0
P0525M How long did sessions last ‐ minutes 1616 1616 100.0
P0526_01 Nutrition counseling topics: Healthy weight 1616 1616 100.0
P0526_02 Nutrition counseling topics: Fruits and vegetables 1616 1616 100.0
P0526_03 Nutrition counseling topics: Protein 1616 1616 100.0
P0526_04 Nutrition counseling topics: Getting enough iron 1616 1616 100.0
P0526_05 Nutrition counseling topics: Calcium for bone health 1616 1616 100.0
P0526_06 Nutrition counseling topics: Vitamin C 1616 1616 100.0
P0526_07 Nutrition counseling topics: Other vitamins and food supplements 1616 1616 100.0
P0526_08 Nutrition counseling topics: Food safety 1616 1616 100.0
P0526_09 Nutrition counseling topics: Physical activity 1616 1616 100.0
P0526_10 Nutrition counseling topics: Eating/preparing healthy meals 1616 1616 100.0
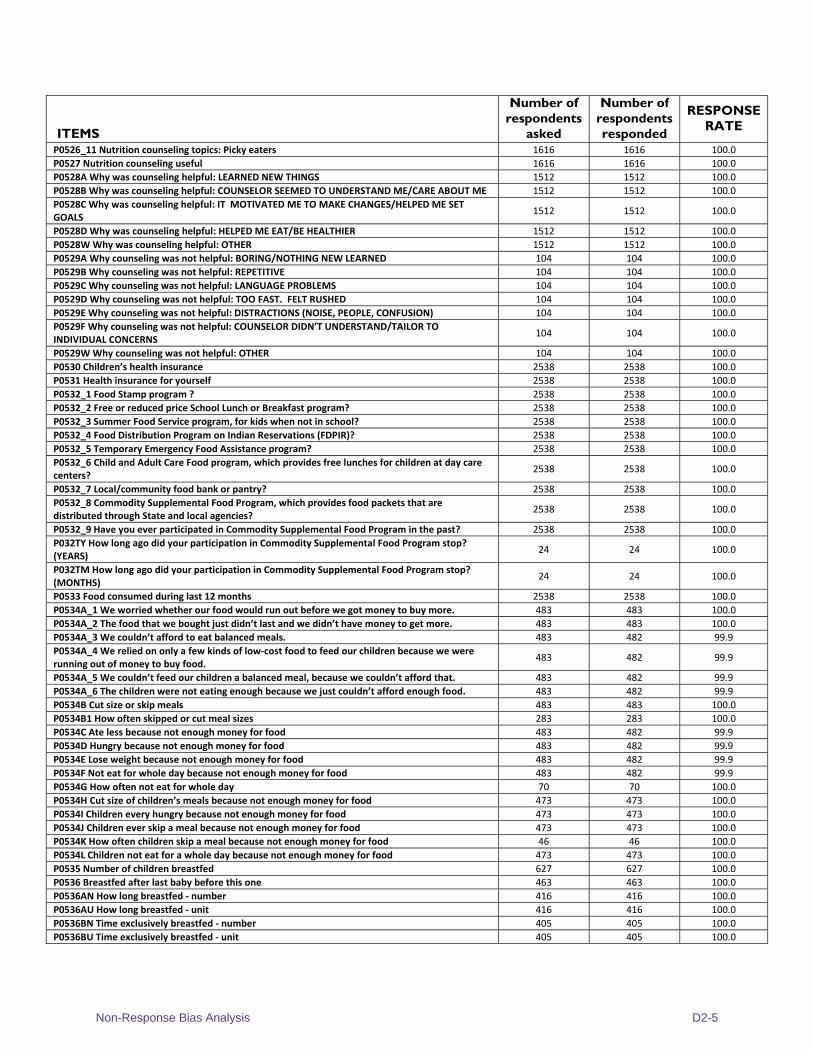
Non-Response Bias Analysis D2-5
ITEMS
Number of respondents
asked
Number of respondents responded
RESPONSE RATE
P0526_11 Nutrition counseling topics: Picky eaters 1616 1616 100.0
P0527 Nutrition counseling useful 1616 1616 100.0
P0528A Why was counseling helpful: LEARNED NEW THINGS 1512 1512 100.0
P0528B Why was counseling helpful: COUNSELOR SEEMED TO UNDERSTAND ME/CARE ABOUT ME 1512 1512 100.0
P0528C Why was counseling helpful: IT MOTIVATED ME TO MAKE CHANGES/HELPED ME SET GOALS
1512 1512 100.0
P0528D Why was counseling helpful: HELPED ME EAT/BE HEALTHIER 1512 1512 100.0
P0528W Why was counseling helpful: OTHER 1512 1512 100.0
P0529A Why counseling was not helpful: BORING/NOTHING NEW LEARNED 104 104 100.0
P0529B Why counseling was not helpful: REPETITIVE 104 104 100.0
P0529C Why counseling was not helpful: LANGUAGE PROBLEMS 104 104 100.0
P0529D Why counseling was not helpful: TOO FAST. FELT RUSHED 104 104 100.0
P0529E Why counseling was not helpful: DISTRACTIONS (NOISE, PEOPLE, CONFUSION) 104 104 100.0
P0529F Why counseling was not helpful: COUNSELOR DIDN’T UNDERSTAND/TAILOR TO INDIVIDUAL CONCERNS
104 104 100.0
P0529W Why counseling was not helpful: OTHER 104 104 100.0
P0530 Children’s health insurance 2538 2538 100.0
P0531 Health insurance for yourself 2538 2538 100.0
P0532_1 Food Stamp program ? 2538 2538 100.0
P0532_2 Free or reduced price School Lunch or Breakfast program? 2538 2538 100.0
P0532_3 Summer Food Service program, for kids when not in school? 2538 2538 100.0
P0532_4 Food Distribution Program on Indian Reservations (FDPIR)? 2538 2538 100.0
P0532_5 Temporary Emergency Food Assistance program? 2538 2538 100.0
P0532_6 Child and Adult Care Food program, which provides free lunches for children at day care centers?
2538 2538 100.0
P0532_7 Local/community food bank or pantry? 2538 2538 100.0
P0532_8 Commodity Supplemental Food Program, which provides food packets that are distributed through State and local agencies?
2538 2538 100.0
P0532_9 Have you ever participated in Commodity Supplemental Food Program in the past? 2538 2538 100.0
P032TY How long ago did your participation in Commodity Supplemental Food Program stop? (YEARS)
24 24 100.0
P032TM How long ago did your participation in Commodity Supplemental Food Program stop? (MONTHS)
24 24 100.0
P0533 Food consumed during last 12 months 2538 2538 100.0
P0534A_1 We worried whether our food would run out before we got money to buy more. 483 483 100.0
P0534A_2 The food that we bought just didn’t last and we didn’t have money to get more. 483 483 100.0
P0534A_3 We couldn’t afford to eat balanced meals. 483 482 99.9
P0534A_4 We relied on only a few kinds of low‐cost food to feed our children because we were running out of money to buy food.
483 482 99.9
P0534A_5 We couldn’t feed our children a balanced meal, because we couldn’t afford that. 483 482 99.9
P0534A_6 The children were not eating enough because we just couldn’t afford enough food. 483 482 99.9
P0534B Cut size or skip meals 483 483 100.0
P0534B1 How often skipped or cut meal sizes 283 283 100.0
P0534C Ate less because not enough money for food 483 482 99.9
P0534D Hungry because not enough money for food 483 482 99.9
P0534E Lose weight because not enough money for food 483 482 99.9
P0534F Not eat for whole day because not enough money for food 483 482 99.9
P0534G How often not eat for whole day 70 70 100.0
P0534H Cut size of children’s meals because not enough money for food 473 473 100.0
P0534I Children every hungry because not enough money for food 473 473 100.0
P0534J Children ever skip a meal because not enough money for food 473 473 100.0
P0534K How often children skip a meal because not enough money for food 46 46 100.0
P0534L Children not eat for a whole day because not enough money for food 473 473 100.0
P0535 Number of children breastfed 627 627 100.0
P0536 Breastfed after last baby before this one 463 463 100.0
P0536AN How long breastfed ‐ number 416 416 100.0
P0536AU How long breastfed ‐ unit 416 416 100.0
P0536BN Time exclusively breastfed ‐ number 405 405 100.0
P0536BU Time exclusively breastfed ‐ unit 405 405 100.0
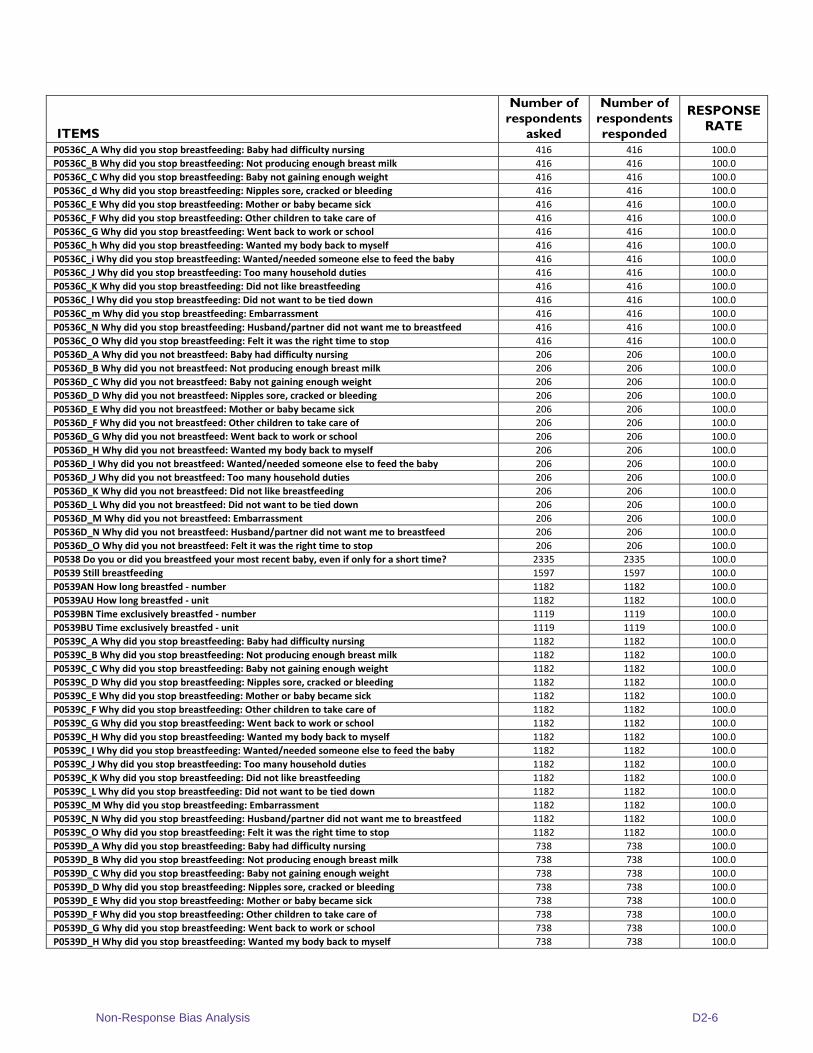
Non-Response Bias Analysis D2-6
ITEMS
Number of respondents
asked
Number of respondents responded
RESPONSE RATE
P0536C_A Why did you stop breastfeeding: Baby had difficulty nursing 416 416 100.0
P0536C_B Why did you stop breastfeeding: Not producing enough breast milk 416 416 100.0
P0536C_C Why did you stop breastfeeding: Baby not gaining enough weight 416 416 100.0
P0536C_d Why did you stop breastfeeding: Nipples sore, cracked or bleeding 416 416 100.0
P0536C_E Why did you stop breastfeeding: Mother or baby became sick 416 416 100.0
P0536C_F Why did you stop breastfeeding: Other children to take care of 416 416 100.0
P0536C_G Why did you stop breastfeeding: Went back to work or school 416 416 100.0
P0536C_h Why did you stop breastfeeding: Wanted my body back to myself 416 416 100.0
P0536C_i Why did you stop breastfeeding: Wanted/needed someone else to feed the baby 416 416 100.0
P0536C_J Why did you stop breastfeeding: Too many household duties 416 416 100.0
P0536C_K Why did you stop breastfeeding: Did not like breastfeeding 416 416 100.0
P0536C_l Why did you stop breastfeeding: Did not want to be tied down 416 416 100.0
P0536C_m Why did you stop breastfeeding: Embarrassment 416 416 100.0
P0536C_N Why did you stop breastfeeding: Husband/partner did not want me to breastfeed 416 416 100.0
P0536C_O Why did you stop breastfeeding: Felt it was the right time to stop 416 416 100.0
P0536D_A Why did you not breastfeed: Baby had difficulty nursing 206 206 100.0
P0536D_B Why did you not breastfeed: Not producing enough breast milk 206 206 100.0
P0536D_C Why did you not breastfeed: Baby not gaining enough weight 206 206 100.0
P0536D_D Why did you not breastfeed: Nipples sore, cracked or bleeding 206 206 100.0
P0536D_E Why did you not breastfeed: Mother or baby became sick 206 206 100.0
P0536D_F Why did you not breastfeed: Other children to take care of 206 206 100.0
P0536D_G Why did you not breastfeed: Went back to work or school 206 206 100.0
P0536D_H Why did you not breastfeed: Wanted my body back to myself 206 206 100.0
P0536D_I Why did you not breastfeed: Wanted/needed someone else to feed the baby 206 206 100.0
P0536D_J Why did you not breastfeed: Too many household duties 206 206 100.0
P0536D_K Why did you not breastfeed: Did not like breastfeeding 206 206 100.0
P0536D_L Why did you not breastfeed: Did not want to be tied down 206 206 100.0
P0536D_M Why did you not breastfeed: Embarrassment 206 206 100.0
P0536D_N Why did you not breastfeed: Husband/partner did not want me to breastfeed 206 206 100.0
P0536D_O Why did you not breastfeed: Felt it was the right time to stop 206 206 100.0
P0538 Do you or did you breastfeed your most recent baby, even if only for a short time? 2335 2335 100.0
P0539 Still breastfeeding 1597 1597 100.0
P0539AN How long breastfed ‐ number 1182 1182 100.0
P0539AU How long breastfed ‐ unit 1182 1182 100.0
P0539BN Time exclusively breastfed ‐ number 1119 1119 100.0
P0539BU Time exclusively breastfed ‐ unit 1119 1119 100.0
P0539C_A Why did you stop breastfeeding: Baby had difficulty nursing 1182 1182 100.0
P0539C_B Why did you stop breastfeeding: Not producing enough breast milk 1182 1182 100.0
P0539C_C Why did you stop breastfeeding: Baby not gaining enough weight 1182 1182 100.0
P0539C_D Why did you stop breastfeeding: Nipples sore, cracked or bleeding 1182 1182 100.0
P0539C_E Why did you stop breastfeeding: Mother or baby became sick 1182 1182 100.0
P0539C_F Why did you stop breastfeeding: Other children to take care of 1182 1182 100.0
P0539C_G Why did you stop breastfeeding: Went back to work or school 1182 1182 100.0
P0539C_H Why did you stop breastfeeding: Wanted my body back to myself 1182 1182 100.0
P0539C_I Why did you stop breastfeeding: Wanted/needed someone else to feed the baby 1182 1182 100.0
P0539C_J Why did you stop breastfeeding: Too many household duties 1182 1182 100.0
P0539C_K Why did you stop breastfeeding: Did not like breastfeeding 1182 1182 100.0
P0539C_L Why did you stop breastfeeding: Did not want to be tied down 1182 1182 100.0
P0539C_M Why did you stop breastfeeding: Embarrassment 1182 1182 100.0
P0539C_N Why did you stop breastfeeding: Husband/partner did not want me to breastfeed 1182 1182 100.0
P0539C_O Why did you stop breastfeeding: Felt it was the right time to stop 1182 1182 100.0
P0539D_A Why did you stop breastfeeding: Baby had difficulty nursing 738 738 100.0
P0539D_B Why did you stop breastfeeding: Not producing enough breast milk 738 738 100.0
P0539D_C Why did you stop breastfeeding: Baby not gaining enough weight 738 738 100.0
P0539D_D Why did you stop breastfeeding: Nipples sore, cracked or bleeding 738 738 100.0
P0539D_E Why did you stop breastfeeding: Mother or baby became sick 738 738 100.0
P0539D_F Why did you stop breastfeeding: Other children to take care of 738 738 100.0
P0539D_G Why did you stop breastfeeding: Went back to work or school 738 738 100.0
P0539D_H Why did you stop breastfeeding: Wanted my body back to myself 738 738 100.0
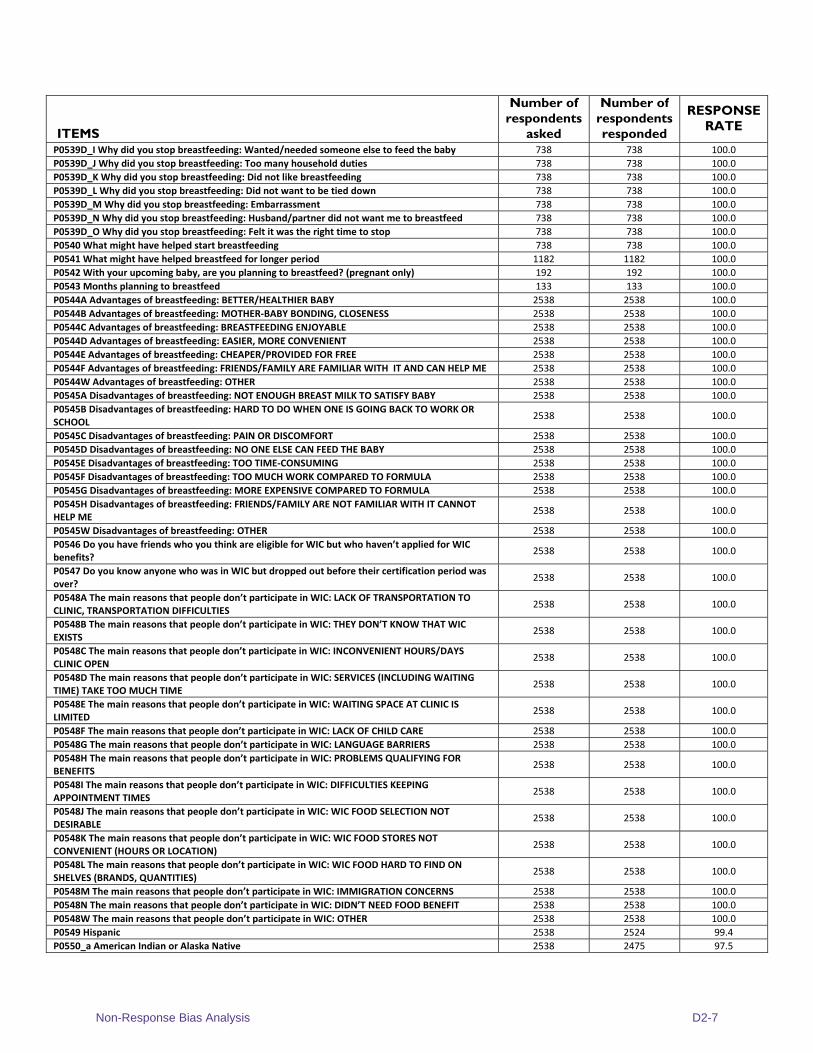
Non-Response Bias Analysis D2-7
ITEMS
Number of respondents
asked
Number of respondents responded
RESPONSE RATE
P0539D_I Why did you stop breastfeeding: Wanted/needed someone else to feed the baby 738 738 100.0
P0539D_J Why did you stop breastfeeding: Too many household duties 738 738 100.0
P0539D_K Why did you stop breastfeeding: Did not like breastfeeding 738 738 100.0
P0539D_L Why did you stop breastfeeding: Did not want to be tied down 738 738 100.0
P0539D_M Why did you stop breastfeeding: Embarrassment 738 738 100.0
P0539D_N Why did you stop breastfeeding: Husband/partner did not want me to breastfeed 738 738 100.0
P0539D_O Why did you stop breastfeeding: Felt it was the right time to stop 738 738 100.0
P0540 What might have helped start breastfeeding 738 738 100.0
P0541 What might have helped breastfeed for longer period 1182 1182 100.0
P0542 With your upcoming baby, are you planning to breastfeed? (pregnant only) 192 192 100.0
P0543 Months planning to breastfeed 133 133 100.0
P0544A Advantages of breastfeeding: BETTER/HEALTHIER BABY 2538 2538 100.0
P0544B Advantages of breastfeeding: MOTHER‐BABY BONDING, CLOSENESS 2538 2538 100.0
P0544C Advantages of breastfeeding: BREASTFEEDING ENJOYABLE 2538 2538 100.0
P0544D Advantages of breastfeeding: EASIER, MORE CONVENIENT 2538 2538 100.0
P0544E Advantages of breastfeeding: CHEAPER/PROVIDED FOR FREE 2538 2538 100.0
P0544F Advantages of breastfeeding: FRIENDS/FAMILY ARE FAMILIAR WITH IT AND CAN HELP ME 2538 2538 100.0
P0544W Advantages of breastfeeding: OTHER 2538 2538 100.0
P0545A Disadvantages of breastfeeding: NOT ENOUGH BREAST MILK TO SATISFY BABY 2538 2538 100.0
P0545B Disadvantages of breastfeeding: HARD TO DO WHEN ONE IS GOING BACK TO WORK OR SCHOOL
2538 2538 100.0
P0545C Disadvantages of breastfeeding: PAIN OR DISCOMFORT 2538 2538 100.0
P0545D Disadvantages of breastfeeding: NO ONE ELSE CAN FEED THE BABY 2538 2538 100.0
P0545E Disadvantages of breastfeeding: TOO TIME‐CONSUMING 2538 2538 100.0
P0545F Disadvantages of breastfeeding: TOO MUCH WORK COMPARED TO FORMULA 2538 2538 100.0
P0545G Disadvantages of breastfeeding: MORE EXPENSIVE COMPARED TO FORMULA 2538 2538 100.0
P0545H Disadvantages of breastfeeding: FRIENDS/FAMILY ARE NOT FAMILIAR WITH IT CANNOT HELP ME
2538 2538 100.0
P0545W Disadvantages of breastfeeding: OTHER 2538 2538 100.0
P0546 Do you have friends who you think are eligible for WIC but who haven’t applied for WIC benefits?
2538 2538 100.0
P0547 Do you know anyone who was in WIC but dropped out before their certification period was over?
2538 2538 100.0
P0548A The main reasons that people don’t participate in WIC: LACK OF TRANSPORTATION TO CLINIC, TRANSPORTATION DIFFICULTIES
2538 2538 100.0
P0548B The main reasons that people don’t participate in WIC: THEY DON’T KNOW THAT WIC EXISTS
2538 2538 100.0
P0548C The main reasons that people don’t participate in WIC: INCONVENIENT HOURS/DAYS CLINIC OPEN
2538 2538 100.0
P0548D The main reasons that people don’t participate in WIC: SERVICES (INCLUDING WAITING TIME) TAKE TOO MUCH TIME
2538 2538 100.0
P0548E The main reasons that people don’t participate in WIC: WAITING SPACE AT CLINIC IS LIMITED
2538 2538 100.0
P0548F The main reasons that people don’t participate in WIC: LACK OF CHILD CARE 2538 2538 100.0
P0548G The main reasons that people don’t participate in WIC: LANGUAGE BARRIERS 2538 2538 100.0
P0548H The main reasons that people don’t participate in WIC: PROBLEMS QUALIFYING FOR BENEFITS
2538 2538 100.0
P0548I The main reasons that people don’t participate in WIC: DIFFICULTIES KEEPING APPOINTMENT TIMES
2538 2538 100.0
P0548J The main reasons that people don’t participate in WIC: WIC FOOD SELECTION NOT DESIRABLE
2538 2538 100.0
P0548K The main reasons that people don’t participate in WIC: WIC FOOD STORES NOT CONVENIENT (HOURS OR LOCATION)
2538 2538 100.0
P0548L The main reasons that people don’t participate in WIC: WIC FOOD HARD TO FIND ON SHELVES (BRANDS, QUANTITIES)
2538 2538 100.0
P0548M The main reasons that people don’t participate in WIC: IMMIGRATION CONCERNS 2538 2538 100.0
P0548N The main reasons that people don’t participate in WIC: DIDN’T NEED FOOD BENEFIT 2538 2538 100.0
P0548W The main reasons that people don’t participate in WIC: OTHER 2538 2538 100.0
P0549 Hispanic 2538 2524 99.4
P0550_a American Indian or Alaska Native 2538 2475 97.5
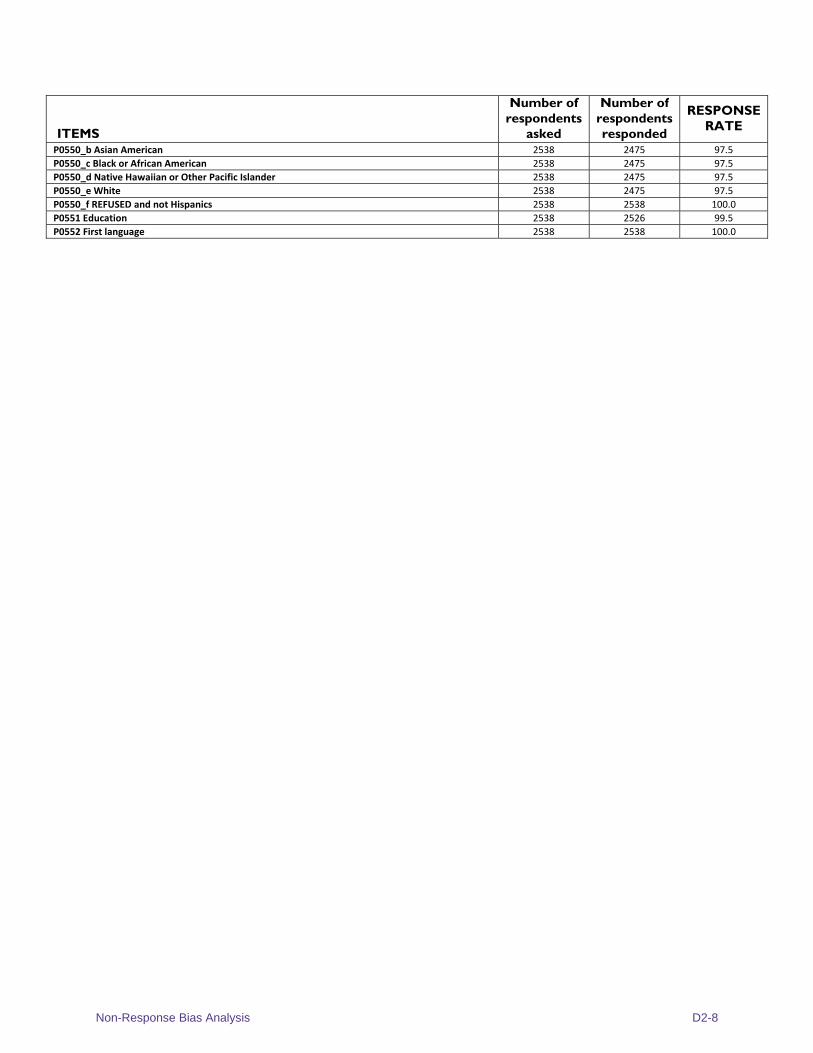
Non-Response Bias Analysis D2-8
ITEMS
Number of respondents
asked
Number of respondents responded
RESPONSE RATE
P0550_b Asian American 2538 2475 97.5
P0550_c Black or African American 2538 2475 97.5
P0550_d Native Hawaiian or Other Pacific Islander 2538 2475 97.5
P0550_e White 2538 2475 97.5
P0550_f REFUSED and not Hispanics 2538 2538 100.0
P0551 Education 2538 2526 99.5
P0552 First language 2538 2538 100.0
Appendix D3: Difference Between Original
Weights and Raked Weights on Selected Measures

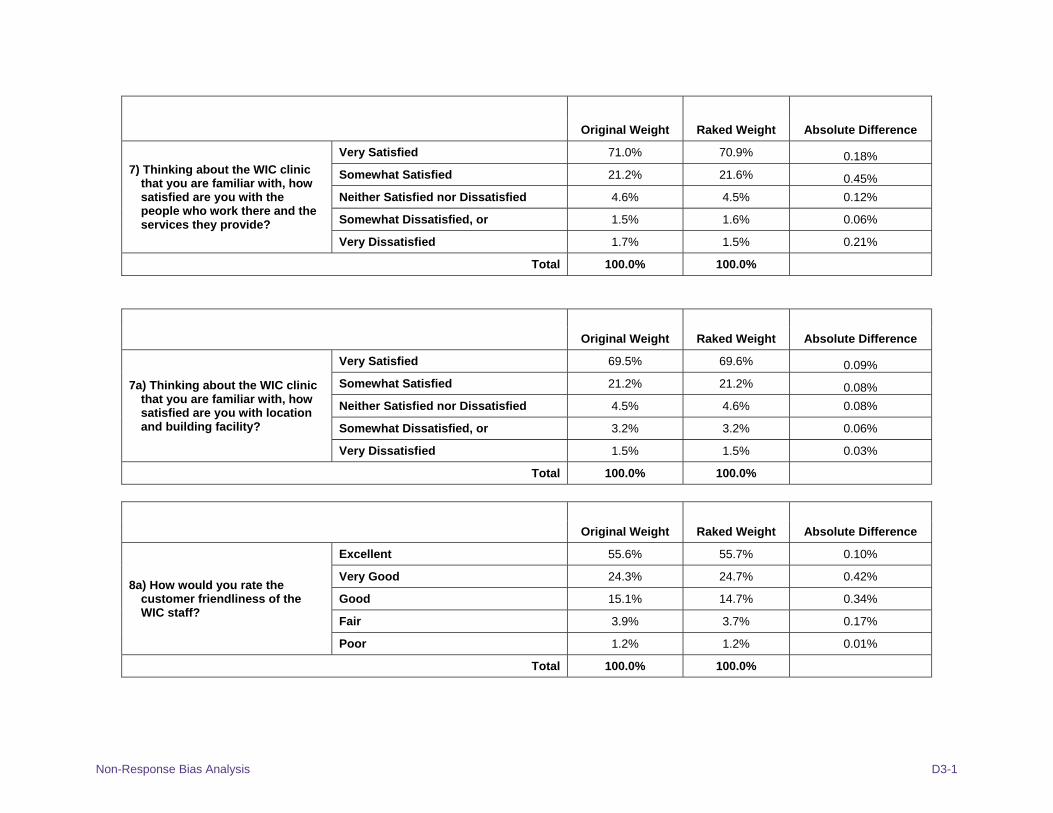
Non-Response Bias Analysis D3-1
Original Weight Raked Weight Absolute Difference
7) Thinking about the WIC clinic that you are familiar with, how satisfied are you with the people who work there and the services they provide?
Very Satisfied 71.0% 70.9% 0.18%
Somewhat Satisfied 21.2% 21.6% 0.45%
Neither Satisfied nor Dissatisfied 4.6% 4.5% 0.12%
Somewhat Dissatisfied, or 1.5% 1.6% 0.06%
Very Dissatisfied 1.7% 1.5% 0.21%
Total 100.0% 100.0%
Original Weight Raked Weight Absolute Difference
7a) Thinking about the WIC clinic that you are familiar with, how satisfied are you with location and building facility?
Very Satisfied 69.5% 69.6% 0.09%
Somewhat Satisfied 21.2% 21.2% 0.08%
Neither Satisfied nor Dissatisfied 4.5% 4.6% 0.08%
Somewhat Dissatisfied, or 3.2% 3.2% 0.06%
Very Dissatisfied 1.5% 1.5% 0.03%
Total 100.0% 100.0%
Original Weight Raked Weight Absolute Difference
8a) How would you rate the customer friendliness of the WIC staff?
Excellent 55.6% 55.7% 0.10%
Very Good 24.3% 24.7% 0.42%
Good 15.1% 14.7% 0.34%
Fair 3.9% 3.7% 0.17%
Poor 1.2% 1.2% 0.01%
Total 100.0% 100.0%
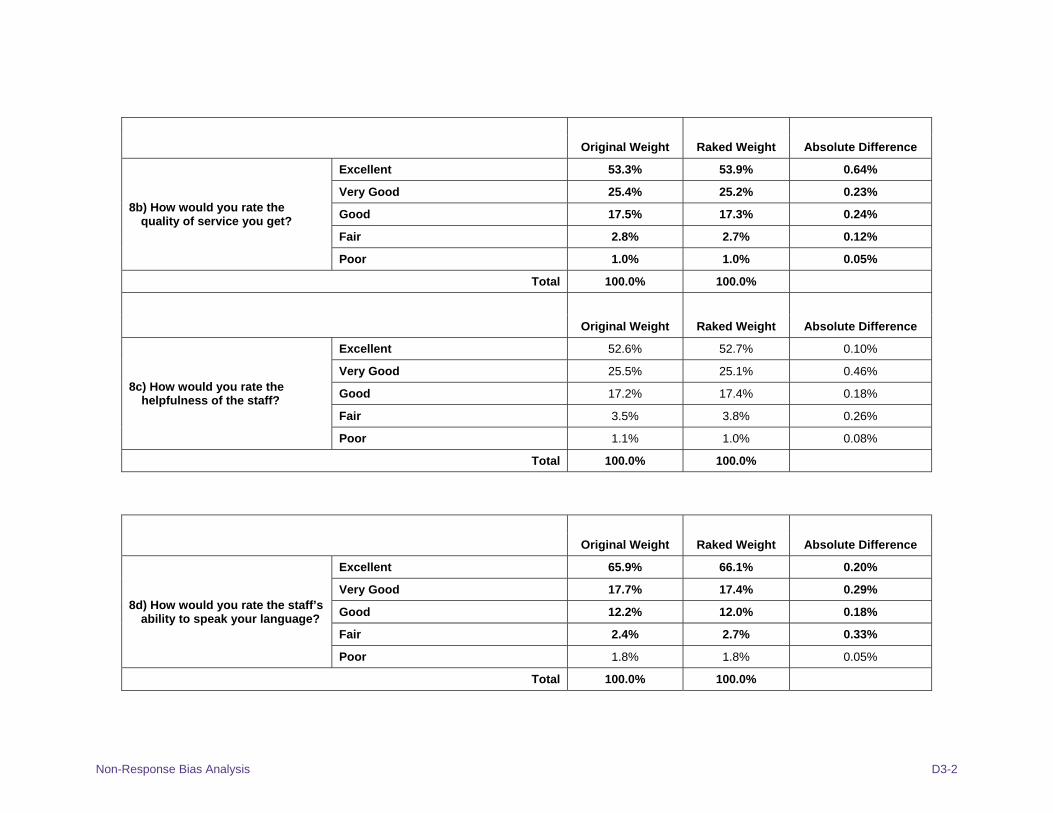
Non-Response Bias Analysis D3-2
Original Weight Raked Weight Absolute Difference
8b) How would you rate the quality of service you get?
Excellent 53.3% 53.9% 0.64%
Very Good 25.4% 25.2% 0.23%
Good 17.5% 17.3% 0.24%
Fair 2.8% 2.7% 0.12%
Poor 1.0% 1.0% 0.05%
Total 100.0% 100.0%
Original Weight Raked Weight Absolute Difference
8c) How would you rate the helpfulness of the staff?
Excellent 52.6% 52.7% 0.10%
Very Good 25.5% 25.1% 0.46%
Good 17.2% 17.4% 0.18%
Fair 3.5% 3.8% 0.26%
Poor 1.1% 1.0% 0.08%
Total 100.0% 100.0%
Original Weight Raked Weight Absolute Difference
8d) How would you rate the staff’s ability to speak your language?
Excellent 65.9% 66.1% 0.20%
Very Good 17.7% 17.4% 0.29%
Good 12.2% 12.0% 0.18%
Fair 2.4% 2.7% 0.33%
Poor 1.8% 1.8% 0.05%
Total 100.0% 100.0%
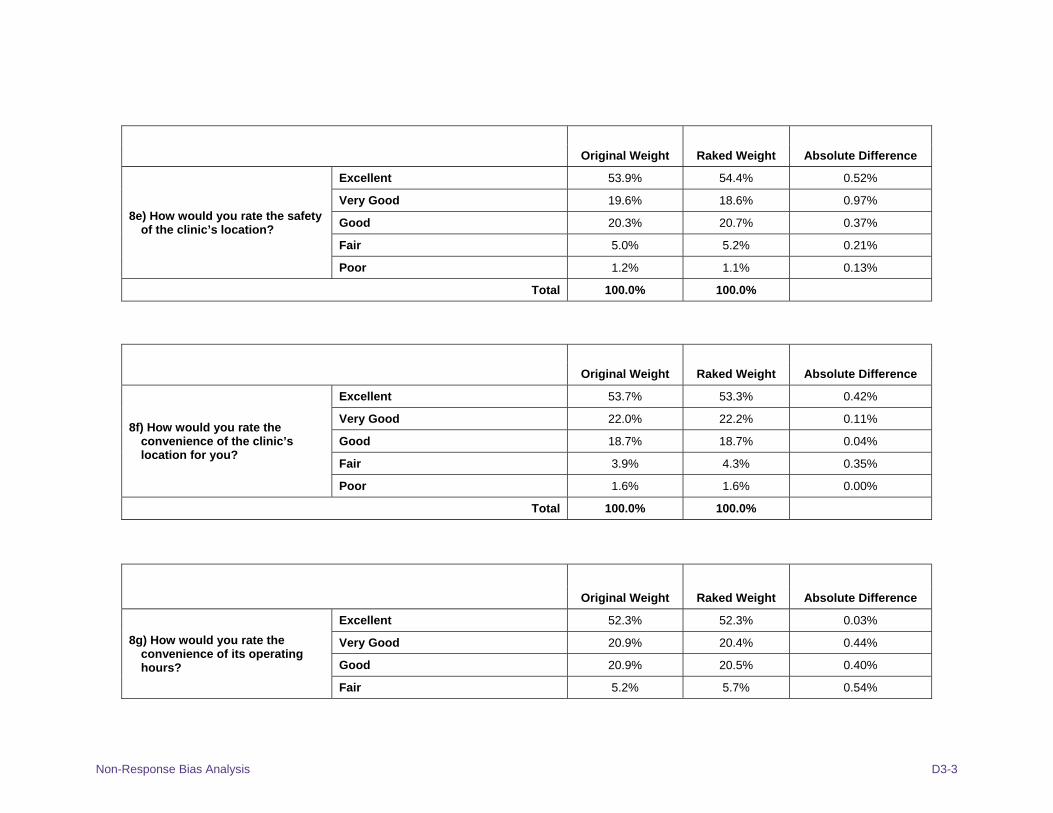
Non-Response Bias Analysis D3-3
Original Weight Raked Weight Absolute Difference
8e) How would you rate the safety of the clinic’s location?
Excellent 53.9% 54.4% 0.52%
Very Good 19.6% 18.6% 0.97%
Good 20.3% 20.7% 0.37%
Fair 5.0% 5.2% 0.21%
Poor 1.2% 1.1% 0.13%
Total 100.0% 100.0%
Original Weight Raked Weight Absolute Difference
8f) How would you rate the convenience of the clinic’s location for you?
Excellent 53.7% 53.3% 0.42%
Very Good 22.0% 22.2% 0.11%
Good 18.7% 18.7% 0.04%
Fair 3.9% 4.3% 0.35%
Poor 1.6% 1.6% 0.00%
Total 100.0% 100.0%
Original Weight Raked Weight Absolute Difference
8g) How would you rate the convenience of its operating hours?
Excellent 52.3% 52.3% 0.03%
Very Good 20.9% 20.4% 0.44%
Good 20.9% 20.5% 0.40%
Fair 5.2% 5.7% 0.54%
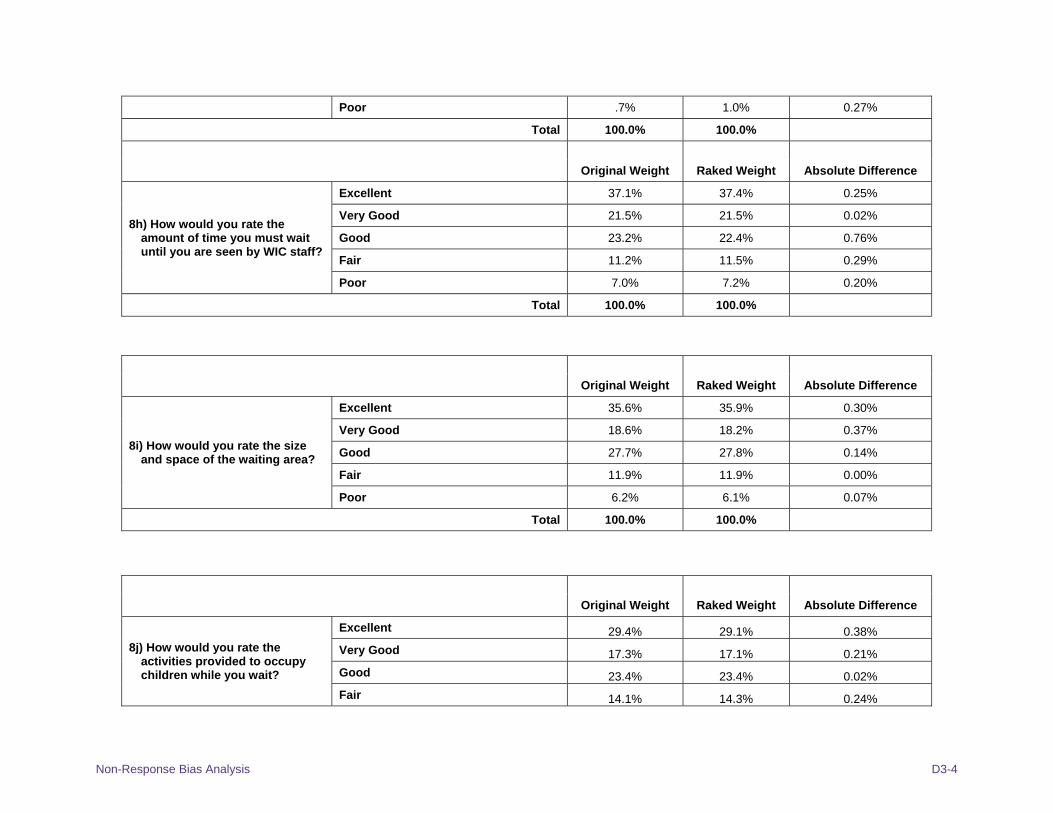
Non-Response Bias Analysis D3-4
Poor .7% 1.0% 0.27%
Total 100.0% 100.0%
Original Weight Raked Weight Absolute Difference
8h) How would you rate the amount of time you must wait until you are seen by WIC staff?
Excellent 37.1% 37.4% 0.25%
Very Good 21.5% 21.5% 0.02%
Good 23.2% 22.4% 0.76%
Fair 11.2% 11.5% 0.29%
Poor 7.0% 7.2% 0.20%
Total 100.0% 100.0%
Original Weight Raked Weight Absolute Difference
8i) How would you rate the size and space of the waiting area?
Excellent 35.6% 35.9% 0.30%
Very Good 18.6% 18.2% 0.37%
Good 27.7% 27.8% 0.14%
Fair 11.9% 11.9% 0.00%
Poor 6.2% 6.1% 0.07%
Total 100.0% 100.0%
Original Weight Raked Weight Absolute Difference
8j) How would you rate the activities provided to occupy children while you wait?
Excellent 29.4% 29.1% 0.38%
Very Good 17.3% 17.1% 0.21%
Good 23.4% 23.4% 0.02%
Fair 14.1% 14.3% 0.24%
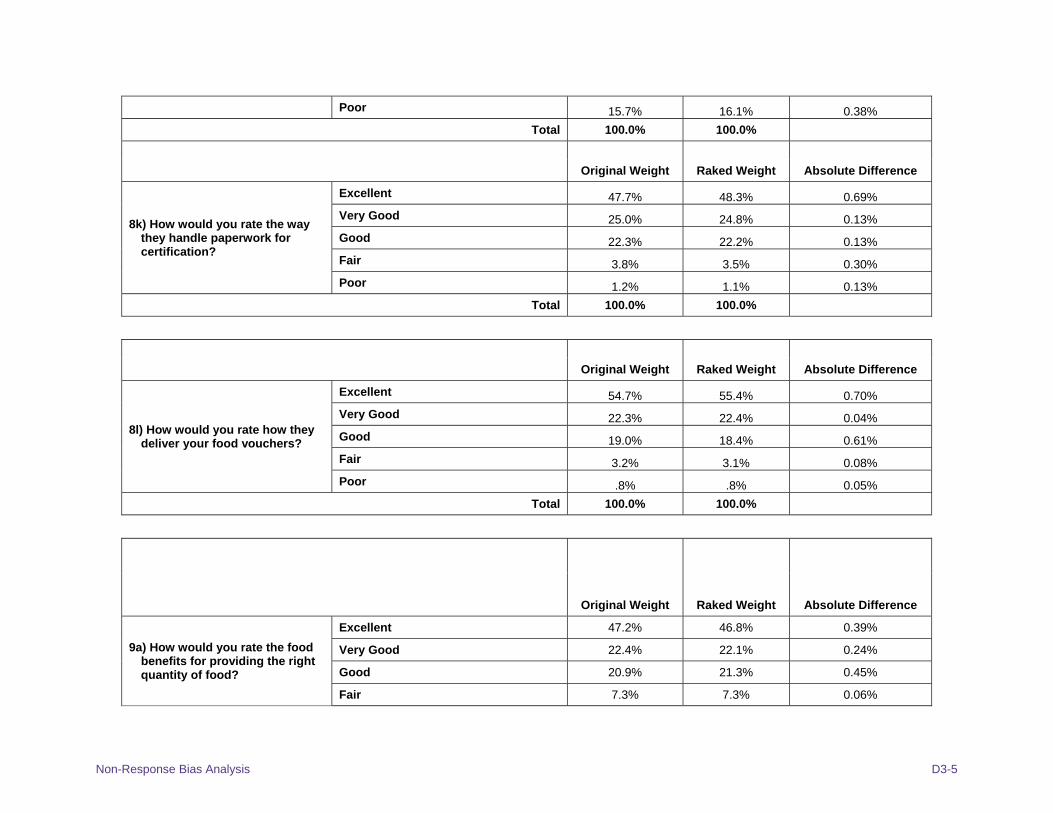
Non-Response Bias Analysis D3-5
Poor 15.7% 16.1% 0.38%
Total 100.0% 100.0%
Original Weight Raked Weight Absolute Difference
8k) How would you rate the way they handle paperwork for certification?
Excellent 47.7% 48.3% 0.69%
Very Good 25.0% 24.8% 0.13%
Good 22.3% 22.2% 0.13%
Fair 3.8% 3.5% 0.30%
Poor 1.2% 1.1% 0.13%
Total 100.0% 100.0%
Original Weight Raked Weight Absolute Difference
8l) How would you rate how they deliver your food vouchers?
Excellent 54.7% 55.4% 0.70%
Very Good 22.3% 22.4% 0.04%
Good 19.0% 18.4% 0.61%
Fair 3.2% 3.1% 0.08%
Poor .8% .8% 0.05%
Total 100.0% 100.0%
Original Weight Raked Weight Absolute Difference
9a) How would you rate the food benefits for providing the right quantity of food?
Excellent 47.2% 46.8% 0.39%
Very Good 22.4% 22.1% 0.24%
Good 20.9% 21.3% 0.45%
Fair 7.3% 7.3% 0.06%
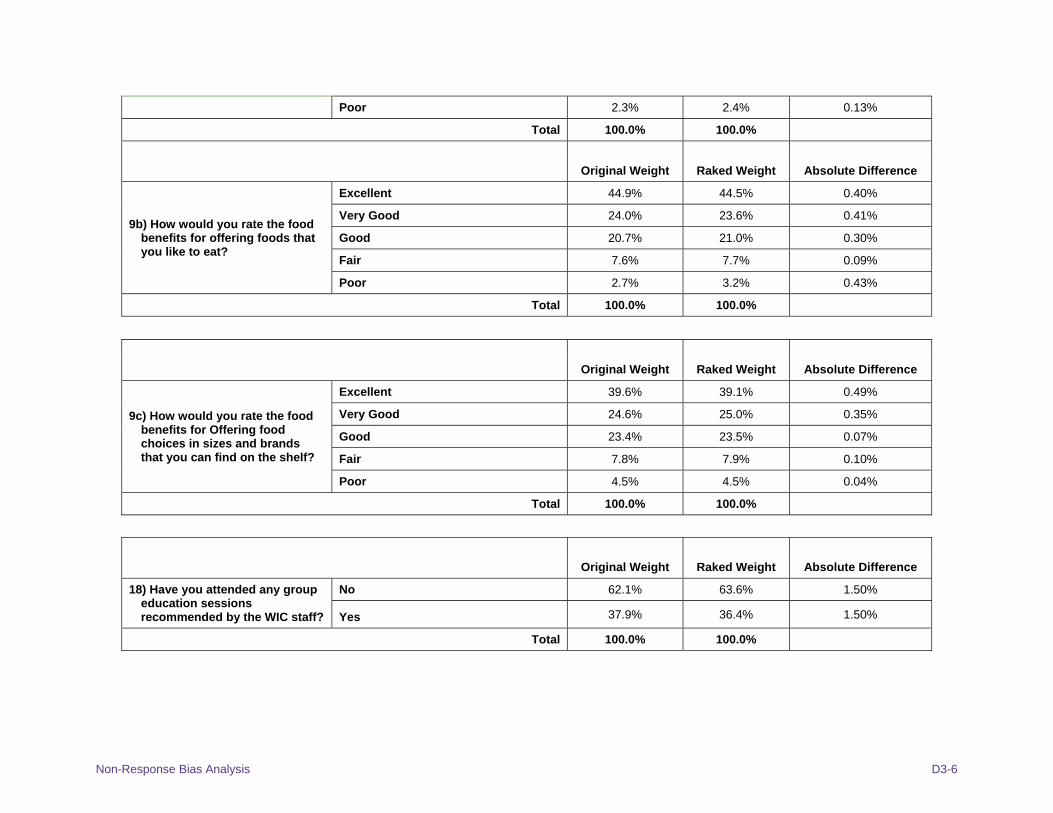
Non-Response Bias Analysis D3-6
Poor 2.3% 2.4% 0.13%
Total 100.0% 100.0%
Original Weight Raked Weight Absolute Difference
9b) How would you rate the food benefits for offering foods that you like to eat?
Excellent 44.9% 44.5% 0.40%
Very Good 24.0% 23.6% 0.41%
Good 20.7% 21.0% 0.30%
Fair 7.6% 7.7% 0.09%
Poor 2.7% 3.2% 0.43%
Total 100.0% 100.0%
Original Weight Raked Weight Absolute Difference
9c) How would you rate the food benefits for Offering food choices in sizes and brands that you can find on the shelf?
Excellent 39.6% 39.1% 0.49%
Very Good 24.6% 25.0% 0.35%
Good 23.4% 23.5% 0.07%
Fair 7.8% 7.9% 0.10%
Poor 4.5% 4.5% 0.04%
Total 100.0% 100.0%
Original Weight Raked Weight Absolute Difference
18) Have you attended any group education sessions recommended by the WIC staff?
No 62.1% 63.6% 1.50%
Yes 37.9% 36.4% 1.50%
Total 100.0% 100.0%
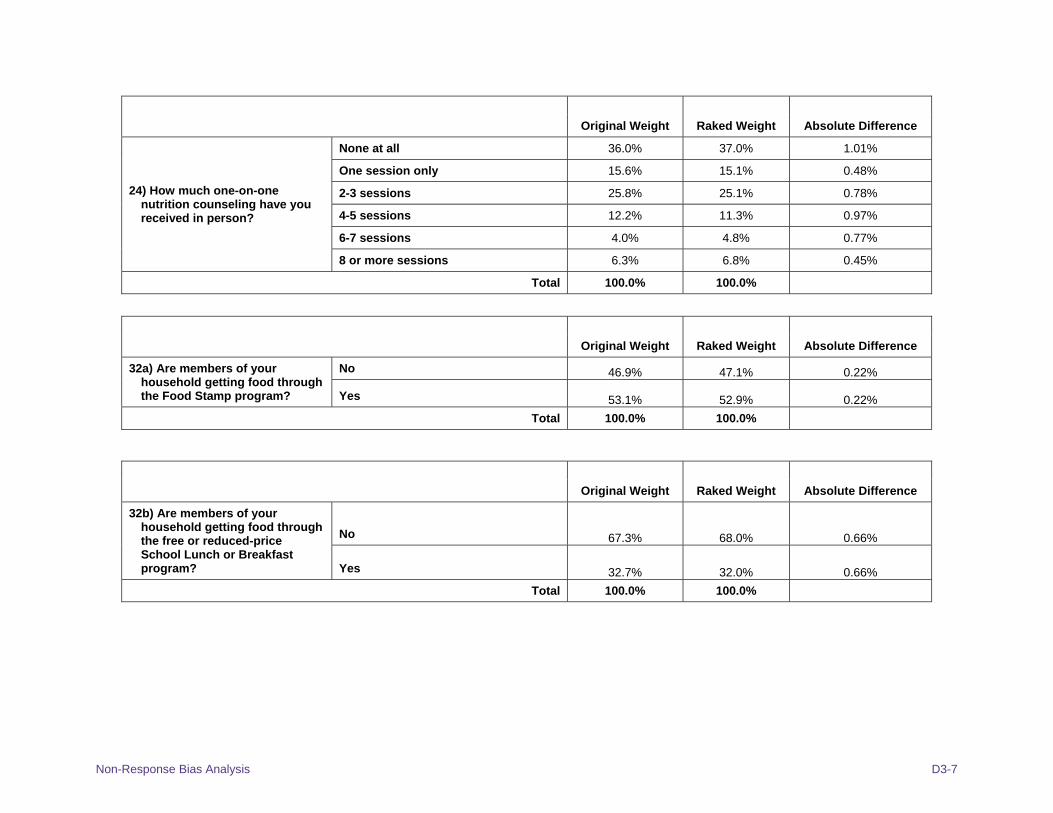
Non-Response Bias Analysis D3-7
Original Weight Raked Weight Absolute Difference
24) How much one-on-one nutrition counseling have you received in person?
None at all 36.0% 37.0% 1.01%
One session only 15.6% 15.1% 0.48%
2-3 sessions 25.8% 25.1% 0.78%
4-5 sessions 12.2% 11.3% 0.97%
6-7 sessions 4.0% 4.8% 0.77%
8 or more sessions 6.3% 6.8% 0.45%
Total 100.0% 100.0%
Original Weight Raked Weight Absolute Difference
32a) Are members of your household getting food through the Food Stamp program?
No 46.9% 47.1% 0.22%
Yes 53.1% 52.9% 0.22%
Total 100.0% 100.0%
Original Weight Raked Weight Absolute Difference
32b) Are members of your household getting food through the free or reduced-price School Lunch or Breakfast program?
No 67.3% 68.0% 0.66%
Yes 32.7% 32.0% 0.66%
Total 100.0% 100.0%
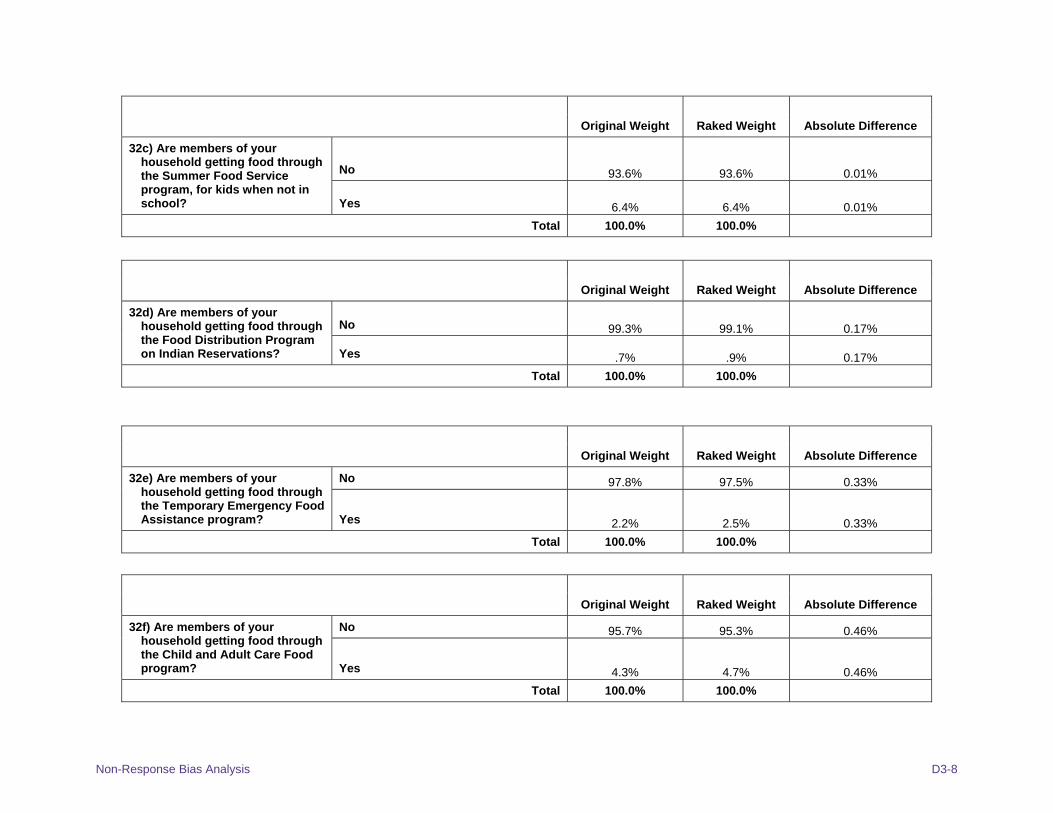
Non-Response Bias Analysis D3-8
Original Weight Raked Weight Absolute Difference
32c) Are members of your household getting food through the Summer Food Service program, for kids when not in school?
No 93.6% 93.6% 0.01%
Yes 6.4% 6.4% 0.01%
Total 100.0% 100.0%
Original Weight Raked Weight Absolute Difference
32d) Are members of your household getting food through the Food Distribution Program on Indian Reservations?
No 99.3% 99.1% 0.17%
Yes .7% .9% 0.17%
Total 100.0% 100.0%
Original Weight Raked Weight Absolute Difference
32e) Are members of your household getting food through the Temporary Emergency Food Assistance program?
No 97.8% 97.5% 0.33%
Yes 2.2% 2.5% 0.33%
Total 100.0% 100.0%
Original Weight Raked Weight Absolute Difference
32f) Are members of your household getting food through the Child and Adult Care Food program?
No 95.7% 95.3% 0.46%
Yes 4.3% 4.7% 0.46%
Total 100.0% 100.0%
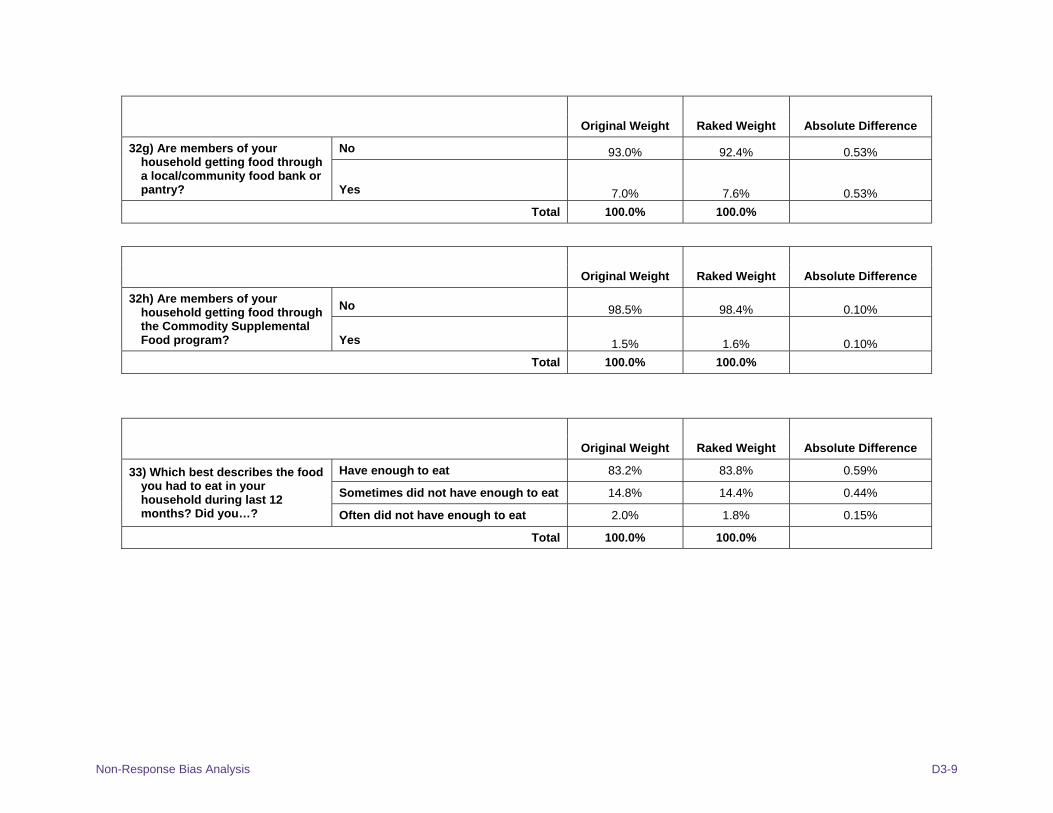
Non-Response Bias Analysis D3-9
Original Weight Raked Weight Absolute Difference
32g) Are members of your household getting food through a local/community food bank or pantry?
No 93.0% 92.4% 0.53%
Yes 7.0% 7.6% 0.53%
Total 100.0% 100.0%
Original Weight Raked Weight Absolute Difference
32h) Are members of your household getting food through the Commodity Supplemental Food program?
No 98.5% 98.4% 0.10%
Yes 1.5% 1.6% 0.10%
Total 100.0% 100.0%
Original Weight Raked Weight Absolute Difference
33) Which best describes the food you had to eat in your household during last 12 months? Did you…?
Have enough to eat 83.2% 83.8% 0.59%
Sometimes did not have enough to eat 14.8% 14.4% 0.44%
Often did not have enough to eat 2.0% 1.8% 0.15%
Total 100.0% 100.0%

Appendix D4: Race/Ethnicity
(Using California Coding), by Selected Measures

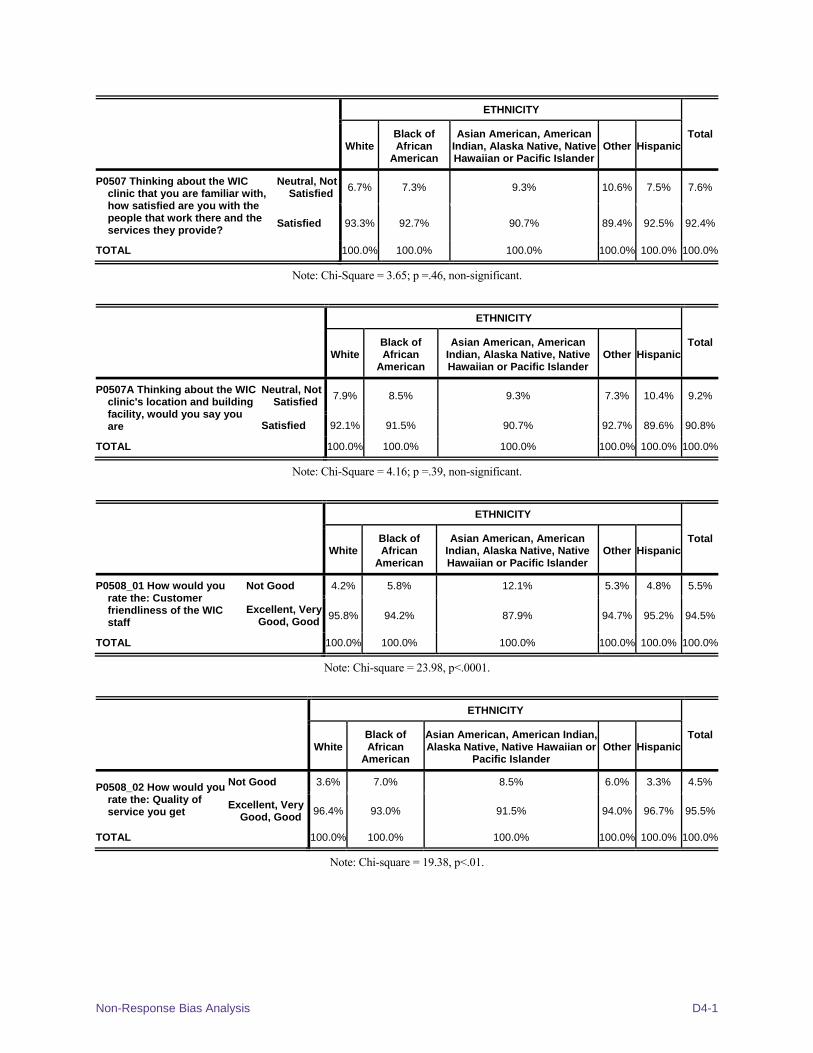
Non-Response Bias Analysis D4-1
ETHNICITY
TotalWhite
Black of African
American
Asian American, American Indian, Alaska Native, Native Hawaiian or Pacific Islander
Other Hispanic
P0507 Thinking about the WIC clinic that you are familiar with, how satisfied are you with the people that work there and the services they provide?
Neutral, Not Satisfied
6.7% 7.3% 9.3% 10.6% 7.5% 7.6%
Satisfied 93.3% 92.7% 90.7% 89.4% 92.5% 92.4%
TOTAL 100.0% 100.0% 100.0% 100.0% 100.0% 100.0%
Note: Chi-Square = 3.65; p =.46, non-significant.
ETHNICITY
TotalWhite
Black of African
American
Asian American, American Indian, Alaska Native, Native Hawaiian or Pacific Islander
Other Hispanic
P0507A Thinking about the WIC clinic's location and building facility, would you say you are
Neutral, Not Satisfied
7.9% 8.5% 9.3% 7.3% 10.4% 9.2%
Satisfied 92.1% 91.5% 90.7% 92.7% 89.6% 90.8%
TOTAL 100.0% 100.0% 100.0% 100.0% 100.0% 100.0%
Note: Chi-Square = 4.16; p =.39, non-significant.
ETHNICITY
TotalWhite
Black of African
American
Asian American, American Indian, Alaska Native, Native Hawaiian or Pacific Islander
Other Hispanic
P0508_01 How would you rate the: Customer friendliness of the WIC staff
Not Good 4.2% 5.8% 12.1% 5.3% 4.8% 5.5%
Excellent, Very Good, Good
95.8% 94.2% 87.9% 94.7% 95.2% 94.5%
TOTAL 100.0% 100.0% 100.0% 100.0% 100.0% 100.0%
Note: Chi-square = 23.98, p<.0001.
ETHNICITY
TotalWhite
Black of African
American
Asian American, American Indian, Alaska Native, Native Hawaiian or
Pacific Islander Other Hispanic
P0508_02 How would you rate the: Quality of service you get
Not Good 3.6% 7.0% 8.5% 6.0% 3.3% 4.5%
Excellent, Very Good, Good
96.4% 93.0% 91.5% 94.0% 96.7% 95.5%
TOTAL 100.0% 100.0% 100.0% 100.0% 100.0% 100.0%
Note: Chi-square = 19.38, p<.01.
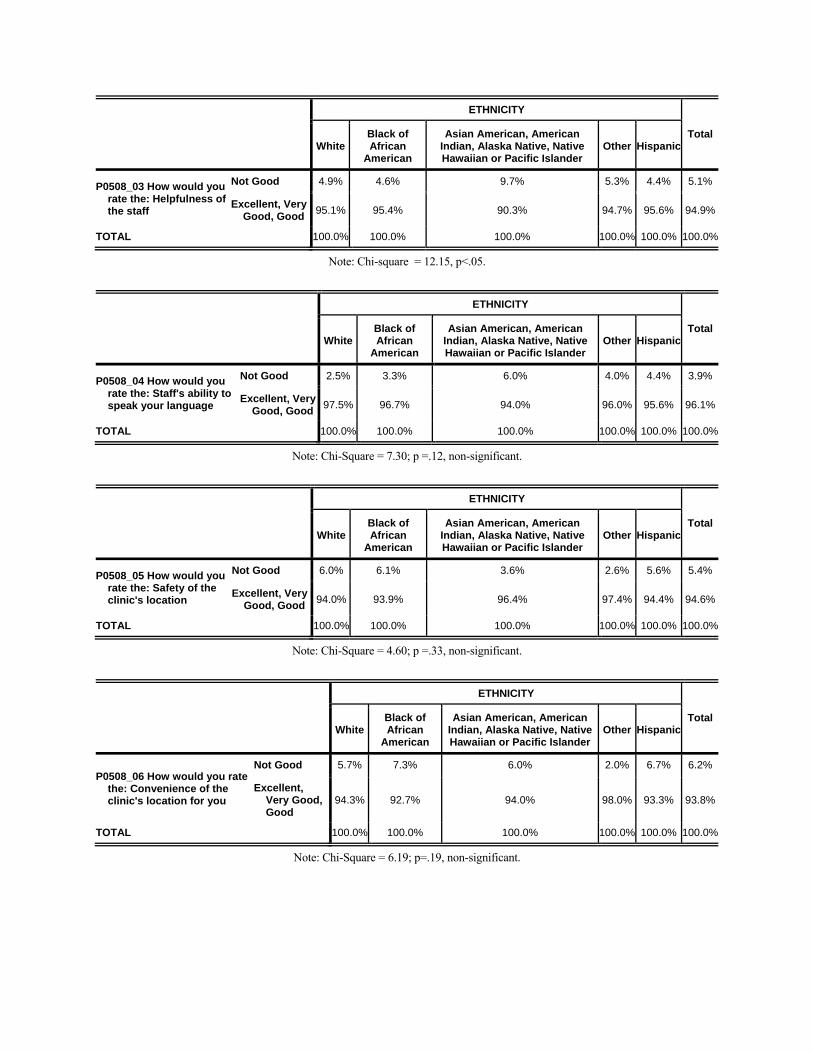
ETHNICITY
TotalWhite
Black of African
American
Asian American, American Indian, Alaska Native, Native Hawaiian or Pacific Islander
Other Hispanic
P0508_03 How would you rate the: Helpfulness of the staff
Not Good 4.9% 4.6% 9.7% 5.3% 4.4% 5.1%
Excellent, Very Good, Good
95.1% 95.4% 90.3% 94.7% 95.6% 94.9%
TOTAL 100.0% 100.0% 100.0% 100.0% 100.0% 100.0%
Note: Chi-square = 12.15, p<.05.
ETHNICITY
TotalWhite
Black of African
American
Asian American, American Indian, Alaska Native, Native Hawaiian or Pacific Islander
Other Hispanic
P0508_04 How would you rate the: Staff's ability to speak your language
Not Good 2.5% 3.3% 6.0% 4.0% 4.4% 3.9%
Excellent, Very Good, Good
97.5% 96.7% 94.0% 96.0% 95.6% 96.1%
TOTAL 100.0% 100.0% 100.0% 100.0% 100.0% 100.0%
Note: Chi-Square = 7.30; p =.12, non-significant.
ETHNICITY
TotalWhite
Black of African
American
Asian American, American Indian, Alaska Native, Native Hawaiian or Pacific Islander
Other Hispanic
P0508_05 How would you rate the: Safety of the clinic's location
Not Good 6.0% 6.1% 3.6% 2.6% 5.6% 5.4%
Excellent, Very Good, Good
94.0% 93.9% 96.4% 97.4% 94.4% 94.6%
TOTAL 100.0% 100.0% 100.0% 100.0% 100.0% 100.0%
Note: Chi-Square = 4.60; p =.33, non-significant.
ETHNICITY
TotalWhite
Black of African
American
Asian American, American Indian, Alaska Native, Native Hawaiian or Pacific Islander
Other Hispanic
P0508_06 How would you rate the: Convenience of the clinic's location for you
Not Good 5.7% 7.3% 6.0% 2.0% 6.7% 6.2%
Excellent, Very Good, Good
94.3% 92.7% 94.0% 98.0% 93.3% 93.8%
TOTAL 100.0% 100.0% 100.0% 100.0% 100.0% 100.0%
Note: Chi-Square = 6.19; p=.19, non-significant.
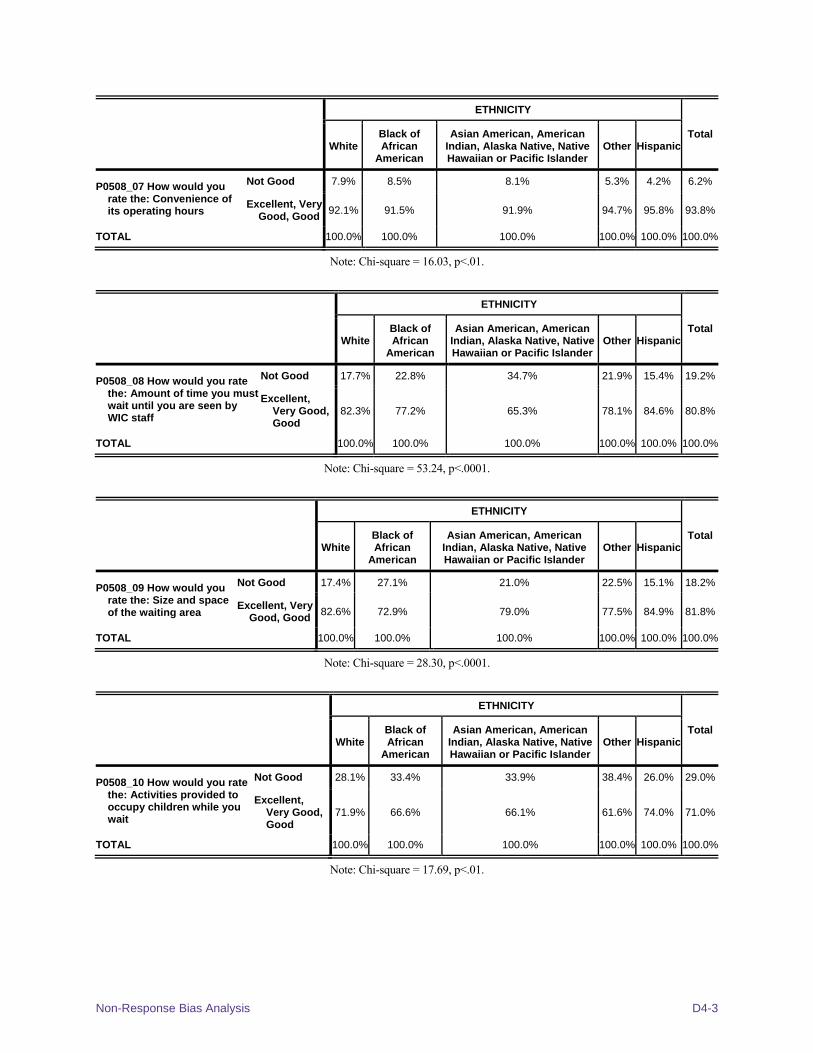
Non-Response Bias Analysis D4-3
ETHNICITY
TotalWhite
Black of African
American
Asian American, American Indian, Alaska Native, Native Hawaiian or Pacific Islander
Other Hispanic
P0508_07 How would you rate the: Convenience of its operating hours
Not Good 7.9% 8.5% 8.1% 5.3% 4.2% 6.2%
Excellent, Very Good, Good
92.1% 91.5% 91.9% 94.7% 95.8% 93.8%
TOTAL 100.0% 100.0% 100.0% 100.0% 100.0% 100.0%
Note: Chi-square = 16.03, p<.01.
ETHNICITY
TotalWhite
Black of African
American
Asian American, American Indian, Alaska Native, Native Hawaiian or Pacific Islander
Other Hispanic
P0508_08 How would you rate the: Amount of time you must wait until you are seen by WIC staff
Not Good 17.7% 22.8% 34.7% 21.9% 15.4% 19.2%
Excellent, Very Good, Good
82.3% 77.2% 65.3% 78.1% 84.6% 80.8%
TOTAL 100.0% 100.0% 100.0% 100.0% 100.0% 100.0%
Note: Chi-square = 53.24, p<.0001.
ETHNICITY
TotalWhite
Black of African
American
Asian American, American Indian, Alaska Native, Native Hawaiian or Pacific Islander
Other Hispanic
P0508_09 How would you rate the: Size and space of the waiting area
Not Good 17.4% 27.1% 21.0% 22.5% 15.1% 18.2%
Excellent, Very Good, Good
82.6% 72.9% 79.0% 77.5% 84.9% 81.8%
TOTAL 100.0% 100.0% 100.0% 100.0% 100.0% 100.0%
Note: Chi-square = 28.30, p<.0001.
ETHNICITY
TotalWhite
Black of African
American
Asian American, American Indian, Alaska Native, Native Hawaiian or Pacific Islander
Other Hispanic
P0508_10 How would you rate the: Activities provided to occupy children while you wait
Not Good 28.1% 33.4% 33.9% 38.4% 26.0% 29.0%
Excellent, Very Good, Good
71.9% 66.6% 66.1% 61.6% 74.0% 71.0%
TOTAL 100.0% 100.0% 100.0% 100.0% 100.0% 100.0%
Note: Chi-square = 17.69, p<.01.
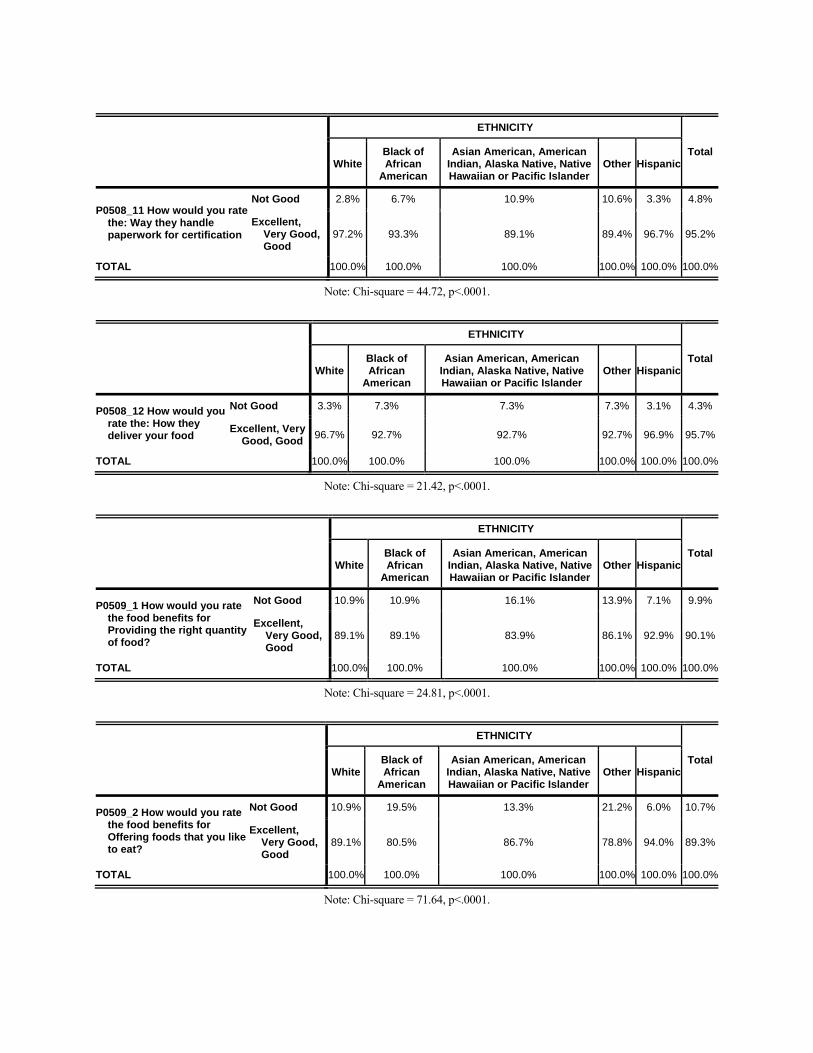
ETHNICITY
TotalWhite
Black of African
American
Asian American, American Indian, Alaska Native, Native Hawaiian or Pacific Islander
Other Hispanic
P0508_11 How would you rate the: Way they handle paperwork for certification
Not Good 2.8% 6.7% 10.9% 10.6% 3.3% 4.8%
Excellent, Very Good, Good
97.2% 93.3% 89.1% 89.4% 96.7% 95.2%
TOTAL 100.0% 100.0% 100.0% 100.0% 100.0% 100.0%
Note: Chi-square = 44.72, p<.0001.
ETHNICITY
TotalWhite
Black of African
American
Asian American, American Indian, Alaska Native, Native Hawaiian or Pacific Islander
Other Hispanic
P0508_12 How would you rate the: How they deliver your food
Not Good 3.3% 7.3% 7.3% 7.3% 3.1% 4.3%
Excellent, Very Good, Good
96.7% 92.7% 92.7% 92.7% 96.9% 95.7%
TOTAL 100.0% 100.0% 100.0% 100.0% 100.0% 100.0%
Note: Chi-square = 21.42, p<.0001.
ETHNICITY
TotalWhite
Black of African
American
Asian American, American Indian, Alaska Native, Native Hawaiian or Pacific Islander
Other Hispanic
P0509_1 How would you rate the food benefits for Providing the right quantity of food?
Not Good 10.9% 10.9% 16.1% 13.9% 7.1% 9.9%
Excellent, Very Good, Good
89.1% 89.1% 83.9% 86.1% 92.9% 90.1%
TOTAL 100.0% 100.0% 100.0% 100.0% 100.0% 100.0%
Note: Chi-square = 24.81, p<.0001.
ETHNICITY
TotalWhite
Black of African
American
Asian American, American Indian, Alaska Native, Native Hawaiian or Pacific Islander
Other Hispanic
P0509_2 How would you rate the food benefits for Offering foods that you like to eat?
Not Good 10.9% 19.5% 13.3% 21.2% 6.0% 10.7%
Excellent, Very Good, Good
89.1% 80.5% 86.7% 78.8% 94.0% 89.3%
TOTAL 100.0% 100.0% 100.0% 100.0% 100.0% 100.0%
Note: Chi-square = 71.64, p<.0001.
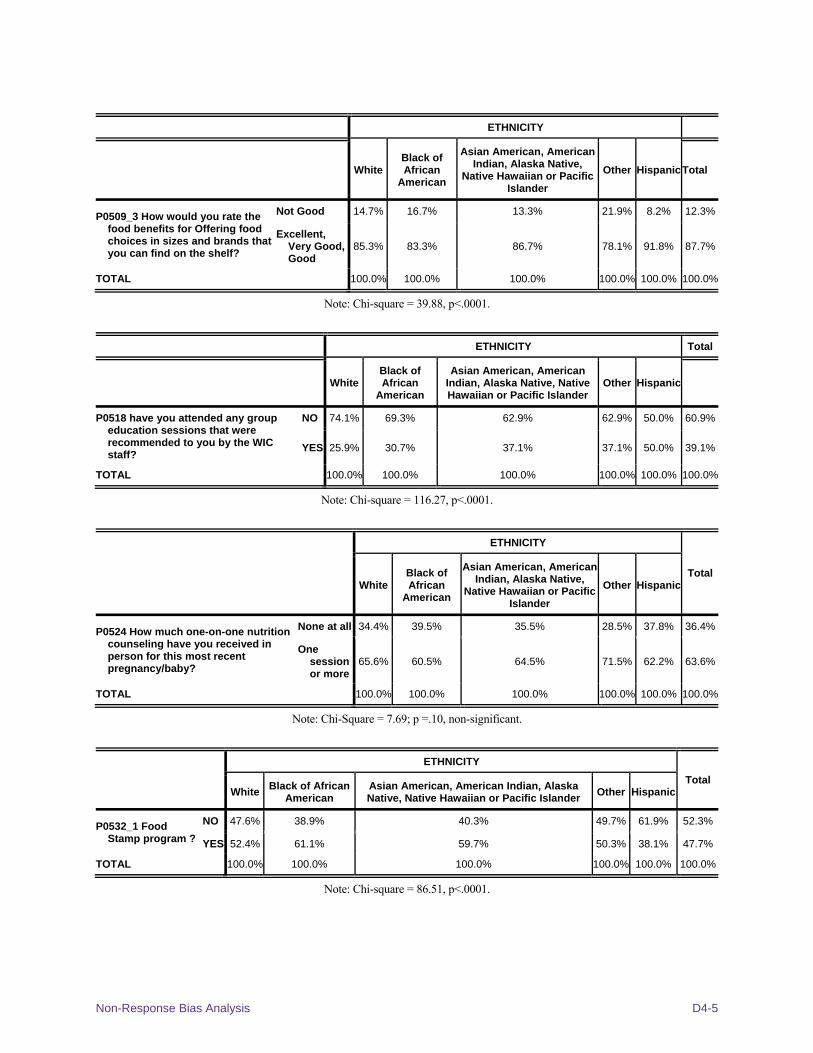
Non-Response Bias Analysis D4-5
ETHNICITY
WhiteBlack of African
American
Asian American, American Indian, Alaska Native,
Native Hawaiian or Pacific Islander
Other HispanicTotal
P0509_3 How would you rate the food benefits for Offering food choices in sizes and brands that you can find on the shelf?
Not Good 14.7% 16.7% 13.3% 21.9% 8.2% 12.3%
Excellent, Very Good, Good
85.3% 83.3% 86.7% 78.1% 91.8% 87.7%
TOTAL 100.0% 100.0% 100.0% 100.0% 100.0% 100.0%
Note: Chi-square = 39.88, p<.0001.
ETHNICITY Total
WhiteBlack of African
American
Asian American, American Indian, Alaska Native, Native Hawaiian or Pacific Islander
Other Hispanic
P0518 have you attended any group education sessions that were recommended to you by the WIC staff?
NO 74.1% 69.3% 62.9% 62.9% 50.0% 60.9%
YES 25.9% 30.7% 37.1% 37.1% 50.0% 39.1%
TOTAL 100.0% 100.0% 100.0% 100.0% 100.0% 100.0%
Note: Chi-square = 116.27, p<.0001.
ETHNICITY
TotalWhite
Black of African
American
Asian American, American Indian, Alaska Native,
Native Hawaiian or Pacific Islander
Other Hispanic
P0524 How much one-on-one nutrition counseling have you received in person for this most recent pregnancy/baby?
None at all 34.4% 39.5% 35.5% 28.5% 37.8% 36.4%
One session or more
65.6% 60.5% 64.5% 71.5% 62.2% 63.6%
TOTAL 100.0% 100.0% 100.0% 100.0% 100.0% 100.0%
Note: Chi-Square = 7.69; p =.10, non-significant.
ETHNICITY
Total White
Black of African American
Asian American, American Indian, Alaska Native, Native Hawaiian or Pacific Islander
Other Hispanic
P0532_1 Food Stamp program ?
NO 47.6% 38.9% 40.3% 49.7% 61.9% 52.3%
YES 52.4% 61.1% 59.7% 50.3% 38.1% 47.7%
TOTAL 100.0% 100.0% 100.0% 100.0% 100.0% 100.0%
Note: Chi-square = 86.51, p<.0001.
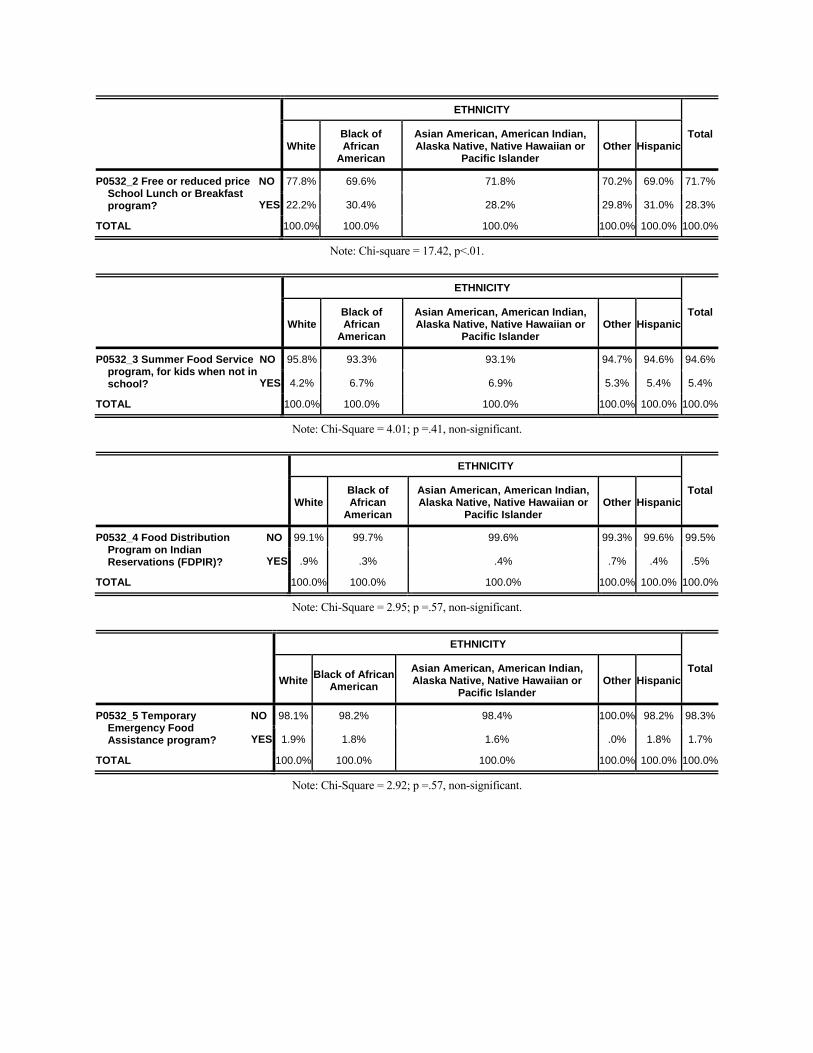
ETHNICITY
TotalWhite
Black of African
American
Asian American, American Indian, Alaska Native, Native Hawaiian or
Pacific Islander Other Hispanic
P0532_2 Free or reduced price School Lunch or Breakfast program?
NO 77.8% 69.6% 71.8% 70.2% 69.0% 71.7%
YES 22.2% 30.4% 28.2% 29.8% 31.0% 28.3%
TOTAL 100.0% 100.0% 100.0% 100.0% 100.0% 100.0%
Note: Chi-square = 17.42, p<.01.
ETHNICITY
TotalWhite
Black of African
American
Asian American, American Indian, Alaska Native, Native Hawaiian or
Pacific Islander Other Hispanic
P0532_3 Summer Food Service program, for kids when not in school?
NO 95.8% 93.3% 93.1% 94.7% 94.6% 94.6%
YES 4.2% 6.7% 6.9% 5.3% 5.4% 5.4%
TOTAL 100.0% 100.0% 100.0% 100.0% 100.0% 100.0%
Note: Chi-Square = 4.01; p =.41, non-significant.
ETHNICITY
TotalWhite
Black of African
American
Asian American, American Indian, Alaska Native, Native Hawaiian or
Pacific Islander Other Hispanic
P0532_4 Food Distribution Program on Indian Reservations (FDPIR)?
NO 99.1% 99.7% 99.6% 99.3% 99.6% 99.5%
YES .9% .3% .4% .7% .4% .5%
TOTAL 100.0% 100.0% 100.0% 100.0% 100.0% 100.0%
Note: Chi-Square = 2.95; p =.57, non-significant.
ETHNICITY
TotalWhite
Black of African American
Asian American, American Indian, Alaska Native, Native Hawaiian or
Pacific Islander Other Hispanic
P0532_5 Temporary Emergency Food Assistance program?
NO 98.1% 98.2% 98.4% 100.0% 98.2% 98.3%
YES 1.9% 1.8% 1.6% .0% 1.8% 1.7%
TOTAL 100.0% 100.0% 100.0% 100.0% 100.0% 100.0%
Note: Chi-Square = 2.92; p =.57, non-significant.
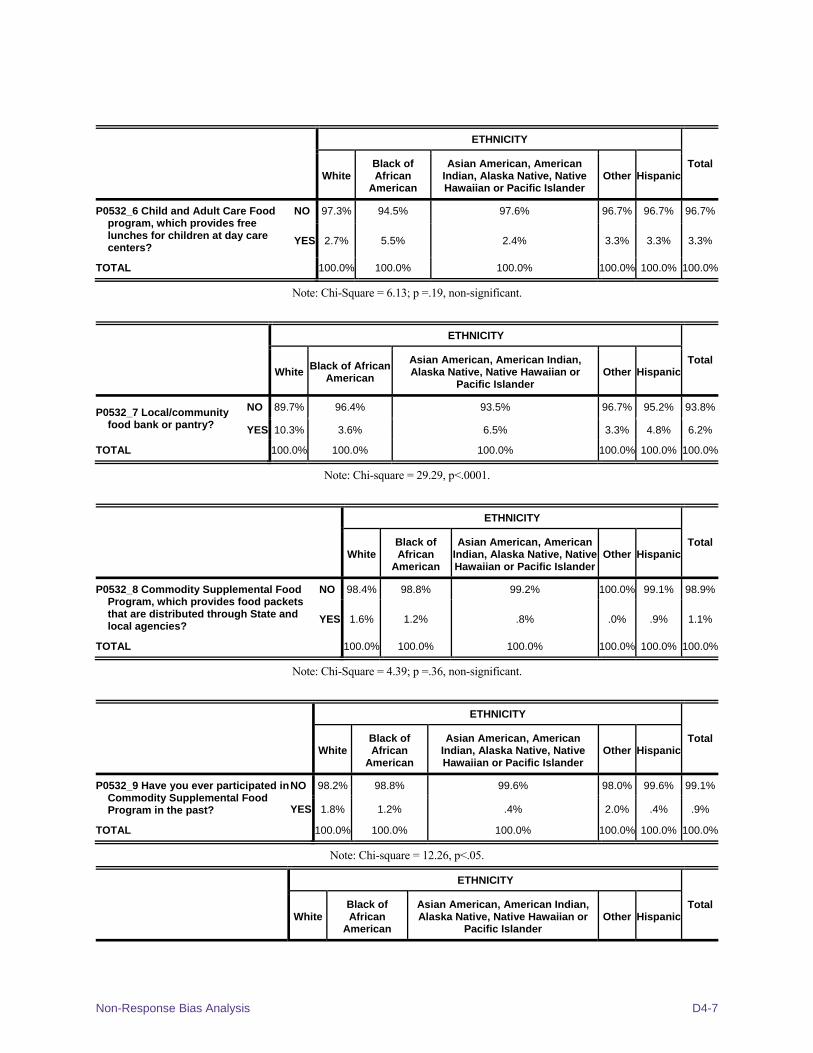
Non-Response Bias Analysis D4-7
ETHNICITY
TotalWhite
Black of African
American
Asian American, American Indian, Alaska Native, Native Hawaiian or Pacific Islander
Other Hispanic
P0532_6 Child and Adult Care Food program, which provides free lunches for children at day care centers?
NO 97.3% 94.5% 97.6% 96.7% 96.7% 96.7%
YES 2.7% 5.5% 2.4% 3.3% 3.3% 3.3%
TOTAL 100.0% 100.0% 100.0% 100.0% 100.0% 100.0%
Note: Chi-Square = 6.13; p =.19, non-significant.
ETHNICITY
TotalWhite
Black of African American
Asian American, American Indian, Alaska Native, Native Hawaiian or
Pacific Islander Other Hispanic
P0532_7 Local/community food bank or pantry?
NO 89.7% 96.4% 93.5% 96.7% 95.2% 93.8%
YES 10.3% 3.6% 6.5% 3.3% 4.8% 6.2%
TOTAL 100.0% 100.0% 100.0% 100.0% 100.0% 100.0%
Note: Chi-square = 29.29, p<.0001.
ETHNICITY
TotalWhite
Black of African
American
Asian American, American Indian, Alaska Native, Native Hawaiian or Pacific Islander
Other Hispanic
P0532_8 Commodity Supplemental Food Program, which provides food packets that are distributed through State and local agencies?
NO 98.4% 98.8% 99.2% 100.0% 99.1% 98.9%
YES 1.6% 1.2% .8% .0% .9% 1.1%
TOTAL 100.0% 100.0% 100.0% 100.0% 100.0% 100.0%
Note: Chi-Square = 4.39; p =.36, non-significant.
ETHNICITY
TotalWhite
Black of African
American
Asian American, American Indian, Alaska Native, Native Hawaiian or Pacific Islander
Other Hispanic
P0532_9 Have you ever participated in Commodity Supplemental Food Program in the past?
NO 98.2% 98.8% 99.6% 98.0% 99.6% 99.1%
YES 1.8% 1.2% .4% 2.0% .4% .9%
TOTAL 100.0% 100.0% 100.0% 100.0% 100.0% 100.0%
Note: Chi-square = 12.26, p<.05.
ETHNICITY
TotalWhite
Black of African
American
Asian American, American Indian, Alaska Native, Native Hawaiian or
Pacific Islander Other Hispanic
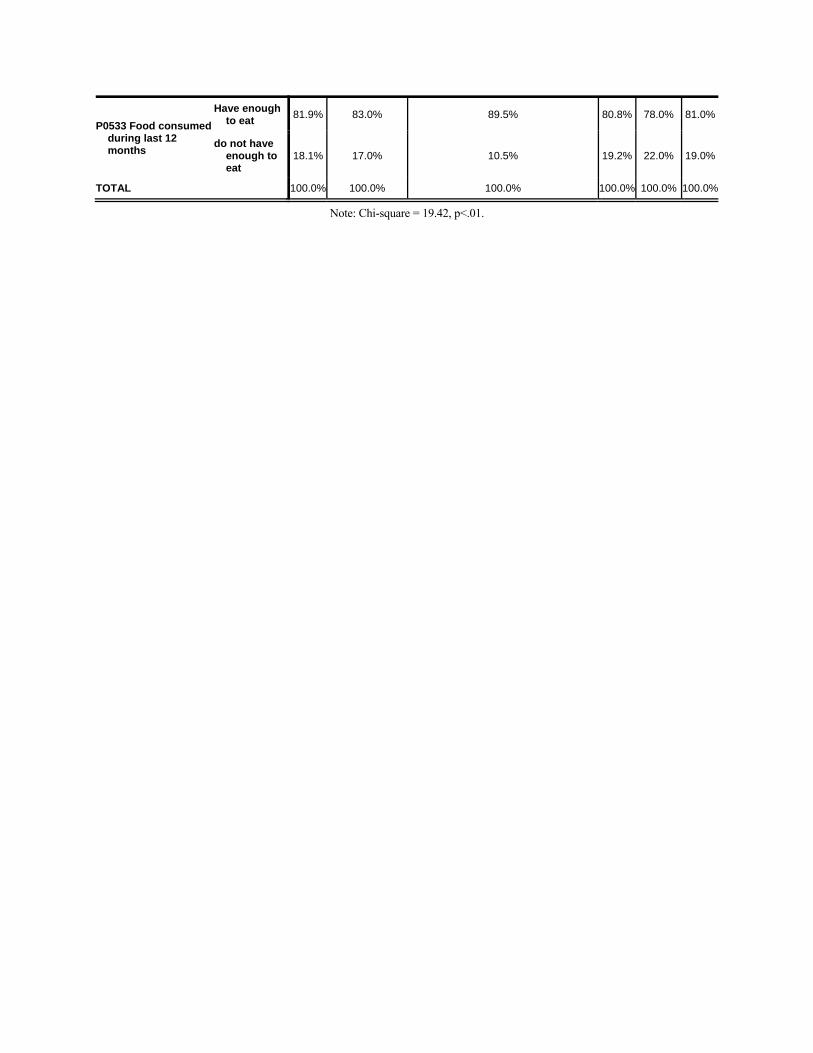
P0533 Food consumed during last 12 months
Have enough to eat
81.9% 83.0% 89.5% 80.8% 78.0% 81.0%
do not have enough to eat
18.1% 17.0% 10.5% 19.2% 22.0% 19.0%
TOTAL 100.0% 100.0% 100.0% 100.0% 100.0% 100.0%
Note: Chi-square = 19.42, p<.01.
Appendix E: Additional Data Tables

Additional Data Tables E-i
TABLE OF CONTENTS Table 1: The Number of WIC Clients Receiving WIC for the First Time (Q1) ...................... 1
Table 2: Number of Times Participated in WIC (Q2) ............................................................... 1
Table 3: Why WIC Clients Did Not Participate in WIC Program (First Child/Pregnancy Removed) (Q3) ............................................................................................................. 1
Table 5: Received Benefits While Pregnant (Q5) ..................................................................... 2
Table 6: Why Did Not Participate While Pregnant (Q6) .......................................................... 2
Table 7: Satisfaction with WIC Staff and Services (Q7) ........................................................... 2
Table 7a: Satisfaction with WIC Clinic Location and Building Facility (Q7a) ......................... 6
Table 8.1: WIC Clients Satisfaction of the (Q8.1) Customer Friendliness of the WIC Staff ...................................................................................................................... 9
Table 8.2: WIC Clients Satisfaction with (Q8.2) Quality of Service ......................................... 13
Table 8.3: WIC Clients Satisfaction with (Q8.3) Helpfulness of Staff ...................................... 17
Table 8.4: WIC Clients Satisfaction with (Q8.4) Staff Language .............................................. 21
Table 8.5: WIC Clients Satisfaction with (Q8.5) Safety of the Clinic’s Location .................... 25
Table 8.6: WIC Clients Satisfaction with (Q8.6) the Convenience of the Clinic’s Location ........................................................................................................ 29
Table 8.7: WIC Clients Satisfaction with (Q8.7) the Convenience of the Clinic’s Operating Hours .......................................................................................................................... 33
Table 8.8: WIC Clients Satisfaction with (Q8.8) Waiting Time ................................................ 37
Table 8.9: WIC Clients Satisfaction with (Q8.9) the Size and Space of the Waiting Area .............................................................................................................. 41
Table 8.10 WIC Clients Satisfaction with (Q8.10) the Child Activities Offered ....................... 45
Table 8.11: WIC Clients Satisfaction with (Q8.11) how Paperwork for Certification is Handled ................................................................................................................... 49
Table 8.12: WIC Clients Satisfaction with (Q8.12) the Delivery of Food .................................. 53
Table 9.1: Satisfaction with WIC Providing the Right Quantities of Food (Q9.1) ................... 57
Table 9.2: Satisfaction with WIC Offering Foods That Participant Will Eat (Q9.2) ................ 62
Table 9.3: Satisfaction with WIC Offering Food Choices and Sizes Found on Store Shelves (Q9.3) ............................................................................................................ 67
Table 10: Food Coupons chosen not to be redeemed (Q10) ..................................................... 73
Table 11: Reasons why participants do not redeem certain food coupons (Q11) .................... 73
Table 12a: Too much food received from redeemed food coupon (Q12a) ................................ 76
Table 12b: Too little food received from redeemed food coupon (Q12b) .................................. 78
Table 13: Type of Store WIC Participants Most Often Redeem WIC Food (Q13) ................. 80
Table 14: Store Where Participants Did Most of Their Shopping (Q14) ................................. 88
Table 15: Purchase WIC Items at Same Store as Usual (Q15) ................................................. 88
Table 16: Why not the Same Store as Usual (Q16) ................................................................... 88
Table 17: Reasons Why WIC Participants Shop Where They Do for WIC Items (Q17) ................................................................................................................. 89
Table 18: Participants Attending Any Group Education Session (Q18) .................................. 91
Table 20: Whether or Not the Seminar Influenced the WIC Participant To Make Any Lifestyle Change (Q20) ...................................................................................... 94
Table 21: Changes WIC Participants Made Because of Seminar (Q21) .................................. 95
Table 22: Reported Reasons Why the Seminar Did Not Work (Q22) ...................................... 97
Table 23.1: Value of WIC Benefits: Time to Talk with Other Mothers (Q23.1) ........................ 98
Table 23.2: Value of WIC Benefits: Money Saved on Grocery Bills (Q23.2) .......................... 103
Table 23.3: Value of WIC Benefits: Health Information (Q23.3) ............................................. 108
Table 23.4: Value of WIC Benefits: Nutrition Information (Q23.4) ......................................... 113
Table 23.5: Value of WIC Benefits: Checking Blood, Height and Weight (Q23.5) ................. 118
Table 23.6: Value of WIC Benefits: Advice from WIC Staff (Q23.6) ...................................... 123
Table 23.7: Value of WIC Benefits: Vouchers for Foods I Know Are Nutritious (Q23.7) .................................................................................................... 128
Table 23.8: Value of WIC Benefits: Helps Me Stay on Time with Shots for My Child (Q23.8) ............................................................................................................ 133
Table 23.9: Value of WIC Benefits: Teaching Me About Breastfeeding (Q23.9) .................... 138
Table 23.10: Value of WIC Benefits: Teaching Me About Foods Babies Need (Q23.10) ......... 143
Table 23.11: Value of WIC Benefits: Teaching Me About Foods Children Need (Q23.11) .......................................................................................................... 148
Table 23.12: Value of WIC Benefits: Teaching Me About the Foods I Need (Q23.12) ............. 153
Table 24: One-on-One Nutrition Counseling: Number of Sessions (Q24) ............................. 158
Table 25: Amount of One-on-One Training Received (Q25) ................................................. 159
Table 26.1: Nutrition Counseling: Healthy weight (Q26.1) ....................................................... 159
Table 26.2: Nutrition Counseling: Fruits and Vegetables (Q26.2) ............................................ 160
Table 26.3: Nutrition Counseling: Protein (Q26.3) .................................................................... 160
Table 26.4: Nutrition Counseling: Getting enough iron (Q26.4) ............................................... 160
Table 26.5: Nutrition Counseling: Calcium for bone health (Q26.5) ........................................ 160
Table 26.6: Nutrition Counseling: Vitamin C (Q26.6) ............................................................... 161
Table 26.7: Nutrition Counseling: Other vitamins and food supplements (Q26.7) ................... 161
Table 26.8: Nutrition Counseling: Food safety (Q26.8) ............................................................. 161
Table 26.9: Nutrition Counseling: Physical activity (Q26.9) ..................................................... 161
Table 26.10: Nutrition Counseling: Eating/preparing healthy meals (Q26.10) ........................... 162
Additional Data Tables E-iii
Table 26.11: Nutrition Counseling: Picky eaters, (Q26.11) ......................................................... 162
Table 27: WIC Clients Who Found Nutrition Counseling Useful (Q27) ............................... 162
Table 28: Reasons Why WIC Participants Found Counseling Helpful (Q28) ....................... 163
Table 29: Reasons Why WIC Participants Did Not Find Counseling Helpful (Q29) ............ 164
Table 30: Insurance Coverage for Children in WIC Families (Q30) ...................................... 165
Table 31: Insurance Coverage for Adults in WIC Families (Q31) ......................................... 168
Table 30/31: Health Insurance Coverage for Women/Children in Household (Q30/31) ............ 169
Table 32: WIC Clients Participation in Other Food Assistance Programs (Q32) .................. 171
Table 33/34: WIC Clients Food Security (Q33/34) ...................................................................... 172
Table 35: Number of Children Breastfed (Q35) ...................................................................... 177
Table 36: Breastfeeding Last/Previous Baby Before This One (Q36) .................................... 177
Table 36a: Days Previous Baby Breastfed (Q36a) .................................................................... 177
Table 36b: Days Previous Baby Exclusively Breastfed (Q36b) ............................................... 177
Table 38: Breastfeeding Most Recent/Current Baby (Q38) .................................................... 178
Table 39a: Days Current Baby Breastfed (Q39a) ...................................................................... 178
Table 39b: Days Current Baby Exclusively Breastfed (Q39b) ................................................ 178
Table 40: What might have helped participants to Breastfeed (Q40) ..................................... 179
Table 41: Things That Would Have Helped WIC Participant To Breastfeed Longer (Q41) ............................................................................................................ 179
Table 42: Plans to Breastfeed (Q42) ........................................................................................ 180
Table 43: Months Planning to Breastfeed (Q43) ..................................................................... 181
Table 44: Advantages of Breastfeeding (Q44) ........................................................................ 182
Table 45: Disadvantages of Breastfeeding (Q45) .................................................................... 183
Table 46: Has Friends Who Might Be Eligible for WIC but Haven’t Applied (Q46) ........... 184
Table 47: Knows Anyone Who Was in WIC but Dropped Out Before Certification Period Was Over (Q47) ....................................................................................................... 187
Table 48: Main Reasons Why People Do Not Participate in WIC (Q48) .............................. 190
Table 49: Table 49 Participant Category by Hispanic Ethnicity (Q49) .................................. 192
Table 50: Participant Category by Race (Q50) ........................................................................ 193
Table 51: Level of Education (Q51) ........................................................................................ 194
Table 52: Participant Category by Primary Language (Q52) .................................................. 194

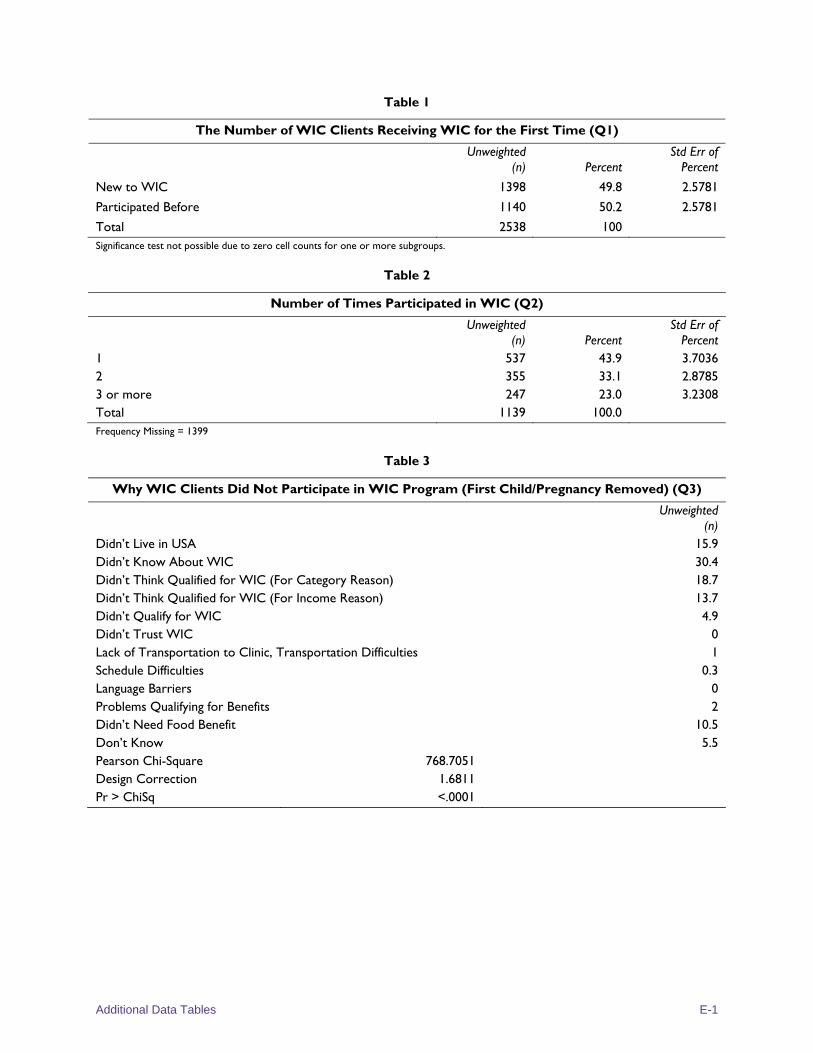
Additional Data Tables E-1
Table 1
The Number of WIC Clients Receiving WIC for the First Time (Q1)
Unweighted (n) Percent
Std Err of Percent
New to WIC 1398 49.8 2.5781
Participated Before 1140 50.2 2.5781
Total 2538 100 Significance test not possible due to zero cell counts for one or more subgroups.
Table 2
Number of Times Participated in WIC (Q2)
Unweighted (n) Percent
Std Err of Percent
1 537 43.9 3.7036 2 355 33.1 2.8785 3 or more 247 23.0 3.2308 Total 1139 100.0 Frequency Missing = 1399
Table 3
Why WIC Clients Did Not Participate in WIC Program (First Child/Pregnancy Removed) (Q3)
Unweighted (n)
Didn’t Live in USA 15.9 Didn’t Know About WIC 30.4 Didn’t Think Qualified for WIC (For Category Reason) 18.7 Didn’t Think Qualified for WIC (For Income Reason) 13.7 Didn’t Qualify for WIC 4.9 Didn’t Trust WIC 0 Lack of Transportation to Clinic, Transportation Difficulties 1 Schedule Difficulties 0.3 Language Barriers 0 Problems Qualifying for Benefits 2 Didn’t Need Food Benefit 10.5 Don’t Know 5.5 Pearson Chi-Square 768.7051 Design Correction 1.6811 Pr > ChiSq <.0001
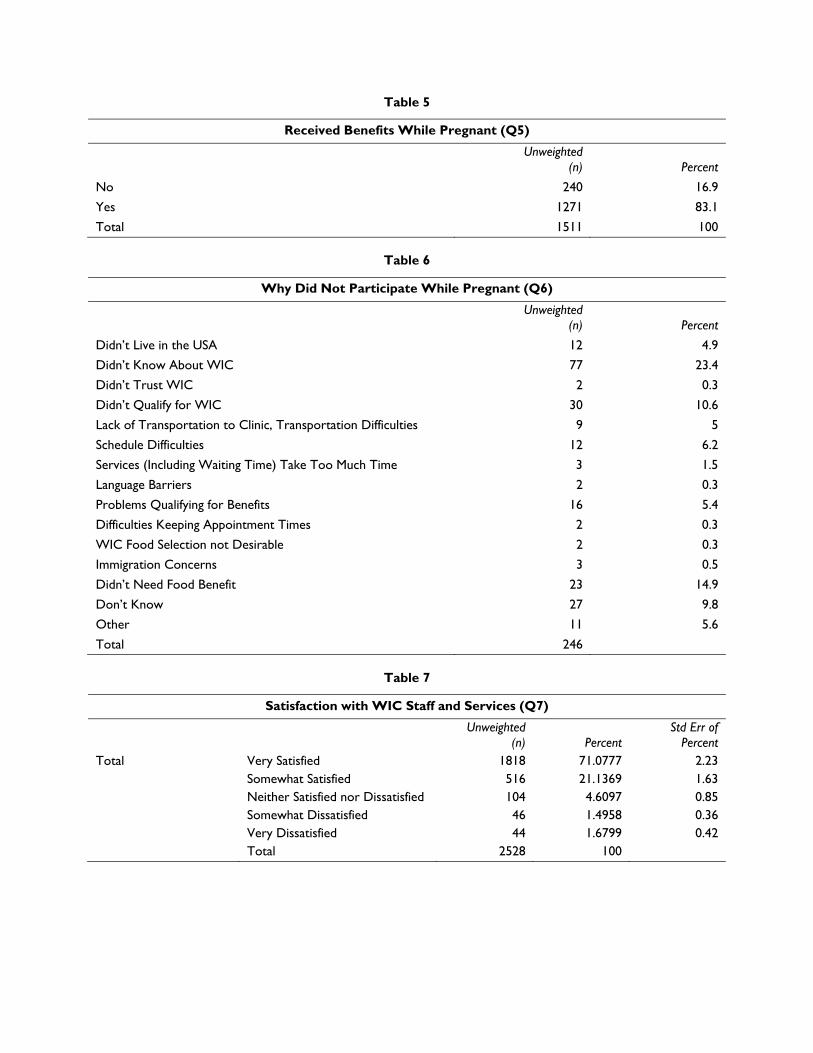
Table 5
Received Benefits While Pregnant (Q5)
Unweighted (n) Percent
No 240 16.9
Yes 1271 83.1
Total 1511 100
Table 6
Why Did Not Participate While Pregnant (Q6)
Unweighted (n) Percent
Didn’t Live in the USA 12 4.9
Didn’t Know About WIC 77 23.4
Didn’t Trust WIC 2 0.3
Didn’t Qualify for WIC 30 10.6
Lack of Transportation to Clinic, Transportation Difficulties 9 5
Schedule Difficulties 12 6.2
Services (Including Waiting Time) Take Too Much Time 3 1.5
Language Barriers 2 0.3
Problems Qualifying for Benefits 16 5.4
Difficulties Keeping Appointment Times 2 0.3
WIC Food Selection not Desirable 2 0.3
Immigration Concerns 3 0.5
Didn’t Need Food Benefit 23 14.9
Don’t Know 27 9.8
Other 11 5.6
Total 246
Table 7
Satisfaction with WIC Staff and Services (Q7)
Unweighted (n) Percent
Std Err of Percent
Total Very Satisfied 1818 71.0777 2.23 Somewhat Satisfied 516 21.1369 1.63 Neither Satisfied nor Dissatisfied 104 4.6097 0.85 Somewhat Dissatisfied 46 1.4958 0.36 Very Dissatisfied 44 1.6799 0.42 Total 2528 100
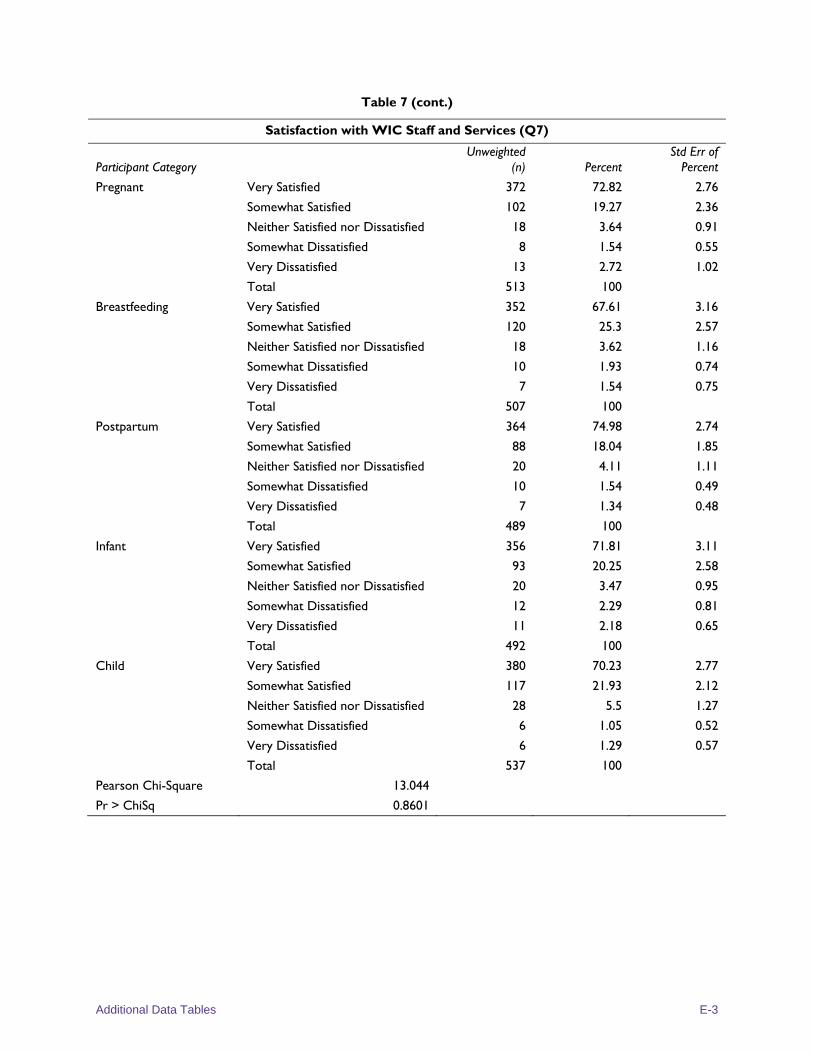
Additional Data Tables E-3
Table 7 (cont.)
Satisfaction with WIC Staff and Services (Q7)
Participant Category Unweighted
(n) Percent Std Err of
Percent
Pregnant Very Satisfied 372 72.82 2.76
Somewhat Satisfied 102 19.27 2.36
Neither Satisfied nor Dissatisfied 18 3.64 0.91
Somewhat Dissatisfied 8 1.54 0.55
Very Dissatisfied 13 2.72 1.02
Total 513 100
Breastfeeding Very Satisfied 352 67.61 3.16
Somewhat Satisfied 120 25.3 2.57
Neither Satisfied nor Dissatisfied 18 3.62 1.16
Somewhat Dissatisfied 10 1.93 0.74
Very Dissatisfied 7 1.54 0.75
Total 507 100
Postpartum Very Satisfied 364 74.98 2.74
Somewhat Satisfied 88 18.04 1.85
Neither Satisfied nor Dissatisfied 20 4.11 1.11
Somewhat Dissatisfied 10 1.54 0.49
Very Dissatisfied 7 1.34 0.48
Total 489 100
Infant Very Satisfied 356 71.81 3.11
Somewhat Satisfied 93 20.25 2.58
Neither Satisfied nor Dissatisfied 20 3.47 0.95
Somewhat Dissatisfied 12 2.29 0.81
Very Dissatisfied 11 2.18 0.65
Total 492 100
Child Very Satisfied 380 70.23 2.77
Somewhat Satisfied 117 21.93 2.12
Neither Satisfied nor Dissatisfied 28 5.5 1.27
Somewhat Dissatisfied 6 1.05 0.52
Very Dissatisfied 6 1.29 0.57
Total 537 100
Pearson Chi-Square 13.044
Pr > ChiSq 0.8601
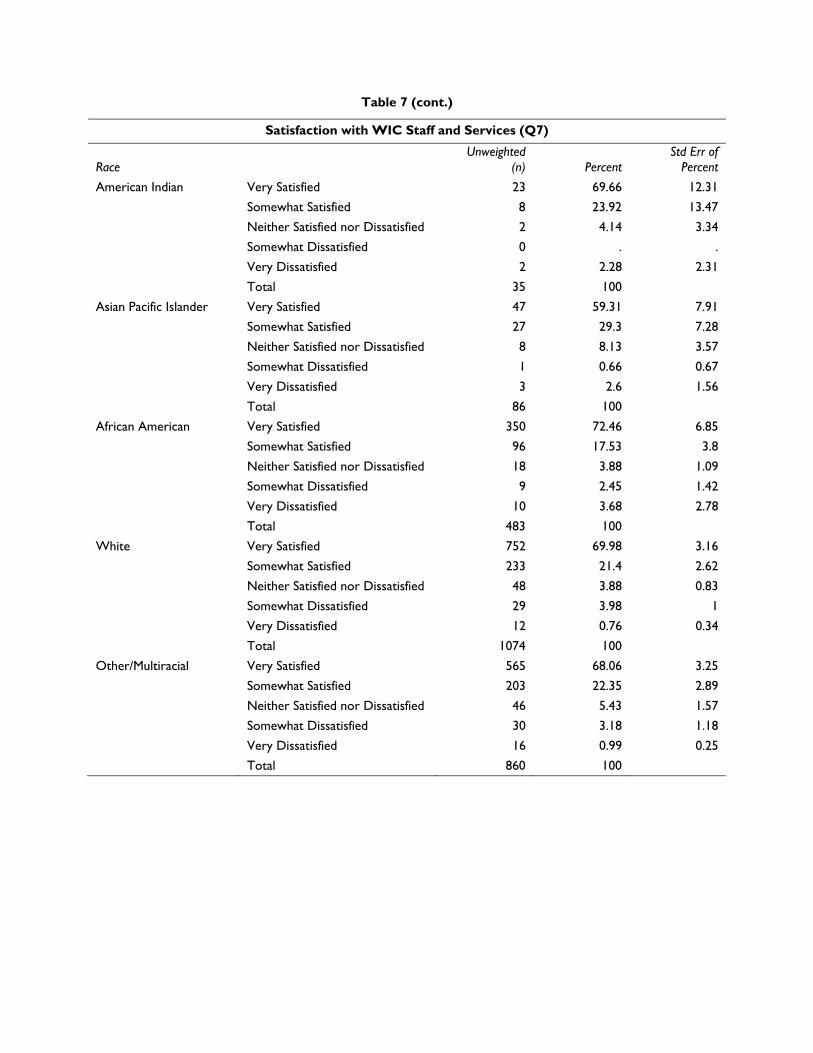
Table 7 (cont.)
Satisfaction with WIC Staff and Services (Q7)
Race Unweighted
(n) Percent Std Err of
Percent
American Indian Very Satisfied 23 69.66 12.31
Somewhat Satisfied 8 23.92 13.47
Neither Satisfied nor Dissatisfied 2 4.14 3.34
Somewhat Dissatisfied 0 . .
Very Dissatisfied 2 2.28 2.31
Total 35 100
Asian Pacific Islander Very Satisfied 47 59.31 7.91
Somewhat Satisfied 27 29.3 7.28
Neither Satisfied nor Dissatisfied 8 8.13 3.57
Somewhat Dissatisfied 1 0.66 0.67
Very Dissatisfied 3 2.6 1.56
Total 86 100
African American Very Satisfied 350 72.46 6.85
Somewhat Satisfied 96 17.53 3.8
Neither Satisfied nor Dissatisfied 18 3.88 1.09
Somewhat Dissatisfied 9 2.45 1.42
Very Dissatisfied 10 3.68 2.78
Total 483 100
White Very Satisfied 752 69.98 3.16
Somewhat Satisfied 233 21.4 2.62
Neither Satisfied nor Dissatisfied 48 3.88 0.83
Somewhat Dissatisfied 29 3.98 1
Very Dissatisfied 12 0.76 0.34
Total 1074 100
Other/Multiracial Very Satisfied 565 68.06 3.25
Somewhat Satisfied 203 22.35 2.89
Neither Satisfied nor Dissatisfied 46 5.43 1.57
Somewhat Dissatisfied 30 3.18 1.18
Very Dissatisfied 16 0.99 0.25
Total 860 100
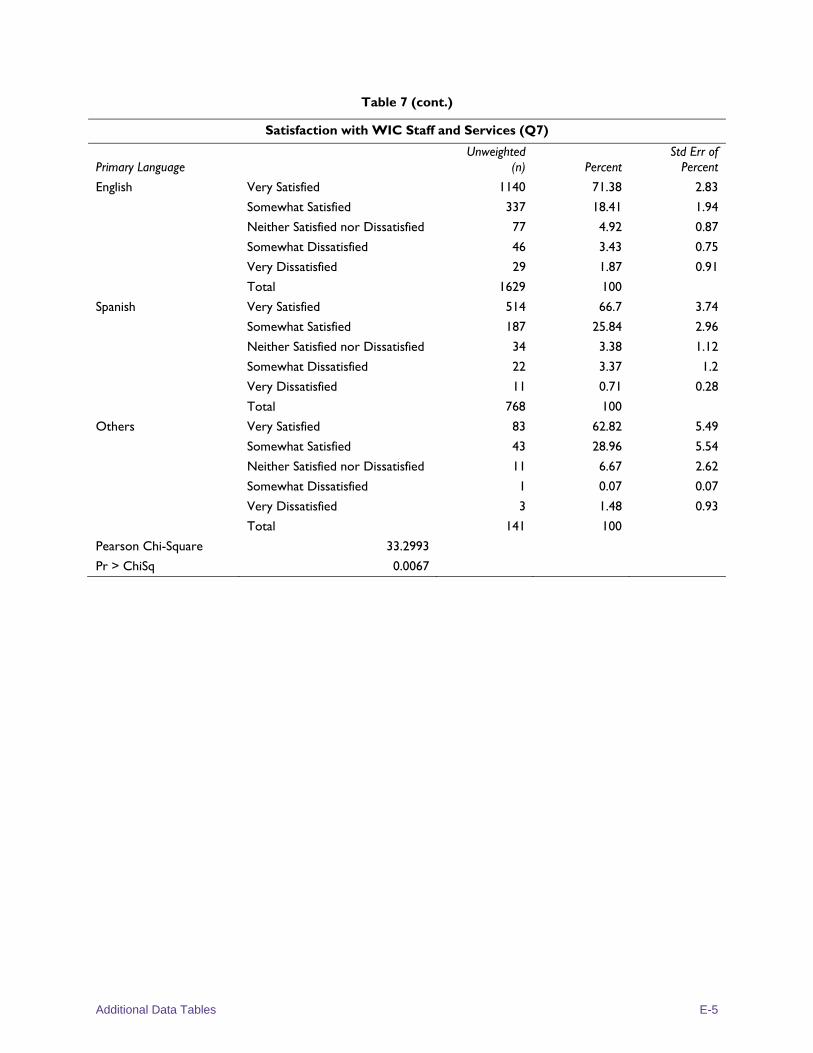
Additional Data Tables E-5
Table 7 (cont.)
Satisfaction with WIC Staff and Services (Q7)
Primary Language Unweighted
(n) Percent Std Err of
Percent
English Very Satisfied 1140 71.38 2.83
Somewhat Satisfied 337 18.41 1.94
Neither Satisfied nor Dissatisfied 77 4.92 0.87
Somewhat Dissatisfied 46 3.43 0.75
Very Dissatisfied 29 1.87 0.91
Total 1629 100
Spanish Very Satisfied 514 66.7 3.74
Somewhat Satisfied 187 25.84 2.96
Neither Satisfied nor Dissatisfied 34 3.38 1.12
Somewhat Dissatisfied 22 3.37 1.2
Very Dissatisfied 11 0.71 0.28
Total 768 100
Others Very Satisfied 83 62.82 5.49
Somewhat Satisfied 43 28.96 5.54
Neither Satisfied nor Dissatisfied 11 6.67 2.62
Somewhat Dissatisfied 1 0.07 0.07
Very Dissatisfied 3 1.48 0.93
Total 141 100
Pearson Chi-Square 33.2993
Pr > ChiSq 0.0067
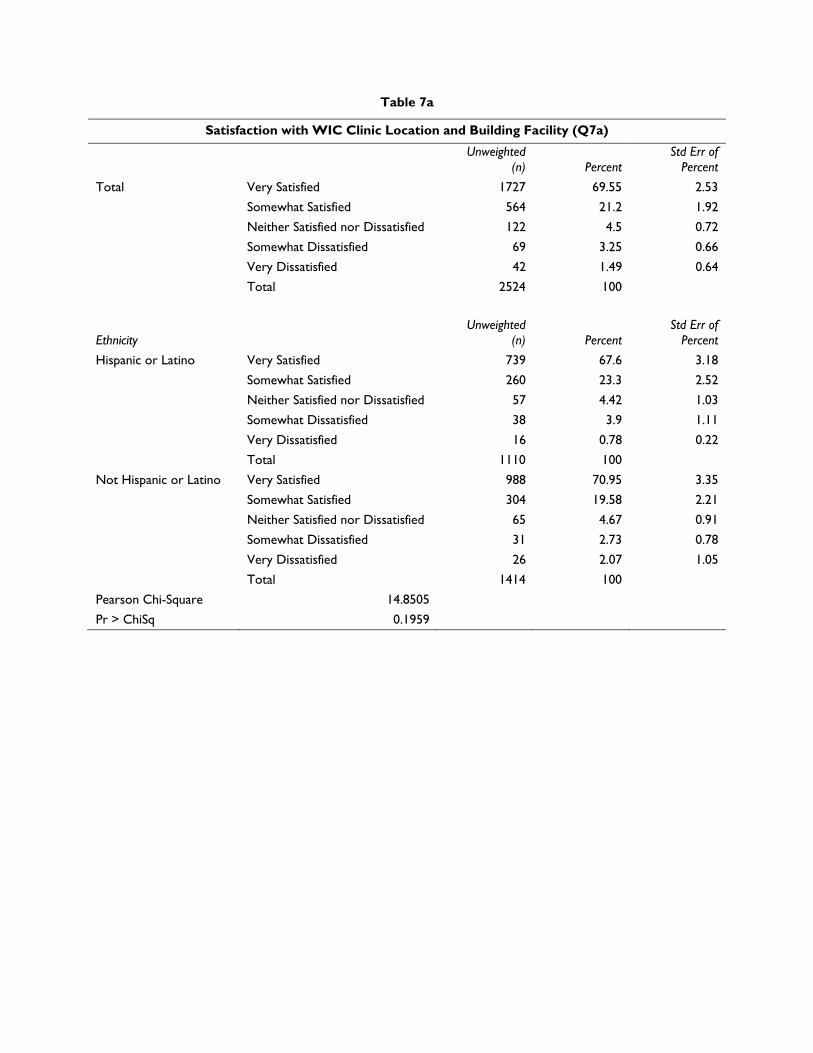
Table 7a
Satisfaction with WIC Clinic Location and Building Facility (Q7a)
Unweighted (n) Percent
Std Err of Percent
Total Very Satisfied 1727 69.55 2.53
Somewhat Satisfied 564 21.2 1.92
Neither Satisfied nor Dissatisfied 122 4.5 0.72
Somewhat Dissatisfied 69 3.25 0.66
Very Dissatisfied 42 1.49 0.64
Total 2524 100
Ethnicity Unweighted
(n) Percent Std Err of
Percent
Hispanic or Latino Very Satisfied 739 67.6 3.18
Somewhat Satisfied 260 23.3 2.52
Neither Satisfied nor Dissatisfied 57 4.42 1.03
Somewhat Dissatisfied 38 3.9 1.11
Very Dissatisfied 16 0.78 0.22
Total 1110 100
Not Hispanic or Latino Very Satisfied 988 70.95 3.35
Somewhat Satisfied 304 19.58 2.21
Neither Satisfied nor Dissatisfied 65 4.67 0.91
Somewhat Dissatisfied 31 2.73 0.78
Very Dissatisfied 26 2.07 1.05
Total 1414 100
Pearson Chi-Square 14.8505
Pr > ChiSq 0.1959
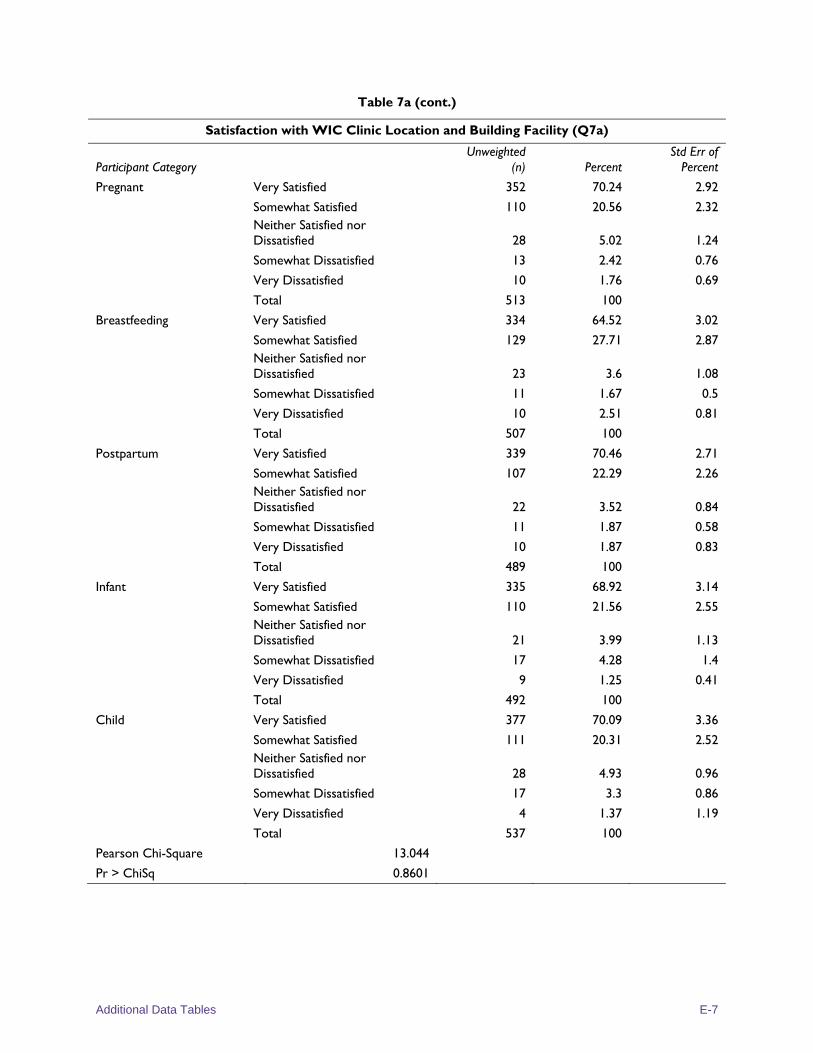
Additional Data Tables E-7
Table 7a (cont.)
Satisfaction with WIC Clinic Location and Building Facility (Q7a)
Participant Category Unweighted
(n) Percent Std Err of
Percent
Pregnant Very Satisfied 352 70.24 2.92
Somewhat Satisfied 110 20.56 2.32 Neither Satisfied nor Dissatisfied 28 5.02 1.24
Somewhat Dissatisfied 13 2.42 0.76
Very Dissatisfied 10 1.76 0.69
Total 513 100
Breastfeeding Very Satisfied 334 64.52 3.02
Somewhat Satisfied 129 27.71 2.87 Neither Satisfied nor Dissatisfied 23 3.6 1.08
Somewhat Dissatisfied 11 1.67 0.5
Very Dissatisfied 10 2.51 0.81
Total 507 100
Postpartum Very Satisfied 339 70.46 2.71
Somewhat Satisfied 107 22.29 2.26 Neither Satisfied nor Dissatisfied 22 3.52 0.84
Somewhat Dissatisfied 11 1.87 0.58
Very Dissatisfied 10 1.87 0.83
Total 489 100
Infant Very Satisfied 335 68.92 3.14
Somewhat Satisfied 110 21.56 2.55 Neither Satisfied nor Dissatisfied 21 3.99 1.13
Somewhat Dissatisfied 17 4.28 1.4
Very Dissatisfied 9 1.25 0.41
Total 492 100
Child Very Satisfied 377 70.09 3.36
Somewhat Satisfied 111 20.31 2.52 Neither Satisfied nor Dissatisfied 28 4.93 0.96
Somewhat Dissatisfied 17 3.3 0.86
Very Dissatisfied 4 1.37 1.19
Total 537 100
Pearson Chi-Square 13.044
Pr > ChiSq 0.8601
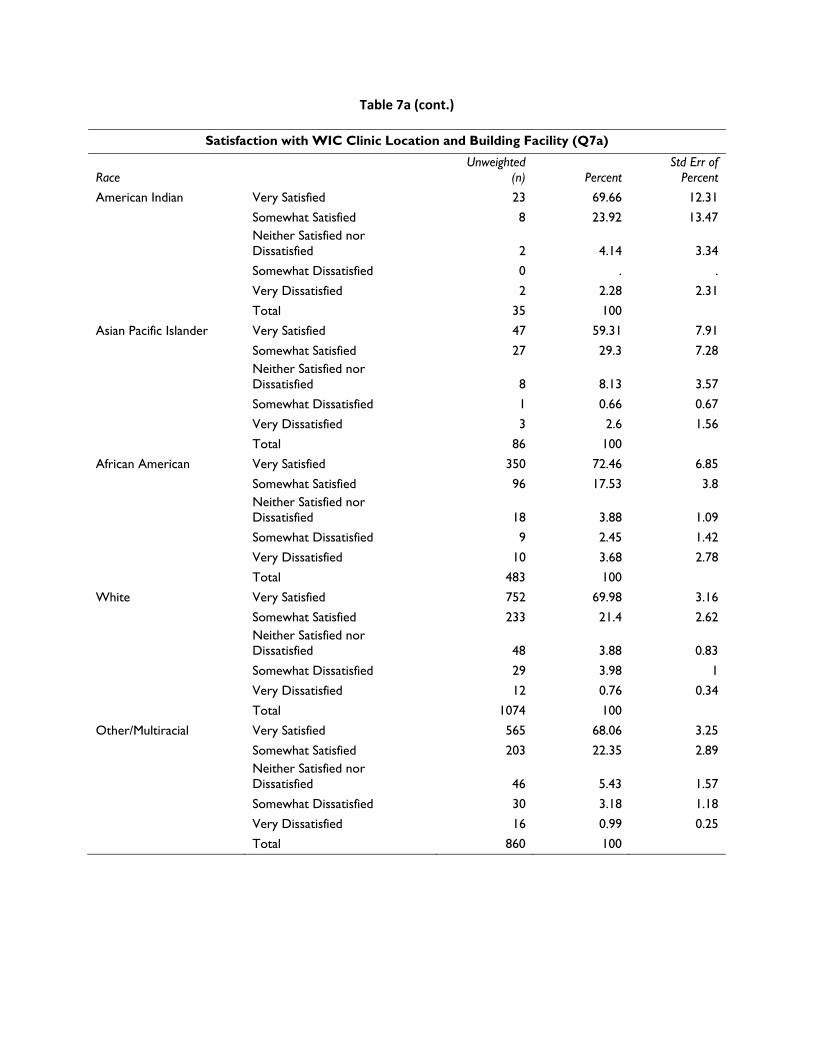
Table 7a (cont.)
Satisfaction with WIC Clinic Location and Building Facility (Q7a)
Race Unweighted
(n) Percent Std Err of
Percent
American Indian Very Satisfied 23 69.66 12.31
Somewhat Satisfied 8 23.92 13.47 Neither Satisfied nor Dissatisfied 2 4.14 3.34
Somewhat Dissatisfied 0 . .
Very Dissatisfied 2 2.28 2.31
Total 35 100
Asian Pacific Islander Very Satisfied 47 59.31 7.91
Somewhat Satisfied 27 29.3 7.28 Neither Satisfied nor Dissatisfied 8 8.13 3.57
Somewhat Dissatisfied 1 0.66 0.67
Very Dissatisfied 3 2.6 1.56
Total 86 100
African American Very Satisfied 350 72.46 6.85
Somewhat Satisfied 96 17.53 3.8 Neither Satisfied nor Dissatisfied 18 3.88 1.09
Somewhat Dissatisfied 9 2.45 1.42
Very Dissatisfied 10 3.68 2.78
Total 483 100
White Very Satisfied 752 69.98 3.16
Somewhat Satisfied 233 21.4 2.62 Neither Satisfied nor Dissatisfied 48 3.88 0.83
Somewhat Dissatisfied 29 3.98 1
Very Dissatisfied 12 0.76 0.34
Total 1074 100
Other/Multiracial Very Satisfied 565 68.06 3.25
Somewhat Satisfied 203 22.35 2.89 Neither Satisfied nor Dissatisfied 46 5.43 1.57
Somewhat Dissatisfied 30 3.18 1.18
Very Dissatisfied 16 0.99 0.25
Total 860 100
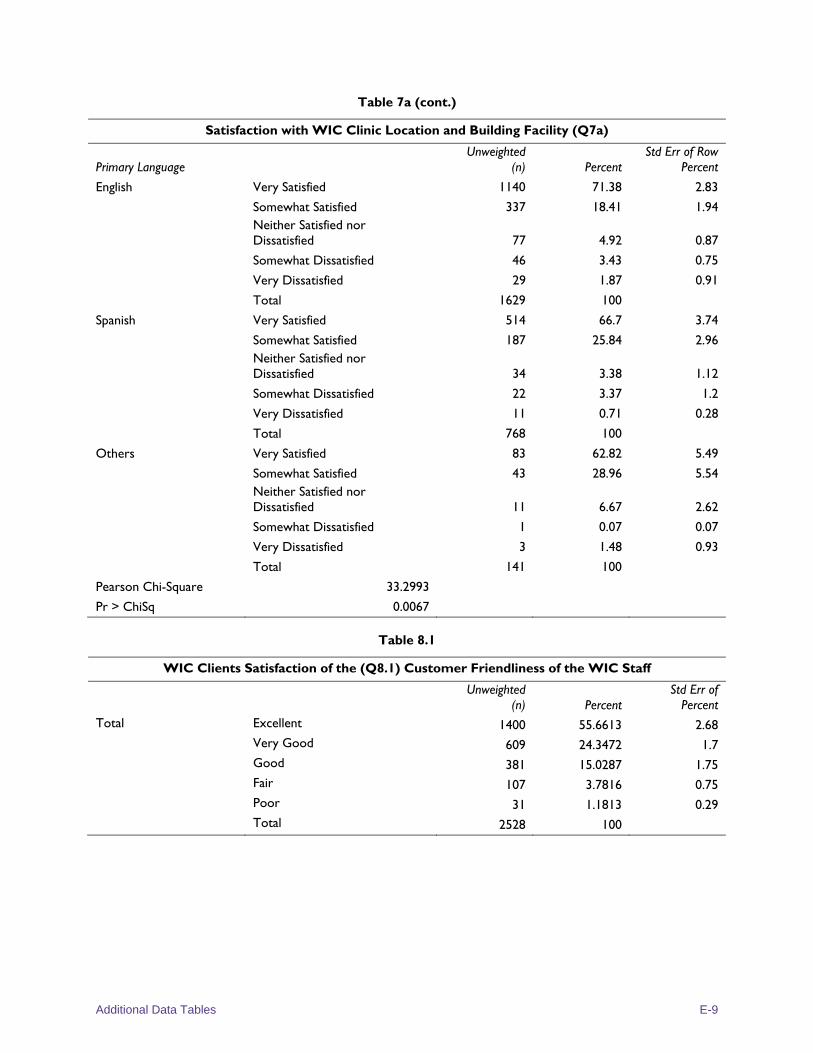
Additional Data Tables E-9
Table 7a (cont.)
Satisfaction with WIC Clinic Location and Building Facility (Q7a)
Primary Language Unweighted
(n) Percent Std Err of Row
Percent
English Very Satisfied 1140 71.38 2.83
Somewhat Satisfied 337 18.41 1.94 Neither Satisfied nor Dissatisfied 77 4.92 0.87
Somewhat Dissatisfied 46 3.43 0.75
Very Dissatisfied 29 1.87 0.91
Total 1629 100
Spanish Very Satisfied 514 66.7 3.74
Somewhat Satisfied 187 25.84 2.96 Neither Satisfied nor Dissatisfied 34 3.38 1.12
Somewhat Dissatisfied 22 3.37 1.2
Very Dissatisfied 11 0.71 0.28
Total 768 100
Others Very Satisfied 83 62.82 5.49
Somewhat Satisfied 43 28.96 5.54 Neither Satisfied nor Dissatisfied 11 6.67 2.62
Somewhat Dissatisfied 1 0.07 0.07
Very Dissatisfied 3 1.48 0.93
Total 141 100
Pearson Chi-Square 33.2993
Pr > ChiSq 0.0067
Table 8.1
WIC Clients Satisfaction of the (Q8.1) Customer Friendliness of the WIC Staff
Unweighted (n) Percent
Std Err of Percent
Total Excellent 1400 55.6613 2.68 Very Good 609 24.3472 1.7 Good 381 15.0287 1.75 Fair 107 3.7816 0.75 Poor 31 1.1813 0.29 Total 2528 100
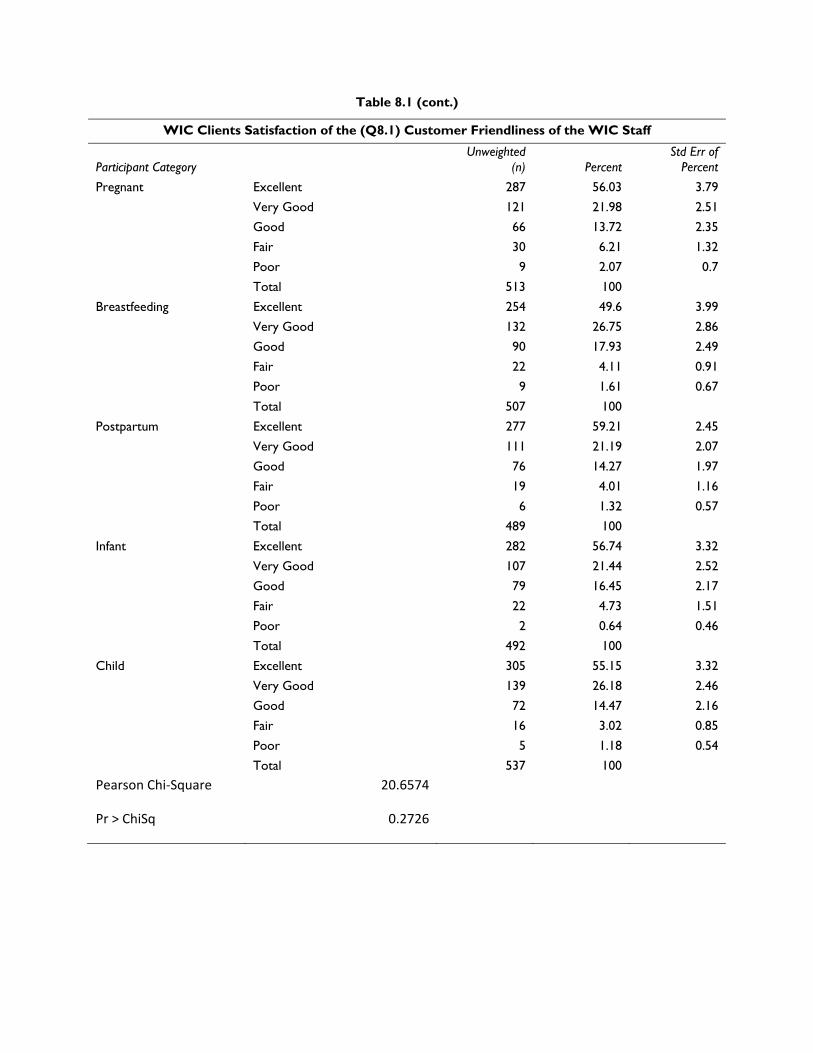
Table 8.1 (cont.)
WIC Clients Satisfaction of the (Q8.1) Customer Friendliness of the WIC Staff
Participant Category Unweighted
(n) Percent Std Err of
Percent
Pregnant Excellent 287 56.03 3.79
Very Good 121 21.98 2.51
Good 66 13.72 2.35
Fair 30 6.21 1.32
Poor 9 2.07 0.7
Total 513 100
Breastfeeding Excellent 254 49.6 3.99
Very Good 132 26.75 2.86
Good 90 17.93 2.49
Fair 22 4.11 0.91
Poor 9 1.61 0.67
Total 507 100
Postpartum Excellent 277 59.21 2.45
Very Good 111 21.19 2.07
Good 76 14.27 1.97
Fair 19 4.01 1.16
Poor 6 1.32 0.57
Total 489 100
Infant Excellent 282 56.74 3.32
Very Good 107 21.44 2.52
Good 79 16.45 2.17
Fair 22 4.73 1.51
Poor 2 0.64 0.46
Total 492 100
Child Excellent 305 55.15 3.32
Very Good 139 26.18 2.46
Good 72 14.47 2.16
Fair 16 3.02 0.85
Poor 5 1.18 0.54
Total 537 100
Pearson Chi‐Square 20.6574
Pr > ChiSq 0.2726

Additional Data Tables E-11
Table 8.1 (cont.)
WIC Clients Satisfaction of the (Q8.1) Customer Friendliness of the WIC Staff
Ethnicity Unweighted
(n) Percent Std Err of
Percent
Hispanic or Latino Excellent 573 51.1 3.57
Very Good 304 27.75 2.56
Good 175 16.76 2.06
Fair 48 3.61 0.84
Poor 10 0.79 0.31
Total 1110 100
Not Hispanic or Latino Excellent 824 59.31 3.13
Very Good 304 21.57 2.01
Good 206 13.67 2.35
Fair 59 3.94 1.01
Poor 21 1.51 0.46
Total 1414 100
Pearson Chi-Square 24.2582
Pr > ChiSq 0.0556
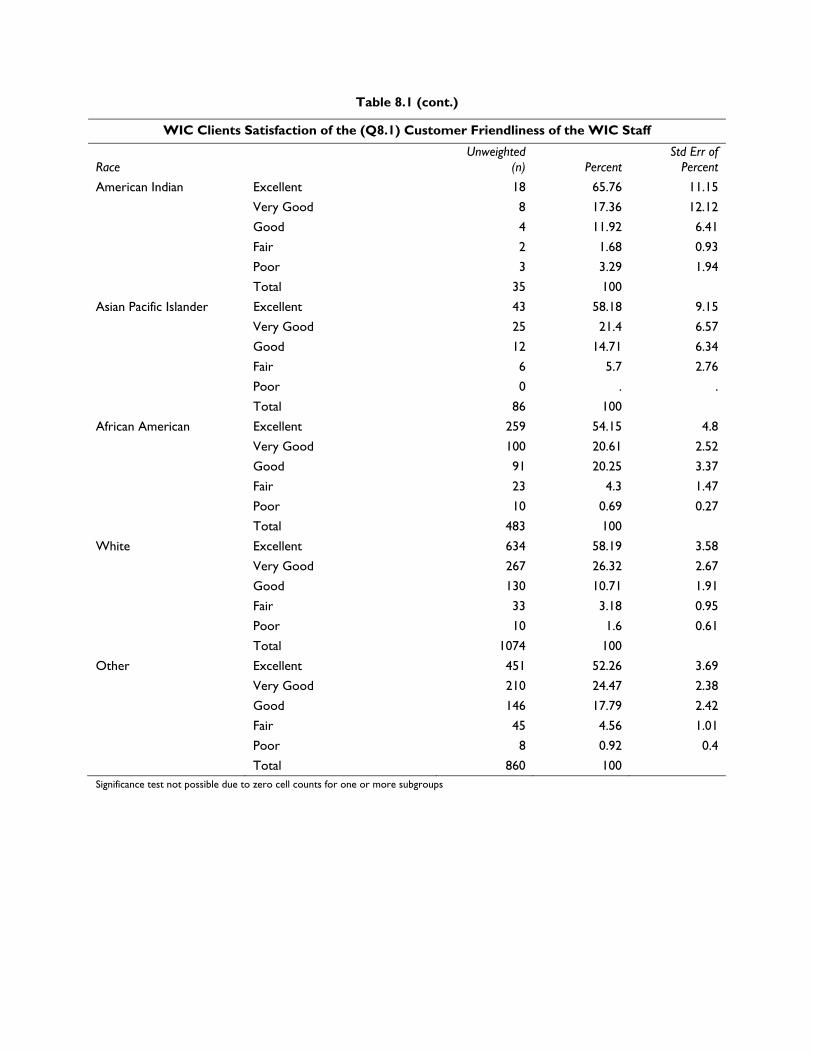
Table 8.1 (cont.)
WIC Clients Satisfaction of the (Q8.1) Customer Friendliness of the WIC Staff
Race Unweighted
(n) Percent Std Err of
Percent
American Indian Excellent 18 65.76 11.15
Very Good 8 17.36 12.12
Good 4 11.92 6.41
Fair 2 1.68 0.93
Poor 3 3.29 1.94
Total 35 100
Asian Pacific Islander Excellent 43 58.18 9.15
Very Good 25 21.4 6.57
Good 12 14.71 6.34
Fair 6 5.7 2.76
Poor 0 . .
Total 86 100
African American Excellent 259 54.15 4.8
Very Good 100 20.61 2.52
Good 91 20.25 3.37
Fair 23 4.3 1.47
Poor 10 0.69 0.27
Total 483 100
White Excellent 634 58.19 3.58
Very Good 267 26.32 2.67
Good 130 10.71 1.91
Fair 33 3.18 0.95
Poor 10 1.6 0.61
Total 1074 100
Other Excellent 451 52.26 3.69
Very Good 210 24.47 2.38
Good 146 17.79 2.42
Fair 45 4.56 1.01
Poor 8 0.92 0.4
Total 860 100 Significance test not possible due to zero cell counts for one or more subgroups

Additional Data Tables E-13
Table 8.1 (cont.)
WIC Clients Satisfaction of the (Q8.1) Customer Friendliness of the WIC Staff
Primary Language Unweighted
(n) Percent Std Err of
Percent
English Excellent 953 59.64 2.59
Very Good 344 20.68 1.78
Good 237 14.58 1.88
Fair 70 3.56 0.89
Poor 25 1.54 0.43
Total 1629 100
Spanish Excellent 390 48.81 4.45
Very Good 225 31.25 3.65
Good 114 15.2 2.69
Fair 35 4.24 1.04
Poor 4 0.5 0.35
Total 768 100
Others Excellent 62 45.34 9.31
Very Good 41 27.1 7.51
Good 32 20.56 4.85
Fair 4 6.31 3.55
Poor 2 0.69 0.45
Total 141 100
Pearson Chi-Square 49.2289
Pr > ChiSq 0.0079
Table 8.2
WIC Clients Satisfaction with (Q8.2) Quality of Service
Unweighted (n) Percent
Std Err of Percent
Total Excellent 1323 53.4231 2.74 Very Good 653 25.3291 1.8 Good 438 17.4095 1.52 Fair 84 2.8211 0.54 Poor 30 1.0172 0.27 Total 2528 100
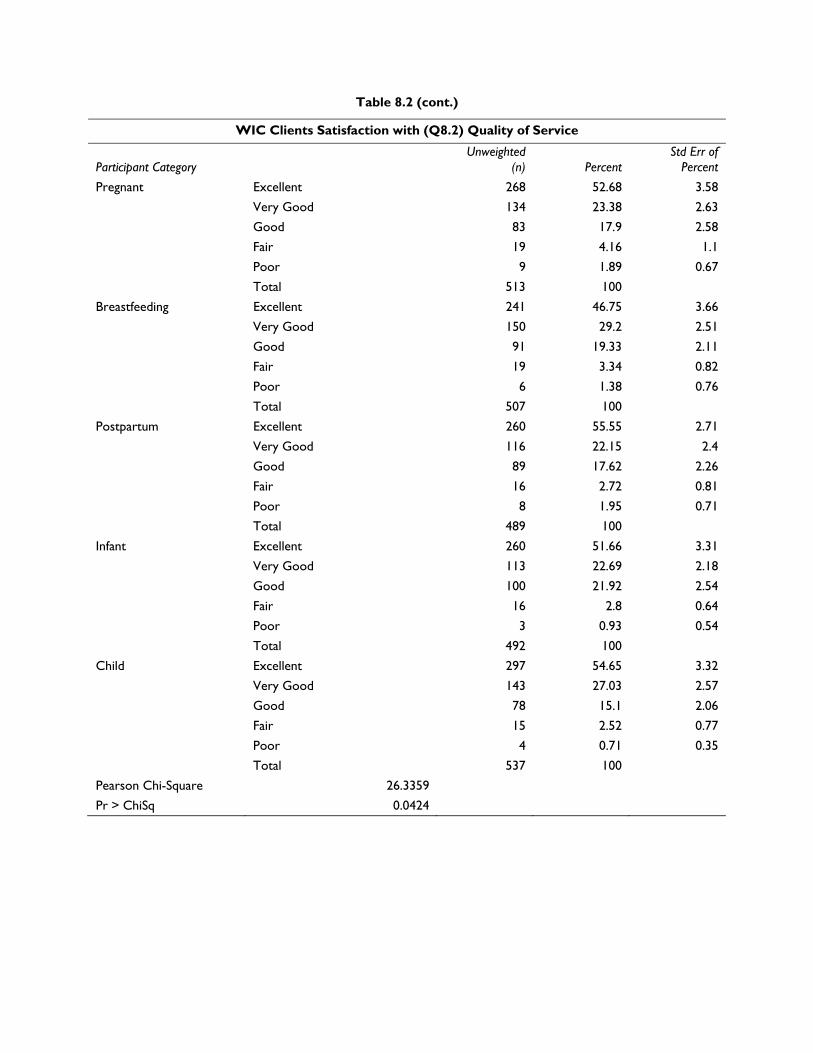
Table 8.2 (cont.)
WIC Clients Satisfaction with (Q8.2) Quality of Service
Participant Category Unweighted
(n) Percent Std Err of
Percent
Pregnant Excellent 268 52.68 3.58
Very Good 134 23.38 2.63
Good 83 17.9 2.58
Fair 19 4.16 1.1
Poor 9 1.89 0.67
Total 513 100
Breastfeeding Excellent 241 46.75 3.66
Very Good 150 29.2 2.51
Good 91 19.33 2.11
Fair 19 3.34 0.82
Poor 6 1.38 0.76
Total 507 100
Postpartum Excellent 260 55.55 2.71
Very Good 116 22.15 2.4
Good 89 17.62 2.26
Fair 16 2.72 0.81
Poor 8 1.95 0.71
Total 489 100
Infant Excellent 260 51.66 3.31
Very Good 113 22.69 2.18
Good 100 21.92 2.54
Fair 16 2.8 0.64
Poor 3 0.93 0.54
Total 492 100
Child Excellent 297 54.65 3.32
Very Good 143 27.03 2.57
Good 78 15.1 2.06
Fair 15 2.52 0.77
Poor 4 0.71 0.35
Total 537 100
Pearson Chi-Square 26.3359
Pr > ChiSq 0.0424

Additional Data Tables E-15
Table 8.2 (cont.)
WIC Clients Satisfaction with (Q8.2) Quality of Service
Ethnicity Unweighted
(n) Percent Std Err of
Percent
Hispanic or Latino Excellent 550 49.7 3.71
Very Good 324 29.88 2.88
Good 194 17.04 2.32
Fair 32 2.44 0.67
Poor 10 0.94 0.39
Total 1110 100
Not Hispanic or Latino Excellent 767 56.2 3.15
Very Good 330 21.72 2.23
Good 245 17.85 2.03
Fair 52 3.15 0.68
Poor 20 1.08 0.41
Total 1414 100
Pearson Chi-Square 22.8224
Pr > ChiSq 0.0992
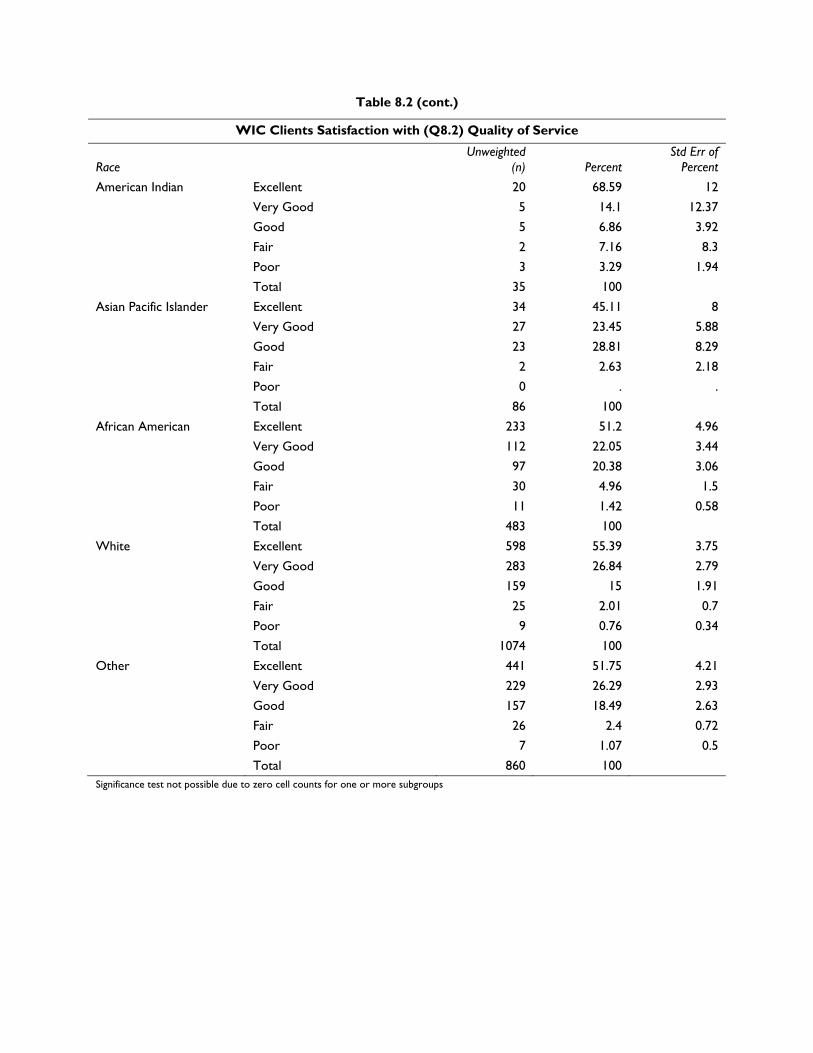
Table 8.2 (cont.)
WIC Clients Satisfaction with (Q8.2) Quality of Service
Race Unweighted
(n) Percent Std Err of
Percent
American Indian Excellent 20 68.59 12
Very Good 5 14.1 12.37
Good 5 6.86 3.92
Fair 2 7.16 8.3
Poor 3 3.29 1.94
Total 35 100
Asian Pacific Islander Excellent 34 45.11 8
Very Good 27 23.45 5.88
Good 23 28.81 8.29
Fair 2 2.63 2.18
Poor 0 . .
Total 86 100
African American Excellent 233 51.2 4.96
Very Good 112 22.05 3.44
Good 97 20.38 3.06
Fair 30 4.96 1.5
Poor 11 1.42 0.58
Total 483 100
White Excellent 598 55.39 3.75
Very Good 283 26.84 2.79
Good 159 15 1.91
Fair 25 2.01 0.7
Poor 9 0.76 0.34
Total 1074 100
Other Excellent 441 51.75 4.21
Very Good 229 26.29 2.93
Good 157 18.49 2.63
Fair 26 2.4 0.72
Poor 7 1.07 0.5
Total 860 100 Significance test not possible due to zero cell counts for one or more subgroups
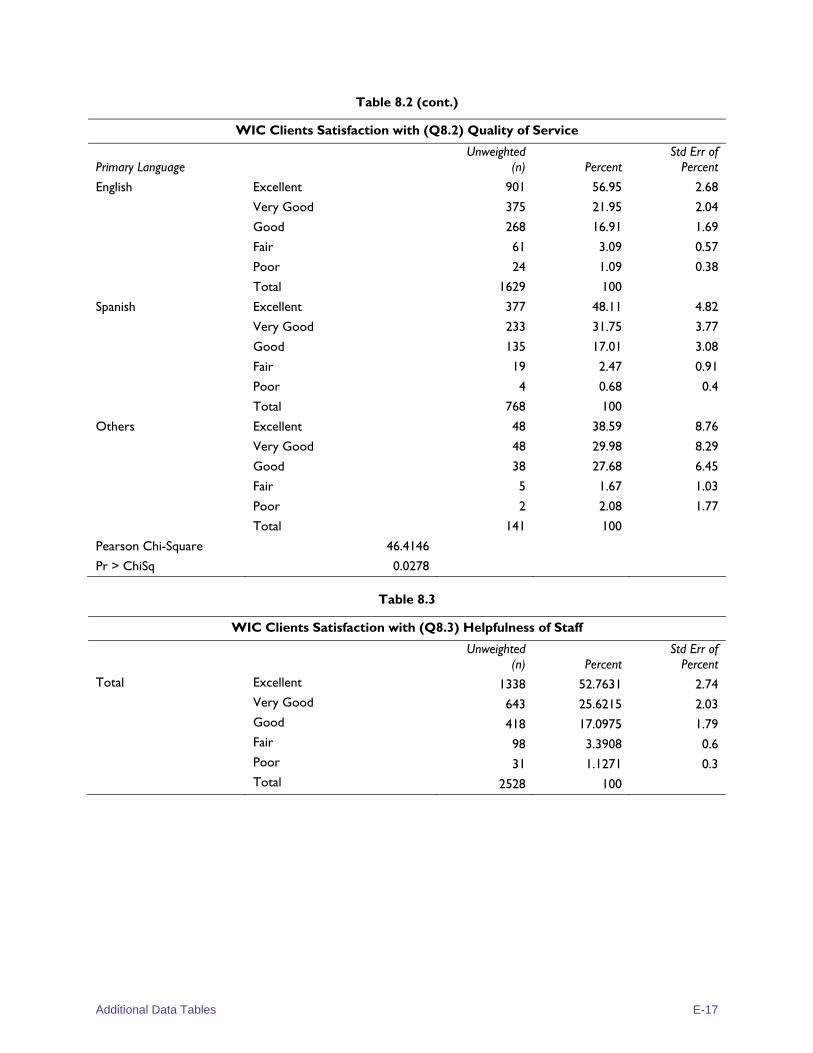
Additional Data Tables E-17
Table 8.2 (cont.)
WIC Clients Satisfaction with (Q8.2) Quality of Service
Primary Language Unweighted
(n) Percent Std Err of
Percent
English Excellent 901 56.95 2.68
Very Good 375 21.95 2.04
Good 268 16.91 1.69
Fair 61 3.09 0.57
Poor 24 1.09 0.38
Total 1629 100
Spanish Excellent 377 48.11 4.82
Very Good 233 31.75 3.77
Good 135 17.01 3.08
Fair 19 2.47 0.91
Poor 4 0.68 0.4
Total 768 100
Others Excellent 48 38.59 8.76
Very Good 48 29.98 8.29
Good 38 27.68 6.45
Fair 5 1.67 1.03
Poor 2 2.08 1.77
Total 141 100
Pearson Chi-Square 46.4146
Pr > ChiSq 0.0278
Table 8.3
WIC Clients Satisfaction with (Q8.3) Helpfulness of Staff
Unweighted (n) Percent
Std Err of Percent
Total Excellent 1338 52.7631 2.74 Very Good 643 25.6215 2.03 Good 418 17.0975 1.79 Fair 98 3.3908 0.6 Poor 31 1.1271 0.3 Total 2528 100
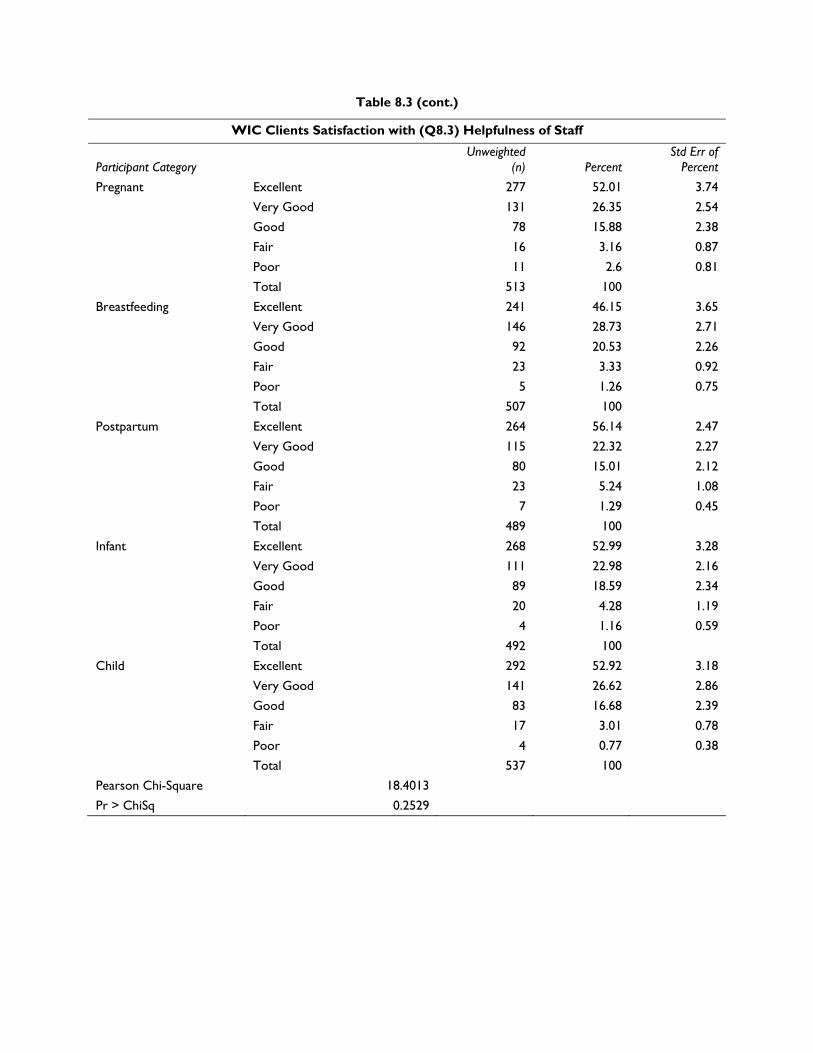
Table 8.3 (cont.)
WIC Clients Satisfaction with (Q8.3) Helpfulness of Staff
Participant Category Unweighted
(n) Percent Std Err of
Percent
Pregnant Excellent 277 52.01 3.74
Very Good 131 26.35 2.54
Good 78 15.88 2.38
Fair 16 3.16 0.87
Poor 11 2.6 0.81
Total 513 100
Breastfeeding Excellent 241 46.15 3.65
Very Good 146 28.73 2.71
Good 92 20.53 2.26
Fair 23 3.33 0.92
Poor 5 1.26 0.75
Total 507 100
Postpartum Excellent 264 56.14 2.47
Very Good 115 22.32 2.27
Good 80 15.01 2.12
Fair 23 5.24 1.08
Poor 7 1.29 0.45
Total 489 100
Infant Excellent 268 52.99 3.28
Very Good 111 22.98 2.16
Good 89 18.59 2.34
Fair 20 4.28 1.19
Poor 4 1.16 0.59
Total 492 100
Child Excellent 292 52.92 3.18
Very Good 141 26.62 2.86
Good 83 16.68 2.39
Fair 17 3.01 0.78
Poor 4 0.77 0.38
Total 537 100
Pearson Chi-Square 18.4013
Pr > ChiSq 0.2529
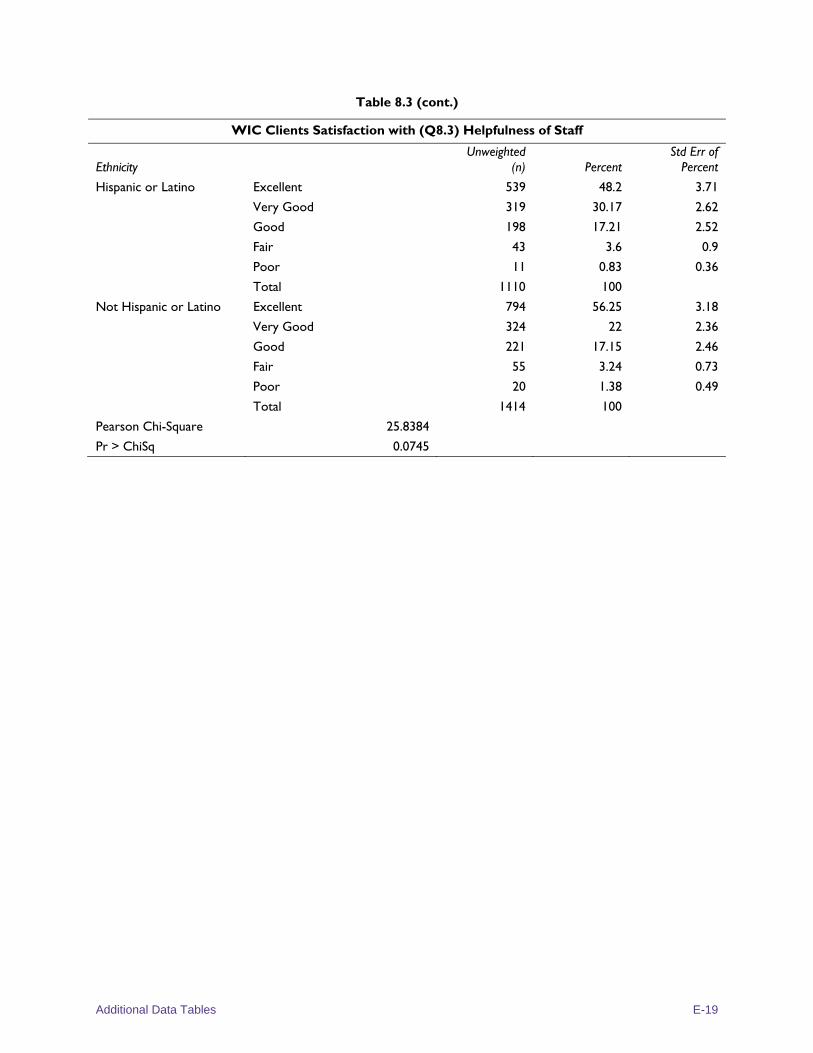
Additional Data Tables E-19
Table 8.3 (cont.)
WIC Clients Satisfaction with (Q8.3) Helpfulness of Staff
Ethnicity Unweighted
(n) Percent Std Err of
Percent
Hispanic or Latino Excellent 539 48.2 3.71
Very Good 319 30.17 2.62
Good 198 17.21 2.52
Fair 43 3.6 0.9
Poor 11 0.83 0.36
Total 1110 100
Not Hispanic or Latino Excellent 794 56.25 3.18
Very Good 324 22 2.36
Good 221 17.15 2.46
Fair 55 3.24 0.73
Poor 20 1.38 0.49
Total 1414 100
Pearson Chi-Square 25.8384
Pr > ChiSq 0.0745
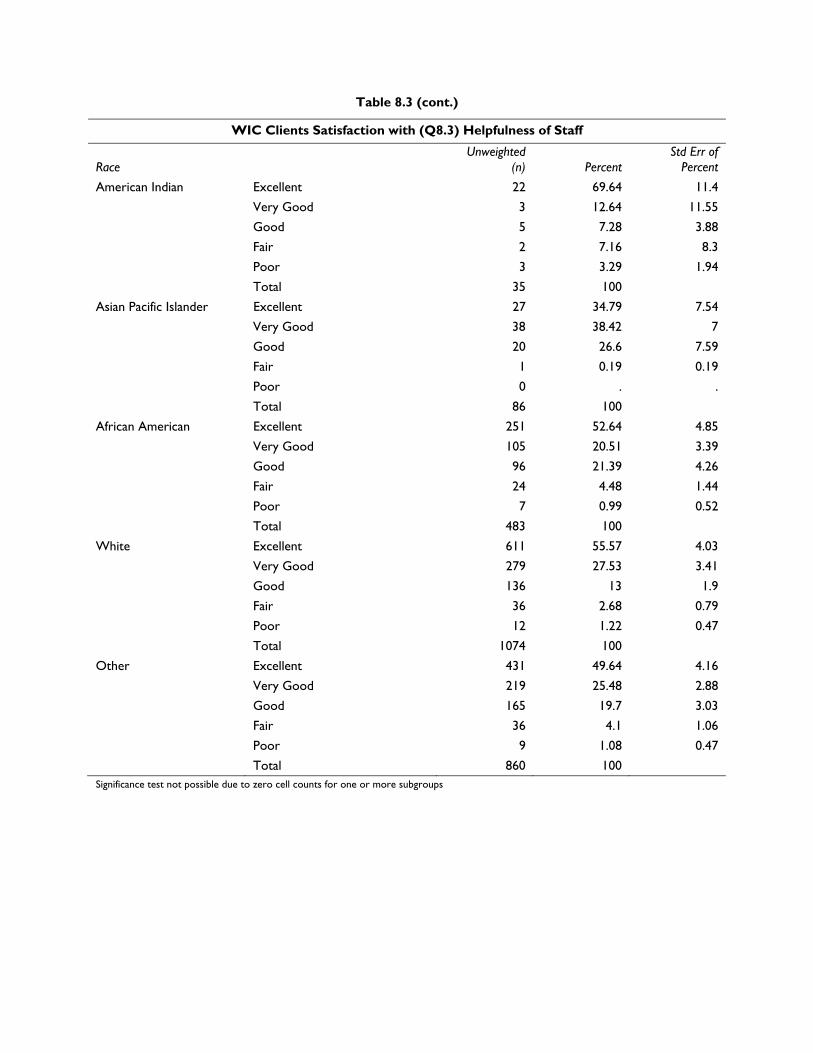
Table 8.3 (cont.)
WIC Clients Satisfaction with (Q8.3) Helpfulness of Staff
Race Unweighted
(n) Percent Std Err of
Percent
American Indian Excellent 22 69.64 11.4
Very Good 3 12.64 11.55
Good 5 7.28 3.88
Fair 2 7.16 8.3
Poor 3 3.29 1.94
Total 35 100
Asian Pacific Islander Excellent 27 34.79 7.54
Very Good 38 38.42 7
Good 20 26.6 7.59
Fair 1 0.19 0.19
Poor 0 . .
Total 86 100
African American Excellent 251 52.64 4.85
Very Good 105 20.51 3.39
Good 96 21.39 4.26
Fair 24 4.48 1.44
Poor 7 0.99 0.52
Total 483 100
White Excellent 611 55.57 4.03
Very Good 279 27.53 3.41
Good 136 13 1.9
Fair 36 2.68 0.79
Poor 12 1.22 0.47
Total 1074 100
Other Excellent 431 49.64 4.16
Very Good 219 25.48 2.88
Good 165 19.7 3.03
Fair 36 4.1 1.06
Poor 9 1.08 0.47
Total 860 100 Significance test not possible due to zero cell counts for one or more subgroups
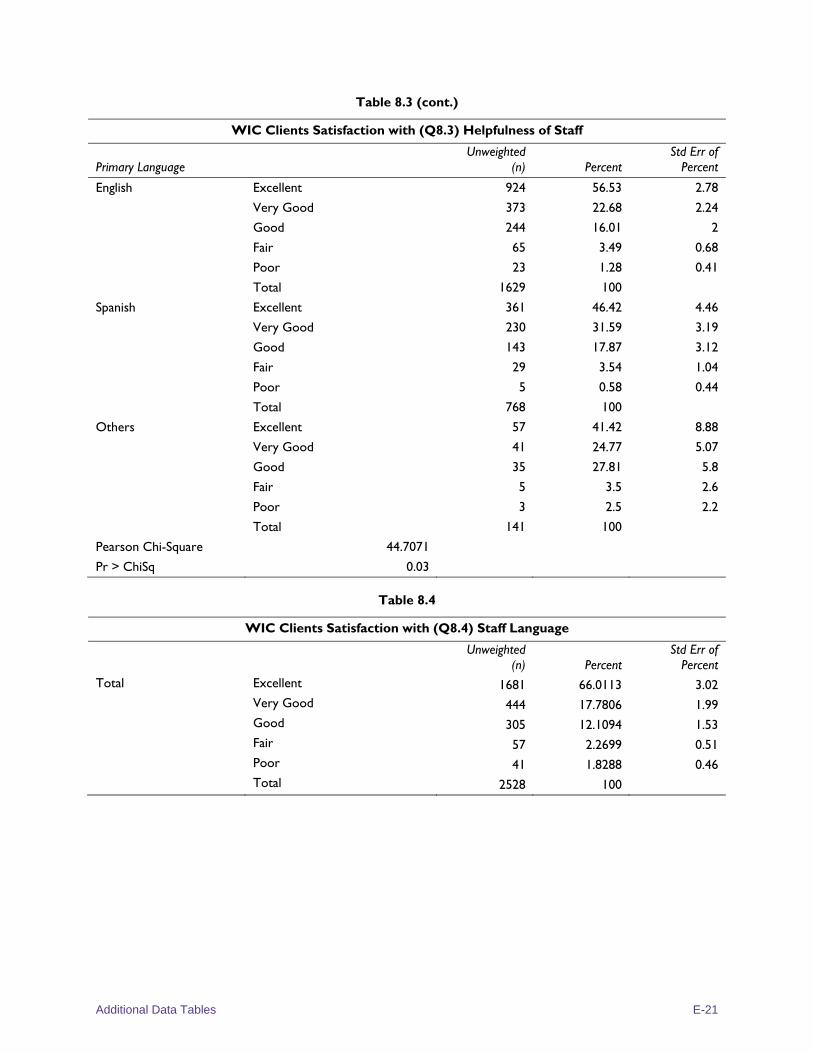
Additional Data Tables E-21
Table 8.3 (cont.)
WIC Clients Satisfaction with (Q8.3) Helpfulness of Staff
Primary Language Unweighted
(n) Percent Std Err of
Percent
English Excellent 924 56.53 2.78
Very Good 373 22.68 2.24
Good 244 16.01 2
Fair 65 3.49 0.68
Poor 23 1.28 0.41
Total 1629 100
Spanish Excellent 361 46.42 4.46
Very Good 230 31.59 3.19
Good 143 17.87 3.12
Fair 29 3.54 1.04
Poor 5 0.58 0.44
Total 768 100
Others Excellent 57 41.42 8.88
Very Good 41 24.77 5.07
Good 35 27.81 5.8
Fair 5 3.5 2.6
Poor 3 2.5 2.2
Total 141 100
Pearson Chi-Square 44.7071
Pr > ChiSq 0.03
Table 8.4
WIC Clients Satisfaction with (Q8.4) Staff Language
Unweighted (n) Percent
Std Err of Percent
Total Excellent 1681 66.0113 3.02 Very Good 444 17.7806 1.99 Good 305 12.1094 1.53 Fair 57 2.2699 0.51 Poor 41 1.8288 0.46 Total 2528 100
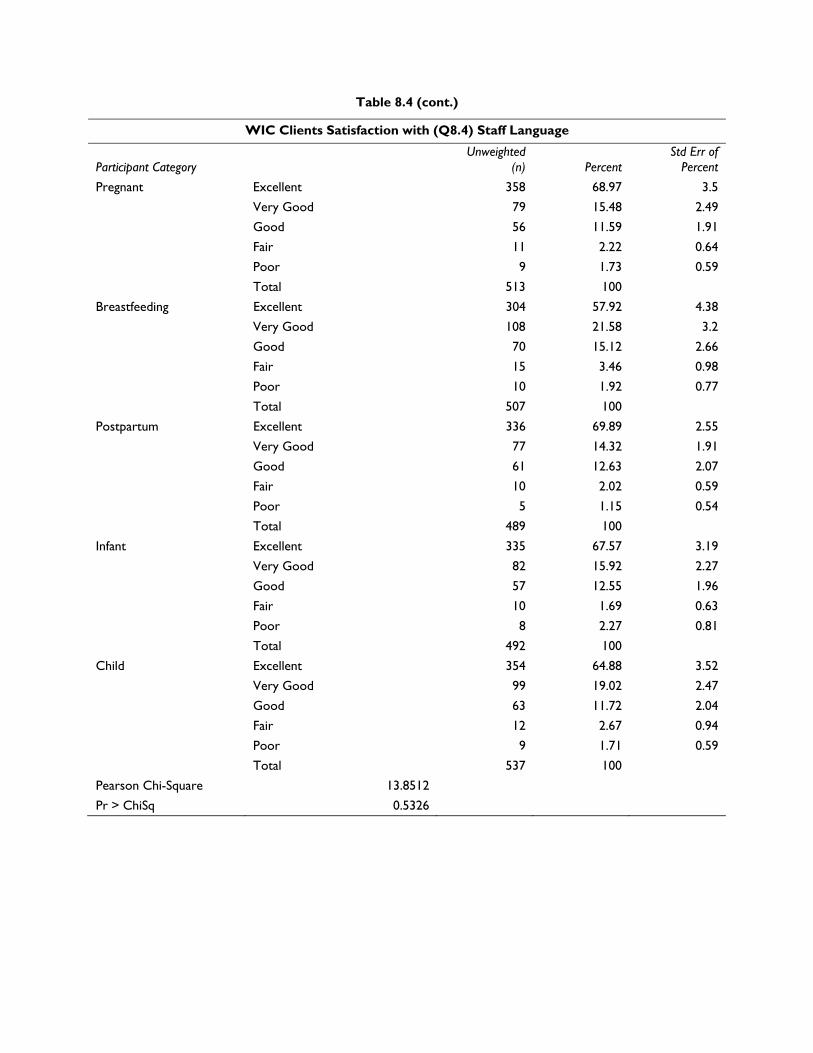
Table 8.4 (cont.)
WIC Clients Satisfaction with (Q8.4) Staff Language
Participant Category Unweighted
(n) Percent Std Err of
Percent
Pregnant Excellent 358 68.97 3.5
Very Good 79 15.48 2.49
Good 56 11.59 1.91
Fair 11 2.22 0.64
Poor 9 1.73 0.59
Total 513 100
Breastfeeding Excellent 304 57.92 4.38
Very Good 108 21.58 3.2
Good 70 15.12 2.66
Fair 15 3.46 0.98
Poor 10 1.92 0.77
Total 507 100
Postpartum Excellent 336 69.89 2.55
Very Good 77 14.32 1.91
Good 61 12.63 2.07
Fair 10 2.02 0.59
Poor 5 1.15 0.54
Total 489 100
Infant Excellent 335 67.57 3.19
Very Good 82 15.92 2.27
Good 57 12.55 1.96
Fair 10 1.69 0.63
Poor 8 2.27 0.81
Total 492 100
Child Excellent 354 64.88 3.52
Very Good 99 19.02 2.47
Good 63 11.72 2.04
Fair 12 2.67 0.94
Poor 9 1.71 0.59
Total 537 100
Pearson Chi-Square 13.8512
Pr > ChiSq 0.5326
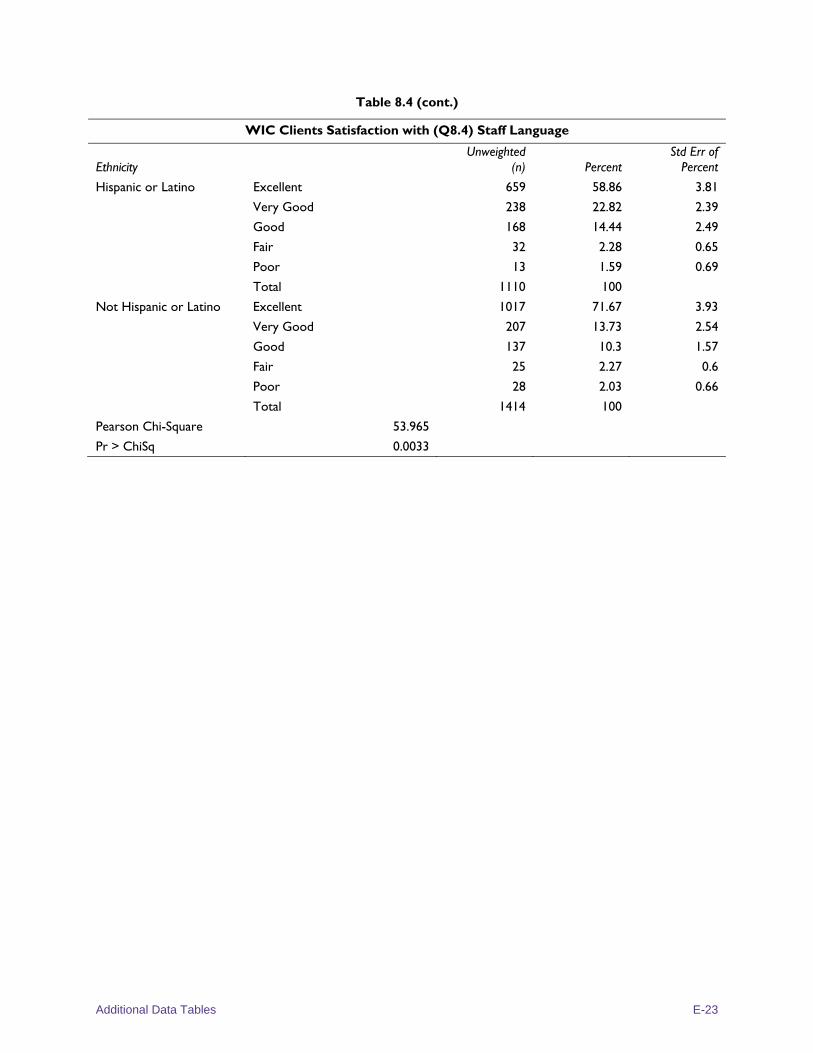
Additional Data Tables E-23
Table 8.4 (cont.)
WIC Clients Satisfaction with (Q8.4) Staff Language
Ethnicity Unweighted
(n) Percent Std Err of
Percent
Hispanic or Latino Excellent 659 58.86 3.81
Very Good 238 22.82 2.39
Good 168 14.44 2.49
Fair 32 2.28 0.65
Poor 13 1.59 0.69
Total 1110 100
Not Hispanic or Latino Excellent 1017 71.67 3.93
Very Good 207 13.73 2.54
Good 137 10.3 1.57
Fair 25 2.27 0.6
Poor 28 2.03 0.66
Total 1414 100
Pearson Chi-Square 53.965
Pr > ChiSq 0.0033
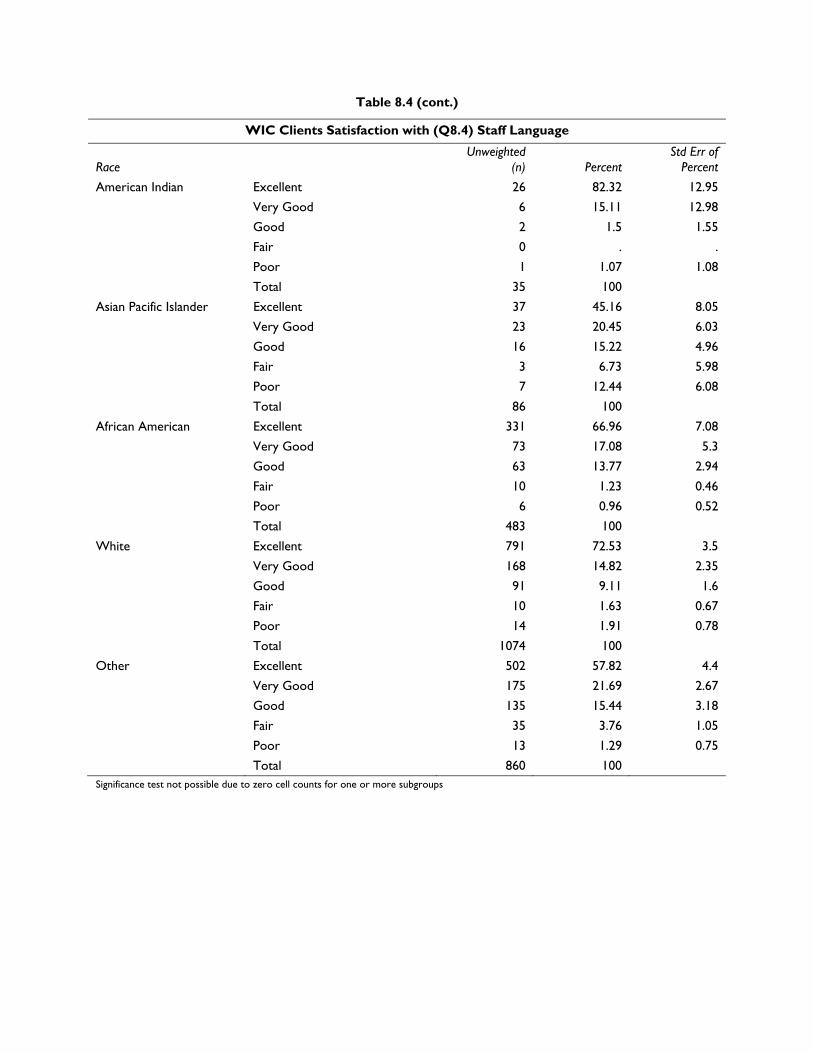
Table 8.4 (cont.)
WIC Clients Satisfaction with (Q8.4) Staff Language
Race Unweighted
(n) Percent Std Err of
Percent
American Indian Excellent 26 82.32 12.95
Very Good 6 15.11 12.98
Good 2 1.5 1.55
Fair 0 . .
Poor 1 1.07 1.08
Total 35 100
Asian Pacific Islander Excellent 37 45.16 8.05
Very Good 23 20.45 6.03
Good 16 15.22 4.96
Fair 3 6.73 5.98
Poor 7 12.44 6.08
Total 86 100
African American Excellent 331 66.96 7.08
Very Good 73 17.08 5.3
Good 63 13.77 2.94
Fair 10 1.23 0.46
Poor 6 0.96 0.52
Total 483 100
White Excellent 791 72.53 3.5
Very Good 168 14.82 2.35
Good 91 9.11 1.6
Fair 10 1.63 0.67
Poor 14 1.91 0.78
Total 1074 100
Other Excellent 502 57.82 4.4
Very Good 175 21.69 2.67
Good 135 15.44 3.18
Fair 35 3.76 1.05
Poor 13 1.29 0.75
Total 860 100 Significance test not possible due to zero cell counts for one or more subgroups
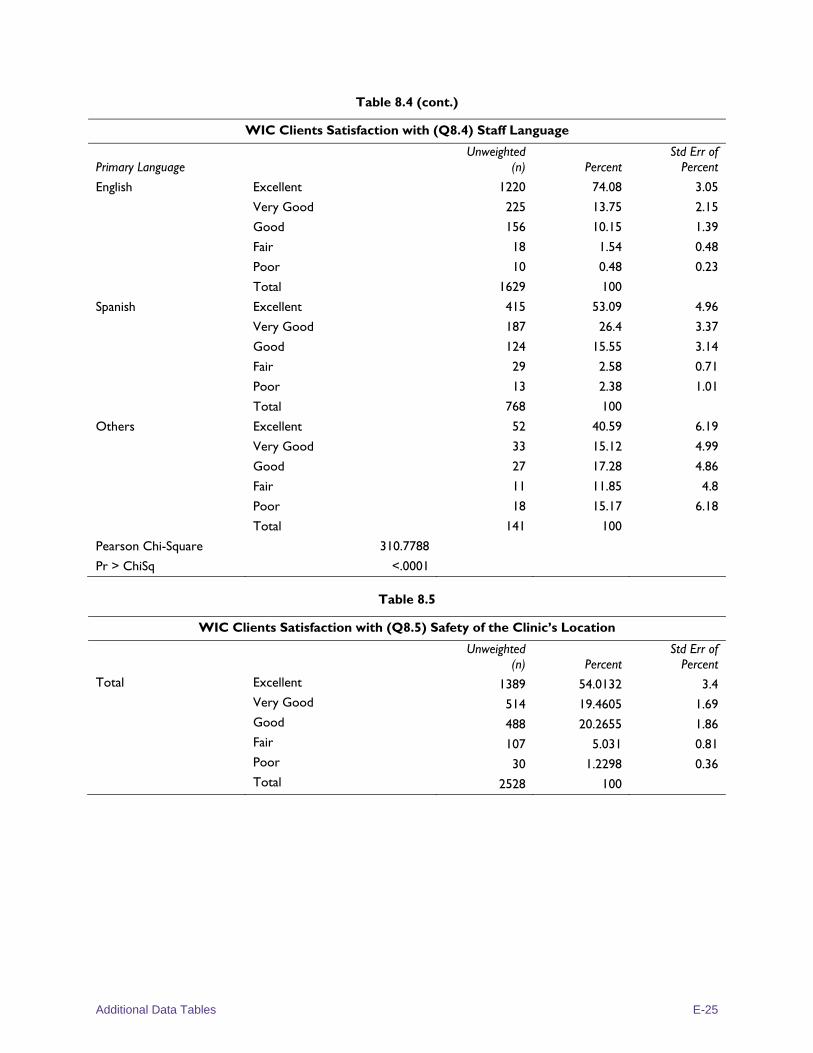
Additional Data Tables E-25
Table 8.4 (cont.)
WIC Clients Satisfaction with (Q8.4) Staff Language
Primary Language Unweighted
(n) Percent Std Err of
Percent
English Excellent 1220 74.08 3.05
Very Good 225 13.75 2.15
Good 156 10.15 1.39
Fair 18 1.54 0.48
Poor 10 0.48 0.23
Total 1629 100
Spanish Excellent 415 53.09 4.96
Very Good 187 26.4 3.37
Good 124 15.55 3.14
Fair 29 2.58 0.71
Poor 13 2.38 1.01
Total 768 100
Others Excellent 52 40.59 6.19
Very Good 33 15.12 4.99
Good 27 17.28 4.86
Fair 11 11.85 4.8
Poor 18 15.17 6.18
Total 141 100
Pearson Chi-Square 310.7788
Pr > ChiSq <.0001
Table 8.5
WIC Clients Satisfaction with (Q8.5) Safety of the Clinic’s Location
Unweighted (n) Percent
Std Err of Percent
Total Excellent 1389 54.0132 3.4 Very Good 514 19.4605 1.69 Good 488 20.2655 1.86 Fair 107 5.031 0.81 Poor 30 1.2298 0.36 Total 2528 100
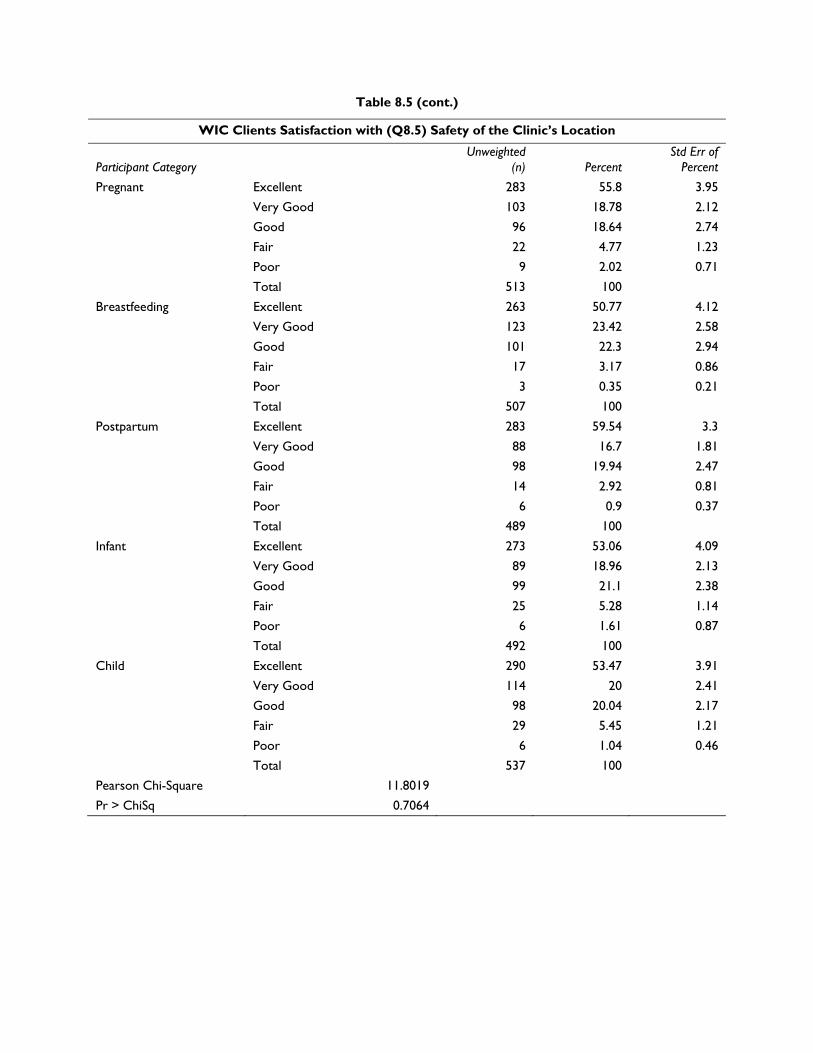
Table 8.5 (cont.)
WIC Clients Satisfaction with (Q8.5) Safety of the Clinic’s Location
Participant Category Unweighted
(n) Percent Std Err of
Percent
Pregnant Excellent 283 55.8 3.95
Very Good 103 18.78 2.12
Good 96 18.64 2.74
Fair 22 4.77 1.23
Poor 9 2.02 0.71
Total 513 100
Breastfeeding Excellent 263 50.77 4.12
Very Good 123 23.42 2.58
Good 101 22.3 2.94
Fair 17 3.17 0.86
Poor 3 0.35 0.21
Total 507 100
Postpartum Excellent 283 59.54 3.3
Very Good 88 16.7 1.81
Good 98 19.94 2.47
Fair 14 2.92 0.81
Poor 6 0.9 0.37
Total 489 100
Infant Excellent 273 53.06 4.09
Very Good 89 18.96 2.13
Good 99 21.1 2.38
Fair 25 5.28 1.14
Poor 6 1.61 0.87
Total 492 100
Child Excellent 290 53.47 3.91
Very Good 114 20 2.41
Good 98 20.04 2.17
Fair 29 5.45 1.21
Poor 6 1.04 0.46
Total 537 100
Pearson Chi-Square 11.8019
Pr > ChiSq 0.7064
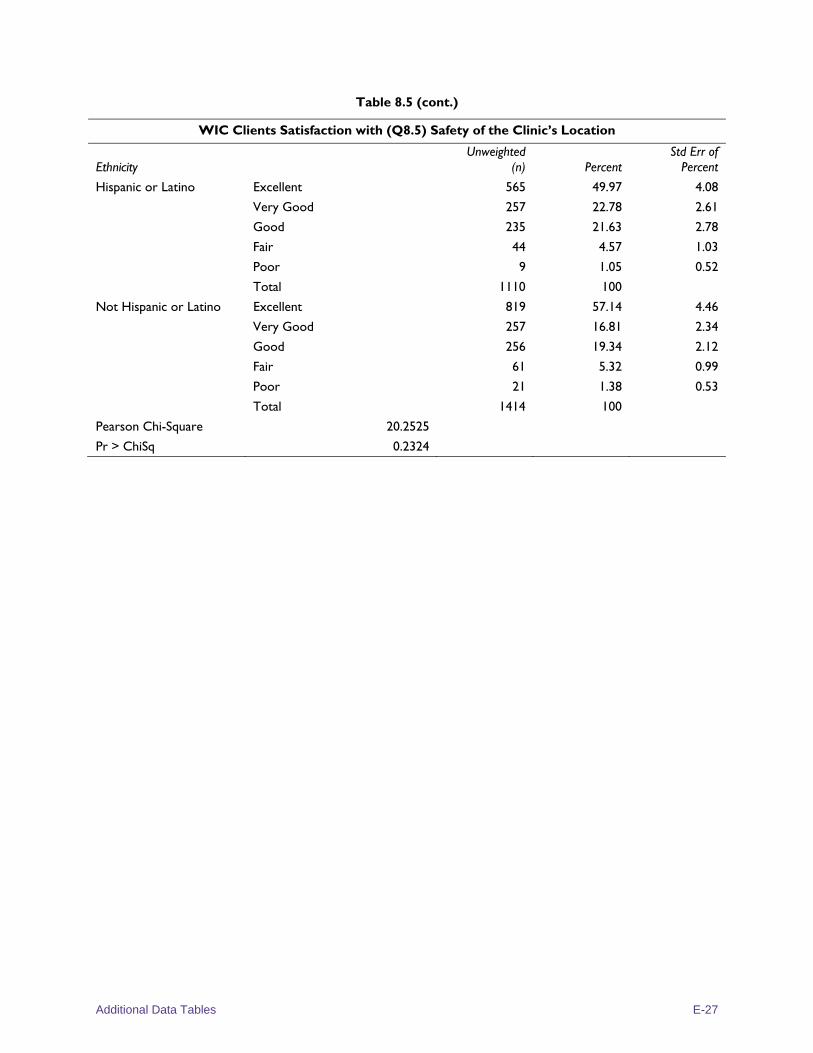
Additional Data Tables E-27
Table 8.5 (cont.)
WIC Clients Satisfaction with (Q8.5) Safety of the Clinic’s Location
Ethnicity Unweighted
(n) Percent Std Err of
Percent
Hispanic or Latino Excellent 565 49.97 4.08
Very Good 257 22.78 2.61
Good 235 21.63 2.78
Fair 44 4.57 1.03
Poor 9 1.05 0.52
Total 1110 100
Not Hispanic or Latino Excellent 819 57.14 4.46
Very Good 257 16.81 2.34
Good 256 19.34 2.12
Fair 61 5.32 0.99
Poor 21 1.38 0.53
Total 1414 100
Pearson Chi-Square 20.2525
Pr > ChiSq 0.2324
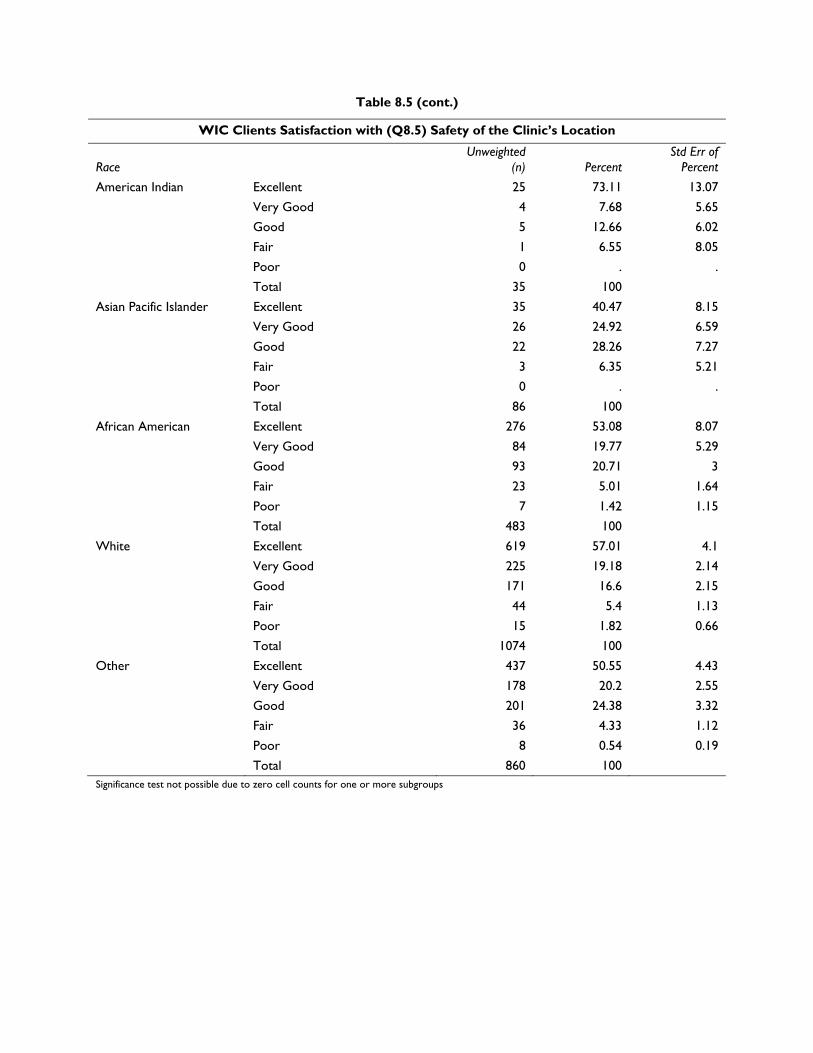
Table 8.5 (cont.)
WIC Clients Satisfaction with (Q8.5) Safety of the Clinic’s Location
Race Unweighted
(n) Percent Std Err of
Percent
American Indian Excellent 25 73.11 13.07
Very Good 4 7.68 5.65
Good 5 12.66 6.02
Fair 1 6.55 8.05
Poor 0 . .
Total 35 100
Asian Pacific Islander Excellent 35 40.47 8.15
Very Good 26 24.92 6.59
Good 22 28.26 7.27
Fair 3 6.35 5.21
Poor 0 . .
Total 86 100
African American Excellent 276 53.08 8.07
Very Good 84 19.77 5.29
Good 93 20.71 3
Fair 23 5.01 1.64
Poor 7 1.42 1.15
Total 483 100
White Excellent 619 57.01 4.1
Very Good 225 19.18 2.14
Good 171 16.6 2.15
Fair 44 5.4 1.13
Poor 15 1.82 0.66
Total 1074 100
Other Excellent 437 50.55 4.43
Very Good 178 20.2 2.55
Good 201 24.38 3.32
Fair 36 4.33 1.12
Poor 8 0.54 0.19
Total 860 100 Significance test not possible due to zero cell counts for one or more subgroups

Additional Data Tables E-29
Table 8.5 (cont.)
WIC Clients Satisfaction with (Q8.5) Safety of the Clinic’s Location
Primary Language Unweighted
(n) Percent Std Err of
Percent
English Excellent 959 57.76 3.9
Very Good 279 16.21 2
Good 292 18.46 2.04
Fair 77 6.07 1.03
Poor 22 1.5 0.51
Total 1629 100
Spanish Excellent 374 47.38 4.48
Very Good 199 25.52 3.39
Good 161 22.79 3.42
Fair 29 3.61 1.08
Poor 5 0.71 0.44
Total 768 100
Others Excellent 59 44.42 6.48
Very Good 39 26.4 5.27
Good 39 27.94 5.53
Fair 1 0.32 0.32
Poor 3 0.92 0.93
Total 141 100
Pearson Chi-Square 63.5962
Pr > ChiSq 0.0005
Table 8.6
WIC Clients Satisfaction with (Q8.6) the Convenience of the Clinic’s Location
Unweighted (n) Percent
Std Err of Percent
Total Excellent 1365 53.8303 3.14 Very Good 541 21.9806 1.65 Good 465 18.6467 1.88 Fair 113 3.9426 0.66 Poor 44 1.5999 0.31 Total 2528 100
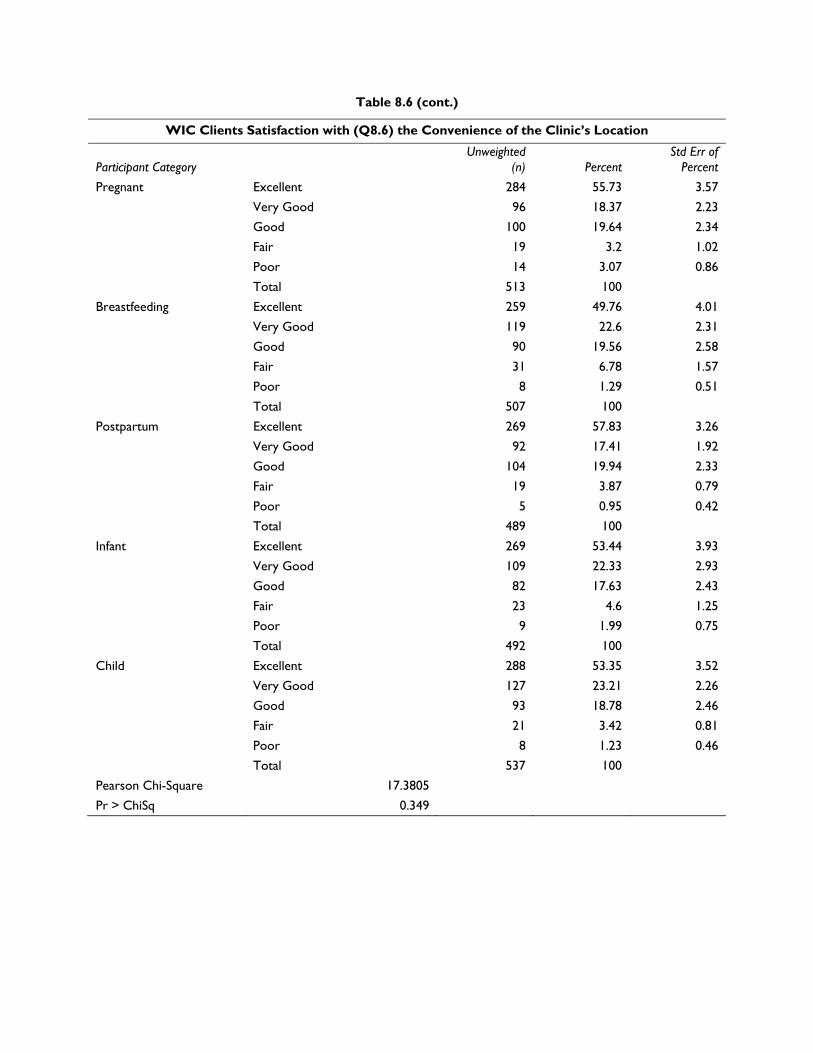
Table 8.6 (cont.)
WIC Clients Satisfaction with (Q8.6) the Convenience of the Clinic’s Location
Participant Category Unweighted
(n) Percent Std Err of
Percent
Pregnant Excellent 284 55.73 3.57
Very Good 96 18.37 2.23
Good 100 19.64 2.34
Fair 19 3.2 1.02
Poor 14 3.07 0.86
Total 513 100
Breastfeeding Excellent 259 49.76 4.01
Very Good 119 22.6 2.31
Good 90 19.56 2.58
Fair 31 6.78 1.57
Poor 8 1.29 0.51
Total 507 100
Postpartum Excellent 269 57.83 3.26
Very Good 92 17.41 1.92
Good 104 19.94 2.33
Fair 19 3.87 0.79
Poor 5 0.95 0.42
Total 489 100
Infant Excellent 269 53.44 3.93
Very Good 109 22.33 2.93
Good 82 17.63 2.43
Fair 23 4.6 1.25
Poor 9 1.99 0.75
Total 492 100
Child Excellent 288 53.35 3.52
Very Good 127 23.21 2.26
Good 93 18.78 2.46
Fair 21 3.42 0.81
Poor 8 1.23 0.46
Total 537 100
Pearson Chi-Square 17.3805
Pr > ChiSq 0.349
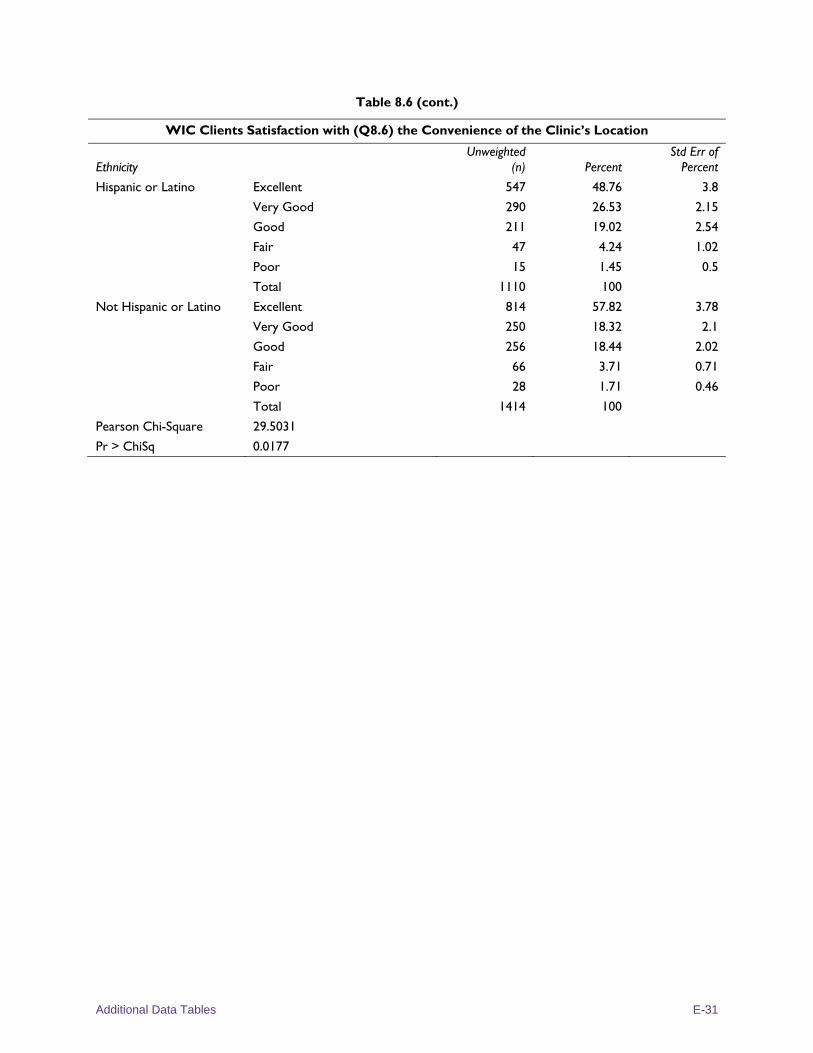
Additional Data Tables E-31
Table 8.6 (cont.)
WIC Clients Satisfaction with (Q8.6) the Convenience of the Clinic’s Location
Ethnicity Unweighted
(n) Percent Std Err of
Percent
Hispanic or Latino Excellent 547 48.76 3.8
Very Good 290 26.53 2.15
Good 211 19.02 2.54
Fair 47 4.24 1.02
Poor 15 1.45 0.5
Total 1110 100
Not Hispanic or Latino Excellent 814 57.82 3.78
Very Good 250 18.32 2.1
Good 256 18.44 2.02
Fair 66 3.71 0.71
Poor 28 1.71 0.46
Total 1414 100
Pearson Chi-Square 29.5031
Pr > ChiSq 0.0177
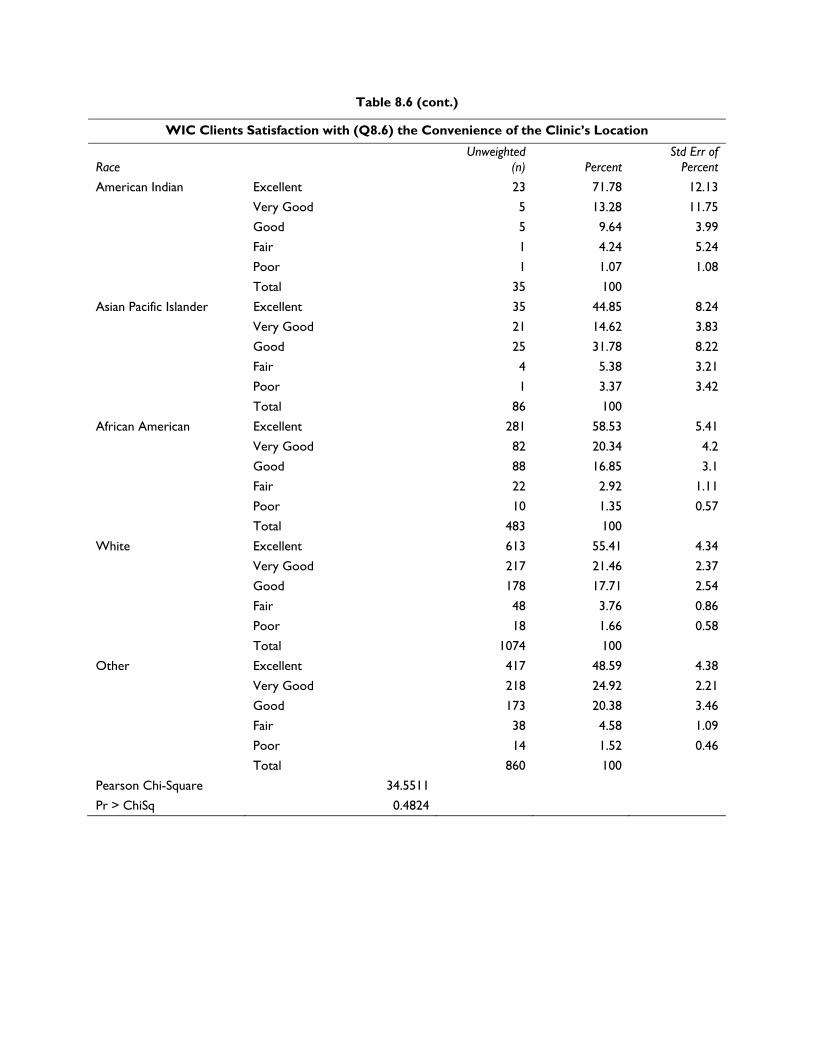
Table 8.6 (cont.)
WIC Clients Satisfaction with (Q8.6) the Convenience of the Clinic’s Location
Race Unweighted
(n) Percent Std Err of
Percent
American Indian Excellent 23 71.78 12.13
Very Good 5 13.28 11.75
Good 5 9.64 3.99
Fair 1 4.24 5.24
Poor 1 1.07 1.08
Total 35 100
Asian Pacific Islander Excellent 35 44.85 8.24
Very Good 21 14.62 3.83
Good 25 31.78 8.22
Fair 4 5.38 3.21
Poor 1 3.37 3.42
Total 86 100
African American Excellent 281 58.53 5.41
Very Good 82 20.34 4.2
Good 88 16.85 3.1
Fair 22 2.92 1.11
Poor 10 1.35 0.57
Total 483 100
White Excellent 613 55.41 4.34
Very Good 217 21.46 2.37
Good 178 17.71 2.54
Fair 48 3.76 0.86
Poor 18 1.66 0.58
Total 1074 100
Other Excellent 417 48.59 4.38
Very Good 218 24.92 2.21
Good 173 20.38 3.46
Fair 38 4.58 1.09
Poor 14 1.52 0.46
Total 860 100
Pearson Chi-Square 34.5511
Pr > ChiSq 0.4824

Additional Data Tables E-33
Table 8.6 (cont.)
WIC Clients Satisfaction with (Q8.6) the Convenience of the Clinic’s Location
Primary Language Unweighted
(n) Percent Std Err of
Percent
English Excellent 946 58.05 3.41
Very Good 295 18.92 1.86
Good 285 17.76 1.92
Fair 72 3.79 0.79
Poor 31 1.48 0.37
Total 1629 100
Spanish Excellent 370 47.5 4.26
Very Good 211 28.17 2.59
Good 143 18.69 3.21
Fair 33 3.95 1.1
Poor 11 1.69 0.68
Total 768 100
Others Excellent 53 37.01 9.01
Very Good 37 24.11 9.66
Good 41 30.97 6.51
Fair 8 5.48 2.42
Poor 2 2.43 2.02
Total 141 100
Pearson Chi-Square 51.7479
Pr > ChiSq 0.0142
Table 8.7
WIC Clients Satisfaction with (Q8.7) the Convenience of the Clinic’s Operating Hours
Unweighted (n) Percent
Std Err of Percent
Total Excellent 1314 52.4498 3.04 Very Good 539 20.8037 1.6 Good 519 20.8439 1.84 Fair 128 5.1595 0.93 Poor 28 0.7432 0.23 Total 2528 100

Table 8.7 (cont.)
WIC Clients Satisfaction with (Q8.7) the Convenience of the Clinic’s Operating Hours
Participant Category Unweighted
(n) Percent Std Err of
Percent Pregnant Excellent 271 52.93 3.62
Very Good 105 18.96 1.63 Good 109 21.73 2.82 Fair 21 4.78 1.46 Poor 7 1.6 0.6 Total 513 100
Breastfeeding Excellent 247 47.83 3.83 Very Good 123 23.76 2.39 Good 101 21.03 2.6 Fair 29 5.55 1.18 Poor 7 1.83 0.73 Total 507 100
Postpartum Excellent 256 53.72 3.34 Very Good 91 17.45 1.89 Good 109 21.85 2.56 Fair 25 5.39 1.02 Poor 8 1.59 0.64 Total 489 100
Infant Excellent 260 53.09 3.81 Very Good 93 18.19 2.1 Good 102 21.41 2.89 Fair 33 6.63 1.31 Poor 4 0.68 0.51 Total 492 100
Child Excellent 282 52.16 3.25 Very Good 128 22.6 2.27 Good 104 20.4 1.92 Fair 21 4.49 1.24 Poor 2 0.35 0.26 Total 537 100
Pearson Chi-Square 20.9761 Pr > ChiSq 0.1372
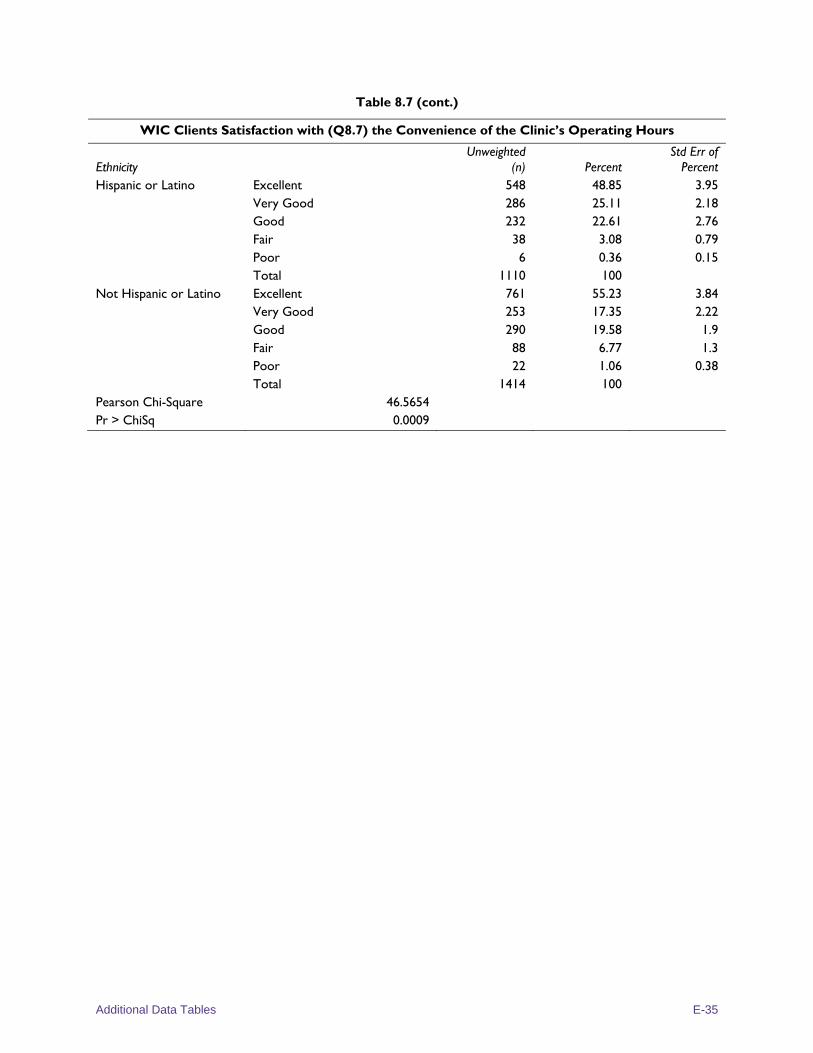
Additional Data Tables E-35
Table 8.7 (cont.)
WIC Clients Satisfaction with (Q8.7) the Convenience of the Clinic’s Operating Hours
Ethnicity Unweighted
(n) Percent Std Err of
Percent Hispanic or Latino Excellent 548 48.85 3.95
Very Good 286 25.11 2.18 Good 232 22.61 2.76 Fair 38 3.08 0.79 Poor 6 0.36 0.15 Total 1110 100
Not Hispanic or Latino Excellent 761 55.23 3.84 Very Good 253 17.35 2.22 Good 290 19.58 1.9 Fair 88 6.77 1.3 Poor 22 1.06 0.38 Total 1414 100
Pearson Chi-Square 46.5654 Pr > ChiSq 0.0009

Table 8.7 (cont.)
WIC Clients Satisfaction with (Q8.7) the Convenience of the Clinic’s Operating Hours
Race Unweighted
(n) Percent Std Err of
Percent American Indian Excellent 22 71.36 20.26
Very Good 5 11.61 10.63 Good 6 14.75 12.41 Fair 0 . . Poor 2 2.28 2.31 Total 35 100
Asian Pacific Islander Excellent 31 41.78 8.23 Very Good 28 27.17 8.7 Good 26 30.66 7.44 Fair 1 0.39 0.39 Poor 0 . . Total 86 100
African American Excellent 250 51.86 6.06 Very Good 83 18 4.28 Good 104 21.4 3.79 Fair 38 8.15 2.07 Poor 8 0.59 0.24 Total 483 100
White Excellent 589 54.45 3.64 Very Good 220 20.81 2.19 Good 197 19.17 2.36 Fair 55 4.83 1.26 Poor 13 0.75 0.29 Total 1074 100
Other Excellent 424 49.8 4.71 Very Good 204 22.53 2.54 Good 192 22.31 3.3 Fair 35 4.56 1.11 Poor 5 0.8 0.47 Total 860 100
Significance test not possible due to zero cell counts for one or more subgroups
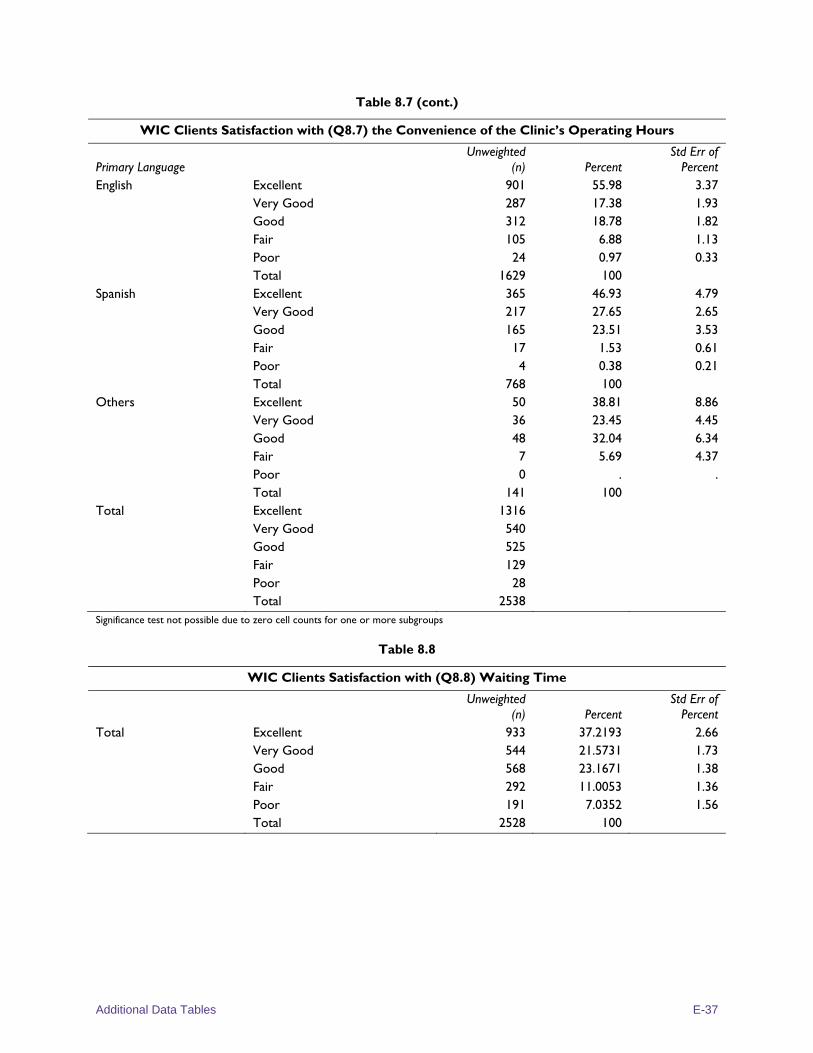
Additional Data Tables E-37
Table 8.7 (cont.)
WIC Clients Satisfaction with (Q8.7) the Convenience of the Clinic’s Operating Hours
Primary Language Unweighted
(n) Percent Std Err of
Percent English Excellent 901 55.98 3.37
Very Good 287 17.38 1.93 Good 312 18.78 1.82 Fair 105 6.88 1.13 Poor 24 0.97 0.33 Total 1629 100
Spanish Excellent 365 46.93 4.79 Very Good 217 27.65 2.65 Good 165 23.51 3.53 Fair 17 1.53 0.61 Poor 4 0.38 0.21 Total 768 100
Others Excellent 50 38.81 8.86 Very Good 36 23.45 4.45 Good 48 32.04 6.34 Fair 7 5.69 4.37 Poor 0 . . Total 141 100
Total Excellent 1316 Very Good 540 Good 525 Fair 129 Poor 28 Total 2538
Significance test not possible due to zero cell counts for one or more subgroups
Table 8.8
WIC Clients Satisfaction with (Q8.8) Waiting Time
Unweighted (n) Percent
Std Err of Percent
Total Excellent 933 37.2193 2.66 Very Good 544 21.5731 1.73 Good 568 23.1671 1.38 Fair 292 11.0053 1.36 Poor 191 7.0352 1.56 Total 2528 100
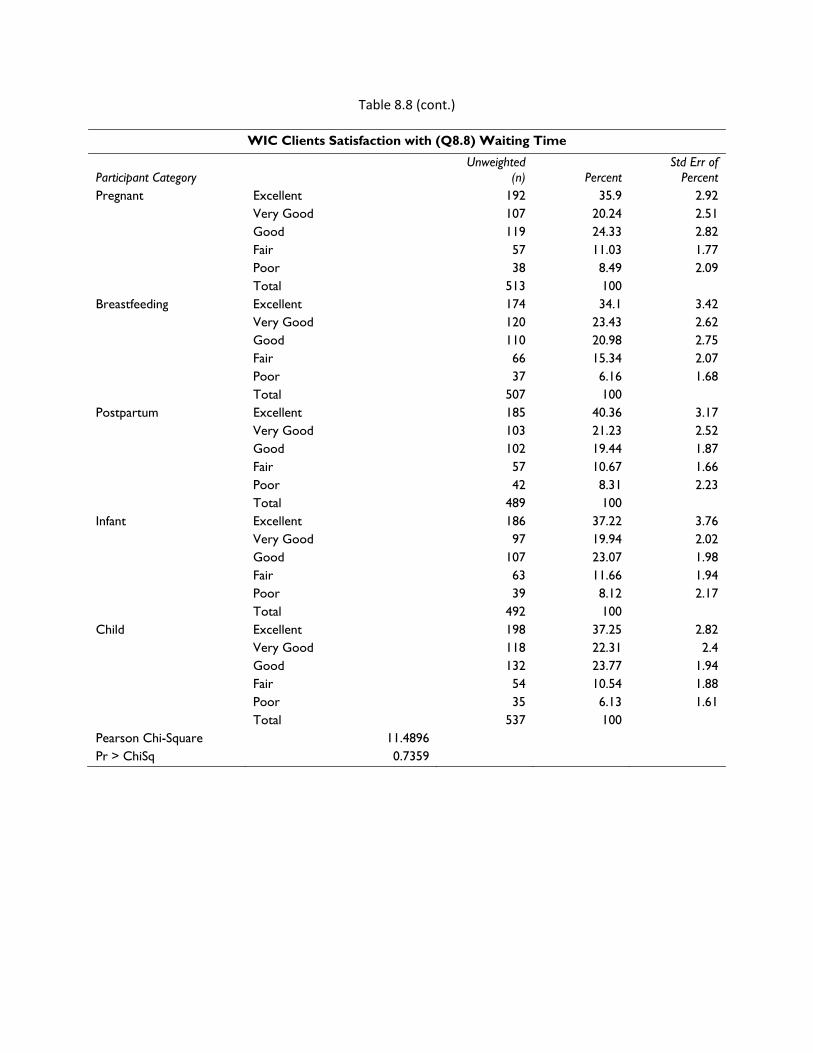
Table 8.8 (cont.)
WIC Clients Satisfaction with (Q8.8) Waiting Time
Participant Category Unweighted
(n) Percent Std Err of
Percent Pregnant Excellent 192 35.9 2.92
Very Good 107 20.24 2.51 Good 119 24.33 2.82 Fair 57 11.03 1.77 Poor 38 8.49 2.09 Total 513 100
Breastfeeding Excellent 174 34.1 3.42 Very Good 120 23.43 2.62 Good 110 20.98 2.75 Fair 66 15.34 2.07 Poor 37 6.16 1.68 Total 507 100
Postpartum Excellent 185 40.36 3.17 Very Good 103 21.23 2.52 Good 102 19.44 1.87 Fair 57 10.67 1.66 Poor 42 8.31 2.23 Total 489 100
Infant Excellent 186 37.22 3.76 Very Good 97 19.94 2.02 Good 107 23.07 1.98 Fair 63 11.66 1.94 Poor 39 8.12 2.17 Total 492 100
Child Excellent 198 37.25 2.82 Very Good 118 22.31 2.4 Good 132 23.77 1.94 Fair 54 10.54 1.88 Poor 35 6.13 1.61 Total 537 100
Pearson Chi-Square 11.4896 Pr > ChiSq 0.7359
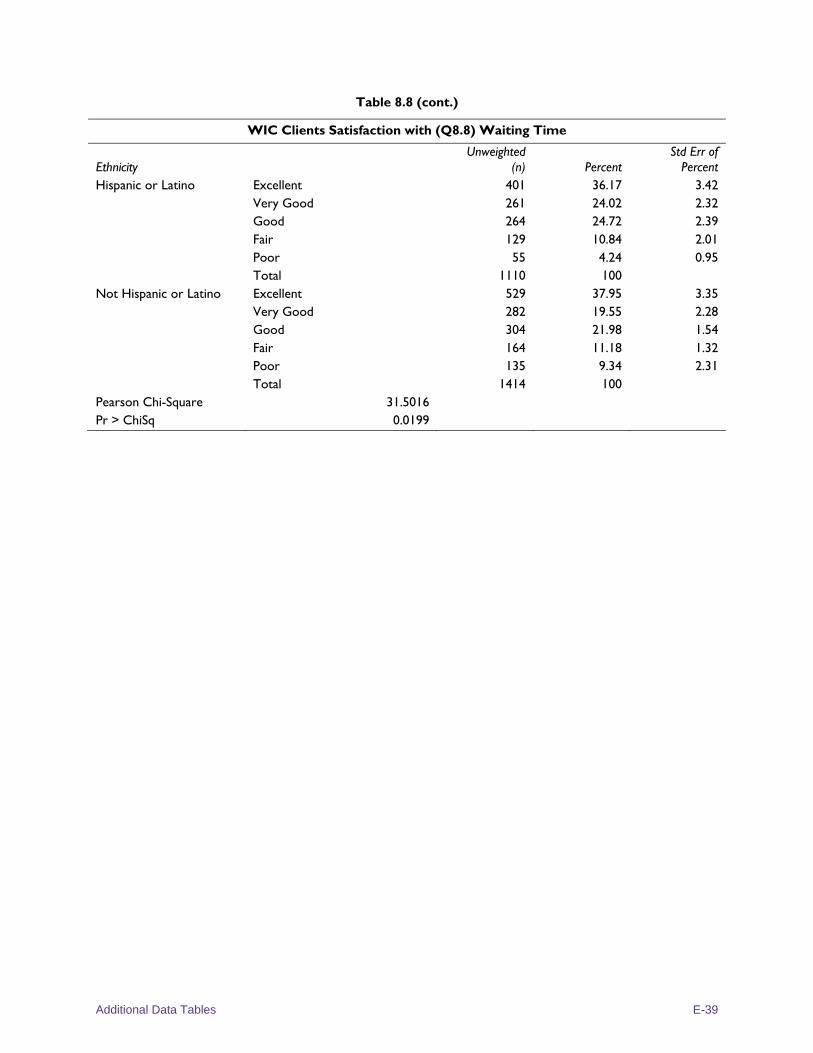
Additional Data Tables E-39
Table 8.8 (cont.)
WIC Clients Satisfaction with (Q8.8) Waiting Time
Ethnicity Unweighted
(n) Percent Std Err of
Percent Hispanic or Latino Excellent 401 36.17 3.42
Very Good 261 24.02 2.32 Good 264 24.72 2.39 Fair 129 10.84 2.01 Poor 55 4.24 0.95 Total 1110 100
Not Hispanic or Latino Excellent 529 37.95 3.35 Very Good 282 19.55 2.28 Good 304 21.98 1.54 Fair 164 11.18 1.32 Poor 135 9.34 2.31 Total 1414 100
Pearson Chi-Square 31.5016 Pr > ChiSq 0.0199
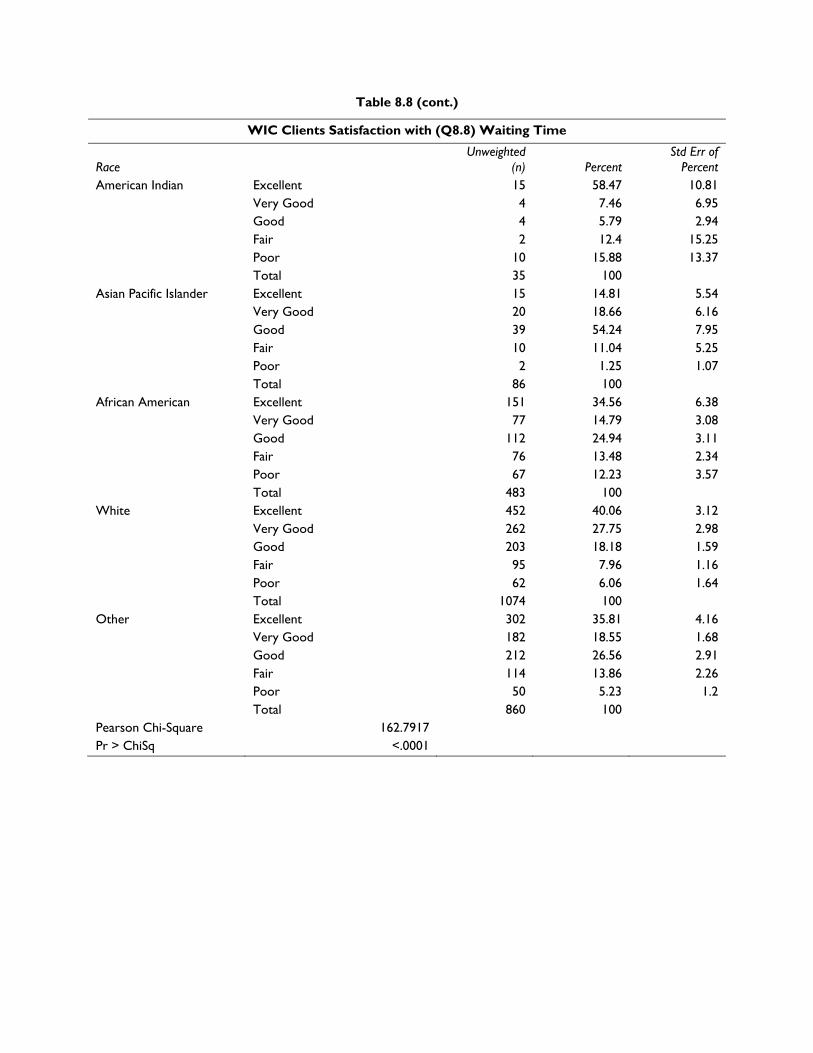
Table 8.8 (cont.)
WIC Clients Satisfaction with (Q8.8) Waiting Time
Race Unweighted
(n) Percent Std Err of
Percent American Indian Excellent 15 58.47 10.81
Very Good 4 7.46 6.95 Good 4 5.79 2.94 Fair 2 12.4 15.25 Poor 10 15.88 13.37 Total 35 100
Asian Pacific Islander Excellent 15 14.81 5.54 Very Good 20 18.66 6.16 Good 39 54.24 7.95 Fair 10 11.04 5.25 Poor 2 1.25 1.07 Total 86 100
African American Excellent 151 34.56 6.38 Very Good 77 14.79 3.08 Good 112 24.94 3.11 Fair 76 13.48 2.34 Poor 67 12.23 3.57 Total 483 100
White Excellent 452 40.06 3.12 Very Good 262 27.75 2.98 Good 203 18.18 1.59 Fair 95 7.96 1.16 Poor 62 6.06 1.64 Total 1074 100
Other Excellent 302 35.81 4.16 Very Good 182 18.55 1.68 Good 212 26.56 2.91 Fair 114 13.86 2.26 Poor 50 5.23 1.2 Total 860 100
Pearson Chi-Square 162.7917 Pr > ChiSq <.0001
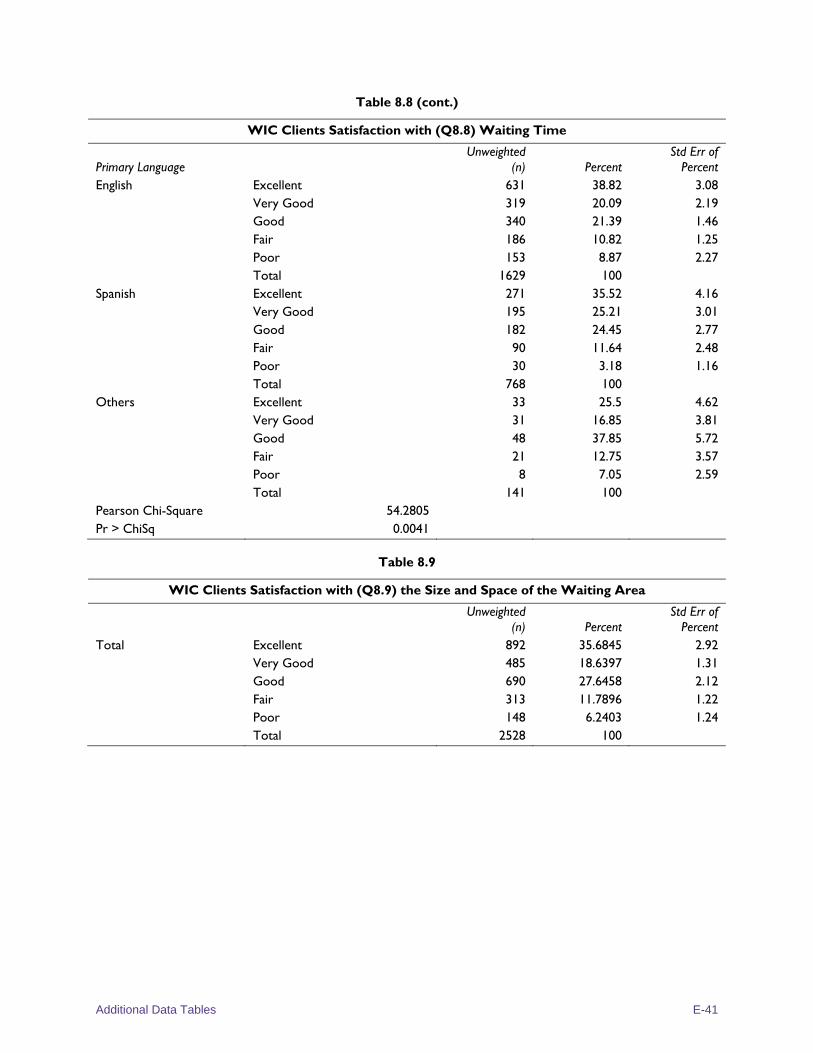
Additional Data Tables E-41
Table 8.8 (cont.)
WIC Clients Satisfaction with (Q8.8) Waiting Time
Primary Language Unweighted
(n) Percent Std Err of
Percent English Excellent 631 38.82 3.08
Very Good 319 20.09 2.19 Good 340 21.39 1.46 Fair 186 10.82 1.25 Poor 153 8.87 2.27 Total 1629 100
Spanish Excellent 271 35.52 4.16 Very Good 195 25.21 3.01 Good 182 24.45 2.77 Fair 90 11.64 2.48 Poor 30 3.18 1.16 Total 768 100
Others Excellent 33 25.5 4.62 Very Good 31 16.85 3.81 Good 48 37.85 5.72 Fair 21 12.75 3.57 Poor 8 7.05 2.59 Total 141 100
Pearson Chi-Square 54.2805 Pr > ChiSq 0.0041
Table 8.9
WIC Clients Satisfaction with (Q8.9) the Size and Space of the Waiting Area
Unweighted (n) Percent
Std Err of Percent
Total Excellent 892 35.6845 2.92 Very Good 485 18.6397 1.31 Good 690 27.6458 2.12 Fair 313 11.7896 1.22 Poor 148 6.2403 1.24 Total 2528 100
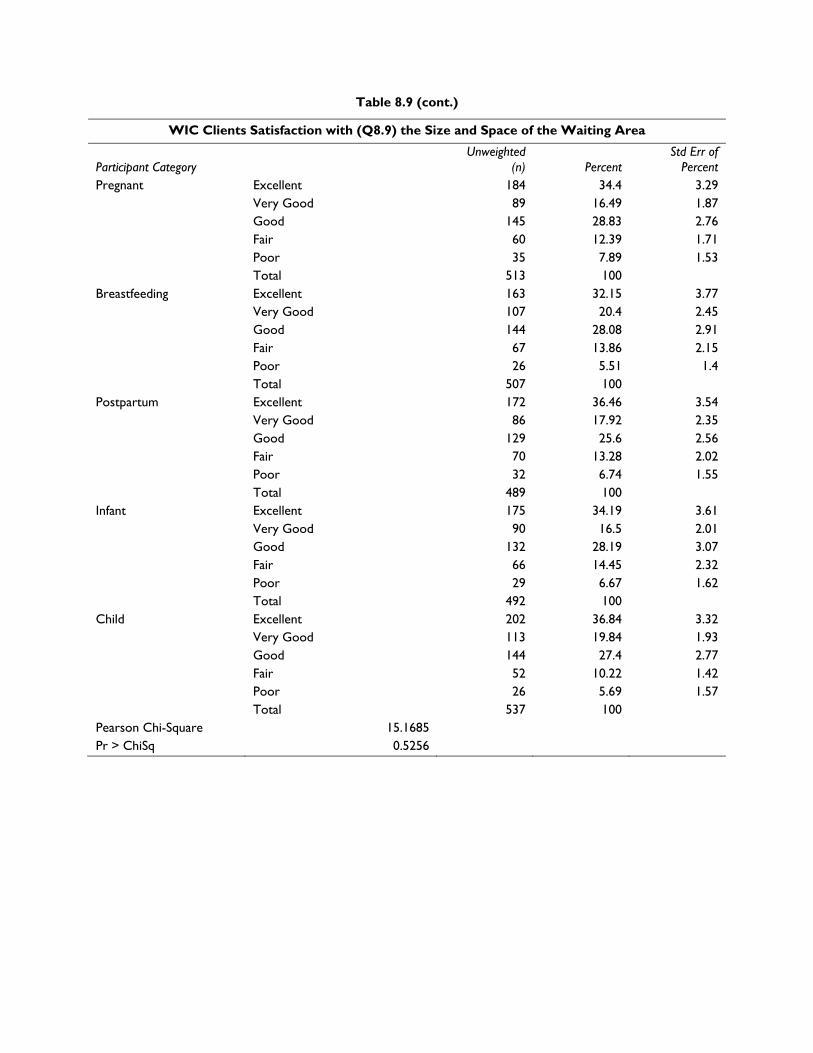
Table 8.9 (cont.)
WIC Clients Satisfaction with (Q8.9) the Size and Space of the Waiting Area
Participant Category Unweighted
(n) Percent Std Err of
Percent Pregnant Excellent 184 34.4 3.29
Very Good 89 16.49 1.87 Good 145 28.83 2.76 Fair 60 12.39 1.71 Poor 35 7.89 1.53 Total 513 100
Breastfeeding Excellent 163 32.15 3.77 Very Good 107 20.4 2.45 Good 144 28.08 2.91 Fair 67 13.86 2.15 Poor 26 5.51 1.4 Total 507 100
Postpartum Excellent 172 36.46 3.54 Very Good 86 17.92 2.35 Good 129 25.6 2.56 Fair 70 13.28 2.02 Poor 32 6.74 1.55 Total 489 100
Infant Excellent 175 34.19 3.61 Very Good 90 16.5 2.01 Good 132 28.19 3.07 Fair 66 14.45 2.32 Poor 29 6.67 1.62 Total 492 100
Child Excellent 202 36.84 3.32 Very Good 113 19.84 1.93 Good 144 27.4 2.77 Fair 52 10.22 1.42 Poor 26 5.69 1.57 Total 537 100
Pearson Chi-Square 15.1685 Pr > ChiSq 0.5256
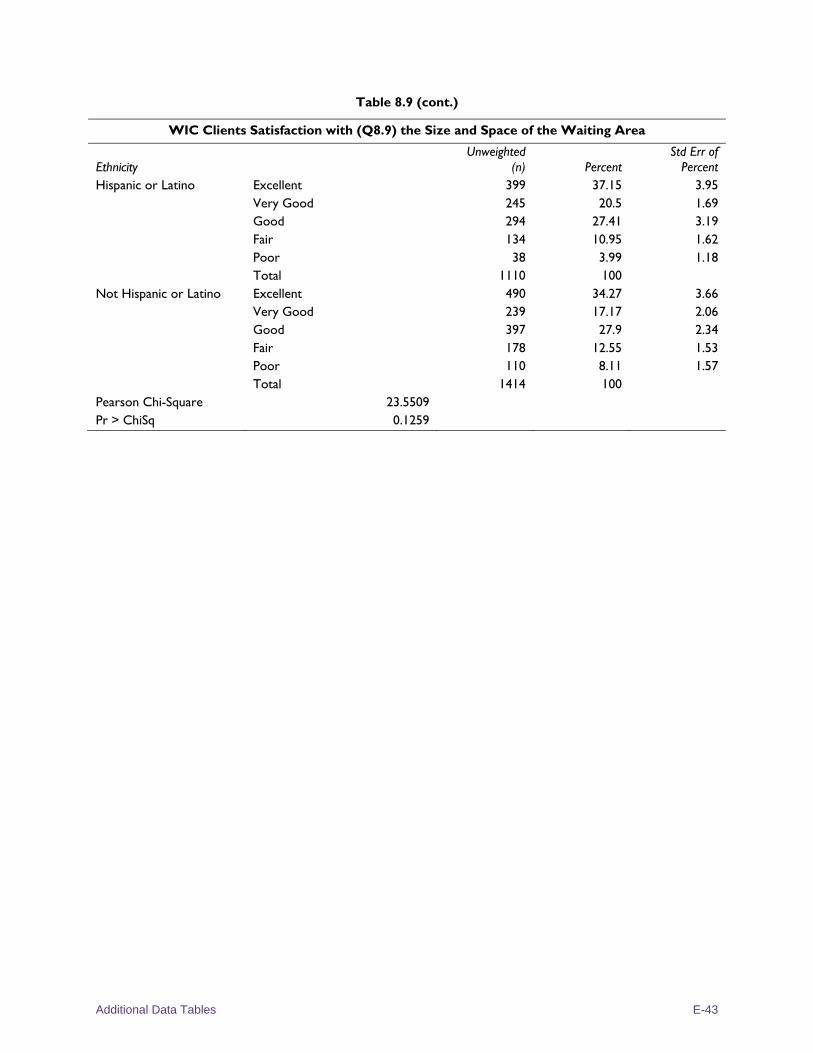
Additional Data Tables E-43
Table 8.9 (cont.)
WIC Clients Satisfaction with (Q8.9) the Size and Space of the Waiting Area
Ethnicity Unweighted
(n) Percent Std Err of
Percent Hispanic or Latino Excellent 399 37.15 3.95
Very Good 245 20.5 1.69 Good 294 27.41 3.19 Fair 134 10.95 1.62 Poor 38 3.99 1.18 Total 1110 100
Not Hispanic or Latino Excellent 490 34.27 3.66 Very Good 239 17.17 2.06 Good 397 27.9 2.34 Fair 178 12.55 1.53 Poor 110 8.11 1.57 Total 1414 100
Pearson Chi-Square 23.5509 Pr > ChiSq 0.1259
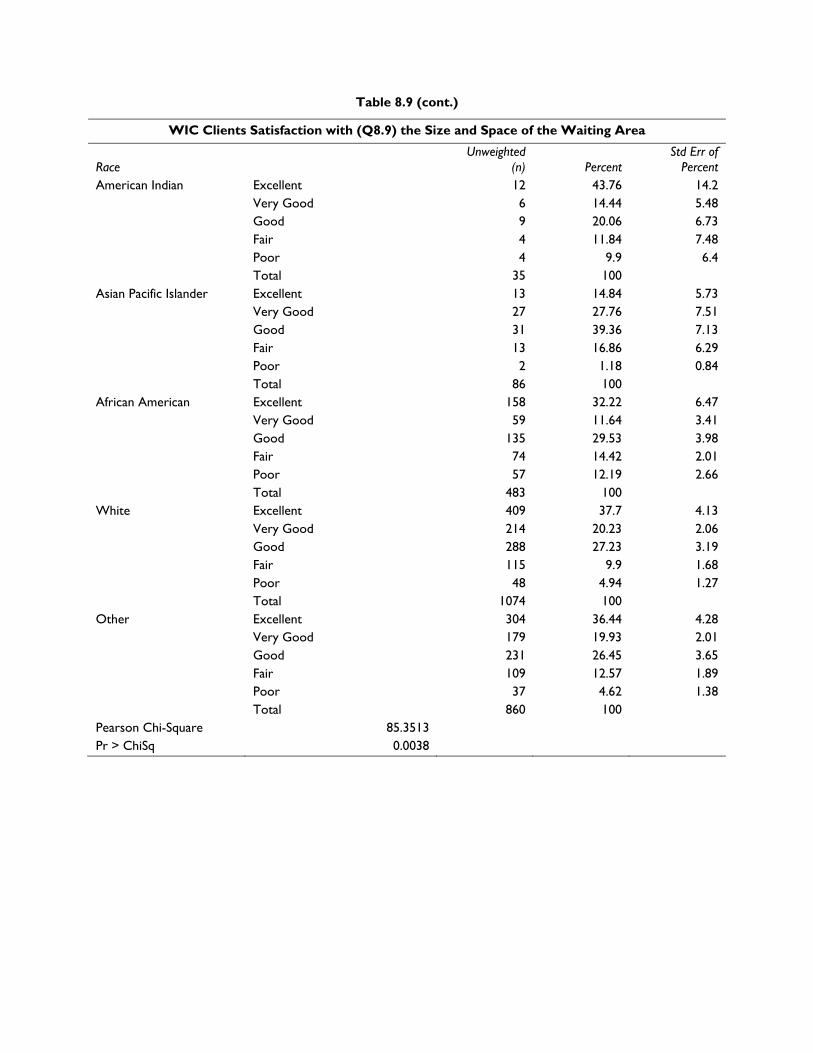
Table 8.9 (cont.)
WIC Clients Satisfaction with (Q8.9) the Size and Space of the Waiting Area
Race Unweighted
(n) Percent Std Err of
Percent American Indian Excellent 12 43.76 14.2
Very Good 6 14.44 5.48 Good 9 20.06 6.73 Fair 4 11.84 7.48 Poor 4 9.9 6.4 Total 35 100
Asian Pacific Islander Excellent 13 14.84 5.73 Very Good 27 27.76 7.51 Good 31 39.36 7.13 Fair 13 16.86 6.29 Poor 2 1.18 0.84 Total 86 100
African American Excellent 158 32.22 6.47 Very Good 59 11.64 3.41 Good 135 29.53 3.98 Fair 74 14.42 2.01 Poor 57 12.19 2.66 Total 483 100
White Excellent 409 37.7 4.13 Very Good 214 20.23 2.06 Good 288 27.23 3.19 Fair 115 9.9 1.68 Poor 48 4.94 1.27 Total 1074 100
Other Excellent 304 36.44 4.28 Very Good 179 19.93 2.01 Good 231 26.45 3.65 Fair 109 12.57 1.89 Poor 37 4.62 1.38 Total 860 100
Pearson Chi-Square 85.3513 Pr > ChiSq 0.0038
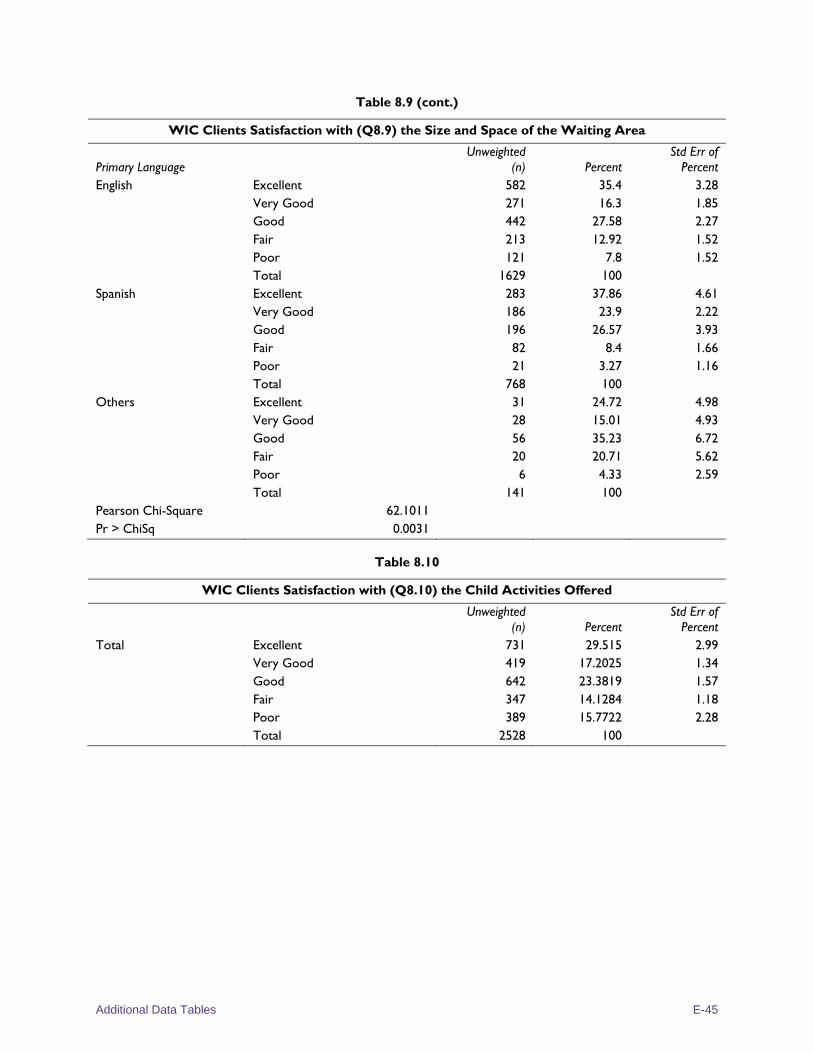
Additional Data Tables E-45
Table 8.9 (cont.)
WIC Clients Satisfaction with (Q8.9) the Size and Space of the Waiting Area
Primary Language Unweighted
(n) Percent Std Err of
Percent English Excellent 582 35.4 3.28
Very Good 271 16.3 1.85 Good 442 27.58 2.27 Fair 213 12.92 1.52 Poor 121 7.8 1.52 Total 1629 100
Spanish Excellent 283 37.86 4.61 Very Good 186 23.9 2.22 Good 196 26.57 3.93 Fair 82 8.4 1.66 Poor 21 3.27 1.16 Total 768 100
Others Excellent 31 24.72 4.98 Very Good 28 15.01 4.93 Good 56 35.23 6.72 Fair 20 20.71 5.62 Poor 6 4.33 2.59 Total 141 100
Pearson Chi-Square 62.1011 Pr > ChiSq 0.0031
Table 8.10
WIC Clients Satisfaction with (Q8.10) the Child Activities Offered
Unweighted (n) Percent
Std Err of Percent
Total Excellent 731 29.515 2.99 Very Good 419 17.2025 1.34 Good 642 23.3819 1.57 Fair 347 14.1284 1.18 Poor 389 15.7722 2.28 Total 2528 100
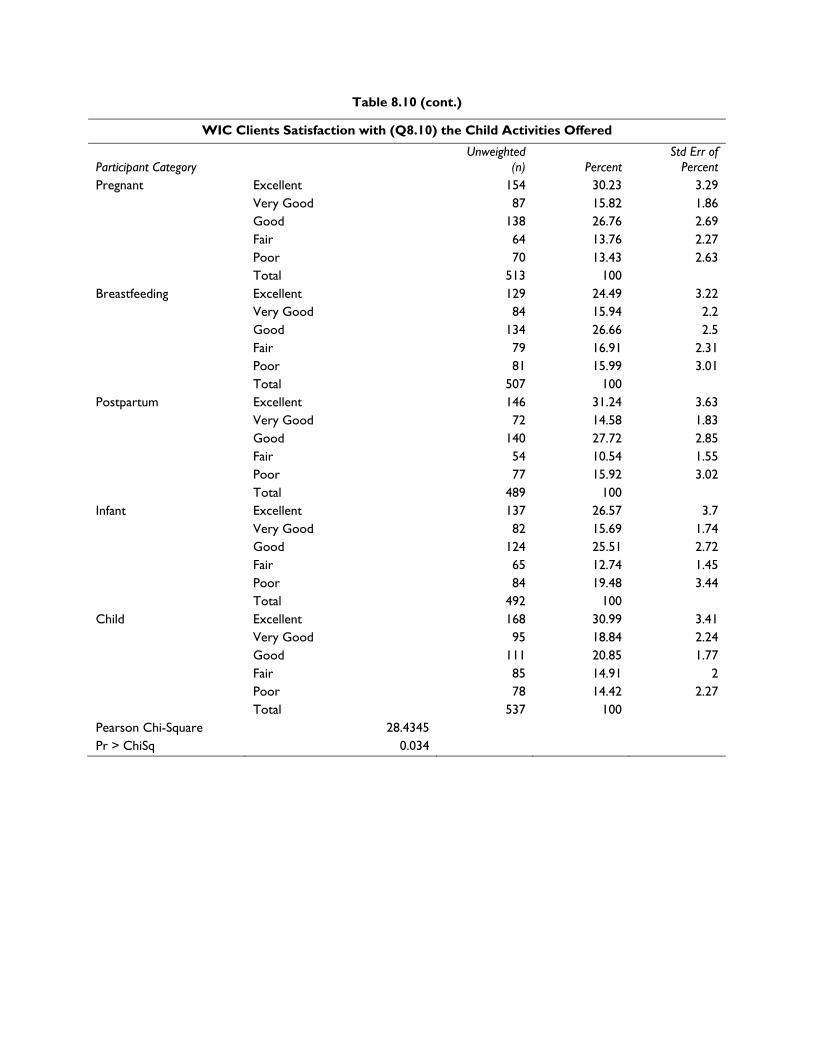
Table 8.10 (cont.)
WIC Clients Satisfaction with (Q8.10) the Child Activities Offered
Participant Category Unweighted
(n) Percent Std Err of
Percent Pregnant Excellent 154 30.23 3.29
Very Good 87 15.82 1.86 Good 138 26.76 2.69 Fair 64 13.76 2.27 Poor 70 13.43 2.63 Total 513 100
Breastfeeding Excellent 129 24.49 3.22 Very Good 84 15.94 2.2 Good 134 26.66 2.5 Fair 79 16.91 2.31 Poor 81 15.99 3.01 Total 507 100
Postpartum Excellent 146 31.24 3.63 Very Good 72 14.58 1.83 Good 140 27.72 2.85 Fair 54 10.54 1.55 Poor 77 15.92 3.02 Total 489 100
Infant Excellent 137 26.57 3.7 Very Good 82 15.69 1.74 Good 124 25.51 2.72 Fair 65 12.74 1.45 Poor 84 19.48 3.44 Total 492 100
Child Excellent 168 30.99 3.41 Very Good 95 18.84 2.24 Good 111 20.85 1.77 Fair 85 14.91 2 Poor 78 14.42 2.27 Total 537 100
Pearson Chi-Square 28.4345 Pr > ChiSq 0.034
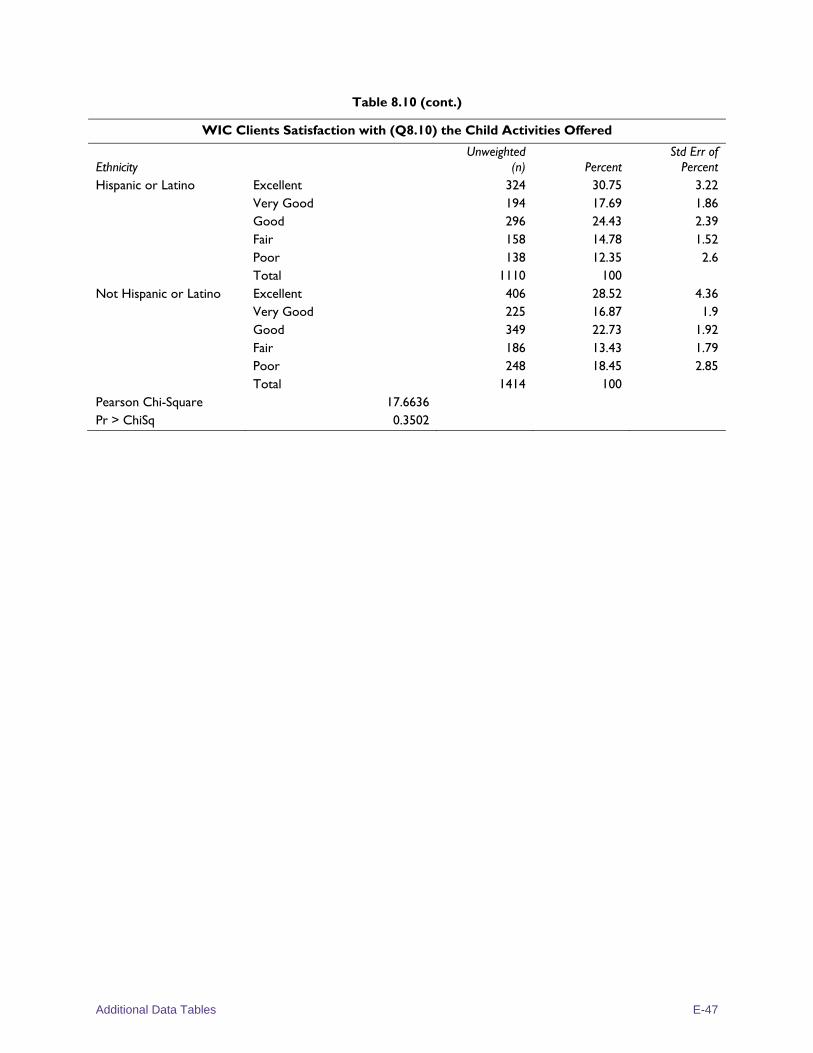
Additional Data Tables E-47
Table 8.10 (cont.)
WIC Clients Satisfaction with (Q8.10) the Child Activities Offered
Ethnicity Unweighted
(n) Percent Std Err of
Percent Hispanic or Latino Excellent 324 30.75 3.22
Very Good 194 17.69 1.86 Good 296 24.43 2.39 Fair 158 14.78 1.52 Poor 138 12.35 2.6 Total 1110 100
Not Hispanic or Latino Excellent 406 28.52 4.36 Very Good 225 16.87 1.9 Good 349 22.73 1.92 Fair 186 13.43 1.79 Poor 248 18.45 2.85 Total 1414 100
Pearson Chi-Square 17.6636 Pr > ChiSq 0.3502
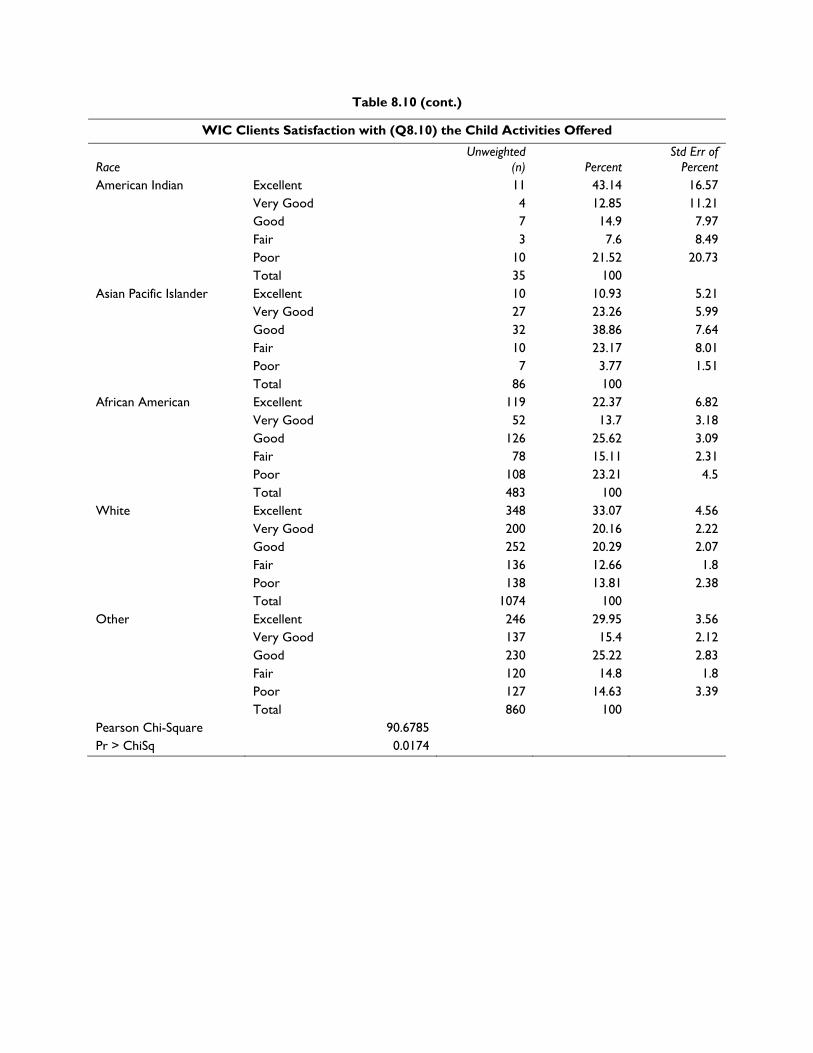
Table 8.10 (cont.)
WIC Clients Satisfaction with (Q8.10) the Child Activities Offered
Race Unweighted
(n) Percent Std Err of
Percent American Indian Excellent 11 43.14 16.57
Very Good 4 12.85 11.21 Good 7 14.9 7.97 Fair 3 7.6 8.49 Poor 10 21.52 20.73 Total 35 100
Asian Pacific Islander Excellent 10 10.93 5.21 Very Good 27 23.26 5.99 Good 32 38.86 7.64 Fair 10 23.17 8.01 Poor 7 3.77 1.51 Total 86 100
African American Excellent 119 22.37 6.82 Very Good 52 13.7 3.18 Good 126 25.62 3.09 Fair 78 15.11 2.31 Poor 108 23.21 4.5 Total 483 100
White Excellent 348 33.07 4.56 Very Good 200 20.16 2.22 Good 252 20.29 2.07 Fair 136 12.66 1.8 Poor 138 13.81 2.38 Total 1074 100
Other Excellent 246 29.95 3.56 Very Good 137 15.4 2.12 Good 230 25.22 2.83 Fair 120 14.8 1.8 Poor 127 14.63 3.39 Total 860 100
Pearson Chi-Square 90.6785 Pr > ChiSq 0.0174
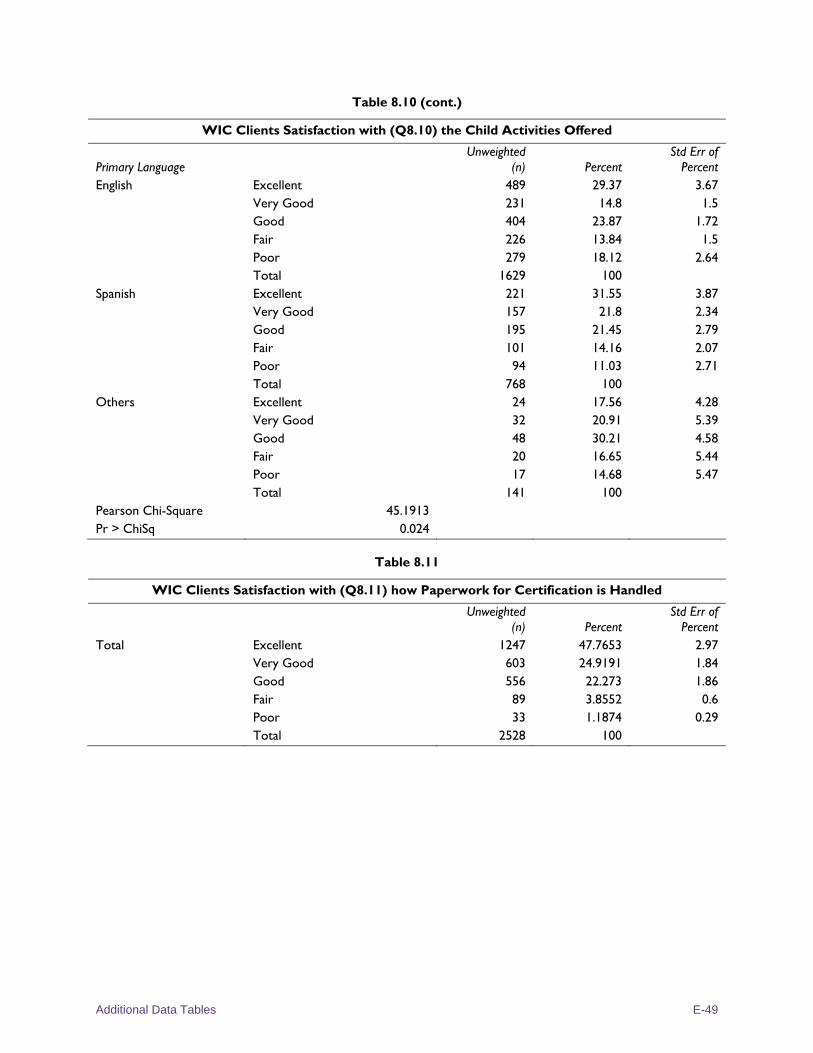
Additional Data Tables E-49
Table 8.10 (cont.)
WIC Clients Satisfaction with (Q8.10) the Child Activities Offered
Primary Language Unweighted
(n) Percent Std Err of
Percent English Excellent 489 29.37 3.67
Very Good 231 14.8 1.5 Good 404 23.87 1.72 Fair 226 13.84 1.5 Poor 279 18.12 2.64 Total 1629 100
Spanish Excellent 221 31.55 3.87 Very Good 157 21.8 2.34 Good 195 21.45 2.79 Fair 101 14.16 2.07 Poor 94 11.03 2.71 Total 768 100
Others Excellent 24 17.56 4.28 Very Good 32 20.91 5.39 Good 48 30.21 4.58 Fair 20 16.65 5.44 Poor 17 14.68 5.47 Total 141 100
Pearson Chi-Square 45.1913 Pr > ChiSq 0.024
Table 8.11
WIC Clients Satisfaction with (Q8.11) how Paperwork for Certification is Handled
Unweighted (n) Percent
Std Err of Percent
Total Excellent 1247 47.7653 2.97 Very Good 603 24.9191 1.84 Good 556 22.273 1.86 Fair 89 3.8552 0.6 Poor 33 1.1874 0.29 Total 2528 100

Table 8.11 (cont.)
WIC Clients Satisfaction with (Q8.11) how Paperwork for Certification is Handled
Participant Category Unweighted
(n) Percent Std Err of
Percent Pregnant Excellent 262 49.97 3.69
Very Good 122 22.56 2.02 Good 106 22.45 2.74 Fair 10 2.2 0.93 Poor 13 2.82 0.81 Total 513 100
Breastfeeding Excellent 238 45.41 4.41 Very Good 134 27.41 2.67 Good 105 21.77 2.57 Fair 28 5.18 1.36 Poor 2 0.23 0.16 Total 507 100
Postpartum Excellent 241 50.63 3 Very Good 106 20.89 1.9 Good 120 24.63 2.36 Fair 16 2.59 0.88 Poor 6 1.26 0.5 Total 489 100
Infant Excellent 255 51.38 3.62 Very Good 95 17.92 2.02 Good 118 24.73 2.42 Fair 19 4.69 1.28 Poor 5 1.28 0.55 Total 492 100
Child Excellent 255 45.33 3.42 Very Good 148 29.01 2.85 Good 111 20.96 2.37 Fair 16 3.78 0.9 Poor 7 0.92 0.39 Total 537 100
Pearson Chi-Square 42.878 Pr > ChiSq 0.0002
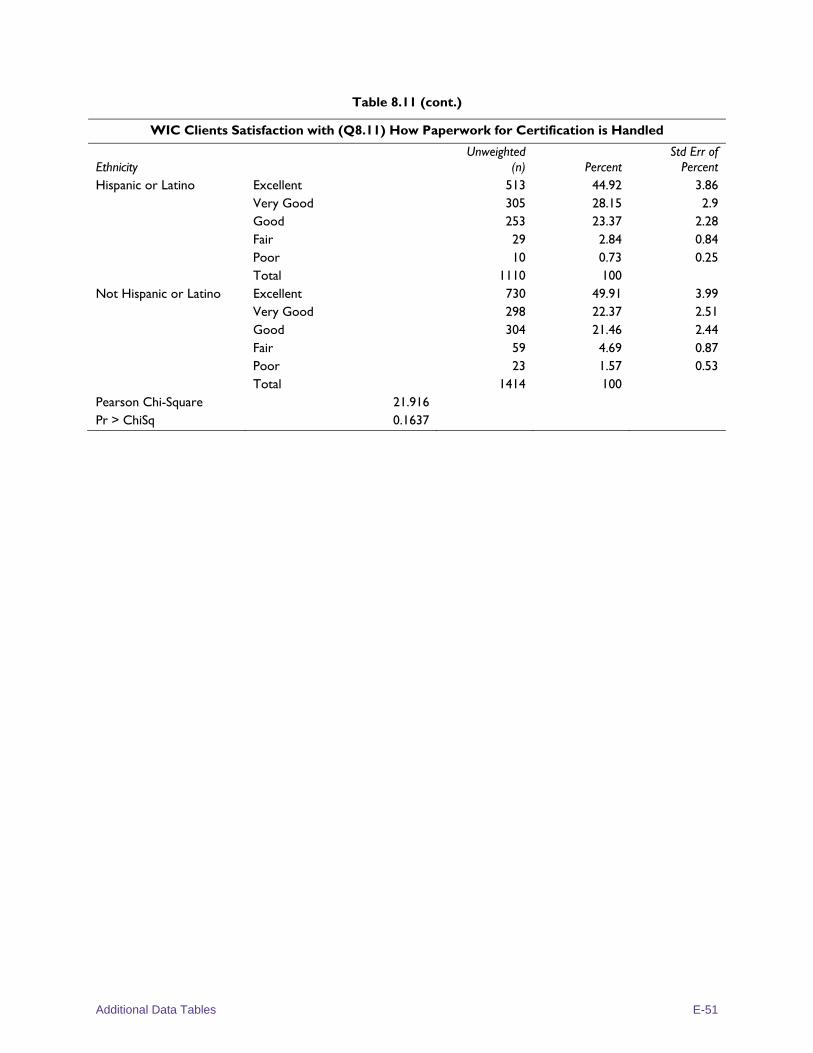
Additional Data Tables E-51
Table 8.11 (cont.)
WIC Clients Satisfaction with (Q8.11) How Paperwork for Certification is Handled
Ethnicity Unweighted
(n) Percent Std Err of
Percent Hispanic or Latino Excellent 513 44.92 3.86
Very Good 305 28.15 2.9 Good 253 23.37 2.28 Fair 29 2.84 0.84 Poor 10 0.73 0.25 Total 1110 100
Not Hispanic or Latino Excellent 730 49.91 3.99 Very Good 298 22.37 2.51 Good 304 21.46 2.44 Fair 59 4.69 0.87 Poor 23 1.57 0.53 Total 1414 100
Pearson Chi-Square 21.916 Pr > ChiSq 0.1637
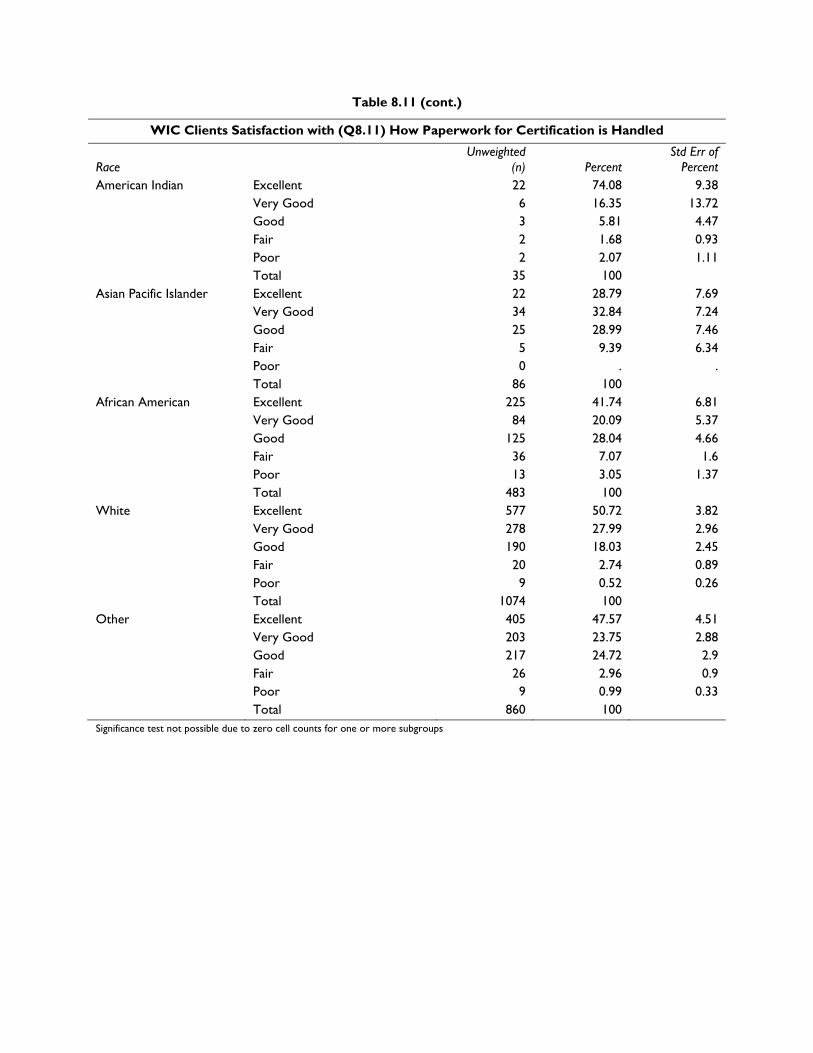
Table 8.11 (cont.)
WIC Clients Satisfaction with (Q8.11) How Paperwork for Certification is Handled
Race Unweighted
(n) Percent Std Err of
Percent American Indian Excellent 22 74.08 9.38
Very Good 6 16.35 13.72 Good 3 5.81 4.47 Fair 2 1.68 0.93 Poor 2 2.07 1.11 Total 35 100
Asian Pacific Islander Excellent 22 28.79 7.69 Very Good 34 32.84 7.24 Good 25 28.99 7.46 Fair 5 9.39 6.34 Poor 0 . . Total 86 100
African American Excellent 225 41.74 6.81 Very Good 84 20.09 5.37 Good 125 28.04 4.66 Fair 36 7.07 1.6 Poor 13 3.05 1.37 Total 483 100
White Excellent 577 50.72 3.82 Very Good 278 27.99 2.96 Good 190 18.03 2.45 Fair 20 2.74 0.89 Poor 9 0.52 0.26 Total 1074 100
Other Excellent 405 47.57 4.51 Very Good 203 23.75 2.88 Good 217 24.72 2.9 Fair 26 2.96 0.9 Poor 9 0.99 0.33 Total 860 100
Significance test not possible due to zero cell counts for one or more subgroups
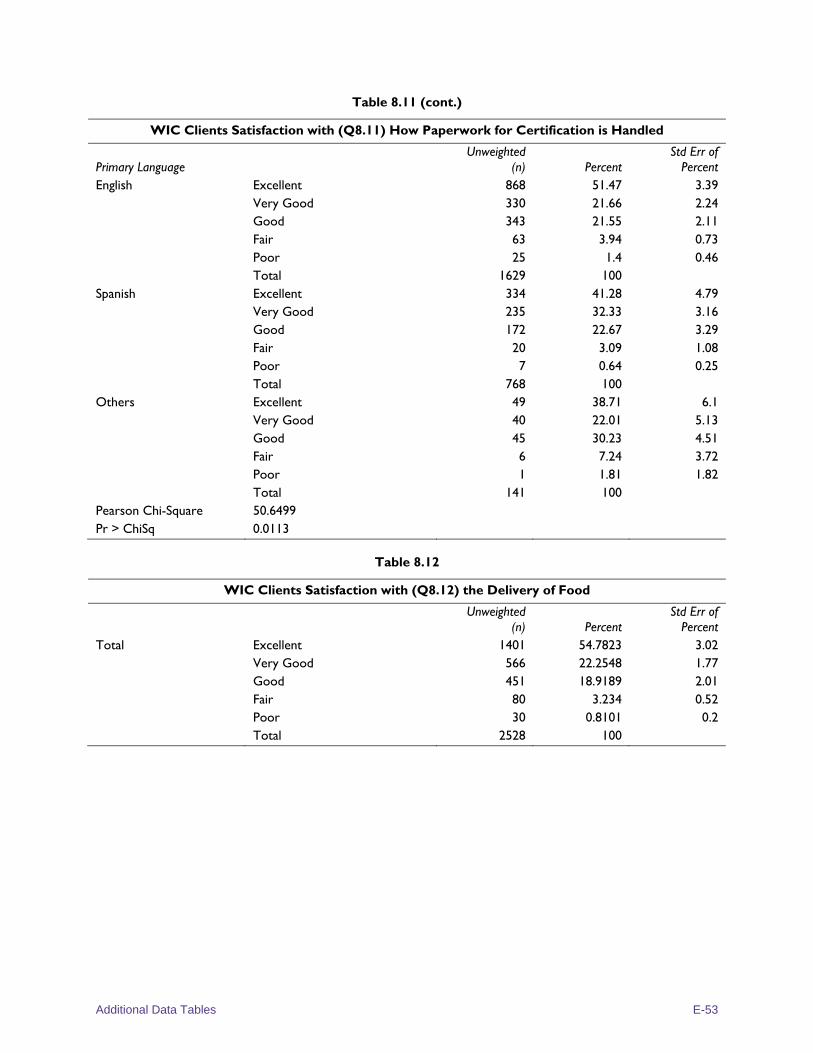
Additional Data Tables E-53
Table 8.11 (cont.)
WIC Clients Satisfaction with (Q8.11) How Paperwork for Certification is Handled
Primary Language Unweighted
(n) Percent Std Err of
Percent English Excellent 868 51.47 3.39
Very Good 330 21.66 2.24 Good 343 21.55 2.11 Fair 63 3.94 0.73 Poor 25 1.4 0.46 Total 1629 100
Spanish Excellent 334 41.28 4.79 Very Good 235 32.33 3.16 Good 172 22.67 3.29 Fair 20 3.09 1.08 Poor 7 0.64 0.25 Total 768 100
Others Excellent 49 38.71 6.1 Very Good 40 22.01 5.13 Good 45 30.23 4.51 Fair 6 7.24 3.72 Poor 1 1.81 1.82 Total 141 100
Pearson Chi-Square 50.6499 Pr > ChiSq 0.0113
Table 8.12
WIC Clients Satisfaction with (Q8.12) the Delivery of Food
Unweighted (n) Percent
Std Err of Percent
Total Excellent 1401 54.7823 3.02 Very Good 566 22.2548 1.77 Good 451 18.9189 2.01 Fair 80 3.234 0.52 Poor 30 0.8101 0.2 Total 2528 100
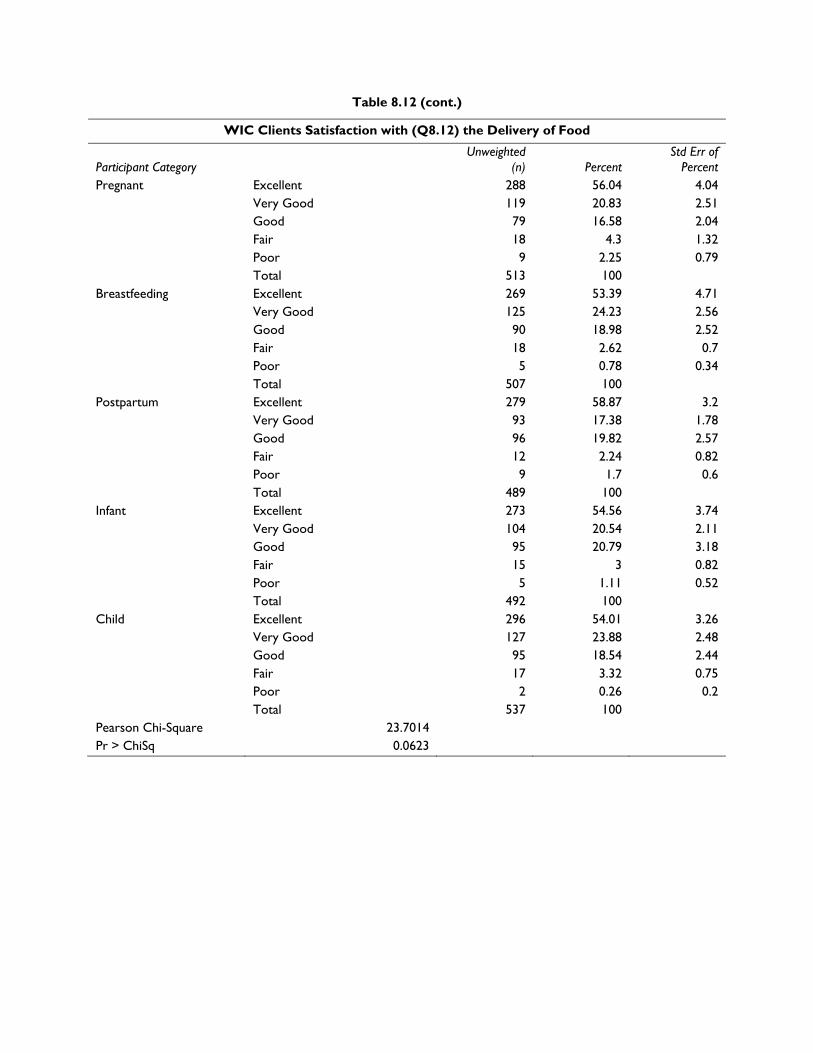
Table 8.12 (cont.)
WIC Clients Satisfaction with (Q8.12) the Delivery of Food
Participant Category Unweighted
(n) Percent Std Err of
Percent Pregnant Excellent 288 56.04 4.04
Very Good 119 20.83 2.51 Good 79 16.58 2.04 Fair 18 4.3 1.32 Poor 9 2.25 0.79 Total 513 100
Breastfeeding Excellent 269 53.39 4.71 Very Good 125 24.23 2.56 Good 90 18.98 2.52 Fair 18 2.62 0.7 Poor 5 0.78 0.34 Total 507 100
Postpartum Excellent 279 58.87 3.2 Very Good 93 17.38 1.78 Good 96 19.82 2.57 Fair 12 2.24 0.82 Poor 9 1.7 0.6 Total 489 100
Infant Excellent 273 54.56 3.74 Very Good 104 20.54 2.11 Good 95 20.79 3.18 Fair 15 3 0.82 Poor 5 1.11 0.52 Total 492 100
Child Excellent 296 54.01 3.26 Very Good 127 23.88 2.48 Good 95 18.54 2.44 Fair 17 3.32 0.75 Poor 2 0.26 0.2 Total 537 100
Pearson Chi-Square 23.7014 Pr > ChiSq 0.0623
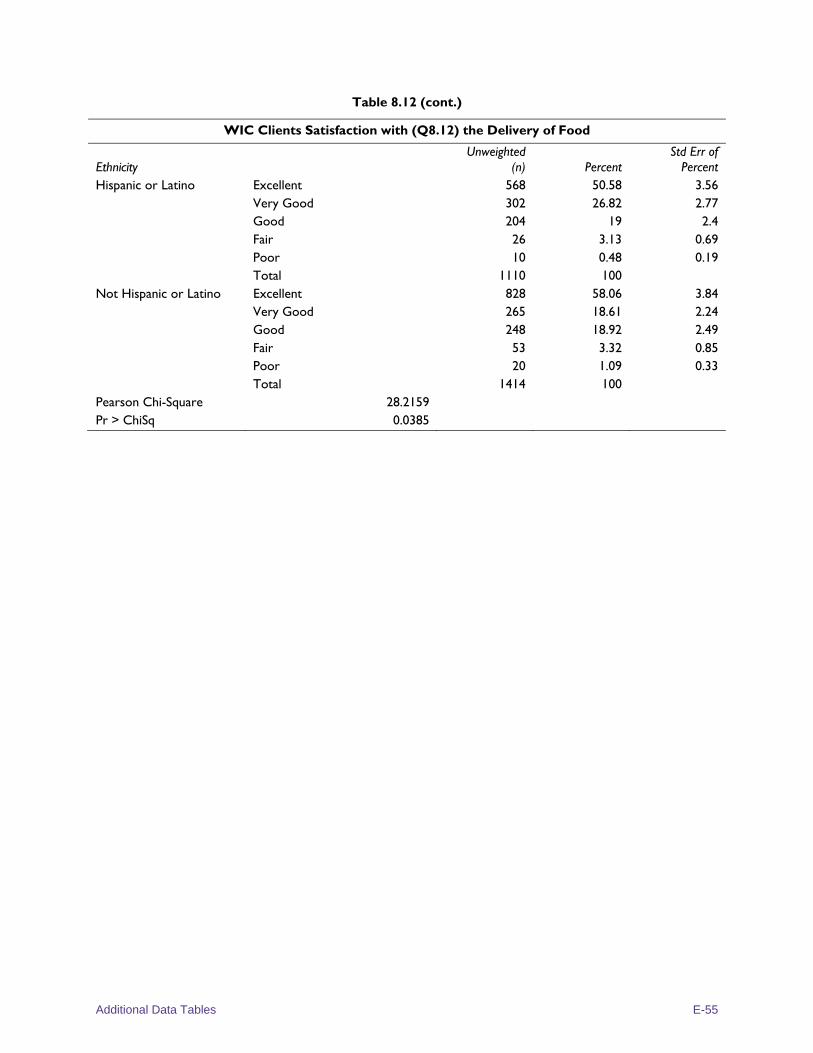
Additional Data Tables E-55
Table 8.12 (cont.)
WIC Clients Satisfaction with (Q8.12) the Delivery of Food
Ethnicity Unweighted
(n) Percent Std Err of
Percent Hispanic or Latino Excellent 568 50.58 3.56
Very Good 302 26.82 2.77 Good 204 19 2.4 Fair 26 3.13 0.69 Poor 10 0.48 0.19 Total 1110 100
Not Hispanic or Latino Excellent 828 58.06 3.84 Very Good 265 18.61 2.24 Good 248 18.92 2.49 Fair 53 3.32 0.85 Poor 20 1.09 0.33 Total 1414 100
Pearson Chi-Square 28.2159 Pr > ChiSq 0.0385
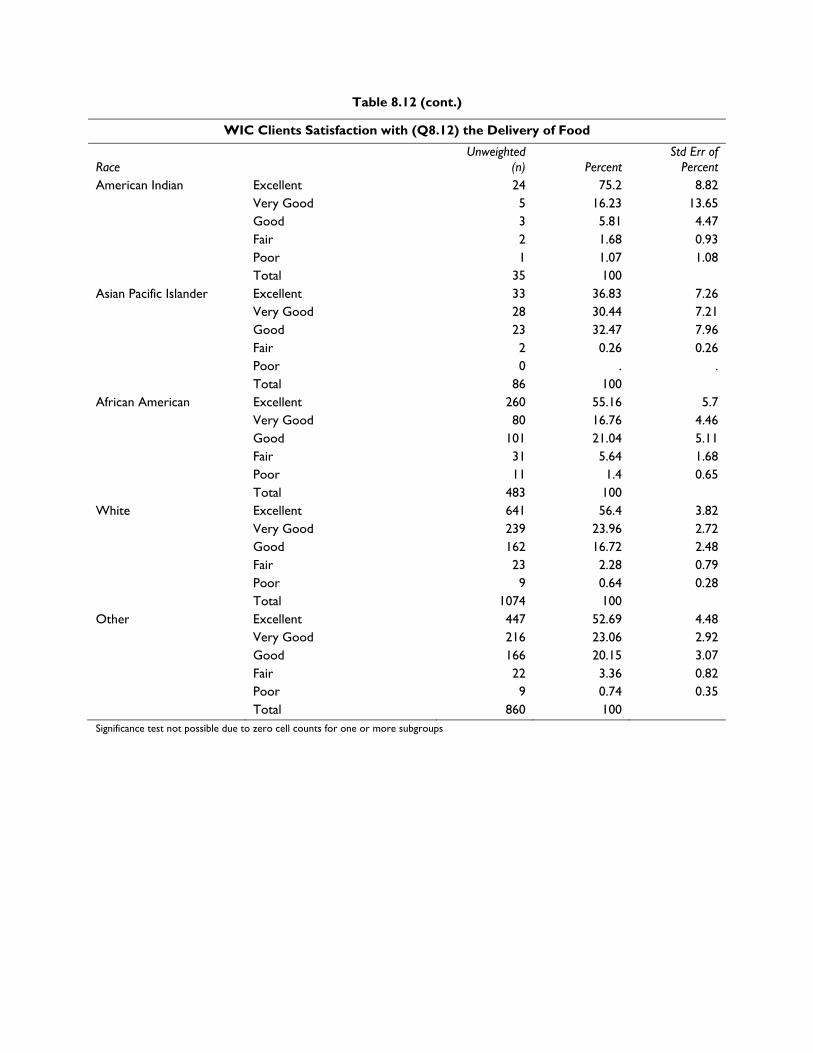
Table 8.12 (cont.)
WIC Clients Satisfaction with (Q8.12) the Delivery of Food
Race Unweighted
(n) Percent Std Err of
Percent American Indian Excellent 24 75.2 8.82
Very Good 5 16.23 13.65 Good 3 5.81 4.47 Fair 2 1.68 0.93 Poor 1 1.07 1.08 Total 35 100
Asian Pacific Islander Excellent 33 36.83 7.26 Very Good 28 30.44 7.21 Good 23 32.47 7.96 Fair 2 0.26 0.26 Poor 0 . . Total 86 100
African American Excellent 260 55.16 5.7 Very Good 80 16.76 4.46 Good 101 21.04 5.11 Fair 31 5.64 1.68 Poor 11 1.4 0.65 Total 483 100
White Excellent 641 56.4 3.82 Very Good 239 23.96 2.72 Good 162 16.72 2.48 Fair 23 2.28 0.79 Poor 9 0.64 0.28 Total 1074 100
Other Excellent 447 52.69 4.48 Very Good 216 23.06 2.92 Good 166 20.15 3.07 Fair 22 3.36 0.82 Poor 9 0.74 0.35 Total 860 100
Significance test not possible due to zero cell counts for one or more subgroups
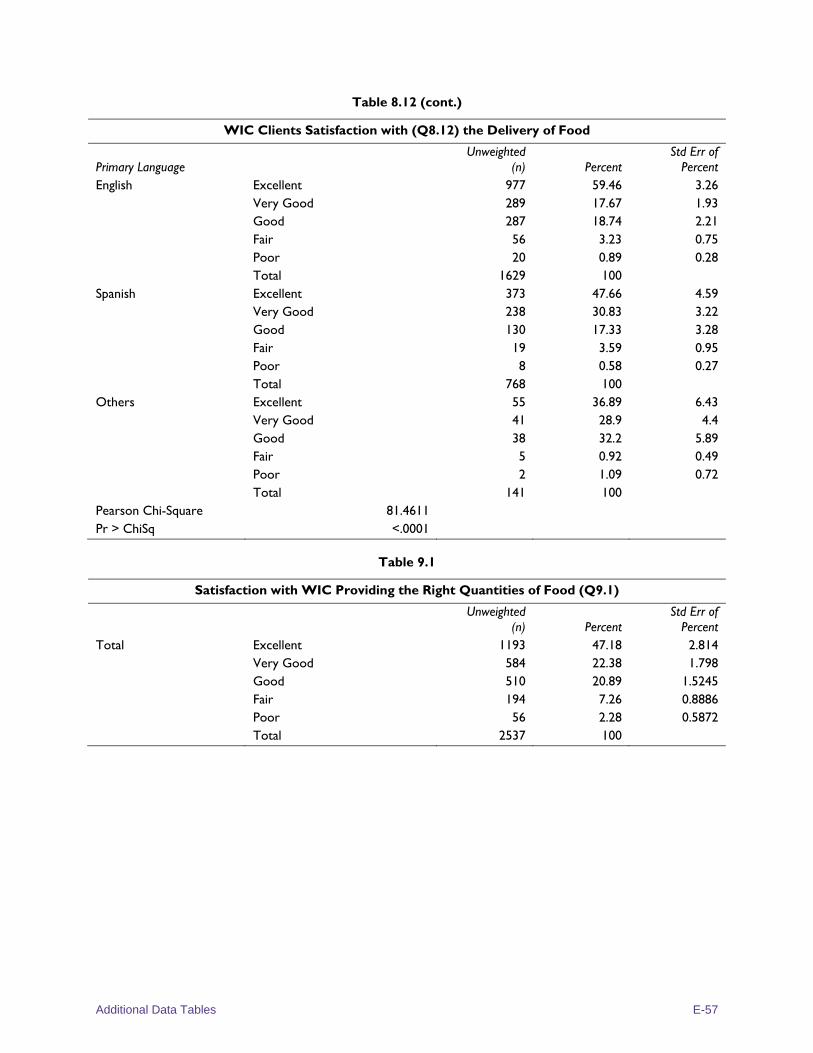
Additional Data Tables E-57
Table 8.12 (cont.)
WIC Clients Satisfaction with (Q8.12) the Delivery of Food
Primary Language Unweighted
(n) Percent Std Err of
Percent English Excellent 977 59.46 3.26
Very Good 289 17.67 1.93 Good 287 18.74 2.21 Fair 56 3.23 0.75 Poor 20 0.89 0.28 Total 1629 100
Spanish Excellent 373 47.66 4.59 Very Good 238 30.83 3.22 Good 130 17.33 3.28 Fair 19 3.59 0.95 Poor 8 0.58 0.27 Total 768 100
Others Excellent 55 36.89 6.43 Very Good 41 28.9 4.4 Good 38 32.2 5.89 Fair 5 0.92 0.49 Poor 2 1.09 0.72 Total 141 100
Pearson Chi-Square 81.4611 Pr > ChiSq <.0001
Table 9.1
Satisfaction with WIC Providing the Right Quantities of Food (Q9.1)
Unweighted (n) Percent
Std Err of Percent
Total Excellent 1193 47.18 2.814 Very Good 584 22.38 1.798 Good 510 20.89 1.5245 Fair 194 7.26 0.8886 Poor 56 2.28 0.5872 Total 2537 100
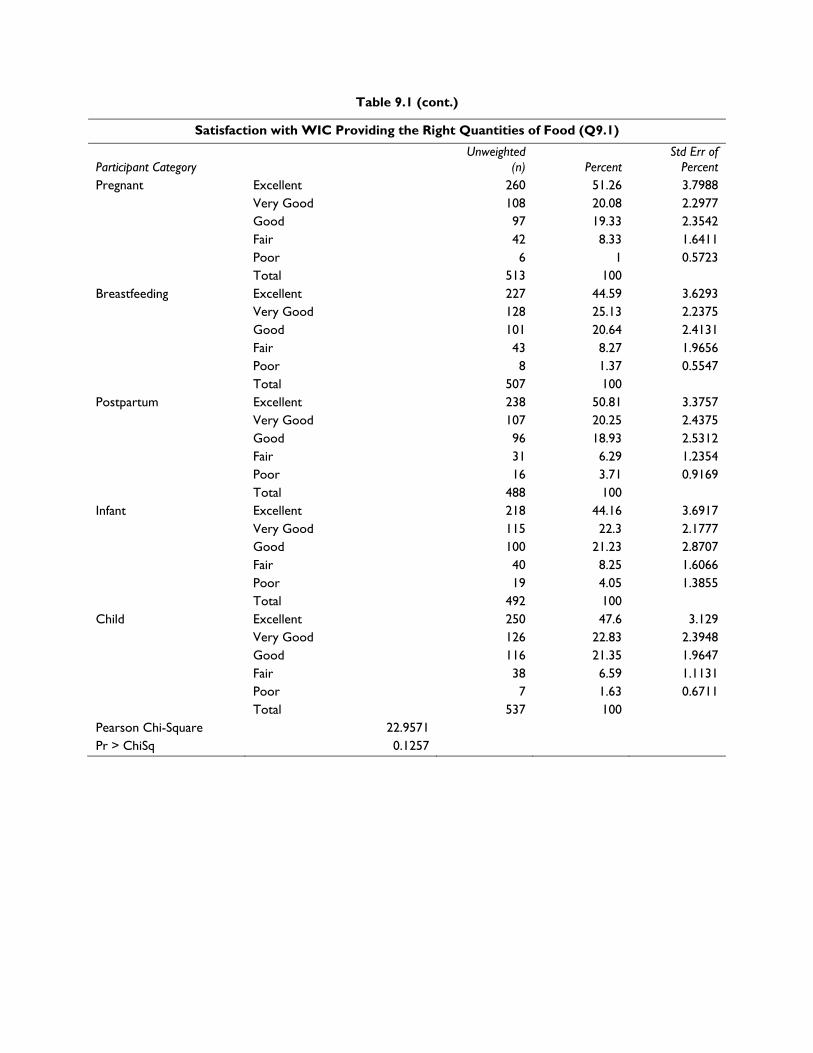
Table 9.1 (cont.)
Satisfaction with WIC Providing the Right Quantities of Food (Q9.1)
Participant Category Unweighted
(n) Percent Std Err of
Percent Pregnant Excellent 260 51.26 3.7988
Very Good 108 20.08 2.2977 Good 97 19.33 2.3542 Fair 42 8.33 1.6411 Poor 6 1 0.5723 Total 513 100
Breastfeeding Excellent 227 44.59 3.6293 Very Good 128 25.13 2.2375 Good 101 20.64 2.4131 Fair 43 8.27 1.9656 Poor 8 1.37 0.5547 Total 507 100
Postpartum Excellent 238 50.81 3.3757 Very Good 107 20.25 2.4375 Good 96 18.93 2.5312 Fair 31 6.29 1.2354 Poor 16 3.71 0.9169 Total 488 100
Infant Excellent 218 44.16 3.6917 Very Good 115 22.3 2.1777 Good 100 21.23 2.8707 Fair 40 8.25 1.6066 Poor 19 4.05 1.3855 Total 492 100
Child Excellent 250 47.6 3.129 Very Good 126 22.83 2.3948 Good 116 21.35 1.9647 Fair 38 6.59 1.1131 Poor 7 1.63 0.6711 Total 537 100
Pearson Chi-Square 22.9571 Pr > ChiSq 0.1257
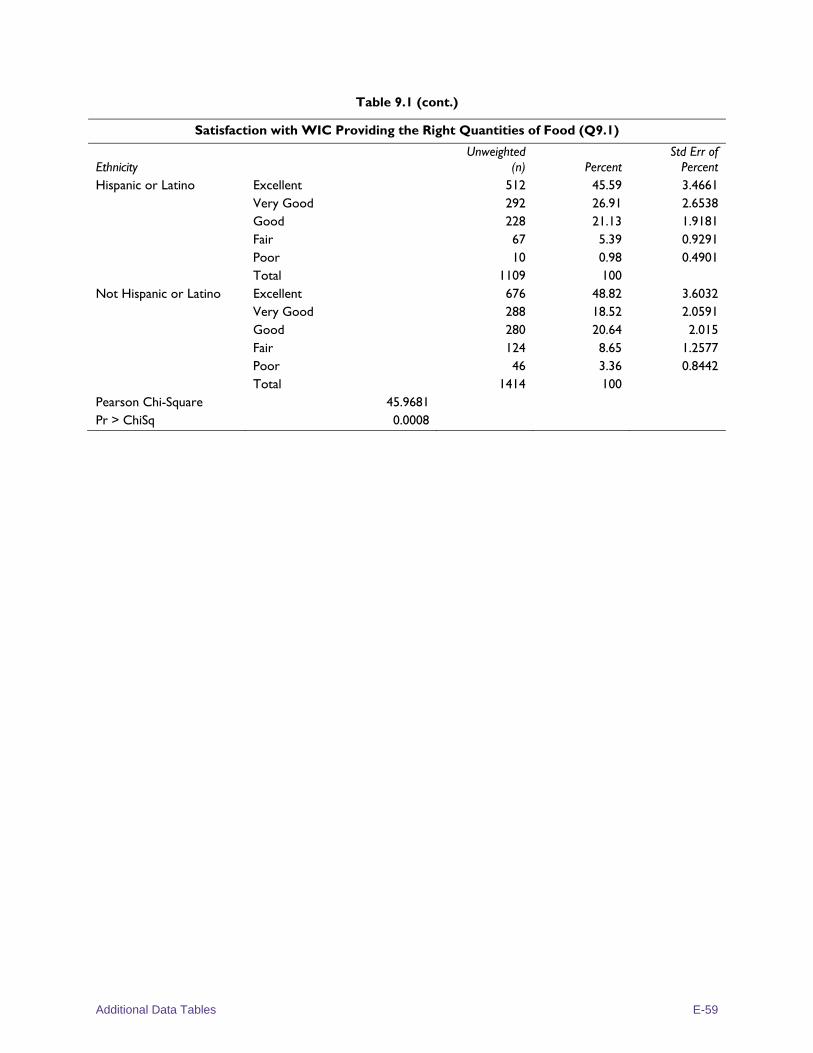
Additional Data Tables E-59
Table 9.1 (cont.)
Satisfaction with WIC Providing the Right Quantities of Food (Q9.1)
Ethnicity Unweighted
(n) Percent Std Err of
Percent Hispanic or Latino Excellent 512 45.59 3.4661
Very Good 292 26.91 2.6538 Good 228 21.13 1.9181 Fair 67 5.39 0.9291 Poor 10 0.98 0.4901 Total 1109 100
Not Hispanic or Latino Excellent 676 48.82 3.6032 Very Good 288 18.52 2.0591 Good 280 20.64 2.015 Fair 124 8.65 1.2577 Poor 46 3.36 0.8442 Total 1414 100
Pearson Chi-Square 45.9681 Pr > ChiSq 0.0008
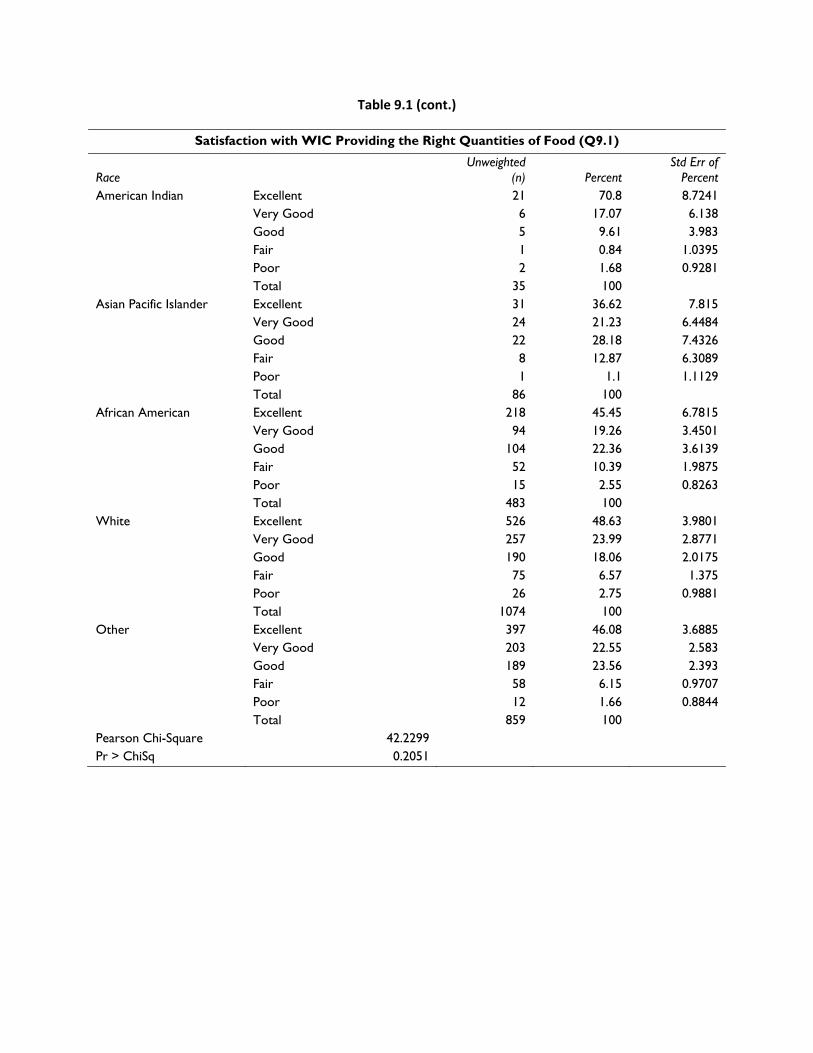
Table 9.1 (cont.)
Satisfaction with WIC Providing the Right Quantities of Food (Q9.1)
Race Unweighted
(n) Percent Std Err of
Percent American Indian Excellent 21 70.8 8.7241
Very Good 6 17.07 6.138 Good 5 9.61 3.983 Fair 1 0.84 1.0395 Poor 2 1.68 0.9281 Total 35 100
Asian Pacific Islander Excellent 31 36.62 7.815 Very Good 24 21.23 6.4484 Good 22 28.18 7.4326 Fair 8 12.87 6.3089 Poor 1 1.1 1.1129 Total 86 100
African American Excellent 218 45.45 6.7815 Very Good 94 19.26 3.4501 Good 104 22.36 3.6139 Fair 52 10.39 1.9875 Poor 15 2.55 0.8263 Total 483 100
White Excellent 526 48.63 3.9801 Very Good 257 23.99 2.8771 Good 190 18.06 2.0175 Fair 75 6.57 1.375 Poor 26 2.75 0.9881 Total 1074 100
Other Excellent 397 46.08 3.6885 Very Good 203 22.55 2.583 Good 189 23.56 2.393 Fair 58 6.15 0.9707 Poor 12 1.66 0.8844 Total 859 100
Pearson Chi-Square 42.2299 Pr > ChiSq 0.2051
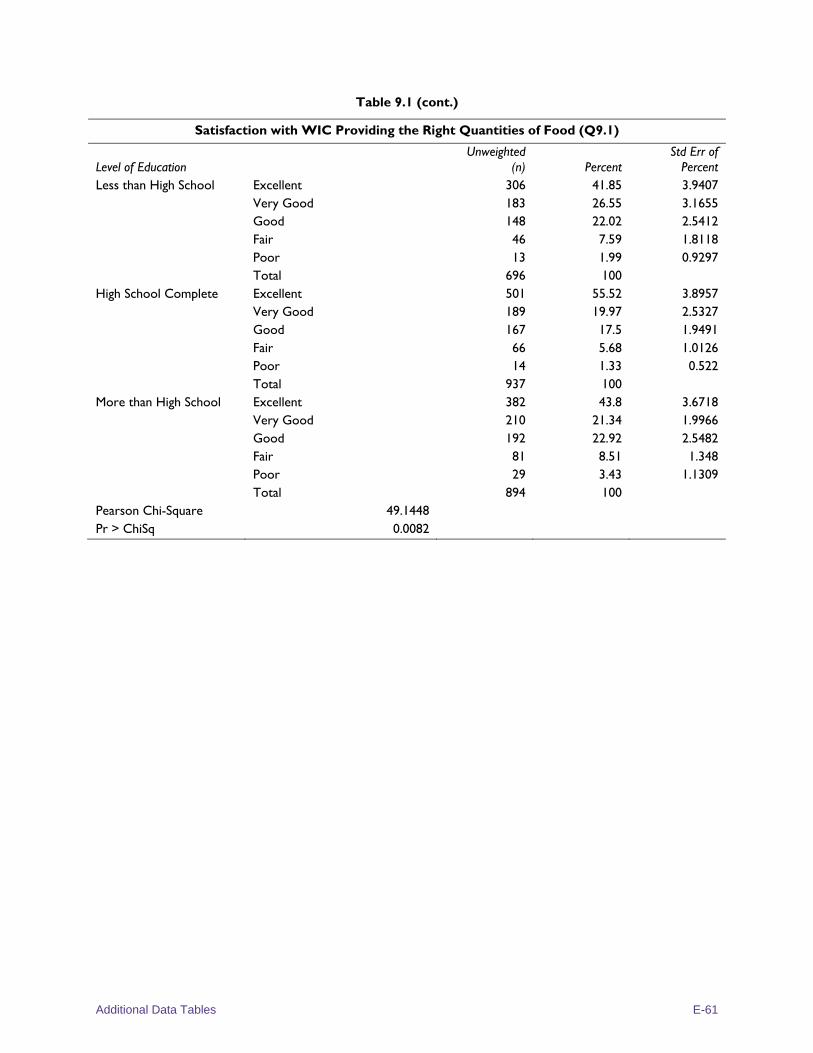
Additional Data Tables E-61
Table 9.1 (cont.)
Satisfaction with WIC Providing the Right Quantities of Food (Q9.1)
Level of Education Unweighted
(n) Percent Std Err of
Percent Less than High School Excellent 306 41.85 3.9407
Very Good 183 26.55 3.1655 Good 148 22.02 2.5412 Fair 46 7.59 1.8118 Poor 13 1.99 0.9297 Total 696 100
High School Complete Excellent 501 55.52 3.8957 Very Good 189 19.97 2.5327 Good 167 17.5 1.9491 Fair 66 5.68 1.0126 Poor 14 1.33 0.522 Total 937 100
More than High School Excellent 382 43.8 3.6718 Very Good 210 21.34 1.9966 Good 192 22.92 2.5482 Fair 81 8.51 1.348 Poor 29 3.43 1.1309 Total 894 100
Pearson Chi-Square 49.1448 Pr > ChiSq 0.0082
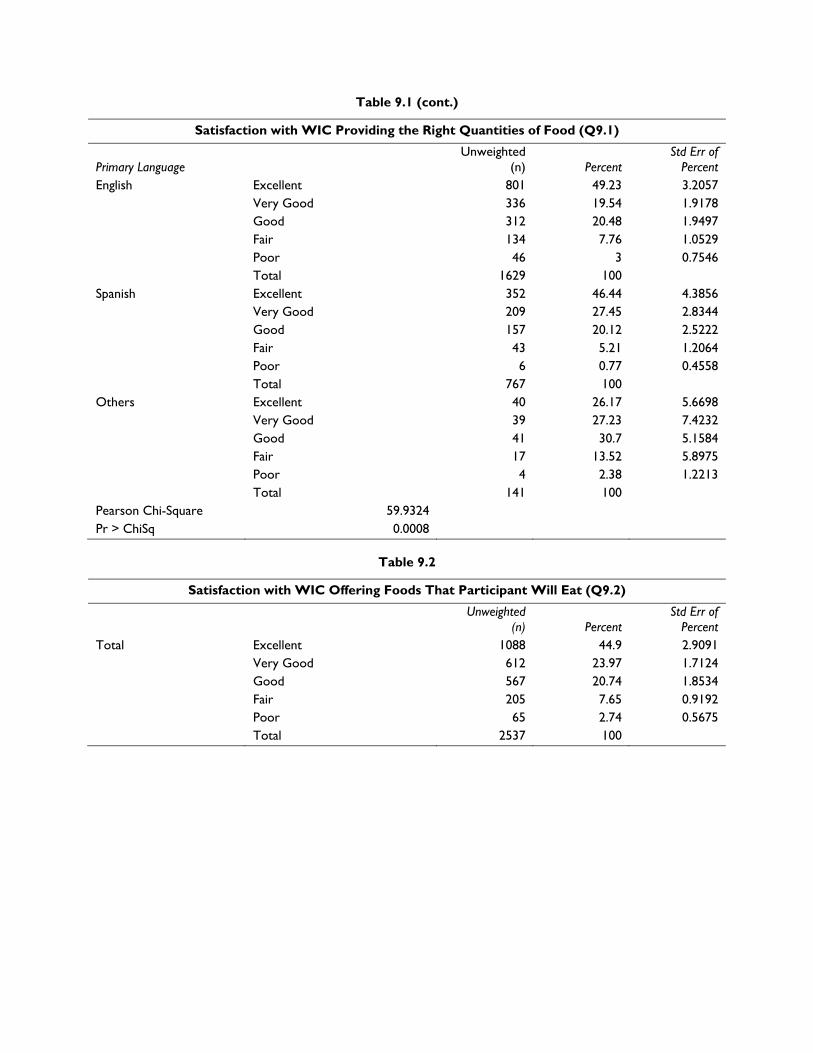
Table 9.1 (cont.)
Satisfaction with WIC Providing the Right Quantities of Food (Q9.1)
Primary Language Unweighted
(n) Percent Std Err of
Percent English Excellent 801 49.23 3.2057
Very Good 336 19.54 1.9178 Good 312 20.48 1.9497 Fair 134 7.76 1.0529 Poor 46 3 0.7546 Total 1629 100
Spanish Excellent 352 46.44 4.3856 Very Good 209 27.45 2.8344 Good 157 20.12 2.5222 Fair 43 5.21 1.2064 Poor 6 0.77 0.4558 Total 767 100
Others Excellent 40 26.17 5.6698 Very Good 39 27.23 7.4232 Good 41 30.7 5.1584 Fair 17 13.52 5.8975 Poor 4 2.38 1.2213 Total 141 100
Pearson Chi-Square 59.9324 Pr > ChiSq 0.0008
Table 9.2
Satisfaction with WIC Offering Foods That Participant Will Eat (Q9.2)
Unweighted (n) Percent
Std Err of Percent
Total Excellent 1088 44.9 2.9091 Very Good 612 23.97 1.7124 Good 567 20.74 1.8534 Fair 205 7.65 0.9192 Poor 65 2.74 0.5675 Total 2537 100
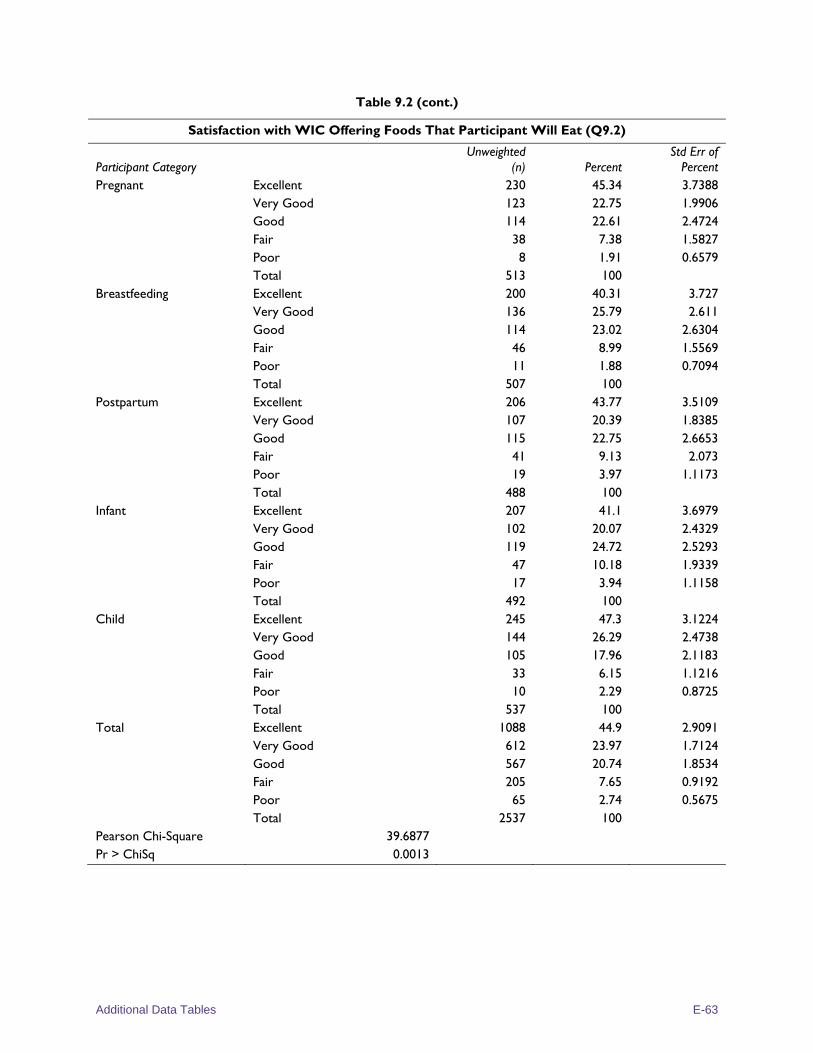
Additional Data Tables E-63
Table 9.2 (cont.)
Satisfaction with WIC Offering Foods That Participant Will Eat (Q9.2)
Participant Category Unweighted
(n) Percent Std Err of
Percent Pregnant Excellent 230 45.34 3.7388
Very Good 123 22.75 1.9906 Good 114 22.61 2.4724 Fair 38 7.38 1.5827 Poor 8 1.91 0.6579 Total 513 100
Breastfeeding Excellent 200 40.31 3.727 Very Good 136 25.79 2.611 Good 114 23.02 2.6304 Fair 46 8.99 1.5569 Poor 11 1.88 0.7094 Total 507 100
Postpartum Excellent 206 43.77 3.5109 Very Good 107 20.39 1.8385 Good 115 22.75 2.6653 Fair 41 9.13 2.073 Poor 19 3.97 1.1173 Total 488 100
Infant Excellent 207 41.1 3.6979 Very Good 102 20.07 2.4329 Good 119 24.72 2.5293 Fair 47 10.18 1.9339 Poor 17 3.94 1.1158 Total 492 100
Child Excellent 245 47.3 3.1224 Very Good 144 26.29 2.4738 Good 105 17.96 2.1183 Fair 33 6.15 1.1216 Poor 10 2.29 0.8725 Total 537 100
Total Excellent 1088 44.9 2.9091 Very Good 612 23.97 1.7124 Good 567 20.74 1.8534 Fair 205 7.65 0.9192 Poor 65 2.74 0.5675 Total 2537 100
Pearson Chi-Square 39.6877 Pr > ChiSq 0.0013
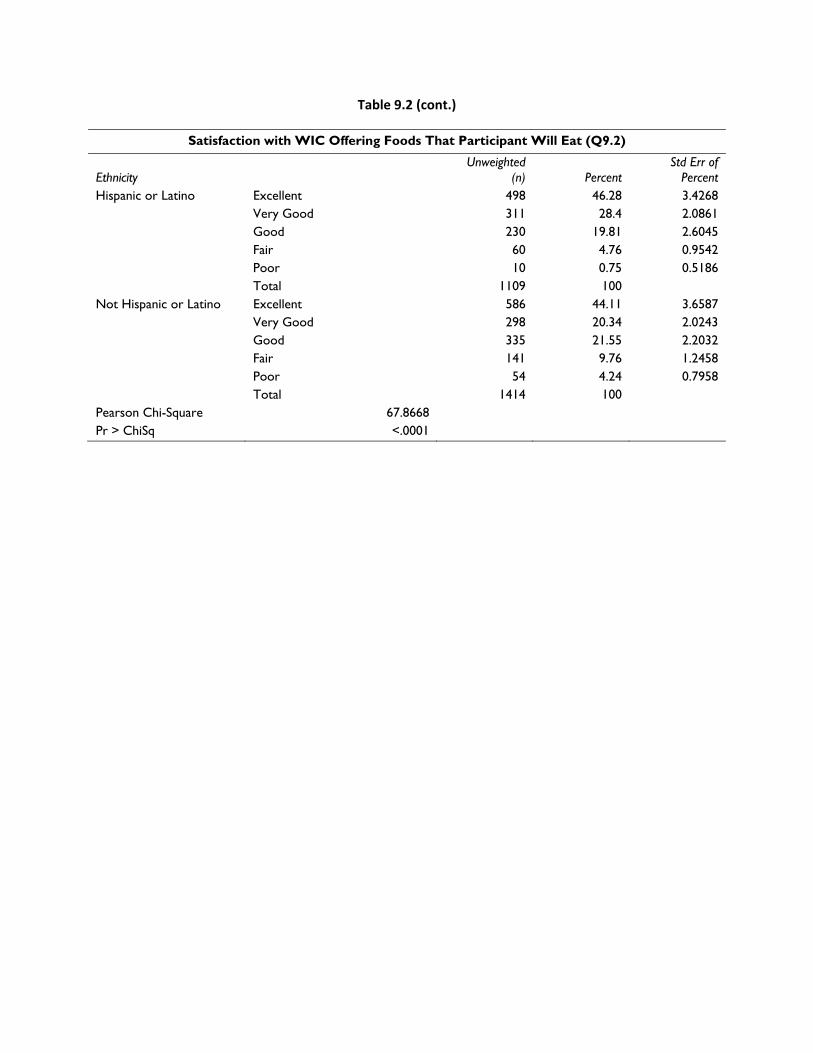
Table 9.2 (cont.)
Satisfaction with WIC Offering Foods That Participant Will Eat (Q9.2)
Ethnicity Unweighted
(n) Percent Std Err of
Percent Hispanic or Latino Excellent 498 46.28 3.4268
Very Good 311 28.4 2.0861 Good 230 19.81 2.6045 Fair 60 4.76 0.9542 Poor 10 0.75 0.5186 Total 1109 100
Not Hispanic or Latino Excellent 586 44.11 3.6587 Very Good 298 20.34 2.0243 Good 335 21.55 2.2032 Fair 141 9.76 1.2458 Poor 54 4.24 0.7958 Total 1414 100
Pearson Chi-Square 67.8668 Pr > ChiSq <.0001
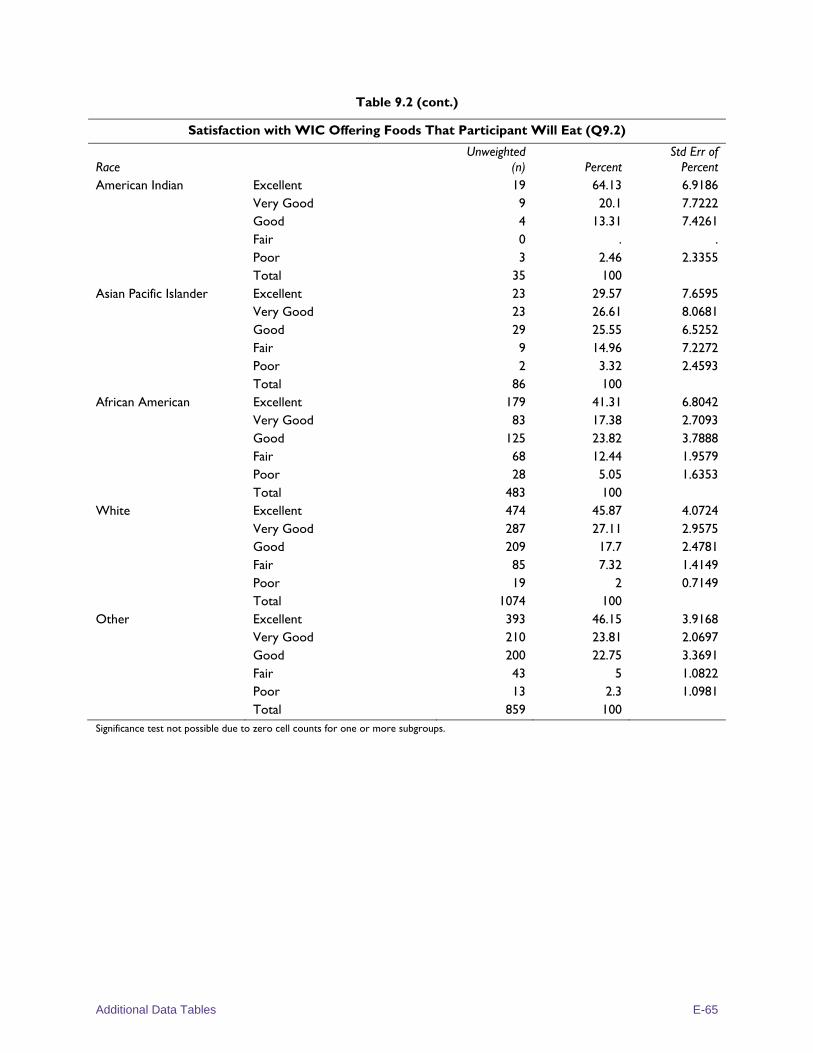
Additional Data Tables E-65
Table 9.2 (cont.)
Satisfaction with WIC Offering Foods That Participant Will Eat (Q9.2)
Race Unweighted
(n) Percent Std Err of
Percent American Indian Excellent 19 64.13 6.9186
Very Good 9 20.1 7.7222 Good 4 13.31 7.4261 Fair 0 . . Poor 3 2.46 2.3355 Total 35 100
Asian Pacific Islander Excellent 23 29.57 7.6595 Very Good 23 26.61 8.0681 Good 29 25.55 6.5252 Fair 9 14.96 7.2272 Poor 2 3.32 2.4593 Total 86 100
African American Excellent 179 41.31 6.8042 Very Good 83 17.38 2.7093 Good 125 23.82 3.7888 Fair 68 12.44 1.9579 Poor 28 5.05 1.6353 Total 483 100
White Excellent 474 45.87 4.0724 Very Good 287 27.11 2.9575 Good 209 17.7 2.4781 Fair 85 7.32 1.4149 Poor 19 2 0.7149 Total 1074 100
Other Excellent 393 46.15 3.9168 Very Good 210 23.81 2.0697 Good 200 22.75 3.3691 Fair 43 5 1.0822 Poor 13 2.3 1.0981 Total 859 100
Significance test not possible due to zero cell counts for one or more subgroups.
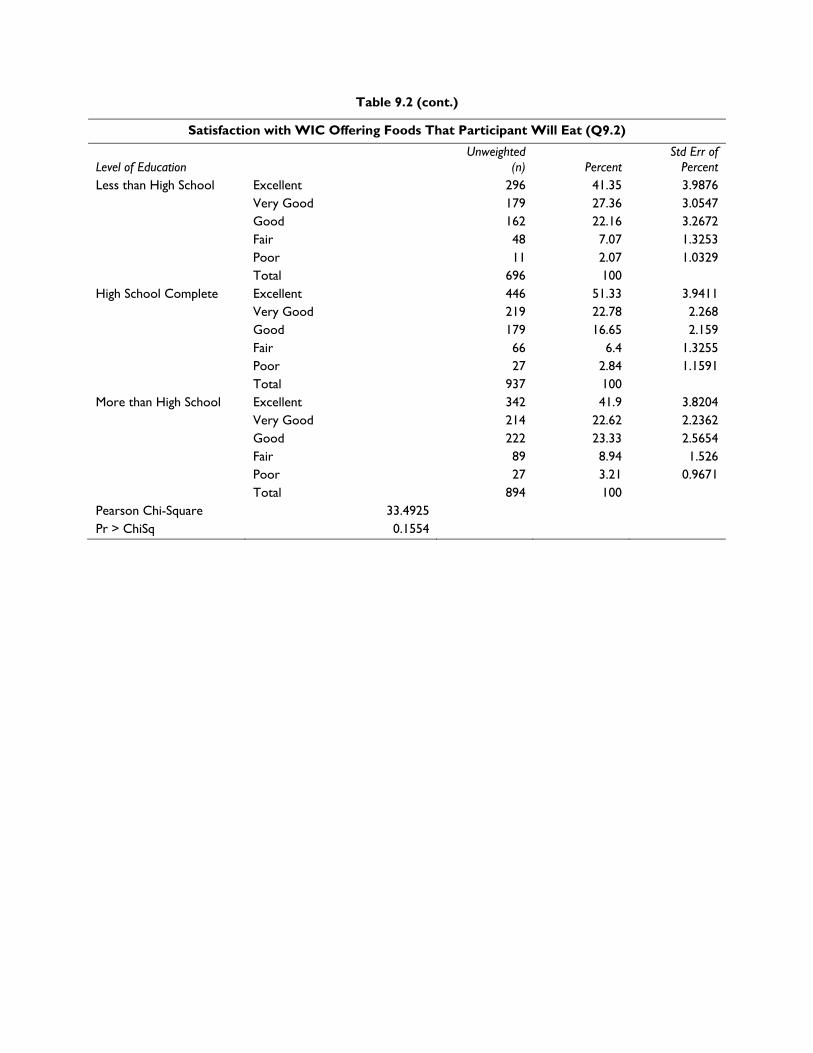
Table 9.2 (cont.)
Satisfaction with WIC Offering Foods That Participant Will Eat (Q9.2)
Level of Education Unweighted
(n) Percent Std Err of
Percent Less than High School Excellent 296 41.35 3.9876
Very Good 179 27.36 3.0547 Good 162 22.16 3.2672 Fair 48 7.07 1.3253 Poor 11 2.07 1.0329 Total 696 100
High School Complete Excellent 446 51.33 3.9411 Very Good 219 22.78 2.268 Good 179 16.65 2.159 Fair 66 6.4 1.3255 Poor 27 2.84 1.1591 Total 937 100
More than High School Excellent 342 41.9 3.8204 Very Good 214 22.62 2.2362 Good 222 23.33 2.5654 Fair 89 8.94 1.526 Poor 27 3.21 0.9671 Total 894 100
Pearson Chi-Square 33.4925 Pr > ChiSq 0.1554
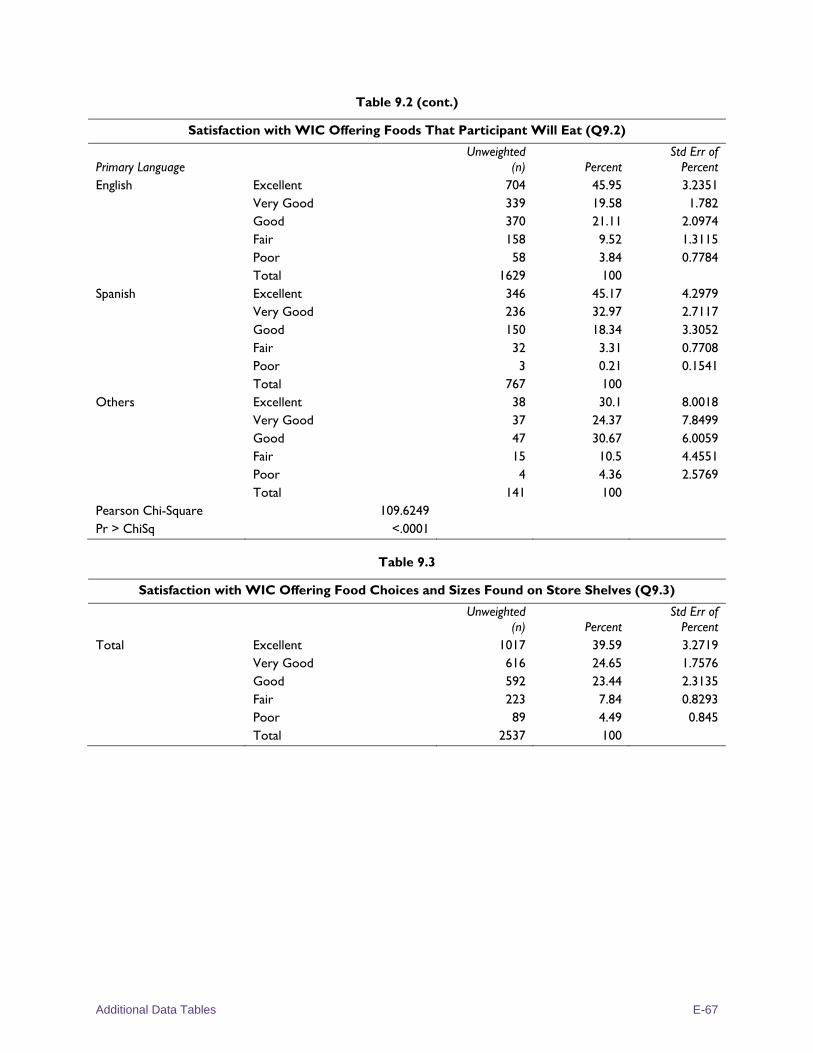
Additional Data Tables E-67
Table 9.2 (cont.)
Satisfaction with WIC Offering Foods That Participant Will Eat (Q9.2)
Primary Language Unweighted
(n) Percent Std Err of
Percent English Excellent 704 45.95 3.2351
Very Good 339 19.58 1.782 Good 370 21.11 2.0974 Fair 158 9.52 1.3115 Poor 58 3.84 0.7784 Total 1629 100
Spanish Excellent 346 45.17 4.2979 Very Good 236 32.97 2.7117 Good 150 18.34 3.3052 Fair 32 3.31 0.7708 Poor 3 0.21 0.1541 Total 767 100
Others Excellent 38 30.1 8.0018 Very Good 37 24.37 7.8499 Good 47 30.67 6.0059 Fair 15 10.5 4.4551 Poor 4 4.36 2.5769 Total 141 100
Pearson Chi-Square 109.6249 Pr > ChiSq <.0001
Table 9.3
Satisfaction with WIC Offering Food Choices and Sizes Found on Store Shelves (Q9.3)
Unweighted (n) Percent
Std Err of Percent
Total Excellent 1017 39.59 3.2719 Very Good 616 24.65 1.7576 Good 592 23.44 2.3135 Fair 223 7.84 0.8293 Poor 89 4.49 0.845 Total 2537 100

Table 9.3 (cont.)
Satisfaction with WIC Offering Food Choices and Sizes Found on Store Shelves (Q9.3)
Participant Category Unweighted
(n) Percent Std Err of
Percent Pregnant Excellent 230 45.46 3.7226
Very Good 105 19.97 2.1032 Good 115 21.73 2.4634 Fair 45 8.97 1.6484 Poor 18 3.88 0.9637 Total 513 100
Breastfeeding Excellent 185 36.22 3.5428 Very Good 135 26.89 2.5433 Good 115 22.55 2.8643 Fair 58 11.42 1.8215 Poor 14 2.92 0.9098 Total 507 100
Postpartum Excellent 187 39.5 4.1312 Very Good 118 23.68 3.1532 Good 122 23.29 2.4475 Fair 46 10.14 1.7788 Poor 15 3.39 0.9747 Total 488 100
Infant Excellent 204 39.2 3.7111 Very Good 114 23.45 2.4522 Good 113 24.77 2.7311 Fair 41 8.32 1.5074 Poor 20 4.26 1.4174 Total 492 100
Child Excellent 211 39.01 3.7678 Very Good 144 26 2.5744 Good 127 23.29 2.9856 Fair 33 6.63 1.1822 Poor 22 5.06 1.3008 Total 537 100
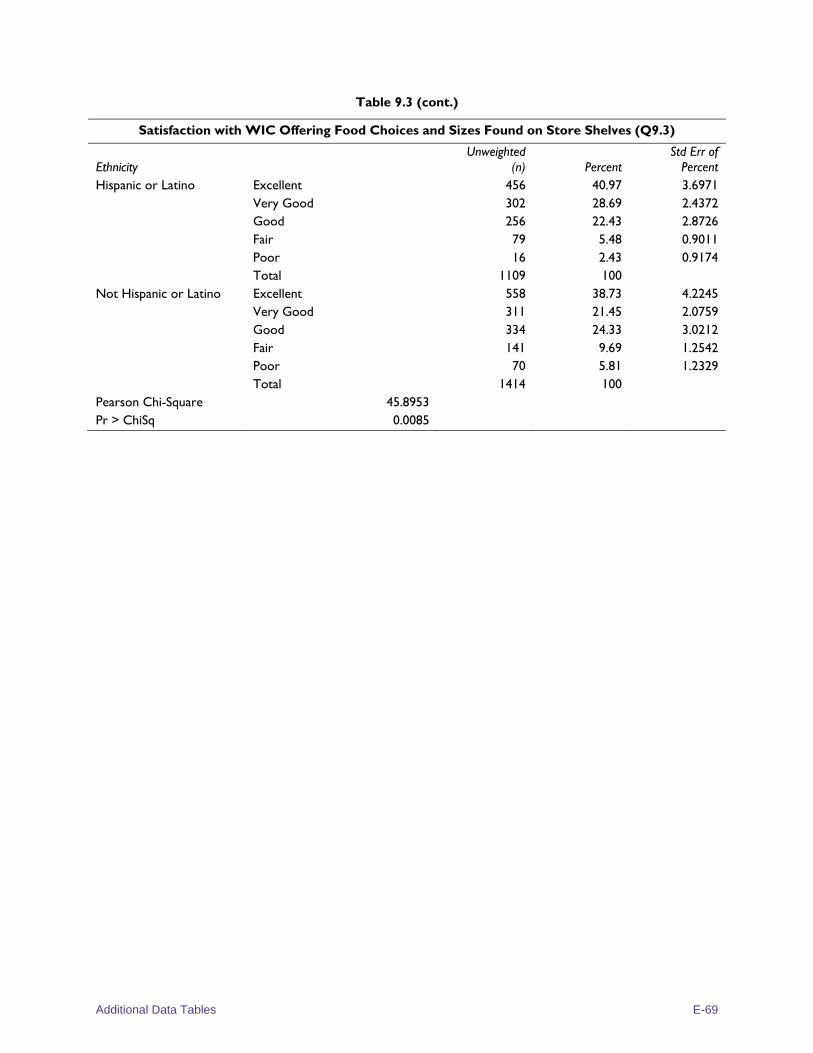
Additional Data Tables E-69
Table 9.3 (cont.)
Satisfaction with WIC Offering Food Choices and Sizes Found on Store Shelves (Q9.3)
Ethnicity Unweighted
(n) Percent Std Err of
Percent Hispanic or Latino Excellent 456 40.97 3.6971
Very Good 302 28.69 2.4372 Good 256 22.43 2.8726 Fair 79 5.48 0.9011 Poor 16 2.43 0.9174 Total 1109 100
Not Hispanic or Latino Excellent 558 38.73 4.2245 Very Good 311 21.45 2.0759 Good 334 24.33 3.0212 Fair 141 9.69 1.2542 Poor 70 5.81 1.2329 Total 1414 100
Pearson Chi-Square 45.8953 Pr > ChiSq 0.0085
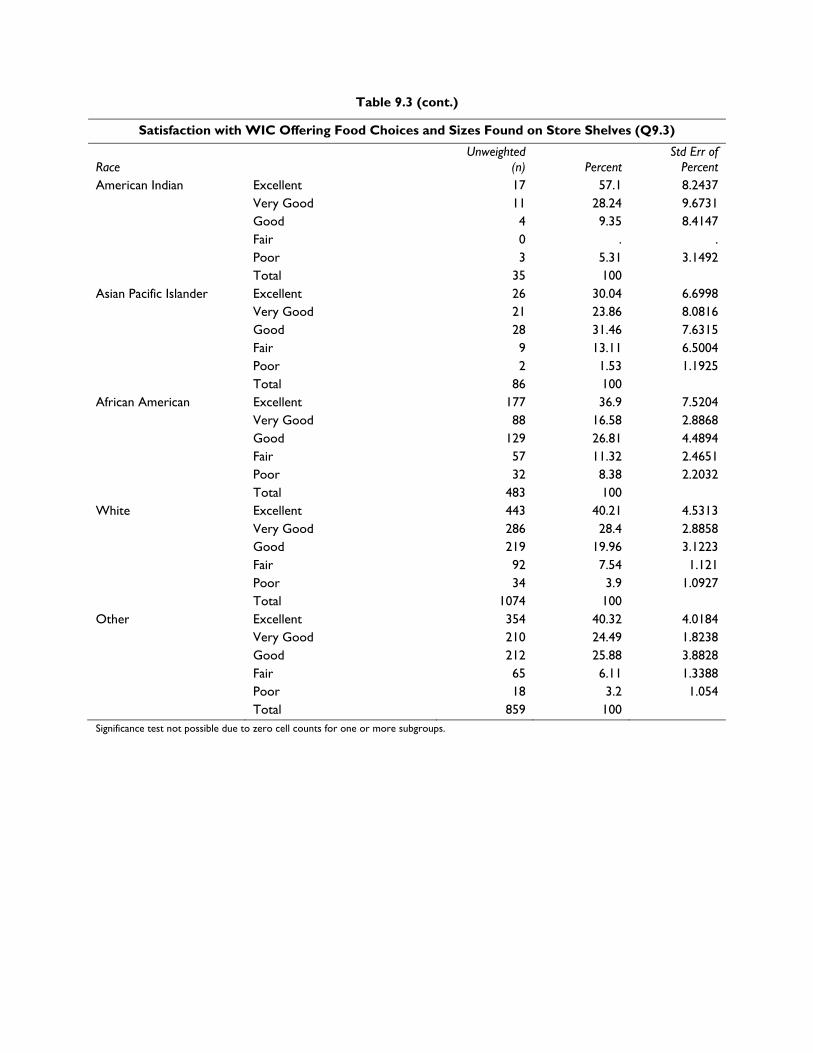
Table 9.3 (cont.)
Satisfaction with WIC Offering Food Choices and Sizes Found on Store Shelves (Q9.3)
Race Unweighted
(n) Percent Std Err of
Percent American Indian Excellent 17 57.1 8.2437
Very Good 11 28.24 9.6731 Good 4 9.35 8.4147 Fair 0 . . Poor 3 5.31 3.1492 Total 35 100
Asian Pacific Islander Excellent 26 30.04 6.6998 Very Good 21 23.86 8.0816 Good 28 31.46 7.6315 Fair 9 13.11 6.5004 Poor 2 1.53 1.1925 Total 86 100
African American Excellent 177 36.9 7.5204 Very Good 88 16.58 2.8868 Good 129 26.81 4.4894 Fair 57 11.32 2.4651 Poor 32 8.38 2.2032 Total 483 100
White Excellent 443 40.21 4.5313 Very Good 286 28.4 2.8858 Good 219 19.96 3.1223 Fair 92 7.54 1.121 Poor 34 3.9 1.0927 Total 1074 100
Other Excellent 354 40.32 4.0184 Very Good 210 24.49 1.8238 Good 212 25.88 3.8828 Fair 65 6.11 1.3388 Poor 18 3.2 1.054 Total 859 100
Significance test not possible due to zero cell counts for one or more subgroups.
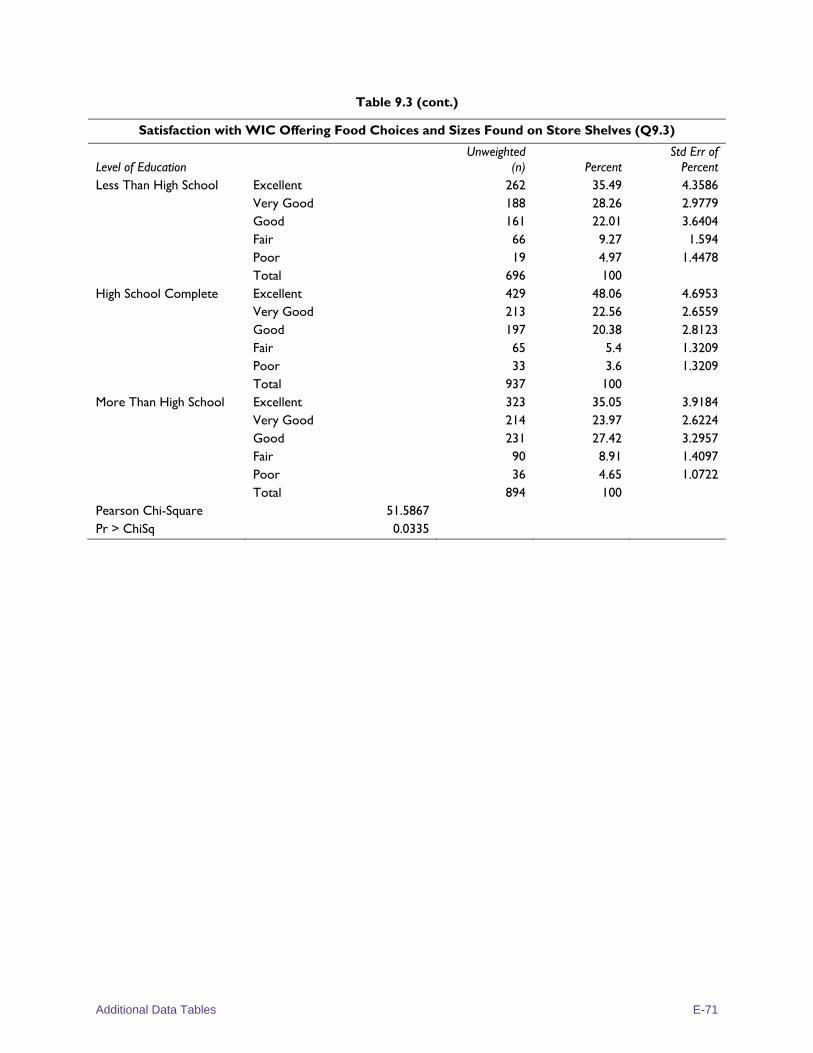
Additional Data Tables E-71
Table 9.3 (cont.)
Satisfaction with WIC Offering Food Choices and Sizes Found on Store Shelves (Q9.3)
Level of Education Unweighted
(n) Percent Std Err of
Percent Less Than High School Excellent 262 35.49 4.3586
Very Good 188 28.26 2.9779 Good 161 22.01 3.6404 Fair 66 9.27 1.594 Poor 19 4.97 1.4478 Total 696 100
High School Complete Excellent 429 48.06 4.6953 Very Good 213 22.56 2.6559 Good 197 20.38 2.8123 Fair 65 5.4 1.3209 Poor 33 3.6 1.3209 Total 937 100
More Than High School Excellent 323 35.05 3.9184 Very Good 214 23.97 2.6224 Good 231 27.42 3.2957 Fair 90 8.91 1.4097 Poor 36 4.65 1.0722 Total 894 100
Pearson Chi-Square 51.5867 Pr > ChiSq 0.0335
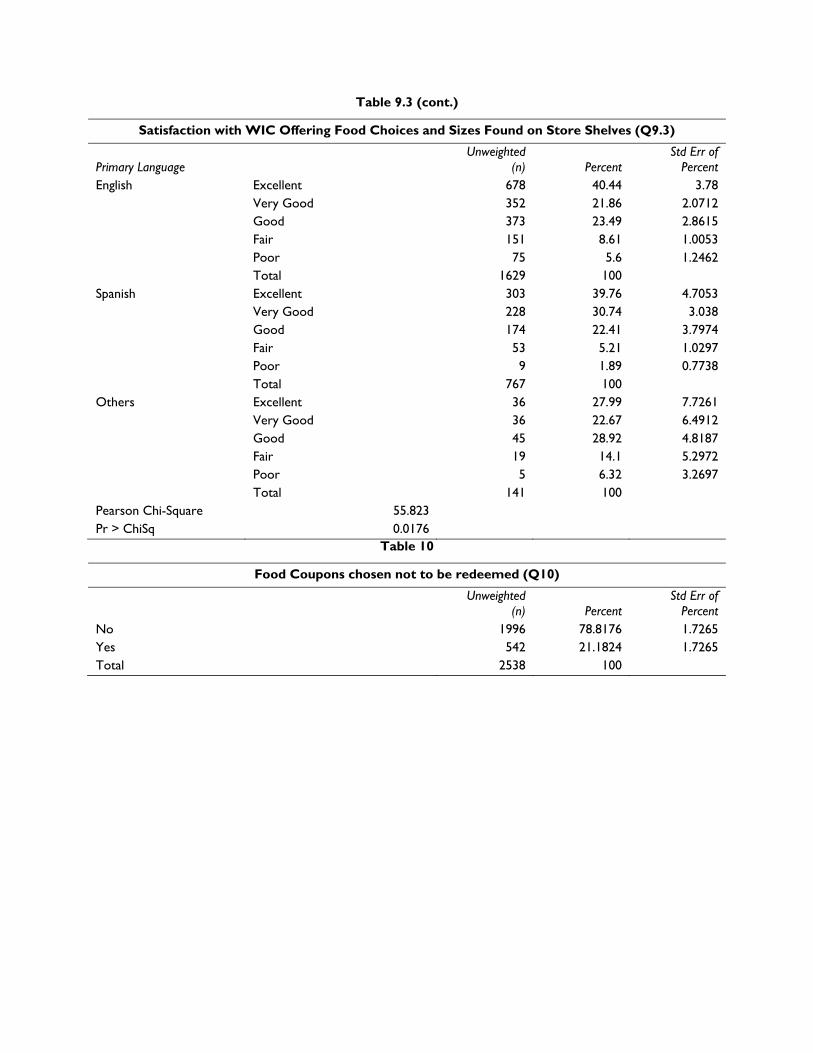
Table 9.3 (cont.)
Satisfaction with WIC Offering Food Choices and Sizes Found on Store Shelves (Q9.3)
Primary Language Unweighted
(n) Percent Std Err of
Percent English Excellent 678 40.44 3.78
Very Good 352 21.86 2.0712 Good 373 23.49 2.8615 Fair 151 8.61 1.0053 Poor 75 5.6 1.2462 Total 1629 100
Spanish Excellent 303 39.76 4.7053 Very Good 228 30.74 3.038 Good 174 22.41 3.7974 Fair 53 5.21 1.0297 Poor 9 1.89 0.7738 Total 767 100
Others Excellent 36 27.99 7.7261 Very Good 36 22.67 6.4912 Good 45 28.92 4.8187 Fair 19 14.1 5.2972 Poor 5 6.32 3.2697 Total 141 100
Pearson Chi-Square 55.823 Pr > ChiSq 0.0176
Table 10
Food Coupons chosen not to be redeemed (Q10)
Unweighted (n) Percent
Std Err of Percent
No 1996 78.8176 1.7265 Yes 542 21.1824 1.7265 Total 2538 100
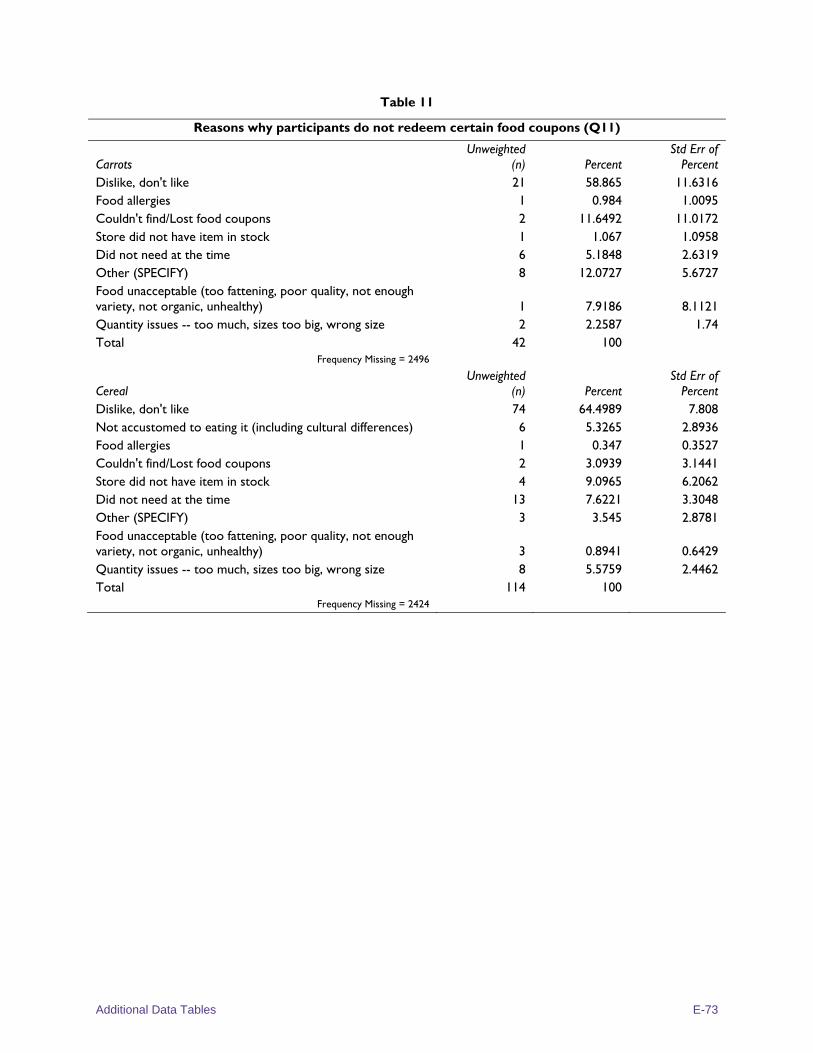
Additional Data Tables E-73
Table 11
Reasons why participants do not redeem certain food coupons (Q11)
Carrots Unweighted
(n) Percent Std Err of
Percent Dislike, don't like 21 58.865 11.6316 Food allergies 1 0.984 1.0095 Couldn't find/Lost food coupons 2 11.6492 11.0172 Store did not have item in stock 1 1.067 1.0958 Did not need at the time 6 5.1848 2.6319 Other (SPECIFY) 8 12.0727 5.6727 Food unacceptable (too fattening, poor quality, not enough variety, not organic, unhealthy) 1 7.9186 8.1121 Quantity issues -- too much, sizes too big, wrong size 2 2.2587 1.74 Total 42 100
Frequency Missing = 2496
Cereal Unweighted
(n) Percent Std Err of
Percent Dislike, don't like 74 64.4989 7.808 Not accustomed to eating it (including cultural differences) 6 5.3265 2.8936 Food allergies 1 0.347 0.3527 Couldn't find/Lost food coupons 2 3.0939 3.1441 Store did not have item in stock 4 9.0965 6.2062 Did not need at the time 13 7.6221 3.3048 Other (SPECIFY) 3 3.545 2.8781 Food unacceptable (too fattening, poor quality, not enough variety, not organic, unhealthy) 3 0.8941 0.6429 Quantity issues -- too much, sizes too big, wrong size 8 5.5759 2.4462 Total 114 100
Frequency Missing = 2424
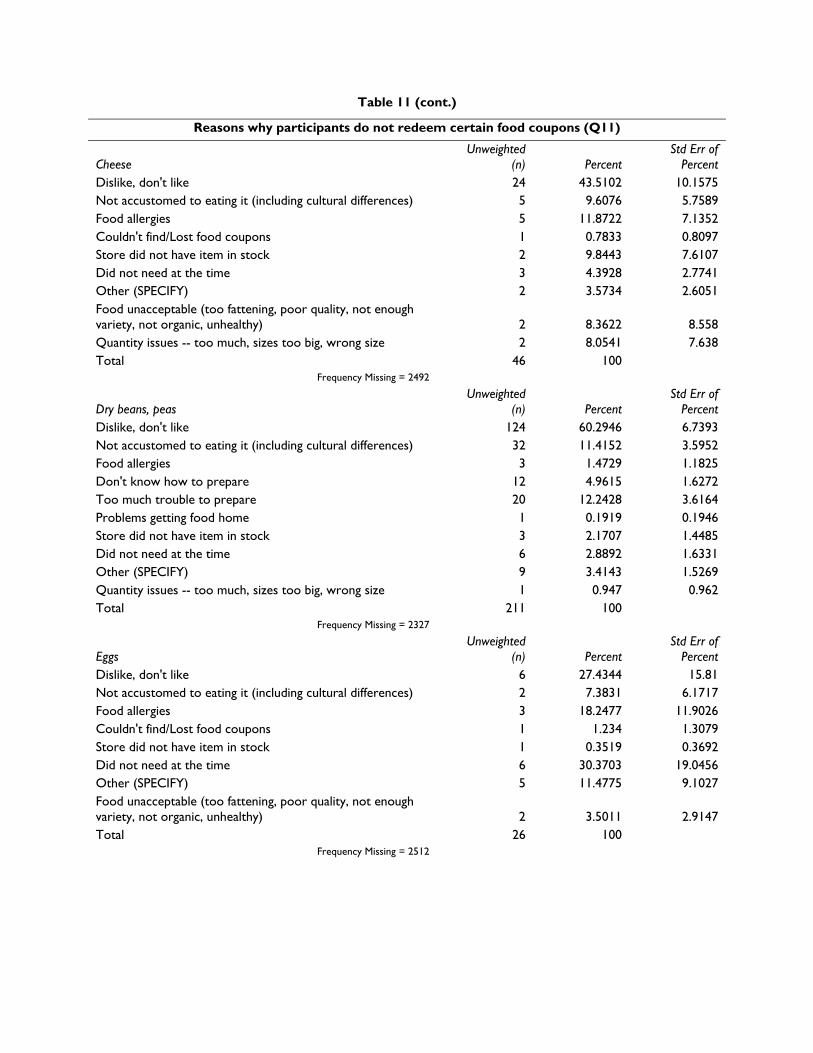
Table 11 (cont.)
Reasons why participants do not redeem certain food coupons (Q11)
Cheese Unweighted
(n) Percent Std Err of
Percent Dislike, don't like 24 43.5102 10.1575 Not accustomed to eating it (including cultural differences) 5 9.6076 5.7589 Food allergies 5 11.8722 7.1352 Couldn't find/Lost food coupons 1 0.7833 0.8097 Store did not have item in stock 2 9.8443 7.6107 Did not need at the time 3 4.3928 2.7741 Other (SPECIFY) 2 3.5734 2.6051 Food unacceptable (too fattening, poor quality, not enough variety, not organic, unhealthy) 2 8.3622 8.558 Quantity issues -- too much, sizes too big, wrong size 2 8.0541 7.638 Total 46 100
Frequency Missing = 2492
Dry beans, peas Unweighted
(n) Percent Std Err of
Percent Dislike, don't like 124 60.2946 6.7393 Not accustomed to eating it (including cultural differences) 32 11.4152 3.5952 Food allergies 3 1.4729 1.1825 Don't know how to prepare 12 4.9615 1.6272 Too much trouble to prepare 20 12.2428 3.6164 Problems getting food home 1 0.1919 0.1946 Store did not have item in stock 3 2.1707 1.4485 Did not need at the time 6 2.8892 1.6331 Other (SPECIFY) 9 3.4143 1.5269 Quantity issues -- too much, sizes too big, wrong size 1 0.947 0.962 Total 211 100
Frequency Missing = 2327
Eggs Unweighted
(n) Percent Std Err of
Percent Dislike, don't like 6 27.4344 15.81 Not accustomed to eating it (including cultural differences) 2 7.3831 6.1717 Food allergies 3 18.2477 11.9026 Couldn't find/Lost food coupons 1 1.234 1.3079 Store did not have item in stock 1 0.3519 0.3692 Did not need at the time 6 30.3703 19.0456 Other (SPECIFY) 5 11.4775 9.1027 Food unacceptable (too fattening, poor quality, not enough variety, not organic, unhealthy) 2 3.5011 2.9147 Total 26 100
Frequency Missing = 2512
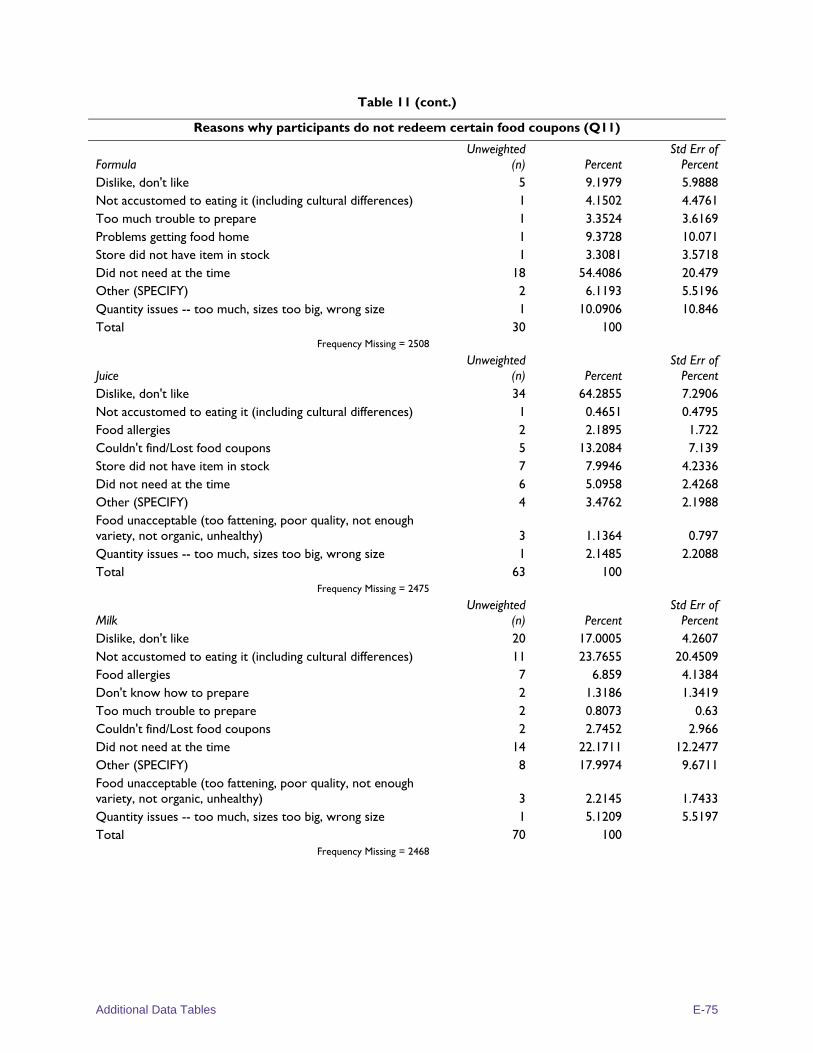
Additional Data Tables E-75
Table 11 (cont.)
Reasons why participants do not redeem certain food coupons (Q11)
Formula Unweighted
(n) Percent Std Err of
Percent Dislike, don't like 5 9.1979 5.9888 Not accustomed to eating it (including cultural differences) 1 4.1502 4.4761 Too much trouble to prepare 1 3.3524 3.6169 Problems getting food home 1 9.3728 10.071 Store did not have item in stock 1 3.3081 3.5718 Did not need at the time 18 54.4086 20.479 Other (SPECIFY) 2 6.1193 5.5196 Quantity issues -- too much, sizes too big, wrong size 1 10.0906 10.846 Total 30 100
Frequency Missing = 2508
Juice Unweighted
(n) Percent Std Err of
Percent Dislike, don't like 34 64.2855 7.2906 Not accustomed to eating it (including cultural differences) 1 0.4651 0.4795 Food allergies 2 2.1895 1.722 Couldn't find/Lost food coupons 5 13.2084 7.139 Store did not have item in stock 7 7.9946 4.2336 Did not need at the time 6 5.0958 2.4268 Other (SPECIFY) 4 3.4762 2.1988 Food unacceptable (too fattening, poor quality, not enough variety, not organic, unhealthy) 3 1.1364 0.797 Quantity issues -- too much, sizes too big, wrong size 1 2.1485 2.2088 Total 63 100
Frequency Missing = 2475
Milk Unweighted
(n) Percent Std Err of
Percent Dislike, don't like 20 17.0005 4.2607 Not accustomed to eating it (including cultural differences) 11 23.7655 20.4509 Food allergies 7 6.859 4.1384 Don't know how to prepare 2 1.3186 1.3419 Too much trouble to prepare 2 0.8073 0.63 Couldn't find/Lost food coupons 2 2.7452 2.966 Did not need at the time 14 22.1711 12.2477 Other (SPECIFY) 8 17.9974 9.6711 Food unacceptable (too fattening, poor quality, not enough variety, not organic, unhealthy) 3 2.2145 1.7433 Quantity issues -- too much, sizes too big, wrong size 1 5.1209 5.5197 Total 70 100
Frequency Missing = 2468
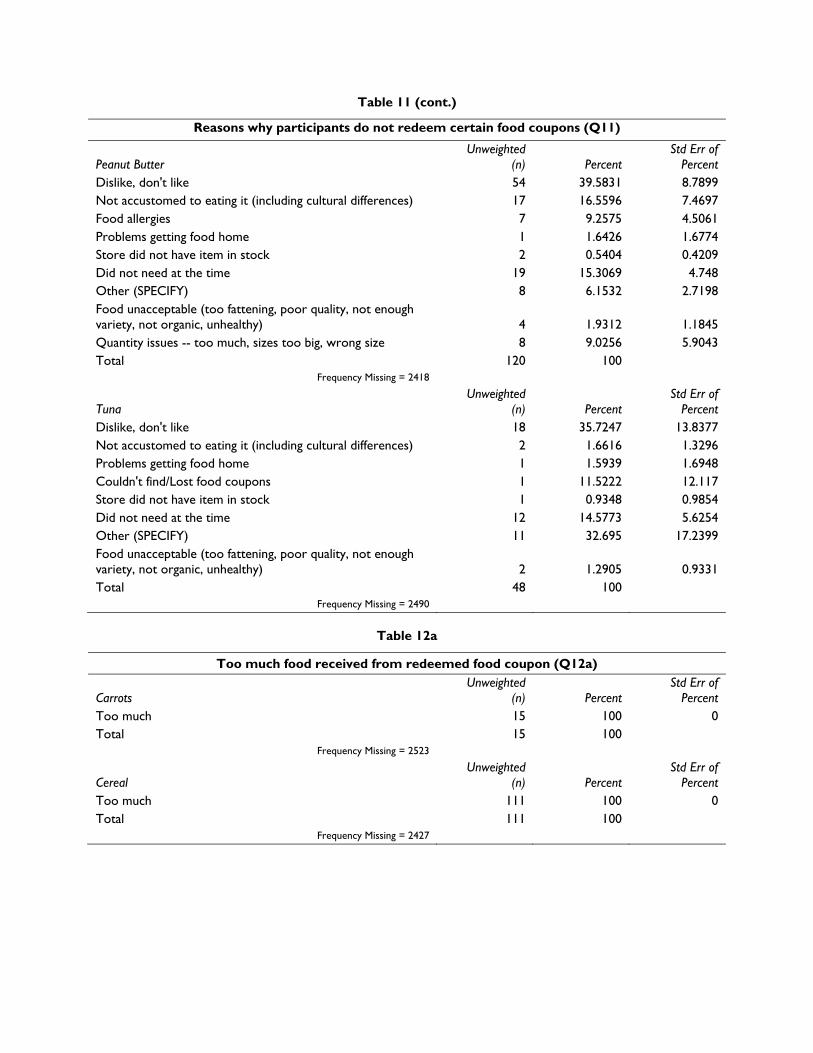
Table 11 (cont.)
Reasons why participants do not redeem certain food coupons (Q11)
Peanut Butter Unweighted
(n) Percent Std Err of
Percent Dislike, don't like 54 39.5831 8.7899 Not accustomed to eating it (including cultural differences) 17 16.5596 7.4697 Food allergies 7 9.2575 4.5061 Problems getting food home 1 1.6426 1.6774 Store did not have item in stock 2 0.5404 0.4209 Did not need at the time 19 15.3069 4.748 Other (SPECIFY) 8 6.1532 2.7198 Food unacceptable (too fattening, poor quality, not enough variety, not organic, unhealthy) 4 1.9312 1.1845 Quantity issues -- too much, sizes too big, wrong size 8 9.0256 5.9043 Total 120 100
Frequency Missing = 2418
Tuna Unweighted
(n) Percent Std Err of
Percent Dislike, don't like 18 35.7247 13.8377 Not accustomed to eating it (including cultural differences) 2 1.6616 1.3296 Problems getting food home 1 1.5939 1.6948 Couldn't find/Lost food coupons 1 11.5222 12.117 Store did not have item in stock 1 0.9348 0.9854 Did not need at the time 12 14.5773 5.6254 Other (SPECIFY) 11 32.695 17.2399 Food unacceptable (too fattening, poor quality, not enough variety, not organic, unhealthy) 2 1.2905 0.9331 Total 48 100
Frequency Missing = 2490
Table 12a
Too much food received from redeemed food coupon (Q12a)
Carrots Unweighted
(n) Percent Std Err of
Percent Too much 15 100 0 Total 15 100
Frequency Missing = 2523
Cereal Unweighted
(n) Percent Std Err of
Percent Too much 111 100 0 Total 111 100
Frequency Missing = 2427
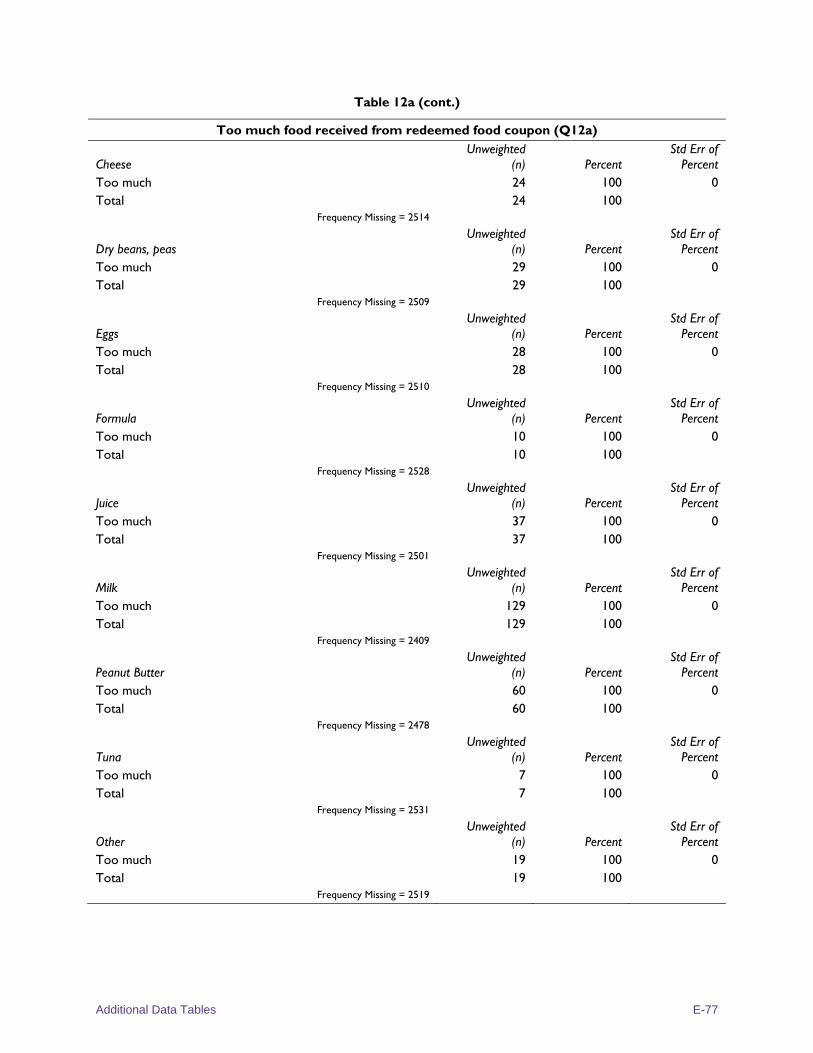
Additional Data Tables E-77
Table 12a (cont.)
Too much food received from redeemed food coupon (Q12a)
Cheese Unweighted
(n) Percent Std Err of
Percent Too much 24 100 0 Total 24 100
Frequency Missing = 2514
Dry beans, peas Unweighted
(n) Percent Std Err of
Percent Too much 29 100 0 Total 29 100
Frequency Missing = 2509
Eggs Unweighted
(n) Percent Std Err of
Percent Too much 28 100 0 Total 28 100
Frequency Missing = 2510
Formula Unweighted
(n) Percent Std Err of
Percent Too much 10 100 0 Total 10 100
Frequency Missing = 2528
Juice Unweighted
(n) Percent Std Err of
Percent Too much 37 100 0 Total 37 100
Frequency Missing = 2501
Milk Unweighted
(n) Percent Std Err of
Percent Too much 129 100 0 Total 129 100
Frequency Missing = 2409
Peanut Butter Unweighted
(n) Percent Std Err of
Percent Too much 60 100 0 Total 60 100
Frequency Missing = 2478
Tuna Unweighted
(n) Percent Std Err of
Percent Too much 7 100 0 Total 7 100
Frequency Missing = 2531
Other Unweighted
(n) Percent Std Err of
Percent Too much 19 100 0 Total 19 100
Frequency Missing = 2519
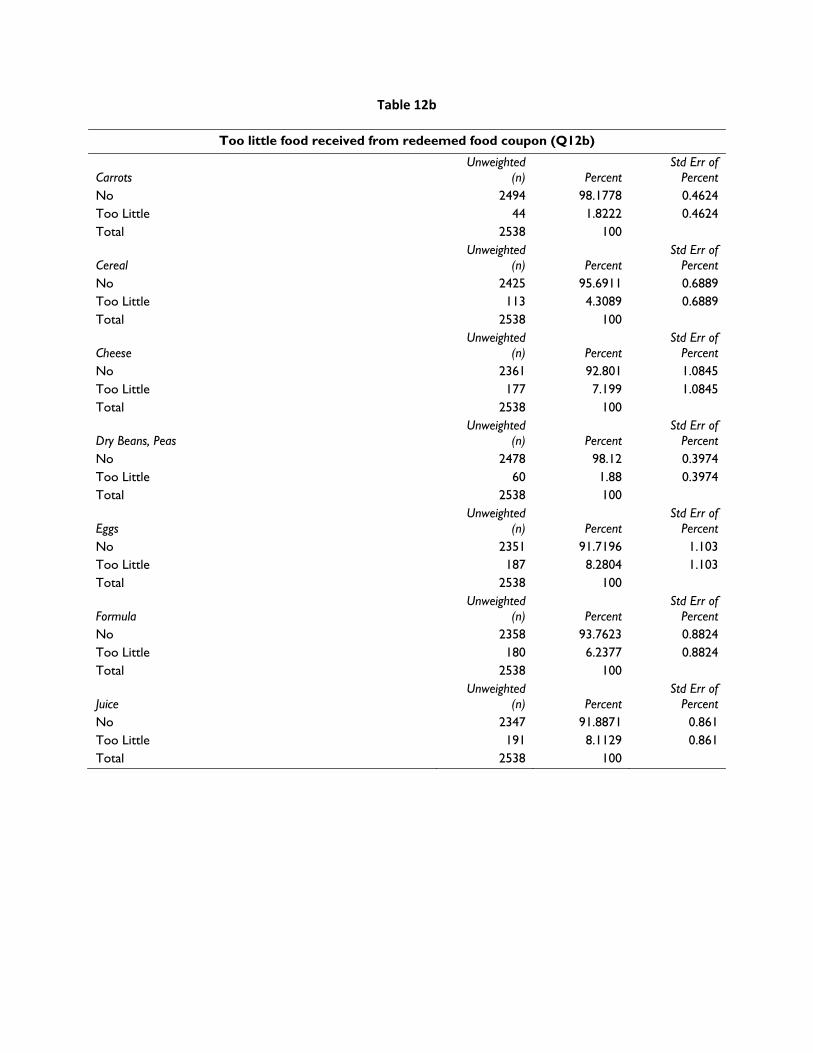
Table 12b
Too little food received from redeemed food coupon (Q12b)
Carrots Unweighted
(n) Percent Std Err of
Percent No 2494 98.1778 0.4624 Too Little 44 1.8222 0.4624 Total 2538 100
Cereal Unweighted
(n) Percent Std Err of
Percent No 2425 95.6911 0.6889 Too Little 113 4.3089 0.6889 Total 2538 100
Cheese Unweighted
(n) Percent Std Err of
Percent No 2361 92.801 1.0845 Too Little 177 7.199 1.0845 Total 2538 100
Dry Beans, Peas Unweighted
(n) Percent Std Err of
Percent No 2478 98.12 0.3974 Too Little 60 1.88 0.3974 Total 2538 100
Eggs Unweighted
(n) Percent Std Err of
Percent No 2351 91.7196 1.103 Too Little 187 8.2804 1.103 Total 2538 100
Formula Unweighted
(n) Percent Std Err of
Percent No 2358 93.7623 0.8824 Too Little 180 6.2377 0.8824 Total 2538 100
Juice Unweighted
(n) Percent Std Err of
Percent No 2347 91.8871 0.861 Too Little 191 8.1129 0.861 Total 2538 100
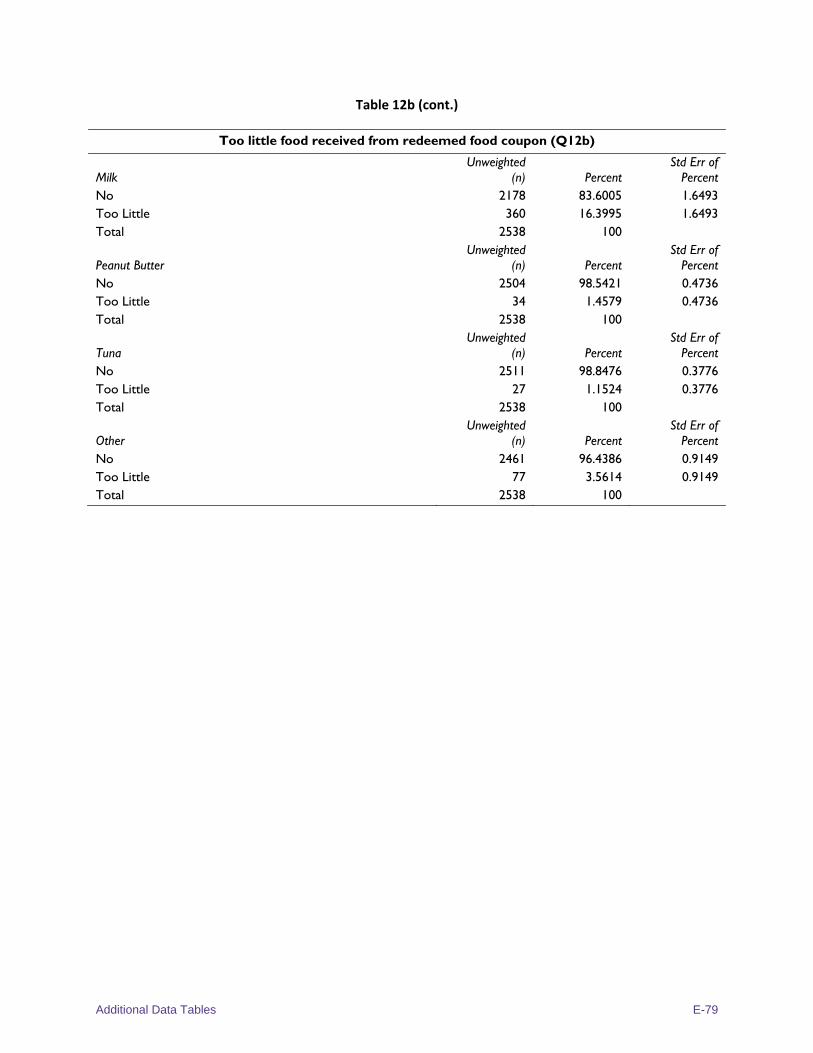
Additional Data Tables E-79
Table 12b (cont.)
Too little food received from redeemed food coupon (Q12b)
Milk Unweighted
(n) Percent Std Err of
Percent No 2178 83.6005 1.6493 Too Little 360 16.3995 1.6493 Total 2538 100
Peanut Butter Unweighted
(n) Percent Std Err of
Percent No 2504 98.5421 0.4736 Too Little 34 1.4579 0.4736 Total 2538 100
Tuna Unweighted
(n) Percent Std Err of
Percent No 2511 98.8476 0.3776 Too Little 27 1.1524 0.3776 Total 2538 100
Other Unweighted
(n) Percent Std Err of
Percent No 2461 96.4386 0.9149 Too Little 77 3.5614 0.9149 Total 2538 100
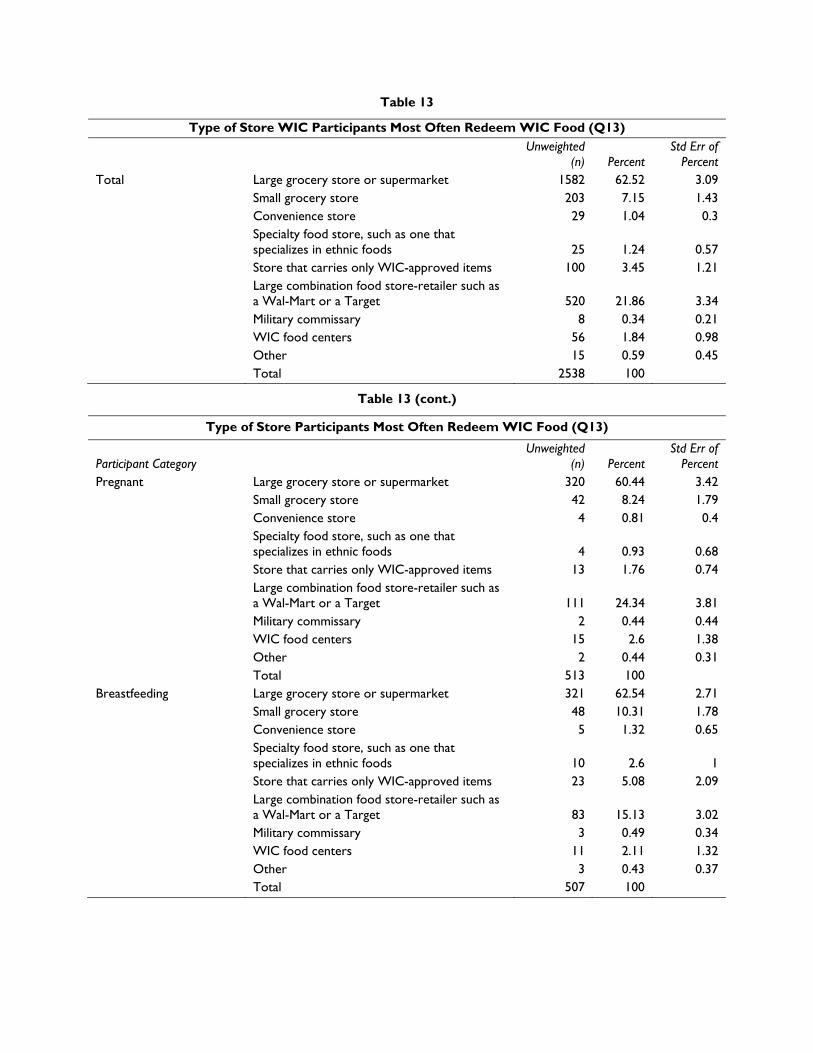
Table 13
Type of Store WIC Participants Most Often Redeem WIC Food (Q13) Unweighted
(n) Percent Std Err of
Percent Total Large grocery store or supermarket 1582 62.52 3.09
Small grocery store 203 7.15 1.43 Convenience store 29 1.04 0.3 Specialty food store, such as one that specializes in ethnic foods 25 1.24 0.57 Store that carries only WIC-approved items 100 3.45 1.21 Large combination food store-retailer such as a Wal-Mart or a Target 520 21.86 3.34 Military commissary 8 0.34 0.21 WIC food centers 56 1.84 0.98 Other 15 0.59 0.45 Total 2538 100
Table 13 (cont.)
Type of Store Participants Most Often Redeem WIC Food (Q13)
Participant Category Unweighted
(n) Percent Std Err of
Percent Pregnant Large grocery store or supermarket 320 60.44 3.42
Small grocery store 42 8.24 1.79 Convenience store 4 0.81 0.4 Specialty food store, such as one that specializes in ethnic foods 4 0.93 0.68 Store that carries only WIC-approved items 13 1.76 0.74 Large combination food store-retailer such as a Wal-Mart or a Target 111 24.34 3.81 Military commissary 2 0.44 0.44 WIC food centers 15 2.6 1.38 Other 2 0.44 0.31 Total 513 100
Breastfeeding Large grocery store or supermarket 321 62.54 2.71 Small grocery store 48 10.31 1.78 Convenience store 5 1.32 0.65 Specialty food store, such as one that specializes in ethnic foods 10 2.6 1 Store that carries only WIC-approved items 23 5.08 2.09 Large combination food store-retailer such as a Wal-Mart or a Target 83 15.13 3.02 Military commissary 3 0.49 0.34 WIC food centers 11 2.11 1.32 Other 3 0.43 0.37 Total 507 100
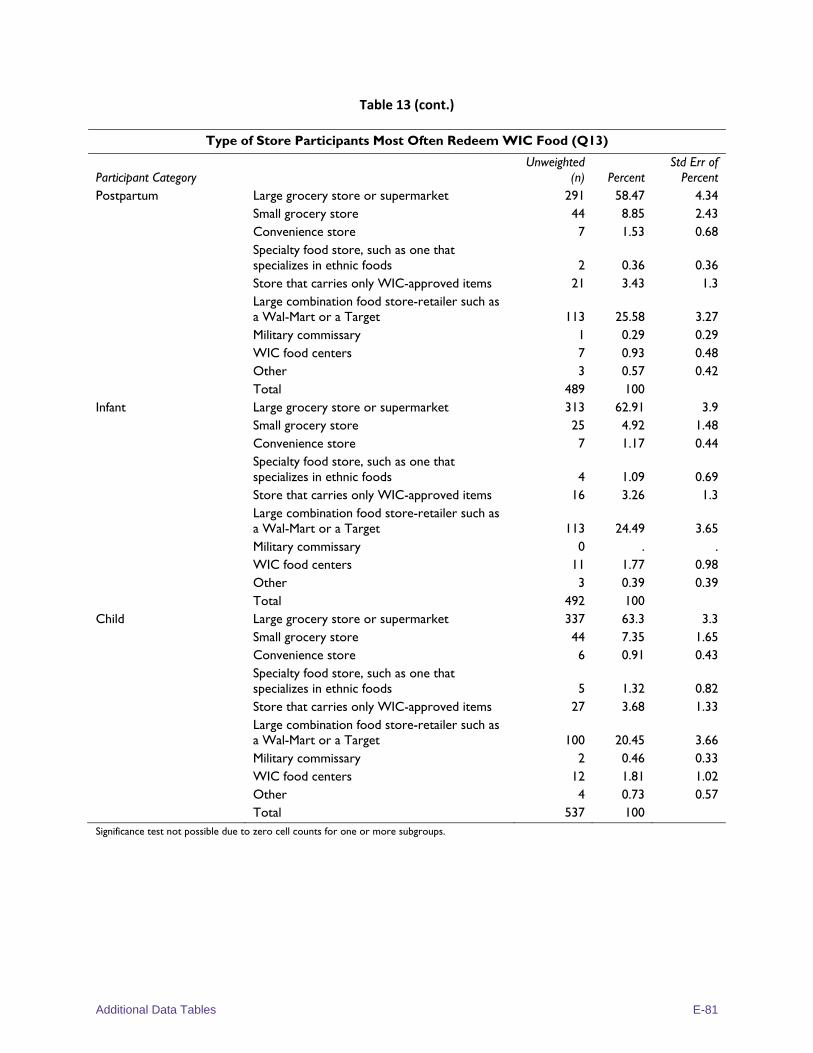
Additional Data Tables E-81
Table 13 (cont.)
Type of Store Participants Most Often Redeem WIC Food (Q13)
Participant Category Unweighted
(n) Percent Std Err of
Percent Postpartum Large grocery store or supermarket 291 58.47 4.34
Small grocery store 44 8.85 2.43 Convenience store 7 1.53 0.68 Specialty food store, such as one that specializes in ethnic foods 2 0.36 0.36 Store that carries only WIC-approved items 21 3.43 1.3 Large combination food store-retailer such as a Wal-Mart or a Target 113 25.58 3.27 Military commissary 1 0.29 0.29 WIC food centers 7 0.93 0.48 Other 3 0.57 0.42 Total 489 100
Infant Large grocery store or supermarket 313 62.91 3.9 Small grocery store 25 4.92 1.48 Convenience store 7 1.17 0.44 Specialty food store, such as one that specializes in ethnic foods 4 1.09 0.69 Store that carries only WIC-approved items 16 3.26 1.3 Large combination food store-retailer such as a Wal-Mart or a Target 113 24.49 3.65 Military commissary 0 . . WIC food centers 11 1.77 0.98 Other 3 0.39 0.39 Total 492 100
Child Large grocery store or supermarket 337 63.3 3.3 Small grocery store 44 7.35 1.65 Convenience store 6 0.91 0.43 Specialty food store, such as one that specializes in ethnic foods 5 1.32 0.82 Store that carries only WIC-approved items 27 3.68 1.33 Large combination food store-retailer such as a Wal-Mart or a Target 100 20.45 3.66 Military commissary 2 0.46 0.33 WIC food centers 12 1.81 1.02 Other 4 0.73 0.57 Total 537 100
Significance test not possible due to zero cell counts for one or more subgroups.
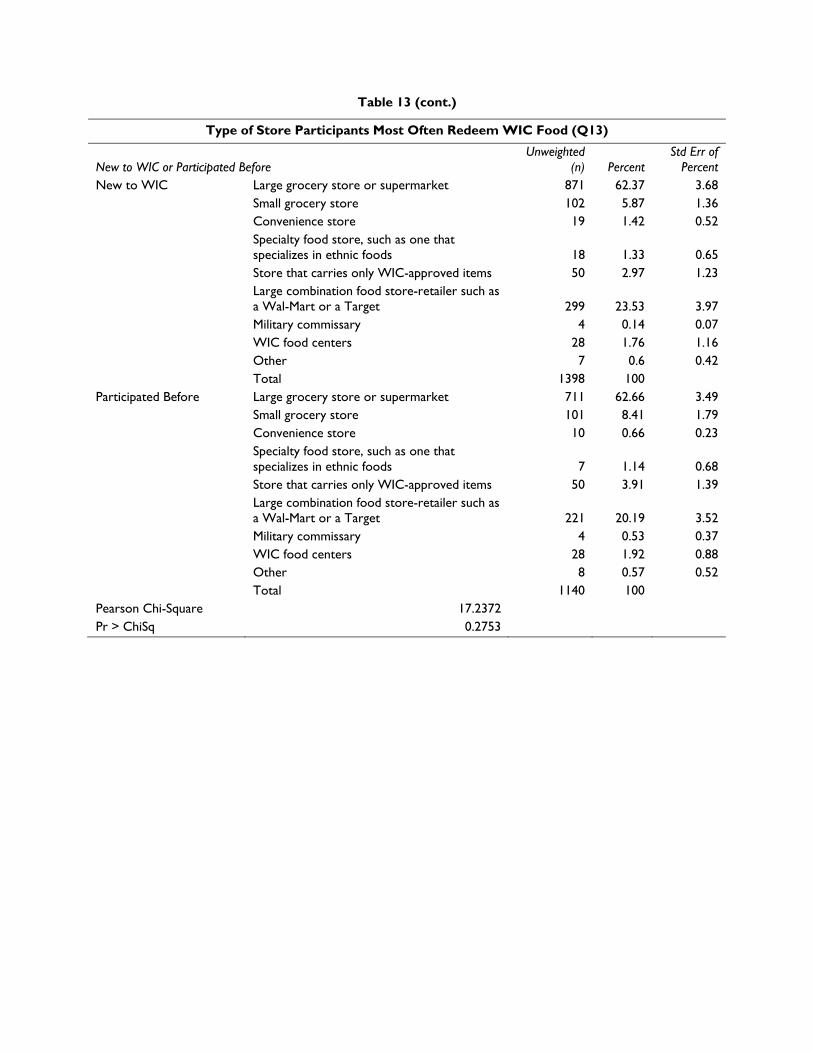
Table 13 (cont.)
Type of Store Participants Most Often Redeem WIC Food (Q13)
New to WIC or Participated Before Unweighted
(n) Percent Std Err of
Percent New to WIC Large grocery store or supermarket 871 62.37 3.68
Small grocery store 102 5.87 1.36 Convenience store 19 1.42 0.52 Specialty food store, such as one that specializes in ethnic foods 18 1.33 0.65 Store that carries only WIC-approved items 50 2.97 1.23 Large combination food store-retailer such as a Wal-Mart or a Target 299 23.53 3.97 Military commissary 4 0.14 0.07 WIC food centers 28 1.76 1.16 Other 7 0.6 0.42 Total 1398 100
Participated Before Large grocery store or supermarket 711 62.66 3.49 Small grocery store 101 8.41 1.79 Convenience store 10 0.66 0.23 Specialty food store, such as one that specializes in ethnic foods 7 1.14 0.68 Store that carries only WIC-approved items 50 3.91 1.39 Large combination food store-retailer such as a Wal-Mart or a Target 221 20.19 3.52 Military commissary 4 0.53 0.37 WIC food centers 28 1.92 0.88 Other 8 0.57 0.52 Total 1140 100
Pearson Chi-Square 17.2372 Pr > ChiSq 0.2753
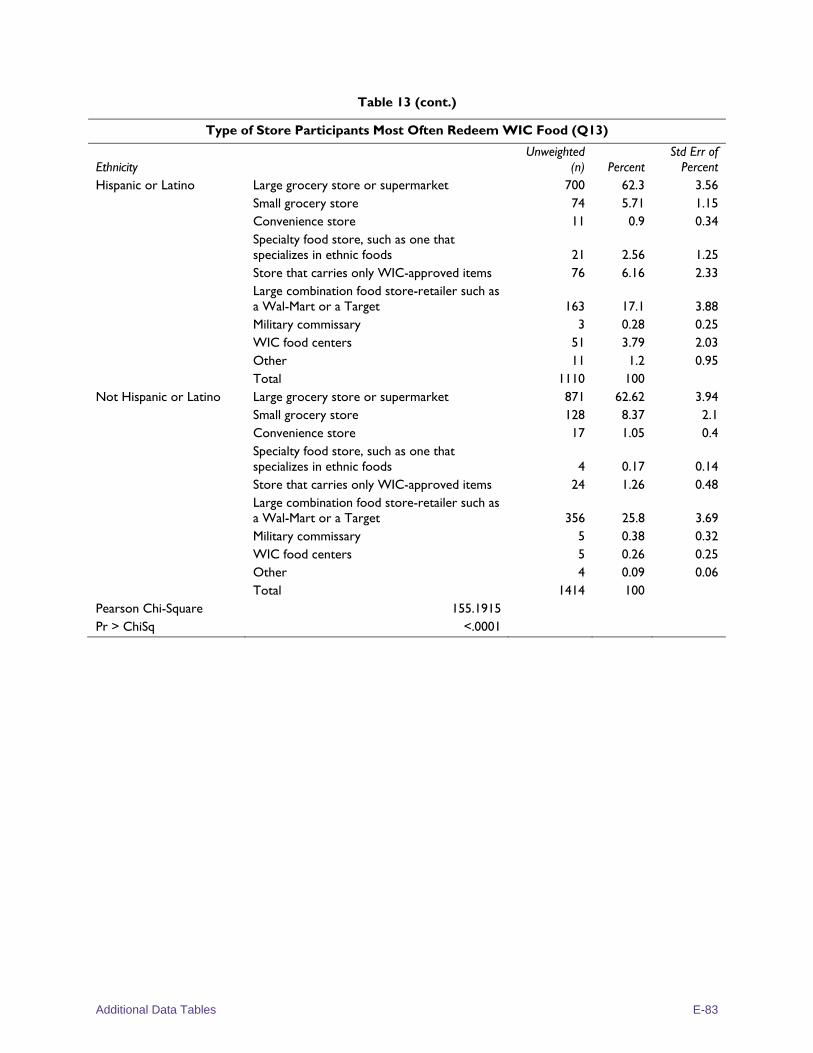
Additional Data Tables E-83
Table 13 (cont.)
Type of Store Participants Most Often Redeem WIC Food (Q13)
Ethnicity Unweighted
(n) Percent Std Err of
Percent Hispanic or Latino Large grocery store or supermarket 700 62.3 3.56
Small grocery store 74 5.71 1.15 Convenience store 11 0.9 0.34 Specialty food store, such as one that specializes in ethnic foods 21 2.56 1.25 Store that carries only WIC-approved items 76 6.16 2.33 Large combination food store-retailer such as a Wal-Mart or a Target 163 17.1 3.88 Military commissary 3 0.28 0.25 WIC food centers 51 3.79 2.03 Other 11 1.2 0.95 Total 1110 100
Not Hispanic or Latino Large grocery store or supermarket 871 62.62 3.94 Small grocery store 128 8.37 2.1 Convenience store 17 1.05 0.4 Specialty food store, such as one that specializes in ethnic foods 4 0.17 0.14 Store that carries only WIC-approved items 24 1.26 0.48 Large combination food store-retailer such as a Wal-Mart or a Target 356 25.8 3.69 Military commissary 5 0.38 0.32 WIC food centers 5 0.26 0.25 Other 4 0.09 0.06 Total 1414 100
Pearson Chi-Square 155.1915 Pr > ChiSq <.0001
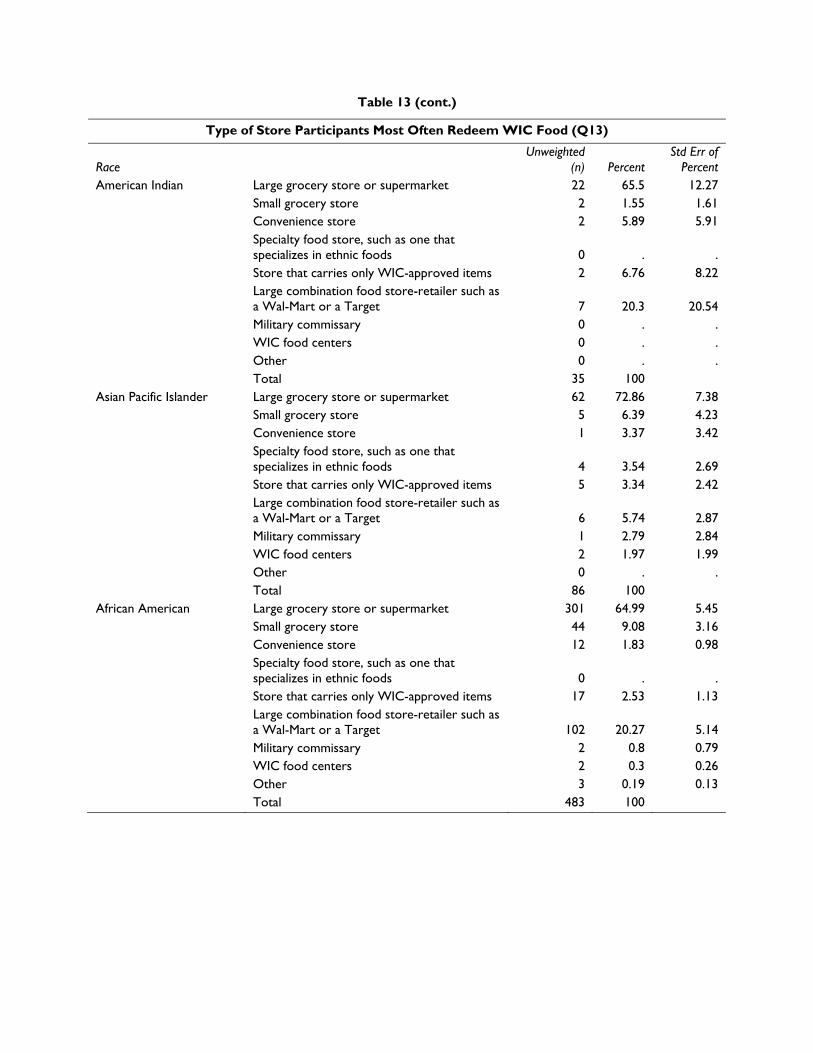
Table 13 (cont.)
Type of Store Participants Most Often Redeem WIC Food (Q13)
Race Unweighted
(n) Percent Std Err of
Percent American Indian Large grocery store or supermarket 22 65.5 12.27
Small grocery store 2 1.55 1.61 Convenience store 2 5.89 5.91 Specialty food store, such as one that specializes in ethnic foods 0 . . Store that carries only WIC-approved items 2 6.76 8.22 Large combination food store-retailer such as a Wal-Mart or a Target 7 20.3 20.54 Military commissary 0 . . WIC food centers 0 . . Other 0 . . Total 35 100
Asian Pacific Islander Large grocery store or supermarket 62 72.86 7.38 Small grocery store 5 6.39 4.23 Convenience store 1 3.37 3.42 Specialty food store, such as one that specializes in ethnic foods 4 3.54 2.69 Store that carries only WIC-approved items 5 3.34 2.42 Large combination food store-retailer such as a Wal-Mart or a Target 6 5.74 2.87 Military commissary 1 2.79 2.84 WIC food centers 2 1.97 1.99 Other 0 . . Total 86 100
African American Large grocery store or supermarket 301 64.99 5.45 Small grocery store 44 9.08 3.16 Convenience store 12 1.83 0.98 Specialty food store, such as one that specializes in ethnic foods 0 . . Store that carries only WIC-approved items 17 2.53 1.13 Large combination food store-retailer such as a Wal-Mart or a Target 102 20.27 5.14 Military commissary 2 0.8 0.79 WIC food centers 2 0.3 0.26 Other 3 0.19 0.13 Total 483 100
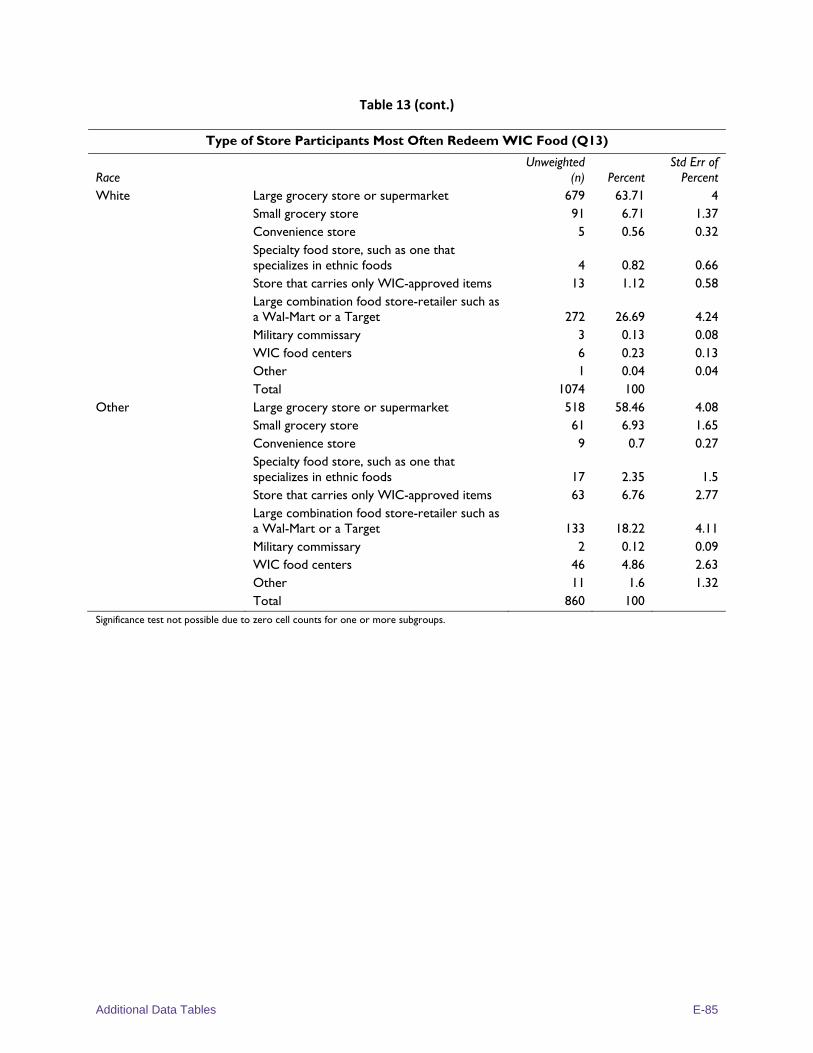
Additional Data Tables E-85
Table 13 (cont.)
Type of Store Participants Most Often Redeem WIC Food (Q13)
Race Unweighted
(n) Percent Std Err of
Percent White Large grocery store or supermarket 679 63.71 4
Small grocery store 91 6.71 1.37 Convenience store 5 0.56 0.32 Specialty food store, such as one that specializes in ethnic foods 4 0.82 0.66 Store that carries only WIC-approved items 13 1.12 0.58 Large combination food store-retailer such as a Wal-Mart or a Target 272 26.69 4.24 Military commissary 3 0.13 0.08 WIC food centers 6 0.23 0.13 Other 1 0.04 0.04 Total 1074 100
Other Large grocery store or supermarket 518 58.46 4.08 Small grocery store 61 6.93 1.65 Convenience store 9 0.7 0.27 Specialty food store, such as one that specializes in ethnic foods 17 2.35 1.5 Store that carries only WIC-approved items 63 6.76 2.77 Large combination food store-retailer such as a Wal-Mart or a Target 133 18.22 4.11 Military commissary 2 0.12 0.09 WIC food centers 46 4.86 2.63 Other 11 1.6 1.32 Total 860 100
Significance test not possible due to zero cell counts for one or more subgroups.
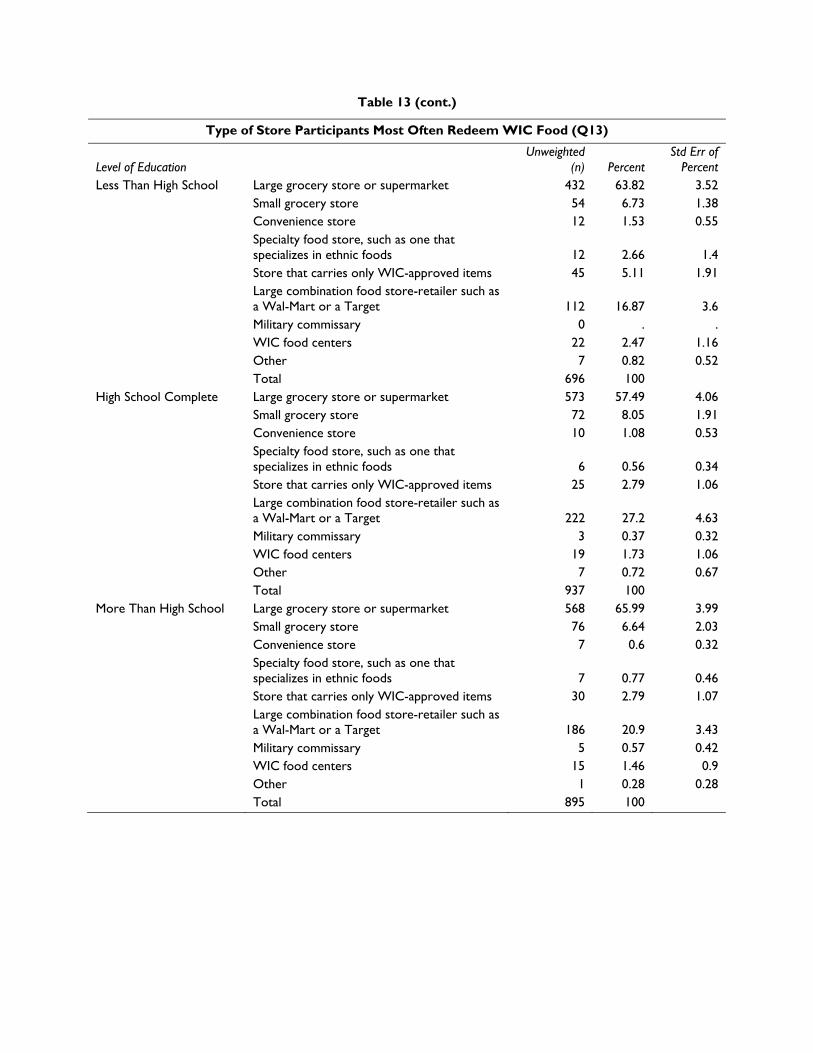
Table 13 (cont.)
Type of Store Participants Most Often Redeem WIC Food (Q13)
Level of Education Unweighted
(n) Percent Std Err of
Percent Less Than High School Large grocery store or supermarket 432 63.82 3.52
Small grocery store 54 6.73 1.38 Convenience store 12 1.53 0.55 Specialty food store, such as one that specializes in ethnic foods 12 2.66 1.4 Store that carries only WIC-approved items 45 5.11 1.91 Large combination food store-retailer such as a Wal-Mart or a Target 112 16.87 3.6 Military commissary 0 . . WIC food centers 22 2.47 1.16 Other 7 0.82 0.52 Total 696 100
High School Complete Large grocery store or supermarket 573 57.49 4.06 Small grocery store 72 8.05 1.91 Convenience store 10 1.08 0.53 Specialty food store, such as one that specializes in ethnic foods 6 0.56 0.34 Store that carries only WIC-approved items 25 2.79 1.06 Large combination food store-retailer such as a Wal-Mart or a Target 222 27.2 4.63 Military commissary 3 0.37 0.32 WIC food centers 19 1.73 1.06 Other 7 0.72 0.67 Total 937 100
More Than High School Large grocery store or supermarket 568 65.99 3.99 Small grocery store 76 6.64 2.03 Convenience store 7 0.6 0.32 Specialty food store, such as one that specializes in ethnic foods 7 0.77 0.46 Store that carries only WIC-approved items 30 2.79 1.07 Large combination food store-retailer such as a Wal-Mart or a Target 186 20.9 3.43 Military commissary 5 0.57 0.42 WIC food centers 15 1.46 0.9 Other 1 0.28 0.28 Total 895 100
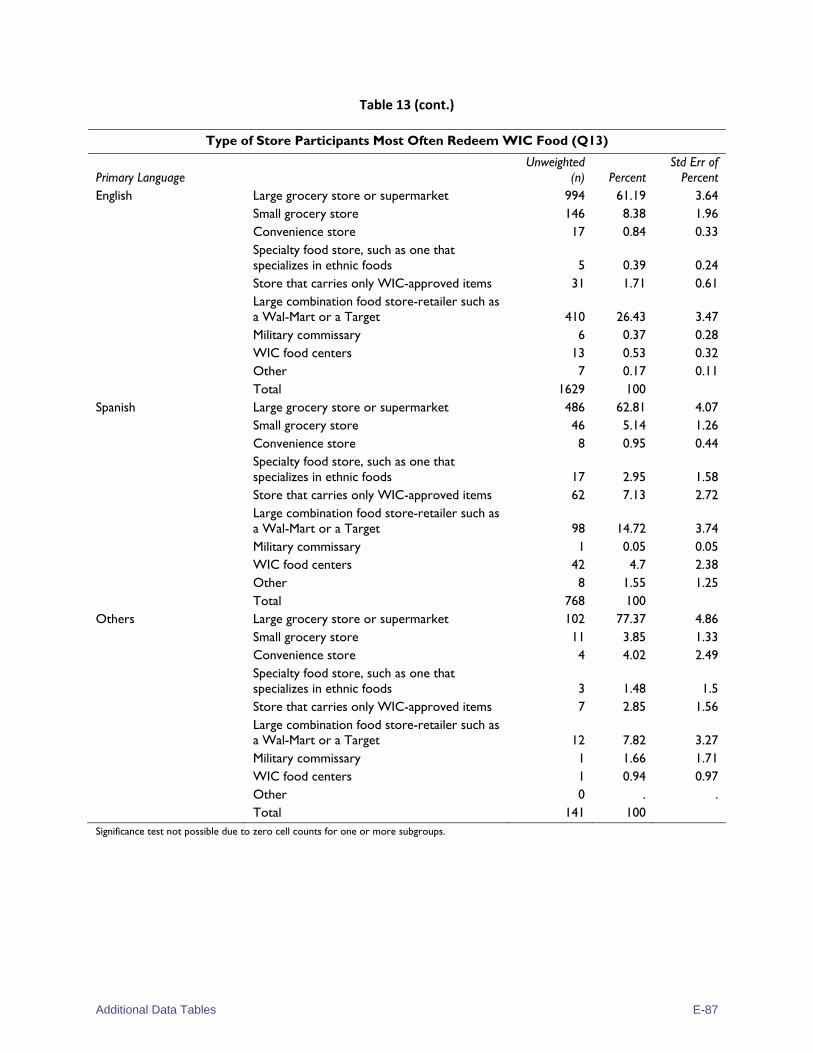
Additional Data Tables E-87
Table 13 (cont.)
Type of Store Participants Most Often Redeem WIC Food (Q13)
Primary Language Unweighted
(n) Percent Std Err of
Percent English Large grocery store or supermarket 994 61.19 3.64
Small grocery store 146 8.38 1.96 Convenience store 17 0.84 0.33 Specialty food store, such as one that specializes in ethnic foods 5 0.39 0.24 Store that carries only WIC-approved items 31 1.71 0.61 Large combination food store-retailer such as a Wal-Mart or a Target 410 26.43 3.47 Military commissary 6 0.37 0.28 WIC food centers 13 0.53 0.32 Other 7 0.17 0.11 Total 1629 100
Spanish Large grocery store or supermarket 486 62.81 4.07 Small grocery store 46 5.14 1.26 Convenience store 8 0.95 0.44 Specialty food store, such as one that specializes in ethnic foods 17 2.95 1.58 Store that carries only WIC-approved items 62 7.13 2.72 Large combination food store-retailer such as a Wal-Mart or a Target 98 14.72 3.74 Military commissary 1 0.05 0.05 WIC food centers 42 4.7 2.38 Other 8 1.55 1.25 Total 768 100
Others Large grocery store or supermarket 102 77.37 4.86 Small grocery store 11 3.85 1.33 Convenience store 4 4.02 2.49 Specialty food store, such as one that specializes in ethnic foods 3 1.48 1.5 Store that carries only WIC-approved items 7 2.85 1.56 Large combination food store-retailer such as a Wal-Mart or a Target 12 7.82 3.27 Military commissary 1 1.66 1.71 WIC food centers 1 0.94 0.97 Other 0 . . Total 141 100
Significance test not possible due to zero cell counts for one or more subgroups.
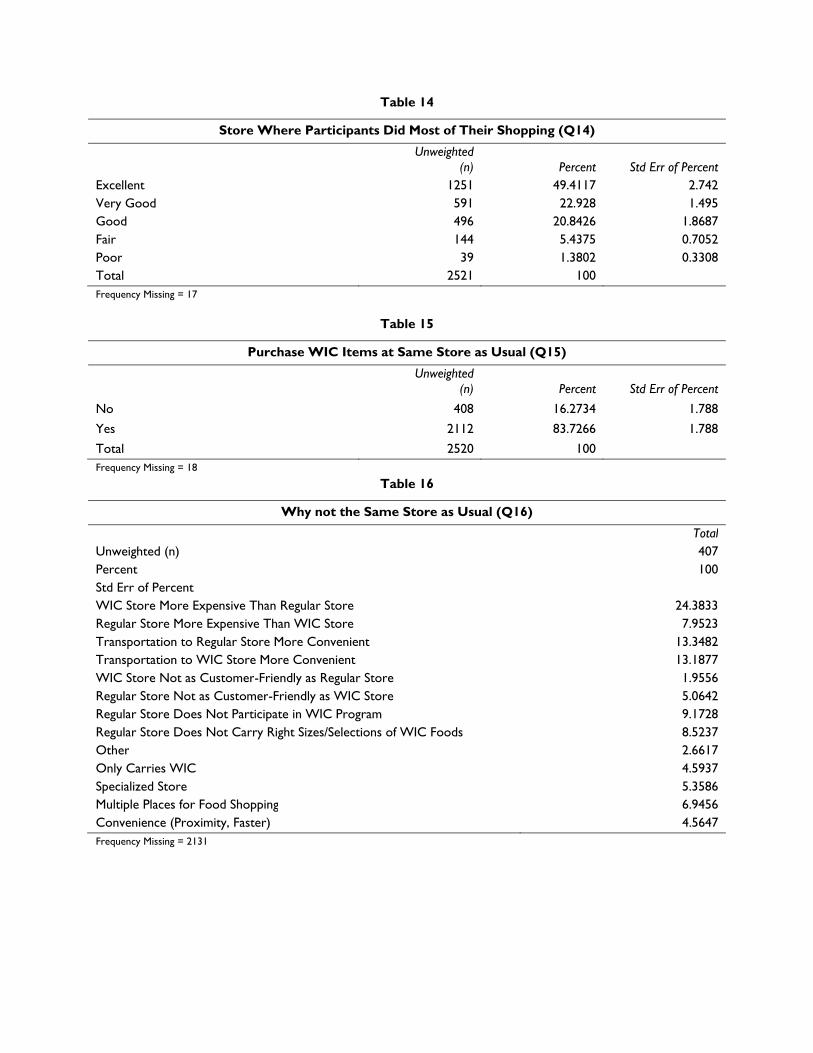
Table 14
Store Where Participants Did Most of Their Shopping (Q14)
Unweighted (n) Percent Std Err of Percent
Excellent 1251 49.4117 2.742 Very Good 591 22.928 1.495 Good 496 20.8426 1.8687 Fair 144 5.4375 0.7052 Poor 39 1.3802 0.3308 Total 2521 100 Frequency Missing = 17
Table 15
Purchase WIC Items at Same Store as Usual (Q15)
Unweighted (n) Percent Std Err of Percent
No 408 16.2734 1.788
Yes 2112 83.7266 1.788
Total 2520 100 Frequency Missing = 18
Table 16
Why not the Same Store as Usual (Q16)
Total Unweighted (n) 407 Percent 100 Std Err of Percent WIC Store More Expensive Than Regular Store 24.3833 Regular Store More Expensive Than WIC Store 7.9523 Transportation to Regular Store More Convenient 13.3482 Transportation to WIC Store More Convenient 13.1877 WIC Store Not as Customer-Friendly as Regular Store 1.9556 Regular Store Not as Customer-Friendly as WIC Store 5.0642 Regular Store Does Not Participate in WIC Program 9.1728 Regular Store Does Not Carry Right Sizes/Selections of WIC Foods 8.5237 Other 2.6617 Only Carries WIC 4.5937 Specialized Store 5.3586 Multiple Places for Food Shopping 6.9456 Convenience (Proximity, Faster) 4.5647 Frequency Missing = 2131
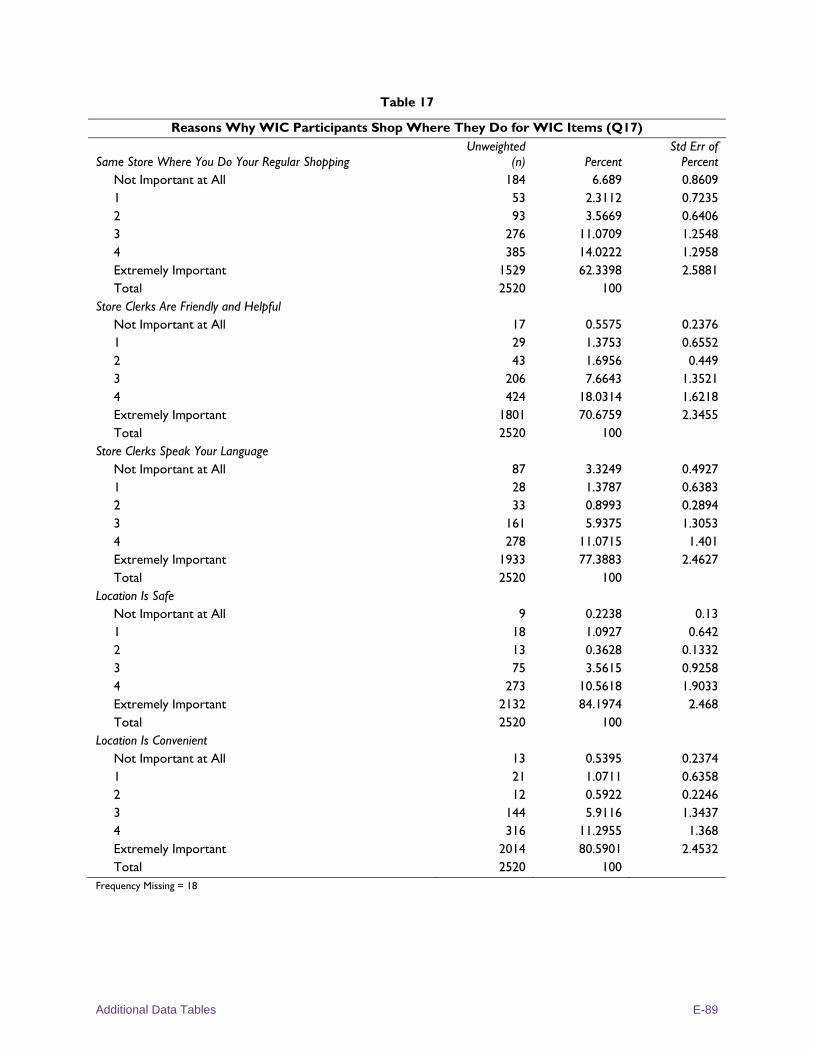
Additional Data Tables E-89
Table 17
Reasons Why WIC Participants Shop Where They Do for WIC Items (Q17)
Same Store Where You Do Your Regular Shopping Unweighted
(n) Percent Std Err of
Percent Not Important at All 184 6.689 0.8609 1 53 2.3112 0.7235 2 93 3.5669 0.6406 3 276 11.0709 1.2548 4 385 14.0222 1.2958 Extremely Important 1529 62.3398 2.5881 Total 2520 100
Store Clerks Are Friendly and Helpful Not Important at All 17 0.5575 0.2376 1 29 1.3753 0.6552 2 43 1.6956 0.449 3 206 7.6643 1.3521 4 424 18.0314 1.6218 Extremely Important 1801 70.6759 2.3455 Total 2520 100
Store Clerks Speak Your Language Not Important at All 87 3.3249 0.4927 1 28 1.3787 0.6383 2 33 0.8993 0.2894 3 161 5.9375 1.3053 4 278 11.0715 1.401 Extremely Important 1933 77.3883 2.4627 Total 2520 100
Location Is Safe Not Important at All 9 0.2238 0.13 1 18 1.0927 0.642 2 13 0.3628 0.1332 3 75 3.5615 0.9258 4 273 10.5618 1.9033 Extremely Important 2132 84.1974 2.468 Total 2520 100
Location Is Convenient Not Important at All 13 0.5395 0.2374 1 21 1.0711 0.6358 2 12 0.5922 0.2246 3 144 5.9116 1.3437 4 316 11.2955 1.368 Extremely Important 2014 80.5901 2.4532 Total 2520 100
Frequency Missing = 18
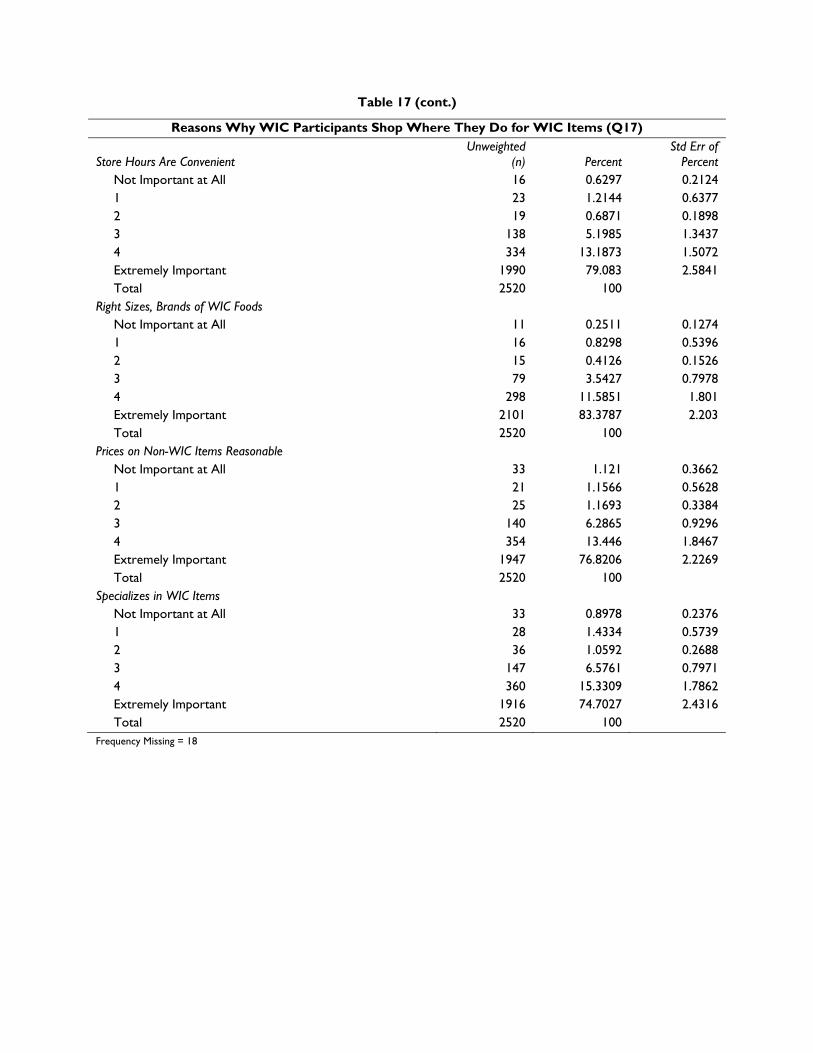
Table 17 (cont.)
Reasons Why WIC Participants Shop Where They Do for WIC Items (Q17)
Store Hours Are Convenient Unweighted
(n) Percent Std Err of
Percent Not Important at All 16 0.6297 0.2124 1 23 1.2144 0.6377 2 19 0.6871 0.1898 3 138 5.1985 1.3437 4 334 13.1873 1.5072 Extremely Important 1990 79.083 2.5841 Total 2520 100
Right Sizes, Brands of WIC Foods Not Important at All 11 0.2511 0.1274 1 16 0.8298 0.5396 2 15 0.4126 0.1526 3 79 3.5427 0.7978 4 298 11.5851 1.801 Extremely Important 2101 83.3787 2.203 Total 2520 100
Prices on Non-WIC Items Reasonable Not Important at All 33 1.121 0.3662 1 21 1.1566 0.5628 2 25 1.1693 0.3384 3 140 6.2865 0.9296 4 354 13.446 1.8467 Extremely Important 1947 76.8206 2.2269 Total 2520 100
Specializes in WIC Items Not Important at All 33 0.8978 0.2376 1 28 1.4334 0.5739 2 36 1.0592 0.2688 3 147 6.5761 0.7971 4 360 15.3309 1.7862 Extremely Important 1916 74.7027 2.4316 Total 2520 100
Frequency Missing = 18
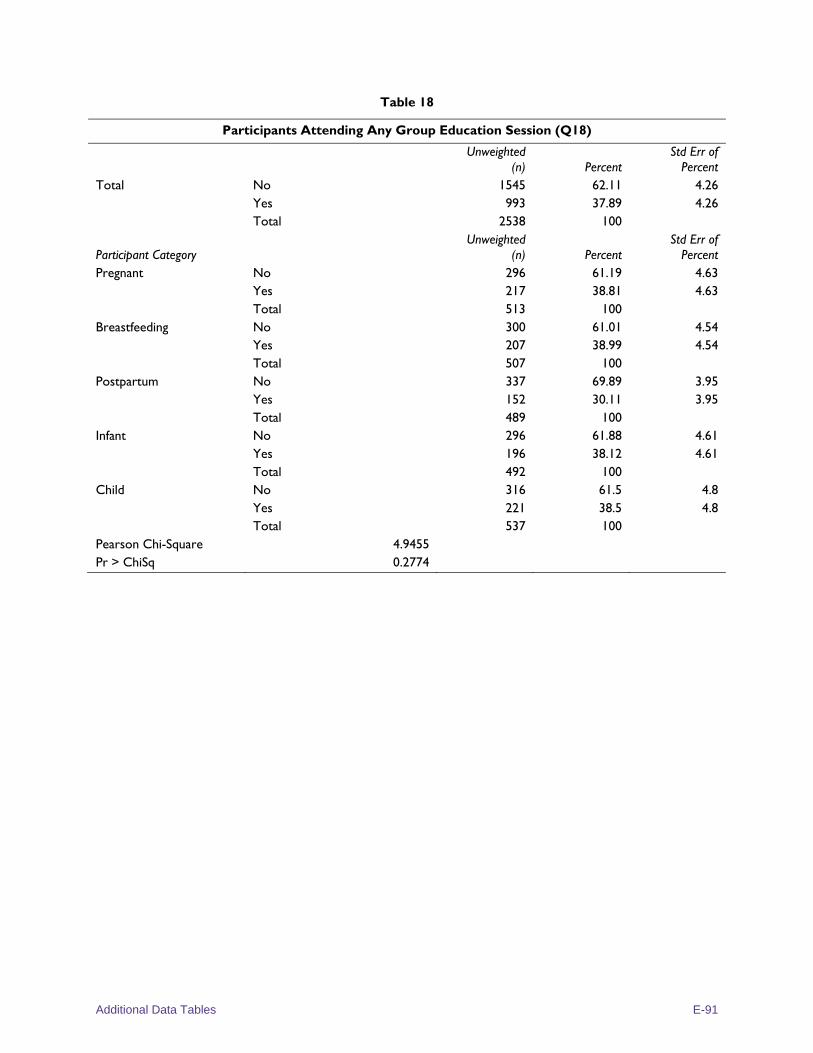
Additional Data Tables E-91
Table 18
Participants Attending Any Group Education Session (Q18)
Unweighted (n) Percent
Std Err of Percent
Total No 1545 62.11 4.26 Yes 993 37.89 4.26 Total 2538 100
Participant Category Unweighted
(n) Percent Std Err of
Percent Pregnant No 296 61.19 4.63
Yes 217 38.81 4.63 Total 513 100
Breastfeeding No 300 61.01 4.54 Yes 207 38.99 4.54 Total 507 100
Postpartum No 337 69.89 3.95 Yes 152 30.11 3.95 Total 489 100
Infant No 296 61.88 4.61 Yes 196 38.12 4.61 Total 492 100
Child No 316 61.5 4.8 Yes 221 38.5 4.8 Total 537 100
Pearson Chi-Square 4.9455 Pr > ChiSq 0.2774
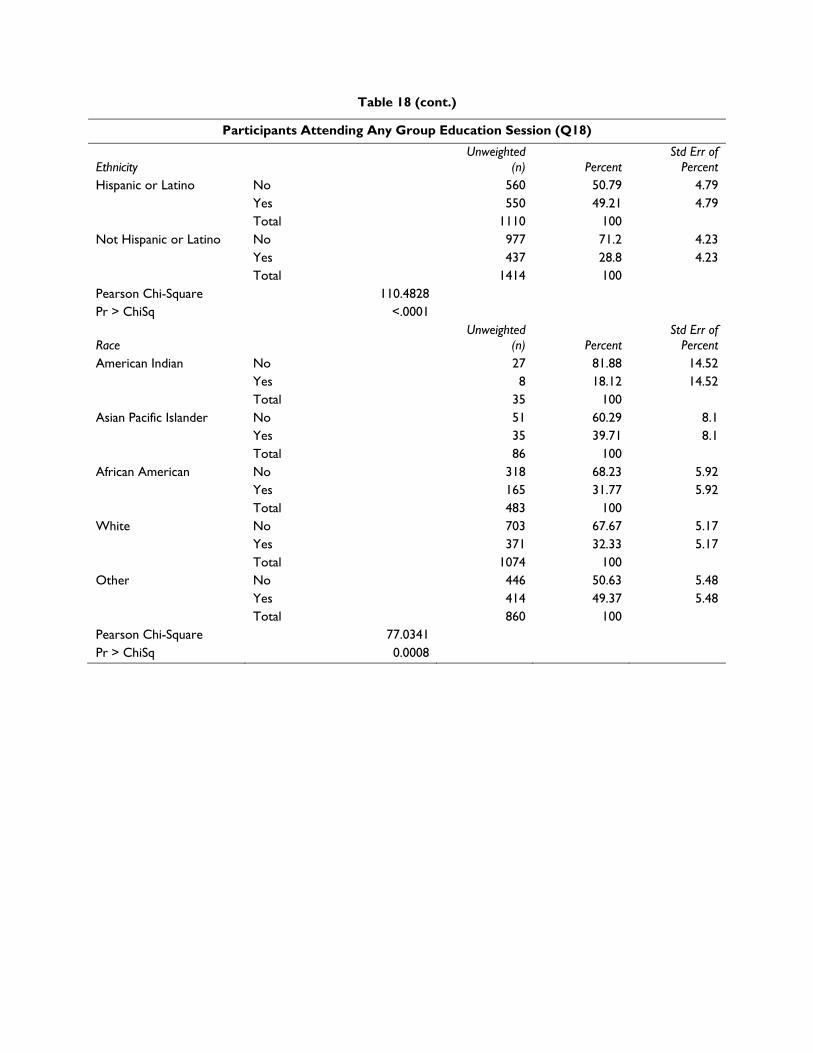
Table 18 (cont.)
Participants Attending Any Group Education Session (Q18)
Ethnicity Unweighted
(n) Percent Std Err of
Percent Hispanic or Latino No 560 50.79 4.79
Yes 550 49.21 4.79 Total 1110 100
Not Hispanic or Latino No 977 71.2 4.23 Yes 437 28.8 4.23 Total 1414 100
Pearson Chi-Square 110.4828 Pr > ChiSq <.0001
Race Unweighted
(n) Percent Std Err of
Percent American Indian No 27 81.88 14.52
Yes 8 18.12 14.52 Total 35 100
Asian Pacific Islander No 51 60.29 8.1 Yes 35 39.71 8.1 Total 86 100
African American No 318 68.23 5.92 Yes 165 31.77 5.92 Total 483 100
White No 703 67.67 5.17 Yes 371 32.33 5.17 Total 1074 100
Other No 446 50.63 5.48 Yes 414 49.37 5.48 Total 860 100
Pearson Chi-Square 77.0341 Pr > ChiSq 0.0008
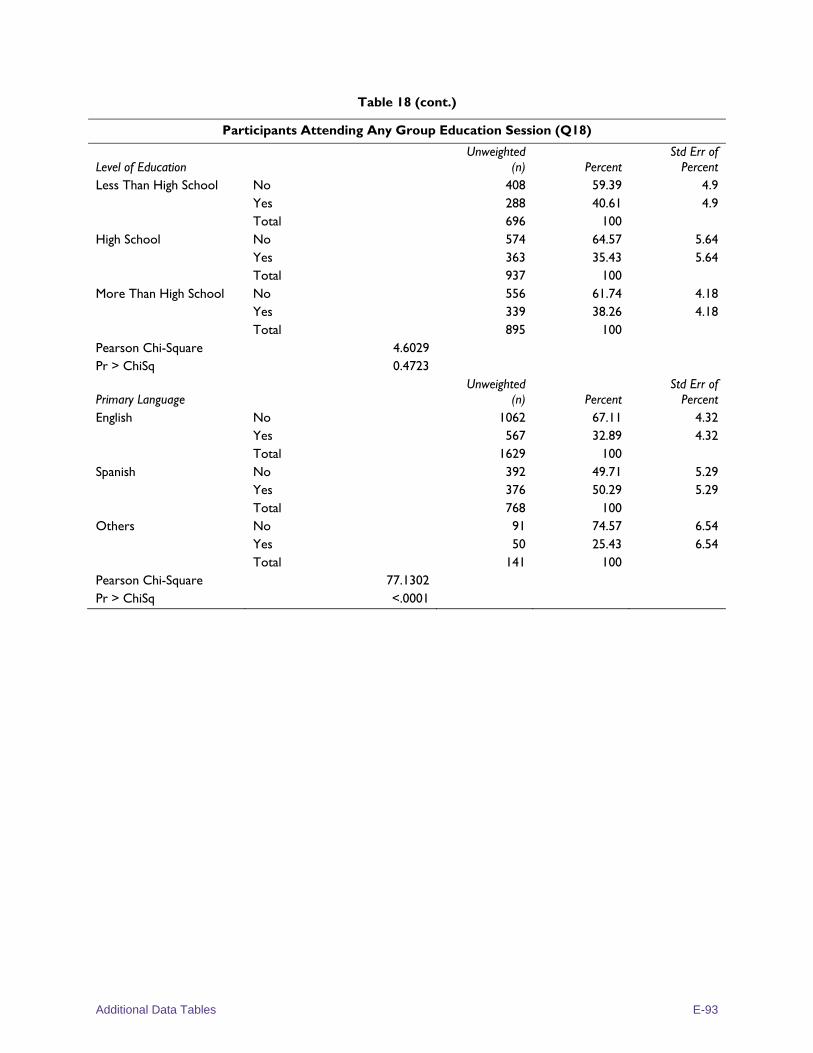
Additional Data Tables E-93
Table 18 (cont.)
Participants Attending Any Group Education Session (Q18)
Level of Education Unweighted
(n) Percent Std Err of
Percent Less Than High School No 408 59.39 4.9
Yes 288 40.61 4.9 Total 696 100
High School No 574 64.57 5.64 Yes 363 35.43 5.64 Total 937 100
More Than High School No 556 61.74 4.18 Yes 339 38.26 4.18 Total 895 100
Pearson Chi-Square 4.6029 Pr > ChiSq 0.4723
Primary Language Unweighted
(n) Percent Std Err of
Percent English No 1062 67.11 4.32
Yes 567 32.89 4.32 Total 1629 100
Spanish No 392 49.71 5.29 Yes 376 50.29 5.29 Total 768 100
Others No 91 74.57 6.54 Yes 50 25.43 6.54 Total 141 100
Pearson Chi-Square 77.1302 Pr > ChiSq <.0001
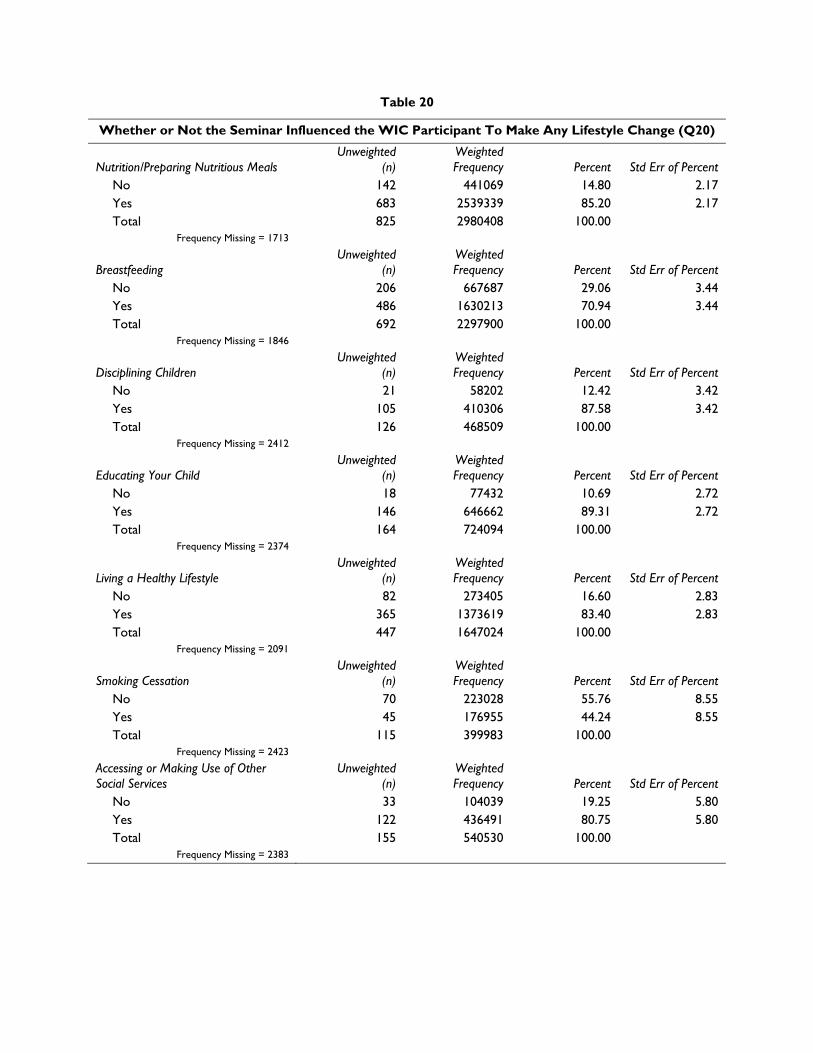
Table 20
Whether or Not the Seminar Influenced the WIC Participant To Make Any Lifestyle Change (Q20)
Nutrition/Preparing Nutritious Meals Unweighted
(n) Weighted Frequency Percent Std Err of Percent
No 142 441069 14.80 2.17 Yes 683 2539339 85.20 2.17 Total 825 2980408 100.00
Frequency Missing = 1713
Breastfeeding Unweighted
(n) Weighted Frequency Percent Std Err of Percent
No 206 667687 29.06 3.44 Yes 486 1630213 70.94 3.44 Total 692 2297900 100.00
Frequency Missing = 1846
Disciplining Children Unweighted
(n) Weighted Frequency Percent Std Err of Percent
No 21 58202 12.42 3.42 Yes 105 410306 87.58 3.42 Total 126 468509 100.00
Frequency Missing = 2412
Educating Your Child Unweighted
(n) Weighted Frequency Percent Std Err of Percent
No 18 77432 10.69 2.72 Yes 146 646662 89.31 2.72 Total 164 724094 100.00
Frequency Missing = 2374
Living a Healthy Lifestyle Unweighted
(n) Weighted Frequency Percent Std Err of Percent
No 82 273405 16.60 2.83 Yes 365 1373619 83.40 2.83 Total 447 1647024 100.00
Frequency Missing = 2091
Smoking Cessation Unweighted
(n) Weighted Frequency Percent Std Err of Percent
No 70 223028 55.76 8.55 Yes 45 176955 44.24 8.55 Total 115 399983 100.00
Frequency Missing = 2423
Accessing or Making Use of Other Social Services
Unweighted (n)
Weighted Frequency Percent Std Err of Percent
No 33 104039 19.25 5.80 Yes 122 436491 80.75 5.80 Total 155 540530 100.00
Frequency Missing = 2383
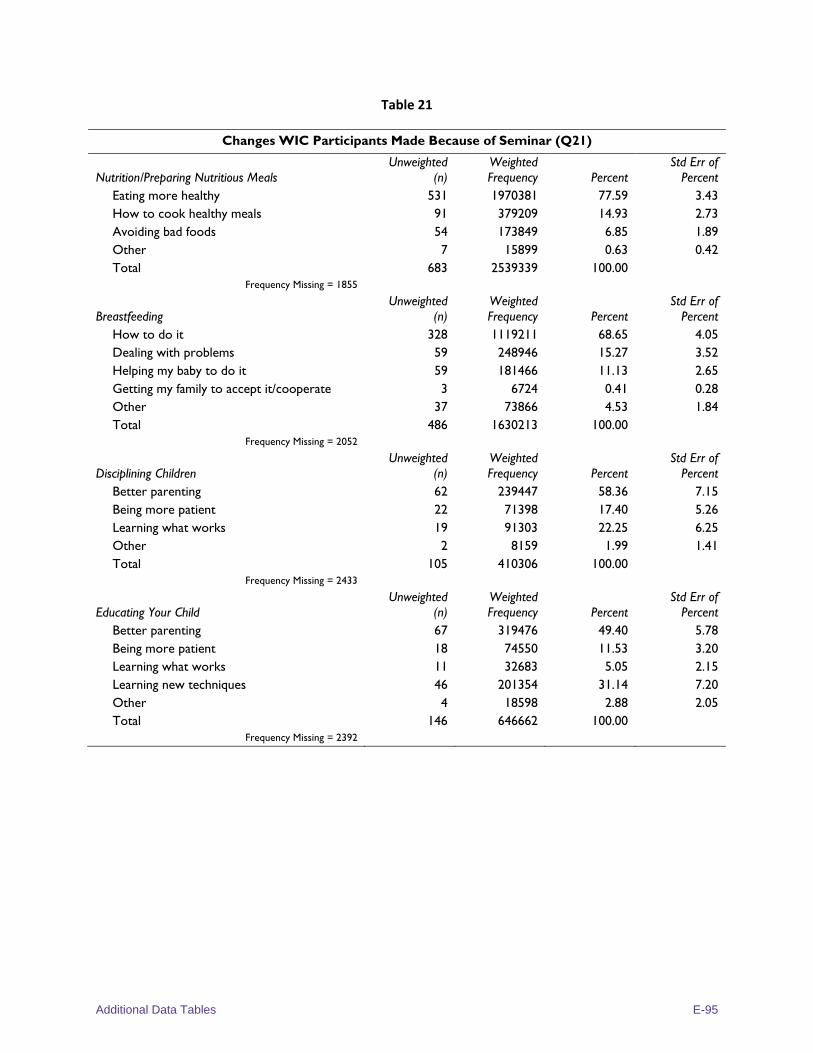
Additional Data Tables E-95
Table 21
Changes WIC Participants Made Because of Seminar (Q21)
Nutrition/Preparing Nutritious Meals Unweighted
(n) Weighted Frequency Percent
Std Err of Percent
Eating more healthy 531 1970381 77.59 3.43 How to cook healthy meals 91 379209 14.93 2.73 Avoiding bad foods 54 173849 6.85 1.89 Other 7 15899 0.63 0.42 Total 683 2539339 100.00
Frequency Missing = 1855
Breastfeeding Unweighted
(n) Weighted Frequency Percent
Std Err of Percent
How to do it 328 1119211 68.65 4.05 Dealing with problems 59 248946 15.27 3.52 Helping my baby to do it 59 181466 11.13 2.65 Getting my family to accept it/cooperate 3 6724 0.41 0.28 Other 37 73866 4.53 1.84 Total 486 1630213 100.00
Frequency Missing = 2052
Disciplining Children Unweighted
(n) Weighted Frequency Percent
Std Err of Percent
Better parenting 62 239447 58.36 7.15 Being more patient 22 71398 17.40 5.26 Learning what works 19 91303 22.25 6.25 Other 2 8159 1.99 1.41 Total 105 410306 100.00
Frequency Missing = 2433
Educating Your Child Unweighted
(n) Weighted Frequency Percent
Std Err of Percent
Better parenting 67 319476 49.40 5.78 Being more patient 18 74550 11.53 3.20 Learning what works 11 32683 5.05 2.15 Learning new techniques 46 201354 31.14 7.20 Other 4 18598 2.88 2.05 Total 146 646662 100.00
Frequency Missing = 2392
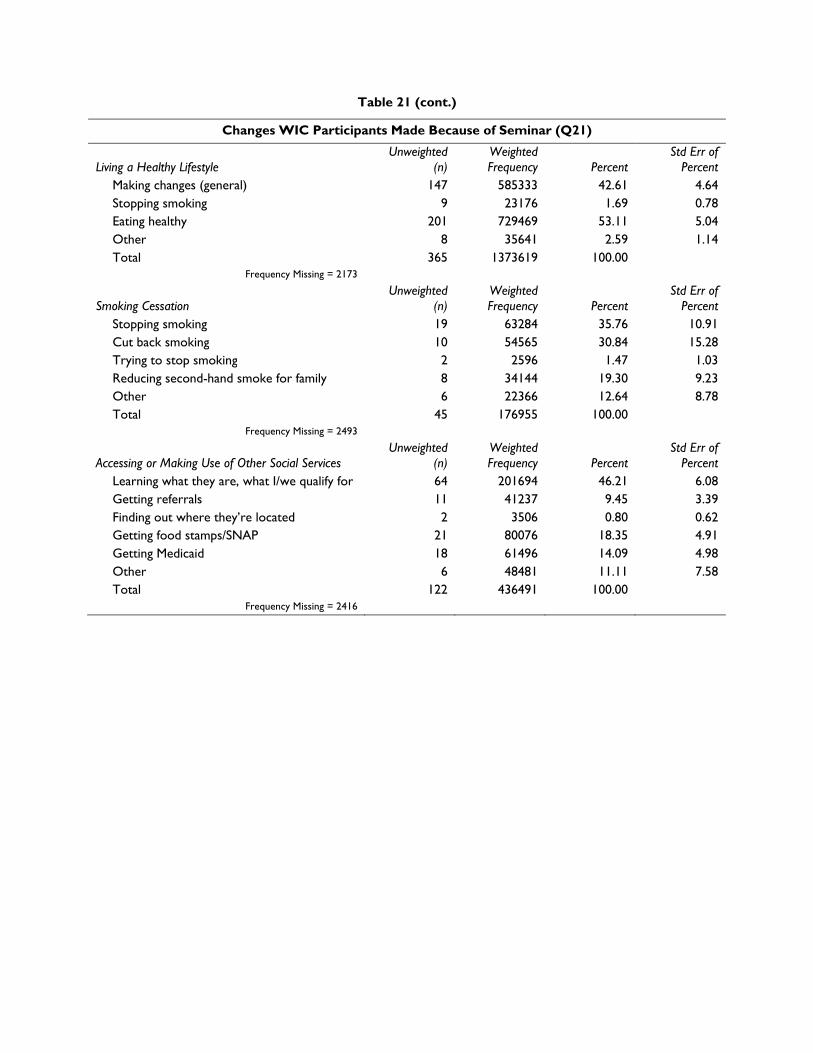
Table 21 (cont.)
Changes WIC Participants Made Because of Seminar (Q21)
Living a Healthy Lifestyle Unweighted
(n) Weighted Frequency Percent
Std Err of Percent
Making changes (general) 147 585333 42.61 4.64 Stopping smoking 9 23176 1.69 0.78 Eating healthy 201 729469 53.11 5.04 Other 8 35641 2.59 1.14 Total 365 1373619 100.00
Frequency Missing = 2173
Smoking Cessation Unweighted
(n) Weighted Frequency Percent
Std Err of Percent
Stopping smoking 19 63284 35.76 10.91 Cut back smoking 10 54565 30.84 15.28 Trying to stop smoking 2 2596 1.47 1.03 Reducing second-hand smoke for family 8 34144 19.30 9.23 Other 6 22366 12.64 8.78 Total 45 176955 100.00
Frequency Missing = 2493
Accessing or Making Use of Other Social Services Unweighted
(n) Weighted Frequency Percent
Std Err of Percent
Learning what they are, what I/we qualify for 64 201694 46.21 6.08 Getting referrals 11 41237 9.45 3.39 Finding out where they’re located 2 3506 0.80 0.62 Getting food stamps/SNAP 21 80076 18.35 4.91 Getting Medicaid 18 61496 14.09 4.98 Other 6 48481 11.11 7.58 Total 122 436491 100.00
Frequency Missing = 2416
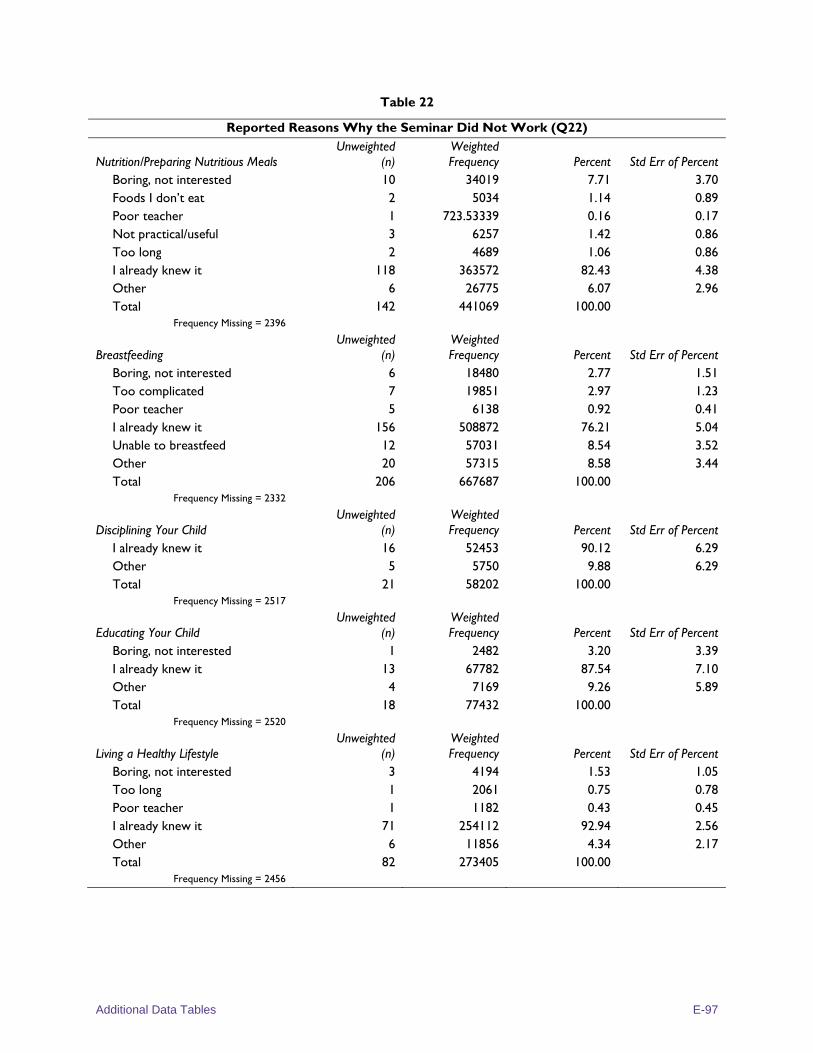
Additional Data Tables E-97
Table 22
Reported Reasons Why the Seminar Did Not Work (Q22)
Nutrition/Preparing Nutritious Meals Unweighted
(n) Weighted Frequency Percent Std Err of Percent
Boring, not interested 10 34019 7.71 3.70 Foods I don’t eat 2 5034 1.14 0.89 Poor teacher 1 723.53339 0.16 0.17 Not practical/useful 3 6257 1.42 0.86 Too long 2 4689 1.06 0.86 I already knew it 118 363572 82.43 4.38 Other 6 26775 6.07 2.96 Total 142 441069 100.00
Frequency Missing = 2396
Breastfeeding Unweighted
(n) Weighted Frequency Percent Std Err of Percent
Boring, not interested 6 18480 2.77 1.51 Too complicated 7 19851 2.97 1.23 Poor teacher 5 6138 0.92 0.41 I already knew it 156 508872 76.21 5.04 Unable to breastfeed 12 57031 8.54 3.52 Other 20 57315 8.58 3.44 Total 206 667687 100.00
Frequency Missing = 2332
Disciplining Your Child Unweighted
(n) Weighted Frequency Percent Std Err of Percent
I already knew it 16 52453 90.12 6.29 Other 5 5750 9.88 6.29 Total 21 58202 100.00
Frequency Missing = 2517
Educating Your Child Unweighted
(n) Weighted Frequency Percent Std Err of Percent
Boring, not interested 1 2482 3.20 3.39 I already knew it 13 67782 87.54 7.10 Other 4 7169 9.26 5.89 Total 18 77432 100.00
Frequency Missing = 2520
Living a Healthy Lifestyle Unweighted
(n) Weighted Frequency Percent Std Err of Percent
Boring, not interested 3 4194 1.53 1.05 Too long 1 2061 0.75 0.78 Poor teacher 1 1182 0.43 0.45 I already knew it 71 254112 92.94 2.56 Other 6 11856 4.34 2.17 Total 82 273405 100.00
Frequency Missing = 2456
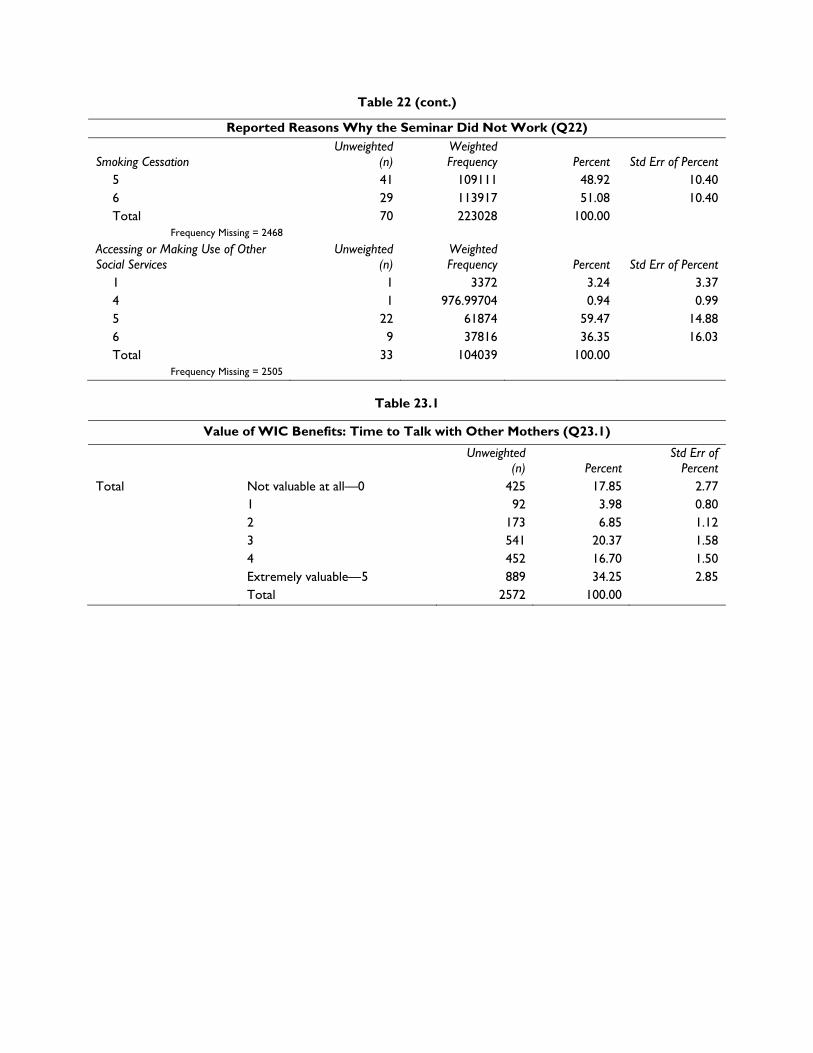
Table 22 (cont.)
Reported Reasons Why the Seminar Did Not Work (Q22)
Smoking Cessation Unweighted
(n) Weighted Frequency Percent Std Err of Percent
5 41 109111 48.92 10.40 6 29 113917 51.08 10.40 Total 70 223028 100.00
Frequency Missing = 2468
Accessing or Making Use of Other Social Services
Unweighted (n)
Weighted Frequency Percent Std Err of Percent
1 1 3372 3.24 3.37 4 1 976.99704 0.94 0.99 5 22 61874 59.47 14.88 6 9 37816 36.35 16.03 Total 33 104039 100.00
Frequency Missing = 2505
Table 23.1
Value of WIC Benefits: Time to Talk with Other Mothers (Q23.1)
Unweighted (n) Percent
Std Err of Percent
Total Not valuable at all—0 425 17.85 2.77 1 92 3.98 0.80 2 173 6.85 1.12 3 541 20.37 1.58 4 452 16.70 1.50 Extremely valuable—5 889 34.25 2.85 Total 2572 100.00
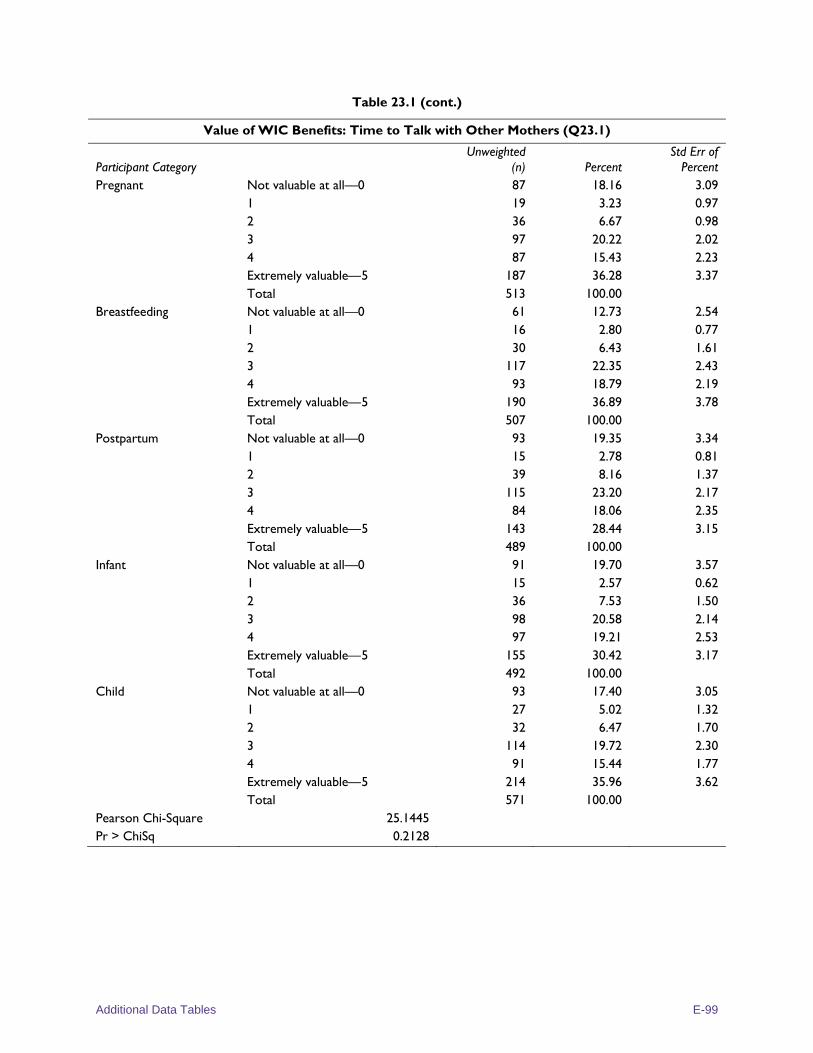
Additional Data Tables E-99
Table 23.1 (cont.)
Value of WIC Benefits: Time to Talk with Other Mothers (Q23.1)
Participant Category Unweighted
(n) Percent Std Err of
Percent Pregnant Not valuable at all—0 87 18.16 3.09
1 19 3.23 0.97 2 36 6.67 0.98 3 97 20.22 2.02 4 87 15.43 2.23 Extremely valuable—5 187 36.28 3.37 Total 513 100.00
Breastfeeding Not valuable at all—0 61 12.73 2.54 1 16 2.80 0.77 2 30 6.43 1.61 3 117 22.35 2.43 4 93 18.79 2.19 Extremely valuable—5 190 36.89 3.78 Total 507 100.00
Postpartum Not valuable at all—0 93 19.35 3.34 1 15 2.78 0.81 2 39 8.16 1.37 3 115 23.20 2.17 4 84 18.06 2.35 Extremely valuable—5 143 28.44 3.15 Total 489 100.00
Infant Not valuable at all—0 91 19.70 3.57 1 15 2.57 0.62 2 36 7.53 1.50 3 98 20.58 2.14 4 97 19.21 2.53 Extremely valuable—5 155 30.42 3.17 Total 492 100.00
Child Not valuable at all—0 93 17.40 3.05 1 27 5.02 1.32 2 32 6.47 1.70 3 114 19.72 2.30 4 91 15.44 1.77 Extremely valuable—5 214 35.96 3.62 Total 571 100.00
Pearson Chi-Square 25.1445 Pr > ChiSq 0.2128
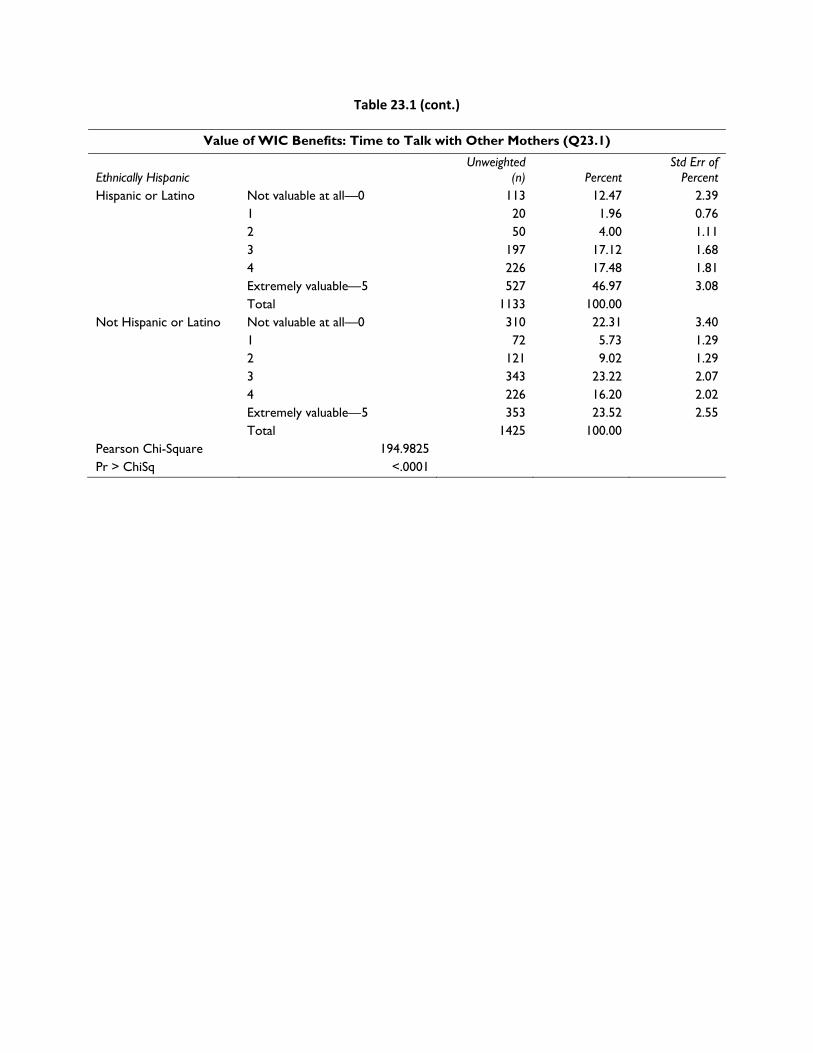
Table 23.1 (cont.)
Value of WIC Benefits: Time to Talk with Other Mothers (Q23.1)
Ethnically Hispanic Unweighted
(n) Percent Std Err of
Percent Hispanic or Latino Not valuable at all—0 113 12.47 2.39
1 20 1.96 0.76 2 50 4.00 1.11 3 197 17.12 1.68 4 226 17.48 1.81 Extremely valuable—5 527 46.97 3.08 Total 1133 100.00
Not Hispanic or Latino Not valuable at all—0 310 22.31 3.40 1 72 5.73 1.29 2 121 9.02 1.29 3 343 23.22 2.07 4 226 16.20 2.02 Extremely valuable—5 353 23.52 2.55 Total 1425 100.00
Pearson Chi-Square 194.9825 Pr > ChiSq <.0001
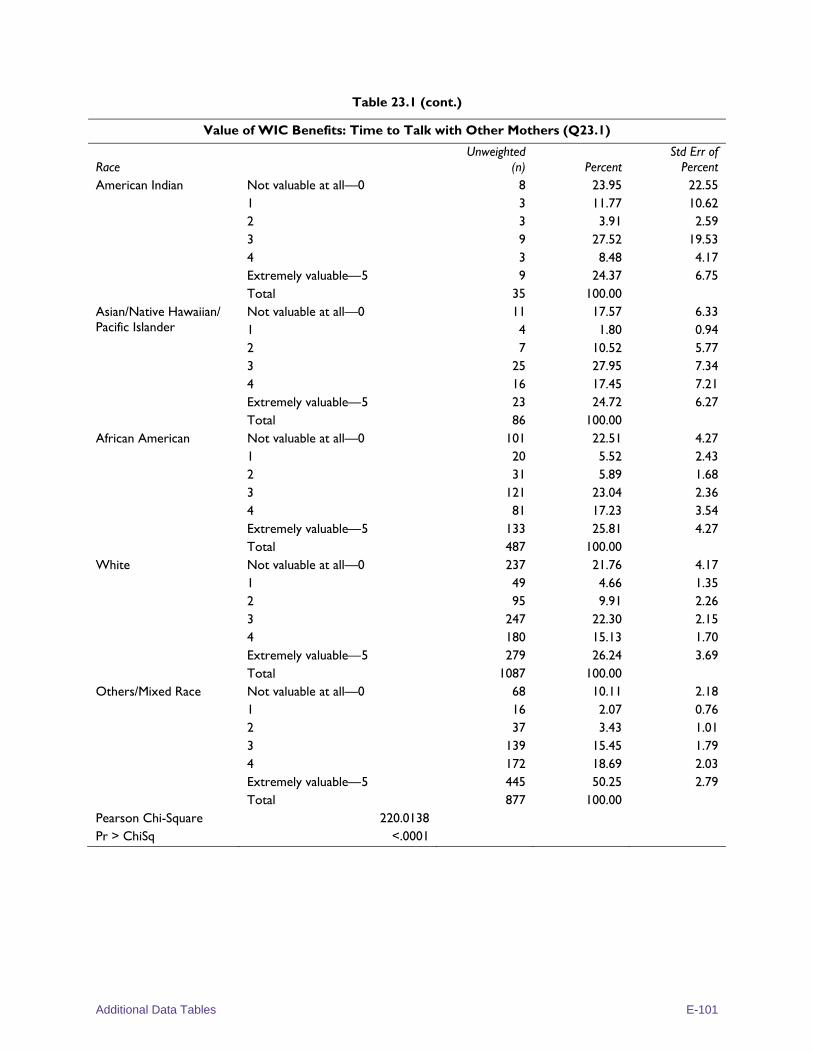
Additional Data Tables E-101
Table 23.1 (cont.)
Value of WIC Benefits: Time to Talk with Other Mothers (Q23.1)
Race Unweighted
(n) Percent Std Err of
Percent American Indian Not valuable at all—0 8 23.95 22.55
1 3 11.77 10.62 2 3 3.91 2.59 3 9 27.52 19.53 4 3 8.48 4.17 Extremely valuable—5 9 24.37 6.75 Total 35 100.00
Asian/Native Hawaiian/ Pacific Islander
Not valuable at all—0 11 17.57 6.33 1 4 1.80 0.94 2 7 10.52 5.77 3 25 27.95 7.34 4 16 17.45 7.21 Extremely valuable—5 23 24.72 6.27 Total 86 100.00
African American Not valuable at all—0 101 22.51 4.27 1 20 5.52 2.43 2 31 5.89 1.68 3 121 23.04 2.36 4 81 17.23 3.54 Extremely valuable—5 133 25.81 4.27 Total 487 100.00
White Not valuable at all—0 237 21.76 4.17 1 49 4.66 1.35 2 95 9.91 2.26 3 247 22.30 2.15 4 180 15.13 1.70 Extremely valuable—5 279 26.24 3.69 Total 1087 100.00
Others/Mixed Race Not valuable at all—0 68 10.11 2.18 1 16 2.07 0.76 2 37 3.43 1.01 3 139 15.45 1.79 4 172 18.69 2.03 Extremely valuable—5 445 50.25 2.79 Total 877 100.00
Pearson Chi-Square 220.0138 Pr > ChiSq <.0001
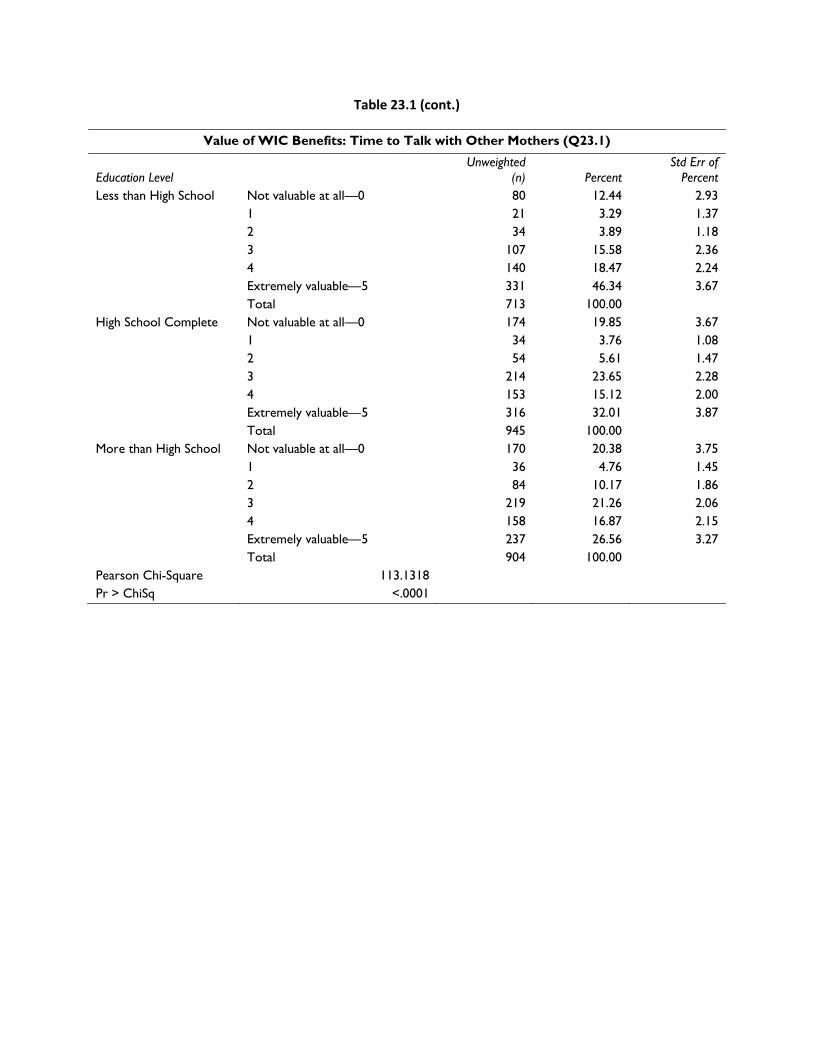
Table 23.1 (cont.)
Value of WIC Benefits: Time to Talk with Other Mothers (Q23.1)
Education Level Unweighted
(n) Percent Std Err of
Percent Less than High School Not valuable at all—0 80 12.44 2.93
1 21 3.29 1.37 2 34 3.89 1.18 3 107 15.58 2.36 4 140 18.47 2.24 Extremely valuable—5 331 46.34 3.67 Total 713 100.00
High School Complete Not valuable at all—0 174 19.85 3.67 1 34 3.76 1.08 2 54 5.61 1.47 3 214 23.65 2.28 4 153 15.12 2.00 Extremely valuable—5 316 32.01 3.87 Total 945 100.00
More than High School Not valuable at all—0 170 20.38 3.75 1 36 4.76 1.45 2 84 10.17 1.86 3 219 21.26 2.06 4 158 16.87 2.15 Extremely valuable—5 237 26.56 3.27 Total 904 100.00
Pearson Chi-Square 113.1318 Pr > ChiSq <.0001
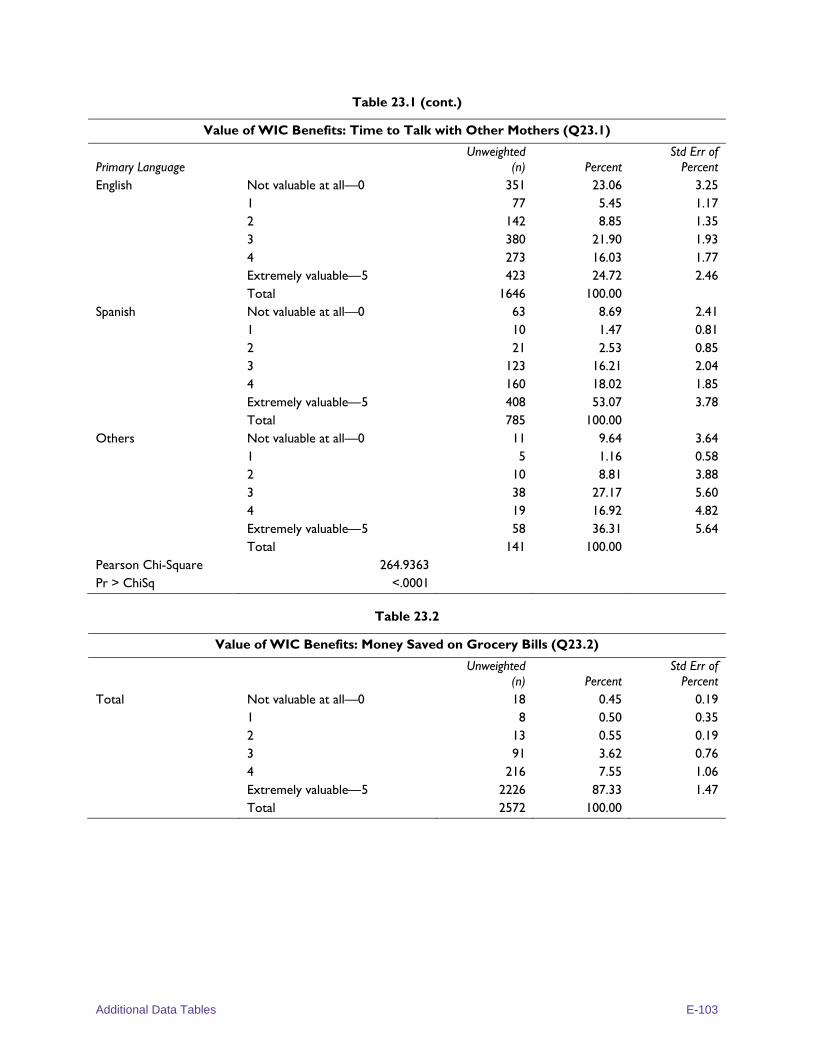
Additional Data Tables E-103
Table 23.1 (cont.)
Value of WIC Benefits: Time to Talk with Other Mothers (Q23.1)
Primary Language Unweighted
(n) Percent Std Err of
Percent English Not valuable at all—0 351 23.06 3.25
1 77 5.45 1.17 2 142 8.85 1.35 3 380 21.90 1.93 4 273 16.03 1.77 Extremely valuable—5 423 24.72 2.46 Total 1646 100.00
Spanish Not valuable at all—0 63 8.69 2.41 1 10 1.47 0.81 2 21 2.53 0.85 3 123 16.21 2.04 4 160 18.02 1.85 Extremely valuable—5 408 53.07 3.78 Total 785 100.00
Others Not valuable at all—0 11 9.64 3.64 1 5 1.16 0.58 2 10 8.81 3.88 3 38 27.17 5.60 4 19 16.92 4.82 Extremely valuable—5 58 36.31 5.64 Total 141 100.00
Pearson Chi-Square 264.9363 Pr > ChiSq <.0001
Table 23.2
Value of WIC Benefits: Money Saved on Grocery Bills (Q23.2)
Unweighted (n) Percent
Std Err of Percent
Total Not valuable at all—0 18 0.45 0.19 1 8 0.50 0.35 2 13 0.55 0.19 3 91 3.62 0.76 4 216 7.55 1.06 Extremely valuable—5 2226 87.33 1.47 Total 2572 100.00
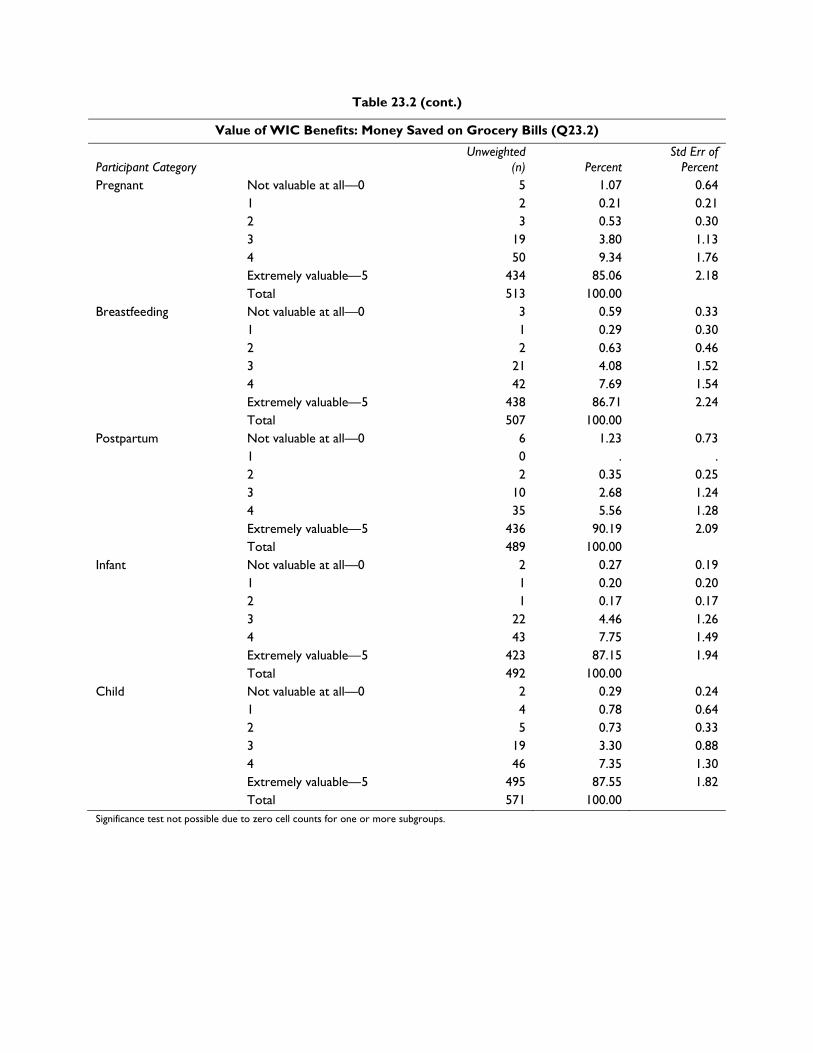
Table 23.2 (cont.)
Value of WIC Benefits: Money Saved on Grocery Bills (Q23.2)
Participant Category Unweighted
(n) Percent Std Err of
Percent Pregnant Not valuable at all—0 5 1.07 0.64
1 2 0.21 0.21 2 3 0.53 0.30 3 19 3.80 1.13 4 50 9.34 1.76 Extremely valuable—5 434 85.06 2.18 Total 513 100.00
Breastfeeding Not valuable at all—0 3 0.59 0.33 1 1 0.29 0.30 2 2 0.63 0.46 3 21 4.08 1.52 4 42 7.69 1.54 Extremely valuable—5 438 86.71 2.24 Total 507 100.00
Postpartum Not valuable at all—0 6 1.23 0.73 1 0 . . 2 2 0.35 0.25 3 10 2.68 1.24 4 35 5.56 1.28 Extremely valuable—5 436 90.19 2.09 Total 489 100.00
Infant Not valuable at all—0 2 0.27 0.19 1 1 0.20 0.20 2 1 0.17 0.17 3 22 4.46 1.26 4 43 7.75 1.49 Extremely valuable—5 423 87.15 1.94 Total 492 100.00
Child Not valuable at all—0 2 0.29 0.24 1 4 0.78 0.64 2 5 0.73 0.33 3 19 3.30 0.88 4 46 7.35 1.30 Extremely valuable—5 495 87.55 1.82 Total 571 100.00
Significance test not possible due to zero cell counts for one or more subgroups.
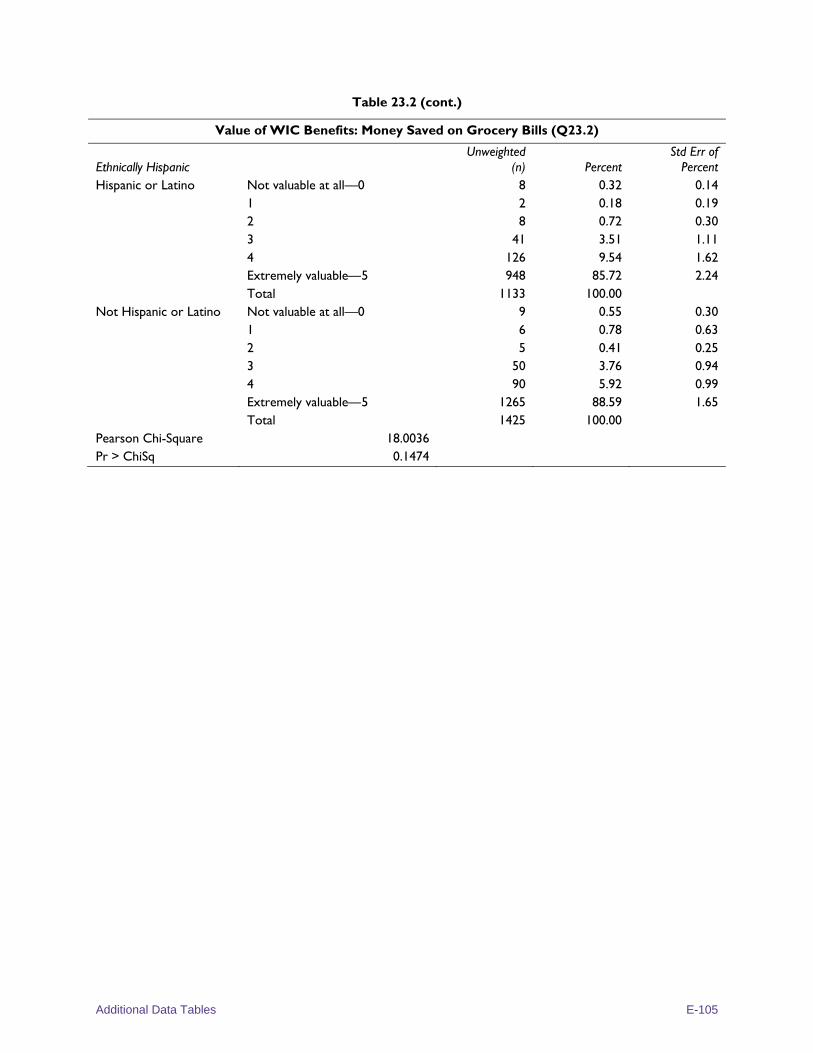
Additional Data Tables E-105
Table 23.2 (cont.)
Value of WIC Benefits: Money Saved on Grocery Bills (Q23.2)
Ethnically Hispanic Unweighted
(n) Percent Std Err of
Percent Hispanic or Latino Not valuable at all—0 8 0.32 0.14
1 2 0.18 0.19 2 8 0.72 0.30 3 41 3.51 1.11 4 126 9.54 1.62 Extremely valuable—5 948 85.72 2.24 Total 1133 100.00
Not Hispanic or Latino Not valuable at all—0 9 0.55 0.30 1 6 0.78 0.63 2 5 0.41 0.25 3 50 3.76 0.94 4 90 5.92 0.99 Extremely valuable—5 1265 88.59 1.65 Total 1425 100.00
Pearson Chi-Square 18.0036 Pr > ChiSq 0.1474
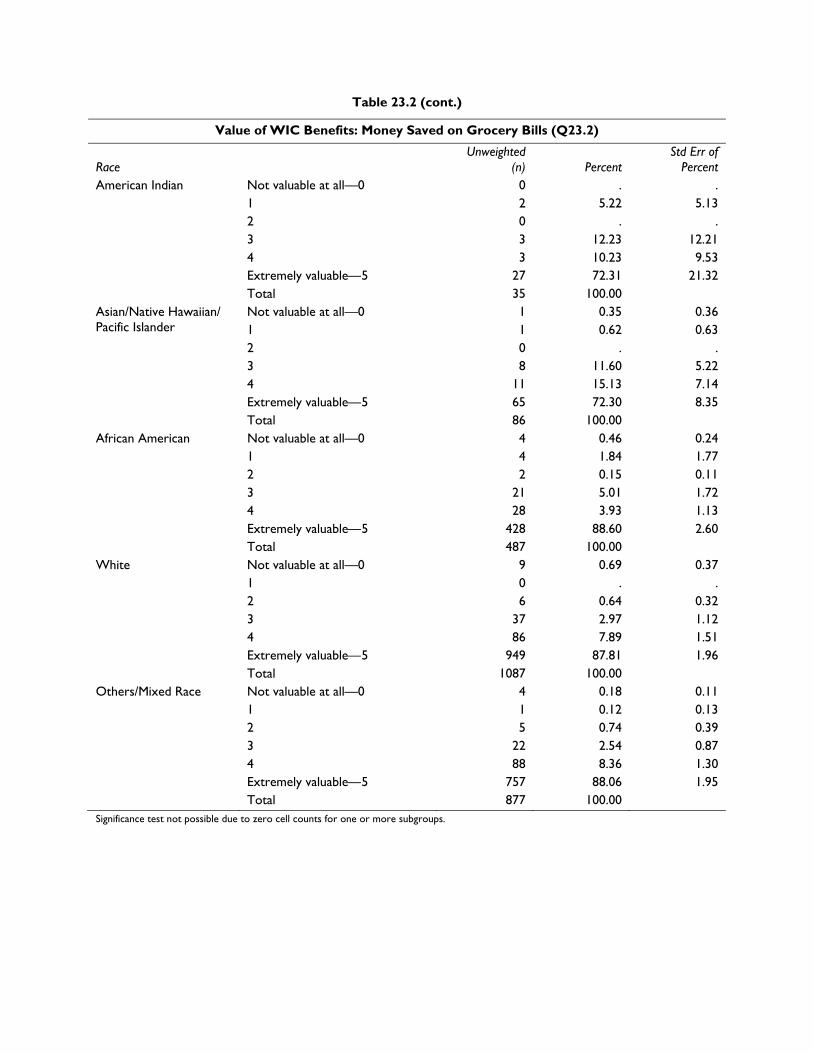
Table 23.2 (cont.)
Value of WIC Benefits: Money Saved on Grocery Bills (Q23.2)
Race Unweighted
(n) Percent Std Err of
Percent American Indian Not valuable at all—0 0 . .
1 2 5.22 5.13 2 0 . . 3 3 12.23 12.21 4 3 10.23 9.53 Extremely valuable—5 27 72.31 21.32 Total 35 100.00
Asian/Native Hawaiian/ Pacific Islander
Not valuable at all—0 1 0.35 0.36 1 1 0.62 0.63 2 0 . . 3 8 11.60 5.22 4 11 15.13 7.14 Extremely valuable—5 65 72.30 8.35 Total 86 100.00
African American Not valuable at all—0 4 0.46 0.24 1 4 1.84 1.77 2 2 0.15 0.11 3 21 5.01 1.72 4 28 3.93 1.13 Extremely valuable—5 428 88.60 2.60 Total 487 100.00
White Not valuable at all—0 9 0.69 0.37 1 0 . . 2 6 0.64 0.32 3 37 2.97 1.12 4 86 7.89 1.51 Extremely valuable—5 949 87.81 1.96 Total 1087 100.00
Others/Mixed Race Not valuable at all—0 4 0.18 0.11 1 1 0.12 0.13 2 5 0.74 0.39 3 22 2.54 0.87 4 88 8.36 1.30 Extremely valuable—5 757 88.06 1.95 Total 877 100.00
Significance test not possible due to zero cell counts for one or more subgroups.
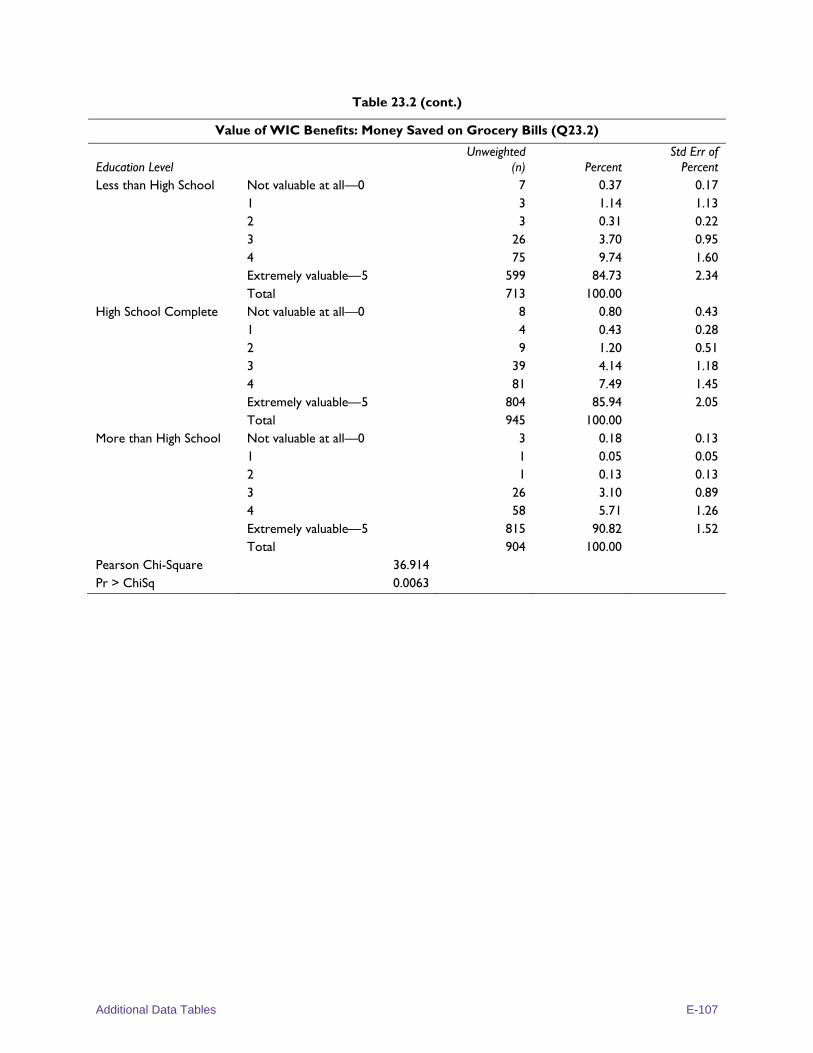
Additional Data Tables E-107
Table 23.2 (cont.)
Value of WIC Benefits: Money Saved on Grocery Bills (Q23.2)
Education Level Unweighted
(n) Percent Std Err of
Percent Less than High School Not valuable at all—0 7 0.37 0.17
1 3 1.14 1.13 2 3 0.31 0.22 3 26 3.70 0.95 4 75 9.74 1.60 Extremely valuable—5 599 84.73 2.34 Total 713 100.00
High School Complete Not valuable at all—0 8 0.80 0.43 1 4 0.43 0.28 2 9 1.20 0.51 3 39 4.14 1.18 4 81 7.49 1.45 Extremely valuable—5 804 85.94 2.05 Total 945 100.00
More than High School Not valuable at all—0 3 0.18 0.13 1 1 0.05 0.05 2 1 0.13 0.13 3 26 3.10 0.89 4 58 5.71 1.26 Extremely valuable—5 815 90.82 1.52 Total 904 100.00
Pearson Chi-Square 36.914 Pr > ChiSq 0.0063
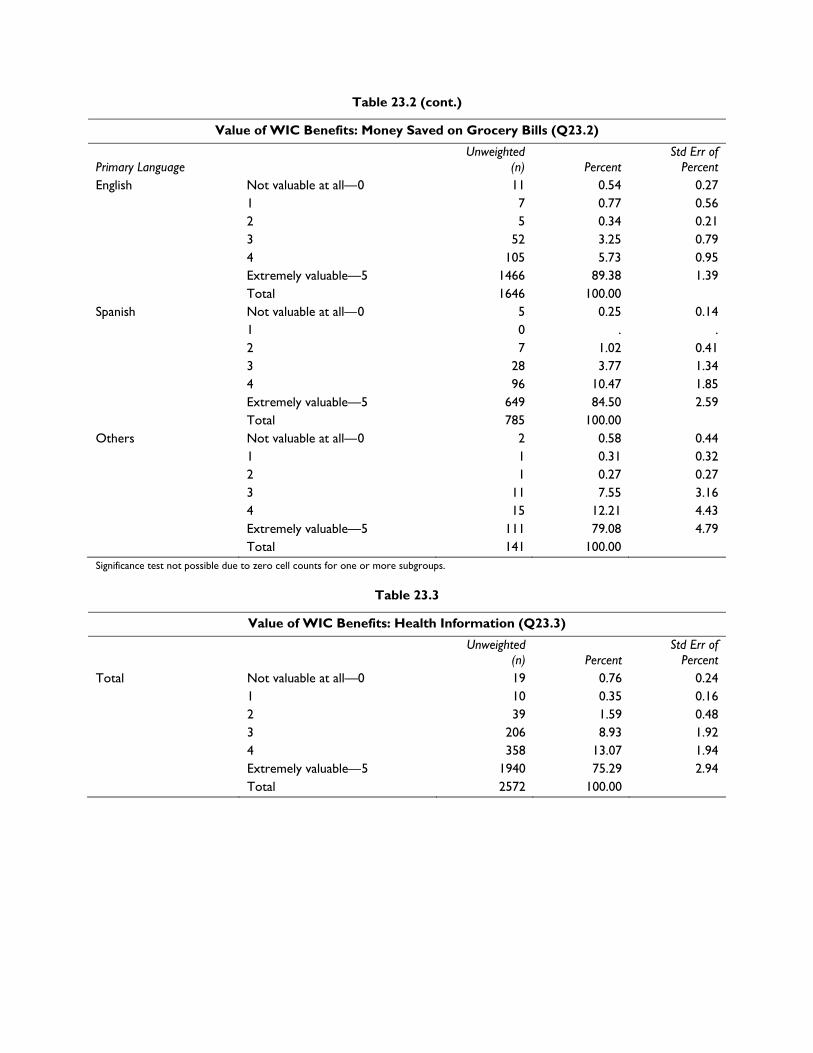
Table 23.2 (cont.)
Value of WIC Benefits: Money Saved on Grocery Bills (Q23.2)
Primary Language Unweighted
(n) Percent Std Err of
Percent English Not valuable at all—0 11 0.54 0.27
1 7 0.77 0.56 2 5 0.34 0.21 3 52 3.25 0.79 4 105 5.73 0.95 Extremely valuable—5 1466 89.38 1.39 Total 1646 100.00
Spanish Not valuable at all—0 5 0.25 0.14 1 0 . . 2 7 1.02 0.41 3 28 3.77 1.34 4 96 10.47 1.85 Extremely valuable—5 649 84.50 2.59 Total 785 100.00
Others Not valuable at all—0 2 0.58 0.44 1 1 0.31 0.32 2 1 0.27 0.27 3 11 7.55 3.16 4 15 12.21 4.43 Extremely valuable—5 111 79.08 4.79 Total 141 100.00
Significance test not possible due to zero cell counts for one or more subgroups.
Table 23.3
Value of WIC Benefits: Health Information (Q23.3)
Unweighted (n) Percent
Std Err of Percent
Total Not valuable at all—0 19 0.76 0.24 1 10 0.35 0.16 2 39 1.59 0.48 3 206 8.93 1.92 4 358 13.07 1.94 Extremely valuable—5 1940 75.29 2.94 Total 2572 100.00
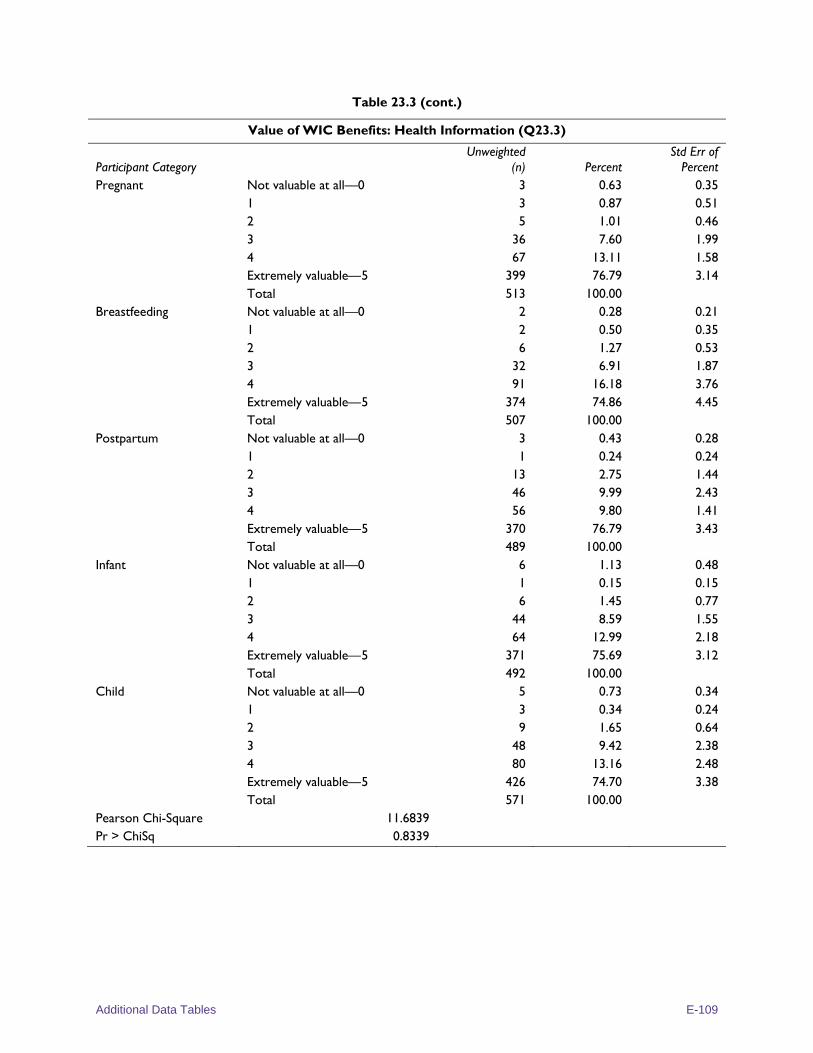
Additional Data Tables E-109
Table 23.3 (cont.)
Value of WIC Benefits: Health Information (Q23.3)
Participant Category Unweighted
(n) Percent Std Err of
Percent Pregnant Not valuable at all—0 3 0.63 0.35
1 3 0.87 0.51 2 5 1.01 0.46 3 36 7.60 1.99 4 67 13.11 1.58 Extremely valuable—5 399 76.79 3.14 Total 513 100.00
Breastfeeding Not valuable at all—0 2 0.28 0.21 1 2 0.50 0.35 2 6 1.27 0.53 3 32 6.91 1.87 4 91 16.18 3.76 Extremely valuable—5 374 74.86 4.45 Total 507 100.00
Postpartum Not valuable at all—0 3 0.43 0.28 1 1 0.24 0.24 2 13 2.75 1.44 3 46 9.99 2.43 4 56 9.80 1.41 Extremely valuable—5 370 76.79 3.43 Total 489 100.00
Infant Not valuable at all—0 6 1.13 0.48 1 1 0.15 0.15 2 6 1.45 0.77 3 44 8.59 1.55 4 64 12.99 2.18 Extremely valuable—5 371 75.69 3.12 Total 492 100.00
Child Not valuable at all—0 5 0.73 0.34 1 3 0.34 0.24 2 9 1.65 0.64 3 48 9.42 2.38 4 80 13.16 2.48 Extremely valuable—5 426 74.70 3.38 Total 571 100.00
Pearson Chi-Square 11.6839 Pr > ChiSq 0.8339
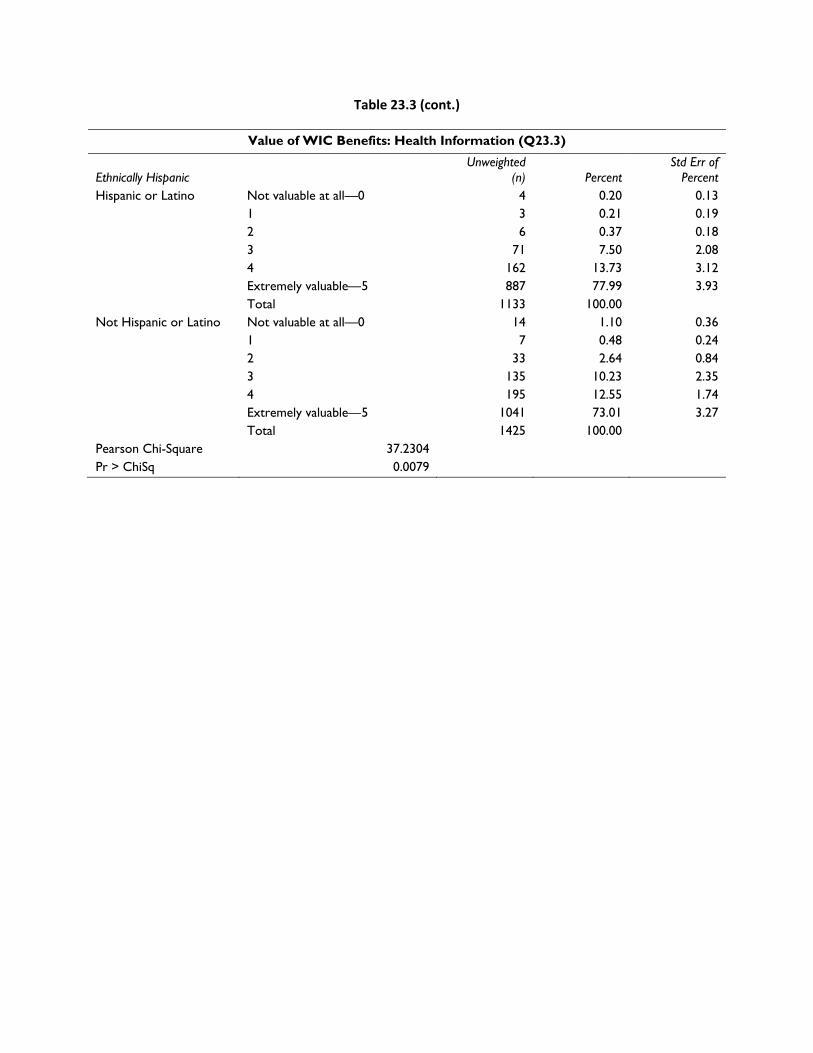
Table 23.3 (cont.)
Value of WIC Benefits: Health Information (Q23.3)
Ethnically Hispanic Unweighted
(n) Percent Std Err of
Percent Hispanic or Latino Not valuable at all—0 4 0.20 0.13
1 3 0.21 0.19 2 6 0.37 0.18 3 71 7.50 2.08 4 162 13.73 3.12 Extremely valuable—5 887 77.99 3.93 Total 1133 100.00
Not Hispanic or Latino Not valuable at all—0 14 1.10 0.36 1 7 0.48 0.24 2 33 2.64 0.84 3 135 10.23 2.35 4 195 12.55 1.74 Extremely valuable—5 1041 73.01 3.27 Total 1425 100.00
Pearson Chi-Square 37.2304 Pr > ChiSq 0.0079
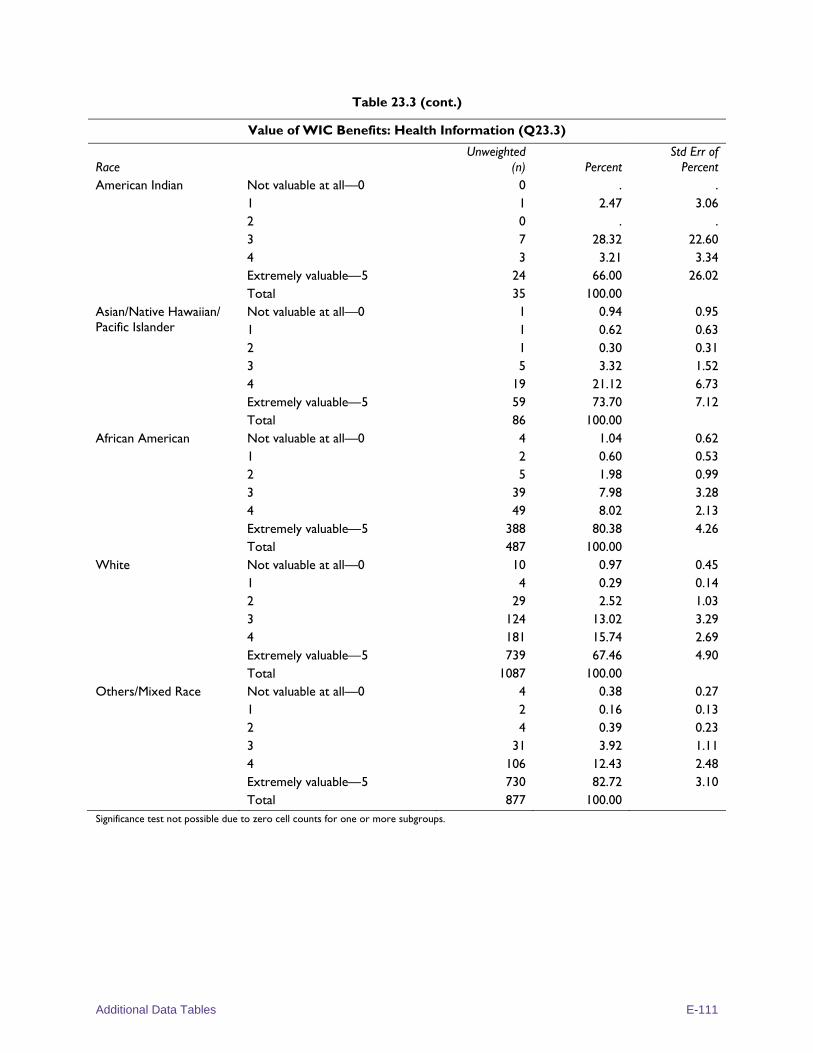
Additional Data Tables E-111
Table 23.3 (cont.)
Value of WIC Benefits: Health Information (Q23.3)
Race Unweighted
(n) Percent Std Err of
Percent American Indian Not valuable at all—0 0 . .
1 1 2.47 3.06 2 0 . . 3 7 28.32 22.60 4 3 3.21 3.34 Extremely valuable—5 24 66.00 26.02 Total 35 100.00
Asian/Native Hawaiian/ Pacific Islander
Not valuable at all—0 1 0.94 0.95 1 1 0.62 0.63 2 1 0.30 0.31 3 5 3.32 1.52 4 19 21.12 6.73 Extremely valuable—5 59 73.70 7.12 Total 86 100.00
African American Not valuable at all—0 4 1.04 0.62 1 2 0.60 0.53 2 5 1.98 0.99 3 39 7.98 3.28 4 49 8.02 2.13 Extremely valuable—5 388 80.38 4.26 Total 487 100.00
White Not valuable at all—0 10 0.97 0.45 1 4 0.29 0.14 2 29 2.52 1.03 3 124 13.02 3.29 4 181 15.74 2.69 Extremely valuable—5 739 67.46 4.90 Total 1087 100.00
Others/Mixed Race Not valuable at all—0 4 0.38 0.27 1 2 0.16 0.13 2 4 0.39 0.23 3 31 3.92 1.11 4 106 12.43 2.48 Extremely valuable—5 730 82.72 3.10 Total 877 100.00
Significance test not possible due to zero cell counts for one or more subgroups.
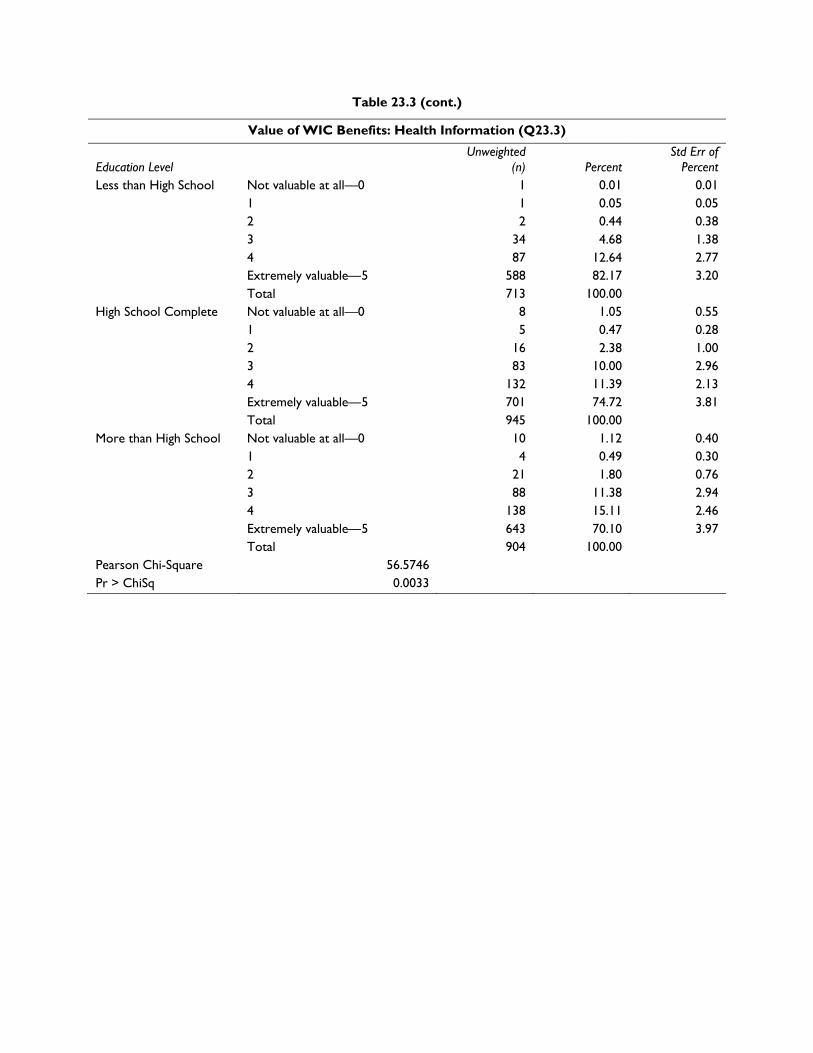
Table 23.3 (cont.)
Value of WIC Benefits: Health Information (Q23.3)
Education Level Unweighted
(n) Percent Std Err of
Percent Less than High School Not valuable at all—0 1 0.01 0.01
1 1 0.05 0.05 2 2 0.44 0.38 3 34 4.68 1.38 4 87 12.64 2.77 Extremely valuable—5 588 82.17 3.20 Total 713 100.00
High School Complete Not valuable at all—0 8 1.05 0.55 1 5 0.47 0.28 2 16 2.38 1.00 3 83 10.00 2.96 4 132 11.39 2.13 Extremely valuable—5 701 74.72 3.81 Total 945 100.00
More than High School Not valuable at all—0 10 1.12 0.40 1 4 0.49 0.30 2 21 1.80 0.76 3 88 11.38 2.94 4 138 15.11 2.46 Extremely valuable—5 643 70.10 3.97 Total 904 100.00
Pearson Chi-Square 56.5746 Pr > ChiSq 0.0033
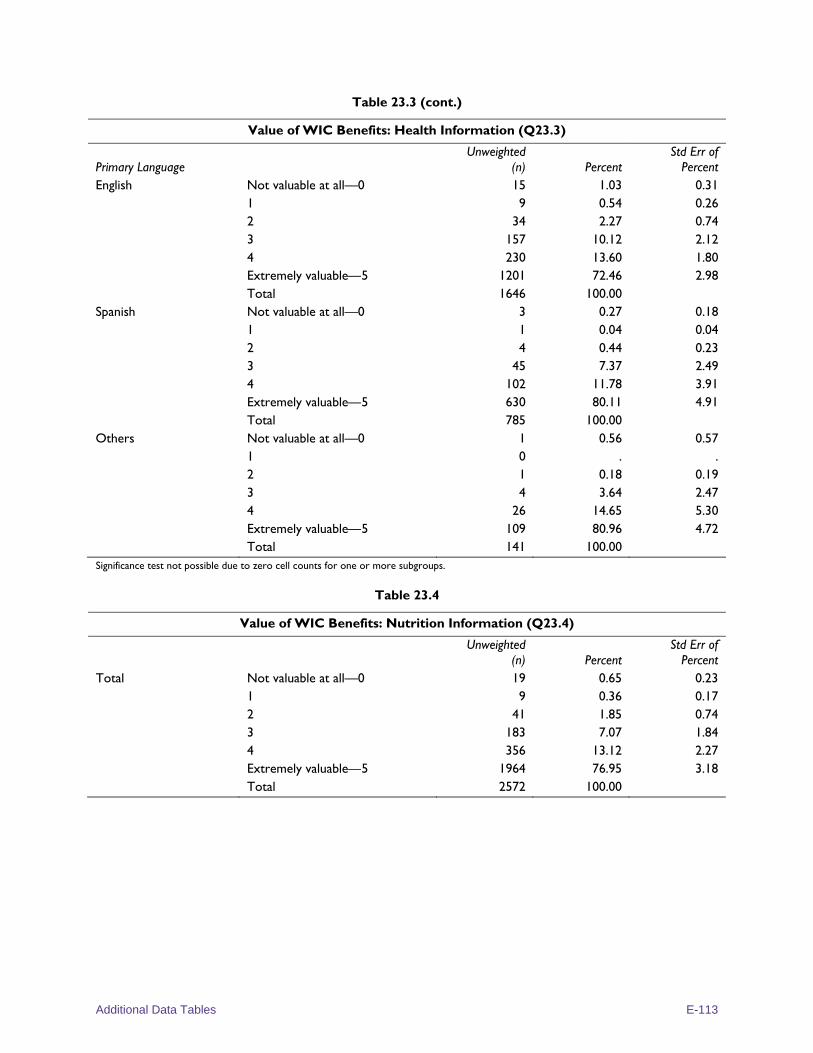
Additional Data Tables E-113
Table 23.3 (cont.)
Value of WIC Benefits: Health Information (Q23.3)
Primary Language Unweighted
(n) Percent Std Err of
Percent English Not valuable at all—0 15 1.03 0.31
1 9 0.54 0.26 2 34 2.27 0.74 3 157 10.12 2.12 4 230 13.60 1.80 Extremely valuable—5 1201 72.46 2.98 Total 1646 100.00
Spanish Not valuable at all—0 3 0.27 0.18 1 1 0.04 0.04 2 4 0.44 0.23 3 45 7.37 2.49 4 102 11.78 3.91 Extremely valuable—5 630 80.11 4.91 Total 785 100.00
Others Not valuable at all—0 1 0.56 0.57 1 0 . . 2 1 0.18 0.19 3 4 3.64 2.47 4 26 14.65 5.30 Extremely valuable—5 109 80.96 4.72 Total 141 100.00
Significance test not possible due to zero cell counts for one or more subgroups.
Table 23.4
Value of WIC Benefits: Nutrition Information (Q23.4)
Unweighted (n) Percent
Std Err of Percent
Total Not valuable at all—0 19 0.65 0.23 1 9 0.36 0.17 2 41 1.85 0.74 3 183 7.07 1.84 4 356 13.12 2.27 Extremely valuable—5 1964 76.95 3.18 Total 2572 100.00
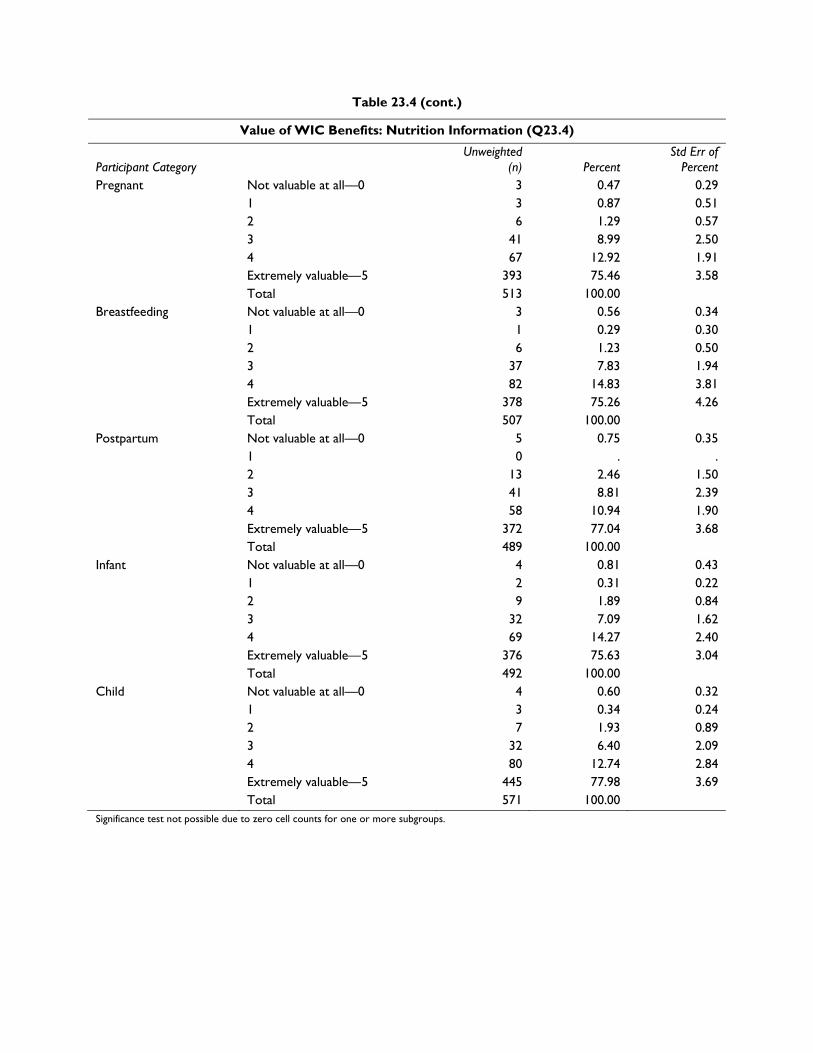
Table 23.4 (cont.)
Value of WIC Benefits: Nutrition Information (Q23.4)
Participant Category Unweighted
(n) Percent Std Err of
Percent Pregnant Not valuable at all—0 3 0.47 0.29
1 3 0.87 0.51 2 6 1.29 0.57 3 41 8.99 2.50 4 67 12.92 1.91 Extremely valuable—5 393 75.46 3.58 Total 513 100.00
Breastfeeding Not valuable at all—0 3 0.56 0.34 1 1 0.29 0.30 2 6 1.23 0.50 3 37 7.83 1.94 4 82 14.83 3.81 Extremely valuable—5 378 75.26 4.26 Total 507 100.00
Postpartum Not valuable at all—0 5 0.75 0.35 1 0 . . 2 13 2.46 1.50 3 41 8.81 2.39 4 58 10.94 1.90 Extremely valuable—5 372 77.04 3.68 Total 489 100.00
Infant Not valuable at all—0 4 0.81 0.43 1 2 0.31 0.22 2 9 1.89 0.84 3 32 7.09 1.62 4 69 14.27 2.40 Extremely valuable—5 376 75.63 3.04 Total 492 100.00
Child Not valuable at all—0 4 0.60 0.32 1 3 0.34 0.24 2 7 1.93 0.89 3 32 6.40 2.09 4 80 12.74 2.84 Extremely valuable—5 445 77.98 3.69 Total 571 100.00
Significance test not possible due to zero cell counts for one or more subgroups.
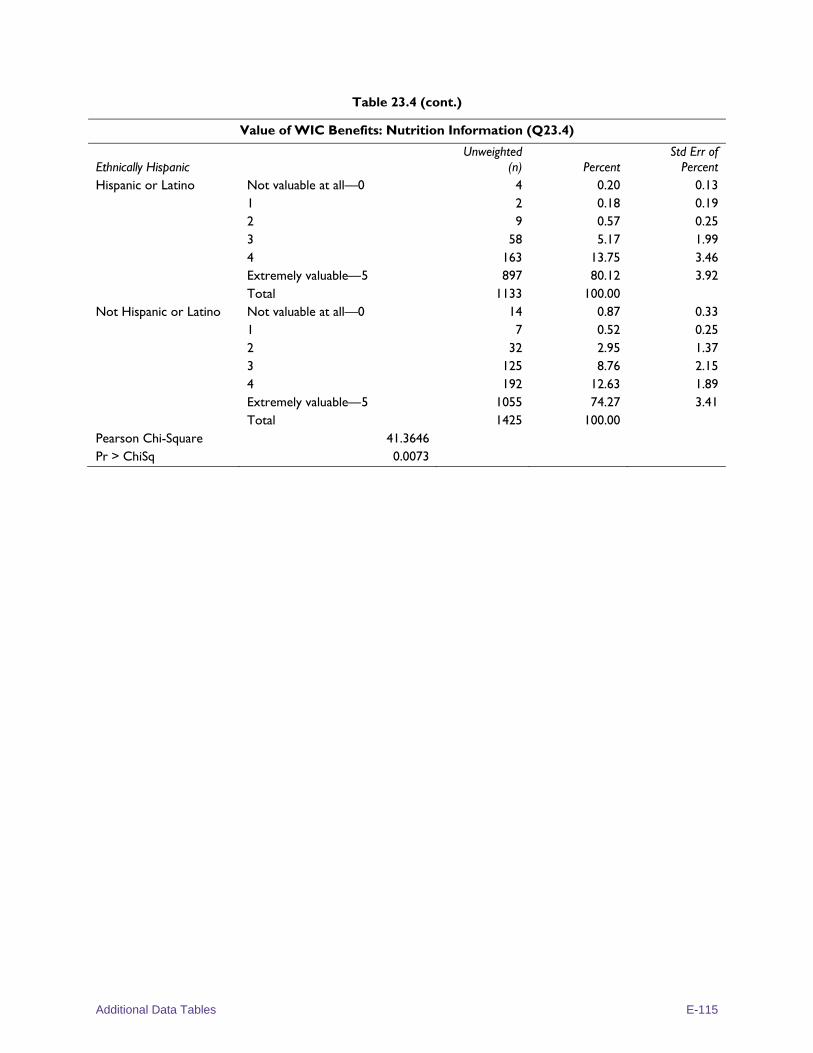
Additional Data Tables E-115
Table 23.4 (cont.)
Value of WIC Benefits: Nutrition Information (Q23.4)
Ethnically Hispanic Unweighted
(n) Percent Std Err of
Percent Hispanic or Latino Not valuable at all—0 4 0.20 0.13
1 2 0.18 0.19 2 9 0.57 0.25 3 58 5.17 1.99 4 163 13.75 3.46 Extremely valuable—5 897 80.12 3.92 Total 1133 100.00
Not Hispanic or Latino Not valuable at all—0 14 0.87 0.33 1 7 0.52 0.25 2 32 2.95 1.37 3 125 8.76 2.15 4 192 12.63 1.89 Extremely valuable—5 1055 74.27 3.41 Total 1425 100.00
Pearson Chi-Square 41.3646 Pr > ChiSq 0.0073
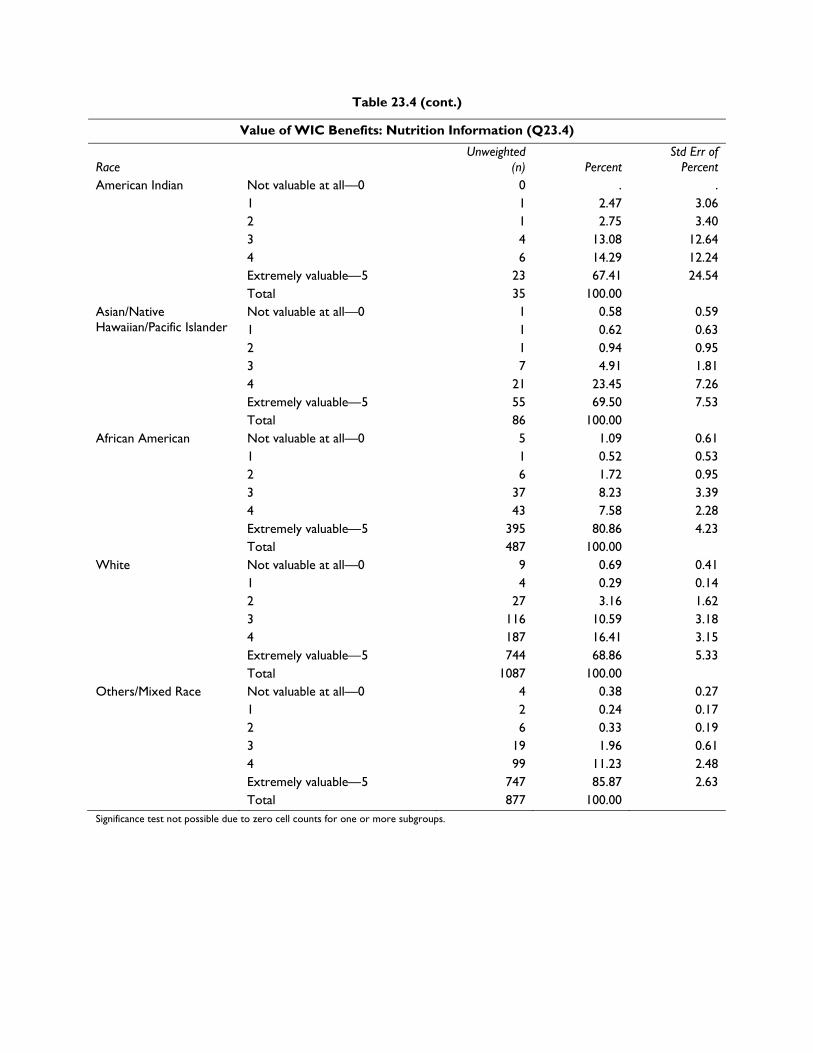
Table 23.4 (cont.)
Value of WIC Benefits: Nutrition Information (Q23.4)
Race Unweighted
(n) Percent Std Err of
Percent American Indian Not valuable at all—0 0 . .
1 1 2.47 3.06 2 1 2.75 3.40 3 4 13.08 12.64 4 6 14.29 12.24 Extremely valuable—5 23 67.41 24.54 Total 35 100.00
Asian/Native Hawaiian/Pacific Islander
Not valuable at all—0 1 0.58 0.59 1 1 0.62 0.63 2 1 0.94 0.95 3 7 4.91 1.81 4 21 23.45 7.26 Extremely valuable—5 55 69.50 7.53 Total 86 100.00
African American Not valuable at all—0 5 1.09 0.61 1 1 0.52 0.53 2 6 1.72 0.95 3 37 8.23 3.39 4 43 7.58 2.28 Extremely valuable—5 395 80.86 4.23 Total 487 100.00
White Not valuable at all—0 9 0.69 0.41 1 4 0.29 0.14 2 27 3.16 1.62 3 116 10.59 3.18 4 187 16.41 3.15 Extremely valuable—5 744 68.86 5.33 Total 1087 100.00
Others/Mixed Race Not valuable at all—0 4 0.38 0.27 1 2 0.24 0.17 2 6 0.33 0.19 3 19 1.96 0.61 4 99 11.23 2.48 Extremely valuable—5 747 85.87 2.63 Total 877 100.00
Significance test not possible due to zero cell counts for one or more subgroups.
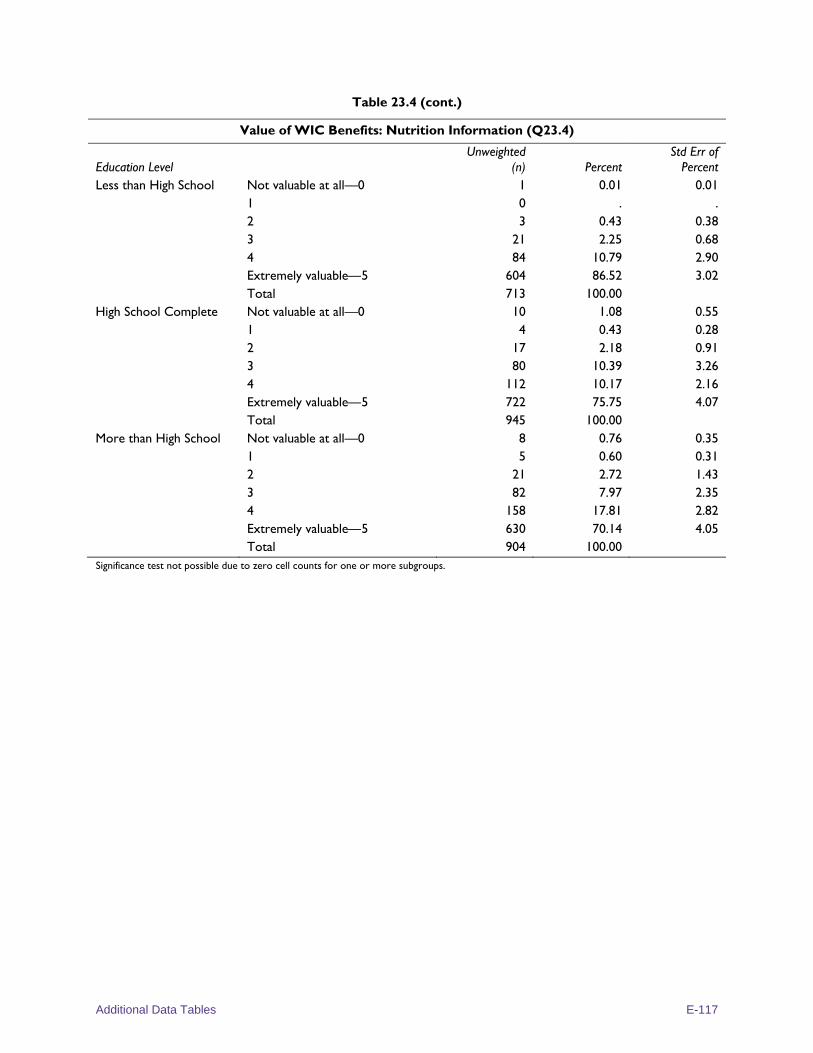
Additional Data Tables E-117
Table 23.4 (cont.)
Value of WIC Benefits: Nutrition Information (Q23.4)
Education Level Unweighted
(n) Percent Std Err of
Percent Less than High School Not valuable at all—0 1 0.01 0.01
1 0 . . 2 3 0.43 0.38 3 21 2.25 0.68 4 84 10.79 2.90 Extremely valuable—5 604 86.52 3.02 Total 713 100.00
High School Complete Not valuable at all—0 10 1.08 0.55 1 4 0.43 0.28 2 17 2.18 0.91 3 80 10.39 3.26 4 112 10.17 2.16 Extremely valuable—5 722 75.75 4.07 Total 945 100.00
More than High School Not valuable at all—0 8 0.76 0.35 1 5 0.60 0.31 2 21 2.72 1.43 3 82 7.97 2.35 4 158 17.81 2.82 Extremely valuable—5 630 70.14 4.05 Total 904 100.00
Significance test not possible due to zero cell counts for one or more subgroups.
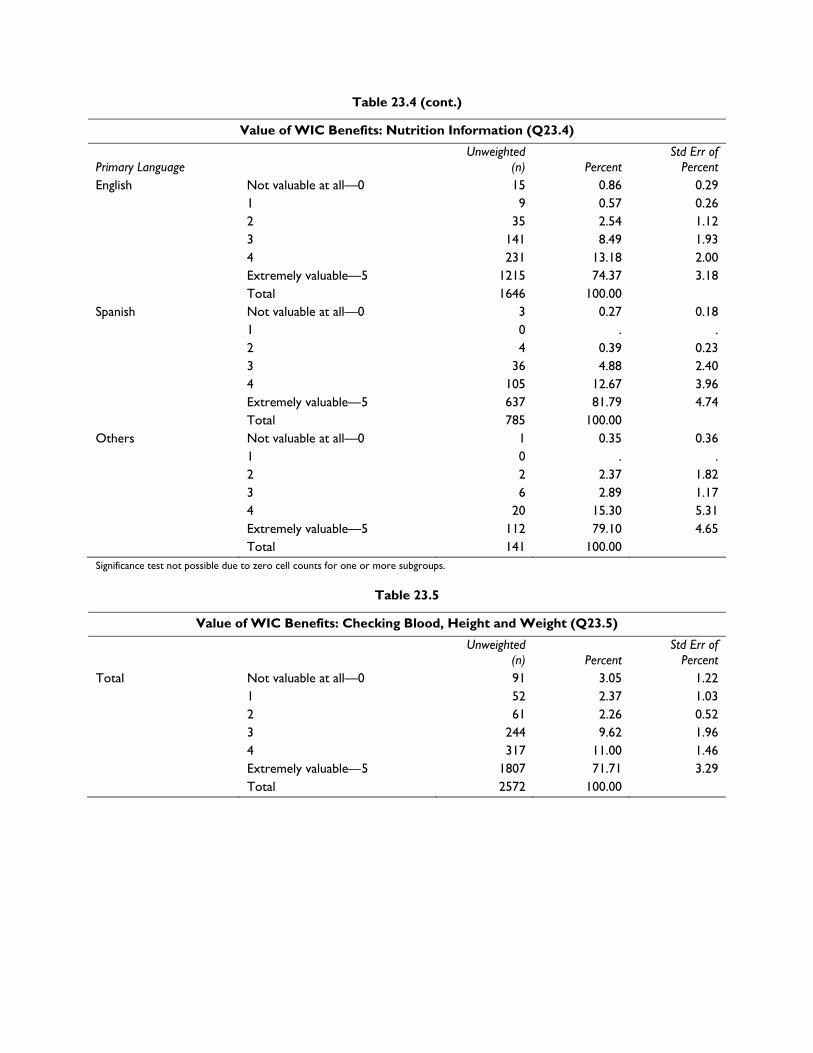
Table 23.4 (cont.)
Value of WIC Benefits: Nutrition Information (Q23.4)
Primary Language Unweighted
(n) Percent Std Err of
Percent English Not valuable at all—0 15 0.86 0.29
1 9 0.57 0.26 2 35 2.54 1.12 3 141 8.49 1.93 4 231 13.18 2.00 Extremely valuable—5 1215 74.37 3.18 Total 1646 100.00
Spanish Not valuable at all—0 3 0.27 0.18 1 0 . . 2 4 0.39 0.23 3 36 4.88 2.40 4 105 12.67 3.96 Extremely valuable—5 637 81.79 4.74 Total 785 100.00
Others Not valuable at all—0 1 0.35 0.36 1 0 . . 2 2 2.37 1.82 3 6 2.89 1.17 4 20 15.30 5.31 Extremely valuable—5 112 79.10 4.65 Total 141 100.00
Significance test not possible due to zero cell counts for one or more subgroups.
Table 23.5
Value of WIC Benefits: Checking Blood, Height and Weight (Q23.5)
Unweighted (n) Percent
Std Err of Percent
Total Not valuable at all—0 91 3.05 1.22 1 52 2.37 1.03 2 61 2.26 0.52 3 244 9.62 1.96 4 317 11.00 1.46 Extremely valuable—5 1807 71.71 3.29 Total 2572 100.00
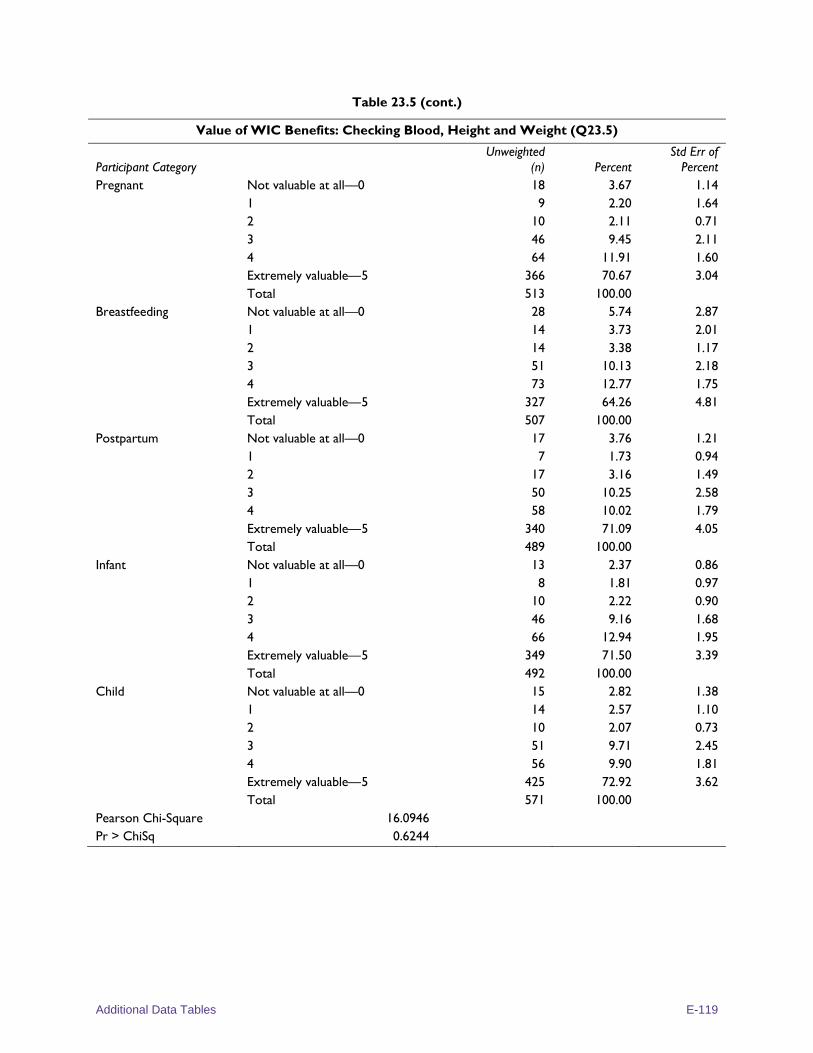
Additional Data Tables E-119
Table 23.5 (cont.)
Value of WIC Benefits: Checking Blood, Height and Weight (Q23.5)
Participant Category Unweighted
(n) Percent Std Err of
Percent Pregnant Not valuable at all—0 18 3.67 1.14
1 9 2.20 1.64 2 10 2.11 0.71 3 46 9.45 2.11 4 64 11.91 1.60 Extremely valuable—5 366 70.67 3.04 Total 513 100.00
Breastfeeding Not valuable at all—0 28 5.74 2.87 1 14 3.73 2.01 2 14 3.38 1.17 3 51 10.13 2.18 4 73 12.77 1.75 Extremely valuable—5 327 64.26 4.81 Total 507 100.00
Postpartum Not valuable at all—0 17 3.76 1.21 1 7 1.73 0.94 2 17 3.16 1.49 3 50 10.25 2.58 4 58 10.02 1.79 Extremely valuable—5 340 71.09 4.05 Total 489 100.00
Infant Not valuable at all—0 13 2.37 0.86 1 8 1.81 0.97 2 10 2.22 0.90 3 46 9.16 1.68 4 66 12.94 1.95 Extremely valuable—5 349 71.50 3.39 Total 492 100.00
Child Not valuable at all—0 15 2.82 1.38 1 14 2.57 1.10 2 10 2.07 0.73 3 51 9.71 2.45 4 56 9.90 1.81 Extremely valuable—5 425 72.92 3.62 Total 571 100.00
Pearson Chi-Square 16.0946 Pr > ChiSq 0.6244
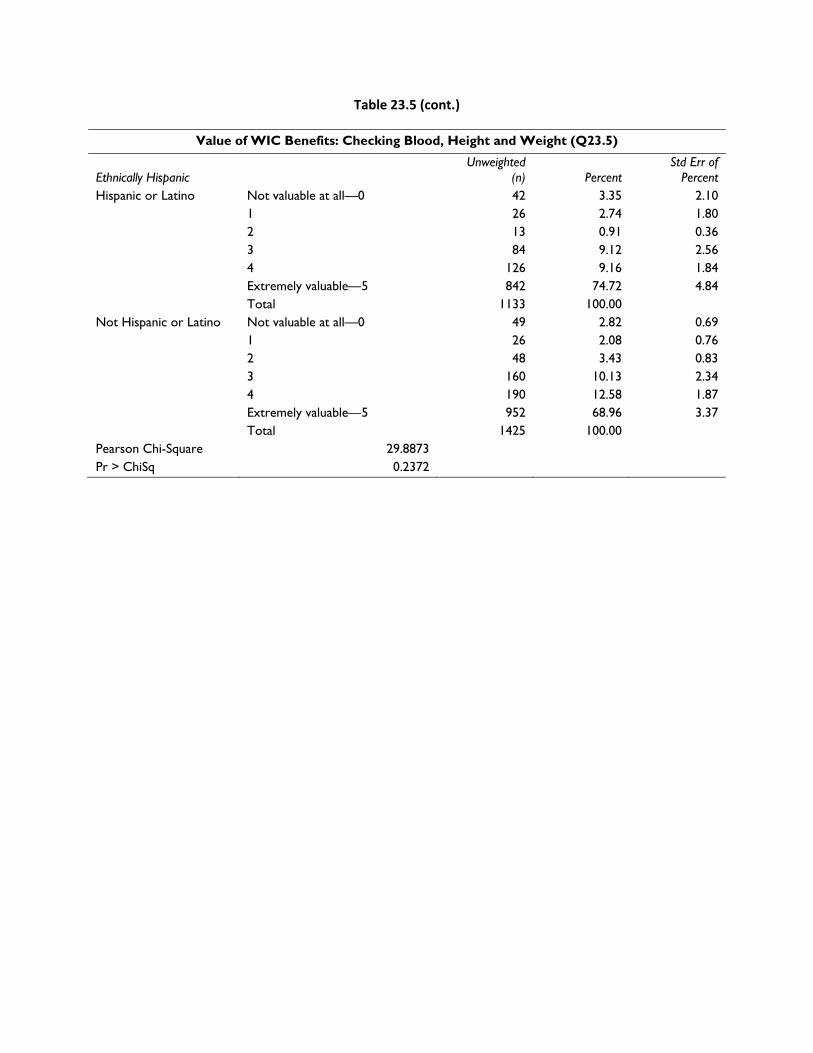
Table 23.5 (cont.)
Value of WIC Benefits: Checking Blood, Height and Weight (Q23.5)
Ethnically Hispanic Unweighted
(n) Percent Std Err of
Percent Hispanic or Latino Not valuable at all—0 42 3.35 2.10
1 26 2.74 1.80 2 13 0.91 0.36 3 84 9.12 2.56 4 126 9.16 1.84 Extremely valuable—5 842 74.72 4.84 Total 1133 100.00
Not Hispanic or Latino Not valuable at all—0 49 2.82 0.69 1 26 2.08 0.76 2 48 3.43 0.83 3 160 10.13 2.34 4 190 12.58 1.87 Extremely valuable—5 952 68.96 3.37 Total 1425 100.00
Pearson Chi-Square 29.8873 Pr > ChiSq 0.2372
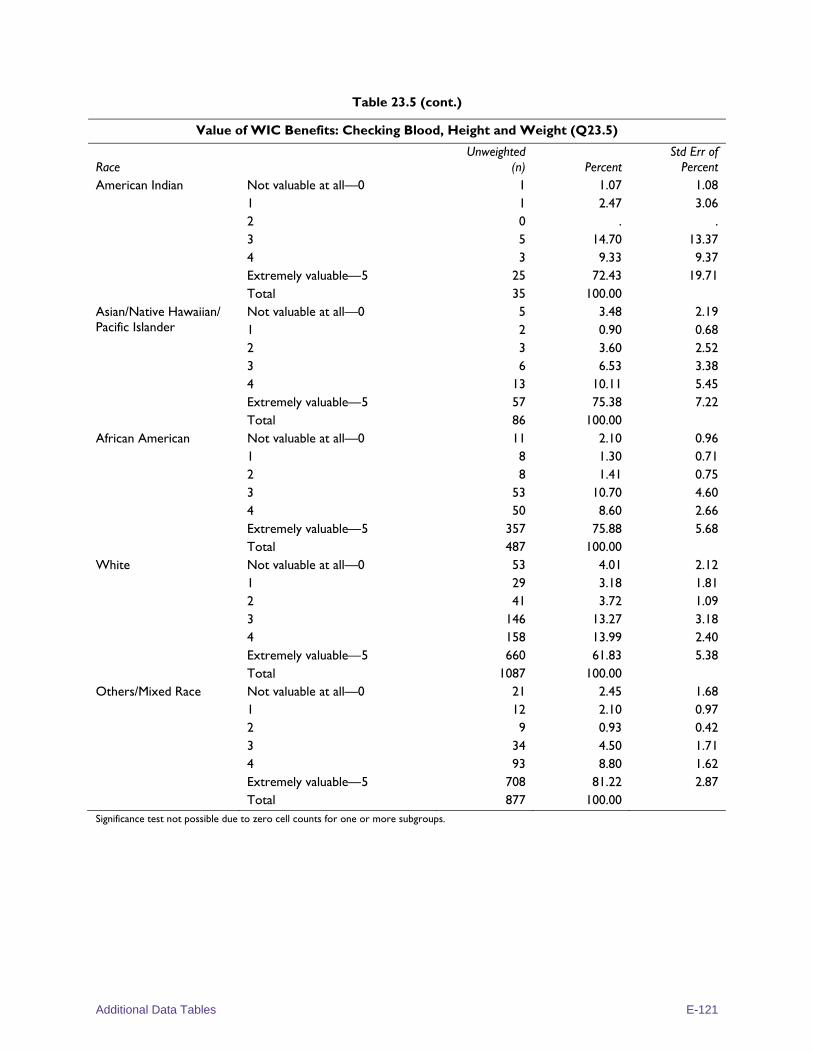
Additional Data Tables E-121
Table 23.5 (cont.)
Value of WIC Benefits: Checking Blood, Height and Weight (Q23.5)
Race Unweighted
(n) Percent Std Err of
Percent American Indian Not valuable at all—0 1 1.07 1.08
1 1 2.47 3.06 2 0 . . 3 5 14.70 13.37 4 3 9.33 9.37 Extremely valuable—5 25 72.43 19.71 Total 35 100.00
Asian/Native Hawaiian/ Pacific Islander
Not valuable at all—0 5 3.48 2.19 1 2 0.90 0.68 2 3 3.60 2.52 3 6 6.53 3.38 4 13 10.11 5.45 Extremely valuable—5 57 75.38 7.22 Total 86 100.00
African American Not valuable at all—0 11 2.10 0.96 1 8 1.30 0.71 2 8 1.41 0.75 3 53 10.70 4.60 4 50 8.60 2.66 Extremely valuable—5 357 75.88 5.68 Total 487 100.00
White Not valuable at all—0 53 4.01 2.12 1 29 3.18 1.81 2 41 3.72 1.09 3 146 13.27 3.18 4 158 13.99 2.40 Extremely valuable—5 660 61.83 5.38 Total 1087 100.00
Others/Mixed Race Not valuable at all—0 21 2.45 1.68 1 12 2.10 0.97 2 9 0.93 0.42 3 34 4.50 1.71 4 93 8.80 1.62 Extremely valuable—5 708 81.22 2.87 Total 877 100.00
Significance test not possible due to zero cell counts for one or more subgroups.
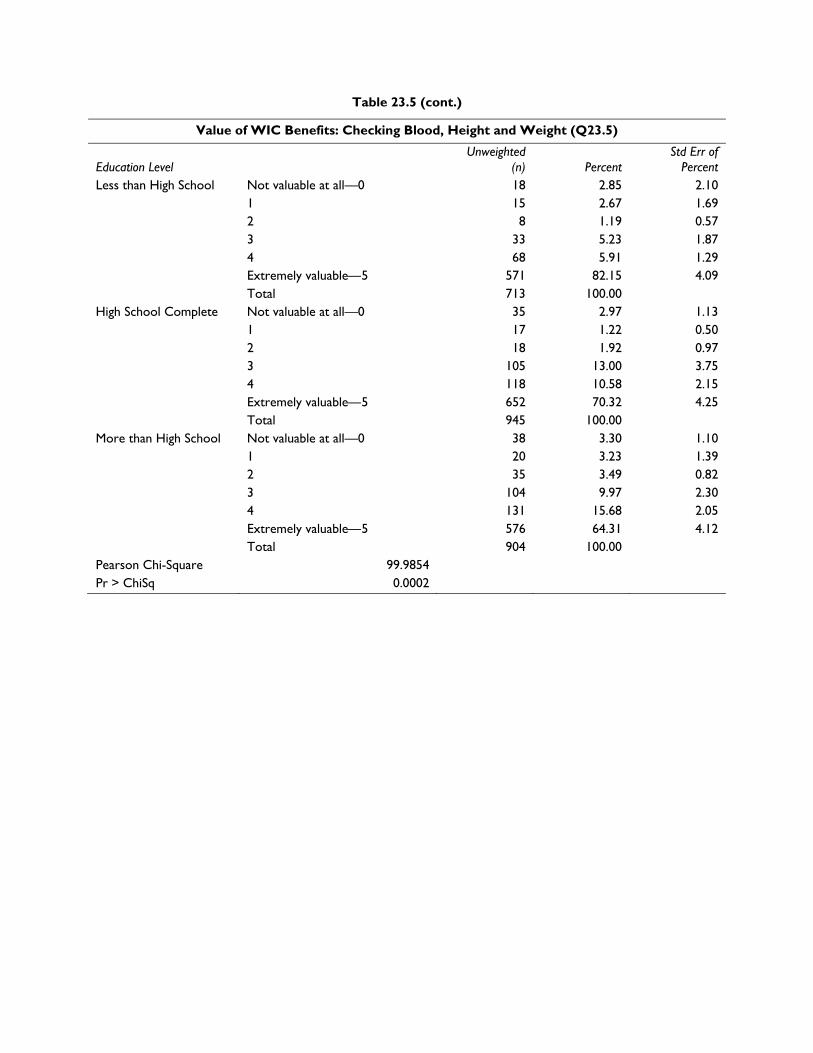
Table 23.5 (cont.)
Value of WIC Benefits: Checking Blood, Height and Weight (Q23.5)
Education Level Unweighted
(n) Percent Std Err of
Percent Less than High School Not valuable at all—0 18 2.85 2.10
1 15 2.67 1.69 2 8 1.19 0.57 3 33 5.23 1.87 4 68 5.91 1.29 Extremely valuable—5 571 82.15 4.09 Total 713 100.00
High School Complete Not valuable at all—0 35 2.97 1.13 1 17 1.22 0.50 2 18 1.92 0.97 3 105 13.00 3.75 4 118 10.58 2.15 Extremely valuable—5 652 70.32 4.25 Total 945 100.00
More than High School Not valuable at all—0 38 3.30 1.10 1 20 3.23 1.39 2 35 3.49 0.82 3 104 9.97 2.30 4 131 15.68 2.05 Extremely valuable—5 576 64.31 4.12 Total 904 100.00
Pearson Chi-Square 99.9854 Pr > ChiSq 0.0002
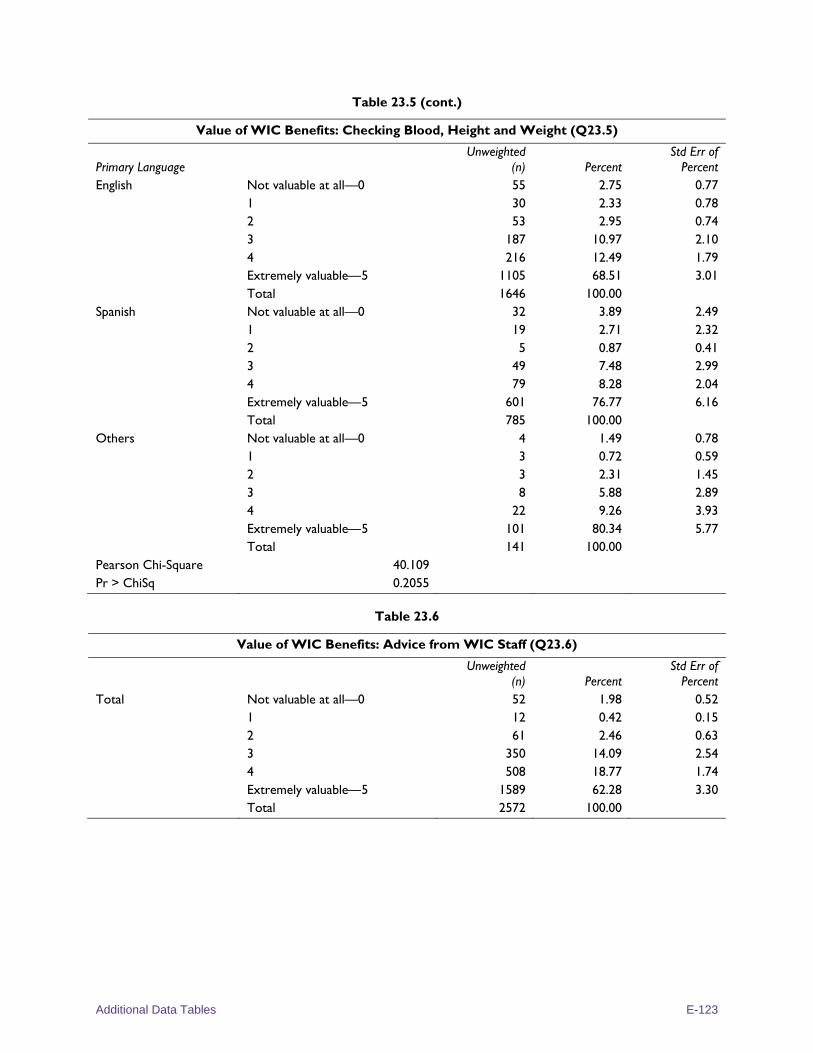
Additional Data Tables E-123
Table 23.5 (cont.)
Value of WIC Benefits: Checking Blood, Height and Weight (Q23.5)
Primary Language Unweighted
(n) Percent Std Err of
Percent English Not valuable at all—0 55 2.75 0.77
1 30 2.33 0.78 2 53 2.95 0.74 3 187 10.97 2.10 4 216 12.49 1.79 Extremely valuable—5 1105 68.51 3.01 Total 1646 100.00
Spanish Not valuable at all—0 32 3.89 2.49 1 19 2.71 2.32 2 5 0.87 0.41 3 49 7.48 2.99 4 79 8.28 2.04 Extremely valuable—5 601 76.77 6.16 Total 785 100.00
Others Not valuable at all—0 4 1.49 0.78 1 3 0.72 0.59 2 3 2.31 1.45 3 8 5.88 2.89 4 22 9.26 3.93 Extremely valuable—5 101 80.34 5.77 Total 141 100.00
Pearson Chi-Square 40.109 Pr > ChiSq 0.2055
Table 23.6
Value of WIC Benefits: Advice from WIC Staff (Q23.6)
Unweighted (n) Percent
Std Err of Percent
Total Not valuable at all—0 52 1.98 0.52 1 12 0.42 0.15 2 61 2.46 0.63 3 350 14.09 2.54 4 508 18.77 1.74 Extremely valuable—5 1589 62.28 3.30 Total 2572 100.00
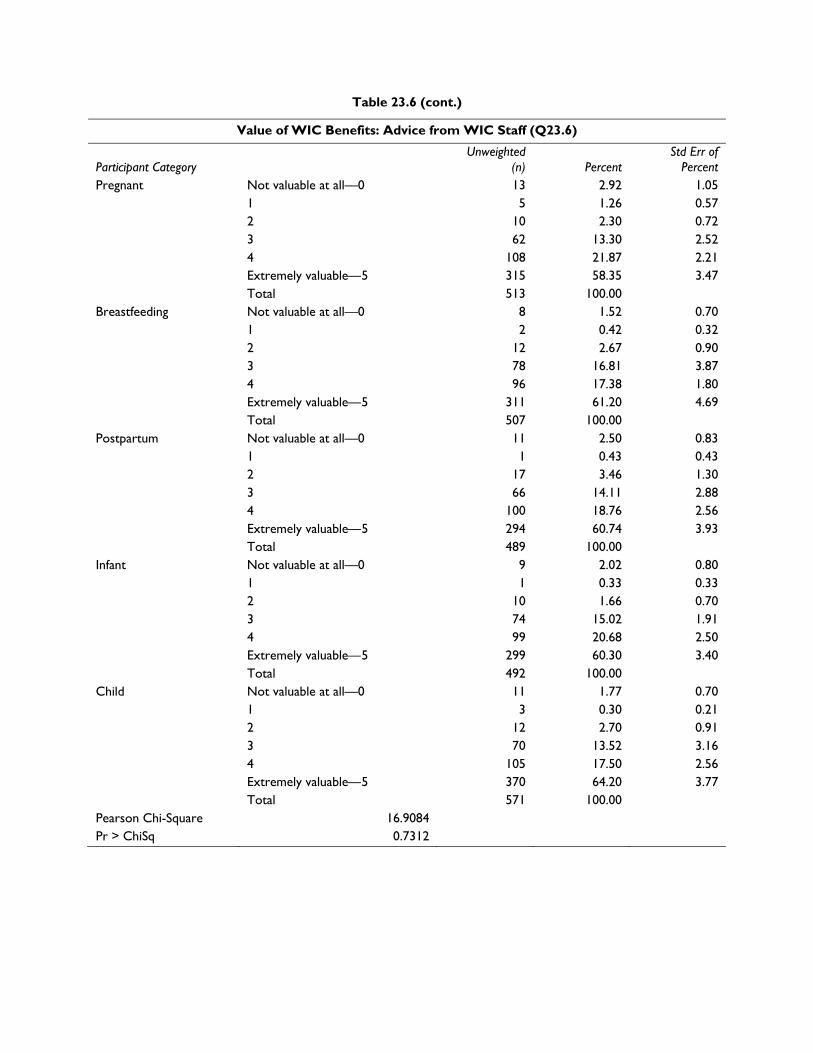
Table 23.6 (cont.)
Value of WIC Benefits: Advice from WIC Staff (Q23.6)
Participant Category Unweighted
(n) Percent Std Err of
Percent Pregnant Not valuable at all—0 13 2.92 1.05
1 5 1.26 0.57 2 10 2.30 0.72 3 62 13.30 2.52 4 108 21.87 2.21 Extremely valuable—5 315 58.35 3.47 Total 513 100.00
Breastfeeding Not valuable at all—0 8 1.52 0.70 1 2 0.42 0.32 2 12 2.67 0.90 3 78 16.81 3.87 4 96 17.38 1.80 Extremely valuable—5 311 61.20 4.69 Total 507 100.00
Postpartum Not valuable at all—0 11 2.50 0.83 1 1 0.43 0.43 2 17 3.46 1.30 3 66 14.11 2.88 4 100 18.76 2.56 Extremely valuable—5 294 60.74 3.93 Total 489 100.00
Infant Not valuable at all—0 9 2.02 0.80 1 1 0.33 0.33 2 10 1.66 0.70 3 74 15.02 1.91 4 99 20.68 2.50 Extremely valuable—5 299 60.30 3.40 Total 492 100.00
Child Not valuable at all—0 11 1.77 0.70 1 3 0.30 0.21 2 12 2.70 0.91 3 70 13.52 3.16 4 105 17.50 2.56 Extremely valuable—5 370 64.20 3.77 Total 571 100.00
Pearson Chi-Square 16.9084 Pr > ChiSq 0.7312
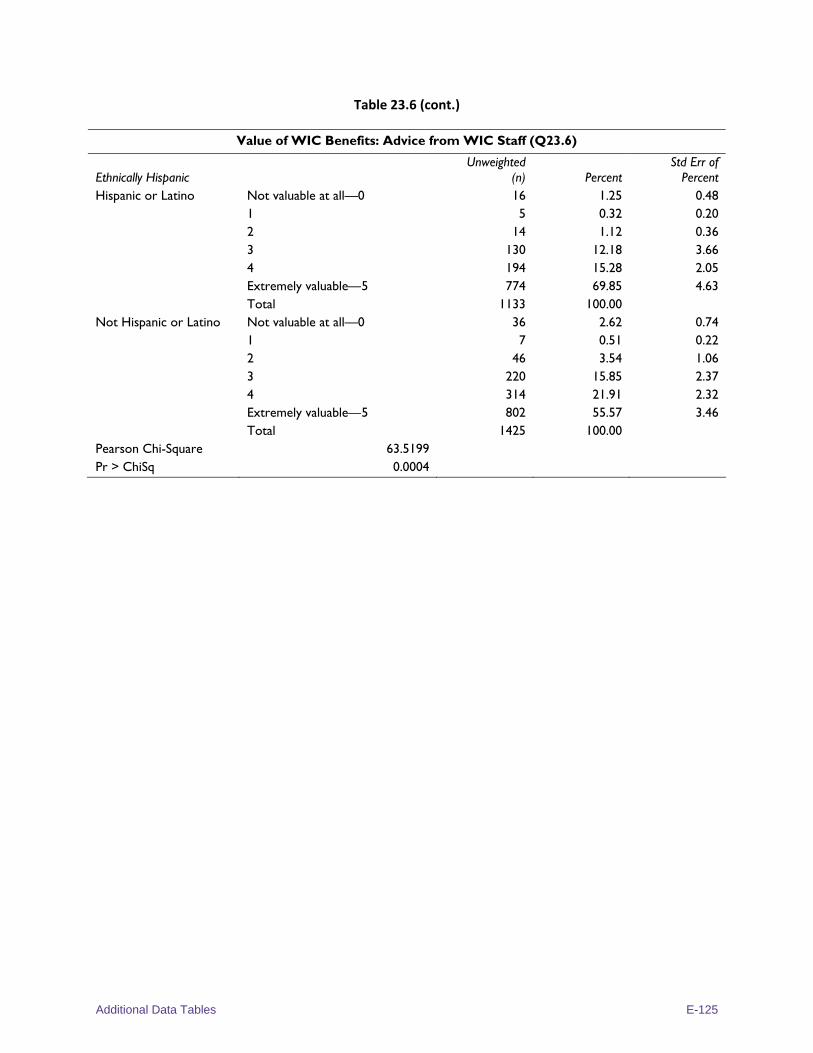
Additional Data Tables E-125
Table 23.6 (cont.)
Value of WIC Benefits: Advice from WIC Staff (Q23.6)
Ethnically Hispanic Unweighted
(n) Percent Std Err of
Percent Hispanic or Latino Not valuable at all—0 16 1.25 0.48
1 5 0.32 0.20 2 14 1.12 0.36 3 130 12.18 3.66 4 194 15.28 2.05 Extremely valuable—5 774 69.85 4.63 Total 1133 100.00
Not Hispanic or Latino Not valuable at all—0 36 2.62 0.74 1 7 0.51 0.22 2 46 3.54 1.06 3 220 15.85 2.37 4 314 21.91 2.32 Extremely valuable—5 802 55.57 3.46 Total 1425 100.00
Pearson Chi-Square 63.5199 Pr > ChiSq 0.0004
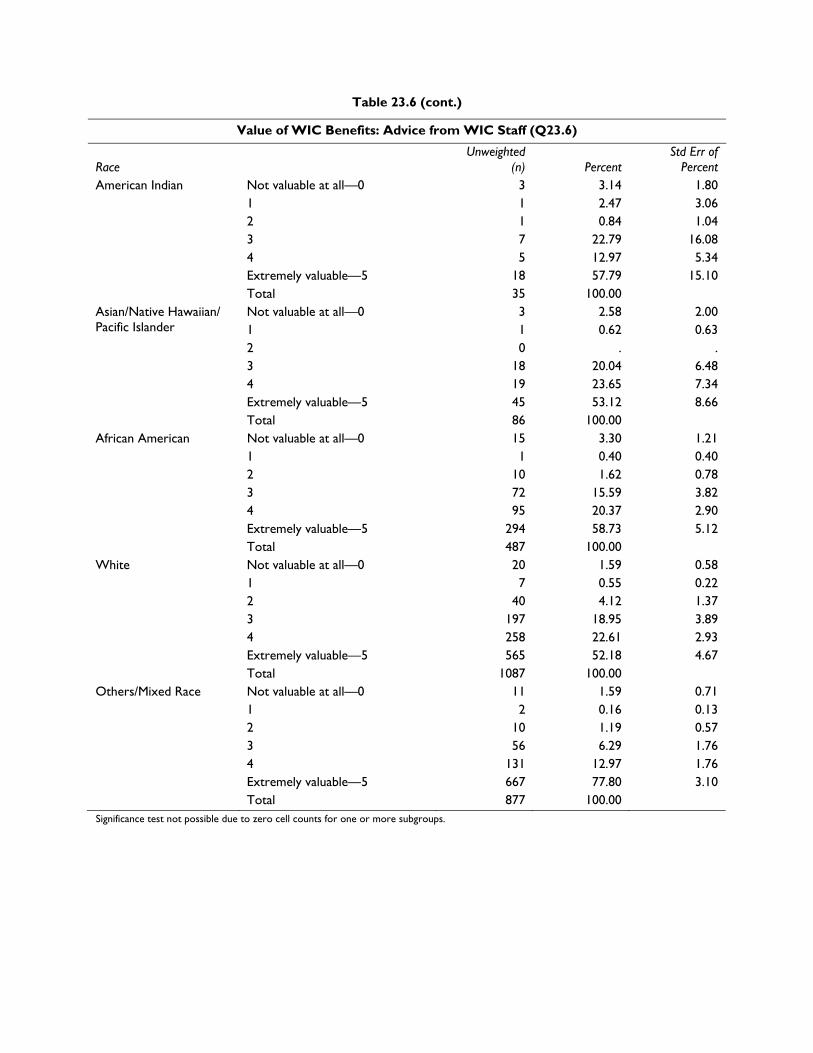
Table 23.6 (cont.)
Value of WIC Benefits: Advice from WIC Staff (Q23.6)
Race Unweighted
(n) Percent Std Err of
Percent American Indian Not valuable at all—0 3 3.14 1.80
1 1 2.47 3.06 2 1 0.84 1.04 3 7 22.79 16.08 4 5 12.97 5.34 Extremely valuable—5 18 57.79 15.10 Total 35 100.00
Asian/Native Hawaiian/ Pacific Islander
Not valuable at all—0 3 2.58 2.00 1 1 0.62 0.63 2 0 . . 3 18 20.04 6.48 4 19 23.65 7.34 Extremely valuable—5 45 53.12 8.66 Total 86 100.00
African American Not valuable at all—0 15 3.30 1.21 1 1 0.40 0.40 2 10 1.62 0.78 3 72 15.59 3.82 4 95 20.37 2.90 Extremely valuable—5 294 58.73 5.12 Total 487 100.00
White Not valuable at all—0 20 1.59 0.58 1 7 0.55 0.22 2 40 4.12 1.37 3 197 18.95 3.89 4 258 22.61 2.93 Extremely valuable—5 565 52.18 4.67 Total 1087 100.00
Others/Mixed Race Not valuable at all—0 11 1.59 0.71 1 2 0.16 0.13 2 10 1.19 0.57 3 56 6.29 1.76 4 131 12.97 1.76 Extremely valuable—5 667 77.80 3.10 Total 877 100.00
Significance test not possible due to zero cell counts for one or more subgroups.

Additional Data Tables E-127
Table 23.6 (cont.)
Value of WIC Benefits: Advice from WIC Staff (Q23.6)
Education Level Unweighted
(n) Percent Std Err of
Percent Less than High School Not valuable at all—0 11 1.61 0.77
1 1 0.07 0.07 2 12 1.31 0.47 3 70 10.53 3.07 4 101 12.05 2.09 Extremely valuable—5 518 74.43 4.51 Total 713 100.00
High School Complete Not valuable at all—0 21 2.11 0.79 1 8 0.96 0.42 2 19 2.74 1.12 3 143 16.84 3.62 4 180 17.14 1.98 Extremely valuable—5 574 60.22 4.47 Total 945 100.00
More than High School Not valuable at all—0 20 2.17 0.62 1 3 0.20 0.12 2 30 3.18 1.00 3 137 14.54 2.64 4 226 25.97 2.90 Extremely valuable—5 488 53.94 3.30 Total 904 100.00
Pearson Chi-Square 101.9744 Pr > ChiSq <.0001
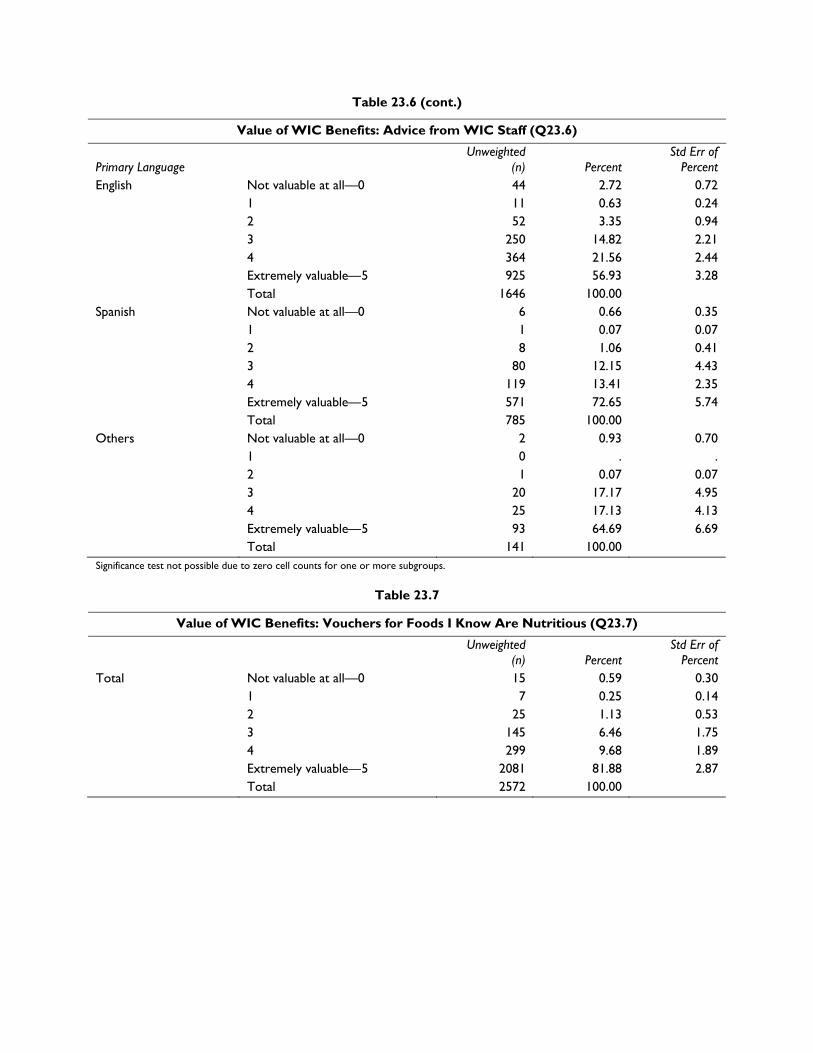
Table 23.6 (cont.)
Value of WIC Benefits: Advice from WIC Staff (Q23.6)
Primary Language Unweighted
(n) Percent Std Err of
Percent English Not valuable at all—0 44 2.72 0.72
1 11 0.63 0.24 2 52 3.35 0.94 3 250 14.82 2.21 4 364 21.56 2.44 Extremely valuable—5 925 56.93 3.28 Total 1646 100.00
Spanish Not valuable at all—0 6 0.66 0.35 1 1 0.07 0.07 2 8 1.06 0.41 3 80 12.15 4.43 4 119 13.41 2.35 Extremely valuable—5 571 72.65 5.74 Total 785 100.00
Others Not valuable at all—0 2 0.93 0.70 1 0 . . 2 1 0.07 0.07 3 20 17.17 4.95 4 25 17.13 4.13 Extremely valuable—5 93 64.69 6.69 Total 141 100.00
Significance test not possible due to zero cell counts for one or more subgroups.
Table 23.7
Value of WIC Benefits: Vouchers for Foods I Know Are Nutritious (Q23.7)
Unweighted (n) Percent
Std Err of Percent
Total Not valuable at all—0 15 0.59 0.30 1 7 0.25 0.14 2 25 1.13 0.53 3 145 6.46 1.75 4 299 9.68 1.89 Extremely valuable—5 2081 81.88 2.87 Total 2572 100.00
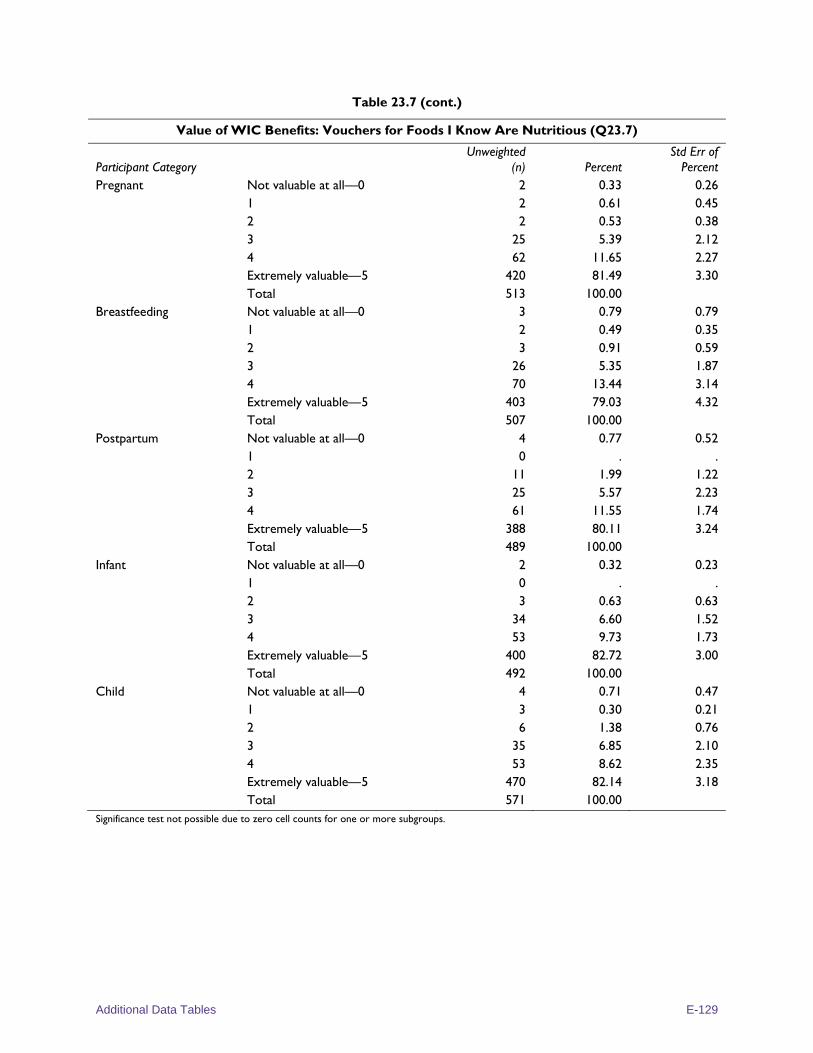
Additional Data Tables E-129
Table 23.7 (cont.)
Value of WIC Benefits: Vouchers for Foods I Know Are Nutritious (Q23.7)
Participant Category Unweighted
(n) Percent Std Err of
Percent Pregnant Not valuable at all—0 2 0.33 0.26
1 2 0.61 0.45 2 2 0.53 0.38 3 25 5.39 2.12 4 62 11.65 2.27 Extremely valuable—5 420 81.49 3.30 Total 513 100.00
Breastfeeding Not valuable at all—0 3 0.79 0.79 1 2 0.49 0.35 2 3 0.91 0.59 3 26 5.35 1.87 4 70 13.44 3.14 Extremely valuable—5 403 79.03 4.32 Total 507 100.00
Postpartum Not valuable at all—0 4 0.77 0.52 1 0 . . 2 11 1.99 1.22 3 25 5.57 2.23 4 61 11.55 1.74 Extremely valuable—5 388 80.11 3.24 Total 489 100.00
Infant Not valuable at all—0 2 0.32 0.23 1 0 . . 2 3 0.63 0.63 3 34 6.60 1.52 4 53 9.73 1.73 Extremely valuable—5 400 82.72 3.00 Total 492 100.00
Child Not valuable at all—0 4 0.71 0.47 1 3 0.30 0.21 2 6 1.38 0.76 3 35 6.85 2.10 4 53 8.62 2.35 Extremely valuable—5 470 82.14 3.18 Total 571 100.00
Significance test not possible due to zero cell counts for one or more subgroups.
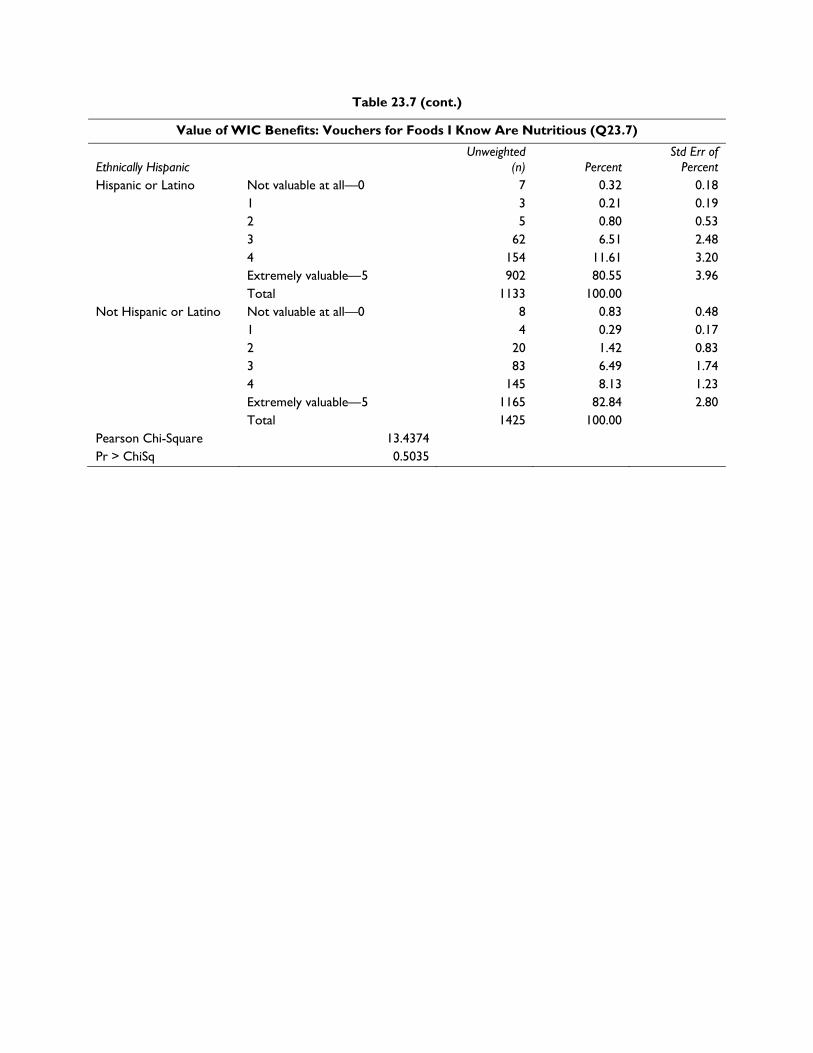
Table 23.7 (cont.)
Value of WIC Benefits: Vouchers for Foods I Know Are Nutritious (Q23.7)
Ethnically Hispanic Unweighted
(n) Percent Std Err of
Percent Hispanic or Latino Not valuable at all—0 7 0.32 0.18
1 3 0.21 0.19 2 5 0.80 0.53 3 62 6.51 2.48 4 154 11.61 3.20 Extremely valuable—5 902 80.55 3.96 Total 1133 100.00
Not Hispanic or Latino Not valuable at all—0 8 0.83 0.48 1 4 0.29 0.17 2 20 1.42 0.83 3 83 6.49 1.74 4 145 8.13 1.23 Extremely valuable—5 1165 82.84 2.80 Total 1425 100.00
Pearson Chi-Square 13.4374 Pr > ChiSq 0.5035
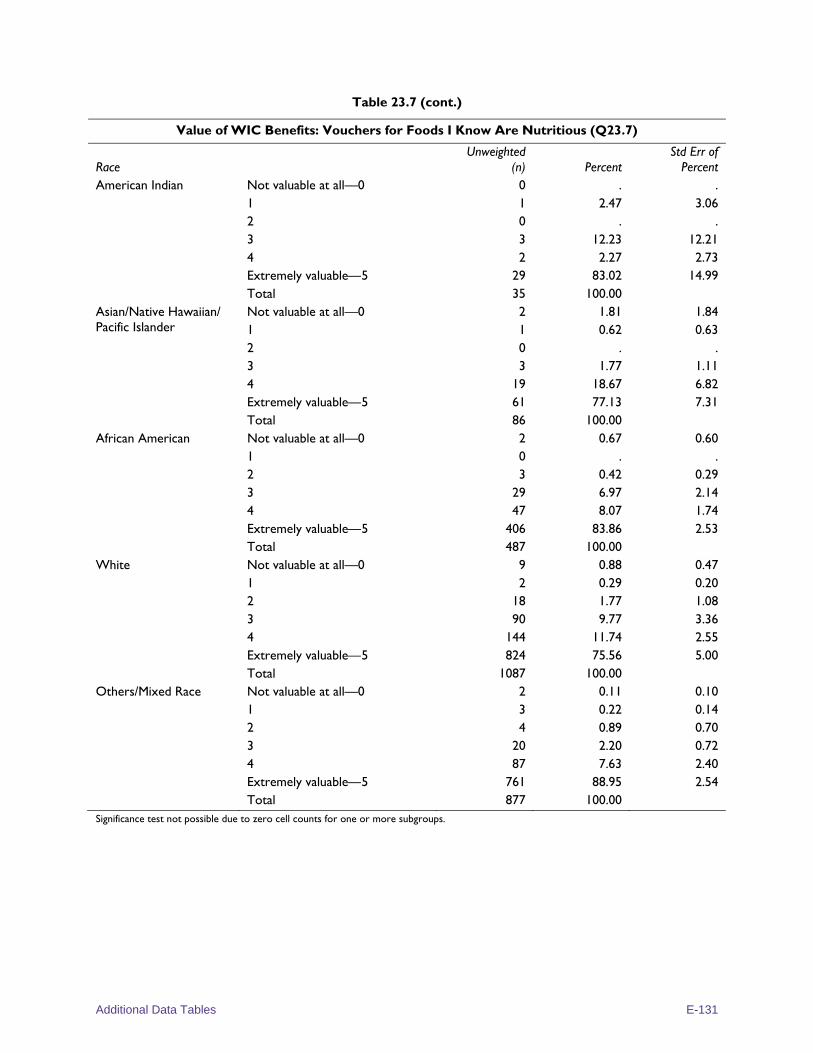
Additional Data Tables E-131
Table 23.7 (cont.)
Value of WIC Benefits: Vouchers for Foods I Know Are Nutritious (Q23.7)
Race Unweighted
(n) Percent Std Err of
Percent American Indian Not valuable at all—0 0 . .
1 1 2.47 3.06 2 0 . . 3 3 12.23 12.21 4 2 2.27 2.73 Extremely valuable—5 29 83.02 14.99 Total 35 100.00
Asian/Native Hawaiian/ Pacific Islander
Not valuable at all—0 2 1.81 1.84 1 1 0.62 0.63 2 0 . . 3 3 1.77 1.11 4 19 18.67 6.82 Extremely valuable—5 61 77.13 7.31 Total 86 100.00
African American Not valuable at all—0 2 0.67 0.60 1 0 . . 2 3 0.42 0.29 3 29 6.97 2.14 4 47 8.07 1.74 Extremely valuable—5 406 83.86 2.53 Total 487 100.00
White Not valuable at all—0 9 0.88 0.47 1 2 0.29 0.20 2 18 1.77 1.08 3 90 9.77 3.36 4 144 11.74 2.55 Extremely valuable—5 824 75.56 5.00 Total 1087 100.00
Others/Mixed Race Not valuable at all—0 2 0.11 0.10 1 3 0.22 0.14 2 4 0.89 0.70 3 20 2.20 0.72 4 87 7.63 2.40 Extremely valuable—5 761 88.95 2.54 Total 877 100.00
Significance test not possible due to zero cell counts for one or more subgroups.
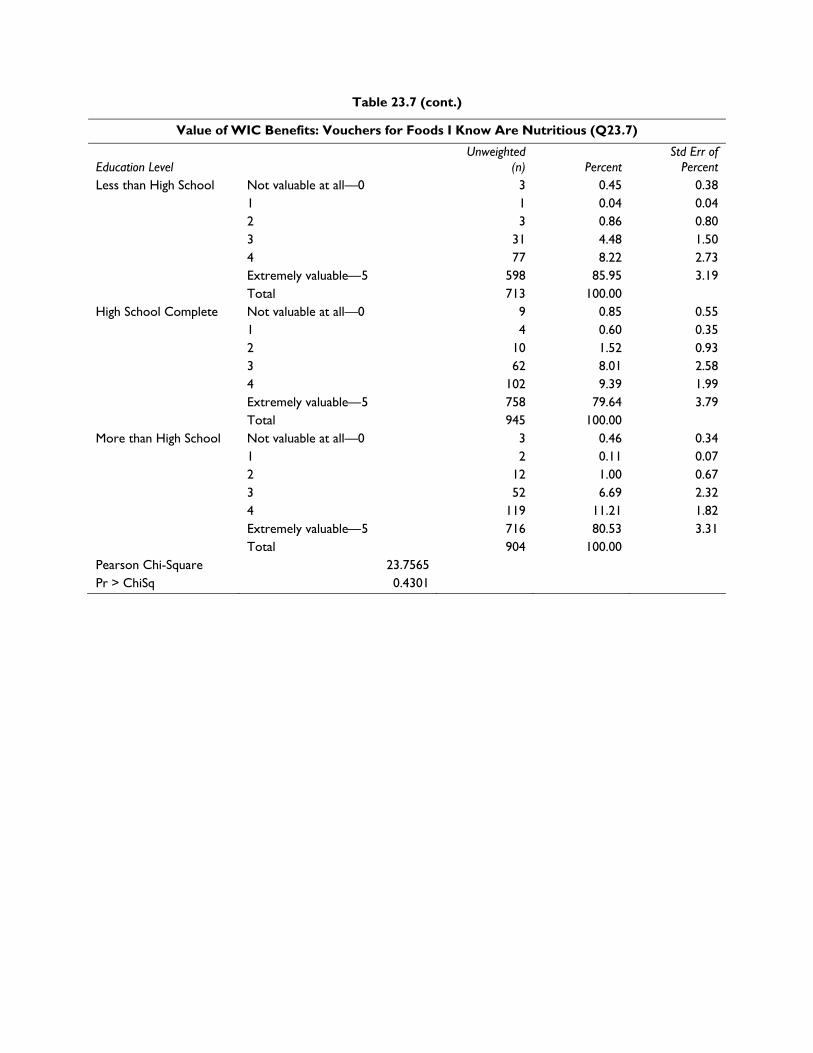
Table 23.7 (cont.)
Value of WIC Benefits: Vouchers for Foods I Know Are Nutritious (Q23.7)
Education Level Unweighted
(n) Percent Std Err of
Percent Less than High School Not valuable at all—0 3 0.45 0.38
1 1 0.04 0.04 2 3 0.86 0.80 3 31 4.48 1.50 4 77 8.22 2.73 Extremely valuable—5 598 85.95 3.19 Total 713 100.00
High School Complete Not valuable at all—0 9 0.85 0.55 1 4 0.60 0.35 2 10 1.52 0.93 3 62 8.01 2.58 4 102 9.39 1.99 Extremely valuable—5 758 79.64 3.79 Total 945 100.00
More than High School Not valuable at all—0 3 0.46 0.34 1 2 0.11 0.07 2 12 1.00 0.67 3 52 6.69 2.32 4 119 11.21 1.82 Extremely valuable—5 716 80.53 3.31 Total 904 100.00
Pearson Chi-Square 23.7565 Pr > ChiSq 0.4301
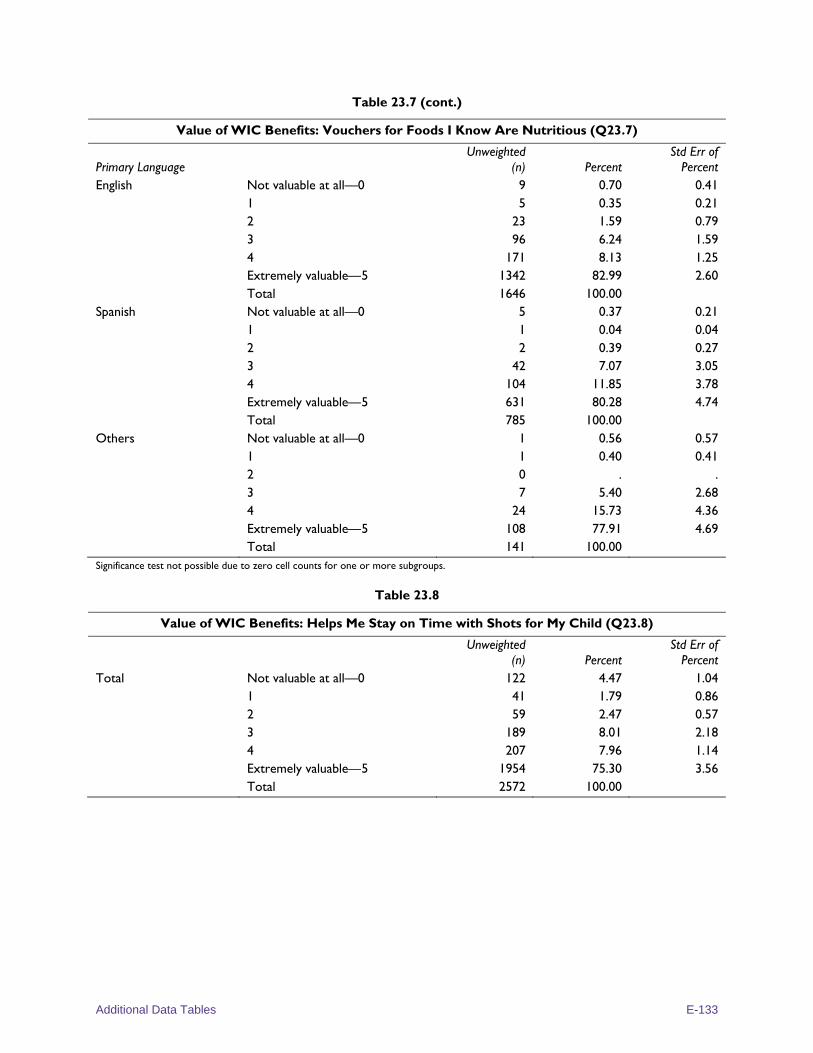
Additional Data Tables E-133
Table 23.7 (cont.)
Value of WIC Benefits: Vouchers for Foods I Know Are Nutritious (Q23.7)
Primary Language Unweighted
(n) Percent Std Err of
Percent English Not valuable at all—0 9 0.70 0.41
1 5 0.35 0.21 2 23 1.59 0.79 3 96 6.24 1.59 4 171 8.13 1.25 Extremely valuable—5 1342 82.99 2.60 Total 1646 100.00
Spanish Not valuable at all—0 5 0.37 0.21 1 1 0.04 0.04 2 2 0.39 0.27 3 42 7.07 3.05 4 104 11.85 3.78 Extremely valuable—5 631 80.28 4.74 Total 785 100.00
Others Not valuable at all—0 1 0.56 0.57 1 1 0.40 0.41 2 0 . . 3 7 5.40 2.68 4 24 15.73 4.36 Extremely valuable—5 108 77.91 4.69 Total 141 100.00
Significance test not possible due to zero cell counts for one or more subgroups.
Table 23.8
Value of WIC Benefits: Helps Me Stay on Time with Shots for My Child (Q23.8)
Unweighted (n) Percent
Std Err of Percent
Total Not valuable at all—0 122 4.47 1.04 1 41 1.79 0.86 2 59 2.47 0.57 3 189 8.01 2.18 4 207 7.96 1.14 Extremely valuable—5 1954 75.30 3.56 Total 2572 100.00
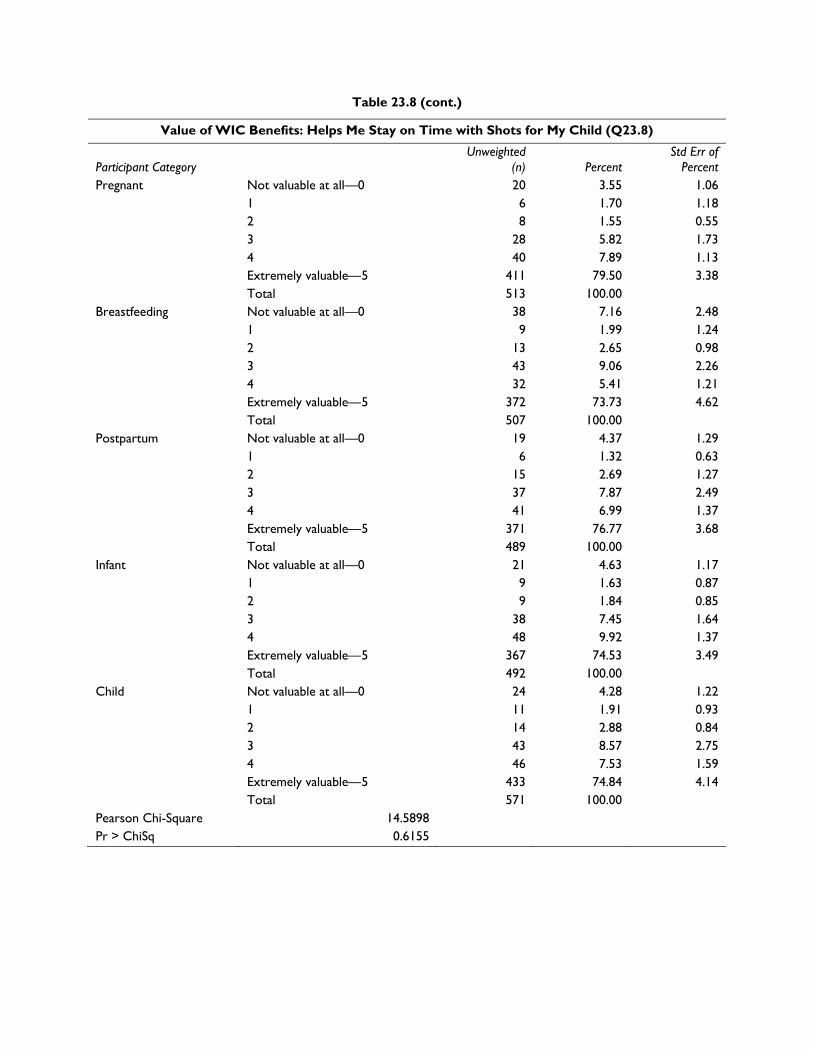
Table 23.8 (cont.)
Value of WIC Benefits: Helps Me Stay on Time with Shots for My Child (Q23.8)
Participant Category Unweighted
(n) Percent Std Err of
Percent Pregnant Not valuable at all—0 20 3.55 1.06
1 6 1.70 1.18 2 8 1.55 0.55 3 28 5.82 1.73 4 40 7.89 1.13 Extremely valuable—5 411 79.50 3.38 Total 513 100.00
Breastfeeding Not valuable at all—0 38 7.16 2.48 1 9 1.99 1.24 2 13 2.65 0.98 3 43 9.06 2.26 4 32 5.41 1.21 Extremely valuable—5 372 73.73 4.62 Total 507 100.00
Postpartum Not valuable at all—0 19 4.37 1.29 1 6 1.32 0.63 2 15 2.69 1.27 3 37 7.87 2.49 4 41 6.99 1.37 Extremely valuable—5 371 76.77 3.68 Total 489 100.00
Infant Not valuable at all—0 21 4.63 1.17 1 9 1.63 0.87 2 9 1.84 0.85 3 38 7.45 1.64 4 48 9.92 1.37 Extremely valuable—5 367 74.53 3.49 Total 492 100.00
Child Not valuable at all—0 24 4.28 1.22 1 11 1.91 0.93 2 14 2.88 0.84 3 43 8.57 2.75 4 46 7.53 1.59 Extremely valuable—5 433 74.84 4.14 Total 571 100.00
Pearson Chi-Square 14.5898 Pr > ChiSq 0.6155
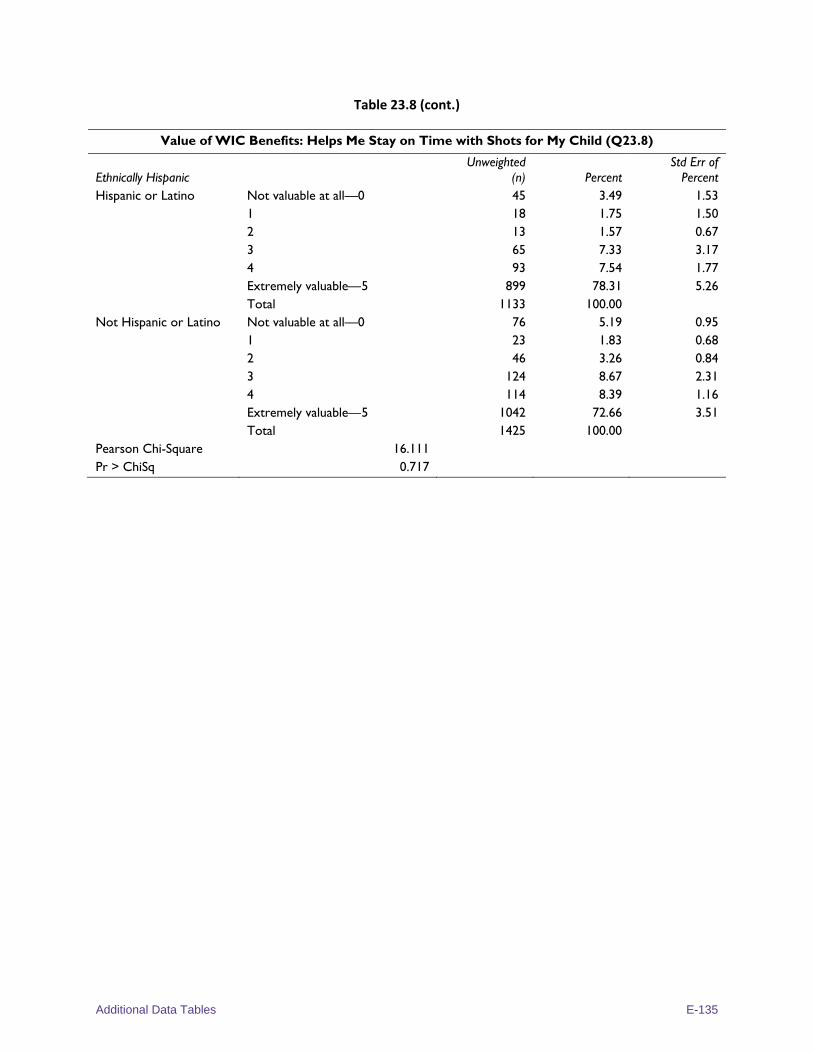
Additional Data Tables E-135
Table 23.8 (cont.)
Value of WIC Benefits: Helps Me Stay on Time with Shots for My Child (Q23.8)
Ethnically Hispanic Unweighted
(n) Percent Std Err of
Percent Hispanic or Latino Not valuable at all—0 45 3.49 1.53
1 18 1.75 1.50 2 13 1.57 0.67 3 65 7.33 3.17 4 93 7.54 1.77 Extremely valuable—5 899 78.31 5.26 Total 1133 100.00
Not Hispanic or Latino Not valuable at all—0 76 5.19 0.95 1 23 1.83 0.68 2 46 3.26 0.84 3 124 8.67 2.31 4 114 8.39 1.16 Extremely valuable—5 1042 72.66 3.51 Total 1425 100.00
Pearson Chi-Square 16.111 Pr > ChiSq 0.717
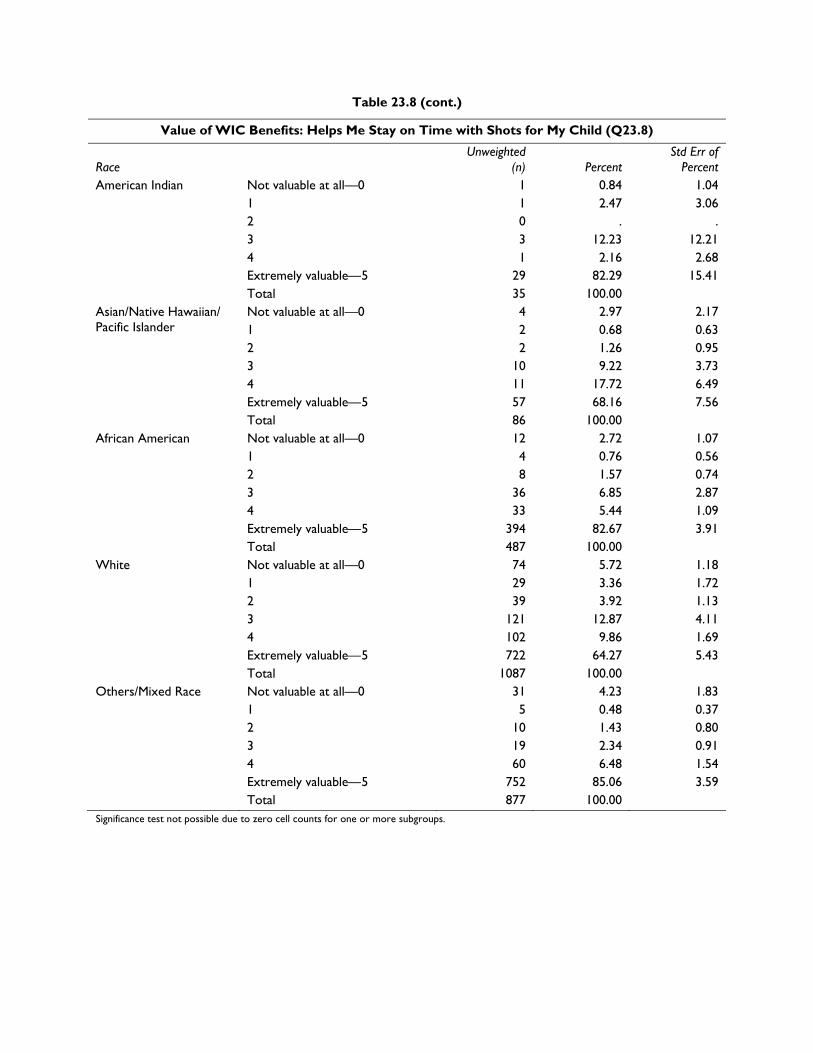
Table 23.8 (cont.)
Value of WIC Benefits: Helps Me Stay on Time with Shots for My Child (Q23.8)
Race Unweighted
(n) Percent Std Err of
Percent American Indian Not valuable at all—0 1 0.84 1.04
1 1 2.47 3.06 2 0 . . 3 3 12.23 12.21 4 1 2.16 2.68 Extremely valuable—5 29 82.29 15.41 Total 35 100.00
Asian/Native Hawaiian/ Pacific Islander
Not valuable at all—0 4 2.97 2.17 1 2 0.68 0.63 2 2 1.26 0.95 3 10 9.22 3.73 4 11 17.72 6.49 Extremely valuable—5 57 68.16 7.56 Total 86 100.00
African American Not valuable at all—0 12 2.72 1.07 1 4 0.76 0.56 2 8 1.57 0.74 3 36 6.85 2.87 4 33 5.44 1.09 Extremely valuable—5 394 82.67 3.91 Total 487 100.00
White Not valuable at all—0 74 5.72 1.18 1 29 3.36 1.72 2 39 3.92 1.13 3 121 12.87 4.11 4 102 9.86 1.69 Extremely valuable—5 722 64.27 5.43 Total 1087 100.00
Others/Mixed Race Not valuable at all—0 31 4.23 1.83 1 5 0.48 0.37 2 10 1.43 0.80 3 19 2.34 0.91 4 60 6.48 1.54 Extremely valuable—5 752 85.06 3.59 Total 877 100.00
Significance test not possible due to zero cell counts for one or more subgroups.
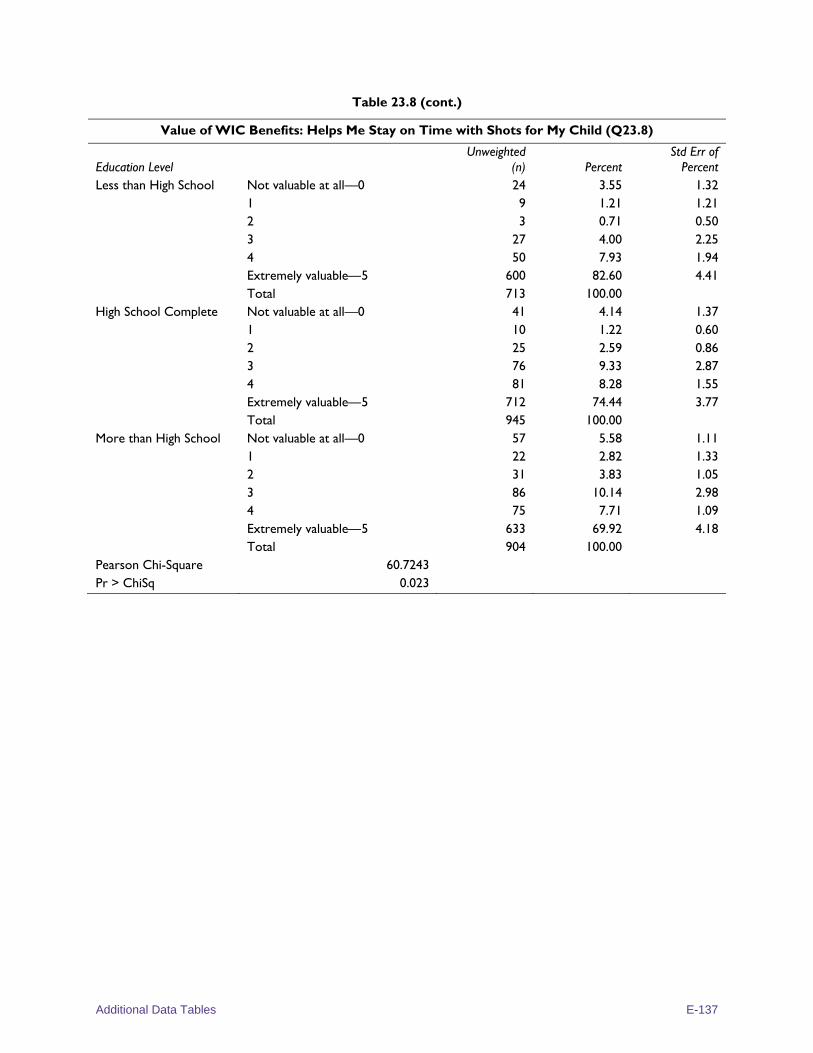
Additional Data Tables E-137
Table 23.8 (cont.)
Value of WIC Benefits: Helps Me Stay on Time with Shots for My Child (Q23.8)
Education Level Unweighted
(n) Percent Std Err of
Percent Less than High School Not valuable at all—0 24 3.55 1.32
1 9 1.21 1.21 2 3 0.71 0.50 3 27 4.00 2.25 4 50 7.93 1.94 Extremely valuable—5 600 82.60 4.41 Total 713 100.00
High School Complete Not valuable at all—0 41 4.14 1.37 1 10 1.22 0.60 2 25 2.59 0.86 3 76 9.33 2.87 4 81 8.28 1.55 Extremely valuable—5 712 74.44 3.77 Total 945 100.00
More than High School Not valuable at all—0 57 5.58 1.11 1 22 2.82 1.33 2 31 3.83 1.05 3 86 10.14 2.98 4 75 7.71 1.09 Extremely valuable—5 633 69.92 4.18 Total 904 100.00
Pearson Chi-Square 60.7243 Pr > ChiSq 0.023
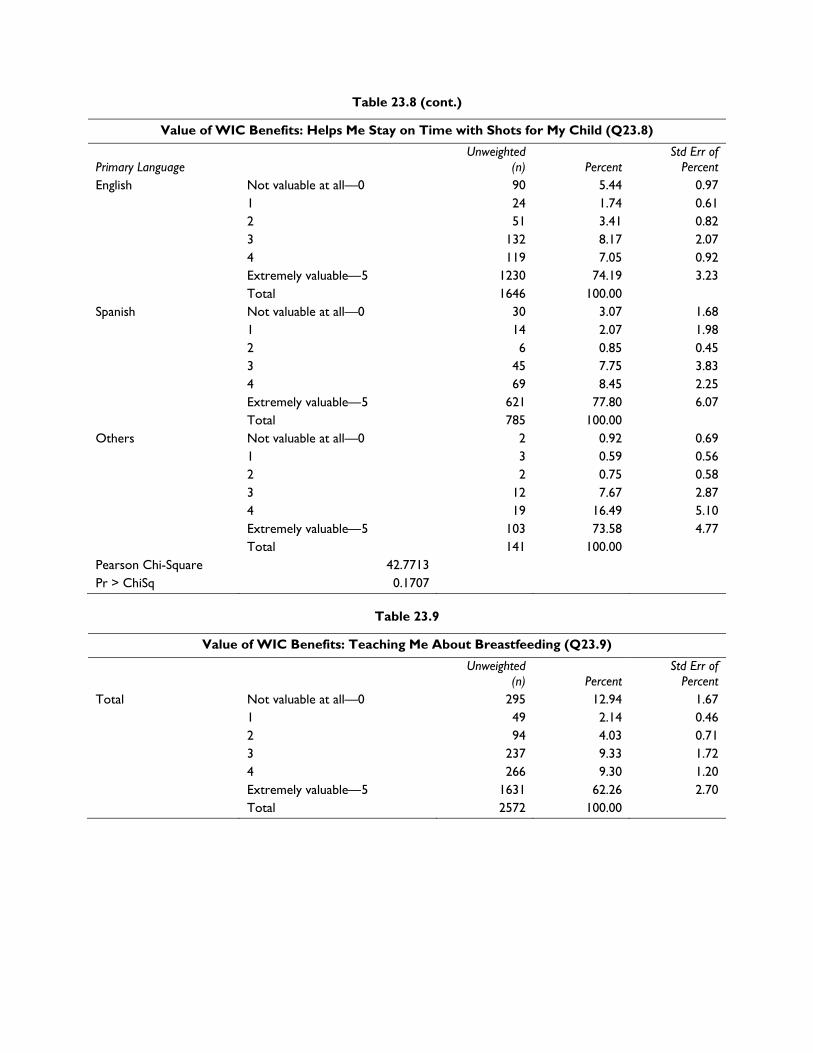
Table 23.8 (cont.)
Value of WIC Benefits: Helps Me Stay on Time with Shots for My Child (Q23.8)
Primary Language Unweighted
(n) Percent Std Err of
Percent English Not valuable at all—0 90 5.44 0.97
1 24 1.74 0.61 2 51 3.41 0.82 3 132 8.17 2.07 4 119 7.05 0.92 Extremely valuable—5 1230 74.19 3.23 Total 1646 100.00
Spanish Not valuable at all—0 30 3.07 1.68 1 14 2.07 1.98 2 6 0.85 0.45 3 45 7.75 3.83 4 69 8.45 2.25 Extremely valuable—5 621 77.80 6.07 Total 785 100.00
Others Not valuable at all—0 2 0.92 0.69 1 3 0.59 0.56 2 2 0.75 0.58 3 12 7.67 2.87 4 19 16.49 5.10 Extremely valuable—5 103 73.58 4.77 Total 141 100.00
Pearson Chi-Square 42.7713 Pr > ChiSq 0.1707
Table 23.9
Value of WIC Benefits: Teaching Me About Breastfeeding (Q23.9)
Unweighted (n) Percent
Std Err of Percent
Total Not valuable at all—0 295 12.94 1.67 1 49 2.14 0.46 2 94 4.03 0.71 3 237 9.33 1.72 4 266 9.30 1.20 Extremely valuable—5 1631 62.26 2.70 Total 2572 100.00
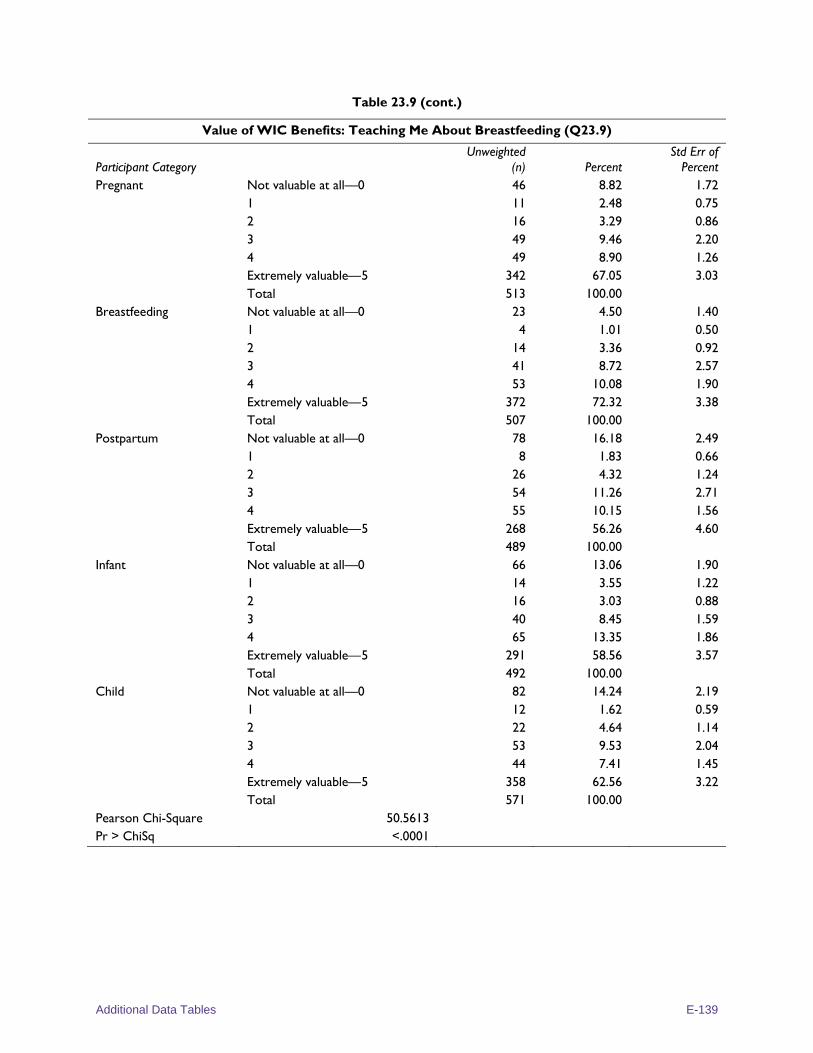
Additional Data Tables E-139
Table 23.9 (cont.)
Value of WIC Benefits: Teaching Me About Breastfeeding (Q23.9)
Participant Category Unweighted
(n) Percent Std Err of
Percent Pregnant Not valuable at all—0 46 8.82 1.72
1 11 2.48 0.75 2 16 3.29 0.86 3 49 9.46 2.20 4 49 8.90 1.26 Extremely valuable—5 342 67.05 3.03 Total 513 100.00
Breastfeeding Not valuable at all—0 23 4.50 1.40 1 4 1.01 0.50 2 14 3.36 0.92 3 41 8.72 2.57 4 53 10.08 1.90 Extremely valuable—5 372 72.32 3.38 Total 507 100.00
Postpartum Not valuable at all—0 78 16.18 2.49 1 8 1.83 0.66 2 26 4.32 1.24 3 54 11.26 2.71 4 55 10.15 1.56 Extremely valuable—5 268 56.26 4.60 Total 489 100.00
Infant Not valuable at all—0 66 13.06 1.90 1 14 3.55 1.22 2 16 3.03 0.88 3 40 8.45 1.59 4 65 13.35 1.86 Extremely valuable—5 291 58.56 3.57 Total 492 100.00
Child Not valuable at all—0 82 14.24 2.19 1 12 1.62 0.59 2 22 4.64 1.14 3 53 9.53 2.04 4 44 7.41 1.45 Extremely valuable—5 358 62.56 3.22 Total 571 100.00
Pearson Chi-Square 50.5613 Pr > ChiSq <.0001
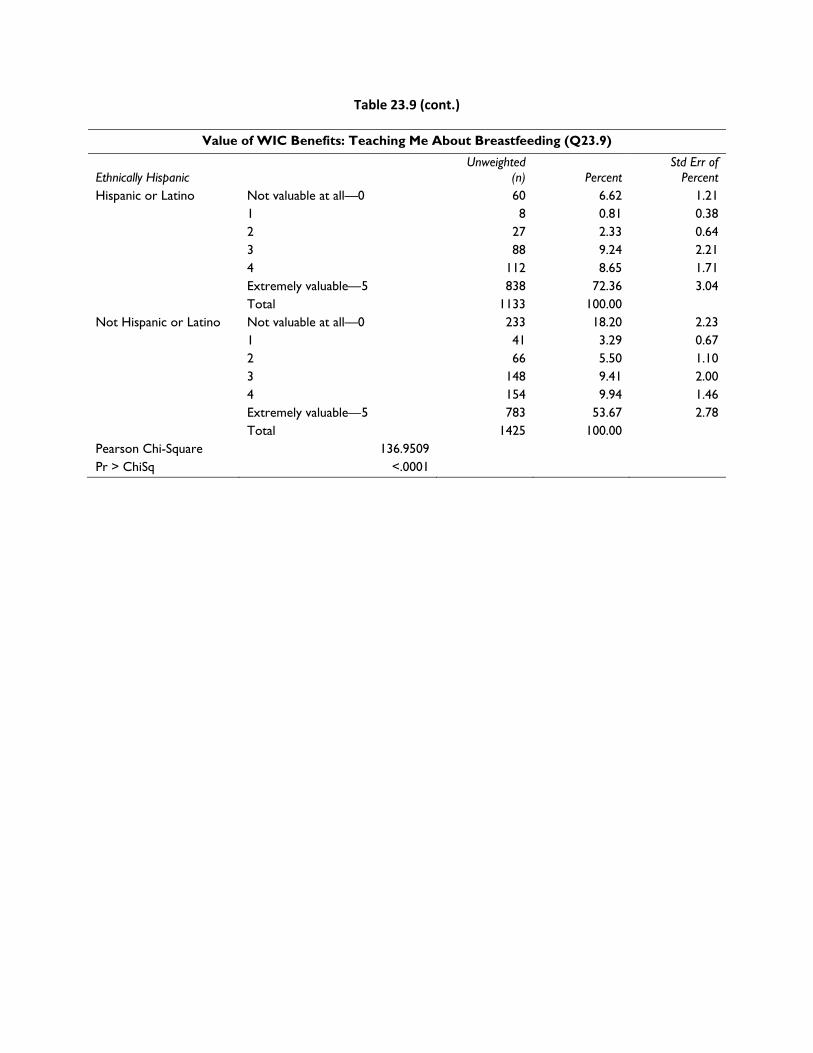
Table 23.9 (cont.)
Value of WIC Benefits: Teaching Me About Breastfeeding (Q23.9)
Ethnically Hispanic Unweighted
(n) Percent Std Err of
Percent Hispanic or Latino Not valuable at all—0 60 6.62 1.21
1 8 0.81 0.38 2 27 2.33 0.64 3 88 9.24 2.21 4 112 8.65 1.71 Extremely valuable—5 838 72.36 3.04 Total 1133 100.00
Not Hispanic or Latino Not valuable at all—0 233 18.20 2.23 1 41 3.29 0.67 2 66 5.50 1.10 3 148 9.41 2.00 4 154 9.94 1.46 Extremely valuable—5 783 53.67 2.78 Total 1425 100.00
Pearson Chi-Square 136.9509 Pr > ChiSq <.0001
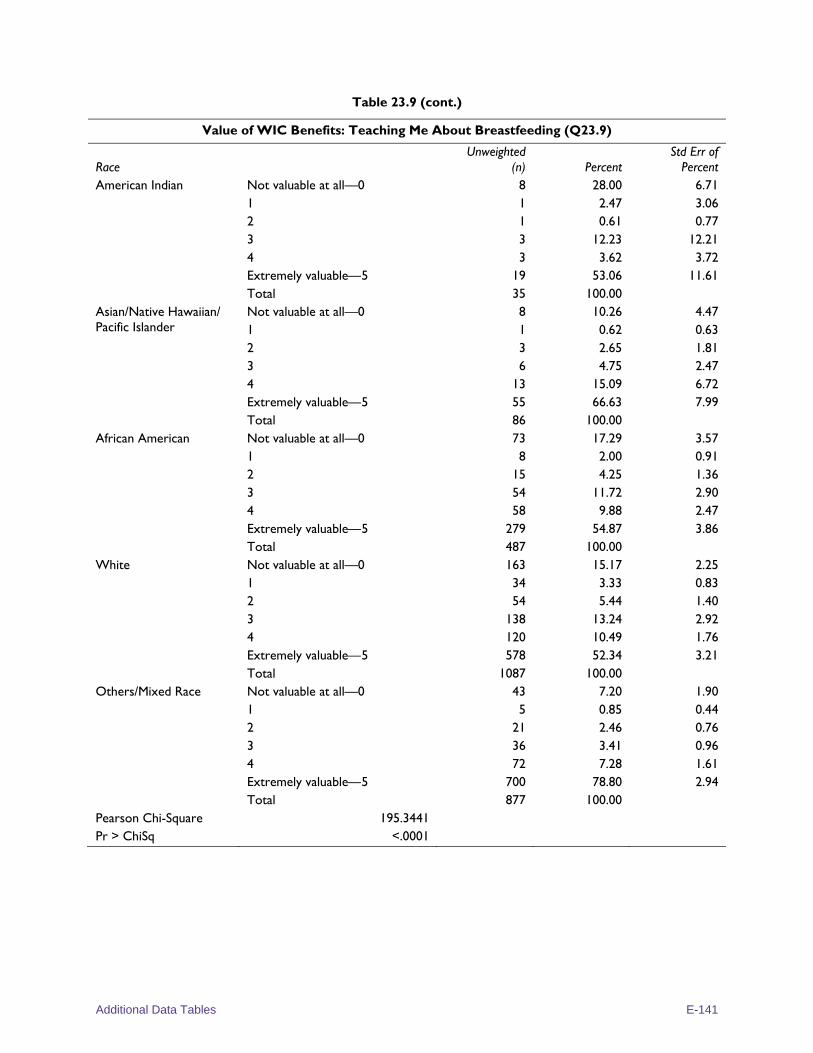
Additional Data Tables E-141
Table 23.9 (cont.)
Value of WIC Benefits: Teaching Me About Breastfeeding (Q23.9)
Race Unweighted
(n) Percent Std Err of
Percent American Indian Not valuable at all—0 8 28.00 6.71
1 1 2.47 3.06 2 1 0.61 0.77 3 3 12.23 12.21 4 3 3.62 3.72 Extremely valuable—5 19 53.06 11.61 Total 35 100.00
Asian/Native Hawaiian/ Pacific Islander
Not valuable at all—0 8 10.26 4.47 1 1 0.62 0.63 2 3 2.65 1.81 3 6 4.75 2.47 4 13 15.09 6.72 Extremely valuable—5 55 66.63 7.99 Total 86 100.00
African American Not valuable at all—0 73 17.29 3.57 1 8 2.00 0.91 2 15 4.25 1.36 3 54 11.72 2.90 4 58 9.88 2.47 Extremely valuable—5 279 54.87 3.86 Total 487 100.00
White Not valuable at all—0 163 15.17 2.25 1 34 3.33 0.83 2 54 5.44 1.40 3 138 13.24 2.92 4 120 10.49 1.76 Extremely valuable—5 578 52.34 3.21 Total 1087 100.00
Others/Mixed Race Not valuable at all—0 43 7.20 1.90 1 5 0.85 0.44 2 21 2.46 0.76 3 36 3.41 0.96 4 72 7.28 1.61 Extremely valuable—5 700 78.80 2.94 Total 877 100.00
Pearson Chi-Square 195.3441 Pr > ChiSq <.0001
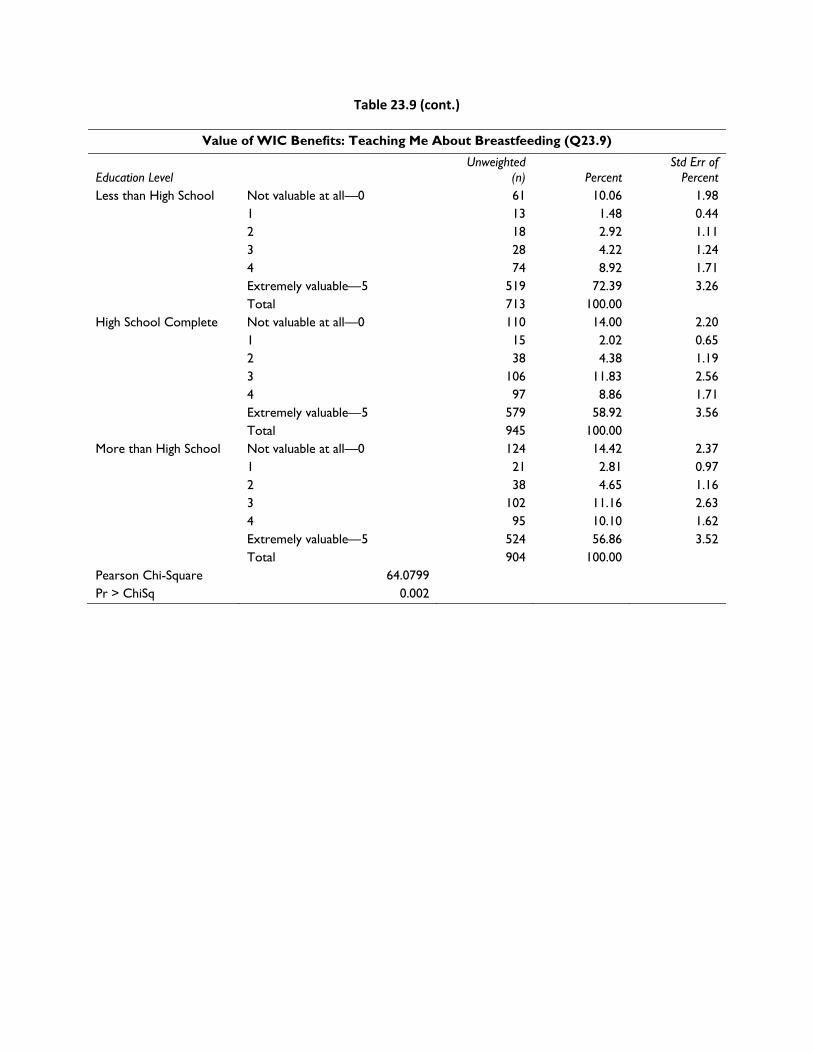
Table 23.9 (cont.)
Value of WIC Benefits: Teaching Me About Breastfeeding (Q23.9)
Education Level Unweighted
(n) Percent Std Err of
Percent Less than High School Not valuable at all—0 61 10.06 1.98
1 13 1.48 0.44 2 18 2.92 1.11 3 28 4.22 1.24 4 74 8.92 1.71 Extremely valuable—5 519 72.39 3.26 Total 713 100.00
High School Complete Not valuable at all—0 110 14.00 2.20 1 15 2.02 0.65 2 38 4.38 1.19 3 106 11.83 2.56 4 97 8.86 1.71 Extremely valuable—5 579 58.92 3.56 Total 945 100.00
More than High School Not valuable at all—0 124 14.42 2.37 1 21 2.81 0.97 2 38 4.65 1.16 3 102 11.16 2.63 4 95 10.10 1.62 Extremely valuable—5 524 56.86 3.52 Total 904 100.00
Pearson Chi-Square 64.0799 Pr > ChiSq 0.002

Additional Data Tables E-143
Table 23.9 (cont.)
Value of WIC Benefits: Teaching Me About Breastfeeding (Q23.9)
Primary Language Unweighted
(n) Percent Std Err of
Percent English Not valuable at all—0 262 17.33 2.10
1 46 3.19 0.68 2 78 5.14 0.98 3 173 9.94 1.77 4 172 9.01 1.24 Extremely valuable—5 915 55.39 2.99 Total 1646 100.00
Spanish Not valuable at all—0 24 4.50 1.21 1 2 0.30 0.21 2 12 1.91 0.68 3 53 7.89 2.52 4 78 10.10 2.10 Extremely valuable—5 616 75.29 3.26 Total 785 100.00
Others Not valuable at all—0 9 10.50 3.93 1 1 0.31 0.32 2 4 3.38 2.18 3 11 10.78 5.18 4 16 7.92 3.52 Extremely valuable—5 100 67.12 5.27 Total 141 100.00
Pearson Chi-Square 145.885 Pr > ChiSq <.0001
Table 23.10
Value of WIC Benefits: Teaching Me About Foods Babies Need (Q23.10)
Unweighted (n) Percent
Std Err of Percent
Total Not valuable at all—0 38 1.92 0.58 1 10 0.33 0.15 2 37 1.59 0.38 3 145 7.30 1.88 4 304 11.33 1.72 Extremely valuable—5 2038 77.53 2.70 Total 2572 100.00
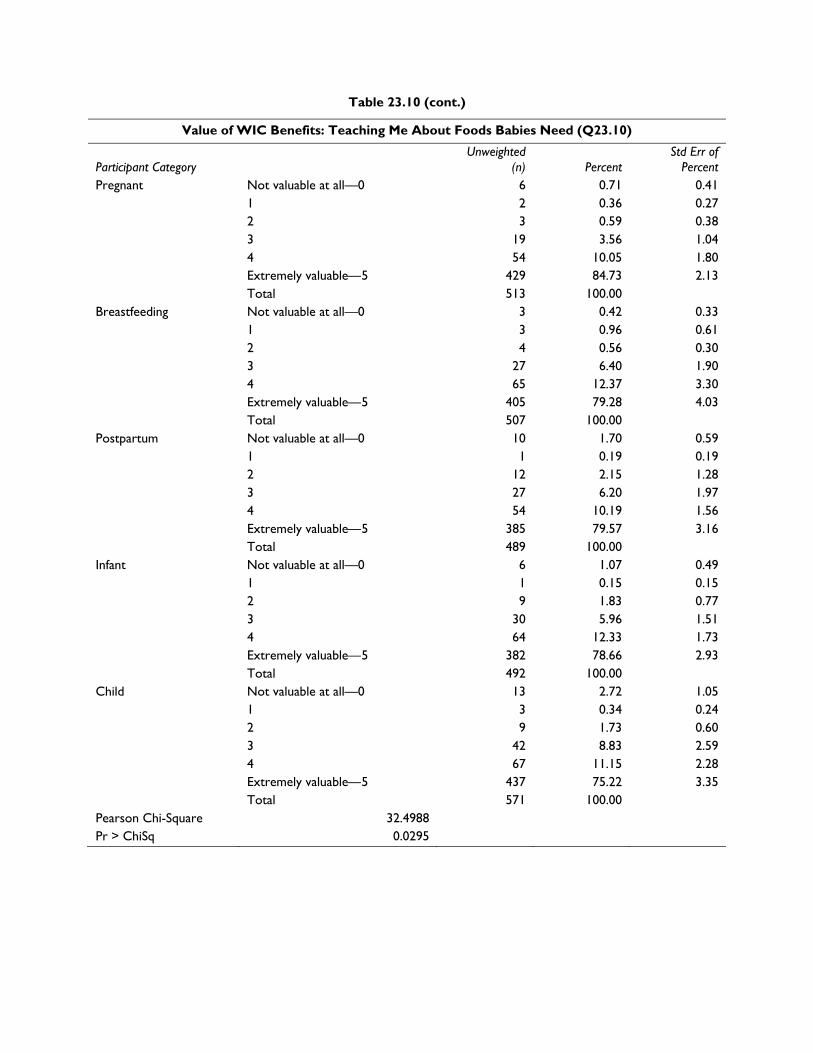
Table 23.10 (cont.)
Value of WIC Benefits: Teaching Me About Foods Babies Need (Q23.10)
Participant Category Unweighted
(n) Percent Std Err of
Percent Pregnant Not valuable at all—0 6 0.71 0.41
1 2 0.36 0.27 2 3 0.59 0.38 3 19 3.56 1.04 4 54 10.05 1.80 Extremely valuable—5 429 84.73 2.13 Total 513 100.00
Breastfeeding Not valuable at all—0 3 0.42 0.33 1 3 0.96 0.61 2 4 0.56 0.30 3 27 6.40 1.90 4 65 12.37 3.30 Extremely valuable—5 405 79.28 4.03 Total 507 100.00
Postpartum Not valuable at all—0 10 1.70 0.59 1 1 0.19 0.19 2 12 2.15 1.28 3 27 6.20 1.97 4 54 10.19 1.56 Extremely valuable—5 385 79.57 3.16 Total 489 100.00
Infant Not valuable at all—0 6 1.07 0.49 1 1 0.15 0.15 2 9 1.83 0.77 3 30 5.96 1.51 4 64 12.33 1.73 Extremely valuable—5 382 78.66 2.93 Total 492 100.00
Child Not valuable at all—0 13 2.72 1.05 1 3 0.34 0.24 2 9 1.73 0.60 3 42 8.83 2.59 4 67 11.15 2.28 Extremely valuable—5 437 75.22 3.35 Total 571 100.00
Pearson Chi-Square 32.4988 Pr > ChiSq 0.0295
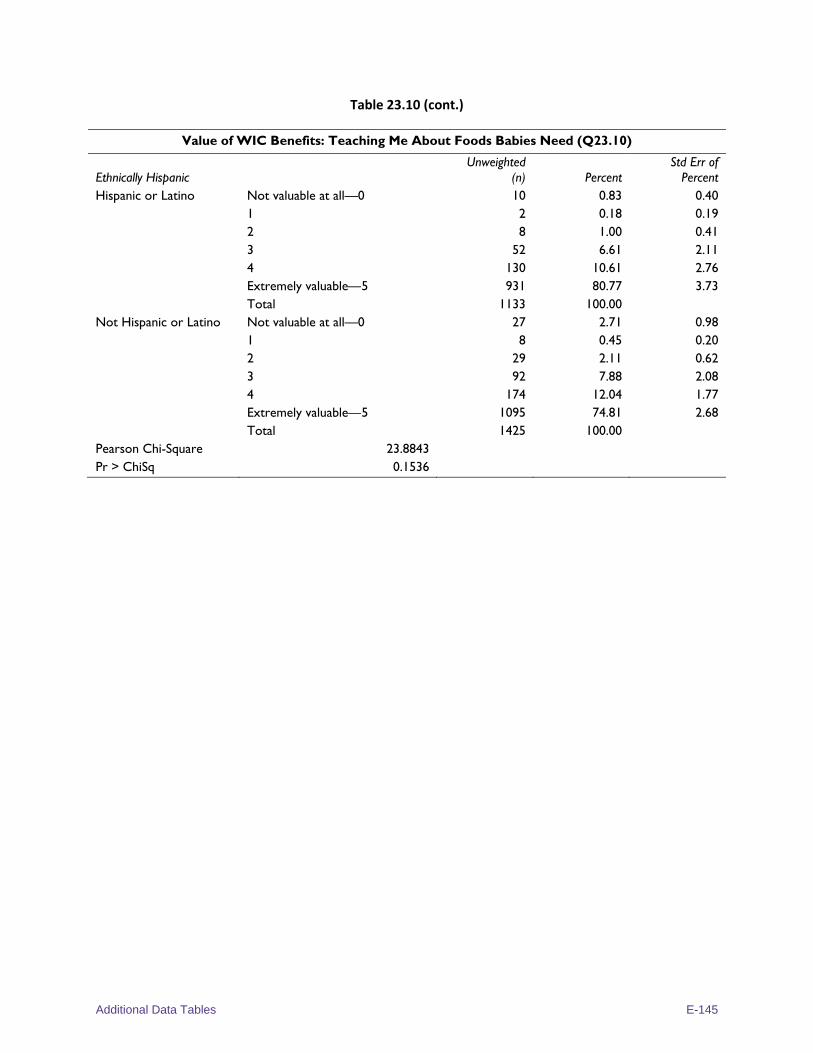
Additional Data Tables E-145
Table 23.10 (cont.)
Value of WIC Benefits: Teaching Me About Foods Babies Need (Q23.10)
Ethnically Hispanic Unweighted
(n) Percent Std Err of
Percent Hispanic or Latino Not valuable at all—0 10 0.83 0.40
1 2 0.18 0.19 2 8 1.00 0.41 3 52 6.61 2.11 4 130 10.61 2.76 Extremely valuable—5 931 80.77 3.73 Total 1133 100.00
Not Hispanic or Latino Not valuable at all—0 27 2.71 0.98 1 8 0.45 0.20 2 29 2.11 0.62 3 92 7.88 2.08 4 174 12.04 1.77 Extremely valuable—5 1095 74.81 2.68 Total 1425 100.00
Pearson Chi-Square 23.8843 Pr > ChiSq 0.1536

Table 23.10 (cont.)
Value of WIC Benefits: Teaching Me About Foods Babies Need (Q23.10)
Race Unweighted
(n) Percent Std Err of
Percent American Indian Not valuable at all—0 0 . .
1 1 2.47 3.06 2 1 3.85 3.90 3 5 18.47 9.38 4 3 3.21 3.34 Extremely valuable—5 25 72.00 9.98 Total 35 100.00
Asian/Native Hawaiian/ Pacific Islander
Not valuable at all—0 2 1.22 0.98 1 1 0.62 0.63 2 0 . . 3 4 6.94 3.79 4 12 11.50 5.46 Extremely valuable—5 67 79.72 6.61 Total 86 100.00
African American Not valuable at all—0 8 4.48 2.74 1 2 0.69 0.54 2 7 1.54 0.71 3 25 5.30 1.83 4 50 9.50 2.38 Extremely valuable—5 395 78.50 3.03 Total 487 100.00
White Not valuable at all—0 19 1.27 0.43 1 5 0.22 0.11 2 22 1.93 0.78 3 93 11.62 3.60 4 172 15.84 2.44 Extremely valuable—5 776 69.12 4.36 Total 1087 100.00
Others/Mixed Race Not valuable at all—0 9 1.44 0.69 1 1 0.12 0.13 2 7 1.23 0.53 3 18 2.56 0.76 4 67 7.16 1.98 Extremely valuable—5 775 87.49 2.42 Total 877 100.00
Significance test not possible due to zero cell counts for one or more subgroups.

Additional Data Tables E-147
Table 23.10 (cont.)
Value of WIC Benefits: Teaching Me About Foods Babies Need (Q23.10)
Education Level Unweighted
(n) Percent Std Err of
Percent Less than High School Not valuable at all—0 6 1.77 1.07
1 2 0.13 0.10 2 7 1.88 0.74 3 27 4.56 1.31 4 73 9.18 2.25 Extremely valuable—5 598 82.48 3.07 Total 713 100.00
High School Complete Not valuable at all—0 15 2.09 0.92 1 3 0.27 0.25 2 10 1.81 0.87 3 64 8.33 2.37 4 107 11.73 2.24 Extremely valuable—5 746 75.77 3.37 Total 945 100.00
More than High School Not valuable at all—0 17 1.91 0.55 1 5 0.55 0.30 2 20 1.16 0.42 3 54 8.65 3.14 4 124 12.81 1.82 Extremely valuable—5 684 74.93 3.76 Total 904 100.00
Pearson Chi-Square 24.2823 Pr > ChiSq 0.4327
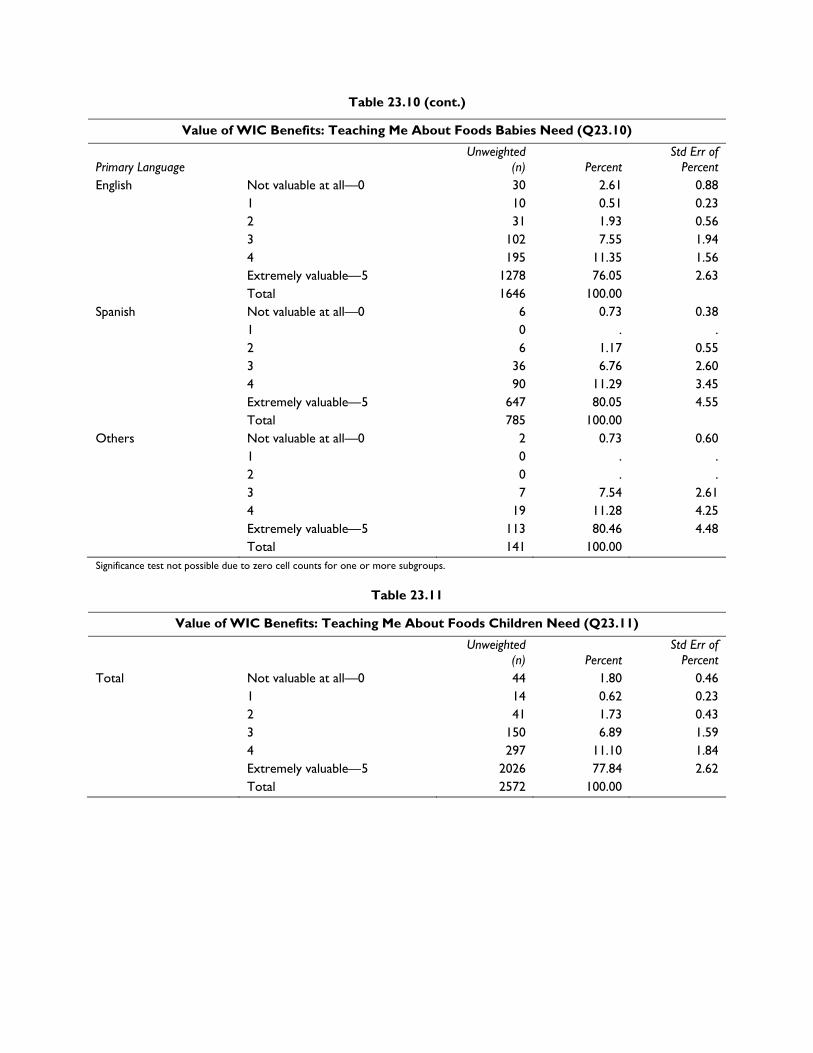
Table 23.10 (cont.)
Value of WIC Benefits: Teaching Me About Foods Babies Need (Q23.10)
Primary Language Unweighted
(n) Percent Std Err of
Percent English Not valuable at all—0 30 2.61 0.88
1 10 0.51 0.23 2 31 1.93 0.56 3 102 7.55 1.94 4 195 11.35 1.56 Extremely valuable—5 1278 76.05 2.63 Total 1646 100.00
Spanish Not valuable at all—0 6 0.73 0.38 1 0 . . 2 6 1.17 0.55 3 36 6.76 2.60 4 90 11.29 3.45 Extremely valuable—5 647 80.05 4.55 Total 785 100.00
Others Not valuable at all—0 2 0.73 0.60 1 0 . . 2 0 . . 3 7 7.54 2.61 4 19 11.28 4.25 Extremely valuable—5 113 80.46 4.48 Total 141 100.00
Significance test not possible due to zero cell counts for one or more subgroups.
Table 23.11
Value of WIC Benefits: Teaching Me About Foods Children Need (Q23.11)
Unweighted (n) Percent
Std Err of Percent
Total Not valuable at all—0 44 1.80 0.46 1 14 0.62 0.23 2 41 1.73 0.43 3 150 6.89 1.59 4 297 11.10 1.84 Extremely valuable—5 2026 77.84 2.62 Total 2572 100.00
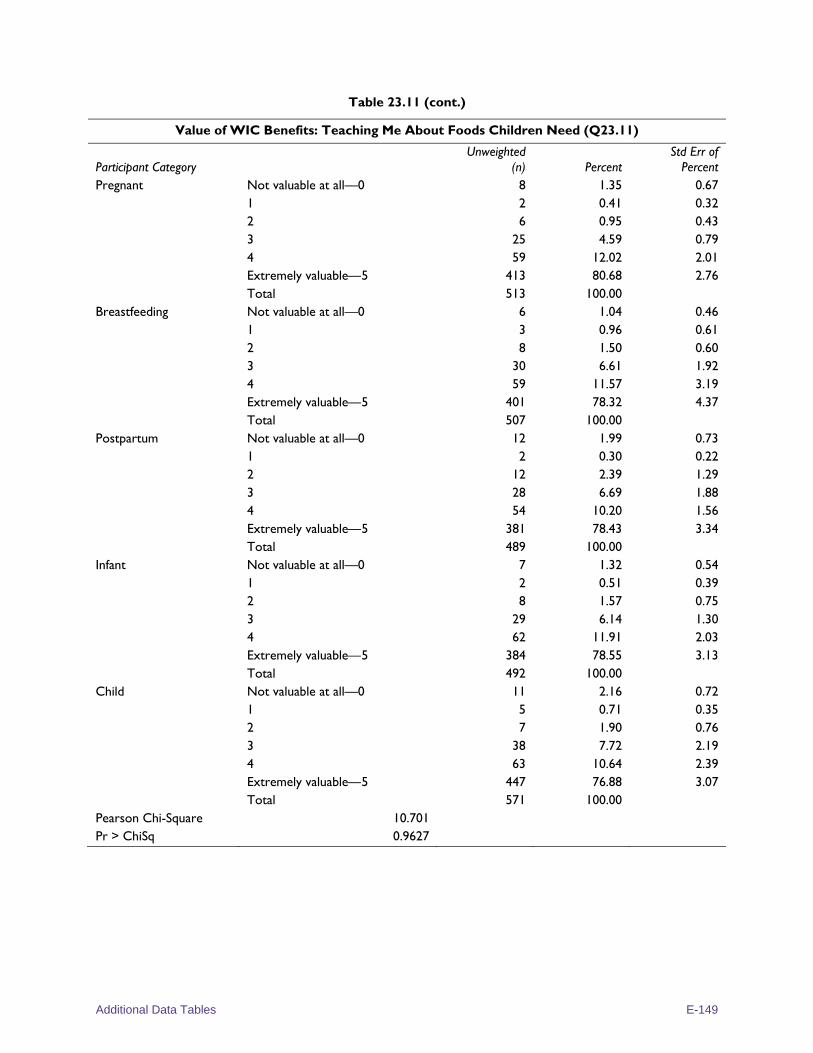
Additional Data Tables E-149
Table 23.11 (cont.)
Value of WIC Benefits: Teaching Me About Foods Children Need (Q23.11)
Participant Category Unweighted
(n) Percent Std Err of
Percent Pregnant Not valuable at all—0 8 1.35 0.67
1 2 0.41 0.32 2 6 0.95 0.43 3 25 4.59 0.79 4 59 12.02 2.01 Extremely valuable—5 413 80.68 2.76 Total 513 100.00
Breastfeeding Not valuable at all—0 6 1.04 0.46 1 3 0.96 0.61 2 8 1.50 0.60 3 30 6.61 1.92 4 59 11.57 3.19 Extremely valuable—5 401 78.32 4.37 Total 507 100.00
Postpartum Not valuable at all—0 12 1.99 0.73 1 2 0.30 0.22 2 12 2.39 1.29 3 28 6.69 1.88 4 54 10.20 1.56 Extremely valuable—5 381 78.43 3.34 Total 489 100.00
Infant Not valuable at all—0 7 1.32 0.54 1 2 0.51 0.39 2 8 1.57 0.75 3 29 6.14 1.30 4 62 11.91 2.03 Extremely valuable—5 384 78.55 3.13 Total 492 100.00
Child Not valuable at all—0 11 2.16 0.72 1 5 0.71 0.35 2 7 1.90 0.76 3 38 7.72 2.19 4 63 10.64 2.39 Extremely valuable—5 447 76.88 3.07 Total 571 100.00
Pearson Chi-Square 10.701 Pr > ChiSq 0.9627
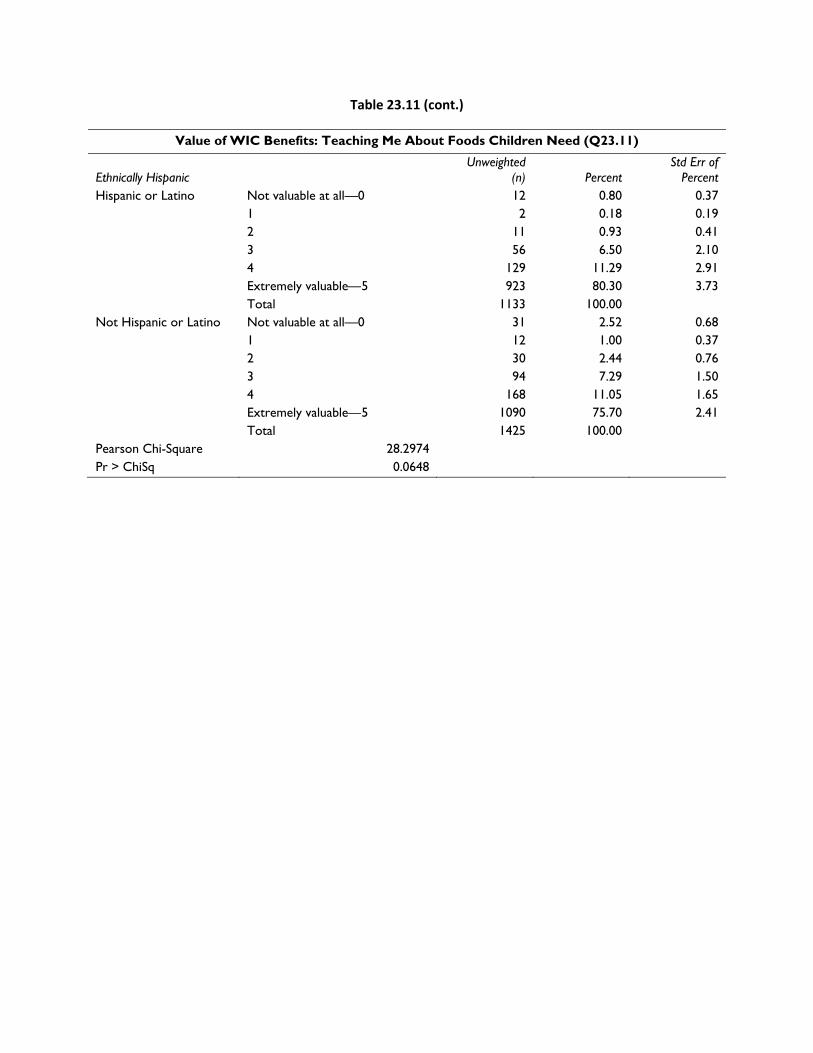
Table 23.11 (cont.)
Value of WIC Benefits: Teaching Me About Foods Children Need (Q23.11)
Ethnically Hispanic Unweighted
(n) Percent Std Err of
Percent Hispanic or Latino Not valuable at all—0 12 0.80 0.37
1 2 0.18 0.19 2 11 0.93 0.41 3 56 6.50 2.10 4 129 11.29 2.91 Extremely valuable—5 923 80.30 3.73 Total 1133 100.00
Not Hispanic or Latino Not valuable at all—0 31 2.52 0.68 1 12 1.00 0.37 2 30 2.44 0.76 3 94 7.29 1.50 4 168 11.05 1.65 Extremely valuable—5 1090 75.70 2.41 Total 1425 100.00
Pearson Chi-Square 28.2974 Pr > ChiSq 0.0648
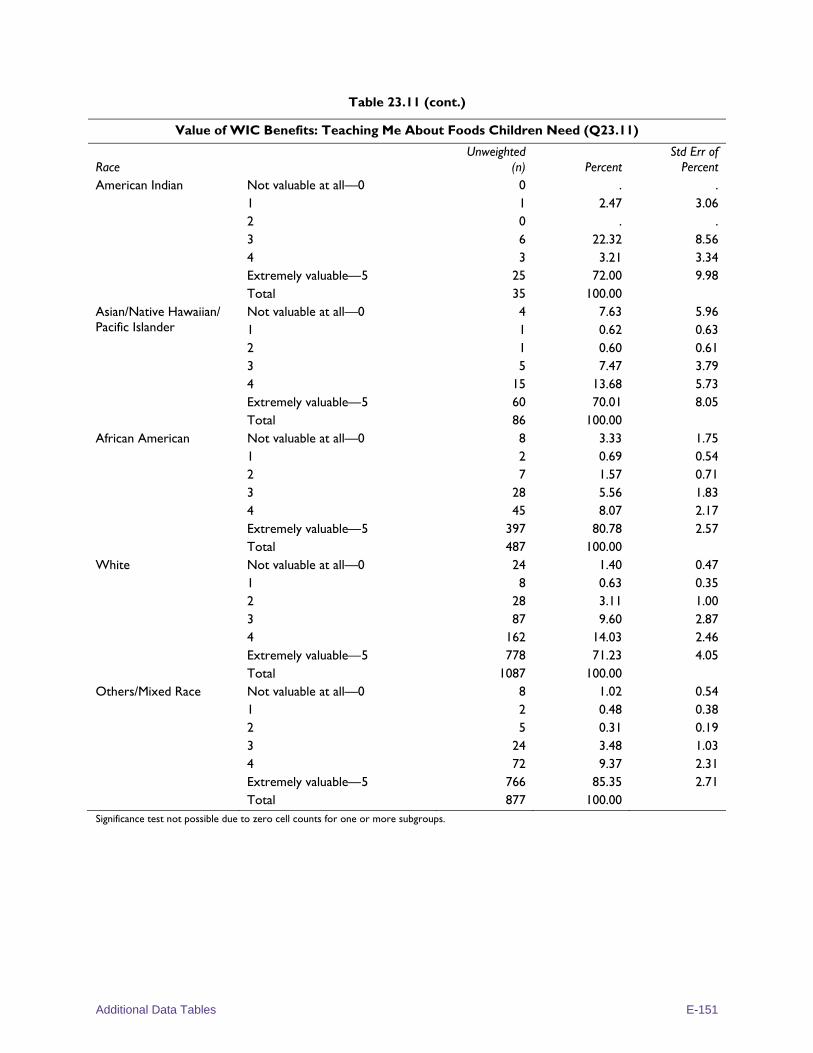
Additional Data Tables E-151
Table 23.11 (cont.)
Value of WIC Benefits: Teaching Me About Foods Children Need (Q23.11)
Race Unweighted
(n) Percent Std Err of
Percent American Indian Not valuable at all—0 0 . .
1 1 2.47 3.06 2 0 . . 3 6 22.32 8.56 4 3 3.21 3.34 Extremely valuable—5 25 72.00 9.98 Total 35 100.00
Asian/Native Hawaiian/ Pacific Islander
Not valuable at all—0 4 7.63 5.96 1 1 0.62 0.63 2 1 0.60 0.61 3 5 7.47 3.79 4 15 13.68 5.73 Extremely valuable—5 60 70.01 8.05 Total 86 100.00
African American Not valuable at all—0 8 3.33 1.75 1 2 0.69 0.54 2 7 1.57 0.71 3 28 5.56 1.83 4 45 8.07 2.17 Extremely valuable—5 397 80.78 2.57 Total 487 100.00
White Not valuable at all—0 24 1.40 0.47 1 8 0.63 0.35 2 28 3.11 1.00 3 87 9.60 2.87 4 162 14.03 2.46 Extremely valuable—5 778 71.23 4.05 Total 1087 100.00
Others/Mixed Race Not valuable at all—0 8 1.02 0.54 1 2 0.48 0.38 2 5 0.31 0.19 3 24 3.48 1.03 4 72 9.37 2.31 Extremely valuable—5 766 85.35 2.71 Total 877 100.00
Significance test not possible due to zero cell counts for one or more subgroups.

Table 23.11 (cont.)
Value of WIC Benefits: Teaching Me About Foods Children Need (Q23.11)
Education Level Unweighted
(n) Percent Std Err of
Percent Less than High School Not valuable at all—0 8 1.54 0.83
1 2 0.07 0.05 2 8 1.01 0.49 3 31 4.82 1.59 4 74 10.85 2.94 Extremely valuable—5 590 81.70 3.05 Total 713 100.00
High School Complete Not valuable at all—0 18 2.23 1.05 1 5 0.59 0.35 2 11 1.85 0.86 3 65 8.81 2.19 4 106 11.10 1.94 Extremely valuable—5 740 75.41 3.45 Total 945 100.00
More than High School Not valuable at all—0 18 1.62 0.48 1 7 1.12 0.48 2 22 2.23 0.89 3 53 6.81 2.38 4 117 11.40 2.11 Extremely valuable—5 687 76.81 3.46 Total 904 100.00
Pearson Chi-Square 24.1667 Pr > ChiSq 0.5149
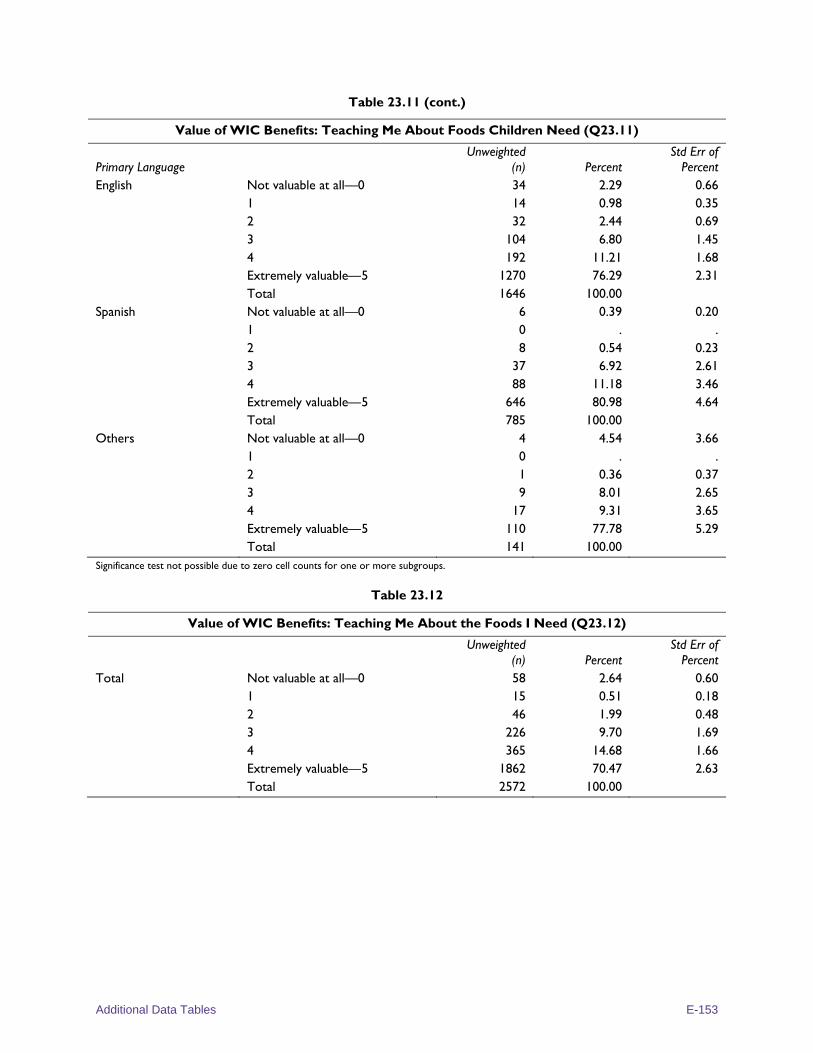
Additional Data Tables E-153
Table 23.11 (cont.)
Value of WIC Benefits: Teaching Me About Foods Children Need (Q23.11)
Primary Language Unweighted
(n) Percent Std Err of
Percent English Not valuable at all—0 34 2.29 0.66
1 14 0.98 0.35 2 32 2.44 0.69 3 104 6.80 1.45 4 192 11.21 1.68 Extremely valuable—5 1270 76.29 2.31 Total 1646 100.00
Spanish Not valuable at all—0 6 0.39 0.20 1 0 . . 2 8 0.54 0.23 3 37 6.92 2.61 4 88 11.18 3.46 Extremely valuable—5 646 80.98 4.64 Total 785 100.00
Others Not valuable at all—0 4 4.54 3.66 1 0 . . 2 1 0.36 0.37 3 9 8.01 2.65 4 17 9.31 3.65 Extremely valuable—5 110 77.78 5.29 Total 141 100.00
Significance test not possible due to zero cell counts for one or more subgroups.
Table 23.12
Value of WIC Benefits: Teaching Me About the Foods I Need (Q23.12)
Unweighted (n) Percent
Std Err of Percent
Total Not valuable at all—0 58 2.64 0.60 1 15 0.51 0.18 2 46 1.99 0.48 3 226 9.70 1.69 4 365 14.68 1.66 Extremely valuable—5 1862 70.47 2.63 Total 2572 100.00

Table 23.12 (cont.)
Value of WIC Benefits: Teaching Me About the Foods I Need (Q23.12)
Participant Category Unweighted
(n) Percent Std Err of
Percent Pregnant Not valuable at all—0 9 1.53 0.66
1 3 0.56 0.35 2 4 0.57 0.35 3 38 7.51 1.46 4 72 13.93 2.09 Extremely valuable—5 387 75.89 2.63 Total 513 100.00
Breastfeeding Not valuable at all—0 9 1.59 0.54 1 3 0.96 0.61 2 5 0.78 0.40 3 45 9.53 2.22 4 77 15.20 2.44 Extremely valuable—5 368 71.94 3.80 Total 507 100.00
Postpartum Not valuable at all—0 10 2.00 0.62 1 4 1.01 0.54 2 16 3.11 1.32 3 39 8.75 2.03 4 66 12.50 2.19 Extremely valuable—5 354 72.62 3.68 Total 489 100.00
Infant Not valuable at all—0 13 2.49 0.77 1 3 1.01 0.63 2 9 1.84 0.83 3 53 10.65 1.85 4 64 11.95 1.82 Extremely valuable—5 350 72.06 3.42 Total 492 100.00
Child Not valuable at all—0 17 3.12 0.91 1 2 0.16 0.16 2 12 2.33 0.79 3 51 9.85 2.32 4 86 16.23 2.40 Extremely valuable—5 403 68.32 3.31 Total 571 100.00
Pearson Chi-Square 27.4579 Pr > ChiSq 0.1977
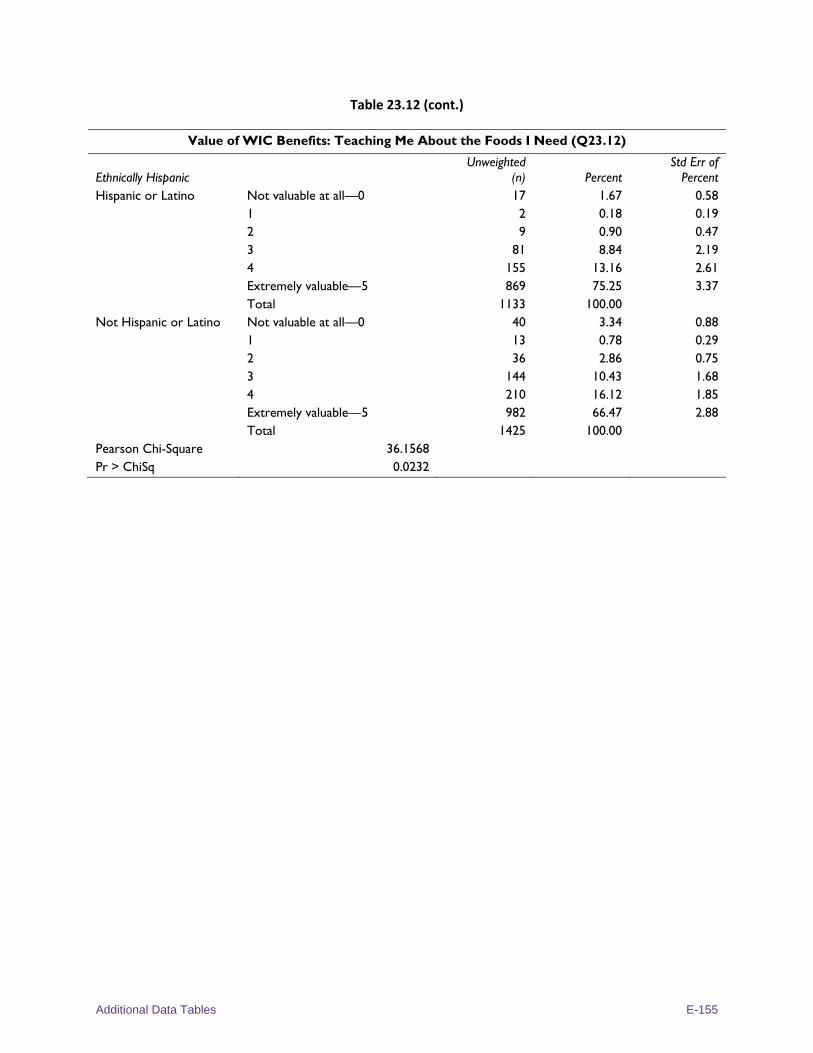
Additional Data Tables E-155
Table 23.12 (cont.)
Value of WIC Benefits: Teaching Me About the Foods I Need (Q23.12)
Ethnically Hispanic Unweighted
(n) Percent Std Err of
Percent Hispanic or Latino Not valuable at all—0 17 1.67 0.58
1 2 0.18 0.19 2 9 0.90 0.47 3 81 8.84 2.19 4 155 13.16 2.61 Extremely valuable—5 869 75.25 3.37 Total 1133 100.00
Not Hispanic or Latino Not valuable at all—0 40 3.34 0.88 1 13 0.78 0.29 2 36 2.86 0.75 3 144 10.43 1.68 4 210 16.12 1.85 Extremely valuable—5 982 66.47 2.88 Total 1425 100.00
Pearson Chi-Square 36.1568 Pr > ChiSq 0.0232
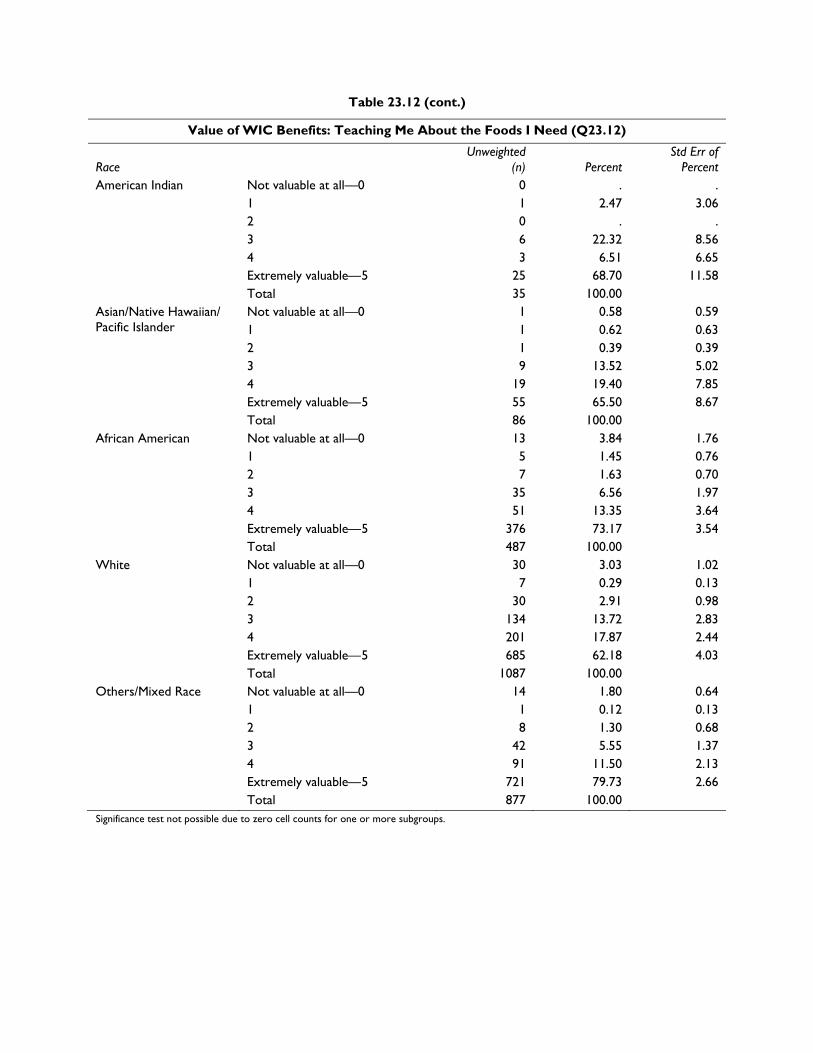
Table 23.12 (cont.)
Value of WIC Benefits: Teaching Me About the Foods I Need (Q23.12)
Race Unweighted
(n) Percent Std Err of
Percent American Indian Not valuable at all—0 0 . .
1 1 2.47 3.06 2 0 . . 3 6 22.32 8.56 4 3 6.51 6.65 Extremely valuable—5 25 68.70 11.58 Total 35 100.00
Asian/Native Hawaiian/ Pacific Islander
Not valuable at all—0 1 0.58 0.59 1 1 0.62 0.63 2 1 0.39 0.39 3 9 13.52 5.02 4 19 19.40 7.85 Extremely valuable—5 55 65.50 8.67 Total 86 100.00
African American Not valuable at all—0 13 3.84 1.76 1 5 1.45 0.76 2 7 1.63 0.70 3 35 6.56 1.97 4 51 13.35 3.64 Extremely valuable—5 376 73.17 3.54 Total 487 100.00
White Not valuable at all—0 30 3.03 1.02 1 7 0.29 0.13 2 30 2.91 0.98 3 134 13.72 2.83 4 201 17.87 2.44 Extremely valuable—5 685 62.18 4.03 Total 1087 100.00
Others/Mixed Race Not valuable at all—0 14 1.80 0.64 1 1 0.12 0.13 2 8 1.30 0.68 3 42 5.55 1.37 4 91 11.50 2.13 Extremely valuable—5 721 79.73 2.66 Total 877 100.00
Significance test not possible due to zero cell counts for one or more subgroups.

Additional Data Tables E-157
Table 23.12 (cont.)
Value of WIC Benefits: Teaching Me About the Foods I Need (Q23.12)
Education Level Unweighted
(n) Percent Std Err of
Percent Less than High School Not valuable at all—0 13 2.06 0.89
1 2 0.14 0.11 2 9 1.97 0.92 3 41 6.06 1.30 4 92 14.41 2.70 Extremely valuable—5 556 75.36 3.05 Total 713 100.00
High School Complete Not valuable at all—0 18 1.87 0.68 1 6 0.63 0.35 2 16 2.61 0.94 3 97 12.37 2.36 4 118 11.88 1.96 Extremely valuable—5 690 70.64 3.28 Total 945 100.00
More than High School Not valuable at all—0 27 3.88 1.16 1 7 0.69 0.37 2 21 1.44 0.49 3 87 10.23 2.41 4 155 17.70 1.84 Extremely valuable—5 607 66.06 3.60 Total 904 100.00
Pearson Chi-Square 46.904 Pr > ChiSq 0.0107
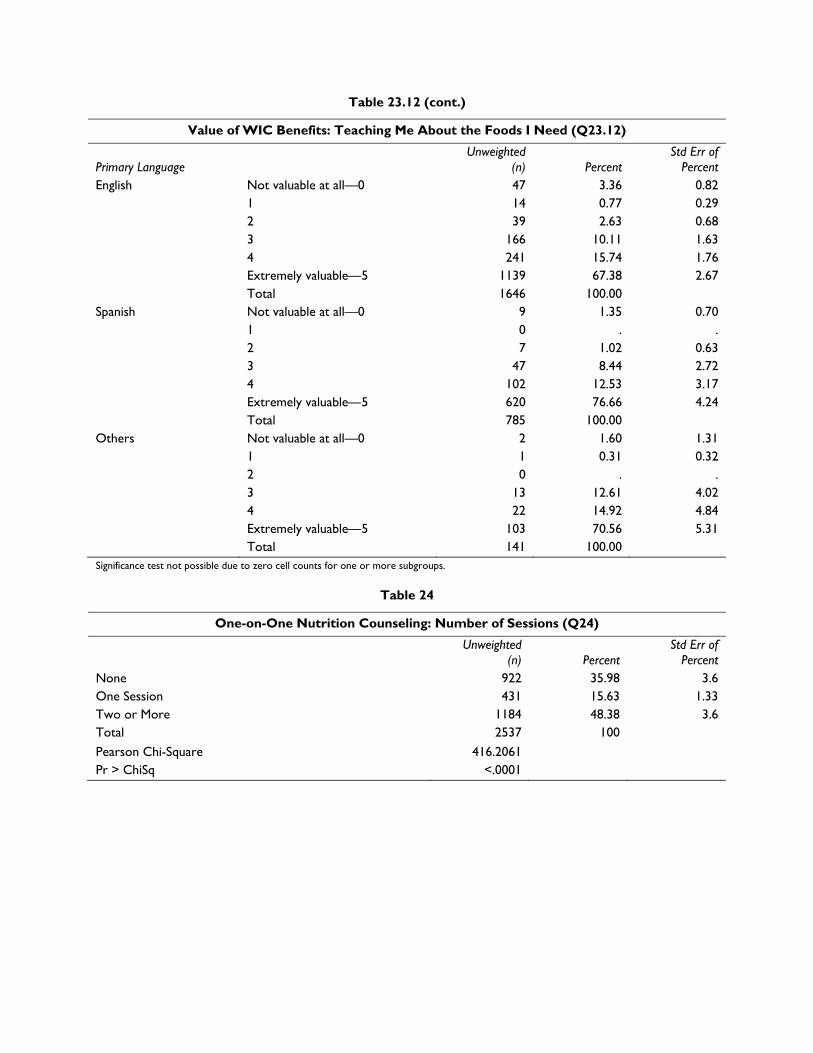
Table 23.12 (cont.)
Value of WIC Benefits: Teaching Me About the Foods I Need (Q23.12)
Primary Language Unweighted
(n) Percent Std Err of
Percent English Not valuable at all—0 47 3.36 0.82
1 14 0.77 0.29 2 39 2.63 0.68 3 166 10.11 1.63 4 241 15.74 1.76 Extremely valuable—5 1139 67.38 2.67 Total 1646 100.00
Spanish Not valuable at all—0 9 1.35 0.70 1 0 . . 2 7 1.02 0.63 3 47 8.44 2.72 4 102 12.53 3.17 Extremely valuable—5 620 76.66 4.24 Total 785 100.00
Others Not valuable at all—0 2 1.60 1.31 1 1 0.31 0.32 2 0 . . 3 13 12.61 4.02 4 22 14.92 4.84 Extremely valuable—5 103 70.56 5.31 Total 141 100.00
Significance test not possible due to zero cell counts for one or more subgroups.
Table 24
One-on-One Nutrition Counseling: Number of Sessions (Q24)
Unweighted (n) Percent
Std Err of Percent
None 922 35.98 3.6 One Session 431 15.63 1.33 Two or More 1184 48.38 3.6 Total 2537 100
Pearson Chi-Square 416.2061 Pr > ChiSq <.0001
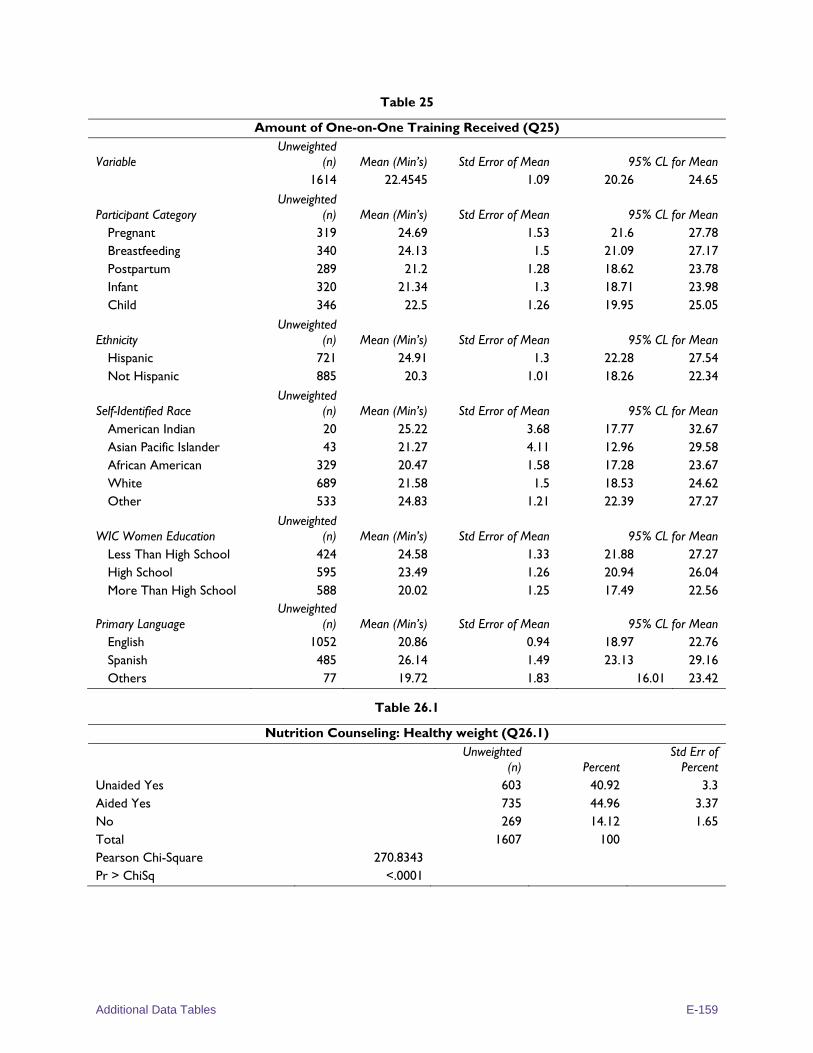
Additional Data Tables E-159
Table 25
Amount of One-on-One Training Received (Q25)
Variable Unweighted
(n) Mean (Min’s) Std Error of Mean 95% CL for Mean 1614 22.4545 1.09 20.26 24.65
Participant Category Unweighted
(n) Mean (Min’s) Std Error of Mean 95% CL for Mean Pregnant 319 24.69 1.53 21.6 27.78 Breastfeeding 340 24.13 1.5 21.09 27.17 Postpartum 289 21.2 1.28 18.62 23.78 Infant 320 21.34 1.3 18.71 23.98 Child 346 22.5 1.26 19.95 25.05
Ethnicity Unweighted
(n) Mean (Min’s) Std Error of Mean 95% CL for Mean Hispanic 721 24.91 1.3 22.28 27.54 Not Hispanic 885 20.3 1.01 18.26 22.34
Self-Identified Race Unweighted
(n) Mean (Min’s) Std Error of Mean 95% CL for Mean American Indian 20 25.22 3.68 17.77 32.67 Asian Pacific Islander 43 21.27 4.11 12.96 29.58 African American 329 20.47 1.58 17.28 23.67 White 689 21.58 1.5 18.53 24.62 Other 533 24.83 1.21 22.39 27.27
WIC Women Education Unweighted
(n) Mean (Min’s) Std Error of Mean 95% CL for Mean Less Than High School 424 24.58 1.33 21.88 27.27 High School 595 23.49 1.26 20.94 26.04 More Than High School 588 20.02 1.25 17.49 22.56
Primary Language Unweighted
(n) Mean (Min’s) Std Error of Mean 95% CL for Mean English 1052 20.86 0.94 18.97 22.76 Spanish 485 26.14 1.49 23.13 29.16 Others 77 19.72 1.83 16.01 23.42
Table 26.1
Nutrition Counseling: Healthy weight (Q26.1)
Unweighted
(n) Percent Std Err of
Percent Unaided Yes 603 40.92 3.3 Aided Yes 735 44.96 3.37 No 269 14.12 1.65 Total 1607 100 Pearson Chi-Square 270.8343 Pr > ChiSq <.0001
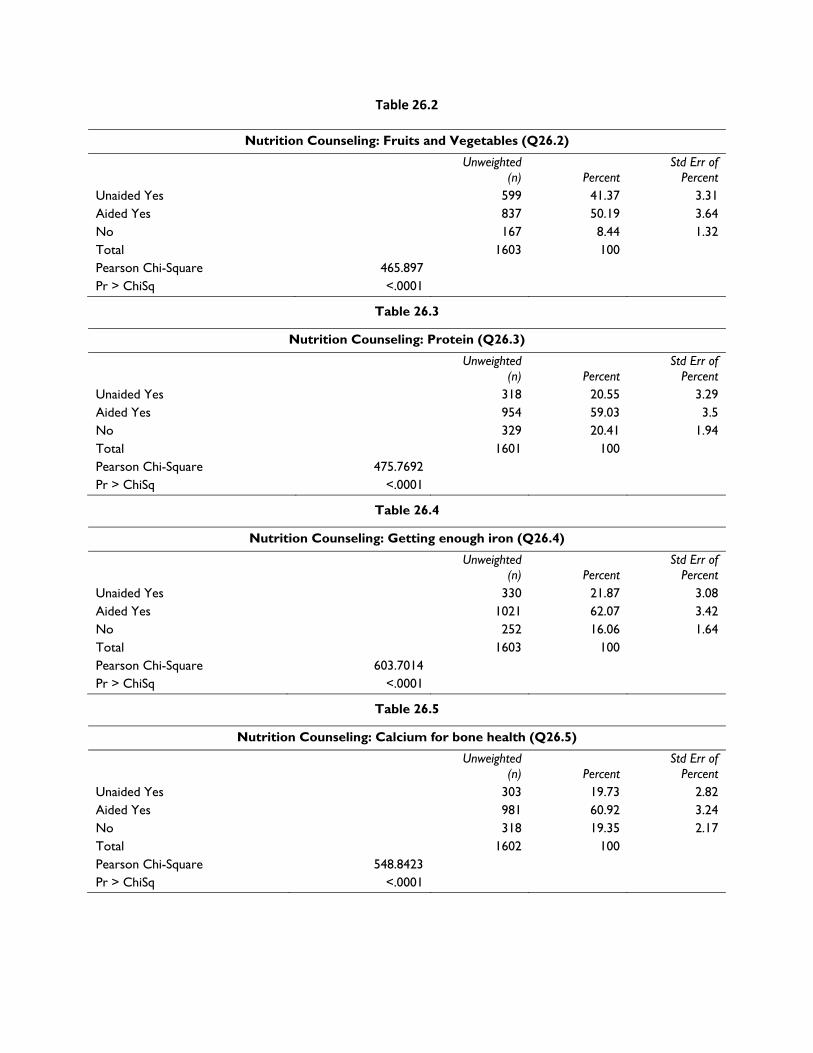
Table 26.2
Nutrition Counseling: Fruits and Vegetables (Q26.2)
Unweighted (n) Percent
Std Err of Percent
Unaided Yes 599 41.37 3.31 Aided Yes 837 50.19 3.64 No 167 8.44 1.32 Total 1603 100 Pearson Chi-Square 465.897 Pr > ChiSq <.0001
Table 26.3
Nutrition Counseling: Protein (Q26.3)
Unweighted (n) Percent
Std Err of Percent
Unaided Yes 318 20.55 3.29 Aided Yes 954 59.03 3.5 No 329 20.41 1.94 Total 1601 100 Pearson Chi-Square 475.7692 Pr > ChiSq <.0001
Table 26.4
Nutrition Counseling: Getting enough iron (Q26.4)
Unweighted (n) Percent
Std Err of Percent
Unaided Yes 330 21.87 3.08 Aided Yes 1021 62.07 3.42 No 252 16.06 1.64 Total 1603 100 Pearson Chi-Square 603.7014 Pr > ChiSq <.0001
Table 26.5
Nutrition Counseling: Calcium for bone health (Q26.5)
Unweighted (n) Percent
Std Err of Percent
Unaided Yes 303 19.73 2.82 Aided Yes 981 60.92 3.24 No 318 19.35 2.17 Total 1602 100 Pearson Chi-Square 548.8423 Pr > ChiSq <.0001

Additional Data Tables E-161
Table 26.6
Nutrition Counseling: Vitamin C (Q26.6)
Unweighted (n) Percent
Std Err of Percent
Unaided Yes 259 17.97 3.18 Aided Yes 905 57.42 3.29 No 436 24.62 2.77 Total 1600 100 Pearson Chi-Square 428.2046 Pr > ChiSq <.0001
Table 26.7
Nutrition Counseling: Other vitamins and food supplements (Q26.7)
Unweighted (n) Percent
Std Err of Percent
Unaided Yes 261 15.59 2.46 Aided Yes 827 52.64 2.72 No 511 31.77 2.9 Total 1599 100 Pearson Chi-Square 331.1778 Pr > ChiSq <.0001
Table 26.8
Nutrition Counseling: Food safety (Q26.8)
Unweighted (n) Percent
Std Err of Percent
Unaided Yes 276 18.04 3.69 Aided Yes 845 52.52 3.16 No 479 29.45 2.92 Total 1600 100 Pearson Chi-Square 296.2556 Pr > ChiSq <.0001
Table 26.9
Nutrition Counseling: Physical activity (Q26.9)
Unweighted (n) Percent
Std Err of Percent
Unaided Yes 248 16.71 3.39 Aided Yes 828 52.8 3.33 No 524 30.48 2.69 Total 1600 100 Pearson Chi-Square 318.4459 Pr > ChiSq <.0001
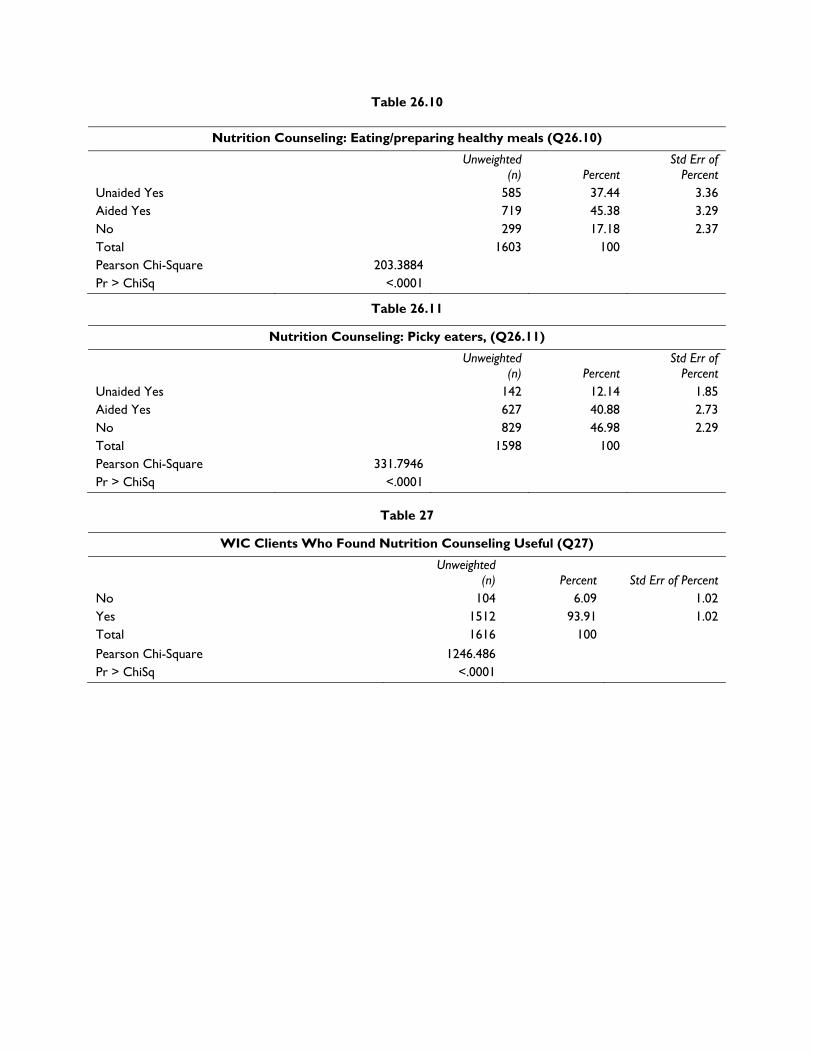
Table 26.10
Nutrition Counseling: Eating/preparing healthy meals (Q26.10)
Unweighted (n) Percent
Std Err of Percent
Unaided Yes 585 37.44 3.36 Aided Yes 719 45.38 3.29 No 299 17.18 2.37 Total 1603 100 Pearson Chi-Square 203.3884 Pr > ChiSq <.0001
Table 26.11
Nutrition Counseling: Picky eaters, (Q26.11)
Unweighted (n) Percent
Std Err of Percent
Unaided Yes 142 12.14 1.85 Aided Yes 627 40.88 2.73 No 829 46.98 2.29 Total 1598 100 Pearson Chi-Square 331.7946 Pr > ChiSq <.0001
Table 27
WIC Clients Who Found Nutrition Counseling Useful (Q27)
Unweighted (n) Percent Std Err of Percent
No 104 6.09 1.02 Yes 1512 93.91 1.02 Total 1616 100
Pearson Chi-Square 1246.486 Pr > ChiSq <.0001
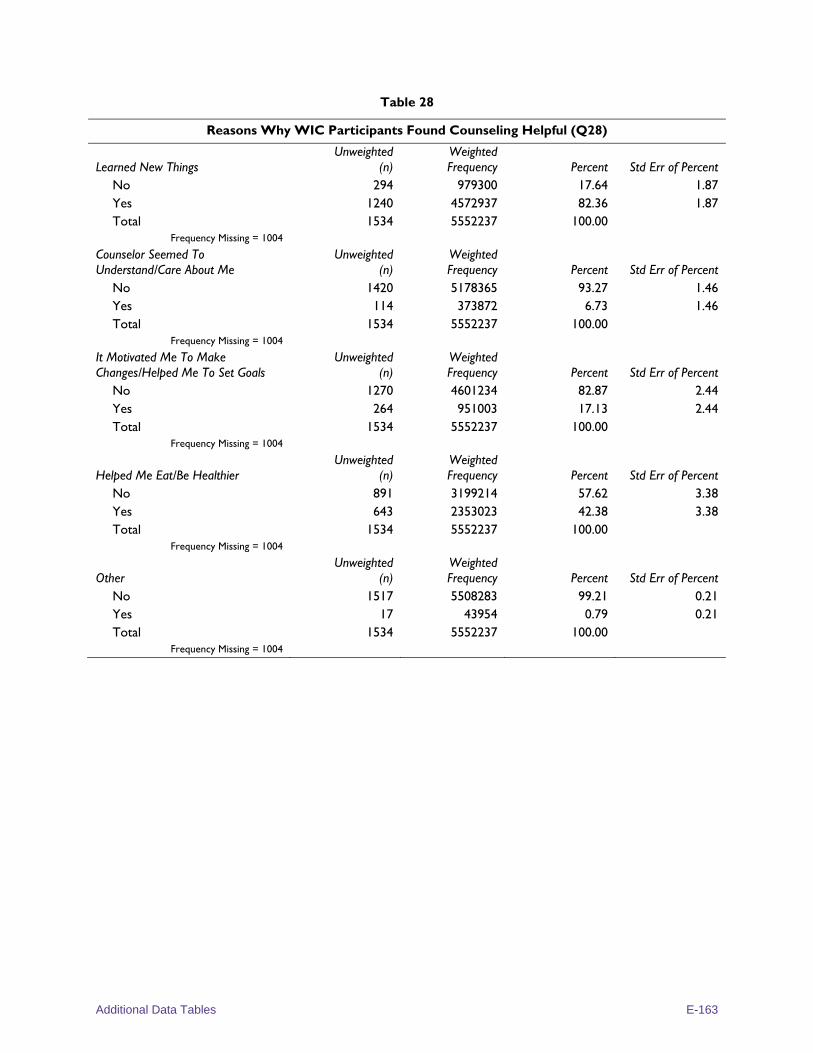
Additional Data Tables E-163
Table 28
Reasons Why WIC Participants Found Counseling Helpful (Q28)
Learned New Things Unweighted
(n) Weighted Frequency Percent Std Err of Percent
No 294 979300 17.64 1.87 Yes 1240 4572937 82.36 1.87 Total 1534 5552237 100.00
Frequency Missing = 1004
Counselor Seemed To Understand/Care About Me
Unweighted (n)
Weighted Frequency Percent Std Err of Percent
No 1420 5178365 93.27 1.46 Yes 114 373872 6.73 1.46 Total 1534 5552237 100.00
Frequency Missing = 1004
It Motivated Me To Make Changes/Helped Me To Set Goals
Unweighted (n)
Weighted Frequency Percent Std Err of Percent
No 1270 4601234 82.87 2.44 Yes 264 951003 17.13 2.44 Total 1534 5552237 100.00
Frequency Missing = 1004
Helped Me Eat/Be Healthier Unweighted
(n) Weighted Frequency Percent Std Err of Percent
No 891 3199214 57.62 3.38 Yes 643 2353023 42.38 3.38 Total 1534 5552237 100.00
Frequency Missing = 1004
Other Unweighted
(n) Weighted Frequency Percent Std Err of Percent
No 1517 5508283 99.21 0.21 Yes 17 43954 0.79 0.21 Total 1534 5552237 100.00
Frequency Missing = 1004
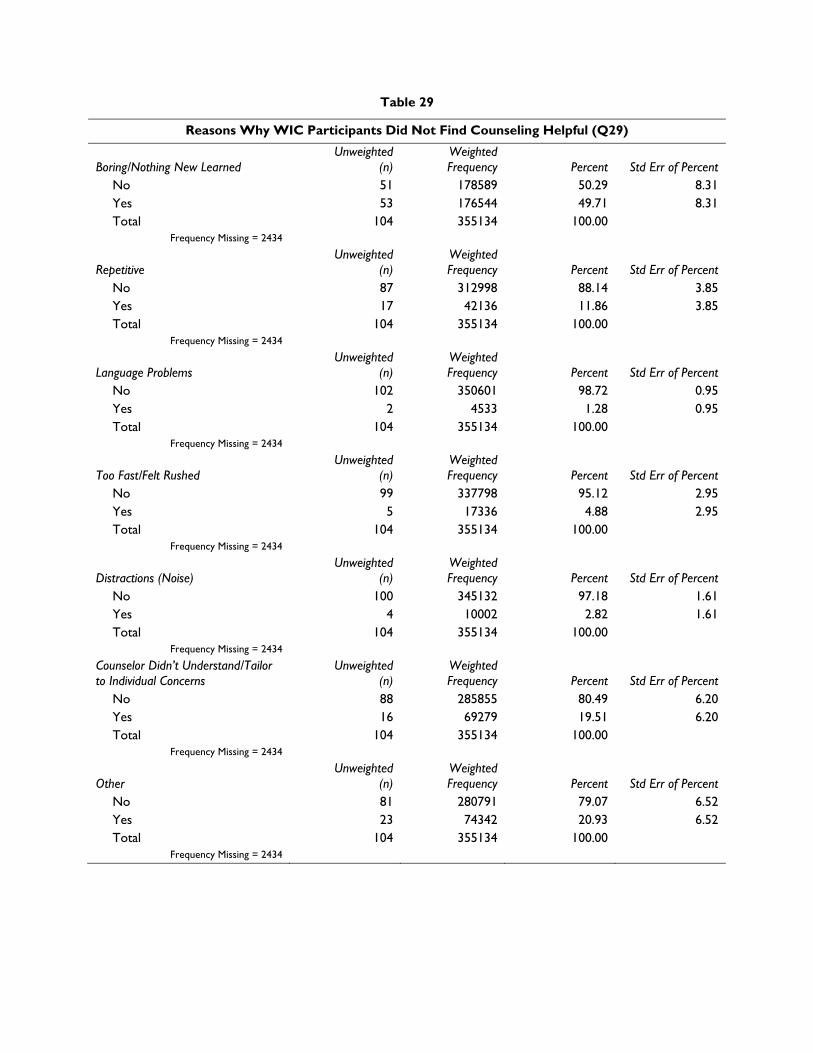
Table 29
Reasons Why WIC Participants Did Not Find Counseling Helpful (Q29)
Boring/Nothing New Learned Unweighted
(n) Weighted Frequency Percent Std Err of Percent
No 51 178589 50.29 8.31 Yes 53 176544 49.71 8.31 Total 104 355134 100.00
Frequency Missing = 2434
Repetitive Unweighted
(n) Weighted Frequency Percent Std Err of Percent
No 87 312998 88.14 3.85 Yes 17 42136 11.86 3.85 Total 104 355134 100.00
Frequency Missing = 2434
Language Problems Unweighted
(n) Weighted Frequency Percent Std Err of Percent
No 102 350601 98.72 0.95 Yes 2 4533 1.28 0.95 Total 104 355134 100.00
Frequency Missing = 2434
Too Fast/Felt Rushed Unweighted
(n) Weighted Frequency Percent Std Err of Percent
No 99 337798 95.12 2.95 Yes 5 17336 4.88 2.95 Total 104 355134 100.00
Frequency Missing = 2434
Distractions (Noise) Unweighted
(n) Weighted Frequency Percent Std Err of Percent
No 100 345132 97.18 1.61 Yes 4 10002 2.82 1.61 Total 104 355134 100.00
Frequency Missing = 2434
Counselor Didn’t Understand/Tailor to Individual Concerns
Unweighted (n)
Weighted Frequency Percent Std Err of Percent
No 88 285855 80.49 6.20 Yes 16 69279 19.51 6.20 Total 104 355134 100.00
Frequency Missing = 2434
Other Unweighted
(n) Weighted Frequency Percent Std Err of Percent
No 81 280791 79.07 6.52 Yes 23 74342 20.93 6.52 Total 104 355134 100.00
Frequency Missing = 2434
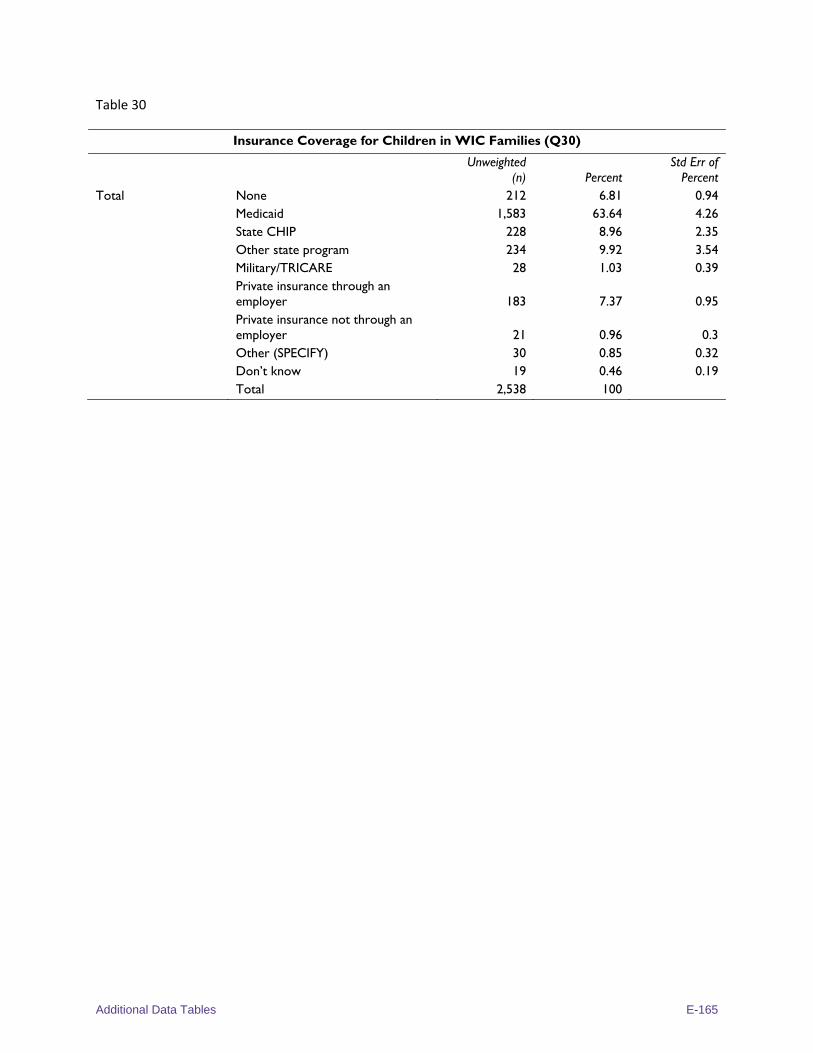
Additional Data Tables E-165
Table 30
Insurance Coverage for Children in WIC Families (Q30)
Unweighted (n) Percent
Std Err of Percent
Total None 212 6.81 0.94 Medicaid 1,583 63.64 4.26 State CHIP 228 8.96 2.35 Other state program 234 9.92 3.54 Military/TRICARE 28 1.03 0.39 Private insurance through an employer 183 7.37 0.95 Private insurance not through an employer 21 0.96 0.3 Other (SPECIFY) 30 0.85 0.32 Don’t know 19 0.46 0.19 Total 2,538 100
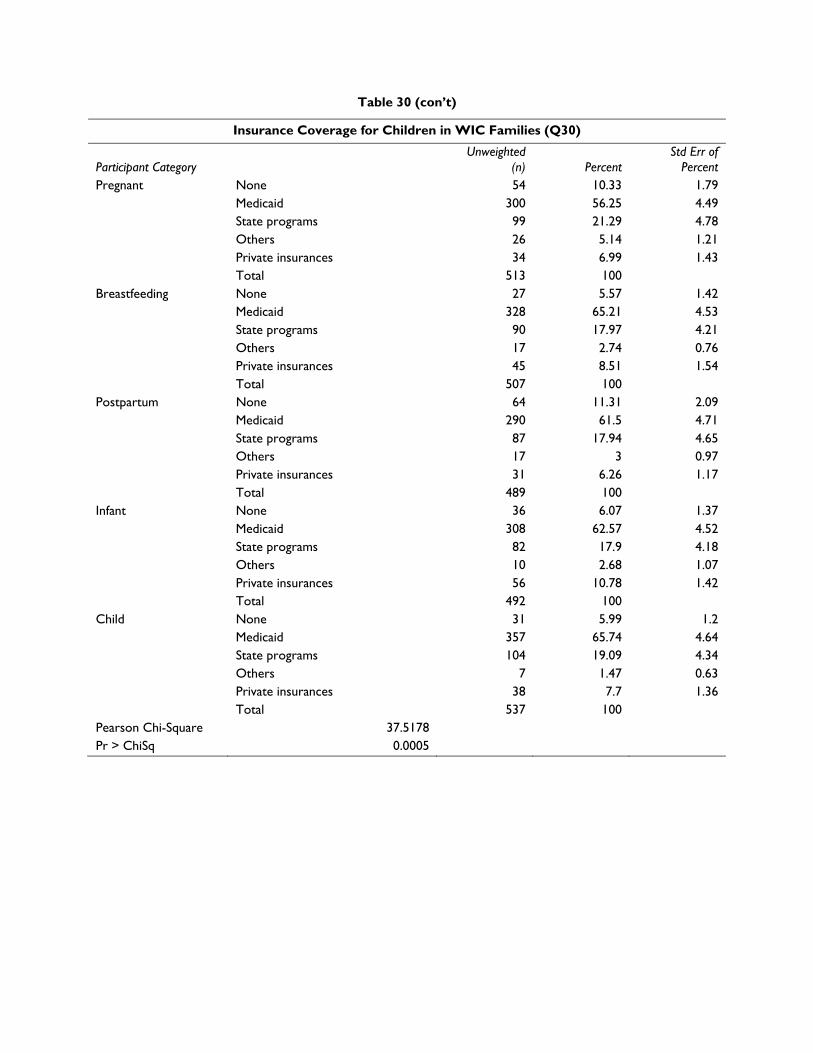
Table 30 (con’t)
Insurance Coverage for Children in WIC Families (Q30)
Participant Category Unweighted
(n) Percent Std Err of
Percent Pregnant None 54 10.33 1.79
Medicaid 300 56.25 4.49 State programs 99 21.29 4.78 Others 26 5.14 1.21 Private insurances 34 6.99 1.43 Total 513 100
Breastfeeding None 27 5.57 1.42 Medicaid 328 65.21 4.53 State programs 90 17.97 4.21 Others 17 2.74 0.76 Private insurances 45 8.51 1.54 Total 507 100
Postpartum None 64 11.31 2.09 Medicaid 290 61.5 4.71 State programs 87 17.94 4.65 Others 17 3 0.97 Private insurances 31 6.26 1.17 Total 489 100
Infant None 36 6.07 1.37 Medicaid 308 62.57 4.52 State programs 82 17.9 4.18 Others 10 2.68 1.07 Private insurances 56 10.78 1.42 Total 492 100
Child None 31 5.99 1.2 Medicaid 357 65.74 4.64 State programs 104 19.09 4.34 Others 7 1.47 0.63 Private insurances 38 7.7 1.36 Total 537 100
Pearson Chi-Square 37.5178 Pr > ChiSq 0.0005
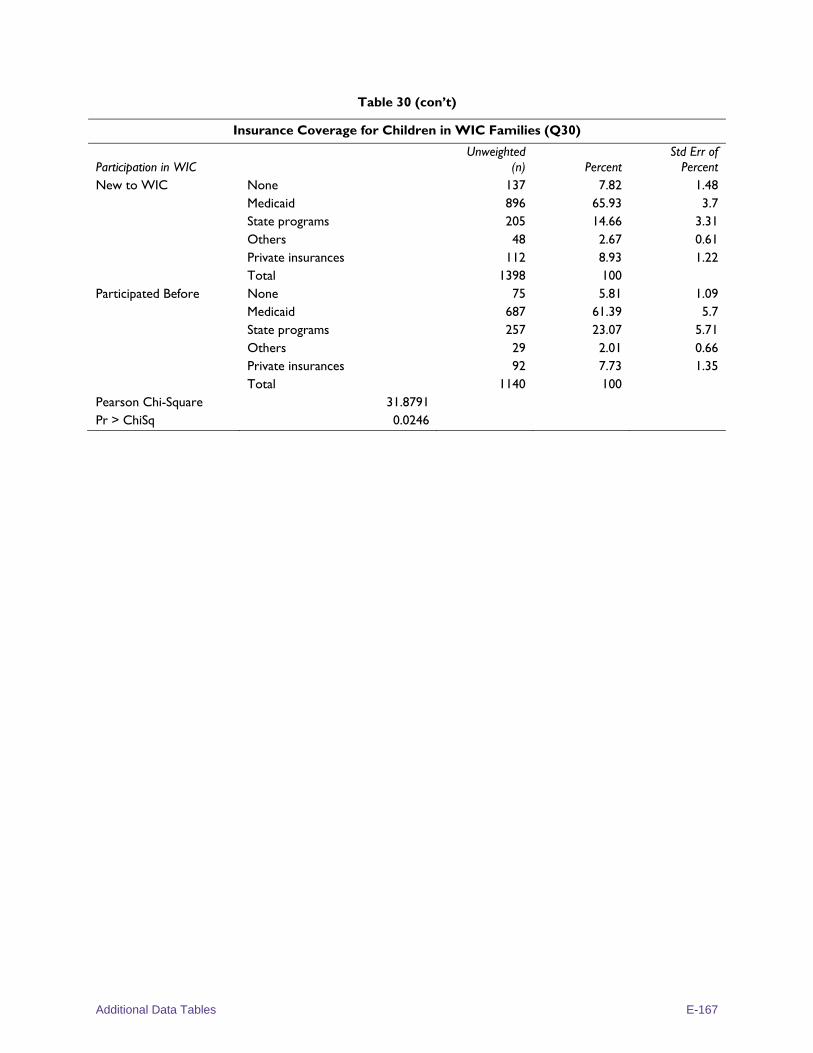
Additional Data Tables E-167
Table 30 (con’t)
Insurance Coverage for Children in WIC Families (Q30)
Participation in WIC Unweighted
(n) Percent Std Err of
Percent New to WIC None 137 7.82 1.48
Medicaid 896 65.93 3.7 State programs 205 14.66 3.31 Others 48 2.67 0.61 Private insurances 112 8.93 1.22 Total 1398 100
Participated Before None 75 5.81 1.09 Medicaid 687 61.39 5.7 State programs 257 23.07 5.71 Others 29 2.01 0.66 Private insurances 92 7.73 1.35 Total 1140 100
Pearson Chi-Square 31.8791 Pr > ChiSq 0.0246
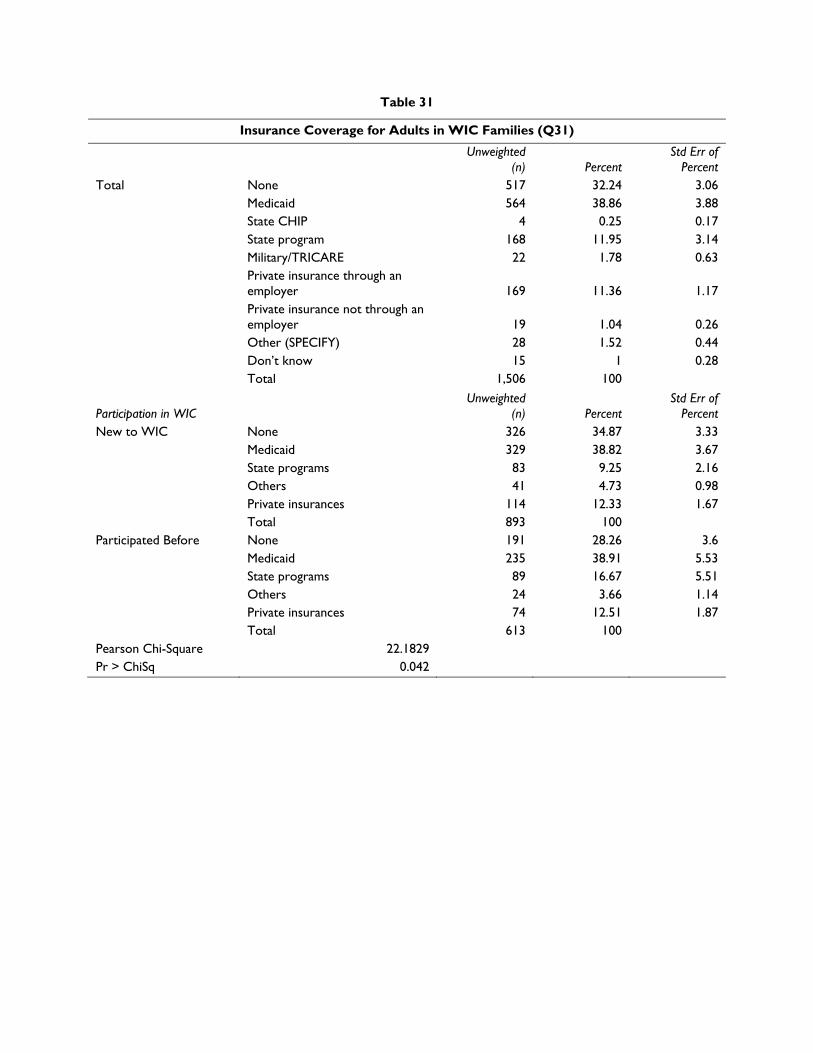
Table 31
Insurance Coverage for Adults in WIC Families (Q31)
Unweighted (n) Percent
Std Err of Percent
Total None 517 32.24 3.06 Medicaid 564 38.86 3.88 State CHIP 4 0.25 0.17 State program 168 11.95 3.14 Military/TRICARE 22 1.78 0.63 Private insurance through an employer 169 11.36 1.17 Private insurance not through an employer 19 1.04 0.26 Other (SPECIFY) 28 1.52 0.44 Don’t know 15 1 0.28 Total 1,506 100
Participation in WIC Unweighted
(n) Percent Std Err of
Percent New to WIC None 326 34.87 3.33
Medicaid 329 38.82 3.67 State programs 83 9.25 2.16 Others 41 4.73 0.98 Private insurances 114 12.33 1.67 Total 893 100
Participated Before None 191 28.26 3.6 Medicaid 235 38.91 5.53 State programs 89 16.67 5.51 Others 24 3.66 1.14 Private insurances 74 12.51 1.87 Total 613 100
Pearson Chi-Square 22.1829 Pr > ChiSq 0.042
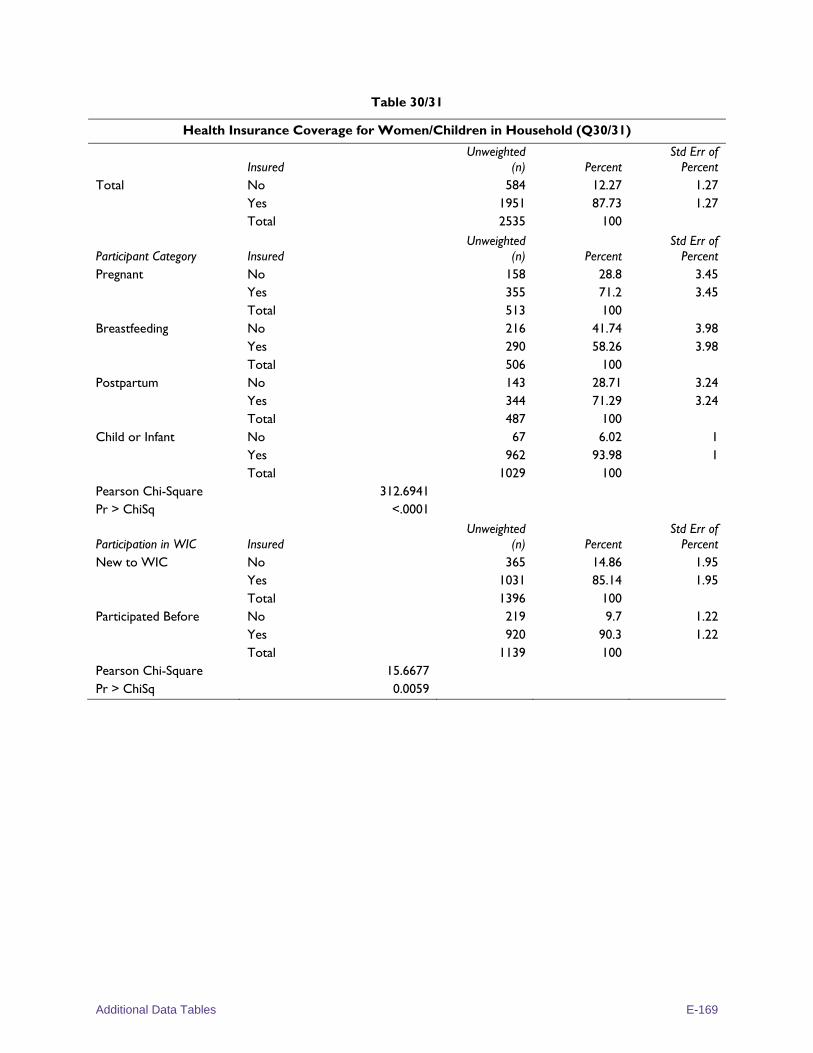
Additional Data Tables E-169
Table 30/31
Health Insurance Coverage for Women/Children in Household (Q30/31)
Insured Unweighted
(n) Percent Std Err of
Percent Total No 584 12.27 1.27 Yes 1951 87.73 1.27 Total 2535 100
Participant Category Insured Unweighted
(n) Percent Std Err of
Percent Pregnant No 158 28.8 3.45 Yes 355 71.2 3.45 Total 513 100 Breastfeeding No 216 41.74 3.98 Yes 290 58.26 3.98 Total 506 100 Postpartum No 143 28.71 3.24 Yes 344 71.29 3.24 Total 487 100 Child or Infant No 67 6.02 1 Yes 962 93.98 1 Total 1029 100 Pearson Chi-Square 312.6941 Pr > ChiSq <.0001
Participation in WIC Insured Unweighted
(n) Percent Std Err of
Percent New to WIC No 365 14.86 1.95 Yes 1031 85.14 1.95 Total 1396 100 Participated Before No 219 9.7 1.22 Yes 920 90.3 1.22 Total 1139 100 Pearson Chi-Square 15.6677 Pr > ChiSq 0.0059
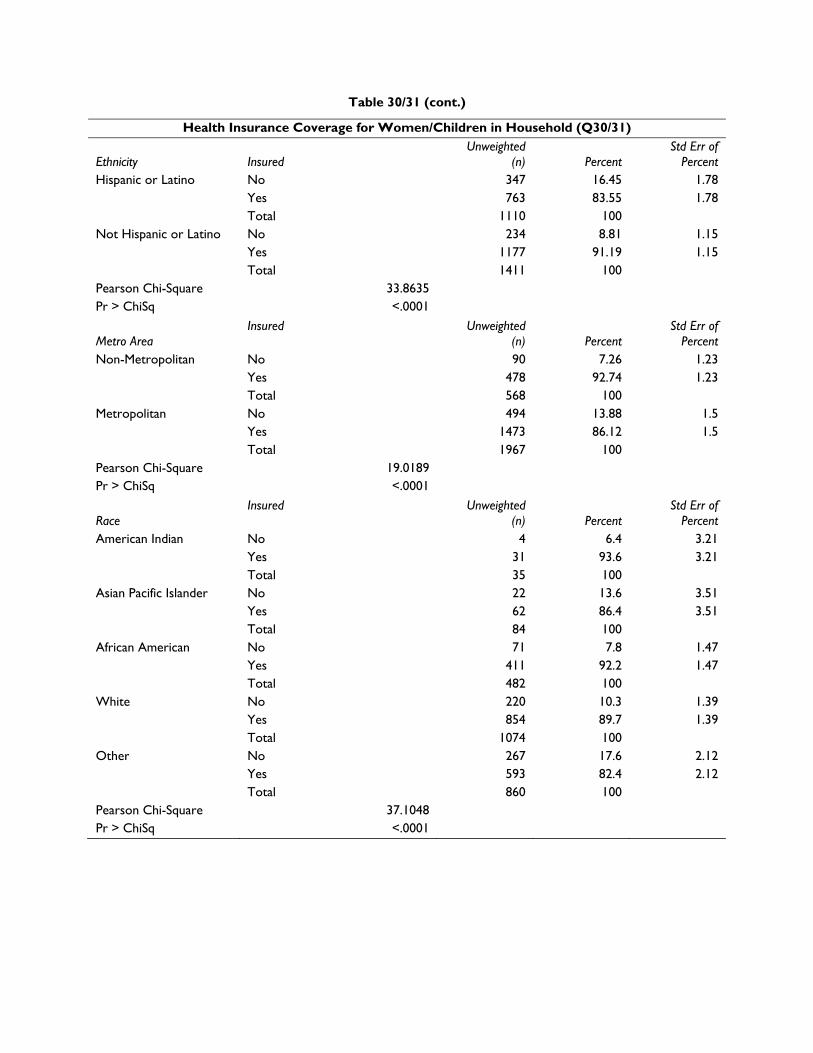
Table 30/31 (cont.)
Health Insurance Coverage for Women/Children in Household (Q30/31)
Ethnicity Insured Unweighted
(n) Percent Std Err of
Percent Hispanic or Latino No 347 16.45 1.78 Yes 763 83.55 1.78 Total 1110 100 Not Hispanic or Latino No 234 8.81 1.15 Yes 1177 91.19 1.15 Total 1411 100 Pearson Chi-Square 33.8635 Pr > ChiSq <.0001
Metro Area Insured Unweighted
(n) Percent Std Err of
Percent Non-Metropolitan No 90 7.26 1.23
Yes 478 92.74 1.23 Total 568 100
Metropolitan No 494 13.88 1.5 Yes 1473 86.12 1.5 Total 1967 100
Pearson Chi-Square 19.0189 Pr > ChiSq <.0001
Race Insured Unweighted
(n) Percent Std Err of
Percent American Indian No 4 6.4 3.21 Yes 31 93.6 3.21 Total 35 100 Asian Pacific Islander No 22 13.6 3.51 Yes 62 86.4 3.51 Total 84 100 African American No 71 7.8 1.47 Yes 411 92.2 1.47 Total 482 100 White No 220 10.3 1.39 Yes 854 89.7 1.39 Total 1074 100 Other No 267 17.6 2.12 Yes 593 82.4 2.12 Total 860 100 Pearson Chi-Square 37.1048 Pr > ChiSq <.0001
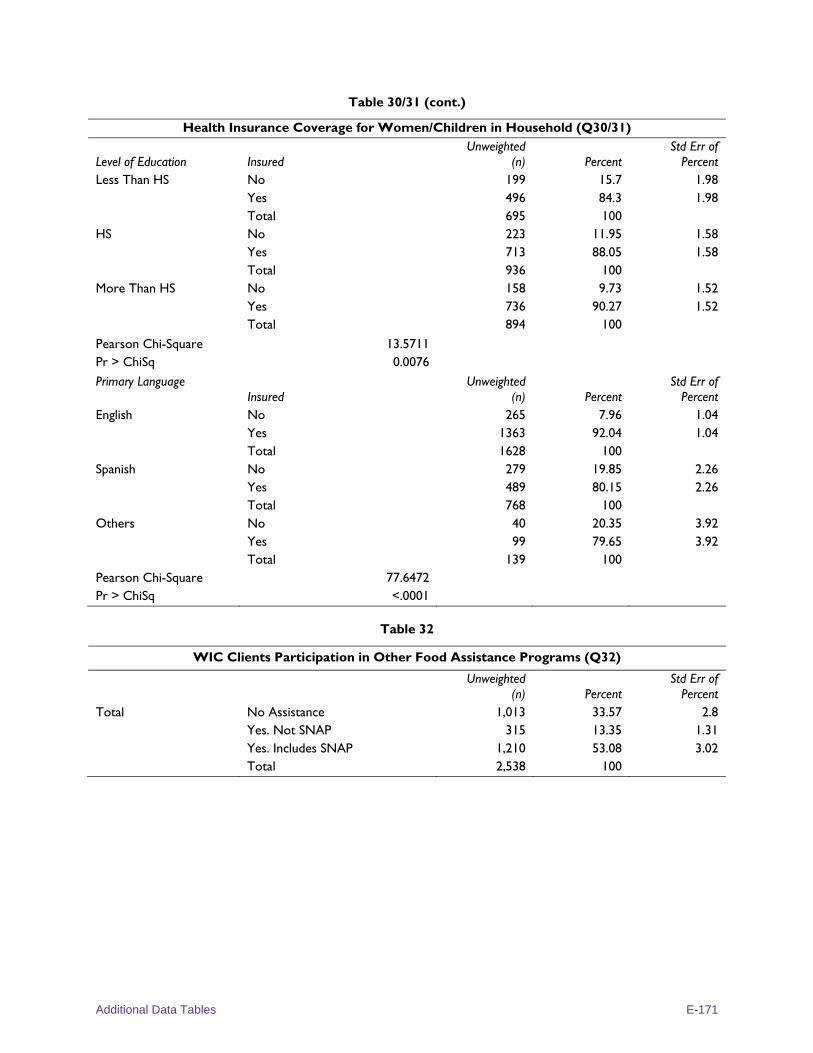
Additional Data Tables E-171
Table 30/31 (cont.)
Health Insurance Coverage for Women/Children in Household (Q30/31)
Level of Education Insured Unweighted
(n) Percent Std Err of
Percent Less Than HS No 199 15.7 1.98 Yes 496 84.3 1.98 Total 695 100 HS No 223 11.95 1.58 Yes 713 88.05 1.58 Total 936 100 More Than HS No 158 9.73 1.52 Yes 736 90.27 1.52 Total 894 100
Pearson Chi-Square 13.5711 Pr > ChiSq 0.0076
Primary Language Insured
Unweighted (n) Percent
Std Err of Percent
English No 265 7.96 1.04 Yes 1363 92.04 1.04 Total 1628 100 Spanish No 279 19.85 2.26 Yes 489 80.15 2.26 Total 768 100 Others No 40 20.35 3.92 Yes 99 79.65 3.92 Total 139 100 Pearson Chi-Square 77.6472 Pr > ChiSq <.0001
Table 32
WIC Clients Participation in Other Food Assistance Programs (Q32)
Unweighted (n) Percent
Std Err of Percent
Total No Assistance 1,013 33.57 2.8 Yes. Not SNAP 315 13.35 1.31 Yes. Includes SNAP 1,210 53.08 3.02 Total 2,538 100
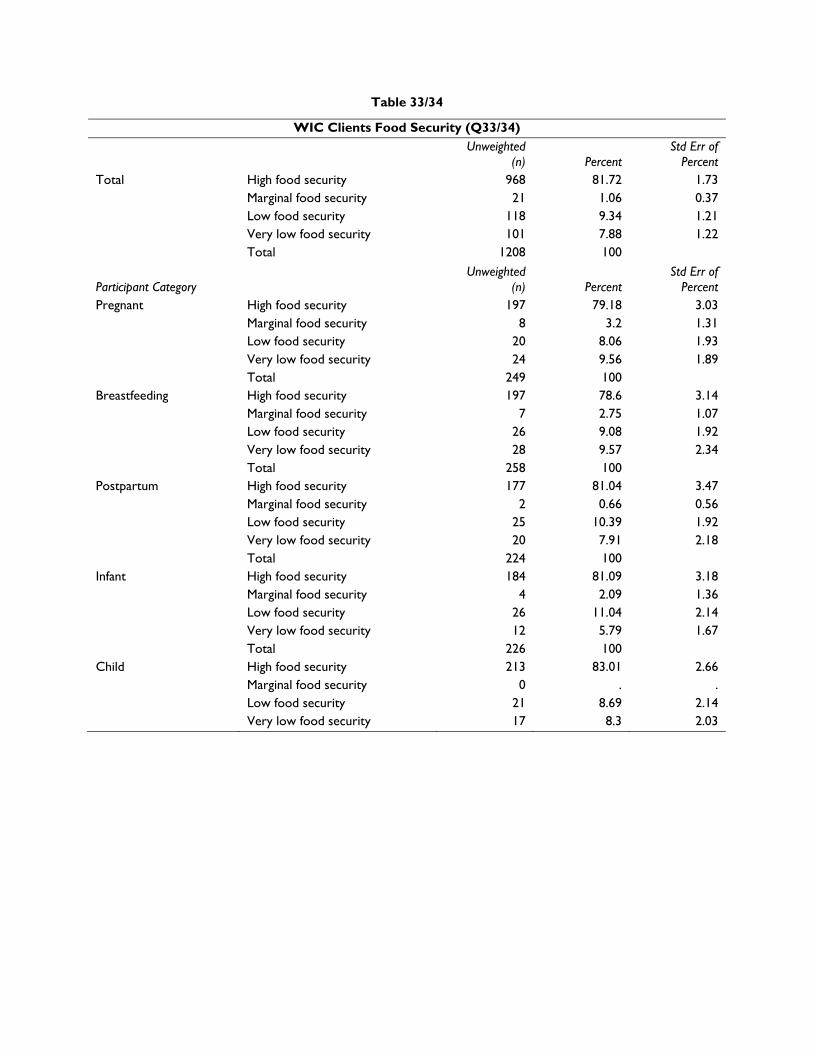
Table 33/34
WIC Clients Food Security (Q33/34) Unweighted
(n) Percent Std Err of
Percent Total High food security 968 81.72 1.73
Marginal food security 21 1.06 0.37 Low food security 118 9.34 1.21 Very low food security 101 7.88 1.22 Total 1208 100
Participant Category Unweighted
(n) Percent Std Err of
Percent Pregnant High food security 197 79.18 3.03
Marginal food security 8 3.2 1.31 Low food security 20 8.06 1.93 Very low food security 24 9.56 1.89 Total 249 100
Breastfeeding High food security 197 78.6 3.14 Marginal food security 7 2.75 1.07 Low food security 26 9.08 1.92 Very low food security 28 9.57 2.34 Total 258 100
Postpartum High food security 177 81.04 3.47 Marginal food security 2 0.66 0.56 Low food security 25 10.39 1.92 Very low food security 20 7.91 2.18 Total 224 100
Infant High food security 184 81.09 3.18 Marginal food security 4 2.09 1.36 Low food security 26 11.04 2.14 Very low food security 12 5.79 1.67 Total 226 100
Child High food security 213 83.01 2.66 Marginal food security 0 . . Low food security 21 8.69 2.14 Very low food security 17 8.3 2.03
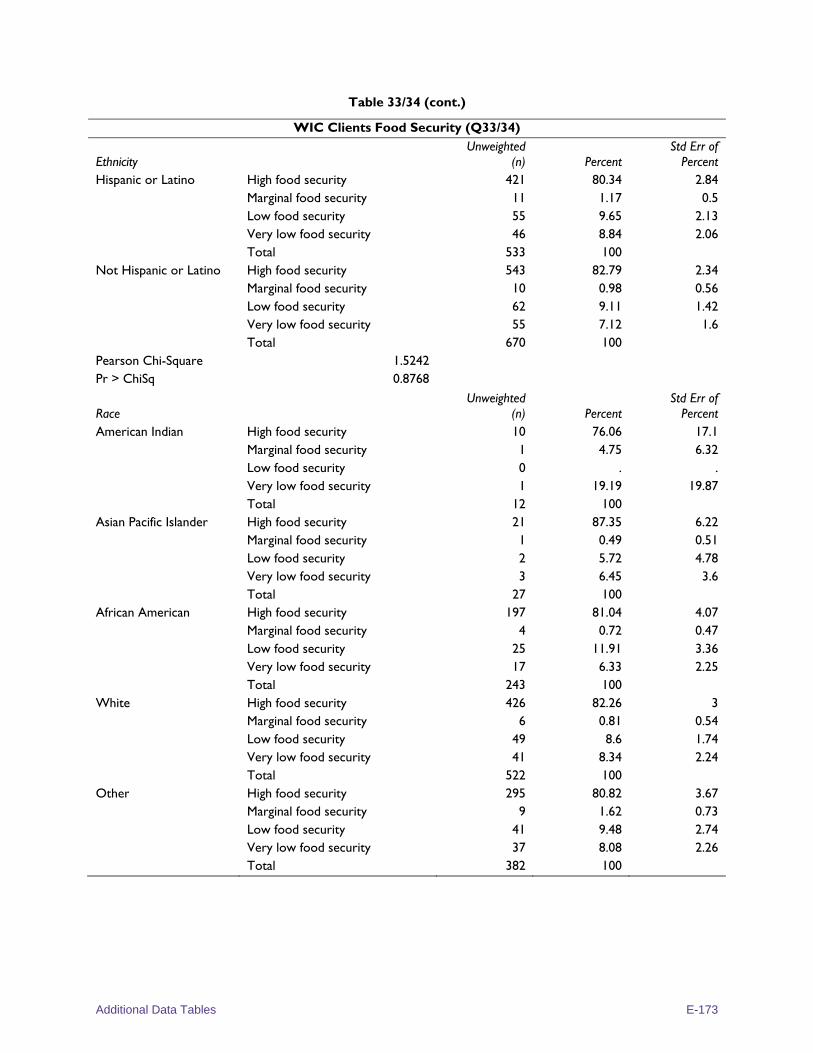
Additional Data Tables E-173
Table 33/34 (cont.)
WIC Clients Food Security (Q33/34)
Ethnicity Unweighted
(n) Percent Std Err of
Percent Hispanic or Latino High food security 421 80.34 2.84
Marginal food security 11 1.17 0.5 Low food security 55 9.65 2.13 Very low food security 46 8.84 2.06 Total 533 100
Not Hispanic or Latino High food security 543 82.79 2.34 Marginal food security 10 0.98 0.56 Low food security 62 9.11 1.42 Very low food security 55 7.12 1.6 Total 670 100
Pearson Chi-Square 1.5242 Pr > ChiSq 0.8768
Race Unweighted
(n) Percent Std Err of
Percent American Indian High food security 10 76.06 17.1
Marginal food security 1 4.75 6.32 Low food security 0 . . Very low food security 1 19.19 19.87 Total 12 100
Asian Pacific Islander High food security 21 87.35 6.22 Marginal food security 1 0.49 0.51 Low food security 2 5.72 4.78 Very low food security 3 6.45 3.6 Total 27 100
African American High food security 197 81.04 4.07 Marginal food security 4 0.72 0.47 Low food security 25 11.91 3.36 Very low food security 17 6.33 2.25 Total 243 100
White High food security 426 82.26 3 Marginal food security 6 0.81 0.54 Low food security 49 8.6 1.74 Very low food security 41 8.34 2.24 Total 522 100
Other High food security 295 80.82 3.67 Marginal food security 9 1.62 0.73 Low food security 41 9.48 2.74 Very low food security 37 8.08 2.26 Total 382 100
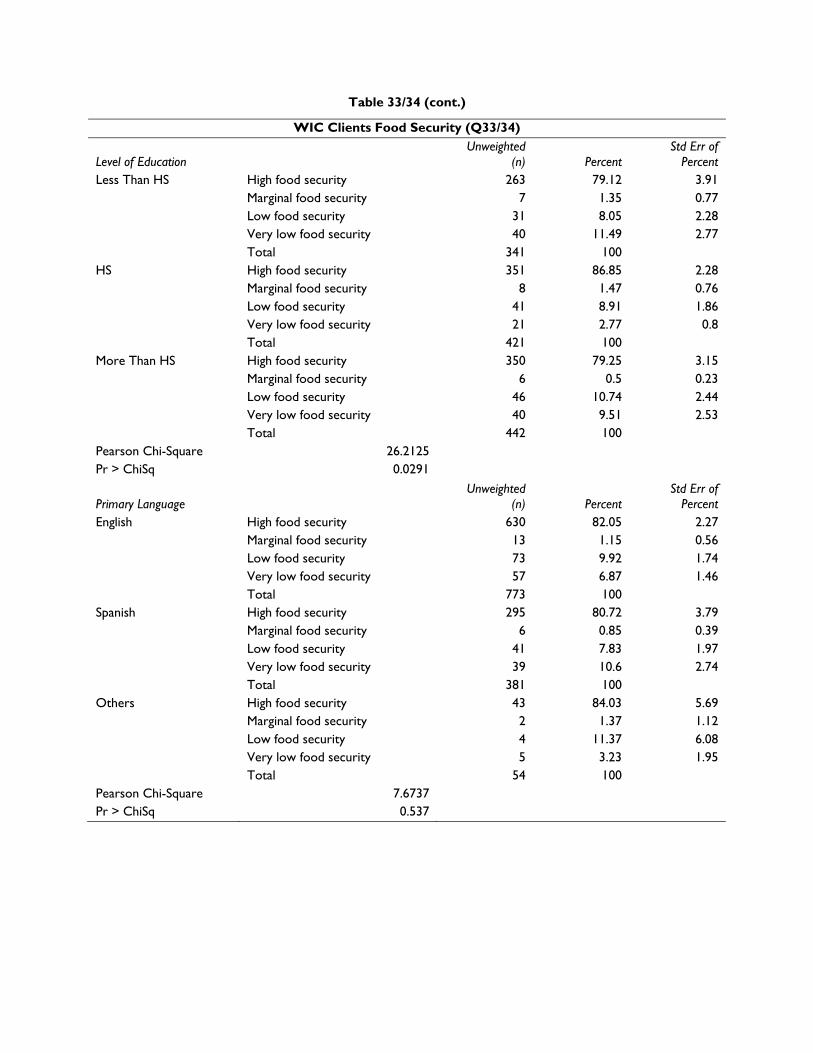
Table 33/34 (cont.)
WIC Clients Food Security (Q33/34)
Level of Education Unweighted
(n) Percent Std Err of
Percent Less Than HS High food security 263 79.12 3.91
Marginal food security 7 1.35 0.77 Low food security 31 8.05 2.28 Very low food security 40 11.49 2.77 Total 341 100
HS High food security 351 86.85 2.28 Marginal food security 8 1.47 0.76 Low food security 41 8.91 1.86 Very low food security 21 2.77 0.8 Total 421 100
More Than HS High food security 350 79.25 3.15 Marginal food security 6 0.5 0.23 Low food security 46 10.74 2.44 Very low food security 40 9.51 2.53 Total 442 100
Pearson Chi-Square 26.2125 Pr > ChiSq 0.0291
Primary Language Unweighted
(n) Percent Std Err of
Percent English High food security 630 82.05 2.27
Marginal food security 13 1.15 0.56 Low food security 73 9.92 1.74 Very low food security 57 6.87 1.46 Total 773 100
Spanish High food security 295 80.72 3.79 Marginal food security 6 0.85 0.39 Low food security 41 7.83 1.97 Very low food security 39 10.6 2.74 Total 381 100
Others High food security 43 84.03 5.69 Marginal food security 2 1.37 1.12 Low food security 4 11.37 6.08 Very low food security 5 3.23 1.95 Total 54 100
Pearson Chi-Square 7.6737 Pr > ChiSq 0.537
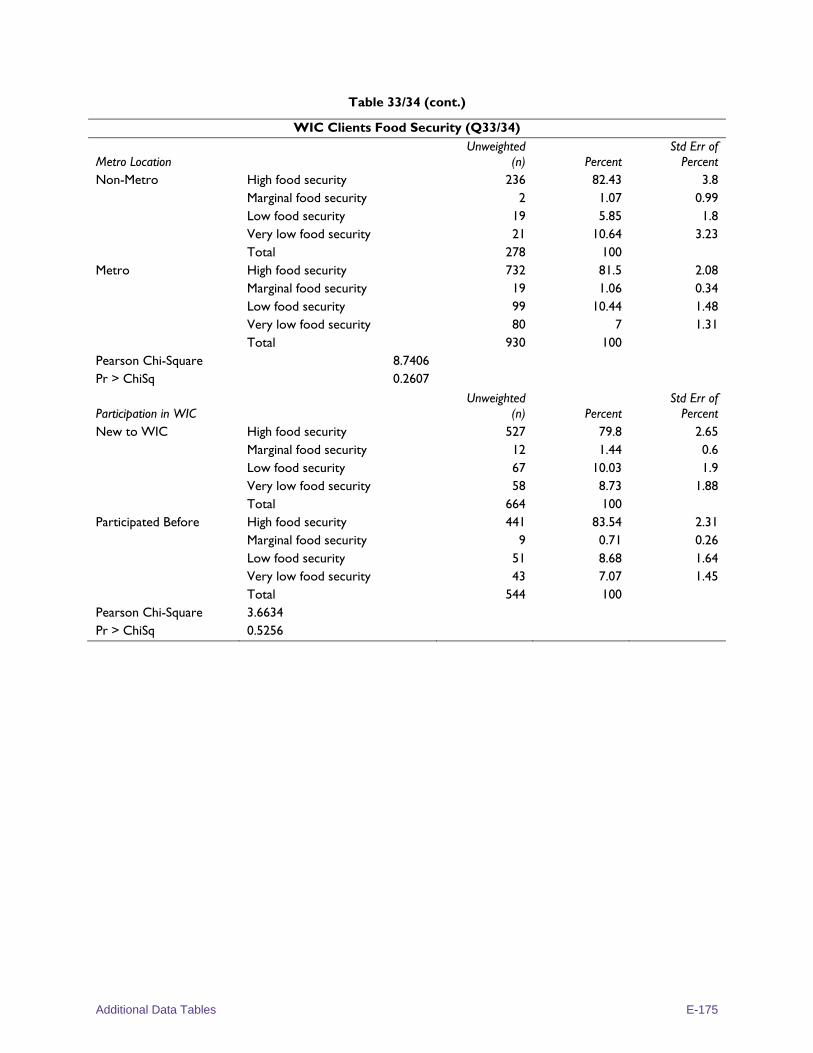
Additional Data Tables E-175
Table 33/34 (cont.)
WIC Clients Food Security (Q33/34)
Metro Location Unweighted
(n) Percent Std Err of
Percent Non-Metro High food security 236 82.43 3.8
Marginal food security 2 1.07 0.99 Low food security 19 5.85 1.8 Very low food security 21 10.64 3.23 Total 278 100
Metro High food security 732 81.5 2.08 Marginal food security 19 1.06 0.34 Low food security 99 10.44 1.48 Very low food security 80 7 1.31 Total 930 100
Pearson Chi-Square 8.7406 Pr > ChiSq 0.2607
Participation in WIC Unweighted
(n) Percent Std Err of
Percent New to WIC High food security 527 79.8 2.65
Marginal food security 12 1.44 0.6 Low food security 67 10.03 1.9 Very low food security 58 8.73 1.88 Total 664 100
Participated Before High food security 441 83.54 2.31 Marginal food security 9 0.71 0.26 Low food security 51 8.68 1.64 Very low food security 43 7.07 1.45 Total 544 100
Pearson Chi-Square 3.6634 Pr > ChiSq 0.5256
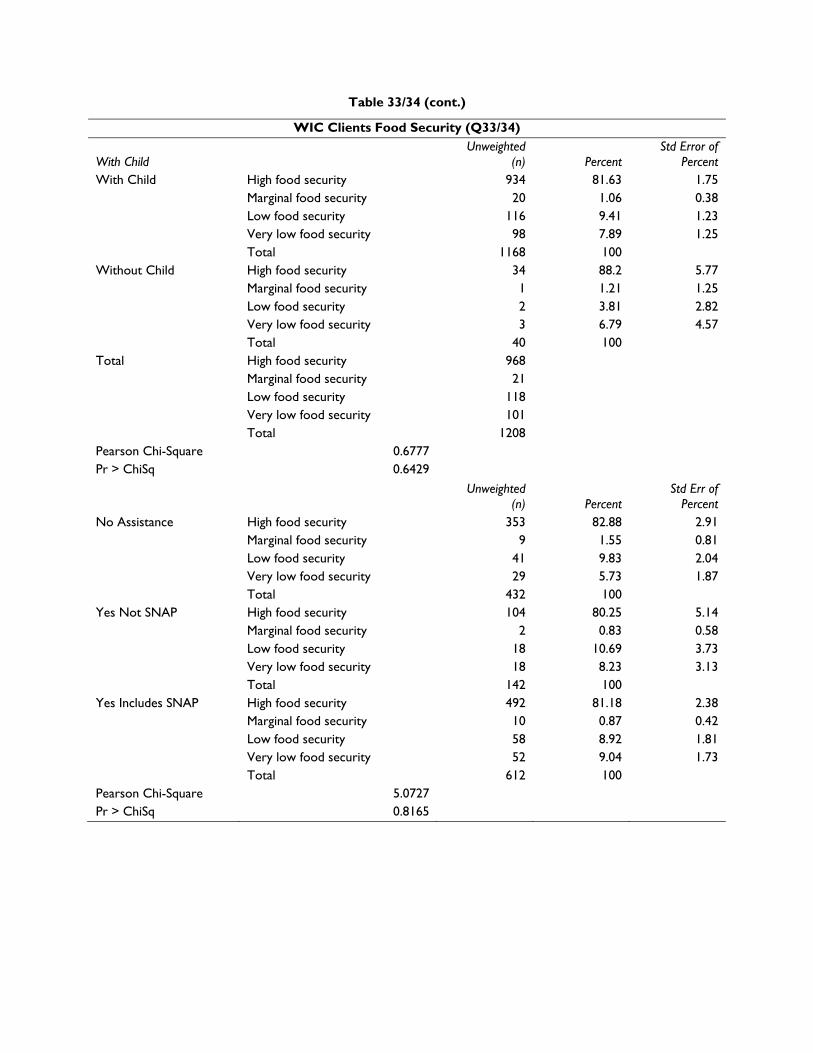
Table 33/34 (cont.)
WIC Clients Food Security (Q33/34)
With Child Unweighted
(n) Percent Std Error of
Percent With Child High food security 934 81.63 1.75
Marginal food security 20 1.06 0.38 Low food security 116 9.41 1.23 Very low food security 98 7.89 1.25 Total 1168 100
Without Child High food security 34 88.2 5.77 Marginal food security 1 1.21 1.25 Low food security 2 3.81 2.82 Very low food security 3 6.79 4.57 Total 40 100
Total High food security 968 Marginal food security 21 Low food security 118 Very low food security 101 Total 1208
Pearson Chi-Square 0.6777 Pr > ChiSq 0.6429
Unweighted (n) Percent
Std Err of Percent
No Assistance High food security 353 82.88 2.91 Marginal food security 9 1.55 0.81 Low food security 41 9.83 2.04 Very low food security 29 5.73 1.87 Total 432 100
Yes Not SNAP High food security 104 80.25 5.14 Marginal food security 2 0.83 0.58 Low food security 18 10.69 3.73 Very low food security 18 8.23 3.13 Total 142 100
Yes Includes SNAP High food security 492 81.18 2.38 Marginal food security 10 0.87 0.42 Low food security 58 8.92 1.81 Very low food security 52 9.04 1.73 Total 612 100
Pearson Chi-Square 5.0727 Pr > ChiSq 0.8165
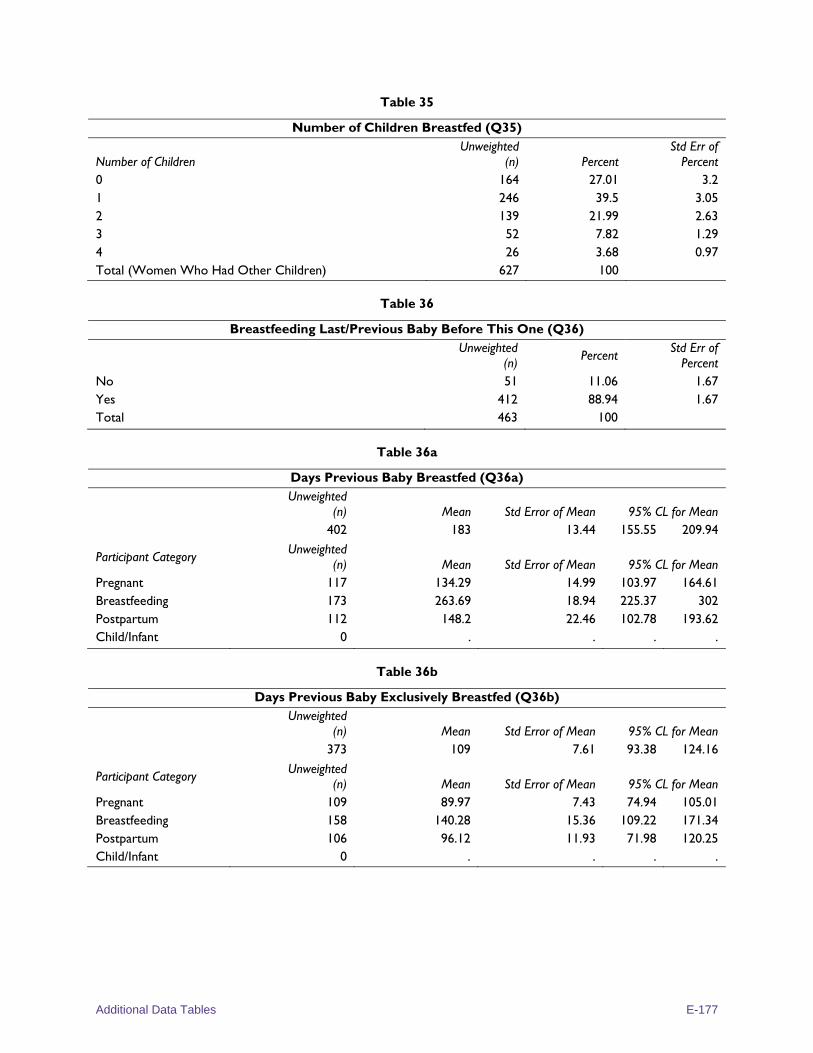
Additional Data Tables E-177
Table 35
Number of Children Breastfed (Q35)
Number of Children Unweighted
(n) Percent Std Err of
Percent 0 164 27.01 3.2 1 246 39.5 3.05 2 139 21.99 2.63 3 52 7.82 1.29 4 26 3.68 0.97 Total (Women Who Had Other Children) 627 100
Table 36
Breastfeeding Last/Previous Baby Before This One (Q36)
Unweighted
(n) Percent Std Err of
Percent No 51 11.06 1.67 Yes 412 88.94 1.67 Total 463 100
Table 36a
Days Previous Baby Breastfed (Q36a)
Unweighted
(n) Mean Std Error of Mean 95% CL for Mean
402 183 13.44 155.55 209.94
Participant Category Unweighted
(n) Mean Std Error of Mean 95% CL for Mean Pregnant 117 134.29 14.99 103.97 164.61 Breastfeeding 173 263.69 18.94 225.37 302 Postpartum 112 148.2 22.46 102.78 193.62 Child/Infant 0 . . . .
Table 36b
Days Previous Baby Exclusively Breastfed (Q36b)
Unweighted
(n) Mean Std Error of Mean 95% CL for Mean 373 109 7.61 93.38 124.16
Participant Category Unweighted (n) Mean Std Error of Mean 95% CL for Mean
Pregnant 109 89.97 7.43 74.94 105.01 Breastfeeding 158 140.28 15.36 109.22 171.34 Postpartum 106 96.12 11.93 71.98 120.25 Child/Infant 0 . . . .
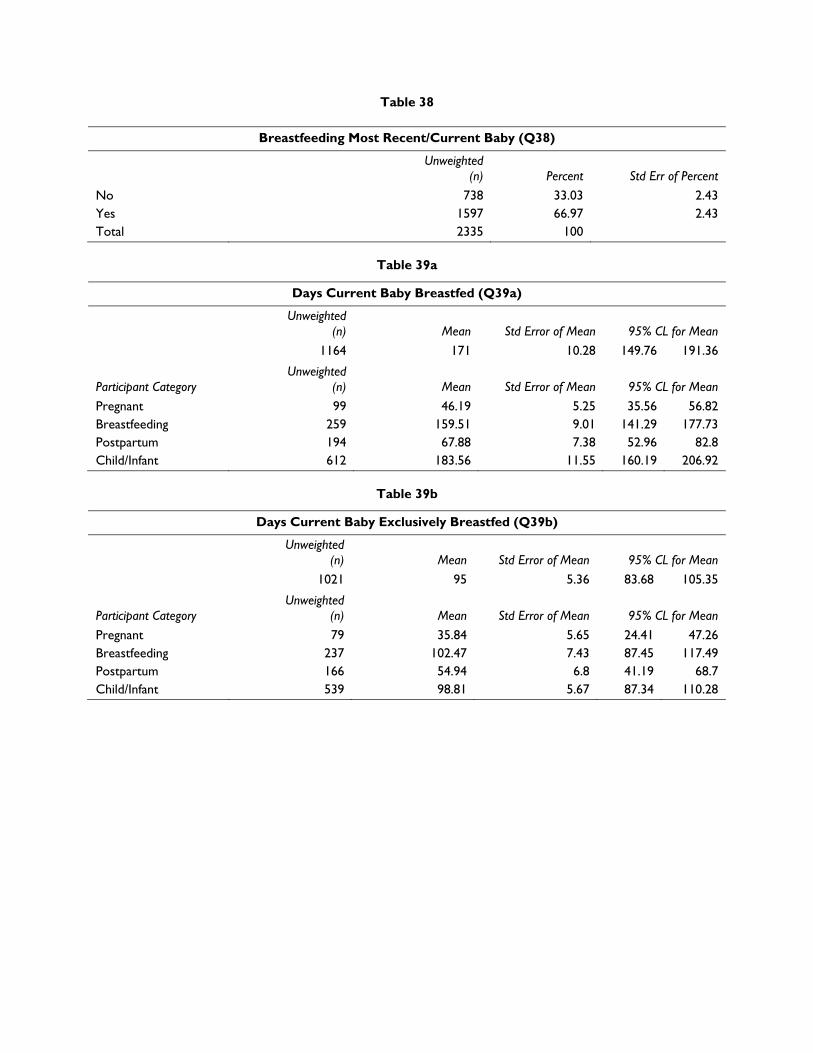
Table 38
Breastfeeding Most Recent/Current Baby (Q38)
Unweighted (n) Percent Std Err of Percent
No 738 33.03 2.43 Yes 1597 66.97 2.43 Total 2335 100
Table 39a
Days Current Baby Breastfed (Q39a)
Unweighted (n) Mean Std Error of Mean 95% CL for Mean
1164 171 10.28 149.76 191.36
Participant Category Unweighted
(n) Mean Std Error of Mean 95% CL for Mean
Pregnant 99 46.19 5.25 35.56 56.82 Breastfeeding 259 159.51 9.01 141.29 177.73 Postpartum 194 67.88 7.38 52.96 82.8 Child/Infant 612 183.56 11.55 160.19 206.92
Table 39b
Days Current Baby Exclusively Breastfed (Q39b)
Unweighted (n) Mean Std Error of Mean 95% CL for Mean
1021 95 5.36 83.68 105.35
Participant Category Unweighted
(n) Mean Std Error of Mean 95% CL for Mean
Pregnant 79 35.84 5.65 24.41 47.26 Breastfeeding 237 102.47 7.43 87.45 117.49 Postpartum 166 54.94 6.8 41.19 68.7 Child/Infant 539 98.81 5.67 87.34 110.28
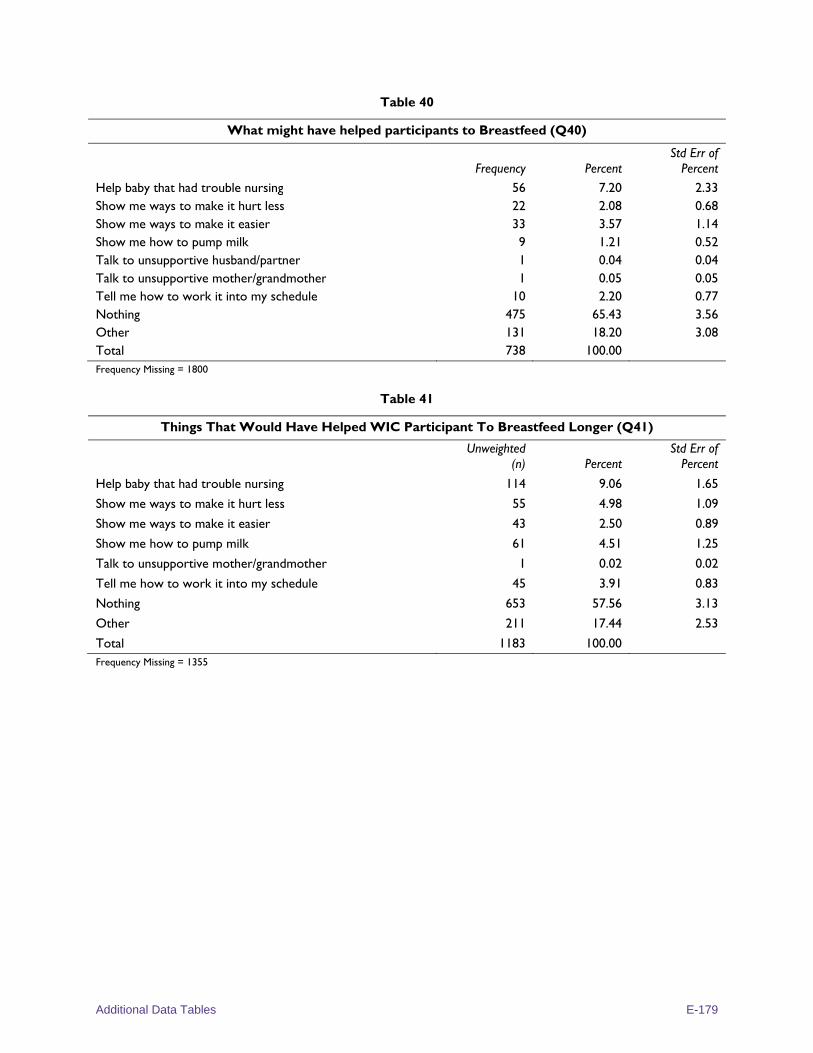
Additional Data Tables E-179
Table 40
What might have helped participants to Breastfeed (Q40)
Frequency Percent Std Err of
Percent
Help baby that had trouble nursing 56 7.20 2.33 Show me ways to make it hurt less 22 2.08 0.68 Show me ways to make it easier 33 3.57 1.14 Show me how to pump milk 9 1.21 0.52 Talk to unsupportive husband/partner 1 0.04 0.04 Talk to unsupportive mother/grandmother 1 0.05 0.05 Tell me how to work it into my schedule 10 2.20 0.77 Nothing 475 65.43 3.56 Other 131 18.20 3.08 Total 738 100.00 Frequency Missing = 1800
Table 41
Things That Would Have Helped WIC Participant To Breastfeed Longer (Q41)
Unweighted (n) Percent
Std Err of Percent
Help baby that had trouble nursing 114 9.06 1.65
Show me ways to make it hurt less 55 4.98 1.09
Show me ways to make it easier 43 2.50 0.89
Show me how to pump milk 61 4.51 1.25
Talk to unsupportive mother/grandmother 1 0.02 0.02
Tell me how to work it into my schedule 45 3.91 0.83
Nothing 653 57.56 3.13
Other 211 17.44 2.53
Total 1183 100.00 Frequency Missing = 1355
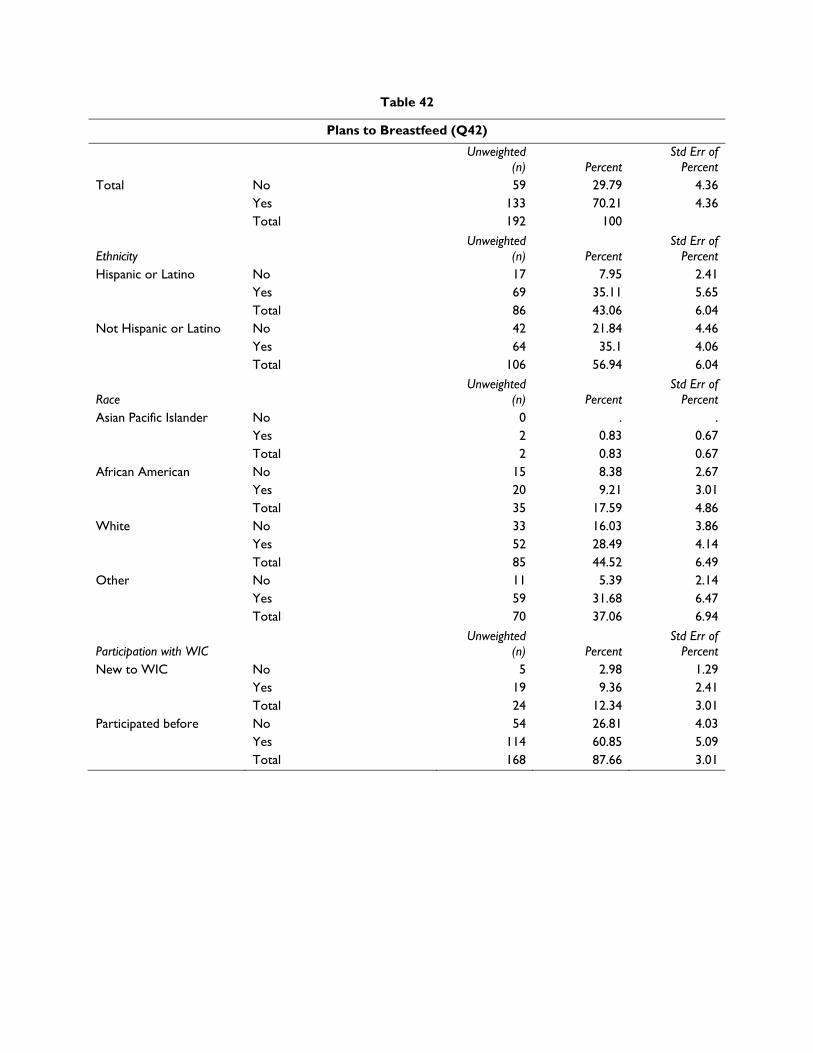
Table 42
Plans to Breastfeed (Q42)
Unweighted (n) Percent
Std Err of Percent
Total No 59 29.79 4.36 Yes 133 70.21 4.36 Total 192 100
Ethnicity Unweighted
(n) Percent Std Err of
Percent Hispanic or Latino No 17 7.95 2.41
Yes 69 35.11 5.65 Total 86 43.06 6.04
Not Hispanic or Latino No 42 21.84 4.46 Yes 64 35.1 4.06 Total 106 56.94 6.04
Race Unweighted
(n) Percent Std Err of
Percent Asian Pacific Islander No 0 . .
Yes 2 0.83 0.67 Total 2 0.83 0.67
African American No 15 8.38 2.67 Yes 20 9.21 3.01 Total 35 17.59 4.86
White No 33 16.03 3.86 Yes 52 28.49 4.14 Total 85 44.52 6.49
Other No 11 5.39 2.14 Yes 59 31.68 6.47 Total 70 37.06 6.94
Participation with WIC Unweighted
(n) Percent Std Err of
Percent New to WIC No 5 2.98 1.29
Yes 19 9.36 2.41 Total 24 12.34 3.01
Participated before No 54 26.81 4.03 Yes 114 60.85 5.09 Total 168 87.66 3.01
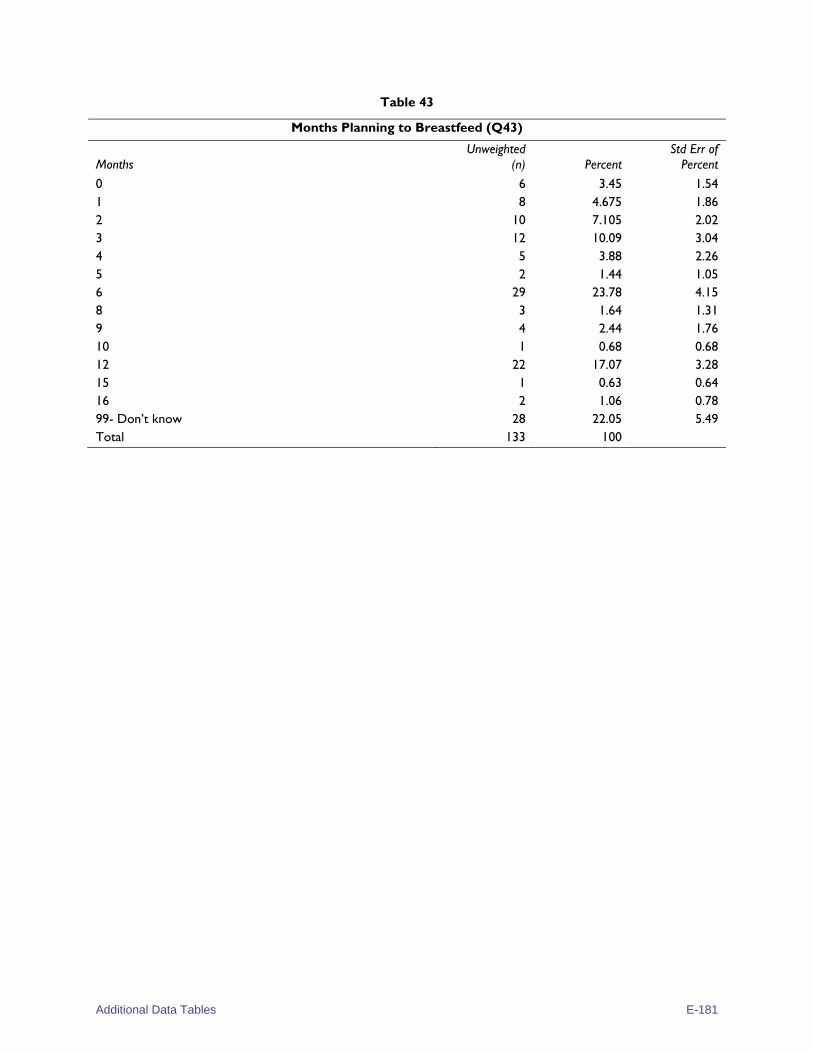
Additional Data Tables E-181
Table 43
Months Planning to Breastfeed (Q43)
Months Unweighted
(n) Percent Std Err of
Percent
0 6 3.45 1.54 1 8 4.675 1.86 2 10 7.105 2.02 3 12 10.09 3.04 4 5 3.88 2.26 5 2 1.44 1.05 6 29 23.78 4.15 8 3 1.64 1.31 9 4 2.44 1.76 10 1 0.68 0.68 12 22 17.07 3.28 15 1 0.63 0.64 16 2 1.06 0.78 99- Don’t know 28 22.05 5.49 Total 133 100
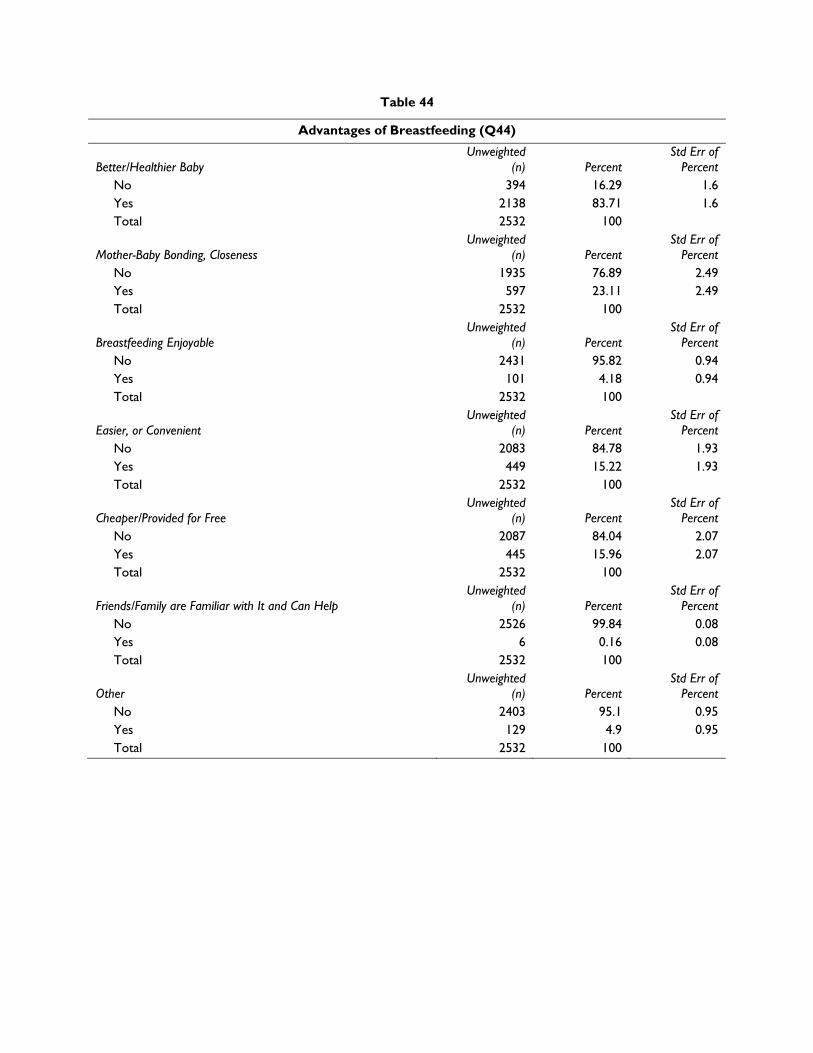
Table 44
Advantages of Breastfeeding (Q44)
Better/Healthier Baby Unweighted
(n) Percent Std Err of
Percent No 394 16.29 1.6 Yes 2138 83.71 1.6 Total 2532 100
Mother-Baby Bonding, Closeness Unweighted
(n) Percent Std Err of
Percent No 1935 76.89 2.49 Yes 597 23.11 2.49 Total 2532 100
Breastfeeding Enjoyable Unweighted
(n) Percent Std Err of
Percent No 2431 95.82 0.94 Yes 101 4.18 0.94 Total 2532 100
Easier, or Convenient Unweighted
(n) Percent Std Err of
Percent No 2083 84.78 1.93 Yes 449 15.22 1.93 Total 2532 100
Cheaper/Provided for Free Unweighted
(n) Percent Std Err of
Percent No 2087 84.04 2.07 Yes 445 15.96 2.07 Total 2532 100
Friends/Family are Familiar with It and Can Help Unweighted
(n) Percent Std Err of
Percent No 2526 99.84 0.08 Yes 6 0.16 0.08 Total 2532 100
Other Unweighted
(n) Percent Std Err of
Percent No 2403 95.1 0.95 Yes 129 4.9 0.95 Total 2532 100
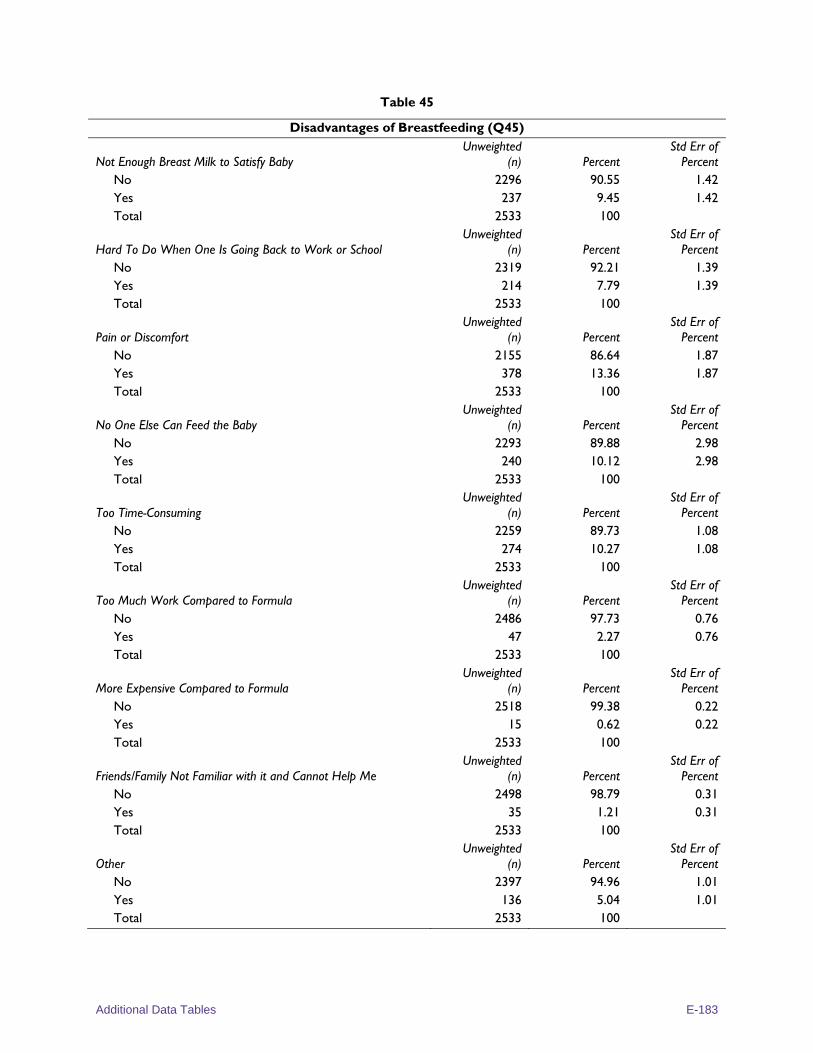
Additional Data Tables E-183
Table 45
Disadvantages of Breastfeeding (Q45)
Not Enough Breast Milk to Satisfy Baby Unweighted
(n) Percent Std Err of
Percent No 2296 90.55 1.42 Yes 237 9.45 1.42 Total 2533 100
Hard To Do When One Is Going Back to Work or School Unweighted
(n) Percent Std Err of
Percent No 2319 92.21 1.39 Yes 214 7.79 1.39 Total 2533 100
Pain or Discomfort Unweighted
(n) Percent Std Err of
Percent No 2155 86.64 1.87 Yes 378 13.36 1.87 Total 2533 100
No One Else Can Feed the Baby Unweighted
(n) Percent Std Err of
Percent No 2293 89.88 2.98 Yes 240 10.12 2.98 Total 2533 100
Too Time-Consuming Unweighted
(n) Percent Std Err of
Percent No 2259 89.73 1.08 Yes 274 10.27 1.08 Total 2533 100
Too Much Work Compared to Formula Unweighted
(n) Percent Std Err of
Percent No 2486 97.73 0.76 Yes 47 2.27 0.76 Total 2533 100
More Expensive Compared to Formula Unweighted
(n) Percent Std Err of
Percent No 2518 99.38 0.22 Yes 15 0.62 0.22 Total 2533 100
Friends/Family Not Familiar with it and Cannot Help Me Unweighted
(n) Percent Std Err of
Percent No 2498 98.79 0.31 Yes 35 1.21 0.31 Total 2533 100
Other Unweighted
(n) Percent Std Err of
Percent No 2397 94.96 1.01 Yes 136 5.04 1.01 Total 2533 100
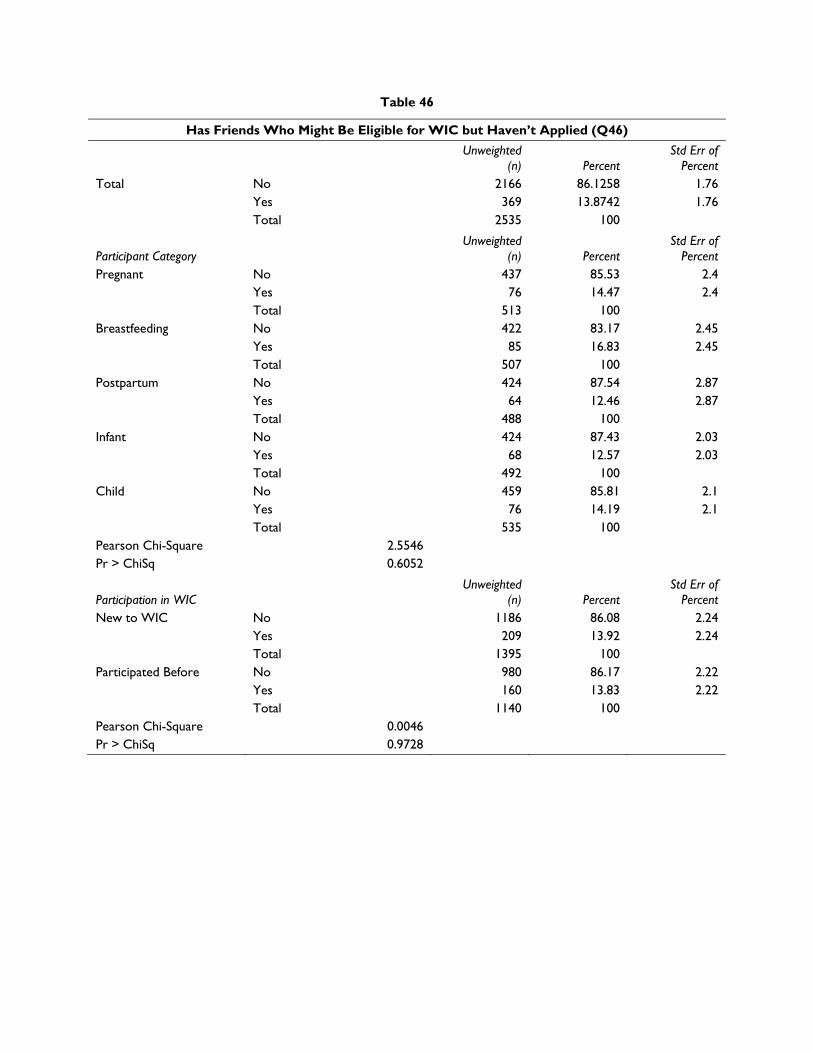
Table 46
Has Friends Who Might Be Eligible for WIC but Haven’t Applied (Q46)
Unweighted (n) Percent
Std Err of Percent
Total No 2166 86.1258 1.76 Yes 369 13.8742 1.76 Total 2535 100
Participant Category Unweighted
(n) Percent Std Err of
Percent Pregnant No 437 85.53 2.4
Yes 76 14.47 2.4 Total 513 100
Breastfeeding No 422 83.17 2.45 Yes 85 16.83 2.45 Total 507 100
Postpartum No 424 87.54 2.87 Yes 64 12.46 2.87 Total 488 100
Infant No 424 87.43 2.03 Yes 68 12.57 2.03 Total 492 100
Child No 459 85.81 2.1 Yes 76 14.19 2.1 Total 535 100
Pearson Chi-Square 2.5546 Pr > ChiSq 0.6052
Participation in WIC Unweighted
(n) Percent Std Err of
Percent New to WIC No 1186 86.08 2.24
Yes 209 13.92 2.24 Total 1395 100
Participated Before No 980 86.17 2.22 Yes 160 13.83 2.22 Total 1140 100
Pearson Chi-Square 0.0046 Pr > ChiSq 0.9728
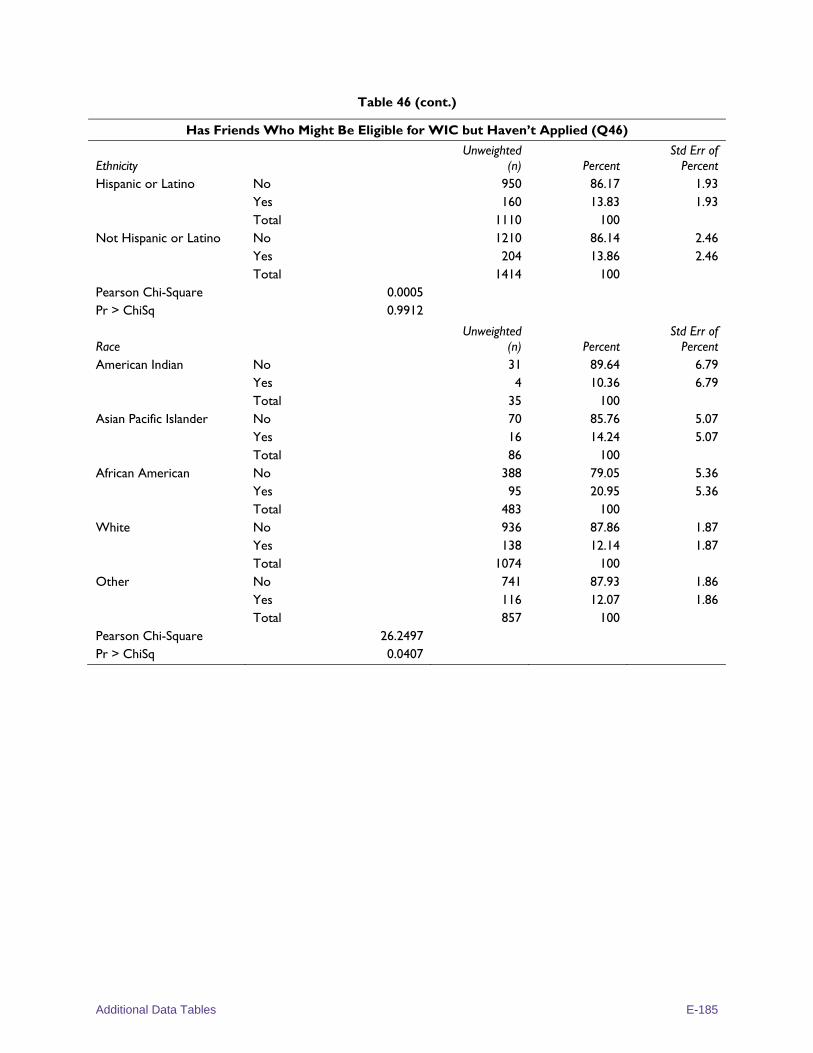
Additional Data Tables E-185
Table 46 (cont.)
Has Friends Who Might Be Eligible for WIC but Haven’t Applied (Q46)
Ethnicity Unweighted
(n) Percent Std Err of
Percent Hispanic or Latino No 950 86.17 1.93
Yes 160 13.83 1.93 Total 1110 100
Not Hispanic or Latino No 1210 86.14 2.46 Yes 204 13.86 2.46 Total 1414 100
Pearson Chi-Square 0.0005 Pr > ChiSq 0.9912
Race Unweighted
(n) Percent Std Err of
Percent American Indian No 31 89.64 6.79
Yes 4 10.36 6.79 Total 35 100
Asian Pacific Islander No 70 85.76 5.07 Yes 16 14.24 5.07 Total 86 100
African American No 388 79.05 5.36 Yes 95 20.95 5.36 Total 483 100
White No 936 87.86 1.87 Yes 138 12.14 1.87 Total 1074 100
Other No 741 87.93 1.86 Yes 116 12.07 1.86 Total 857 100
Pearson Chi-Square 26.2497 Pr > ChiSq 0.0407
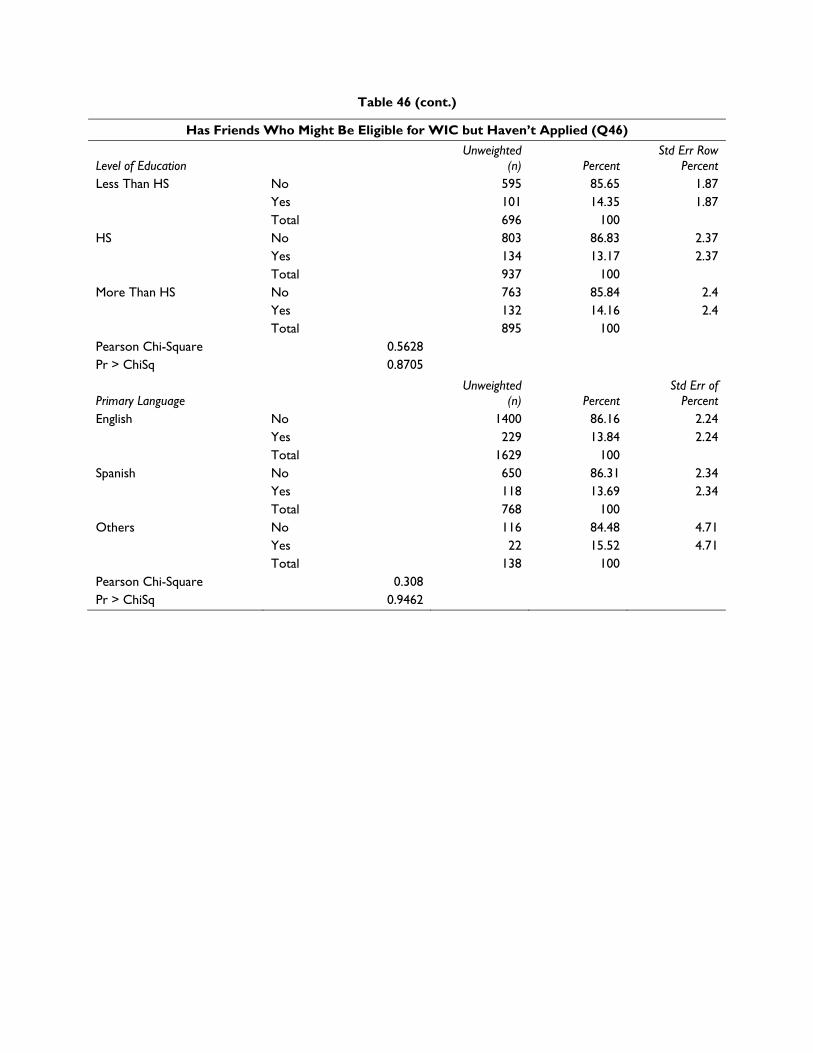
Table 46 (cont.)
Has Friends Who Might Be Eligible for WIC but Haven’t Applied (Q46)
Level of Education Unweighted
(n) Percent Std Err Row
Percent Less Than HS No 595 85.65 1.87
Yes 101 14.35 1.87 Total 696 100
HS No 803 86.83 2.37 Yes 134 13.17 2.37 Total 937 100
More Than HS No 763 85.84 2.4 Yes 132 14.16 2.4 Total 895 100
Pearson Chi-Square 0.5628 Pr > ChiSq 0.8705
Primary Language Unweighted
(n) Percent Std Err of
Percent English No 1400 86.16 2.24
Yes 229 13.84 2.24 Total 1629 100
Spanish No 650 86.31 2.34 Yes 118 13.69 2.34 Total 768 100
Others No 116 84.48 4.71 Yes 22 15.52 4.71 Total 138 100
Pearson Chi-Square 0.308 Pr > ChiSq 0.9462
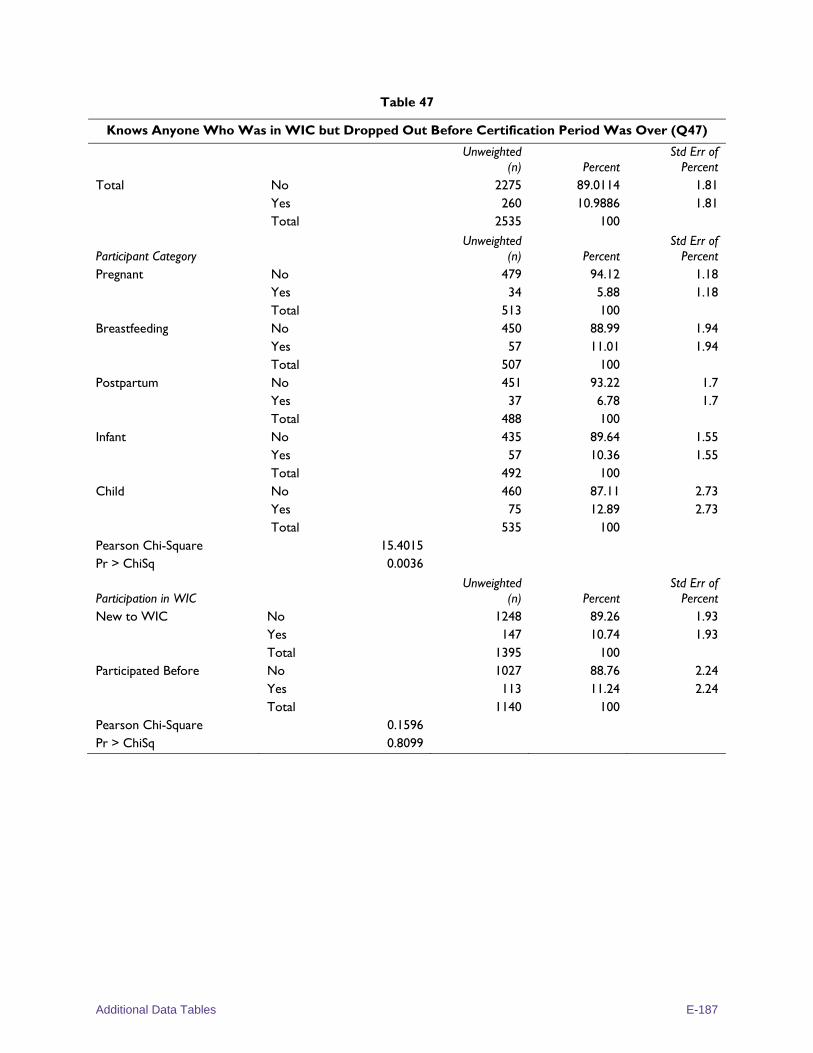
Additional Data Tables E-187
Table 47
Knows Anyone Who Was in WIC but Dropped Out Before Certification Period Was Over (Q47)
Unweighted (n) Percent
Std Err of Percent
Total No 2275 89.0114 1.81 Yes 260 10.9886 1.81 Total 2535 100
Participant Category Unweighted
(n) Percent Std Err of
Percent Pregnant No 479 94.12 1.18
Yes 34 5.88 1.18 Total 513 100
Breastfeeding No 450 88.99 1.94 Yes 57 11.01 1.94 Total 507 100
Postpartum No 451 93.22 1.7 Yes 37 6.78 1.7 Total 488 100
Infant No 435 89.64 1.55 Yes 57 10.36 1.55 Total 492 100
Child No 460 87.11 2.73 Yes 75 12.89 2.73 Total 535 100
Pearson Chi-Square 15.4015 Pr > ChiSq 0.0036
Participation in WIC Unweighted
(n) Percent Std Err of
Percent New to WIC No 1248 89.26 1.93
Yes 147 10.74 1.93 Total 1395 100
Participated Before No 1027 88.76 2.24 Yes 113 11.24 2.24 Total 1140 100
Pearson Chi-Square 0.1596 Pr > ChiSq 0.8099
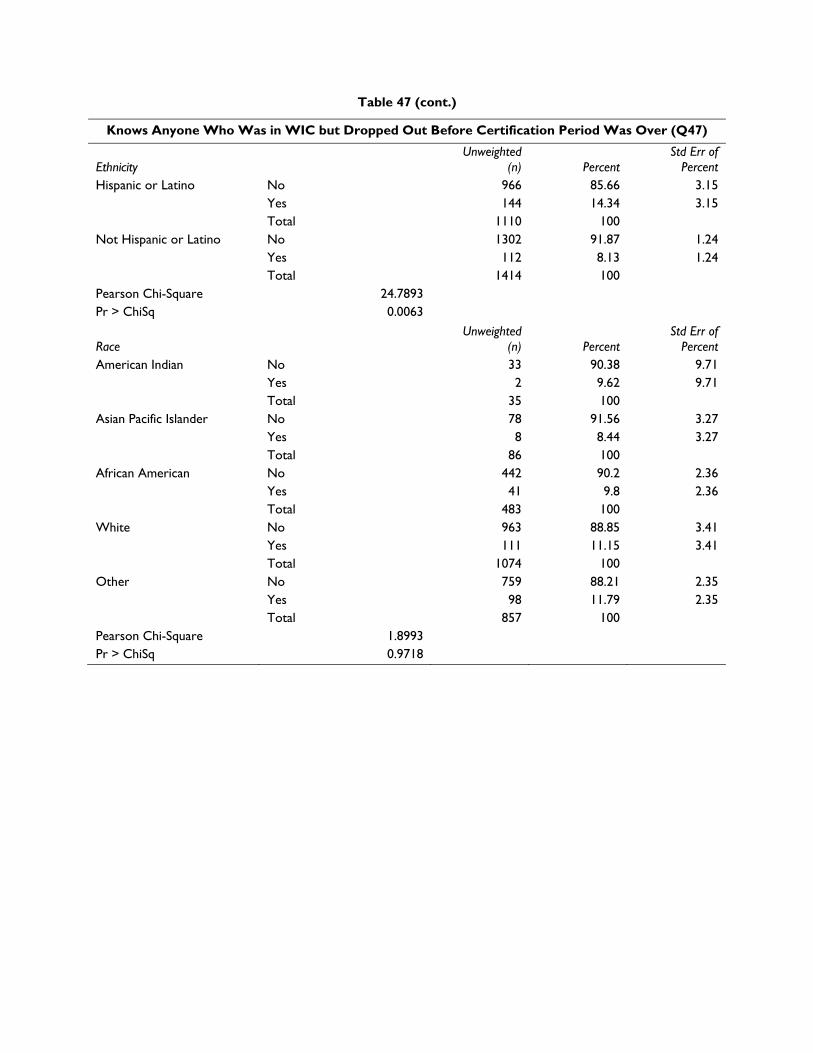
Table 47 (cont.)
Knows Anyone Who Was in WIC but Dropped Out Before Certification Period Was Over (Q47)
Ethnicity Unweighted
(n) Percent Std Err of
Percent Hispanic or Latino No 966 85.66 3.15
Yes 144 14.34 3.15 Total 1110 100
Not Hispanic or Latino No 1302 91.87 1.24 Yes 112 8.13 1.24 Total 1414 100
Pearson Chi-Square 24.7893 Pr > ChiSq 0.0063
Race Unweighted
(n) Percent Std Err of
Percent American Indian No 33 90.38 9.71
Yes 2 9.62 9.71 Total 35 100
Asian Pacific Islander No 78 91.56 3.27 Yes 8 8.44 3.27 Total 86 100
African American No 442 90.2 2.36 Yes 41 9.8 2.36 Total 483 100
White No 963 88.85 3.41 Yes 111 11.15 3.41 Total 1074 100
Other No 759 88.21 2.35 Yes 98 11.79 2.35 Total 857 100
Pearson Chi-Square 1.8993 Pr > ChiSq 0.9718
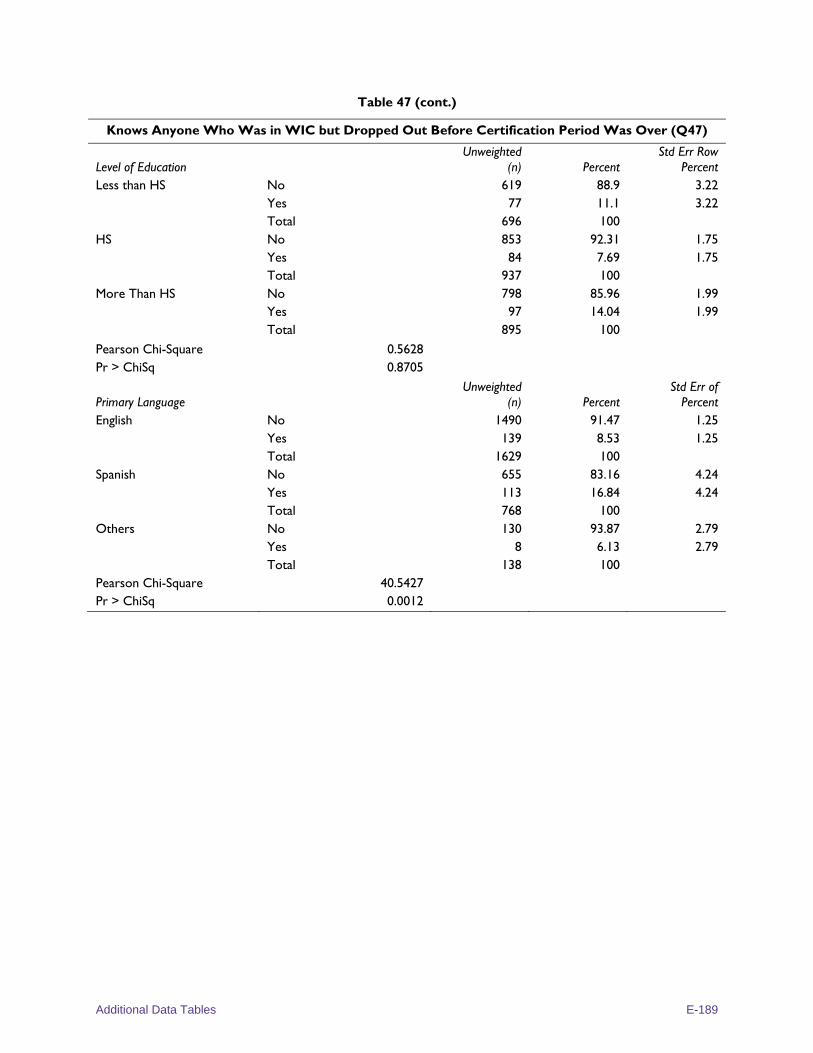
Additional Data Tables E-189
Table 47 (cont.)
Knows Anyone Who Was in WIC but Dropped Out Before Certification Period Was Over (Q47)
Level of Education Unweighted
(n) Percent Std Err Row
Percent Less than HS No 619 88.9 3.22
Yes 77 11.1 3.22 Total 696 100
HS No 853 92.31 1.75 Yes 84 7.69 1.75 Total 937 100
More Than HS No 798 85.96 1.99 Yes 97 14.04 1.99 Total 895 100
Pearson Chi-Square 0.5628 Pr > ChiSq 0.8705
Primary Language Unweighted
(n) Percent Std Err of
Percent English No 1490 91.47 1.25
Yes 139 8.53 1.25 Total 1629 100
Spanish No 655 83.16 4.24 Yes 113 16.84 4.24 Total 768 100
Others No 130 93.87 2.79 Yes 8 6.13 2.79 Total 138 100
Pearson Chi-Square 40.5427 Pr > ChiSq 0.0012
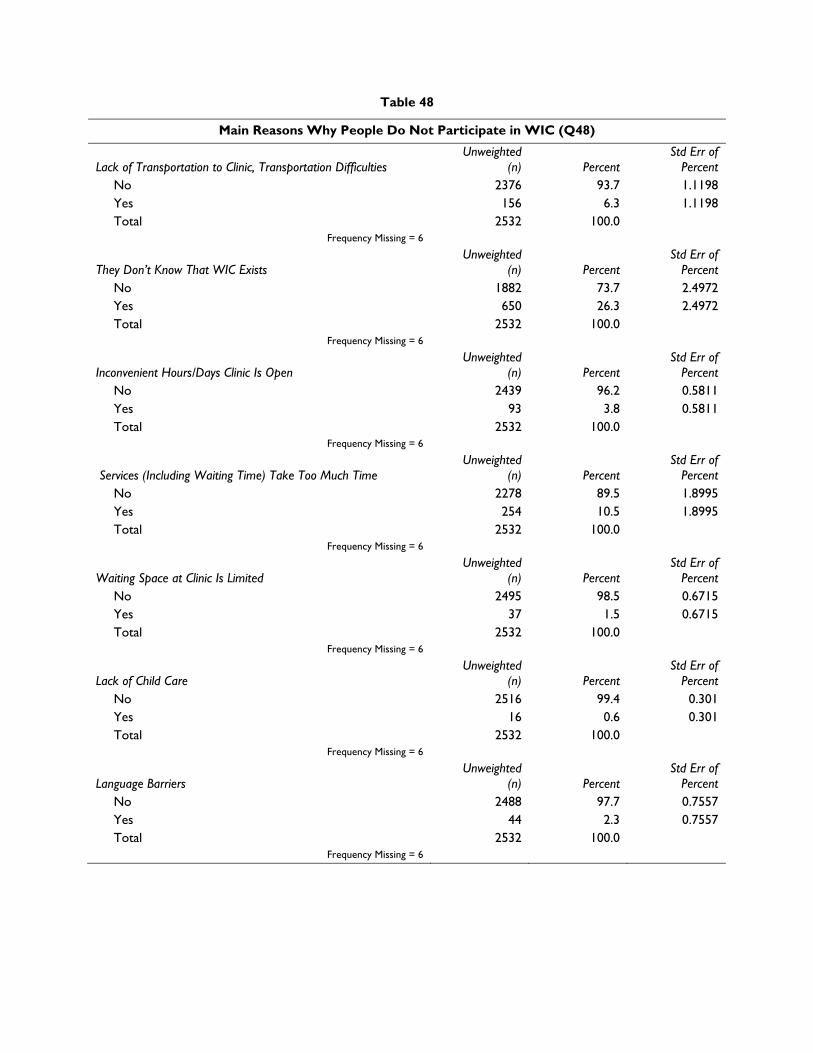
Table 48
Main Reasons Why People Do Not Participate in WIC (Q48)
Lack of Transportation to Clinic, Transportation Difficulties Unweighted
(n) Percent Std Err of
Percent No 2376 93.7 1.1198 Yes 156 6.3 1.1198 Total 2532 100.0
Frequency Missing = 6
They Don’t Know That WIC Exists Unweighted
(n) Percent Std Err of
Percent No 1882 73.7 2.4972 Yes 650 26.3 2.4972 Total 2532 100.0
Frequency Missing = 6
Inconvenient Hours/Days Clinic Is Open Unweighted
(n) Percent Std Err of
Percent No 2439 96.2 0.5811 Yes 93 3.8 0.5811 Total 2532 100.0
Frequency Missing = 6
Services (Including Waiting Time) Take Too Much Time Unweighted
(n) Percent Std Err of
Percent No 2278 89.5 1.8995 Yes 254 10.5 1.8995 Total 2532 100.0
Frequency Missing = 6
Waiting Space at Clinic Is Limited Unweighted
(n) Percent Std Err of
Percent No 2495 98.5 0.6715 Yes 37 1.5 0.6715 Total 2532 100.0
Frequency Missing = 6
Lack of Child Care Unweighted
(n) Percent Std Err of
Percent No 2516 99.4 0.301 Yes 16 0.6 0.301 Total 2532 100.0
Frequency Missing = 6
Language Barriers Unweighted
(n) Percent Std Err of
Percent No 2488 97.7 0.7557 Yes 44 2.3 0.7557 Total 2532 100.0
Frequency Missing = 6
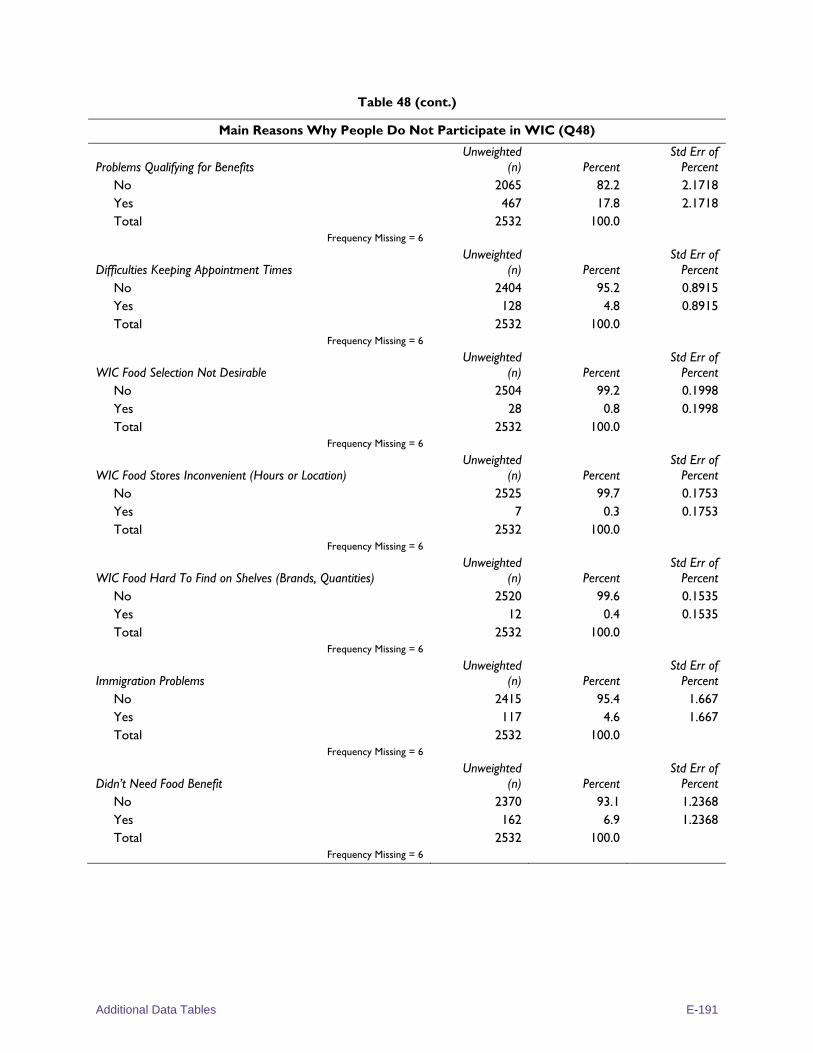
Additional Data Tables E-191
Table 48 (cont.)
Main Reasons Why People Do Not Participate in WIC (Q48)
Problems Qualifying for Benefits Unweighted
(n) Percent Std Err of
Percent No 2065 82.2 2.1718 Yes 467 17.8 2.1718 Total 2532 100.0
Frequency Missing = 6
Difficulties Keeping Appointment Times Unweighted
(n) Percent Std Err of
Percent No 2404 95.2 0.8915 Yes 128 4.8 0.8915 Total 2532 100.0
Frequency Missing = 6
WIC Food Selection Not Desirable Unweighted
(n) Percent Std Err of
Percent No 2504 99.2 0.1998 Yes 28 0.8 0.1998 Total 2532 100.0
Frequency Missing = 6
WIC Food Stores Inconvenient (Hours or Location) Unweighted
(n) Percent Std Err of
Percent No 2525 99.7 0.1753 Yes 7 0.3 0.1753 Total 2532 100.0
Frequency Missing = 6
WIC Food Hard To Find on Shelves (Brands, Quantities) Unweighted
(n) Percent Std Err of
Percent No 2520 99.6 0.1535 Yes 12 0.4 0.1535 Total 2532 100.0
Frequency Missing = 6
Immigration Problems Unweighted
(n) Percent Std Err of
Percent No 2415 95.4 1.667 Yes 117 4.6 1.667 Total 2532 100.0
Frequency Missing = 6
Didn’t Need Food Benefit Unweighted
(n) Percent Std Err of
Percent No 2370 93.1 1.2368 Yes 162 6.9 1.2368 Total 2532 100.0
Frequency Missing = 6
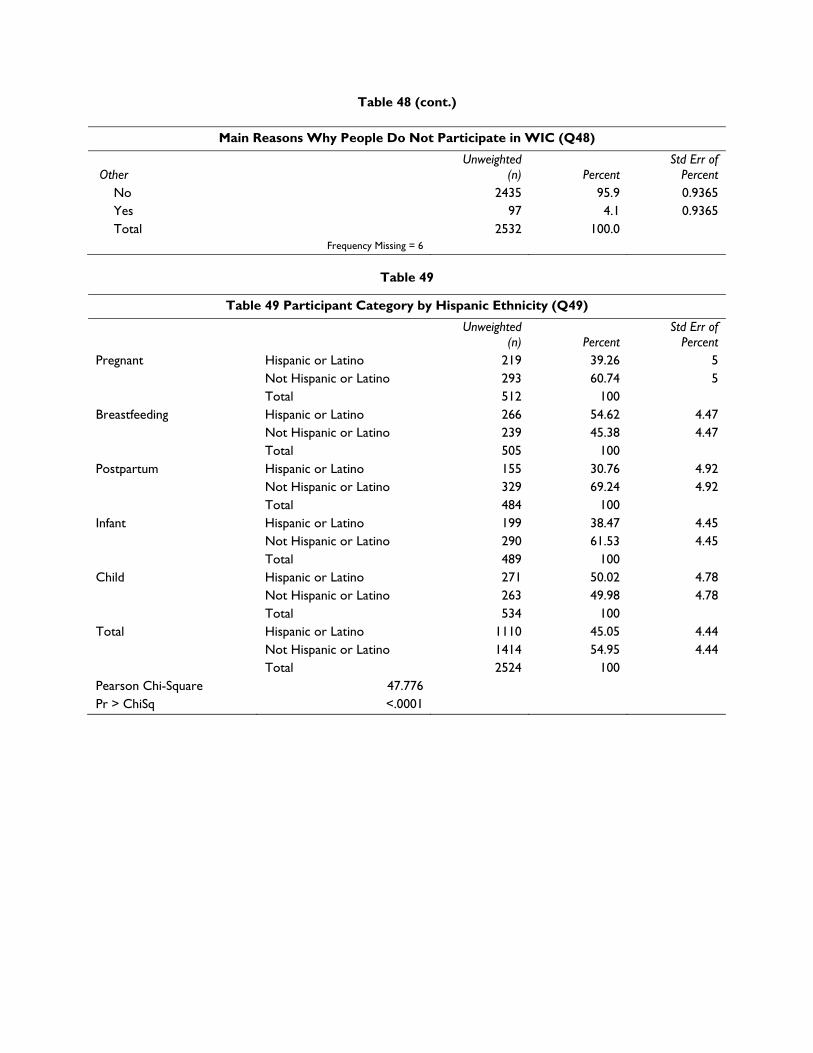
Table 48 (cont.)
Main Reasons Why People Do Not Participate in WIC (Q48)
Other Unweighted
(n) Percent Std Err of
Percent No 2435 95.9 0.9365 Yes 97 4.1 0.9365 Total 2532 100.0
Frequency Missing = 6
Table 49
Table 49 Participant Category by Hispanic Ethnicity (Q49)
Unweighted (n) Percent
Std Err of Percent
Pregnant Hispanic or Latino 219 39.26 5 Not Hispanic or Latino 293 60.74 5 Total 512 100
Breastfeeding Hispanic or Latino 266 54.62 4.47 Not Hispanic or Latino 239 45.38 4.47 Total 505 100
Postpartum Hispanic or Latino 155 30.76 4.92 Not Hispanic or Latino 329 69.24 4.92 Total 484 100
Infant Hispanic or Latino 199 38.47 4.45 Not Hispanic or Latino 290 61.53 4.45 Total 489 100
Child Hispanic or Latino 271 50.02 4.78 Not Hispanic or Latino 263 49.98 4.78 Total 534 100
Total Hispanic or Latino 1110 45.05 4.44 Not Hispanic or Latino 1414 54.95 4.44 Total 2524 100
Pearson Chi-Square 47.776 Pr > ChiSq <.0001
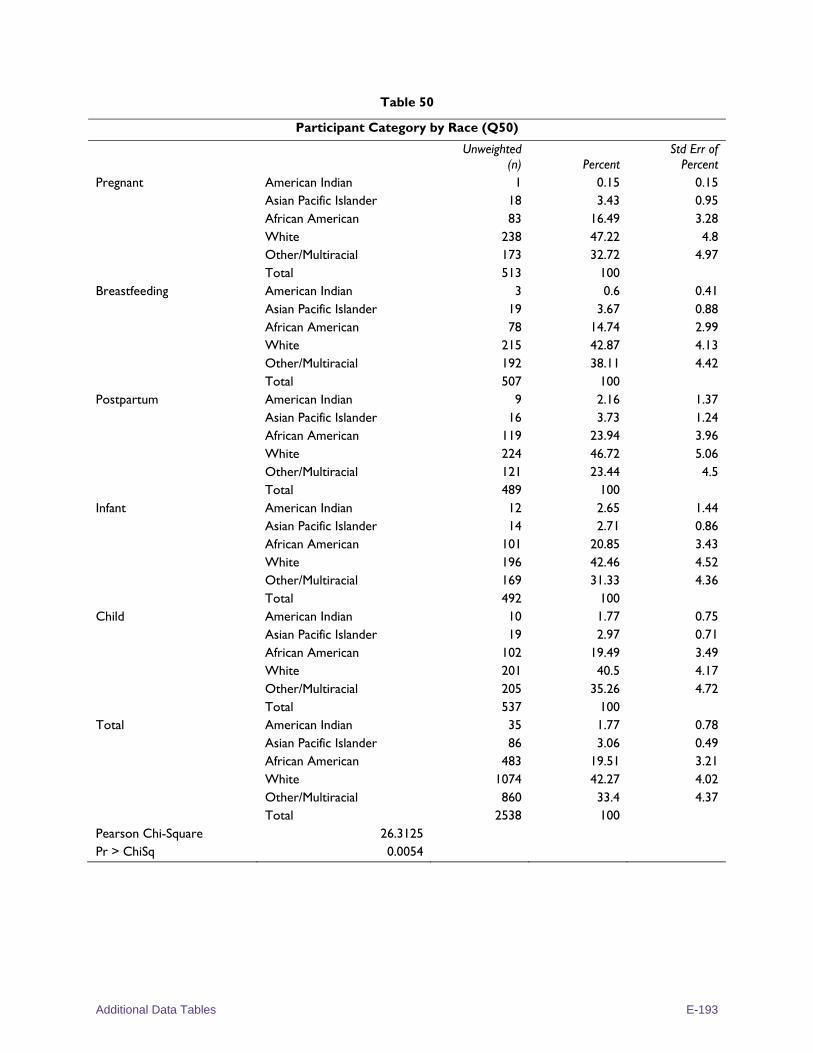
Additional Data Tables E-193
Table 50
Participant Category by Race (Q50)
Unweighted (n) Percent
Std Err of Percent
Pregnant American Indian 1 0.15 0.15 Asian Pacific Islander 18 3.43 0.95 African American 83 16.49 3.28 White 238 47.22 4.8 Other/Multiracial 173 32.72 4.97 Total 513 100
Breastfeeding American Indian 3 0.6 0.41 Asian Pacific Islander 19 3.67 0.88 African American 78 14.74 2.99 White 215 42.87 4.13 Other/Multiracial 192 38.11 4.42 Total 507 100
Postpartum American Indian 9 2.16 1.37 Asian Pacific Islander 16 3.73 1.24 African American 119 23.94 3.96 White 224 46.72 5.06 Other/Multiracial 121 23.44 4.5 Total 489 100
Infant American Indian 12 2.65 1.44 Asian Pacific Islander 14 2.71 0.86 African American 101 20.85 3.43 White 196 42.46 4.52 Other/Multiracial 169 31.33 4.36 Total 492 100
Child American Indian 10 1.77 0.75 Asian Pacific Islander 19 2.97 0.71 African American 102 19.49 3.49 White 201 40.5 4.17 Other/Multiracial 205 35.26 4.72 Total 537 100
Total American Indian 35 1.77 0.78 Asian Pacific Islander 86 3.06 0.49 African American 483 19.51 3.21 White 1074 42.27 4.02 Other/Multiracial 860 33.4 4.37 Total 2538 100
Pearson Chi-Square 26.3125 Pr > ChiSq 0.0054
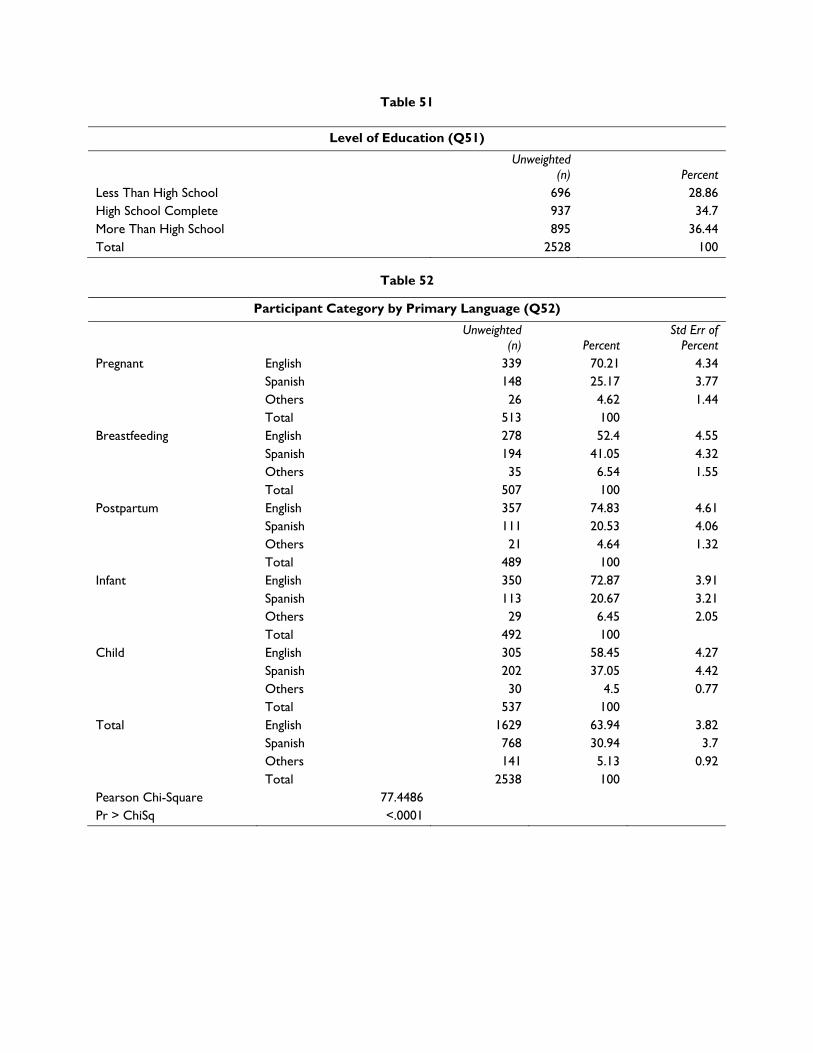
Table 51
Level of Education (Q51)
Unweighted (n) Percent
Less Than High School 696 28.86 High School Complete 937 34.7 More Than High School 895 36.44 Total 2528 100
Table 52
Participant Category by Primary Language (Q52)
Unweighted (n) Percent
Std Err of Percent
Pregnant English 339 70.21 4.34 Spanish 148 25.17 3.77 Others 26 4.62 1.44 Total 513 100
Breastfeeding English 278 52.4 4.55 Spanish 194 41.05 4.32 Others 35 6.54 1.55 Total 507 100
Postpartum English 357 74.83 4.61 Spanish 111 20.53 4.06 Others 21 4.64 1.32 Total 489 100
Infant English 350 72.87 3.91 Spanish 113 20.67 3.21 Others 29 6.45 2.05 Total 492 100
Child English 305 58.45 4.27 Spanish 202 37.05 4.42 Others 30 4.5 0.77 Total 537 100
Total English 1629 63.94 3.82 Spanish 768 30.94 3.7 Others 141 5.13 0.92 Total 2538 100
Pearson Chi-Square 77.4486 Pr > ChiSq <.0001