Embed Size (px)
Citation preview

Tuberculosis, public health and gathering newevidence to guide control effortsGUEST EDITORS
Amanda ChristensenA, Chris LowbridgeA,
Guy B. MarksB and Vitali SintchenkoC,D,E
AHealth Protection NSWBDepartment of Respiratory Medicine, Liverpool HospitalCCentre for Infectious Diseases and Microbiology,Westmead Hospital
DSydney Institute for Emerging Infectious Diseasesand Biosecurity, The University of Sydney
ECorresponding author. Email: [email protected]
More than100years after the discovery of the tubercle bacillus
by Robert Koch, tuberculosis (TB) remains one of the most
important public health challenges worldwide. Despite signif-
icant achievements in communicable disease control in the last
century, theWorldHealthOrganization (WHO) estimates that
in 2011 there were 8.7 million incident cases of TB and 1.4
million TB-related deaths, as well as an additional 430 000
deaths as a result of TB and human immunodeficiency virus
(HIV) co-infection.1 In Australia, the incidence of TB has
fluctuated at around 6.0 per 100 000 population for the last 15
years, with more than 85% of cases occurring in people born
overseas.2 This special issue of the NSW Public Health
Bulletin reviews the current epidemiology ofTB inNewSouth
Wales (NSW), showcases the experiences of clinicians in
managing difficult TB cases, highlights the public health
challenges involved in TB control, and adds new evidence to
aid future action towards the elimination of TB in Australia.
The first paper, from the NSW TB Control Program,
describes the epidemiology of TB in the state. Lowbridge,
Christensen andMcAnulty review TB notifications over the
past two decades and explain why, despite high rates of
treatment success, this disease remains a continued strategic
priority for disease control. They focus our attention on two
key themes: TB transmission within sub-groups of the
NSW population, and the potential threat of evolving TB
epidemics in neighbouring countries. These two themes are
reinforced and expanded upon by other papers in the issue.
Gilbert and Sintchenko outline new opportunities in decipher-
ing TB transmission chains presented by the radically
improved resolution of subtyping and whole-genome
sequencing of Mycobacterium tuberculosis. It is important
to raise public health professionals’ awareness about recent
advances in pathogen genome characterisation as these meth-
ods are becoming available at state public health laboratories
and allow inference about the direction of transmission
between cases and the prediction of undiagnosed cases.3
Britton, Perez-Velez and Marais offer an update on the
clinical management of TB in children. They demonstrate
that rates of paediatric TB in Australia are comparable to
other developed countries, with minimal local transmission
and routine post-exposure prophylaxis.
The case studies present emerging issues in TBmanagement
and control. Michail summarises recommendations about
monitoring for adverse events following anti-TB therapy.
Banner shares the lessons she and her colleagues learnt
following a contact tracing exercise within a school envi-
ronment. Fisher, Cook and Marks estimate the costs of
contact screening in a neonatal intensive care unit following
the incidental exposure of neonates to a health care worker
diagnosed with respiratory TB. Vogelnest, a senior veteri-
narian, presents TB as an emerging zoonotic disease and
highlights the need for occupational health programs and
screening programs for susceptible species. These reports
illustrate the increasing complexity of TB patient manage-
ment and public health investigations.
Two papers aim to improve our understanding of effective
contact investigations, especially in hard-to-reach popula-
tions. They add to the body of knowledge about how to
prioritise contacts on the basis of the infectiousness of the
Vol. 24(1) � 2013ISSN 1034 7674
NSW PUBLIC HEALTH BULLETIN
CONTENTS – See back page w w w . p u b l i s h . c s i r o . a u / j o u r n a l s / p h b
10.1071/NB12124
Tuberculosis in NSW

index case, intensity of exposure and susceptibility of
contacts. Dobler discusses the findings from a retrospec-
tive review of TB contact investigations in NSW. This
study demonstrated that only 9% of contacts with positive
skin tests received treatment for latent TB infection and
advocated formore consistent decision-making and testing
strategies for latent TBmanagement. Devlin and Passmore
highlight the challenges faced by public health profes-
sionals in managing ongoing outbreaks in high-risk com-
munities. Their paper provides important details on the
transmission of TB in Aboriginal communities in northern
NSW, perhaps the only example of an ongoing local TB
outbreak in the state.
The final paper reminds us about the critical importance of
TB control interventions in high-incidence countries.
Shaw explains Australia’s role in promoting and support-
ing TB control within the Western Pacific Region. This
region has been responsible for almost a quarter of the
world’s TB cases and its challenges of drug-resistance and
co-infection with HIV make a strong case for improved
engagement from Australia. The author details opportu-
nities for our country to contribute to theRegional Strategy
to Stop TB in the Western Pacific4 and to the local TB
control capacity building in the region.
The editorial team hopes that this issue of the NSW Public
Health Bulletinwill assist both public health professionals
and clinicians involved in the management and control of
TB and will be of interest to everyone who is passionate
about local and international efforts in TB control.
References1. World Health Organization. Global tuberculosis report 2012.
Geneva: World Health Organization; 2012.
2. Barry C, Waring J, Stapledon R, Konstantinos A; National
Tuberculosis Advisory Committee, for the Communicable
Diseases Network Australia. Tuberculosis notifications in
Australia, 2008 and 2009. Commun Dis Intell 2012; 36(1):
82–94.
3. Walker TM, Ip CL, Harrell RH, Evans JT, Kapatai G,
Dedicoat MJ et al. Whole-genome sequencing to delineate
Mycobacterium tuberculosis outbreaks: a retrospective
observational study. Lancet Infect Dis 2013; 13(2): 137–46.
doi:10.1016/S1473-3099(12)70277-3
4. World Health Organization. Regional Strategy to Stop
Tuberculosis in the Western Pacific 2011–2015. Available at:
http://www.wpro.who.int/tb/documents/policy/2010/regional_
strategy/en/index.html (Cited 29 January 2013).
NoticeThis issue of the Bulletin marks the beginning of quarterly publication.
ErratumTyphoid and paratyphoid fever in Western Sydney Local
Health District, NSW, January–June 2011 (N SWPublic
Health Bull 2012; 23(7–8): 148–152).
The paper by Blackstock, Sheppeard, Paterson and Ralph
erroneously used the term ‘serotype’ in some instances
where the term ‘phage type’ should have been used, for
example in the sentence ‘‘Three S. Typhi isolates acquired
at large social gatherings in Samoa had the same serotype
and susceptibility profilesy’’ The sentence should have
read: ‘‘Three S. Typhi isolates acquired at large social
gatherings in Samoa had the same phage type and sus-
ceptibility profilesy’’ In addition, differences from the
locally endemic strain would need to have been shown to
‘‘suggest a potential outbreak’’.
The authors would also like to clarify that, while the results
reported in this paper were provided by the NSW Enteric
Reference Laboratory, Institute for Clinical Pathology and
Medical Research, Westmead Hospital, the phage typing
was in fact performed at the Microbiological Diagnostic
Unit – Public Health Laboratory, The University of
Melbourne.
The Bulletin apologises for any confusion resulting from
these errors.
2 | Vol. 24(1) 2013 NSW Public Health Bulletin

Tuberculosis in NSW, 2009–2011
Chris LowbridgeA,B, Amanda ChristensenA
and Jeremy M. McAnultyA
AHealth Protection NSWBCorresponding author. Email: [email protected]
Abstract: Aim: To describe the epidemiology of
tuberculosis in NSW between 2009 and 2011 and
comparewith previous years.Methods:Data from
all cases of tuberculosis notified in NSW during
this period were extracted from the Notifiable
Conditions Information Management System.
Descriptive analyses of notification data were
undertaken. Incidence rates were calculated per
100 000 population. Results: Between 2009 and
2011, there were 1548 cases of tuberculosis
notified in NSW, translating to an average annual
notification rate of 7.2 per 100 000 population for
this period. A total of 89% (n¼ 1371) of notified
cases were overseas-born, and 1.6% (n¼ 24) of
cases were recorded as Aboriginal persons. The
most common site of infection was the lung (60%
of cases). Of notified cases, 68% were reported as
having been tested for HIV, of which 3% (n¼ 28)
of cases had HIV/tuberculosis co-infection. There
were 20 cases of multidrug-resistant tuberculosis,
including one case of extensively drug-resistant
tuberculosis. Conclusion: The notification rate
of tuberculosis in NSW has remained relatively
stable over the past two decades, though small
incremental increases since 2003 are evident.
Endemic transmission of tuberculosis within sub-
groups of the NSW population, as well as the
ongoing high endemnicity for tuberculosis in
neighbouring countries, highlight the importance
of tuberculosis control as a continued strategic
priority for disease control in NSW.
Tuberculosis (TB) remains a disease of global public health
significance. The World Health Organization (WHO) esti-
mates that in 2011 there were 8.7 million incident cases of
TB and 1.4 million TB-related deaths, as well as an
additional 430 000 deaths as a result of TB and human
immunodeficiency virus (HIV) co-infection.1 In Australia
the incidence of TB is low: in 2010 it was reported by
WHO to be 6.1 cases per 100 000 population. Mortality
from TB, excluding HIV-positive cases, was less than one
TB-related death per 100 000 population in Australia in
2010.1
Despite Australia’s low incidence, TB control remains a
challenge as the epidemiology of this disease must be
considered in a global context given the frequency of
international travel and migration from high-incidence
countries.2 The incidence and prevalence of TB in many
of Australia’s international neighbours remains high.
Twenty-two countries account for 80% of the global
burden of TB; nine of these countries are within the
South-East Asian and Western Pacific Regions. These
two regions also account for approximately 18% of
multidrug-resistant TB (MDR-TB) cases.1
Given the global context of TB epidemiology, elimination
of disease within any given country is not considered
feasible. The key goals and strategies of the New South
Wales (NSW) TB Control Program therefore focus on case
finding, early diagnoses and effective treatment in order to
minimise and eliminate local transmission.3 NSW has a
strong surveillance system in place, whereby all patients
diagnosed with TB are notified to a public health unit or
chest clinic in accordance with the NSW Public Health Act
2010. Case details are then entered into a central registry, the
Notifiable Conditions Information Management System.
The aim of this report is to describe the epidemiology of
TB in NSW between 2009 and 2011 by examining the
demographic and clinical characteristics, and risk factors
for infection, of notified cases. We report on the public
health follow-up of cases and the extent of contact tracing
activities undertaken by public health and clinical services.
We also compare incidence data with data from previous
years. Understanding the epidemiology of TB in NSW
is critical for informing and evaluating disease control
strategies.
MethodsData sources
TB notification data were extracted from the Notifiable
Conditions Information Management System. Data were
included in the study when the year of diagnosis was
between 2009 and 2011 (inclusive). Population data
including NSW mid-year population estimates, estimated
populations by country of birth and population estimates
by Local Health District (LHD) were obtained from the
10.1071/NB12115 Vol. 24(1) 2013 NSW Public Health Bulletin | 3
EPIREVIEW
Australian Bureau of Statistics (ABS) via the Secure
Analytics for Population Health Research and Intelligence
system. Results for the 2009–2011 period were compared
with the two most recently published NSW TB EpiReviews
for the periods 2008 and 2003–2007.2,4
Definitions
For the purpose of this report TB was defined as active
infectionwithMycobacterium tuberculosis. Cases of latent
TB are not included. Pulmonary TBwas defined as disease
occurring within the patient’s lung, excluding the pleura.
Extrapulmonary TB was defined as disease affecting any
other region of the body including the pleura. A case of TB
was defined as ‘new’ when there was no record of previous
TB treatment of more than 1 month duration.
TB notification data were analysed by year of diagnosis.
Each case of TB is assigned a year of diagnosis, which is
the year in which the majority of clinical and public health
action, including diagnosis, treatment, isolation and con-
tact tracing, occurred.
High-risk countries were defined as per the WHO defini-
tion of countries in which the incidence of TB is greater
than or equal to 60 cases per 100 000 population per
year.5
Cases were defined as havingMDR-TBwhen their isolates
demonstrated resistance to at least isoniazid and rifampi-
cin. Extensively drug-resistant TB (XDR-TB) was defined
as cases in which isolates demonstrated resistance to
isoniazid and rifampicin, as well as additional resistance
to any fluoroquinolone, and to at least one injectable
second-line drug (capreomycin, kanamycin or amikacin).6
0
1
2
3
4
5
6
7
8
0
100
200
300
400
500
600
1991
1992
1993
1994
1995
1996
1997
1998
1999
2000
2001
2002
2003
2004
2005
2006
2007
2008
2009
2010
2011
Rat
e pe
r 10
000
0 po
pula
tion
Num
ber
of c
ases
Year
Cases
Rate
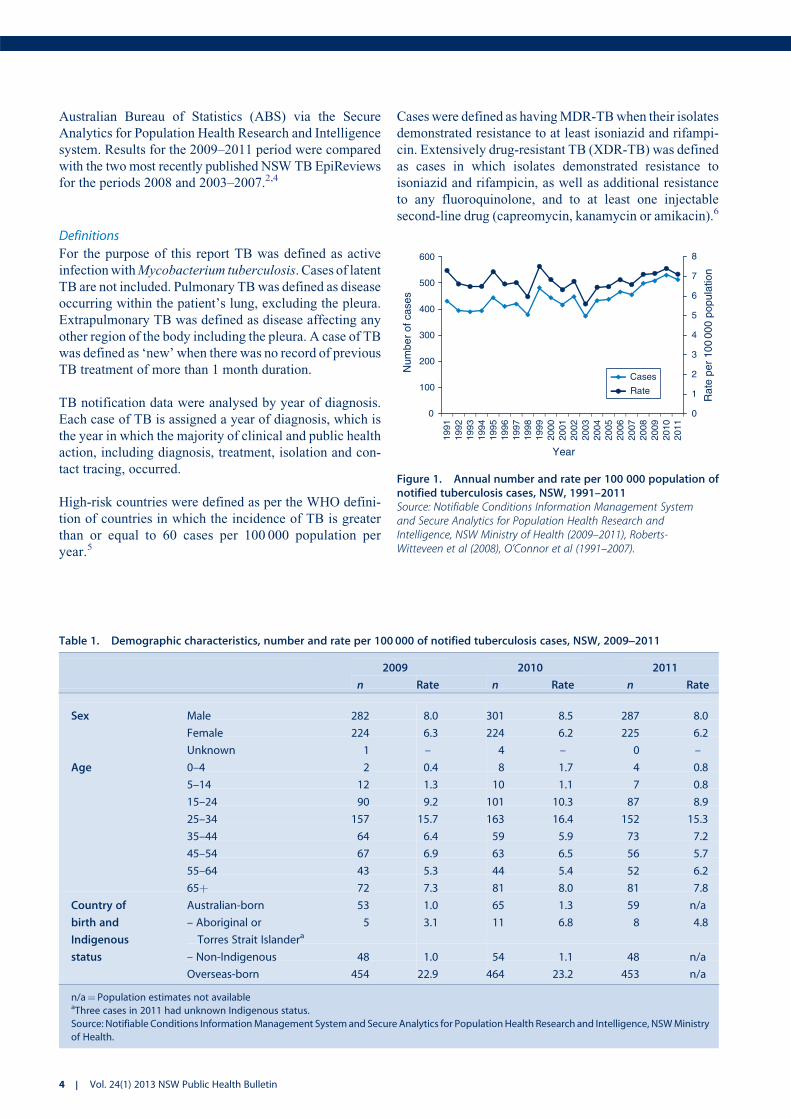
Figure 1. Annual number and rate per 100 000 population ofnotified tuberculosis cases, NSW, 1991–2011Source: Notifiable Conditions Information Management Systemand Secure Analytics for Population Health Research andIntelligence, NSW Ministry of Health (2009–2011), Roberts-Witteveen et al (2008), O’Connor et al (1991–2007).
Table 1. Demographic characteristics, number and rate per 100 000 of notified tuberculosis cases, NSW, 2009]2011
2009 2010 2011
n Rate n Rate n Rate
Sex Male 282 8.0 301 8.5 287 8.0
Female 224 6.3 224 6.2 225 6.2
Unknown 1 – 4 – 0 –
Age 0–4 2 0.4 8 1.7 4 0.8
5–14 12 1.3 10 1.1 7 0.8
15–24 90 9.2 101 10.3 87 8.9
25–34 157 15.7 163 16.4 152 15.3
35–44 64 6.4 59 5.9 73 7.2
45–54 67 6.9 63 6.5 56 5.7
55–64 43 5.3 44 5.4 52 6.2
65þ 72 7.3 81 8.0 81 7.8
Country of
birth and
Indigenous
status
Australian-born 53 1.0 65 1.3 59 n/a
– Aboriginal or
Torres Strait Islandera5 3.1 11 6.8 8 4.8
– Non-Indigenous 48 1.0 54 1.1 48 n/a
Overseas-born 454 22.9 464 23.2 453 n/a
n/a¼ Population estimates not availableaThree cases in 2011 had unknown Indigenous status.
Source: Notifiable Conditions InformationManagement Systemand Secure Analytics for PopulationHealth Research and Intelligence, NSWMinistry
of Health.
4 | Vol. 24(1) 2013 NSW Public Health Bulletin

Statistical analyses
Descriptive analyses of notification data were under-
taken. Cases were categorised as overseas-born, non-
Indigenous Australian-born, or Aboriginal and/or Torres
Strait Islander Australian-born. Overseas-born cases were
categorised into regions of birth using ABS standards.7
Incidence rates per 100 000 population were calculated
for the whole of NSW using select fields from demo-
graphic, clinical, risk factor and contact management
data categories. Incidence rates for TB by LHD of resi-
dence were calculated and mapped. Data were analysed
using SAS� Enterprise Guide� (version 4.3, SAS Insti-
tute, Cary, NC, USA).
ResultsThere were 1548 notifications of TB received in NSW
between 2009 and 2011 inclusive (507–529 notifications
per year), equating to an annualised rate of 7.2 cases per
100 000 population for the period (range 7.1–7.4 per
100 000 population). The rate of TB notification in NSW
has remained relatively stable over the past two decades
(Figure 1) however there have been small incremental
increases since 2003.
Demographic characteristics
Males accounted for 56% of tuberculosis cases diagnosed
between 2009 and 2011. The mean age of cases was 41
years (range: 6months–94 years). Adults aged 25–34 years
accounted for the largest proportion (30%) of cases
(Table 1). There were 24 cases of TB in Aboriginal persons
(1.6%of all cases) inNSWbetween2009 and 2011, equating
to a crude incidence rate of 4.9 cases per 100 000 population
per year. The highest annual crude rate of infection in
Aboriginal persons was 6.8 cases per 100 000 population
(n¼ 11) in 2010. The rate of infection in non-Indigenous
Australian-born persons in 2010 was 1.0 per 100 000 popu-
lation (9.5% of cases). In 2009, Aboriginal persons were
three times more likely to be notified with TB than non-
Indigenous Australian-born persons (Incident Rate Ratio
(IRR) 3.3, 95% CI: 1.3–8.2), increasing to six times more
likely in 2010 (IRR 6.3, 95%CI: 3.3–12.0). OfAboriginal or
Torres Strait Islander persons notifiedwithTBbetween2009
and 2011, 50% were residents of the Northern NSW or Mid
North Coast LHDs.
Themajority of cases of TB between 2009 and 2011 (85%)
resided within the Sydney metropolitan area, giving an
annualised incidence rate of 11.2 per 100 000 population
Table 2. Number and rate per 100 000 of notified tuberculosis cases by Local Health District, NSW, 2009]2011
2009 2010 2011 Total
n Rate n Rate n Rate n Rate
Regional and rural 39 1.8 46 2.1 49 2.2 134 2.1
Murrumbidgee 7 2.4 6 2.1 14 4.8 27 3.1
Far West ,3 3.1 0 0.0 ,3 3.2 ,3 2.1
Mid North Coast 3 1.4 9 4.3 5 2.3 17 2.7
Southern NSW 6 3.0 3 1.5 4 2.0 13 2.2
Hunter New England 15 1.7 15 1.7 17 1.9 47 1.8
Western NSW 0 0.0 4 1.5 5 1.9 9 1.1
Northern NSW 7 2.4 9 3.0 3 1.0 19 2.1
Outer metro 25 2.4 32 3.1 30 2.9 87 2.8
Illawarra Shoalhaven 12 3.1 13 3.4 14 3.6 39 3.4
Nepean Blue
Mountains
10 2.9 14 4.1 12 3.5 36 3.5
Central Coast 3 1.0 5 1.6 4 1.3 12 1.3
Inner metro 442 11.4 450 11.5 427 10.8 1319 11.2
Western Sydney 127 15.6 111 13.5 127 15.3 365 14.8
Sydney 91 16.2 84 14.7 88 15.2 263 15.4
South Western Sydney 98 11.4 91 10.5 83 9.4 272 10.4
South Eastern Sydney 68 8.2 101 12.1 68 8.1 237 9.5
Northern Sydney 58 7.0 63 7.6 61 7.3 182 7.3
Other
Justice Health 0 n/a 0 n/a 5 n/a 5 n/a
Overseas ,3 n/a ,3 n/a ,3 n/a 3 n/a
n/a: Population estimates not available
Small cell counts have been suppressed for privacy and confidentiality reasons.
Source: Notifiable Conditions InformationManagement Systemand Secure Analytics for PopulationHealth Research and Intelligence, NSWMinistry
of Health.
Tuberculosis in NSW, 2009–2011
Vol. 24(1) 2013 NSW Public Health Bulletin | 5
per year. The rate of infection in outer metropolitan, and
regional and rural areas was 2.8 and 2.1 cases per 100 000
population respectively (Table 2). Within the Sydney
metropolitan area, Sydney LHD and Western Sydney
LHD had the highest overall rates and accounted for
41% of all TB notifications in NSW between 2009 and
2011. Of the regional and rural LHDs, Murrumbidgee had
the highest rate (3.1 cases per 100 000 population per year).
Country of birth
The incidence rate of TB in overseas-born persons in 2010
was 23.2 per 100 000 population, compared to 1.3 cases
per 100 000 population for Australian-born persons. Popu-
lation estimates by country of birth were not available
for 2011. Between 2009 and 2011, 89% (n¼ 1371) of
cases were overseas-born. Of overseas-born cases, 45%
(n¼ 613) were born in South-East Asia and 39% (n¼ 534)
were born in the Western Pacific Region.
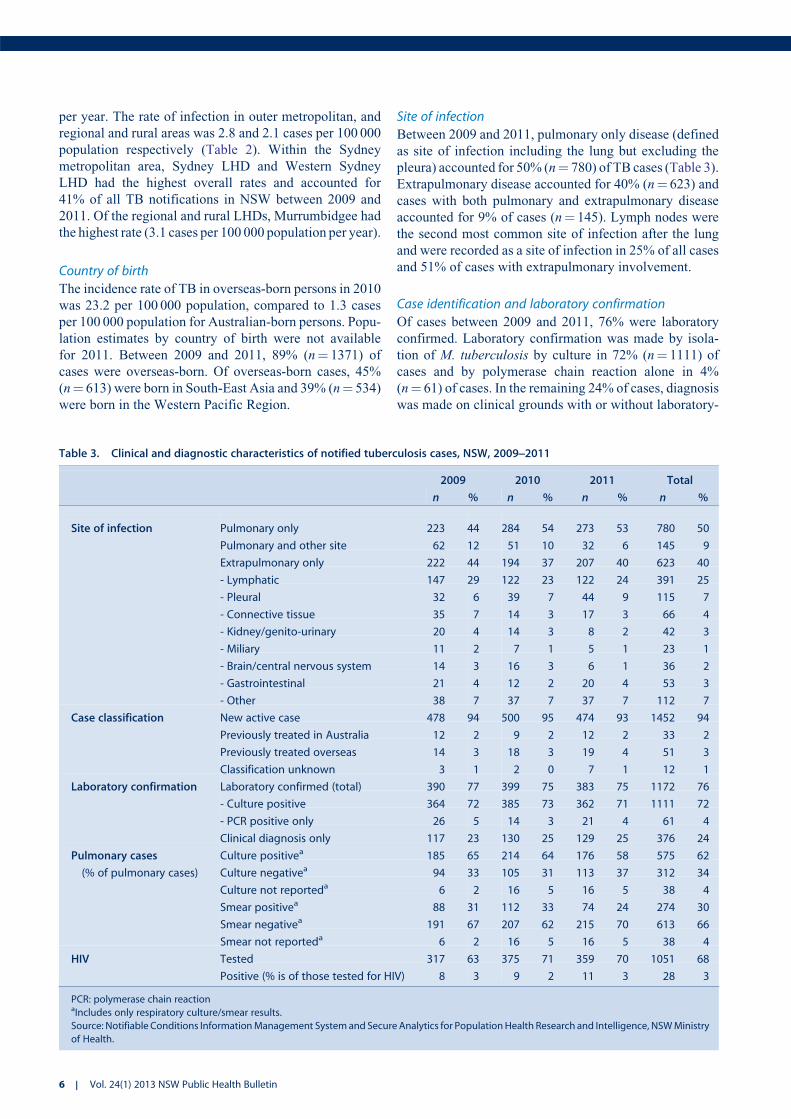
Site of infection
Between 2009 and 2011, pulmonary only disease (defined
as site of infection including the lung but excluding the
pleura) accounted for 50% (n¼ 780) of TB cases (Table 3).
Extrapulmonary disease accounted for 40% (n¼ 623) and
cases with both pulmonary and extrapulmonary disease
accounted for 9% of cases (n¼ 145). Lymph nodes were
the second most common site of infection after the lung
and were recorded as a site of infection in 25% of all cases
and 51% of cases with extrapulmonary involvement.
Case identification and laboratory confirmation
Of cases between 2009 and 2011, 76% were laboratory
confirmed. Laboratory confirmation was made by isola-
tion of M. tuberculosis by culture in 72% (n¼ 1111) of
cases and by polymerase chain reaction alone in 4%
(n¼ 61) of cases. In the remaining 24% of cases, diagnosis
was made on clinical grounds with or without laboratory-
Table 3. Clinical and diagnostic characteristics of notified tuberculosis cases, NSW, 2009]2011
2009 2010 2011 Total
n % n % n % n %
Site of infection Pulmonary only 223 44 284 54 273 53 780 50
Pulmonary and other site 62 12 51 10 32 6 145 9
Extrapulmonary only 222 44 194 37 207 40 623 40
- Lymphatic 147 29 122 23 122 24 391 25
- Pleural 32 6 39 7 44 9 115 7
- Connective tissue 35 7 14 3 17 3 66 4
- Kidney/genito-urinary 20 4 14 3 8 2 42 3
- Miliary 11 2 7 1 5 1 23 1
- Brain/central nervous system 14 3 16 3 6 1 36 2
- Gastrointestinal 21 4 12 2 20 4 53 3
- Other 38 7 37 7 37 7 112 7
Case classification New active case 478 94 500 95 474 93 1452 94
Previously treated in Australia 12 2 9 2 12 2 33 2
Previously treated overseas 14 3 18 3 19 4 51 3
Classification unknown 3 1 2 0 7 1 12 1
Laboratory confirmation Laboratory confirmed (total) 390 77 399 75 383 75 1172 76
- Culture positive 364 72 385 73 362 71 1111 72
- PCR positive only 26 5 14 3 21 4 61 4
Clinical diagnosis only 117 23 130 25 129 25 376 24
Pulmonary cases
(% of pulmonary cases)
Culture positivea 185 65 214 64 176 58 575 62
Culture negativea 94 33 105 31 113 37 312 34
Culture not reporteda 6 2 16 5 16 5 38 4
Smear positivea 88 31 112 33 74 24 274 30
Smear negativea 191 67 207 62 215 70 613 66
Smear not reporteda 6 2 16 5 16 5 38 4
HIV Tested 317 63 375 71 359 70 1051 68
Positive (% is of those tested for HIV) 8 3 9 2 11 3 28 3
PCR: polymerase chain reactionaIncludes only respiratory culture/smear results.
Source: Notifiable Conditions InformationManagement Systemand Secure Analytics for PopulationHealth Research and Intelligence, NSWMinistry
of Health.
6 | Vol. 24(1) 2013 NSW Public Health Bulletin

suggestive evidence. Of pulmonary cases, 62% (n¼ 575)
had M. tuberculosis isolated from a respiratory sample;
30% (n¼ 274) of pulmonary cases were direct sputum
smear-positive.
Of cases where the nature of identification was reported
(n¼ 1529), the majority (78%) were identified through
investigation of symptomatic disease. This was followed
by screening for TB (13%); that is, post-migration screen-
ing, then contact tracing (6%).
Case classification
Case classification remained stable over the 3-year period
from 2009 to 2011, with new active cases making up 94%
of all reported cases (Table 3). Previously treated cases
made up the remainder, with 3% of cases having received
partial or complete treatment overseas and 2% having
received partial or complete treatment in Australia.
HIV co-infection
The proportion of cases that were tested for HIV has
increased since 2009, with 68% of cases being tested
overall for this period. Of those tested for HIV, 28 cases
had HIV co-infection (3%) (Table 3). Of HIV co-infected
cases, 74%weremale and all were aged between 20 and 59
years. Five (18%) were Australian-born, while the remain-
ing cases were born primarily in South and South-East
Asian and African countries.
Clinical outcomes
Known clinical outcome was recorded for 1033 cases in
2009 and 2010 (Table 4). A total of 87% (n¼ 904) of cases
were successfully treated, consisting of 84% (n¼ 869) who
completed treatment and 3% (n¼ 35) who were considered
cured (culture positive prior to treatment and culture nega-
tive after completion of treatment). There were five TB-
related deaths reported, all in 2009. Twenty-three cases
(2%) defaulted from treatment; the remainder were either
transferred overseas, died of a non-TB related cause, or
were continuing on treatment at the time of analysis.
Drug resistance
Between 2009 and 2011 there were 20 cases of MDR-TB
reported (including one case with XDR-TB). All but two
cases of MDR-TB were overseas-born, including seven
born in theWestern Pacific Region and eight born in South-
East Asia. Of the two Australian-born MDR-TB cases, one
had travelled to a high-risk country for more than 3 months,
while the other had travelled to several high-risk countries
on multiple occasions but never for more than 3 months.
The proportion of cases with mono-resistance to rifampicin
has remained stable at 1–2% of cases. However, the propor-
tion of caseswithmono-resistance to isoniazid has decreased
from 9.3% of cases in 2009 to 5.3% of cases in 2011. This
trend was found to be statistically significant when tested
using the Chi-square test for trend (x2¼ 5.8, P¼ 0.02).
However, when a longer period is observed (2007–2011)
there is no statistically significant trend.
Risk factors
The most commonly identified risk factor for TB in
notified cases between 2009 and 2011 was being born in
a high-risk country, with 80% of all cases reporting this
risk factor. Past residence of more than 3 months in a high-
risk country was reported by 47% of all cases. Other
reported risk factors are presented in Table 5.
There was variation in the reported risk factors between
Australian- and overseas-born cases. In Australian-born
cases, the most frequently reported risk factor was past
residence ofmore than3months in a high-risk country (28%
of Australian-born cases), followed by having a household
member or close contact with TB (25% of Australian-born
cases). Of overseas-born cases, 90% were born in a high-
risk country and 50% had resided in a high-risk country for
more than 3 months. Amongst cases born in a high-risk
country, themedian length of stay inAustralia prior to onset
of disease was 4 years (Inter-quartile Range 2–12 years).
Contact tracing
A total of 7338 contacts of TB cases were identified
between 2009 and 2011. Of these, 6027 (82%) received
contact screening. Of contacts screened, 48 (1%) were
determined to have active TB disease. A further 186 (3%)
Table 4. Outcomes of clinical management of notifiedtuberculosis cases, NSW, 2009]2010
2009 2010
n % n %
Treatment successa 440 87 464 88
- Completed treatment 424 84 445 84
- Curedb 16 3 19 4
Defaulted 15 3 8 2
Treatment failurec 0 0 0 0
Treatment interruptedd 0 0 0 0
Transferred overseas 24 5 29 5
Died of tuberculosis 5 1 0 0
Died of other or unknown cause 21 4 14 3
Still undergoing treatment 0 0 13 2
Outcome unknown 2 0 1 0
Total number of cases 507 100 529 100
aDefined as either completed treatment or cured.bBacteriologically confirmed cure of smear or culture positive
pulmonary cases.cTreatment completed but case not cured.dTreatment interrupted for 2 months or more, but completed.
Source: Notifiable Conditions Information Management System and
Secure Analytics for Population Health Research and Intelligence,
NSW Ministry of Health.
Tuberculosis in NSW, 2009–2011
Vol. 24(1) 2013 NSW Public Health Bulletin | 7

contacts screened had a tuberculin skin test (TST) conver-
sion. On initial TST screening, 33% of contacts who
received screening were TST positive. Of contacts
screened, 412 (7%) received prophylactic treatment.
Further breakdown of contact screening data by year is
presented in Table 6.
DiscussionBetween 2003 and 2011 there was a small but steady
increase in the number of notifications of TB in NSW.
This increase is consistent with recent national trends8 and
is an indicator of the need for continued TB control
measures. As the majority of TB notifications in NSW
are in persons who were born in or have lived in a country
with a high incidence of TB, the epidemiology of TB
notifications in NSW can be expected to broadly reflect
global TB trends. The notification rate for TB continues to
remain highest in the Sydney metropolitan area, particu-
larly within Sydney’s inner city and western suburbs. This
has previously been suggested to be a reflection of migrant
settlement patterns within NSW.2 Between 2009 and 2011
Table 5. Risk factors for tuberculosis (TB) among notified cases, by country of birth, NSW, 2009]2011
Australian-born Overseas-born All cases
n % n % n %
Child (Australian-born) of parent(s) born in a high-risk countrya 21 11.9 n/a n/a 21 1.4
Born in a high-risk countryb n/a n/a 1234 90.0 1234 79.7
Past residence ($3 months) in a high-risk country 49 27.7 685 50.0 734 47.4
Household member or close contact with TB 45 25.4 161 11.7 206 13.3
Immunosuppressive therapy or condition 28 15.8 128 9.3 156 10.1
Currently or ever employed in the health care industry 12 6.8 102 7.4 114 7.4
Previously diagnosed with TB 12 6.8 73 5.3 85 5.5
Risk not able to be determined or not assessed 32 18.1 51 3.7 83 5.4
Chest X-ray suggestive of old untreated TB 2 1.1 12 0.9 14 0.9
Ever employed in a residential institution 0 0.0 7 0.5 7 0.5
Currently or ever residing in a homeless shelter 4 2.3 6 0.4 10 0.6
Currently or ever residing in a residential institution 2 1.1 6 0.4 8 0.5
Ever resided in a correctional facility 4 2.3 3 0.2 7 0.5
Other risk factor 19 10.7 57 4.2 76 4.9
n/a: not applicableaRefers to children aged under 15 years who were born in Australia but whose parent or parents were born in a high-risk country.bAs determined by the clinician assessing the patient.
Source: Notifiable Conditions InformationManagement Systemand Secure Analytics for PopulationHealth Research and Intelligence, NSWMinistry
of Health.
Table 6. Outcomes of contact tracing of notified tuberculosis (TB) cases, in NSW, 2009]2011
2009 2010 2011 Total
n % n % n % n %
Contacts identified 2527 2427 2384 7338
Contacts screeneda 2083 82 1840 76 2104 88 6027 82
Contacts with active TBb 10 0 25 1 13 1 48 1
Contacts TST positive on initial screenb 652 31 704 38 631 30 1987 33
Contacts TST positive with risk factors for exposure/BCGb 565 27 750 41 596 28 1911 32
Contacts with TST conversionb 70 3 57 3 59 3 186 3
Contacts on preventive therapyb 127 6 186 10 99 5 412 7
BCG: Bacille Calmette-Guerin vaccine
TST: tuberculin skin testaPercentage of all contacts identified.bPercentage of all contacts screened.
Source: Notifiable Conditions InformationManagement Systemand Secure Analytics for PopulationHealth Research and Intelligence, NSWMinistry
of Health.
8 | Vol. 24(1) 2013 NSW Public Health Bulletin

there were 24 cases of TB reported in Aboriginal people in
NSW; this is double the number of cases reported for the
3 years prior (2006–2008).2
Drug resistance is one of the most significant emerging
issues in TB control globally.1 In NSW the proportion of
MDR-TB cases continues to remain low (1.3%). This is
lower than the national proportion of cases with MDR-TB
in 2008 (2.4%).9 WHO estimates that 3.7% of new TB
cases globally are MDR-TB.1 Despite the low proportion
of cases with MDR-TB in NSW, the number of MDR-TB
cases notified appears to be increasing. Between 2009 and
2011 the average annual number of MDR-TB cases was
6.7 per year, an increase from 3.8 cases per year between
2003 and 2007.4 Due to the small numbers of MDR-TB
cases, it is difficult to be certain whether this is a true
increase or natural variation.
The proportion of cases tested for HIV co-infection has
increased from 54% of cases in 2008 to 70% of cases in
2011.2 Despite this increase NSW remains behind the
national level of 81% of cases tested for HIV in 2009.8
Further work is needed to reach the national performance
indicator of 100% of TB cases assessed for HIV. Despite
increased testing, the proportion of cases with HIV co-
infection remains low (3%). This is consistent with the
proportion of HIV co-infected TB cases nationally.8
ConclusionThe effectiveness of TB control services in NSW is
evidenced by low mortality from TB, the high proportion
of cases successfully treated, minimal local transmission
of TB and extensive screening of contacts. Incremental
increases in the overall notification rate of TB in the
last 8 years, an increase in the average annual number of
MDR-TB cases and ongoing local transmission within
sub-groups of the population highlight the need for contin-
ued vigilance in TB control.
AcknowledgmentsThe authors wish to acknowledge staff from the network of Chest
Clinics and Public Health Units in NSW who collected the data. We
also acknowledge Dr Vitali Sintchenko, Peter Jelfs and staff of the
NSW Mycobacterium Reference Laboratory at the Institute for
Clinical Pathology and Medical Research, Westmead Hospital.
References1. World Health Organization. Global tuberculosis report 2012.
Geneva: World Health Organization; 2012.
2. Roberts-Witteveen AR, Christensen AJ, McAnulty JM. EpiRe-
view: Tuberculosis in NSW, 2008. N S W Public Health Bull
2010; 21(8): 174–82. doi:10.1071/NB10005
3. Communicable Diseases Branch. GL2005_030 Tuberculosis
prevention and control services: the role of chest clinics in NSW.
Sydney: NSW Department of Health; 2005.
4. O’Connor BA, Fritsche LL, Christensen AJ, McAnulty JM.
EpiReview: Tuberculosis in NSW, 2003–2007. N S W Public
Health Bull 2009; 20(4): 59–68. doi:10.1071/NB09001
5. World Health Organization. Global tuberculosis control 2011.
Geneva: World Health Organization; 2011.
6. National Tuberculosis Advisory Committee. Multi-drug resis-
tant tuberculosis. Commun Dis Intell 2007; 31(4): 406–9.
7. Australian Bureau of Statistics. Standard Australian Classifica-
tion of Countries (SACC). Canberra: Australian Bureau of
Statistics; 2011.
8. Barry C, Waring J, Stapledon R, Konstantinos A; National
Tuberculosis Advisory Committee, for the Communicable Dis-
eases NetworkAustralia. Tuberculosis notifications inAustralia,
2008 and 2009. Commun Dis Intell 2012; 36(1): 82–94.
9. Lumb R, Bastian I, Carter R, Jelfs P, Keehner T, Sievers A.
Tuberculosis in Australia: bacteriologically confirmed cases and
drug resistance, 2008 and 2009. A report of the Australian
Mycobacterium Reference Laboratory Network. Commun Dis
Intell Q Rep 2011; 35(2): 154–61.
Tuberculosis in NSW, 2009–2011
Vol. 24(1) 2013 NSW Public Health Bulletin | 9
The use of mycobacterial interspersed repetitiveunit typing and whole genome sequencingto inform tuberculosis prevention and controlactivities
Gwendolyn L. GilbertA,B,C and Vitali
SintchenkoA,B
ACentre for Infectious Diseases and Microbiology,Westmead Hospital
BSydney Institute for Emerging Infectious Diseasesand Biosecurity, The University of Sydney
CCorresponding author. Email: [email protected]
Abstract: Molecular strain typing of Mycobacte-
rium tuberculosis has been possible for only about
20 years; it has significantly improved our under-
standing of the evolution and epidemiology of
Mycobacterium tuberculosis and tuberculosis
disease. Mycobacterial interspersed repetitive unit
typing, based on 24 variable number tandem repeat
unit loci, is highly discriminatory, relatively easy to
perform and interpret and is currently the
most widely used molecular typing system for
tuberculosis surveillance. Nevertheless, clusters
identified by mycobacterial interspersed repetitive
unit typing sometimes cannot be confirmed or
adequatelydefinedbycontact tracing and additional
methods are needed. Recently, whole genome
sequencing has been used to identify single nucleo-
tide polymorphisms and other mutations, between
genotypically indistinguishable isolates from the
same cluster, to more accurately trace transmission
pathways. Rapidly increasing speed and quality and
reduced costs will soon make large scale whole
genome sequencing feasible, combinedwith the use
of sophisticated bioinformatics tools, for epidemio-
logical surveillance of tuberculosis.
Unlike many other bacterial pathogens, different strains of
Mycobacterium tuberculosis complex cannot be easily
distinguished by the use of phenotypic methods. It was not
until the 1990s, when M. tuberculosis complex molecular
typing methods were developed, that it became possible to
accurately identify tuberculosis (TB) transmission and study
the origins and global distribution of M. tuberculosis com-
plex genotypes.M. tuberculosis complex is a clonal species,
inwhich horizontal transmission (recombination) of genetic
material is rare. Genetic variation results from: (a) point
mutations or single nucleotide polymorphisms (SNPs);
(b) small DNA insertions or deletions, often mediated by
mobile genetic elements, such as insertion sequences (IS);
(c) larger DNA deletions, resulting in regions of difference
(RDs) between strains, major enough to determine subspe-
cies within theM. tuberculosis complex; and (d) variation in
numbers of repeat sequences at various genomic loci. All of
these are potential genotyping targets.
The appropriate choice of targets depends on the purpose
of genotyping. For example, monitoring TB transmission
requires targets that change rapidly enough to distinguish
epidemiologically unrelated strains (such as IS or repeat
sequences), but may not provide accurate information
about lineage, whereas studies of long-term epidemiologi-
cal trends and lineages require more stable targets reflect-
ing rare genetic events (such as SNPs or RDs) that can trace
the origins and global spread of different strains.
The rationale for molecular typing depends on the setting.
In low-incidence settings it is often used, routinely, to
identify case clusters (and, potentially, their sources) that
are not apparent by conventional contact tracing. Routine
typing can also identify laboratory contamination and
false-positive culture results and, so, prevent unnecessary
treatment. In high-prevalence settings, molecular typing is
more likely to be performed, selectively, to investigate the
evolution and transmission of M. tuberculosis to inform
and improve TB control programs.
Strain typing methodsOne of the first genotyping methods described was IS6110
restriction fragment length polymorphism (RFLP) typing
which, until recently, was the most discriminatory method
available.1 IS6110 is found only in the M. tuberculosis
complex, usually in multiple copies; the number of copies
and the sizes of restriction fragments that contain them
distinguish different strains, except those with few, or
sometimes no, IS6110 copies. Themethod involves cutting
DNA with a restriction enzyme, identifying fragments
10 | Vol. 24(1) 2013 NSW Public Health Bulletin 10.1071/NB12106

containing IS6110 with a labelled molecular probe and
separating them on a gel to produce a strain-specific
banding pattern. Its disadvantages are that it requires
prolonged incubation of isolates to produce a large enough
quantity of DNA and the banding patterns can be difficult
to interpret and reproduce. However, it has been used
successfully, for many years, to provide insights into
M. tuberculosis transmission, distinguish reactivation from
reinfection, and identify laboratory cross-contamination.2
Spoligotyping detects the presence or absence of 43 non-
repetitive spacer oligonucleotides, which are variably
interspersed between short chromosomal repeats at the
direct repeat locus of the M. tuberculosis genome.3,4 The
direct repeat locus is amplified by polymerase chain
reaction (PCR) and the product is hybridized to a series
of probes on a strip to identify the presence of spacer
sequences. It requires relatively little DNA and can be used
on early cultures or clinical specimens.3 The results are
objective and reproducible but it is less discriminatory than
IS6110-RFLP and so less suitable for transmission studies.
However, it differentiates M. tuberculosis strains into
broad families that generally correspond with geographic
areas5 and, sometimes, with characteristics such as viru-
lence, transmissibility and resistance.6
Recently, mycobacterial interspersed repetitive unit
(MIRU) typing has largely overtaken both IS6110 and
spoligotyping, although they are sometimes used together.
MIRUs are tandem repeat sequences, dispersed among
intergenic regions of the M. tuberculosis genome, which
vary between M. tuberculosis strains according to the
number of repeats at each locus. They are one of a group
of variable number tandem repeat (VNTR) sequences,
which are the basis ofmultilocus VNTR analysis (MLVA),
a common bacterial genotyping method.
M. tuberculosis MIRU-VNTR typing, originally based on
12 loci,7 is rapid, objective and reproducible. It was rapidly
adopted as the basis for large-scale, high-throughput
M. tuberculosis genotyping8–10 but, even in combination
with spoligotyping, was less discriminatory than IS6110
fingerprinting, especially for isolates of the widespread
Beijing spoligotypes.11 Because of the potential for false
clusters, identified by MIRU-12 and spoligotyping,
IS6110-RFLP typing of clustered isolates was often needed
to more accurately define outbreaks,12 especially if there
were no obvious epidemiological links between cases.
Subsequently, a more discriminatory set of 24-MIRU-
VNTR loci, including the original 12, was identified.
MIRU-24 typing of more than 800 geographically diverse
isolates, representing all major lineages, identified 40%
more genotypes and demonstrated a fourfold lower rate of
clustering than MIRU-12 typing.13 Even a smaller subset
of 15 loci, with the highest evolutionary rates, was as
discriminatory as IS6110-RFLP typing. Thus, MIRU-15
typing was proposed as a new standard for routine use and
MIRU-24 as a high-resolution alternative for phylogenetic
studies.11,13 Others have confirmed the higher discrimina-
tory power of MIRU-24, compared with MIRU-12.14
MIRU-24 typingMIRU-24 (or -15) is now the new ‘gold standard’ for
routine M. tuberculosis typing. To facilitate global epide-
miological studies, a web-based database (http://www.
miru-vntrplus.org/) has been established, based on a col-
lection of 186 reference strains, representing the primary
M. tuberculosis complex lineages.15,16 The database
includes geographic origin, drug susceptibility profile
and comprehensive genetic lineage information, including
the MIRU-24, SNP and RD profiles, spoligotype and
IS6110-RFLP fingerprint of each strain. MIRU-24 analy-
sis reliably predicted the correct lineage of greater than
99% of nearly 700 external strains.15,16 The database
allows users to compare strains with the reference set,
search for similar strains and map geographic information.
An expanding genotype nomenclature (MLVAMtbC15-9
type) has been implemented to facilitate comparison
between laboratories.16
MIRU typing can be performed either by separate PCRs
for each locus and measurement of amplicon sizes by gel
electrophoresis or by several multiplex PCRs, using fluo-
rescently labeled primers, and determination of amplicon
sizes by capillary electrophoresis in a DNA analyser. The
number of tandem repeats (of known length) at each locus is
calculated from the amplicon size and results are expressed
as a numerical code corresponding to the numbers of
repeats at each locus, which is the strain ‘fingerprint’.
In a recent international proficiency study17 of MIRU-24
typing, a panel of 30 DNA extracts, from 20 well-
characterised M. tuberculosis strains, was tested in 37
laboratories. There was wide variation in reproducibility
of results between laboratories (average 60%); it was better
(88%) when commercial kits were used than when in-
house-adaptedmethods using capillary (70%) or gel (50%)
electrophoresis were used. However, many in-house-
adapted methods achieved greater than 80% reproducibil-
ity, suggesting that, with care, they can be used reliably.17
The study demonstrated potential pitfalls of comparing
genotypes between laboratories and the importance of
quality assurance programs.
The New South Wales (NSW) Mycobacterium Reference
Laboratory has used IS6110-RFLP and spoligotyping
since 2004, MIRU-12 since 2005 and MIRU-24 since
2010, to confirm suspected transmission between
epidemiologically-related TB cases,18 investigate out-
breaks,12 differentiate TB reactivation from reinfection,19
identify otherwise unsuspected case clusters or laboratory
contamination and estimate rates of recent transmission.10
The most common spoligotypes in NSW belong to the
MIRU typing and whole genome sequencing
Vol. 24(1) 2013 NSW Public Health Bulletin | 11

Beijing family (more than one-quarter of all isolates
examined), which was first described in China and neigh-
bouring countries in 1995, and has since been reported in
many parts of the world, especially Asia and the former
Soviet states. We have tracked an expanding cluster of
cases, due to a strain with a unique MIRU-24 profile,
among Aboriginal communities in the NSW North Coast
region, which has involved at least 30 cases since 2000
(unpublished data; see also Devlin and Passmore20).
Table 1 compares our MIRU-typing results with those of
several studies showing rates of recent transmission (RRT)
using this method.14,21,22 It is worth noting that a low RRT
reflects the degree of success of the local TB control
program.
Despite the improved discriminatory power of MIRU-24
typing, apparent clusters cannot always be confirmed,
even by the most detailed contact tracing, suggesting
some false clustering, especially in settings with high
rates of transmission of closely related M. tuberculosis
strains. In China, a high proportion of cases are caused by
the so-called ‘modern’ Beijing lineage. Isolates belonging
to this lineage have only one or two IS6110 copies and,
generally, similar MIRU-24 patterns. False clustering of
MIRU patterns occurs due to homoplasy or convergent
evolution (independent mutations resulting in the same
genotypes among isolates with different ancestry). This
can mean, for example, that reinfection with a similar
strain could be misinterpreted as reactivation of infection
due to treatment failure. In future, problems like this
could be resolved by whole genome sequencing, or
inclusion of additional targets in typing methods. For
example, SNPs have been identified, which can reliably
differentiate these otherwise homogeneous ‘modern’
Beijing strains, with the same or very similar, MIRU-24
types, into several lineages. In a recent study, the combi-
nation of MIRU-15 typing plus PCR amplification and
sequence typing of three hypervariable regions and eight
SNPs overcame false clustering; it was therefore
proposed for second-line typing of clustered isolates in
settings of high prevalence of Beijing strains.21
Whole genome sequencingThe ultimate strain typing system is whole genome
sequencing which, until recently, seemed fanciful because
of the cost, time taken and requirement for sophisticated
bioinformatics tools for sequence analysis. However,
recent advances in sequencing technology have dramati-
cally reduced the cost and turnaround time and improved
the quality of sequence data and several recent investiga-
tions have demonstrated its potential.
Whole genome sequencing was used in the Netherlands to
investigate a well-characterised M. tuberculosis transmis-
sion chain (confirmed by genotyping and contact tracing)
involving five patients aged over 12 years, for which no
source had been identified.23 Four SNPs, a tandem-repeat
polymorphism and an IS6110 transpositionwere identified
between the first and last isolates of this cluster. The
remaining isolates were screened for these six polymorph-
isms and five were found in isolates from one patient, an
alcoholic who had been non-compliant with treatment. It
was hypothesised that molecular evolution ofM. tubercu-
losis in vivo may be driven by environmental factors such
as intermittent antibiotic use leading to successive bursts of
multiplication, or by genomic stress due to alcohol abuse.
Identifying factors that stimulate mutational bursts could
have major implications for TB management.23 In a
Canadian study,24 whole genome sequencing of 32 isolates
from a large 3-year community outbreak and four unrelat-
ed historical isolates, all with identical MIRU-24 and
IS6110-RFLP types, was combined with social network
analysis based on patient interviews, to determine the
origin and transmission dynamics of the outbreak. Analy-
sis ofmore than 200 SNPs revealed two genetically distinct
lineages, both represented among historical isolates, indi-
cating that they had separated before the outbreak started.
Table 1. Comparison of Mycobacterium tuberculosis clustering rates in recent studies of tuberculosis transmission
Locations (references) Canada14 Switzerland22 China21 NSW, Australia10 (unpubl.)
Dates (years) 2003–08 (5) 2000–08 (9) 2007–10 (3.5) 2004–06 (3) 2009–11 (3)
Typing method MIRU-12 MIRU-24 MIRU-24 MIRU-12 MIRU-24
Number of isolates 650 520 267 855 633
Clustering 75% 17.3% 42% 33.7% 24.8%
Average cluster size 10.0 2.6 3.0 6.5 2.6
RRT 0.71 0.11 Not reported 0.25 0.16
Beijing lineage 2% 12% 89% 24% 25%
EAI lineage 5% 10% Not reported 12% 15%
EAI: East African Indian
MIRU: mycobacterial interspersed repetitive unit
RRT: rate of recent transmission; defined as the number of identical (clustered) isolatesminus the number of clusters (accepting a single source case
for each cluster), divided by the total number of isolates.
12 | Vol. 24(1) 2013 NSW Public Health Bulletin

Additional, targeted social network and epidemiological
analyses identified three co-primary case-patients who had
been symptomatic for prolonged periods before diagnosis.
The outbreak coincided with an increase in crack cocaine
use in the community.24 Whole genome sequencing impli-
cated socio-environmental factors, not identified by
conventional genotyping and contact tracing, in triggering
simultaneous expansion of two pre-existing M. tuber-
culosis lineages that were subsequently sustained within
a high-risk social network.
The exponential fall in cost and increased speed and
quality of whole genome sequencing will continue.25 Only
the availability of appropriate tools to analyse and interpret
the results will limit its use. It has the potential to rapidly
trackM. tuberculosis transmission andmicroevolution and
identify virulent and antibiotic resistant strains. When
combined with appropriate clinical data this will improve
our understanding of disease risks and how to prevent it;
allow more timely and individually targeted therapy; and
identify new vaccine, antibiotic and diagnostic targets.
ConclusionIn the relatively short period since molecular strain typing
ofM. tuberculosis has been available andwidely used, it has
considerably increased our understanding of the evolution
and modes of transmission of this ubiquitous and important
pathogen. It has demonstrated that transmission can occur
as a result of apparently casual, transient contact by leading
to more detailed investigation of possible common sources
of exposure of apparently unrelated individuals who share
the same infecting strain. It has allowed comparison of
rates of clustering between different population groups and
communities, which reflects and can lead to improvement
in the efficacy of TB control programs. Finally, it has
provided new insights into the evolution ofM. tuberculosis
over long periods of time and widely distant geographic
regions and also during the course of a single case cluster.
As methods have improved from the highly discriminatory
but slow and technically demanding IS6110 RFLP to the
simpler, but equally discriminatory MIRU-24, genotyping
has become more accessible, which means that our under-
standing of M. tuberculosis evolution and epidemiology
has correspondingly increased. Whole genome sequencing
promises to provide further insights and evenmore discrim-
inatory and informative strain typing.
References1. van Embden JD, Cave MD, Crawford JT, Dale JW, Eisenach
KD, Gicquel B et al. Strain identification of Mycobacterium
tuberculosis by DNA fingerprinting: recommendations for a
standardized methodology. J Clin Microbiol 1993; 31: 406–9.
2. Houben RMGJ, Glynn JR. A systematic review and meta-
analysis of molecular epidemiological studies of tuberculosis:
development of a new tool to aid interpretation. Trop Med Int
Health 2009; 14: 892–909. doi:10.1111/j.1365-3156.
2009.02316.x
3. Kamerbeek J, Schouls L, Kolk A, van Agterveld M, van
Soolingen D, Kuijper S et al. Simultaneous detection and strain
differentiation ofMycobacterium tuberculosis for diagnosis and
epidemiology. J Clin Microbiol 1997; 35: 907–14.
4. Soini H, Pan X, Teeter L, Musser JM, Graviss EA. Transmission
dynamics and molecular characterization of Mycobacterium
tuberculosis isolates with low copy numbers of IS6110. J Clin
Microbiol 2001; 39: 217–21. doi:10.1128/JCM.39.1.217-
221.2001
5. Filliol I, Driscoll JR, van Soolingen D, Kreiswirth BN, Kremer
K, Valetudie G et al. Snapshot of moving and expanding clones
of Mycobacterium tuberculosis and their global distribution
assessed by spoligotyping in an international study. J Clin
Microbiol 2003; 41: 1963–70. doi:10.1128/JCM.41.5.1963-
1970.2003
6. Buu TN, Huyen MN, Lan NTN, Quy HT, Hen NV, Zignol M
et al. The Beijing genotype is associated with young age and
multidrug-resistant tuberculosis in rural Vietnam. Int J Tuberc
Lung Dis 2009; 13: 900–6.
7. Supply P, Mazars E, Lesjean S, Vincent V, Gicquel B, Locht C.
Variable human minisatellite-like regions in theMycobacterium
tuberculosis genome. Mol Microbiol 2000; 36: 762–71.
doi:10.1046/j.1365-2958.2000.01905.x
8. Cowan LS, Diem L, Monson T, Wand P, Temporado D,
Oemig TV et al. Evaluation of a two-step approach for large-
scale, prospective genotyping of Mycobacterium tuberculosis
isolates in the United States. J Clin Microbiol 2005; 43: 688–95.
doi:10.1128/JCM.43.2.688-695.2005
9. vanDeutekomH, Supply P, deHaas PEW,Willery E, Hoijng SP,
Locht C et al. Molecular typing ofMycobacterium tuberculosis
by mycobacterial interspersed repetitive unit-variable-number
tandem repeat analysis, a more accurate method for identifying
epidemiological links between patients with tuberculosis. J Clin
Microbiol 2005; 43: 4473–9. doi:10.1128/JCM.43.9.4473-
4479.2005
10. Gallego B, Sintchenko V, Jelfs P, Coiera E, Gilbert GL.
Three-year longitudinal study of genotypes of Mycobacterium
tuberculosis in a low prevalence population. Pathology 2010;
42: 267–72. doi:10.3109/00313021003631346
11. Allix-Beguec C, Fauville-Dufaux M, Supply P. Three-year
population-based evaluation of standardized mycobacterial
interspersed repetitive-unit-variable-number tandem-repeat
typing of Mycobacterium tuberculosis. J Clin Microbiol 2008;
46: 1398–406. doi:10.1128/JCM.02089-07
12. Merritt TD, Sintchenko V, Jelfs P, Worthing M, Robinson B,
Durrheim DN et al. An outbreak of pulmonary tuberculosis in
young Australians. Med J Aust 2007; 186: 240–2.
13. Supply P, Allix C, Lesjean S, Cardoso-Oelemann M,
Rusch-Gerdes S, Willery E et al. Proposal for standardization
of optimized mycobacterial interspersed repetitive unit-
variable-number tandem repeat typing of Mycobacterium
tuberculosis. J ClinMicrobiol 2006; 44: 4498–510. doi:10.1128/
JCM.01392-06
14. Christianson S, Wolfe J, Orr P, Karlowsky J, Levett PN,
Horsman GB et al. Evaluation of 24 locus MIRU-VNTR
genotyping of Mycobacterium tuberculosis isolates in Canada.
Tuberculosis (Edinb) 2010; 90: 31–8. doi:10.1016/
j.tube.2009.12.003
15. Allix-Beguec C, Harmsen D, Weniger T, Supply P, Niemann S.
Evaluation and strategy for use of MIRU-VNTRplus,
MIRU typing and whole genome sequencing
Vol. 24(1) 2013 NSW Public Health Bulletin | 13

amultifunctional database for online analysis of genotyping data
and phylogenetic identification of Mycobacterium tuberculosis
complex isolates. J Clin Microbiol 2008; 46: 2692–9.
doi:10.1128/JCM.00540-08
16. Weniger T, Krawczyk J, Supply P, Niemann S, Harmsen D.
MIRU-VNTRplus: a web tool for polyphasic genotyping of
Mycobacterium tuberculosis complex bacteria. Nucleic Acids
Res 2010; 38: W326–31. doi:10.1093/nar/gkq351
17. de Beer JL, Kremer K, Kodmon C, Supply P, van Soolingen D.
Global Network for the Molecular Surveillance of Tuberculosis
2009. First worldwide proficiency study on variable-number
tandem-repeat typing of Mycobacterium tuberculosis complex
strains. J Clin Microbiol 2012; 50: 662–9. doi:10.1128/
JCM.00607-11
18. Jelfs P, Sintchenko V, Gilbert GL. Genotyping of Mycobacte-
rium tuberculosis in New South Wales: results from 18 months
of a statewide trial. N S W Public Health Bull 2006; 17: 81–5.
doi:10.1071/NB06020
19. Dobler CC, Crawford ABH, Jelfs PJ, Gilbert GL,
Marks GB. Recurrence of tuberculosis in a low-incidence
setting. Eur Respir J 2009; 33: 160–7. doi:10.1183/
09031936.00104108
20. Devlin S, Passmore E. Ongoing transmission of tuberculosis in
Aboriginal communities in NSW. N S W Public Health Bull
2013; 24(1): 38–42.
21. Luo T, Yang C, Gagneux S, Gicquel B, Mei J, Gao Q. Combi-
nation of single nucleotide polymorphism and variable-number
tandem repeats for genotyping a homogenous population of
Mycobacterium tuberculosis Beijing strains in China. J Clin
Microbiol 2012; 50: 633–9. doi:10.1128/JCM.05539-11
22. Fenner L, Gagneux S, Helbling P, Battegay M, Rieder HL,
Pfyffer GE et al. Mycobacterium tuberculosis transmission in a
countrywith low tuberculosis incidence: role of immigration and
HIV infection. J Clin Microbiol 2012; 50: 388–95. doi:10.1128/
JCM.05392-11
23. Schurch AC, Kremer K, Kiers A, Daviena O, Boeree MJ, Siezen
RJ et al. The tempo and mode of molecular evolution of
Mycobacterium tuberculosis at patient-to-patient scale. Infect
Genet Evol 2010; 10: 108–14. doi:10.1016/
j.meegid.2009.10.002
24. Gardy JL, Johnston JC, Ho Sui SJ, Cook VJ, Shah L, Brodkin E
et al. Whole-genome sequencing and social-network analysis of
a tuberculosis outbreak. N Engl J Med 2011; 364: 730–9.
doi:10.1056/NEJMoa1003176
25. National Human Genome Research Institute, National Institutes
of Health. DNA sequencing costs. Available at: www.genome.
gov/sequencingcosts (Cited 7 August 2012).
14 | Vol. 24(1) 2013 NSW Public Health Bulletin

Diagnosis, treatment and preventionof tuberculosis in children
Philip BrittonA, Carlos M. Perez-VelezB,C
and Ben J. MaraisA,C,D
AThe Children’s Hospital at WestmeadBGrupo Tuberculosis Valle-Colorado and Clınica Leon XIII,IPS Universidad de Antioquia, Colombia
CSydney Emerging Infectious Diseases and Biosecurity Institute,The University of Sydney
DCorresponding author. Email: [email protected]
Abstract: In Australia, tuberculosis notification
rates have plateaued at a low level and disease is
highly concentrated in immigrant communities
where children may be affected. Many clinicians
regard tuberculosis as an adult disease, hence it is
rarely considered in the differential diagnosis of
sick children. This paper provides a brief overview
of the natural history of the disease in children to
demonstrate the importance of taking a careful
tuberculosis exposure history. It also provides
guidance regarding the diagnosis, treatment and
prevention of tuberculosis in children. The man-
agement of paediatric cases is not difficult if
important differences with adult disease are care-
fully considered; these differences are discussed in
detail.
Tuberculosis (TB) remains a major, but often unrecog-
nised, cause of disease and death among women and
children in TB endemic areas.1 Cases are highly concen-
trated in areas affected by poverty, social disruption,
human immunodeficiency virus (HIV) infection and
drug-resistant TB,2,3 with increased international travel
and immigration posing major challenges to the control of
TB. In Australia, TB incidence rates are among the lowest
in the world at 5–6 per 100 000 population per year.4
However, rates are highly variable and up to 10 times
higher in certain sub-groups of the population. More than
85%of cases occur in immigrant populations and represent
imported infection, with the top five countries of origin
being India, Viet Nam, the Philippines, China and Indo-
nesia, where high rates of drug-resistant TB have been
recorded.2,4 Evidence of local transmission is limited and
restricted to particular disease clusters.5 New SouthWales
(NSW) reports the highest absolute number of TB cases
within Australia.4,6 In 2008, children aged under 15 years
constituted less than 5% of the disease burden (18/498),6
similar to other developed countries with minimal internal
transmission and routine provision of post-exposure pro-
phylaxis to young and vulnerable children.7,8 Despite low
numbers of children with TB, Australian clinicians need to
consider TB as part of the differential diagnosis, as cases
are observed at regular intervals.9–13 This brief overview
focuses on recent advances in diagnosis and on issues
related to the clinical care of children with TB.
Natural history of diseaseThe pre-chemotherapy literature provides detailed natural
history of disease descriptions which guide risk assessment
and management.14,15 An observation is that most children
(.90%) who progress to TB disease do so within the first
12 months after primary infection; this is referred to as the
‘window of risk’. Another observation is the pronounced
bi-modal risk profile: very young children (aged less than
2 years) experience the greatest risk; a nadir occurs at around
5–10 years of age and then an increase is seenwith the onset
of puberty. This coincides with a radical shift in the disease
spectrum. In young children, lymph node disease with or
without airway compression predominates, due to exuberant
lymph node responses and small pliable airways. Dissemi-
nated disease is also more common due to immature T-cell
responses and poor disease containment. The sudden switch
to adult-type TB that occurs around puberty, first in girls and
then in boys, remains an enigma, but may shed light on key
variables underlying individual vulnerability.16 It is impor-
tant to remember that adolescent children with adult-type
disease are highly infectious.17 Table 1 summarises some
important differences between TB in adults and children.
DiagnosisChildren are usually evaluated for TB as a result of
immigrant screening, contact investigation or following
presentation with symptoms or signs suggestive of TB
disease. It is important to distinguish these different entry
points since they influence the diagnostic work-up and
interpretation of results (Figure 1). Mycobacterium tuber-
culosis infection detected during immigrant screening
probably reflects remote past infection with reduced risk
of disease progression, unless it is a young child or
immunocompromised individual. M. tuberculosis infec-
tion detected during contact investigation is likely to be
recent, implying a higher risk of disease progression,
although this remains highly age-dependent. In this popu-
lation, isolated radiographic findings in asymptomatic
10.1071/NB12100 Vol. 24(1) 2013 NSW Public Health Bulletin | 15

children are problematic, since transient elements of the
Ghon/primary complex are frequently visualised and not
necessarily indicative of active disease. Observational
studies and current World Health Organization guidance
suggest that symptom-based screening is adequate, at least
in older children, and the complete absence of current
symptoms is sufficient to rule out TB disease in this
group.18,19 Table 2 provides an overview of investigations
to establish a diagnosis of TB in children.
Clinical evaluation
Children rarely present with near pathognomonic signs of
TB such as a TB gibbus; most clinical manifestations are
non-specific. In fact, one of the remarkable features of
intra-thoracic TB is the frequent absence of physical signs
despite the presence of persistent non-remitting symptoms.
Furthermore, despite minimal clinical findings, the clini-
cianmay be surprised by the radiographic extent of disease.
The pathophysiological explanation for this discrepancy is
not clear but may reflect the fact that TB often causes a
vasculitis (as observed with TB meningitis) in addition to
parenchymal involvement. This implies that both oxygen
exchange and blood supply are reduced in affected parts of
the lung, limiting the resultant ventilation:perfusion mis-
match which may explain the frequent absence of acute
respiratory distress despite extensive lung involvement.
A detailed history should explore the likelihood of recent
(during the past 12 months) TB exposure and allow
accurate symptom characterisation. This is important
Table 1. Tuberculosis (TB): differences between adults and children
Aspect Adultsa Childrena
Epidemiology/
awareness
Massive global disease burden that is
well quantified; excellent awareness
Massive global disease burden that is poorly quantified;
minimal awareness
Health policy Main focus of national TB control
programs (NTPs)
Rarely recognised as a priority by NTPs
Pathogenesis of
lung lesions
Usually adult-type lung disease
(previously referred to as post-
primary TB)
Usually intra-thoracic lymph node disease (previously referred
to as primary TB)
Bacterial load/
transmission/
infection control
Multibacillary
High infection risk after close contact
Paucibacillary
Low infection risk, but may be infectious if extensive lung
involvement with/without cavities; epidemiologic marker
of transmission
Drug resistance Difficult to differentiate acquired from
transmitted (primary) drug resistance
Nearly always transmitted (primary) drug resistance indicating
recent transmission
Exposure history Important, but often neglectedb Essential
Risk of progression
to disease
Relatively low risk of progression to
disease following TB exposure/
infection
Highly variable risk of progression to disease following TB
exposure/infection – greatest in the very young and/or
immunocompromised
Preventive therapy Limited value, except in
immunocompromised adults
Definite value in young (aged ,5 years) and/or
immunocompromised children
Imaging studies Chest X-rays (CXRs) not routinely
required, unless sputum negative
CXRs (with both frontal and lateral views, of good quality,
and competently read) are the most informative study
Disease
classification
Pulmonary vs extrapulmonary
distinction
Post-primary TB is a confusing conceptc
Intra-thoracic lymph node disease best classified as pulmonary TB
Diverse spectrum of pathology that requires accurate
classification
Microbiological
studies
Easy to collect adequate respiratory
specimen and confirm presence of
mycobacteria
Difficult to collect adequate respiratory specimens (young
children cannot expectorate); smear microscopy has very low
yield; cultures and nucleic acid amplication tests have low-to-
moderate yield depending on disease severity
Treatment With at least four drugs With three or four drugs depending on likely organism load and
severity of disease
Prognosis Excellent outcomes achievable with
timely and appropriate treatment
Excellent outcomes achievable with timely and appropriate
treatment; potentially grave outcome with delayed diagnosis
Adjusted by the authors from their previous work.14
aTypical characteristics in the absence of HIV-infection and/or severely compromised immunity.bTaking a careful contact history is often neglected for adults, but has particular relevance for the identification of drug-resistant TB suspects.cThe old distinction between primary and post-primary TB obscures the fact that adult-type (post-primary; secondary) TB frequently results from
recent re-infection and may also occur within months of documented primary infection (particularly in adolescents).
16 | Vol. 24(1) 2013 NSW Public Health Bulletin

because poorly-defined symptoms have poor discrimina-
tory power.20 Common constitutional symptoms include
decreased appetite (recent crossing of weight centiles is
most informative), fatigue or reduced playfulness, and
fever. Despite TB being an infectious disease, fever is
often absent, low-grade or intermittent. With lung involve-
ment, children usually present with a persistent non-
remitting cough that is unresponsive to standard first-line
treatment. Airway compression may manifest as loud
(large airway) wheezing that does not respond to bronch-
odilators. Clinical follow-up is a useful diagnostic tool in
children with mild disease manifestations for whom the
diagnosis cannot be made with certainty.20
Imaging studies
Chest radiography is generally the most informative inves-
tigation and should include both frontal and lateral views.
Lateral views are important as they improve assessment of
the mediastinum and hilar areas. Childhood intra-thoracic
TB has a wide range of appearances associated with
different disease entities, which justifies careful classifica-
tion.21,22 Visible hilar adenopathy with or without airway
compression is highly suggestive of TB disease. High-
resolution chest computed tomography (CT) provides the
most accurate visualisation of intra-thoracic structures,23
but due to the high cost and associated radiation exposure
its use should be limited to complicated cases. CT and/or
magnetic resonance imaging (MRI) is the best way to
visualise extrapulmonary lesions, especially intra-cranial
pathology. MRI is more sensitive for detecting brainstem
lesions or early perfusion defects (infarcts) and also
provides better evaluation of the spine and soft tissues.24
Laboratory studies
Immune-based tests are severely limited by their inability to
differentiate M. tuberculosis infection from active disease,
Possible TB disease?
Symptoms/signs suggestive of possible TB
Possible TB disease?
• Symptom-based screening positive
• Radiological signs suggestive of TB disease
Young orimmunocompromised?
Disease classification?
Specify:
- Degree of certainty
- Clinical syndrome
Consider:
- Immune status (perform HIV test)
- Possibility of drug resistance (see Table 3 for treatment guidance)5
Provide preventivetherapy3
Monitor for possiblefuture disease2
Alternative diagnosis?
Rule out alternative diagnoses
- monitor symptom resolution; re-evaluate as indicated4
TB exposure or infection?
• Recent close contact with an infectious TB case
• Positive immune-based testing (TST and/or IGRA)a
Findings consistent with TB disease?
Carefully review:
- Mycobacterium tuberculosis infection risk; epidemiological risk factors and immune-based tests (TST and/or IGRA)
- Clinical symptoms and signs suggestive of TB disease
- Radiological signs consistent with TB disease
Collect appropriate specimens:
- Respiratory specimens and/or non-respiratory specimens for bacteriological confirmation and other relevant tests (see Table 2)
Active case finding(immigrant or contact screening)
Passive case finding(symptomatic child)
No
Yes
Yes
Yes
YesNo
No
No
Yes
Discharge1
and/or
and/or
Figure 1. Algorithm for diagnosis and classification of tuberculosis (TB) in children.Adjusted by the authors from their previous work.14
HIV: human immunodeficiency virus; TST: tuberculin skin test; IGRA: interferon-gamma release assay.aNeither of the immune-based tests (TST/IGRA) can ‘rule out’ TB disease with confidence and conversion may be delayed for 2–3months after documented exposure. All children aged,5 years and any child with current symptoms should receive a chest X-ray.Diagnostic labels1No TB exposure or infection.2TB exposure/infection with low risk of progression to disease.3TB exposure/infection with high risk of progression to disease.4Not TB disease.5TB disease.
Diagnosis, treatment and prevention of tuberculosis in children
Vol. 24(1) 2013 NSW Public Health Bulletin | 17

and neither the purified protein derivative tuberculin skin
test (TST) or interferon-gamma release assays (IGRAs)
(e.g. QuantiFERON-Gold In Tube�) offer a simple
solution.25 IGRAs do not replace TSTs for the detection
of M. tuberculosis infection in children and, like TSTs,
cannot be used to exclude TB. In certain clinical situations
IGRAs may be used in addition to TSTs to improve
sensitivity and specificity in the detection of TB infection.25
Smear microscopy has poor sensitivity in young children,
most ofwhom are paucibacillary and unable to expectorate;
it has been largely superseded by culture and nucleic acid
amplification tests (NAATs). In general, culture yields in
children are lower than in adults, depending on the severity
of disease as well as the quality, quantity and types of
specimens collected. Two studies have evaluated the per-
formance of the rapid NAAT-based Xpert� MTB/RIF
assay in children, demonstrating similar performance char-
acteristics to adult studies, with excellent specificity and
detection of around 70% of culture-positive cases.26,27
Collecting adequate respiratory specimens in young chil-
dren is problematic, but gastric aspirates, induced sputum
(with or without laryngopharyngeal suction) and broncho-
alveolar lavage (in select patients) offer feasible
alternatives. A combination of specimens provides the
best yield.28 Fine-needle aspiration biopsy has excellent
utility in children with a peripheral lymph node mass.29
With tuberculous meningitis, slow clinical onset, cerebro-
spinal fluid pleocytosis (with total cell count ,500) and
elevated protein is highly suggestive.30 Despite the chal-
lenges discussed, bacteriological confirmation should
always be attempted, although it should not delay treat-
ment initiation in young and vulnerable children. TB can
be diagnosed with relative certainty based on a combina-
tion of clinical, radiological, laboratory and histopatholog-
ical (when feasible) findings consistent with TB disease, in
association with epidemiological factors and/or immuno-
logical evidence of M. tuberculosis infection.
TreatmentIf a diagnosis of TB disease is established, pragmatic
disease classification guides management and facilitates
case comparison. From a treatment perspective, likely
bacillary load, anatomical location and the possibility
of drug resistance are the most important variables to
consider. If high bacillary loads are anticipated, the use
of multiple drugs during the intensive phase of treatment
reduces the risk of acquired drug resistance. Consideration
Table 2. Summary of investigations to diagnose tuberculosis (TB) in children
Investigation Uses Strengths (S) and limitations (L)
Microbiological studies (detection of Mycobacterium tuberculosis)
Microscopy Diagnosis of TB S: Specificity high; useful in all specimen types; rapid (,1 hour) detection;
low cost (fluorescence microscopy most cost effective).
L: Sensitivity very low, especially in young children; highly operator-dependent;
labour intensive; unable to speciate or distinguish viable and dead bacilli.
Growth on special
media
– Diagnosis of TB
– Species identification
Drug susceptibility
testing
S: Specificity high.
L: Sensitivity low in young children; slow turnaround time.
DNA detection S: Specificity high; fully automated platforms; rapid turnaround.
L: Sensitivity low in young children; cannot distinguish viable from dead bacilli;
quality control essential.
Histopathological studies
Stained tissue samples Diagnosis of TB S: Allows exclusion of other diagnoses (such as malignancy).
Immune-based studies
TST
IGRAs
Identification of
M. tuberculosis
infection
L: Neither test can differentiate M. tuberculosis infection from active disease.
L: TST: affected by BCG vaccination; requires a second visit after 48–72 hours.
S: IGRAs: unaffected by BCG vaccination; requires a single visit.
L: Low sensitivity in very young and/or immunocompromised children;
indeterminate results problematic.
Imaging
Radiography
CT and MRI
Ultrasonography
Diagnosis of TB Chest radiography (frontal and lateral views) most helpful; CT or MRI useful
in uncertain or complicated cases; ultrasonography useful to identify
intra-abdominal/retro-peritoneal lymphadenopathy or pleural/pericardial
effusions.
L: Ultrasonography highly operator-dependent.
BCG: Bacille Calmette-Guerin; CT: computed tomography; IGRAs: interferon-gamma release assays; MRI: magnetic resonance imaging; TST:
tuberculin skin test.
18 | Vol. 24(1) 2013 NSW Public Health Bulletin

should also be given to the possible involvement of
‘sanctuary sites’ such as the brain and cerebrospinal fluid
(CSF), since drugs have highly variable CSF penetration.31
High and/or rising rates of drug-resistant TB, documented
in many countries within the Asia-Pacific region, Eastern
Europe and sub-Saharan Africa,2 make it necessary for
clinicians to carefully scrutinise patients who resided in,
or travelled through, these countries. The possibility of
Table 3. Summary of first-line tuberculosis (TB) drugs and dosage recommendations for children
First-line
drugs
Mode and mechanism of action Main adverse effectsa Daily dose mg/kg(range)b [maximumdose]c
Isoniazid Bactericidal
� Inhibits cell wall synthesis
� Most potent early bactericidal activity offering
the best protection to companion drugs
� Contributes mainly by rapidly killing actively
metabolising extracellular bacilli; contributes to
sterilisation if given for a prolonged period
Hepatitis; peripheral
neuropathy
10 (7–15)d [300mg]
Rifampicin Bactericidal and sterilising
� Inhibits ribonucleic acid synthesis
� Contributes by killing extracellular and slower
growing intracellular bacilli; important contribution
to sterilisation
Hepatitis; orange
discolouration of
secretions; drug-drug
interactions
15 (10–20) [600mg]
Pyrazinamide Sterilising
� Disrupts energy metabolism
� Contributes by specifically killing bacilli that persist
within the acidic centres of caseating granulomas
Hepatitis; arthralgia 35 (30–40) [2000mg]
Ethambutol Bacteriostatic
� Inhibits cell wall synthesis
� Contributes mainly by offering some additional
protection against drug-resistant mutants
Visual disturbance (acuity,
colour vision)
20 (15–25) [1200mg]
Suggested treatment regimens
Disease category Treatment regimen Rationale
Uncomplicated intra-
thoracic disease
Isoniazid, rifampicin and pyrazinamide
(2-month intensive phase)
Isoniazid and rifampicin (4/12 continuation phase)
Organism load low, drug penetration
good
Extensive lung infiltrates
and/or cavities
Add ethambutol during 2-month intensive phase Organism load high, drug penetration
good
Tuberculous meningitis Add fourth drug, at least during 2-month
intensive phase
Add steroids for 1 monthe
Organism load low, drug penetration
variable, risk of severe immune-
mediated sequelae
Severe airway compression Three or four drug regimen depending on extent
of lung infiltration/cavities
Consider adding steroids for 1 month
Organism and drug penetration variable,f
inflammation may worsen airway
compression
Recent exposure/infection
No active disease
Preventive therapy
Isoniazid (6–9 months)
Isoniazid, rifampicin (3 months)
Organism load very low, drug penetration
good
Adjusted by the authors from their previous work.14
aHypersensitivity reactions and drug rashes may occur with any drug.bMost recent World Health Organization dosage recommendations for children,37 except where indicated.cMaximum doses from Australian Therapeutic Guidelines.38
dRange from additional reference.39
eRecommendations around fourth drug and duration of therapy vary;WHOadvise isoniazid, rifampicin, pyrazinamide and ethambutol for 2months
followed by 10 months isoniazid and rifampicin.fDrug penetration into large cold abcesses may be limited, requiring surgical drainage.
Diagnosis, treatment and prevention of tuberculosis in children
Vol. 24(1) 2013 NSW Public Health Bulletin | 19

drug-resistant TB should be suspected following close
contact with a drug-resistant source case; in residents of
countries known to have a high prevalence of drug-
resistant TB; or following contact with someone who died
on TB treatment, is poorly adherent to therapy, or required
more than one treatment course.
TB treatment aims to ensure long-term cure without
serious adverse effects for the patient. From a public health
perspective it is important to terminate transmission and
prevent the emergence of drug resistance. Table 3 sum-
marises the mode of action, main adverse effects and
recommended dosages of first-line TB drugs, including
dosage recommendations for children; sub-optimal drug
levels result from using weight-adjusted adult doses.
In the absence of drug resistance, the most likely cause of
poor treatment response is non-adherence. If a child pre-
sents with a TB recurrence more than 6–12 months after
treatment completion and clinical cure, it most likely
represents re-infection. Standard first-line treatment would
be appropriate (in the absence of risk factors for drug-
resistant disease); there is no indication to use an escalated
re-treatment regimen. With poor response to adherent
therapy, careful re-evaluation of the original diagnosis
and assessment for drug resistance is warranted. In NSW,
all positive cultures undergo drug susceptibility testing,
which provides additional motivation to achieve bacterio-
logical confirmation. With drug-resistant TB, the basic
principles of management are unchanged and excellent
outcomes can be achieved.32 All children diagnosed with
TB should be tested for HIV infection; management of
co-infected children has been recently reviewed.33
PreventionPrevention strategies include vaccination, pre- and post-
exposure prophylaxis, treatment of ‘latent’ infection, and
secondary prophylaxis (provided after completion of TB
treatment). Bacille Calmette-Guerin (BCG) vaccination
reduces the risk of disseminated (miliary) disease and
tuberculous meningitis in very young children but protec-
tion is incomplete and it offers no consistent protection
against adult-type TB.34 It is not included in routine
vaccination schedules in Australia, however, it should be
considered when vulnerable children (e.g. aged less than
2 years) are exposed to a high-risk environment, such as
visiting a TB endemic country. Research to develop novel
vaccines with improved efficacy and safety is ongoing.
Careful risk stratification identifies those at greatest need
of preventive therapy following TB exposure. The target
population for preventive therapy provision may vary in
different settings depending on feasibility and available
resources, but all young (aged less than 5 years) and/or
immunocompromised children should receive preventive
therapy following documented exposure/infection.19 With
good adherence and in the absence of drug resistance,
isoniazid monotherapy provides excellent protection fol-
lowing documented exposure/infection. However, parents
are often reluctant to provide ‘treatment’ to an otherwise
well child and ensuring good adherence is challenging.
Treatment with isoniazid and rifampicin for 3 months has
demonstrated equivalent efficacy and improved adherence
compared to 9 months of treatment with isoniazid alone,
with no increase in adverse events.35 Twelve doses of
weekly rifapentine and isoniazid proved efficacious in a
recent adult study,36 but this regimen cannot yet be
recommended in children aged less than 12 years until
more safety and efficacy data are available. In HIV-
infected children on antiretroviral therapy, drug-drug
interactions should be considered with all rifamycin-
containing regimens.33
ConclusionChildren suffer a huge but under-recognised TB disease
burden in endemic countries from which Australia con-
tinues to receive immigrants. Multiple challenges remain:
to develop more effective vaccines, better diagnostics and
shorter treatment regimens. However, it is worth empha-
sising that most children would be served well by the
sensible application of existing tools.
References1. Marais BJ, Gupta A, Starke JR, El Sony A. Tuberculosis in
women and children. Lancet 2010; 375: 2057–9. doi:10.1016/
S0140-6736(10)60579-X
2. World Health Organization. Global tuberculosis report 2012.
Geneva: World Health Organization; 2012.
3. Raviglione M, Marais B, Floyd K, Lonnwroth K, Getahun H,
Migliori GB et al. Scaling up interventions to achieve global
tuberculosis control: progress and new developments. Lancet
2012; 379: 1902–13. doi:10.1016/S0140-6736(12)60727-2
4. Barry C, Waring J, Stapledon R, Konstantinos A; National
Tuberculosis Advisory Committee, for the Communicable
Diseases Network Australia. Tuberculosis notifications in
Australia, 2008 and 2009. Commun Dis Intell 2012; 36(1):
82–94.
5. Merritt TD, Sintchenko V, Jelfs P, Worthing M, Robinson B,
Durrheim DN et al. An outbreak of pulmonary tuberculosis in
young Australians. Med J Aust 2007; 186(5): 240–2.
6. Roberts-Witteveen AR, Christensen A, McAnulty JM.
EpiReview: Tuberculosis in NSW, 2008. N S W Public Health
Bull 2010; 21(7–8): 174–82. doi:10.1071/NB10005
7. Menzies HJ,Winston CA, Holtz TH, Cain KP,Mac KenzieWR.
Epidemiology of tuberculosis among US- and foreign-born
children and adolescents in the United States, 1994-2007.
Am J Public Health 2010; 100(9): 1724–9. doi:10.2105/
AJPH.2009.181289
8. Sandgren A, Hollo V, Quinten C, Manissero D. Childhood
tuberculosis in the European Union/European Economic Area,
2000 to 2009. Euro Surveill 2011; 16(12): 19825.
9. TebrueggeM, Ritz N, Connell T, Curtis N. A 2-year old girl with
fever, cough, and tachypnoea. BMJ 2009; 338: b1210.
doi:10.1136/bmj.b1210
20 | Vol. 24(1) 2013 NSW Public Health Bulletin

10. Patradoon-Ho PS, Ambler RW. Universal post-arrival screening
for child refugees in Australia: isn’t it time? J Paediatr Child
Health 2012; 48(2): 99–102. doi:10.1111/j.1440-
1754.2010.01869.x
11. Ritz N, Connell TG, Tebruegge M, Johnstone BR, Curtis N.
Tuberculous dactylitis—an easily missed diagnosis. Eur J Clin
Microbiol Infect Dis 2011; 30(11): 1303–10. doi:10.1007/
s10096-011-1239-5
12. Thoo CH, Graf N, Hogan P. Erythema induratum in a Kenyan
child. Australas J Dermatol 2008; 49(3): 156–8. doi:10.1111/
j.1440-0960.2008.00455.x
13. Blyth C, Waring J, Burgner D. Inconspicuous consumption:
disseminated tuberculosis following untreated latent infection.
J Paediatr Child Health 2004; 40(4): 227–9. doi:10.1111/
j.1440-1754.2004.00343.x
14. Perez-Velez CM, Marais BJ. Tuberculosis in children. N Engl J
Med 2012; 367: 348–61. doi:10.1056/NEJMra1008049
15. Marais BJ, Gie RP, Schaaf HS, Hesseling AC, Obihara CC,
Starke JJ et al. The natural history of childhood intra-thoracic
tuberculosis: a critical review of the pre-chemotherapy
literature. Int J Tuberc Lung Dis 2004; 8(4): 392–402.
16. Donald PR,Marais BJ, Barry CE, 3rd. Age and the epidemiology
and pathogenesis of tuberculosis. Lancet 2010; 375: 1852–4.
doi:10.1016/S0140-6736(10)60580-6
17. Curtis AB, Ridzon R, Vogel R, McDonough S, Hargreaves J,
Ferry J et al. Extensive transmission of Mycobacterium
tuberculosis from a child. N Engl J Med 1999; 341: 1491–5.
doi:10.1056/NEJM199911113412002
18. Marais BJ, Gie RP, Hesseling AC, Schaaf HS, Enarson DA,
Beyers N. Radiographic signs and symptoms in children
treated for tuberculosis: possible implications for symptom-
based screening in resource-limited settings. Pediatr Infect
Dis J 2006; 25(3): 237–40. doi:10.1097/01.
inf.0000202140.76368.74
19. World Health Organization. Guidance for national tuberculosis
programmes on the management of tuberculosis in children.
Geneva: World Health Organization; 2006.
20. Marais BJ, Gie RP, Hesseling AC, Schaaf HS, Lombard C,
Enarson DA et al. A refined symptom-based approach to
diagnose pulmonary tuberculosis in children. Pediatrics 2006;
118(5): e1350–9. doi:10.1542/peds.2006-0519
21. Marais BJ, Gie RP, Schaaf HS, Starke JR, Hesseling AC, Donald
PR et al. A proposed radiological classification of childhood
intra-thoracic tuberculosis. Pediatr Radiol 2004; 34(11):
886–94. doi:10.1007/s00247-004-1238-0
22. Gie RP. Diagnostic atlas of intrathoracic tuberculosis in
children: a guide for low-income countries. Paris: International
Union Against Tuberculosis and Lung Disease; 2003. Available
at: http://www.theunion.org/index.php/en/resources/technical-
publications/item/110-diagnostic-atlas-of-intrathoracic-
tuberculosis-in-children (Cited 25 July 2012).
23. Andronikou S, van Hoenacker FM, de Backer AI. Advances in
imaging chest tuberculosis: blurring of differences between
children and adults. Clin Chest Med 2009; 30: 717–44.
doi:10.1016/j.ccm.2009.08.022
24. Pienaar M, Andronikou S, van Toorn R. MRI to demonstrate
diagnostic features and complications of TBM not seen with CT.
Childs Nerv Syst 2009; 25(8): 941–7. doi:10.1007/s00381-
008-0785-3
25. National Tuberculosis Advisory Committee. Position statement
on interferon-gamma release assays in the detection of latent
tuberculosis infection. Commun Dis Intell 2012; 36(1): 125–31.
26. NicolMP,Workman L, IsaacsW,Munro J, Black F, Eley B et al.
Accuracy of the Xpert MTB/RIF test for the diagnosis of
pulmonary tuberculosis in children admitted to hospital in Cape
Town, South Africa: a descriptive study. Lancet Infect Dis 2011;
11(11): 819–24. doi:10.1016/S1473-3099(11)70167-0
27. Rachow A, Clowes P, Saathoff E, Mtafya B, Michael E,
Ntinginya EN et al. Increased and expedited case detection by
Xpert MTB/RIF assay in childhood tuberculosis: a prospective
cohort study. Clin Infect Dis 2012; 54(10): 1388–96.
doi:10.1093/cid/cis190
28. NicolMP, ZarHJ. New specimens and laboratory diagnostics for
childhood pulmonary TB: progress and prospects. Paediatr
Respir Rev 2011; 12(1): 16–21. doi:10.1016/j.prrv.2010.09.008
29. Wright CA, Warren RW, Marais BJ. Fine needle aspiration
biopsy: an undervalued diagnostic modality in paediatric
mycobacterial disease. Int J Tuberc Lung Dis 2009; 13(12):
1467–75.
30. Marais S, Thwaites G, Schoeman JF, Torok ME, Misra UK,
Prasad K et al. Tuberculous meningitis: defining a uniform case
definition for use in clinical research. Lancet Infect Dis 2010;
10(11): 803–12. doi:10.1016/S1473-3099(10)70138-9
31. Donald PR. The chemotherapy of tuberculous meningitis in
children and adults. Tuberculosis (Edinb) 2010; 90(6): 375–92.
doi:10.1016/j.tube.2010.07.003
32. Seddon JA, Furin JJ, GaleM, Del Castillo Barrientos H, Hurtado
RM, Amanullah F et al. Caring for children with drug-resistant
tuberculosis: practice-based recommendations. Am J Respir Crit
Care Med 2012; 186(10): 953–64. doi:10.1164/rccm.201206-
1001CI
33. Marais BJ, Rabie H, Cotton MF. TB and HIV in children –
advances in prevention and management. Paediatr Respir Rev
2011; 12(1): 39–45. doi:10.1016/j.prrv.2010.09.002
34. TrunzBB,FineP,DyeC.Effect ofBCGvaccination onchildhood
tuberculous meningitis and miliary tuberculosis worldwide:
a meta-analysis and assessment of cost-effectiveness. Lancet
2006; 367: 1173–80. doi:10.1016/S0140-6736(06)68507-3
35. Spyridis NP, Spyridis PG, Gelesme A, Sypsa V, Valianatou M,
Metsou F et al. The effectiveness of a 9-month regimen of
isoniazid alone versus 3- and 4-month regimens of isoniazid
plus rifampin for treatment of latent tuberculosis infection in
children: results of an 11-year randomized study. Clin Infect Dis
2007; 45(6): 715–22. doi:10.1086/520983
36. Sterling TR, Villarino ME, Borisov AS, Shang N, Gordin F,
Bliven-Sizemore E et al. Three months of rifapentine and
isoniazid for latent tuberculosis infection. N Engl J Med 2011;
365(23): 2155–66. doi:10.1056/NEJMoa1104875
37. Detjen AK, Mace C, Perrin C, Graham SM, Grzemska M.
Adoption of revised dosage recommendations for childhood
tuberculosis in countries with different childhood tuberculosis
burdens. Public Health Action 2012; 2(4): 126–32. doi:10.5588/
pha.12.0052
38. Antibiotic Expert Group. Therapeutic guidelines: antibiotic.
Version 14. Melbourne: Therapeutic Guidelines Limited; 2010.
39. Marais BJ, Graham SM, Maeurer M, Zumla A. Progress,
challenges and concepts from childhood tuberculosis. Lancet
(in press).
Diagnosis, treatment and prevention of tuberculosis in children
Vol. 24(1) 2013 NSW Public Health Bulletin | 21

Tuberculosis: an old world disease providingnew world challenges in NSW
Guy B. MarksA,E, Amanda ChristensenB,
Vitali SintchenkoC,D and Chris LowbridgeB
ADepartment of Respiratory Medicine, Liverpool HospitalBHealth Protection NSWCCentre for Infectious Diseases and Microbiology,Westmead Hospital
DSydney Institute for Emerging Infectious Diseasesand Biosecurity, The University of Sydney
ECorresponding author. Email: [email protected]
Tuberculosis (TB) is a complex, difficult disease from
both public health and clinical perspectives. Problems are
the norm, rather than the exception.The NSW TB Control
Program consists of a network of highly experienced
physicians, nurses, laboratory and public health person-
nel, working closely to manage this ongoing threat to
public health. The following four case studies present
issues encountered in managing TB in New South Wales
(NSW).
In the first example, Michail draws our attention to the
challenges of adverse drug reactions in the management
of TB. Early detection, which requires vigilance and
judicious monitoring, is critical for reducing the risk of
harm. The serious nature of TB, the limited range of
effective drugs available and the difficulty in identifying
a single causative drug from a multi-drug regimen means
that permanent drug cessation or replacement is not a
simple option in most cases. Careful consideration is
required in deciding if, when and how to re-introduce
drugs after suspected adverse drug reactions. While
published guidelines offer some assistance, there is enor-
mous variation in the clinical circumstances surrounding
each case. Hence, clinical experience and judgment is
required. Sometimes the combined experience of several
clinicians, gathered by informal consultation or by way of
clinical case conferences, is needed to reach decisions on
more complex cases. Michail’s article highlights the
importance of specialised clinical management of TB to
optimise patient safety.
Experience, expertise and judgment are all relevant to
public health, as well as the clinical management of TB,
as highlighted in the two examples by Banner and Fisher
et al. In the public arena, TB remains an emotive and
poorly understood disease. Fear, anxiety, distrust and
suspicion are easily aroused when people are informed
they may have had contact with people with TB. On the
other hand, failure to detect and treat latent TB infection
(LTBI) in contacts of people with TB may result in
avoidable cases of TB occuring in those contacts; this
may have disastrous consequences if those contacts are
young children or infants. Good management is complex
and requires balancing the public’s right to know with the
patient’s right to privacy, and the need to protect those at
risk with the need to avoid spreading alarm by unneces-
sary screening. We have imperfect tools for estimating
risk in this context and much of the difficulty in manag-
ing TB contact investigations arises from the need to
make decisions in the presence of substantial uncertainty.
For example, the lack of specificity of tests for LTBI
means that testing patients at very low risk for LTBI,
either by tuberculin skin test or by interferon-gamma
release assay, will identify many false positive cases,
causing false alarm and, possibly, the initiation of an
unnecessary course of treatment. This highlights the
importance of carefully selecting those to be screened
for LTBI. The episodes reported here draw attention to
the importance of pooling our statewide experience in
managing complex public health problems in TB care and
applying a considered and protocol-driven approach to
management.
Vogelnest’s report on TB in animals reminds us that, no
matter how much we think we know collectively, we
should always expect the unexpected in managing TB.
While humanTBmainly affects humans, other animals can
be infected (usually by humans) and can be a source of
infection for other animals and humans. Fortunately no
cases of active TB in humans have arisen from the recent
cases at an Australian zoo.1
The outcomes of the NSW TB Control Program have
been good for many years. The incidence of the disease is
low, deaths are uncommon,2 local transmission is limited3
and relapse after treatment is very rare.4 Despite these
positive outcomes the following case studies demonstrate
that there is no room for complacency. The complex and
unpredictable nature of TB means that we must retain
vigilance, programmatic management, and our collective
clinical and public health expertise, to ensure that the
gains of the last 20 years are consolidated and that further
progress is made.
22 | Vol. 24(1) 2013 NSW Public Health Bulletin 10.1071/NB13007

References1. Stephens N, Vogelnest L, Lowbridge C, Christensen A,
Marks GB, Sintchenko V et al. Transmission ofMycobacterium
tuberculosis from an Asian elephant (Elephas maximus) to
a chimpanzee (Pan troglodytes) and humans in an Australian
zoo. Epidemiol Infect 2013; 141(7): 1488–97.
2. Lowbridge C, Christensen AJ, McAnulty JM. EpiReview:
Tuberculosis in NSW, 2009–2011. N S W Public Health Bull
2013; 24(1): 3–9.
3. Gallego B, Sintchenko V, Jelfs P, Coiera E, Gilbert GL.
Three-year longitudinal study of genotypes of Mycobacterium
tuberculosis in a low prevalence population. Pathology 2010;
42(3): 267–72. doi:10.3109/00313021003631346
4. Dobler CC, Crawford ABH, Jelfs PJ, Gilbert GL, Marks GB.
Recurrence of tuberculosis in a low incidence setting. Eur
Respir J 2009; 33(1): 160–7. doi:10.1183/09031936.00104108
Tuberculosis: an old world disease providing new world challenges in NSW
Vol. 24(1) 2013 NSW Public Health Bulletin | 23
Monitoring for adverse events amongpatients on tuberculosis therapy
David Michail
Department of Respiratory and Sleep Medicine, WestmeadHospital and Blacktown HospitalParramatta Chest Clinic
Tuberculosis (TB) continues to be a significant public
health problem in New South Wales (NSW) with 512 case
notifications in 2011.1 The NSW Health Policy Directive
on the management of people with TB in NSW states:
The aim of the NSW Department of Health TB Program
is to minimise the burden of TB and to prevent the
transmission of TB through early detection and appro-
priate treatment of people with TB. Patients with
suspected TB should be referred for management in
an Area Health Service (AHS) TB Prevention and
Control Service – Chest Clinic.2
In Australia, patients with diagnosed or clinically sus-
pected TB are treated under the guidance of a specialist
with training in TB management. Standard therapy for TB
follows international and Australian guidelines and tradi-
tionally involves an intensive phase of drug therapy
followed by a continuation phase. The majority of
treatment – with only rare exceptions – is administered
by directly observed therapy (DOT) to aidwith compliance
and completion of therapy.2–4 The overall goals of treat-
ment are to cure the patient and to minimise the risk of
transmission to others.
Side effects and adverse reactions to anti-TB therapy
are not uncommon and can be serious and even life-
threatening when they do occur. While various definitions
of adverse drug reactions (ADRs) exist a comprehensive
definition is:
An appreciably harmful or unpleasant reaction, result-
ing from an intervention related to the use of a medici-
nal product, which predicts hazard from future
administration and warrants prevention or specific
treatment, or alteration of the dosage regimen, or
withdrawal of the product.5
Most medications used in standard anti-TB regimens were
developed decades ago, and standard treatment regimens
carry a risk of up to 30% for significant ADRs developing
in the intensive phase of treatment.6 Other studies have
reported fewer incidences.7–9 A significant ADR is one
that necessitates interruption of therapy. The most
commonly noted include hepatotoxicity and fulminant
liver failure, peripheral neuropathy, rash, and visual dis-
turbance, amongst others.6 Systems aimed at rapid identi-
fication of potential ADRs may be able to minimise their
impact on morbidity and mortality and improve tolerance
and successful completion of anti-TB therapy.
Early identification of ADRs that occur during the course
of therapy for TB requires:
• a thorough knowledge of reported adverse reactions
associated with specific drugs
• awareness of clinical situations, including co-morbidity
and co-administration of other drugs, that increase a
given individual’s risk10 (individuals who have HIV
co-infection and are on antiretroviral therapy are one
important high-risk group)
• careful surveillance for the early manifestations of
ADRs (which, in turn, requires vigilance on the part of
both patients and health care workers).
Although there are no standard guidelines for surveillance
regimens, there is widespread agreement on some elements
that are standard practice at the Parramatta Chest Clinic,
Sydney, Australia, which provides services for Western
Sydney residents, including patients of Westmead and
Blacktown Hospitals.
General principles of monitoring• Appropriate prescriber and health care provider educa-
tion regarding common and less common side effects of
frequently prescribed TB medications.
• Thorough baseline assessment of individual risk,
including appropriate blood tests, and review of
co-morbidities, medication and lifestyle factors.
• Detailed patient education and pre-treatment counsel-
ling, including written information (in the patient’s
native language where possible) regarding symptoms
or signs tomonitor, and appropriate health care provider
contact details and/or management plan in case of
development of symptoms or signs.
• Checklist of symptoms to be completed at interaction
between health care provider and patient during therapy
administration at DOT visits. The practice of DOT gives
a scheduled frequent interaction between the health care
provider and the patient that should facilitate frequent
symptom review and early identification of any poten-
tial problems.
• Periodic TB specialist consultation for symptom review
and examination.
24 | Vol. 24(1) 2013 NSW Public Health Bulletin 10.1071/NB12111

• Appropriate use of repeat blood testing, either sched-
uled or for further assessment of symptoms.11
• Periodic ophthalmic review either through a local Eye
Clinic or by appropriately trained TB Clinic staff.
Management of ADRs during therapy for TB requires
specialist knowledge. It frequently involves discontinua-
tion of one or all TB medications, as well as supportive
management until the ADR has resolved. Decisions on the
timely reintroduction of appropriate therapy and the need
to increase the duration of therapy to compensate for
treatment interruptions are challenges that face treating
physicians.
Management of adverse drug reactionsHepatotoxicity is a particularly concerning and difficult to
manage complication of TB therapy. Any one of, or a
combination of, isoniazid, rifampicin and pyrazinamide
(three of the four first-line drugs)may cause hepatotoxicity.
Hepatotoxicitymay be identified as a result of presentation
with abnormal symptoms and/or signs (anorexia, nausea,
vomiting, abdominal discomfort, right upper quadrant
tenderness or jaundice) or by routine surveillance blood
tests. Management practice at the Parramatta Chest Clinic
varies between the following two scenarios:12–14
• Asymptomatic patients with an increase in serum trans-
aminases from baseline – if the increase in transami-
nases is ,5-fold over normal baseline value, continue
the current regimen, monitor for development of symp-
toms of liver dysfunction, and continue to periodically
check liver function tests (minimum recommended
frequency at least weekly). If the transaminases increase
.5-fold over normal baseline normal value, cease all
medications
• Symptomatic patients – withhold all drugs and measure
liver function and coagulation status immediately. If
transaminases are elevated .3-fold over normal base-
line values, continue to withhold all drugs until symp-
toms resolve and transaminases decrease to ,2-fold
above normal, then re-introduce medications under
specialist guidance.
For other severe ADRs, the following practices are used at
the Parramatta Chest Clinic:
• full assessment of the patient by a member of the Chest
Clinic or Respiratory Department medical/nursing staff
as soon as possible, including comprehensive examina-
tion and blood testing
• immediate cessation of all anti-TB drugs
• review of other non-TB medications that may be con-
tributing, or medications requiring dose adjustment in
liver failure (if the drug reaction has caused
hepatotoxicity)
• supportive care as required
• consideration of admission to hospital if indicated.
Once a patient has recovered from the drug reaction,
reintroduction of therapy is undertaken under the guidance
of a TB specialist.
ConclusionTB remains a significant public health problem in NSW.
With rapid identification of active cases and appropriate
therapy under the guidance of a team well trained in the
management of TB patients, successful therapy with mini-
misation of risk of adverse reactions can be achieved.
Thorough knowledge of potential symptoms and signs of
drug reactions, as well as frequent nurse and physician-
initiated surveillance, are key.
References1. Lowbridge C, Christensen AJ, McAnulty JM. EpiReview:
Tuberculosis in NSW, 2009–2011. N S W Public Health Bull
2013; 24(1): 3–9.
2. NSW Health. Tuberculosis – Principles for Management of
people with Tuberculosis in NSW. Policy Directive
PD2008_019. Available at: http://www0.health.nsw.gov.au/
policies/pd/2008/pdf/PD2008_019.pdf (Cited 4 February 2013).
3. Tekle B, Mariam DH, Ali A. Defaulting from DOTS and its
determinants in three districts of Arsizone in Ethiopia. Int J
Tuberc Lung Dis 2002; 6: 573–9.
4. Fry RS, Khoshnood K, Vdovichenko E, Granskaya J, Sazhin V,
Shpakovskaya L et al. Barriers to completion of tuberculosis
treatment among prisoners in St. Petersburg, Russia. Int J Tuberc
Lung Dis 2005; 9: 1027–33.
5. Edwards IR, Aronson JK. Adverse drug reactions: definitions,
diagnosis, and management. Lancet 2000; 356: 1255–9.
doi:10.1016/S0140-6736(00)02799-9
6. Marra F, Marra CA, Bruchet N, Richardson K, Moadebi S,
Elwood RK et al. Adverse drug reactions associated with first-
line anti-tuberculosis drug regimens. Int J Tuberc Lung Dis
2007; 11(8): 868–75.
7. Schaberg T, Rebham K, Lode H. Risk factors for side-effects of
isoniazid, rifampicin and pyrazinamide in patients hospitalized
for pulmonary tuberculosis. Eur Respir J 1996; 9: 2026–30.
doi:10.1183/09031936.96.09102026
8. Zierski M, Bek E. Side-effects of drug regimens used in short-
course regimens chemotherapy for pulmonary tuberculosis.
A controlled clinical study. Tubercle 1980; 61(1): 41–9.
doi:10.1016/0041-3879(80)90060-4
9. Yee D, Valiquette C, Pelletier M, Parisien I, Rocher I,
Menzies D. Incidence of serious side effects from first-line
antituberculosis drugs among patients treated for active tuber-
culosis. Am J Respir Crit Care Med 2003; 167(11): 1472–7.
doi:10.1164/rccm.200206-626OC
10. Sharma SK, Balamurugan A, Saha PK, Pandey RM, Mehra NK.
Evaluation of clinical and immunogenetic risk factors for the
development of hepatotoxicity during anti-tuberculosis treat-
ment. Am J Respir Crit Care Med 2002; 166: 916–9.
doi:10.1164/rccm.2108091
11. Durand F, Jebrak G, Pessayre D, Fournier M, Bernuau J.
Hepatotoxcity of antitubercular drugs. Rationale for monitoring
Monitoring for adverse events among patients on tuberculosis therapy
Vol. 24(1) 2013 NSW Public Health Bulletin | 25

liver status. Drug Saf 1996; 15(6): 394–405. doi:10.2165/
00002018-199615060-00004
12. BlumbergHM,BurmanWJ, ChaissonRE,DaleyCL, Etkind SC,
Friedman LN et al. American Thoracic Society/Centers for
Disease Control and Prevention/Infectious Diseases Society of
America: Treatment of tuberculosis. Am J Respir Crit Care Med
2003; 167(4): 603–62. doi:10.1164/rccm.167.4.603
13. Saukkonen JJ, Cohn DL, Jasmer RM, Schenker S, Jereb JA,
Nolan CM et al. An official ATS statement: hepatotoxicity of
anti-tuberculous therapy. Am J Respir Crit Care Med 2006; 174:
935–52. doi:10.1164/rccm.200510-1666ST
14. Hopewell PC, Pai M, Maher D, Uplekar M, Raviglione MC.
International standards for tuberculosis care. Lancet Infect Dis
2006; 6(11): 710–25. doi:10.1016/S1473-3099(06)70628-4
26 | Vol. 24(1) 2013 NSW Public Health Bulletin
Tuberculosis contact tracing within a schoolenvironment: lessons for the future
Pam Banner
NSW Tuberculosis Program
Contact tracing plays a large role in the everyday work of
chest clinics in NSW. It is a routine procedure that follows
the ‘concentric circle’ method of screening. When a chest
clinic becomes aware of a confirmed case of tuberculosis
(TB), the inner ring of the circle (which comprises those
with the highest risk of infection, including family and
others in close contact with the index case) are screened
first. If infection is detected in this group, screening
proceeds to the medium-risk group and then, if necessary,
to low-risk contacts, until no new infections are found.
When explained, this method is usually readily understood
and accepted by contacts. However, screening can become
disrupted when contacts and others become fearful.
This paper highlights the case of a complex school screen-
ing which involved both screening all rings of the concen-
tric circle (i.e. high, medium and low-risk contacts) and
screening outside the circle (i.e. non-contacts).
In 2007 an overseas-born casual infants/primary school
teacher in NSWwas diagnosedwith infectious cavitary TB
disease by sputum smear, culture and chest X-ray. She had
originally been diagnosedwith pneumonia andwas on sick
leave for 1 month. One hour into the second day of her
return to work, she had a massive haemoptysis (coughing
up of blood) and was hospitalised.
Her household contacts were an overseas-born husband
who was tuberculin skin test (TST) positive with a clear
chest X-ray, and an Australian-born child who was TST
negative. No other contacts were provided to the TB
Coordinator at the Chest Clinic. Because of the teacher’s
smear and chest X-ray results, the TB Coordinator con-
sulted with the then NSW Department of Health and local
Public Health Unit (local units which work to identify,
prevent andminimise public health risks to the community).
Following this consultation, it was agreed to notify the
school.
The school executive identified 160 children and staff the
teacher had the closest contact with; they were included in
the high-risk, first screening circle. A letter to parents, TB
information, and a screening consent form were sent home
with the identified children. The TB Coordinator gave an
information session to staff, which was open to any
concerned parents. It was decided that case management
and screening would be performed at the school.
Initial screening identified one teacher and one child as
infected. However, at follow-up screening of this group a
few months later, 14 students, five teachers and the
teacher’s child returned positive TSTs. All had clear chest
X-rays and were offered preventive treatment through the
Chest Clinic.
The Public Health Unit Director and TB Coordinator
attended further meetings at the school. An information
evening for parents was discussed but, at this time, the
school executive declined. A further 40 medium-risk
(second circle) students and teachers were then identified
and screened, with another two students found to be
infected.
As children began preventive treatment a rumour spread
that there was an outbreak of TB at the school. Parents
arriving at school were approached by media reporters.
Screening was demanded by some parents whose children
had never been in any of the teacher’s classes.
An expert panel was convened to discuss the issue.
Decisions were made to screen a low-risk group of a
further 60 students and staff (the third circle); hold a parent
information evening; release a statement to themedia; send
a letter to all local general practitioners (GPs) to inform
them of the situation; and hold a meeting for GPs. Screen-
ing of this low-risk group found only one child infected.
Eighteen non-contacts outside the circles were also
screened at the request of parents, with no infected children
found.
The TB Coordinator, along with representatives from the
school, Public Health Unit and media representatives from
the Local Health District (LHD), held a successful infor-
mation evening for parents. It was stressed that there were
no new cases of TB, was no ongoing risk of infection, those
infected cannot spread TB to others and that 90% of people
infected never develop disease.
From the 260 contacts screened, seven teachers, 18 stu-
dents and the teacher’s child were infected. This
represented 12% of the high-risk group, 5.5% of the
medium-risk group and 1.5% of the low-risk group. To
date, no contacts have developed active disease.
10.1071/NB12096 Vol. 24(1) 2013 NSW Public Health Bulletin | 27

As a result of the screening exercise, there were valuable
lessons learnt that can guide future school contact tracing
exercises. It is recommended that after an initial telecon-
ference with all relevant personnel (in this case, the TB
Coordinator, Public Health Unit Director and school prin-
cipal), the Public Health Unit Director (or equivalent)
should write a briefing note for the relevant Health Depart-
ment Director (in this case, the Chief Health Officer) and
the head of the local health service (in this case, the Chief
Executive of the LHD) including a summary of the key
issues and recommendations. The media departments in
both the LHD and the Health Department should also be
alerted and updated.
The school principal, in conjunction with the local TB
Coordinator, should hold an information session for all
teachers at the school. This session should reinforce
confidentiality issues and provide education on possible
screening results. The school principal should send a letter
and TB factsheet to parents of all children in the entire
year(s) affected, even if only a small portion is to be
screened. Also consider sending a letter to all parents in
the school if the school is small. Education Department
regional officers and school occupational health and safety
regional officers should be informed by the school of the
screening, and given a TB factsheet and an individualised
screening plan for the event.
Advice should be given to the school executive to hold an
open parent information evening before screening com-
mences. The screening consent form should also request
the details of the child’s GP so he or she can be informed of
the screening plan.
This example highlights the importance of implementing
an agreed screening plan to effectively manage large
screenings; this will ensure consistency of processes and
information given and provide a central point of commu-
nication for all involved.
28 | Vol. 24(1) 2013 NSW Public Health Bulletin

Costs of a contact screening activityin a neonatal intensive care unit
Kate E. FisherA, Nicole F. CookB
and Guy B. MarksC
ADepartment of Community Paediatrics, South Western SydneyLocal Health District
BCommunity Health/Paediatric Ambulatory Care Services, SouthWestern Sydney Local Health District
CDepartment of Respiratory Medicine, Liverpool Hospital
InMarch 2011, a medical officer working in a metropolitan
New South Wales (NSW) neonatal intensive care unit
(NICU) was diagnosed with active pulmonary tuberculosis
(TB).Hehad immigrated toAustralia froma high-incidence
country 2 years earlier with negative pre-immigration
screening. Occupational TB screening prior to commencing
employment at the hospital, conducted in line with NSW
Health policy,1 was also negative. The man was screened
again, also in line with the NSW Health policy, after he
displayed TB symptoms (i.e. a 6-month history of non-
productive cough and weight loss), and was smear-positive
on induced sputum. Mycobacterium tuberculosis was con-
firmed on polymerase chain reaction, fully sensitive to
standard anti-TB therapy.
The index case worked full-time in the NICU during his
infectious period from December 2010 to March 2011. As
neonates are at higher risk than older children or adults of
developing severe and potentially fatal disease soon after
infection with TB, it was decided to immediately offer
screening to all exposed neonates and others who were
potentially exposed rather than implementing a staged
response.2,3 The outcome of this investigation is being
reported elsewhere.4 Here we describe the costs of the
investigation.
Contact investigationAll 125 neonates, 165 of their relatives and 122 health care
workers identified from medical records and departmental
rosters as having had contact with the index case during his
infectious period were offered screening (Table 1).
Ninety-six neonates were followed up at the hospital, 15
were followed up in other Local Health Districts, nine had
died of unrelated causes and five failed to attend. Exposed
neonates received a tuberculin skin test (TST) at 3 months
corrected age; TSTs have been shown to be unreliable prior
to this age.5–7 Neonates whowere too young to be screened
were commenced on isoniazid prophylaxis until they
reached 3 months corrected age.
Relatives and health care workers were offered TST
screening at the Chest Clinic. A reaction of $10mm (or
$15mm with a Bacille Calmette-Guerin (BCG) scar) was
defined as a positive TST.
Data on exposure and outcomes were collected from
clinical records and departmental rosters. None of the
100 neonates screened (89 in the hospital and 11 in other
Local Health Districts) had positive TSTs.4 Fifty-one of
152 (34%) relatives and nine of 120 (8%) health care
workers screened had positive TSTs.4 All subsequently
hadnegative chestX-rays, sputumcultures and/or interferon-
gamma release assays (IGRAs). All positive TSTs were
associated with origin from a high-incidence country and/
or previous BCG vaccination. No adult contacts were
treated for TB infection or disease.
Resources usedThe time spent on this investigation by nurses, doctors and
pharmacists was obtained from rosters and interviews with
staff. Salaries were calculated using 2011 NSW Health
awards.8–10 Travel costs were estimated using National
Roads and Motorists’ Association costs for a medium-
sized vehicle.11 The costs of laboratory tests and radiology
were obtained from theMedicare Benefits Schedule (items
58503 and 69327), and hospital radiology and pathology
departments.12 The hospital pharmacy provided informa-
tion on the cost of isoniazid. The cost of consumables was
calculated from clinic invoices. Car parking and postage
costs were obtained from the investigation cost centre. All
costs presented are therefore estimates (Table 2).
Neonates were screened by Chest Clinic registered nurses.
Neonates on isoniazid were also monitored in medical
review clinics. Chest Clinic and infection control clinical
nurse consultants also attended the neonatal clinics. The
time nurses spent on neonatal screening cost $24 489.8
Chest Clinic registered nurses also conducted the relative
and health care worker screening at a cost of $14 913.8
Neonatologists and paediatricians reviewed the neonates at
the screening and medical review clinics at a cost of
$19 059.9 Respiratory physicians interviewed and coun-
selled the families of exposed neonates at the initial
screening clinics at a cost of $9148.9
The estimated 910 km travelled for screening home visits
and medication delivery cost approximately $682.11
10.1071/NB12108 Vol. 24(1) 2013 NSW Public Health Bulletin | 29

Nurses’ time spent conducting home visits cost an addi-
tional $971.8 A clinical nurse consultant was appointed to
coordinate the investigation over 23 weeks at a cost of
$40 970.8 Screening tests conducted included chest X-rays
(220 performed for a total of $10 373), TSTs (487 per-
formed for $1406), IGRAs (10 performed for $500) and
sputum smears/cultures (two contacts with three speci-
mens each for $171).12
The 66 neonates commenced on prophylaxis received a
total of 4425 isoniazid treatment days. At an average dose
of 50mg/day the isoniazid solution cost $167, with no
additional cost passed onto the families. Manufacturing
and dispensing the isoniazid solution took the hospital
pharmacists approximately 69 hours, at a cost of $2491.10
Additional costs included consumables ($1034), parking
for families ($1826) and postage for letters sent to families
and health care providers (approximately $230).
There are few neonatal nosocomial TB exposure investi-
gations in the published literature, and little evidence on
their cost.2,5,13–16 We estimate the total cost to the hospital
of this screening investigation was $128 430. This may
underestimate the true cost as some items could not be
quantified, including the cost of screening the 15 neonates
and their relatives who attended other facilities for screen-
ing, the cost to families of travel to the clinics and
pharmacy, and the investigation hotline. The time spent
by hospital executives, the media unit, the NSW Ministry
of Health and Public Health Unit staff is also not included
in this estimate.
Indirect costs that are difficult to quantify include the cost
of a parent’s time away from work and usual duties. The
opportunity cost to other departments of scarce health care
resources including health care worker time, clinic space
and tests used for the investigation is significant but
difficult to quantify.
Table 1. South Western Sydney Local Health District neonatal intensive care unit tuberculosis contact investigation: exposedcontact demographics and screening outcomes, 2011
Neonates Relatives Health care workers
Number exposed 125 165 122
Mean age at start of investigation 2.1 weeks corrected
(95% CI: 1.0–3.1)
32.5 years
(95% CI: 31.0–33.4)
40.1 years
(95% CI: 38.0–42.1)
Gender
Male
Female
70 (56%)
55 (44%)
72 (44%)
93 (56%)
12 (10%)
110 (90%)
Born overseas 0 (0%) 72 (44%) 54 (44%)
Previous BCG 0 (0%) 23 (14%) 65 (53%)
Previous known TB 0 (0%) 2 (1%) 0 (0%)
Received isoniazid prophylaxis Hospital clinic: 66/89 (74%) 0 (0%) 0 (0%)
Positive TST during investigation Hospital clinic: 0/89 (0%)
Out of area: 0/11 (0%)
51/152 (34%) 9/120 (8%)
BCG: Bacille Calmette-Guerin; CI: confidence interval; TST: tuberculin skin test.
Table 2. Estimated costs of the neonatal intensive care unit tuberculosis contact investigation for the contacts screened in theSouth Western Sydney Local Health District, 2011
Category Estimated cost
Nurses’ time (99 days of chest clinic RN time, 11 days of chest clinic CNC time, 10 days of infection control
CNC time, 2 weeks of neonatology RN time)
$39 402
Doctors’ time (25 days of neonatologist and paediatrician time, 12 days of respiratory physician time) $28 207
Investigation coordination (23 weeks of CNC time) $40 970
Home visits (Travel costs over 910 km and nursing time of 10 RN hours and 12 CNC hours) $1653
Screening tests (220 CXRs, 487 TSTs, 10 IGRAs, 2 x 3 sputum smear/cultures) $12 450
Isoniazid prophylaxis (4425 days of isoniazid solution and 69 hours of pharmacist time) $2658
Other (consumables, car parking, postage) $3090
Total estimated cost $128 430
NB: Costs associated with screening neonates living in other Local Health Districts are not included in this estimate.
CNC: clinical nurse consultant; CXR: chest X-ray; IGRA: interferon-gamma release assay; RN: registered nurse; TST: tuberculin skin test.
30 | Vol. 24(1) 2013 NSW Public Health Bulletin

The potentially substantial costs of screening investiga-
tions are not always included within health service bud-
gets. This episode highlights the importance of including
funds for screening within the public health or prevention
components of budgets to accommodate such events.
Intangible costs including the anxiety and stress caused
to families from the potential infection of their neonate,
as well as to exposed health care workers and relatives,
are considerable but not readily expressed in dollar
terms.
ConclusionThere is a paucity of evidence around neonatal nosocomial
TB exposure events, making it difficult to plan an appro-
priate response. In the absence of information it is difficult
to justify not taking a precautionary approach when
neonates are involved, but alternative approaches could
be considered. Rather than screening all contacts as in this
investigation, after careful risk assessment screening could
initially be restricted to thosewith the highest exposure and
extended to those at lower risk only if cases are detected. If
no evidence of transmission was detected in the most
highly-exposed contacts, further unnecessary screening
of contacts at lower risk would be prevented, resulting in
potential cost savings.
No evidence of transmission was detected in this and
previous similar investigations; the risk of nosocomial
transmission in the NICU setting appears to be
low.2–7,13–17 This may add confidence that a staged
approach for future TB screening activities in neonatal
settings can be a safe and cost-effective alternative to
initially screening all potentially exposed neonates.
AcknowledgmentsThe authors wish to acknowledge the hard work of staff from the
South Western Sydney Local Health District Chest Clinic, NICU,
Departments of Paediatrics and Community Paediatrics, and the
Sydney and South Western Sydney Public Health Unit during the
investigation.
References1. NSW Health. Occupational Assessment, Screening and Vacci-
nation Against Specified Infectious Diseases. Policy Directive
PD2011_005. Available at: http://www.health.nsw.gov.au/
policies/pd/2011/pdf/PD2011_005.pdf (Cited 25 June 2013).
2. Ohno H, Ikegami Y, Kishida K, Yamamoto Y, Ikeda N,
Taniguchi T et al. A contact investigation of the transmission of
Mycobacterium tuberculosis from a nurse working in a newborn
nursery and maternity ward. J Infect Chemother 2008;
14(1): 66–71. doi:10.1007/s10156-007-0565-0
3. Nivin B, Nicholas P, Gayer M, Frieden TR, Fujiwara PI.
A continuing outbreak of multidrug-resistant tuberculosis, with
transmission in a hospital nursery. Clin Infect Dis 1998;
26(2): 303–7. doi:10.1086/516296
4. Fisher KE, Guaran R, Stack J, Simpson S, Krause W, For KD
et al. Contact investigation of neonates, relatives and healthcare
workers following nosocomial tuberculosis exposure. Infect
Control Hosp Epidemiol (in press)
5. Light IJ, Saidleman M, Sutherland JM. Management of new-
borns after nursery exposure to tuberculosis. Am Rev Respir Dis
1974; 109(4): 415–9.
6. Lee LH, LeVea CM, Graman PS. Congenital tuberculosis in a
neonatal intensive care unit: case report, epidemiological
investigation, and management of exposures. Clin Infect Dis
1998; 27(3): 474–7. doi:10.1086/514690
7. Kim KI, Lee JW, Park JH, Kim SY, Park HJ, Choi PJ et al.
Pulmonary tuberculosis in five young infants with nursery
exposure: clinical, radiographic and CT findings. Pediatr Radiol
1998; 28(11): 836–40. doi:10.1007/s002470050477
8. NSW Health. Public hospital nurses (state) award. Available at:
http://www.health.nsw.gov.au/nursing/employment/nurse_
award_wage_rates_11.asp (Cited 27 July 2012).
9. NSW Health. NSW public health system staff specialists (state)
award. Available at: http://www.health.nsw.gov.au/archive/
policies/ib/2011/pdf/IB2011_036.pdf (Cited 27 July 2012).
10. NSW Health. Health employees’ pharmacists (state) award.
Available at: http://www.health.nsw.gov.au/resources/jobs/
conditions/awards/pdf/hsu_he_pharmacists.pdf (Cited 27 July
2012).
11. Carr D. 2012 private whole of life fixed vehicle operating costs.
NRMA Motoring & Services. Available at: http://www.
mynrma.com.au/images/Motoring-PDF/Car-Operating-Costs-
Report-Summary.pdf (Cited 27 July 2012).
12. Department of Health and Ageing. Medicare benefits schedule
book 2012. Canberra: DOHA; 2011.
13. Borgia P, Cambieri A, Chini F, Coltella L, Delogu G, Di Rosa E
et al. Suspected transmission of tuberculosis in a maternity ward
from a smear-positive nurse: preliminary results of clinical
evaluations and testing of neonates potentially exposed, Rome,
Italy, 1 January to 28 July 2011. Euro Surveill 2011;
16(40): 19 984.
14. Sen M, Gregson D, Lewis J. Neonatal exposure to active
pulmonary tuberculosis in a health care professional. CMAJ
2005; 172(11): 1453–6. doi:10.1503/cmaj.1031052
15. Burk JR, Bahar D, Wolf FS, Greene J, Bailey WC. Nursery
exposure of 528 newborns to a nurse with pulmonary tubercu-
losis. South Med J 1978; 71(1): 7–10. doi:10.1097/00007611-
197801000-00004
16. Steiner P, RaoM, VictoriaMS, Rudolph N, Buynoski G.Miliary
tuberculosis in two infants after nursery exposure: epidemio-
logic, clinical and laboratory findings. Am Rev Respir Dis 1976;
113(3): 267–71.
17. Lonie C, Levy M, Frommer M. Counting the costs: a review of
two tuberculosis mass contact screening investigations. N S W
Public Health Bull 1994; 5(2): 13–5. doi:10.1071/NB94008
Costs of a contact screening activity in a neonatal intensive care unit
Vol. 24(1) 2013 NSW Public Health Bulletin | 31

Tuberculosis: an emerging zoonosis
Larry Vogelnest
Taronga Wildlife Hospital, Taronga Conservation SocietyAustralia
Tuberculosis (TB) caused byMycobacterium tuberculosis
is primarily a disease of humans who are considered the
primary reservoir host for this pathogen. It is an ancient
disease, with descriptions dating back thousands of years.
It is currently estimated that one-third of the global human
population is infected,1 and TB accounts for millions of
deaths annually.
Mycobacterium tuberculosis in animalsHumans have had a very close association with animals
for millennia, utilising them for food, labour, transport,
clothing, companionship, disability assistance, recreation,
sport, religious and cultural icons, security, entertainment
and research and in rescue, rehabilitation and conserva-
tion efforts. It is inevitable then that as a result of this
close association, transmission of pathogens from
humans to animals and vice versa will occur. M. tubercu-
losis infections have been reported in a wide range of
animal species including: elephants,2–6 non-human pri-
mates,3,5,7 rhinoceroses,6 tapir,7 various non-domestic
ungulates,6,7 seals,3,5 various non-domestic carnivores,5
dogs,8,9 cats,9 guinea pigs,10 rabbits,10 cattle11 and
birds.3,5,12 Susceptibility to infection withM. tuberculosis
varies significantly between animal taxonomic groups,
with species such as old world monkeys, lesser apes,
elephants, hamsters and guinea pigs being highly suscepti-
ble; great apes, new world monkeys, canids, seals, tapir,
rhinoceroses, pigs, rats and mice are moderately suscepti-
ble; and prosimians, felids, equids, ungulates, rabbits, birds
and reptiles have low susceptibility.3 The susceptibility
for many species is unknown. Animals are generally
considered to acquire infection from humans with active
TB, however animal-to-animal transmission also occurs,
including between different species.6
Historically, zoonotic TB has been associated with
M. bovis, however the incidence has declined significantly
with the control and eradication of M. bovis in many
countries and the advent of the pasteurisation of milk.13
It is now emerging that animals are a potential source of
M. tuberculosis infection for humans, and it is becoming an
important occupational and public health concern.
Although the relative incidence is low, there are now
several reports of transmission of M. tuberculosis from
animals to humans.5,6,9,14–17 In the majority of these cases
infection occurred in humans that had a close and/or
prolonged association with the infected animal/s, most
commonly through occupational exposure.
Risk factors for animal-to-human transmissionMany of the risk factors identified for contracting TB
from a human with active TB are equally applicable to
acquiring infection from an animal. These include: the
number of bacilli being actively shed; total time of
exposure; droplet size; persistence of aerosols through
insufficient ventilation; and immune status.13 Additional
risks associated with working with animals include:
proximity to an infected animal; aerosol-generating prac-
tices (such as the use of high pressure hosing when
cleaning); conducting clinical veterinary procedures such
as trunk washes in elephants; conducting necropsies on an
infected animal; being an elephant trainer/keeper; and
inconsistent or improper use of N95 masks when working
with known or potentially infected animals.6 Generally,
however, it is concluded that humans must be in close
proximity to, and have more than incidental contact with,
an infected animal to be at risk of infection.13,14
Case studies of animal-to-human transmissionA number of recent case studies provide examples of
zoonotic M. tuberculosis infections. One report docu-
ments the infection of veterinary personnel during the
clinical and pathological examination of a dog with
unexpected disseminated TB. Contact investigation
among the owners and veterinary personnel indicated that
the index dog did not infect humans during its lifetime.
However, all three pathologists performing the necropsy
on the dog later returned positive results. Infection was
most likely due to inhalation of aerosols created by using
an electric saw to open the brain cavity.9
Tuberculosis caused by M. tuberculosis is emerging as
an important disease of Asian elephants (Elephas
maximus).2–6 There have been numerous reports of
transmission of M. tuberculosis from elephants to
humans.5,6,14–17 TB was diagnosed in two Asian ele-
phants, three Rocky Mountain goats (Oreamnos ameri-
canus) and one black rhinoceros (Diceros bicornis) in the
Los Angeles Zoo. Tuberculin skin test conversions were
associated with working with the elephants and attending
an elephant necropsy.6 Five employees working at an
elephant refuge in Tennessee had tuberculin skin test
conversions linked to the presence of an infected elephant
at the refuge. Risk of conversion was increased for
elephant caregivers and administrative personnel working
32 | Vol. 24(1) 2013 NSW Public Health Bulletin 10.1071/NB12098
in the barn housing the elephant or in offices connected to
the barn. Indirect exposure to aerosolised organisms and
delayed and inadequate infection control practices likely
contributed to transmission.16 After the death of three
elephants at an exotic animal farm in Illinois due to TB
and the diagnosis in a fourth live elephant, 22 caregivers at
the farm were screened for TB; 11 caregivers had positive
tuberculin skin test reactions, one of whom was diagnosed
with active TB. Genotyping demonstrated that the isolates
from the four elephants and the caregiver with active TB
were the same.15 After the diagnosis of TB in an Asian
elephant and a chimpanzee (Pan troglodytes) in an Austra-
lian zoo, over 145 staff and volunteers were screened and
completed a detailed questionnaire to assess exposure risk.
There was no evidence of risk to people who did not work
with the elephants.18,19
ConclusionPeople should be aware of the risk of contracting TB from
animals where there is a risk of animal exposure to
M. tuberculosis, particularly with susceptible species
and in regions of the world where the incidence of TB in
the human population is high. Animal industries and
professions (e.g. zoological institutions, the veterinary
profession and wildlife rescue and rehabilitation centres)
should have occupational health programs that include
personnel education, adequate infection control practices,
appropriate use of personal protective equipment, TB
screening programs for susceptible species, regular
screening of employees working with these species and
pre-employment screening to establish baseline exposure
for TB.
AcknowledgmentI would like to thank Nicola Stephens, Manager, Communicable
Disease Epidemiology and Surveillance Section, Health Protection
Branch, Department of Health, Victoria (work completed while at
Communicable Diseases Branch, Health Protection NSW) for her
assistance with the preparation of this paper.
References1. World Health Organization. Tuberculosis factsheet. Available
at: http://www.who.int/mediacentre/factsheets/fs104/en (Cited
25 June 2013).
2. Angkawanish T, Wajjwalku W, Sirimalaisuwan A,
Mahasawangkul S, Kaewsakhorn T, Boonsri K et al. Mycobac-
terium tuberculosis infection of domesticated Asian Elephants,
Thailand. Emerg Infect Dis 2010; 16: 1949–51. doi:10.3201/
eid1612.100862
3. Isaza R. Tuberculosis in all taxa. In: Fowler ME, Miller RE,
editors. Zoo and wild animal medicine. 5th ed. Pennsylvania:
WB Saunders Company; 2003. p. 689–96.
4. Mikota SK. Tuberculosis in elephants. In: Fowler ME, Miller
RE, editors. Zoo and wild animal medicine. 6th ed. St. Louis:
Saunders Elsevier; 2008. p. 355–64.
5. Montali RJ, Mikota SK, Cheng LI.Mycobacterium tuberculosis
in zoo and wildlife species. Rev Sci Tech 2001; 20: 291–303.
6. Oh P, Granich R, Scott J, Sun B, Joseph M, Stringfield C et al.
Human exposure following Mycobacterium tuberculosis infec-
tion of multiple animal species in a Metropolitan Zoo. Emerg
Infect Dis 2002; 8: 1290–3. doi:10.3201/eid0811.020302
7. Michel AL, Venter L, Espie IW, Coetzee ML. Mycobacterium
tuberculosis infections in eight species at the National
Zoological Gardens of South Africa, 1991-2001. J Zoo Wildl
Med 2003; 34(4): 364–70. doi:10.1638/02-063
8. Erwin PC, Bemis DA, McCombs SB, Sheeler LL, Himelright
IM, Halford SK et al.Mycobacterium tuberculosis transmission
from human to canine. Emerg Infect Dis 2004; 10(12): 2258–60.
doi:10.3201/eid1012.040094
9. Posthaus H, Bodmer T, Alves L, Oevermann A, Schiller I,
Rhodes SC et al. Accidental infection of veterinary personnel
with Mycobacterium tuberculosis at necropsy: A case study.
Vet Microbiol 2011; 149: 374–80. doi:10.1016/j.vetmic.
2010.11.027
10. Sakamoto K. The pathology of Mycobacterium tuberculosis
infection. Vet Pathol 2012; 49(3): 423–39. doi:10.1177/
0300985811429313
11. Fetene T, Kebede N, Alem G. Tuberculosis infection in animal
and human populations in three districts of Western Gojam,
Ethiopia. Zoonoses Public Health 2011; 58: 47–53. doi:10.1111/
j.1863-2378.2009.01265.x
12. Schmidt V, Schneider S, Schlomer J, Krautwald-Junghanns M,
Richter E. Transmission of tuberculosis between men and pet
birds: a case report. Avian Pathol 2008; 37(6): 589–92.
doi:10.1080/03079450802428901
13. Maslow J. Tuberculosis and other mycobacteria as zoonoses.
Proceedings American Association of Zoo Veterinarians. 1997;
pp. 110–15.
14. Davis M.Mycobacterium tuberculosis risk for elephant handlers
and veterinarians. Appl Occup Environ Hyg 2001; 16: 350–3.
doi:10.1080/10473220120327
15. Michalak K, Austin C, Diesel S, Bacon MJ, Zimmerman P,
Maslow JN.Mycobacterium tuberculosis infection as a zoonotic
disease: transmission between humans and elephants. Emerg
Infect Dis 1998; 4: 283–7. doi:10.3201/eid0402.980217
16. Murphree R, Warkentin JV, Dunn JR, Schaffner W, Jones TF.
Elephant-to-human transmission of tuberculosis, 2009. Emerg
Infect Dis 2011; 17(3): 366–71. doi:10.3201/eid1703.101668
17. Une Y, Mori T. Tuberculosis as a zoonosis from a veterinary
perspective.Comp ImmunolMicrobiol Infect Dis 2007; 30: 415–
25. doi:10.1016/j.cimid.2007.05.002
18. Stephens N, Vogelnest L, Lowbridge C, Christensen A, Marks
GB, Sintchenko V et al. Transmission of Mycobacterium
tuberculosis from an Asian elephant (Elephas maximus) to a
chimpanzee (Pan troglodytes) and humans in an Australian zoo.
Epidemiol Infect 2013; 141(7): 1488–97.
19. Charlesworth KE, Vogelnest L, Stephens N, Marks GB. Diag-
nosis, investigation and management of tuberculosis at an
Australian zoo. N S W Public Health Bull 2013; 24(1): 49.
Tuberculosis: an emerging zoonosis
Vol. 24(1) 2013 NSW Public Health Bulletin | 33
What do we know about the outcomes oftuberculosis contact investigations in NSW?
Claudia C. Dobler
Department of Respiratory and Environmental Epidemiology,Woolcock Institute of Medical Research, The University of Sydney
Email: [email protected]
Abstract: A recently conducted study on tuber-
culosis contact investigations in six Sydney tuber-
culosis clinics – that together managed 59% of all
tuberculosis cases in NSW from January 2000 to
December 2009 – found that the prevalence of
tuberculosis among contacts was comparable to
other low-incidence settings. However, only 9%
of contacts with latent tuberculosis infection
received treatment. This paper explores the results
of the study, evaluating potential missed opportu-
nities to prevent tuberculosis among contacts, and
discussing the mechanisms in decision making
about treatment of latent tuberculosis infection. In
particular, the paper focuses on the challenges of
tuberculin skin test interpretation among contacts
who have received Bacille Calmette-Guerin vacci-
nation and who were born in countries where
tuberculosis is endemic.
Screening of contacts of people with active tuberculosis
(TB) is a cornerstone of TB control in low-incidence
countries such as Australia.1 Contact tracing aims to identi-
fy contacts with active TB or latent tuberculosis infection
(LTBI) and to provide adequate treatment and follow-up.
Active TB is evaluated by taking a history of clinical
symptoms, performing a chest X-ray, and examining spu-
tum samples if the chest X-ray is abnormal. A diagnosis of
LTBI is based on a positive tuberculin skin test (TST),
taking into account the pre-test probability of a contact
having LTBI when interpreting the TST result. Contacts
with a previously positive TST do not usually undergo a
repeat TST, but the risk of having sustained a new infection
from the current index case – depending on the infectious-
ness of the index case and duration and intensity of exposure
of the contact – will be assessed by the reviewing physician.
High-risk contacts will be offered LTBI treatment, and the
remainder of the contacts will be followed-up with repeat
chest X-rays for a minimum of 2 years.
In New South Wales (NSW), TB contact screening
(including TSTs and preventive TB treatment) is guided
by NSW Health policy directives.2–4 This paper will
discuss the findings of a recently conducted study examin-
ing the risk of active TB among 14 371 contacts of people
with TB in NSW.5
Ethics apporval was obtained from the NSW Population
and Health Services Research Ethics Committee (HREC/
10/CIPHS/58).
Active TB among contactsThe study population of this retrospective cohort study
comprised all persons who were screened as contacts of
people with TB between January 2000 andDecember 2009
at TB clinics within the former Sydney West and Sydney
South West Area Health Services. The six TB clinics
within these two former Area Health Services together
managed 59% of all TB cases in NSW during the study
period. Cases of active TB among the study population
were identified by linking a database containing details for
all identified contacts (the Clinical Surveillance System)
and the NSW Notifiable Diseases Database, which
includes the TB registry and was used for the collection
of notifiable disease case information in NSW until the
implementation of the Notifiable Conditions Information
Management System in 2010.
Of all contacts who were seen as part of TB contact
investigations, 1.9% were diagnosed with active TB either
at the time of the first screening or during follow-up. The
prevalence of TB among contacts at the time of the initial
screening (within 3 months after the first health-care con-
tact) was 1.5% and thus consistent with the prevalence of
active TB among contacts in other low-incidence settings.6
This relatively high yield for active TB at the time of initial
screening (78% of contacts with active TB) compared to the
lower yield during the subsequent follow-up period (22% of
contacts with active TB were diagnosed during a mean
follow-up period of 4.6 years) highlights the importance of
ensuring at least one initial health-care screening visit for
every contact at risk of having been infected.
Latent TB infection: lost opportunities to preventTB among contacts?In this study, 35% of all contacts with at least one TST
performed had a TST $10mm at the time of the initial
screening visit or during follow-up and thuswere identified
34 | Vol. 24(1) 2013 NSW Public Health Bulletin 10.1071/NB12099

as having LTBI. Applying the threshold for TST recom-
mended in United States (US) guidelines7 (5mm) or
European guidelines8 (TST $10mm in non-Bacille
Calmette-Guerin (BCG)-vaccinated or BCG vaccinated
,12 months of age; TST $15mm in BCG-vaccinated
.12 months of age) would have resulted in higher and
lower estimated prevalence, respectively.
Only 9% of contacts with a positive TST in this study
received treatment for LTBI. Do these findings imply that
we are missing opportunities to prevent TB among con-
tacts in NSW? Is comprehensive coverage of preventive
treatment in contacts with evidence of LTBI what we
should strive for? To answer these questions we need to
take a closer look at those contacts that developed TB.
Of 273 contacts with active TB, 212 already had the
disease at the beginning of contact screening and thus
could not have been considered for treatment of LTBI. Of
the remaining 61 contacts who developed TB during the
follow-up period, details on TST results and/or chest
X-rays were available for 45. Of those, 30 (18 of whom
were aged less than 35 years) had a TST $10mm at the
time of initial screening and did not receive LTBI treat-
ment. Three of these 30 contacts were not given LTBI
treatment because their chest X-ray was abnormal (includ-
ing one contact aged less than 35 years), and active TB
could not be excluded with certainty; they were followed
up with a chest X-ray. Interestingly, 25 of the 27 contacts
with a TST$10mm and a normal chest X-ray who did not
receive LTBI treatment were born overseas; the majority
of these 25 contacts had received BCG vaccination.
Historically, US guidelines have recommended excluding
fromLTBI treatment persons aged 35 years and overwith a
positive TST but no other risk factors for TB.9 This
recommendation followed a study that showed an associa-
tion between age and increased risk of (potentially fatal)
isoniazid-induced hepatitis.10 Subsequent US guidelines
focus on screening and treatment of LTBI in high-risk
populations only; the age cut-off no longer applies as this
recommendation was directed at persons at low risk.1 The
NSWpolicy directive on preventive therapy still applies an
age cut-off of 35 years in considerations about who should
be offered LTBI treatment.3
Given current NSW guidelines, at least the 17 contacts
under the age of 35 yearswith a TST$10mmand a normal
chest X-ray at initial screening should have been consid-
ered for LTBI treatment. Sixteen of these contacts were
born overseas and had received BCG vaccination. The
findings highlight the challenge of TST interpretation in
contacts who have received BCG vaccination and who
were born in countries where TB is endemic; these contacts
are likely to have been infected with TB previously. The
decision to treat LTBI is a complex one in which the risk of
progression to active TB (and associated morbidity and
mortality) must be weighed against the risk of an adverse
event from LTBI treatment. As the perceived potential risk
of progression to active TB depends, amongst other things,
on the likelihood of a false-positive TST (particularly in
BCG-vaccinated contacts) and the likelihood of recent
(compared to past) infection, this may explain a reluctance
to offer treatment of LTBI to overseas-born contacts who
have been BCG-vaccinated. Facing these uncertainties, it
seems that the majority of chest clinic physicians in the
study followed the principle ‘primum nil nocere/first, do
no harm’ by avoiding the risk of adverse events from LTBI
treatment.
The role of interferon-gamma release assaysin contact tracingTSTs have poor specificity in BCG-vaccinated individuals
due to cross-reactivity with the antigens in the BCG
vaccine. Interferon-gamma release assays (IGRAs), which
have a much lower potential for false-positive results due
to cross-reactivity, have been proposed as an alternative to
the TST. However, IGRAs are currently not routinely used
in NSW as an alternative or supplemental test in contact
tracing.2 The reluctance to integrate IGRAs routinely as a
diagnostic procedure in contact tracing is likely related to
the fact that until recently there was little evidence that a
positive IGRA result is a predictor of the risk of developing
active TB. However, in recent years this association has
been shown in several studies. Two meta-analyses pub-
lished in 2012 examined the predictive value of IGRAs for
progression to active TB: one concluded that the predictive
value of IGRAs for development of TB is similar to the
TST;11 the other found that IGRAs have a higher positive
and negative predictive value for progression to active TB,
especially in high-risk groups.12 In other countries with a
low incidence of TB, such as the United Kingdom and the
US, IGRAs have been introduced into guidelines on
contact tracing.13,14 In these countries, IGRAs are used
to verify a positive TST13 or as an alternative to the TST.14
The Australian National Position Statement on the role of
IGRAs in the detection of LTBI, published in March 2012,
also acknowledges the role of IGRAs as a supplementary
test to confirm LTBI in low-risk individuals with a positive
TST in the context of contact tracing.15 Due to the recently
gained knowledge on the predictive value of IGRAs for
active TB,which seems to be at least equivalent to the TST,
and the higher specificity of IGRAs in BCG-vaccinated
individuals, consideration should be given to integrating
IGRAs, in addition to TSTs, into contact investigations
in NSW.
LTBI in overseas-born contactsThe other challenge in TST interpretation (other than
previous BCG vaccination) in contacts born in countries
where TB is endemic is the uncertainty about the time of
infection. LTBI treatment for recent infection is more
What do we know about the outcomes of tuberculosis contact investigations in NSW?
Vol. 24(1) 2013 NSW Public Health Bulletin | 35
beneficial than treatment for infection in the past, as the
risk of progressing from LTBI to active TB disease is
greatest in the 2 years following infection.16 If there is clear
evidence of TB transmission from the index case, for
example when an Australian-born child contact has a
positive TST, this supports the assumption that recent
infection could have occurred in all close contacts. How-
ever, if all household contacts of an index casewere born in
countries with a high TB incidence, it is difficult to
establish whether recent transmission has occurred. It is
likely that the reviewing physician takes uncertainty about
the time of infection into account. This could explain the
finding that overseas-born contacts with a positive TST
often do not receive LTBI treatment. There is, however,
evidence that treatment of LTBI in overseas-born close
(household) contacts is cost-effective17,18 and worthwhile
in terms of quality-adjusted life years.17 Indeed, further
analysis of theNSWTBcontact study shows that overseas-
born contacts had a higher risk of developing active TB
than Australian-born contacts (after adjustment for age,
gender, TST size and whether preventive treatment was
given) with odds ratios of 3.35 (95% CI 1.84–6.10), 3.64
(95% CI 2.48–5.35) and 5.79 (95% CI 4.08–8.21) in
overseas-born contacts from countries with a TB incidence
of ,10, 10–99 and $100 per 100 000 population respec-
tively (unpublished data). A more proactive approach to
LTBI treatment in overseas-born high-risk contacts in
NSW therefore seems indicated.
Effectiveness of LTBI treatmentIn the NSWTB contact study, an estimated 3942 additional
contacts with a TST$10mmwould have to have received
LTBI treatment to prevent 38 cases of TB that occurred
after initial screening among contacts with a TST$10mm;
that is assuming 100% uptake, adherence, completion and
effectiveness (unpublished data). However, in clinical
practice, patient adherence to LTBI treatment is often a
limiting factor in treatment effectiveness. Previous studies
suggest low completion rates, ranging from 19% (for
isoniazid for 9months) to 82% (for isoniazid for 6months),
with a completion rate of 75% for 6 months of isoniazid
described at a major Sydney chest clinic.19 A Cochrane
review of randomised controlled trials found an overall
effect estimate of 60% for treatment of LTBI (taking into
account patient adherence to treatment).20 While concerns
about the overall effectiveness of LTBI treatment may be a
reason for the reluctance of physicians to offer LTBI
treatment, it is important to remember that randomised
controlled trials have demonstrated that isoniazid has a
90% efficacy in preventing TB in infected contacts (and
other individuals with LTBI) when taken properly.21
ConclusionThe prevalence of active TB among contacts in NSW is
comparable to other settings with a low incidence of TB.
Less than 10%of contacts with a TST$10mm in theNSW
TB contact study received prophylactic treatment. Some
missed opportunities to prevent TB have been identified,
especially among young overseas-born high-risk contacts.
Future challenges for TB contact tracing in NSW include
achieving consistency in decision-making about LTBI
treatment while taking individual patient factors into
account, and defining the role of IGRAs in contact
investigations.
References1. American Thoracic Society. Targeted tuberculin testing and
treatment of latent tuberculosis infection. Am J Respir Crit Care
Med 2000; 161: S221–47.
2. NSW Health. Tuberculosis Contact Tracing. Policy Directive
PD2008_017. Available at: http://www.health.nsw.gov.au/
policies/pd/2008/pdf/PD2008_017.pdf (Cited 30 December
2012).
3. NSW Health. Preventive Therapy. Policy Directive
PD2005_072. Available at: http://www.health.nsw.gov.au/
policies/PD/2005/pdf/PD2005_072.pdf (Cited 30 December
2012).
4. NSW Health. Tuberculin Skin Testing. Policy Directive
PD2009_005. Available at: http://www.health.nsw.gov.au/
policies/pd/2009/pdf/PD2009_005.pdf (Cited 30 December
2012).
5. Dobler CC, Marks GB. Risk of tuberculosis among contacts in a
low incidence setting. Eur Respir J (in press).
6. Fox GJ, Barry SE, Britton WJ, Marks GB. Contact investigation
for tuberculosis: a systematic review and meta-analysis. Eur
Respir J 2013; 41(1): 140–56. doi:10.1183/09031936.00070812
7. American Thoracic Society/Centers for Disease Control and
Prevention/Infectious Diseases Society of America. Controlling
tuberculosis in the United States. Am J Respir Crit Care Med
2005; 172(9): 1169–227. doi:10.1164/rccm.2508001
8. Erkens CG, Kamphorst M, Abubakar I, Bothamley GH, Chem-
tob D, Haas W et al. Tuberculosis contact investigation in low
prevalence countries: a European consensus. Eur Respir J 2010;
36(4): 925–49. doi:10.1183/09031936.00201609
9. American Thoracic Society, American Lung Association,
Center for Disease Control. Preventive therapy of tuberculosis
infection. Am Rev Respir Dis 1974; 110: 371–4.
10. Kopanoff DE, Snider DE, Jr, Caras GJ. Isoniazid-related
hepatitis: a U.S. Public Health Service cooperative surveillance
study. Am Rev Respir Dis 1978; 117(6): 991–1001.
11. Rangaka MX, Wilkinson KA, Glynn JR, Ling D, Menzies D,
Mwansa-Kambafwile J et al. Predictive value of interferon-
gamma release assays for incident active tuberculosis: a
systematic review and meta-analysis. Lancet Infect Dis 2012;
12(1): 45–55. doi:10.1016/S1473-3099(11)70210-9
12. Diel R, Loddenkemper R, Nienhaus A. Predictive value of
interferon-gamma release assays and tuberculin skin testing
for predicting progression from latent TB infection to disease
state: a meta-analysis. Chest 2012; 142(1): 63–75. doi:10.1378/
chest.11-3157
13. National Institute for Health and Clinical Excellence. NICE
clinical guideline 117. Tuberculosis: clinical diagnosis and
management of tuberculosis, andmeasures for its prevention and
control. London; 2011.
36 | Vol. 24(1) 2013 NSW Public Health Bulletin

14. MazurekGH, Jereb J, VernonA, LoBue P,Goldberg S, CastroK.
Updated guidelines for using Interferon Gamma Release Assays
to detect Mycobacterium tuberculosis infection – United States,
2010. MMWR Recomm Rep 2010; 59(RR-5): 1–25.
15. National Tuberculosis Advisory Committee. Position statement
on interferon-gamma release assays in the detection of latent
tuberculosis infection. Commun Dis Intell 2012; 36(1):
125–31.
16. Ferebee SH. Controlled chemoprophylaxis trials in tuberculosis.
A general review. Bibl Tuberc 1970; 26: 28–106.
17. TanMC,MarraCA, SadatsafaviM,Marra F,Moran-MendozaO,
Moadebi S et al. Cost-effectiveness of LTBI treatment for TB
contacts in British Columbia. Value Health 2008; 11(5): 842–52.
doi:10.1111/j.1524-4733.2008.00334.x
18. Dasgupta K, Schwartzman K, Marchand R, Tennenbaum TN,
Brassard P, Menzies D. Comparison of cost-effectiveness of
tuberculosis screening of close contacts and foreign-born
populations. Am J Respir Crit Care Med 2000; 162(6): 2079–86.
19. Dobler CC, Marks GB. Completion of treatment for latent
tuberculosis infection with monthly drug dispensation directly
through the tuberculosis clinic. PLoS ONE 2012; 7(11): e48900.
doi:10.1371/journal.pone.0048900
20. Smieja MJ, Marchetti CA, Cook DJ, Smaill FM. Isoniazid for
preventing tuberculosis in non-HIV infected persons. Cochrane
Database Syst Rev 2000; (2): CD001363.
21. Comstock GW. How much isoniazid is needed for prevention
of tuberculosis among immunocompetent adults? Int J Tuberc
Lung Dis 1999; 3(10): 847–50.
What do we know about the outcomes of tuberculosis contact investigations in NSW?
Vol. 24(1) 2013 NSW Public Health Bulletin | 37

Ongoing transmission of tuberculosisin Aboriginal communities in NSW
Sue DevlinA,C and Erin PassmoreB
ANorth Coast Public Health UnitBNSW Public Health Officer Training Program,NSW Ministry of Health
CCorresponding author. Email: [email protected]
Abstract: This report describes the ongoing trans-
mission of tuberculosis inAboriginal communities
in NSW. From October 2000 to July 2012 there
were 30 linked cases of tuberculosis diagnosed in
Aboriginal people – 22 in the North Coast area of
NSW,with a further three cases in Sydney and five
in southern Queensland. It is likely that a range of
factors have contributed to this ongoing transmis-
sion, including delayed diagnosis, the extensive
social connectionswithin the communities affected,
and the highly mobile living arrangements of
many of those affected. Cases have continued to
emerge despite implementation of tuberculosis
control measures in line with state and international
protocols. Tuberculosis control staff are working
in partnership with Aboriginal communities to
identify and implement appropriate tuberculosis
control strategies.
Tuberculosis (TB) is an important public health issue and a
leading cause of death worldwide.1 The public health
burden of TB is substantial, even in developed countries
with comprehensive TB control programs. InAustralia, the
incidence of TB is low (6.0 cases per 100 000 population in
2009), with the majority of cases occurring in migrants
from countries with a high incidence of TB.2 For Aborigi-
nal Australians, the incidence of TB has been declining
since 2002 but remains over five times higher than for
Australian-born non-Aboriginal people (4.8 versus 0.9 per
100 000 population).2 The persistence of TB in Aboriginal
people has been attributed to poor living conditions and
malnutrition compounded by chronic diseases and alcohol
use.3–5 The aim of this paper is to describe the epidemiol-
ogy of a cluster of TB cases with ongoing transmission
amongst Aboriginal people in New South Wales (NSW),
and the public health response.
MethodsThis paper presents results up to July 2012, however new
cases continue to be identified and the public health
response is ongoing.
TB is a notifiable disease under the NSW Public Health
Act 2010. The data presented in this paper have been
collected as a part of routine TB control procedures
implemented in accordance with the Act. The data were
obtained from theNSWNotifiable Conditions Information
Management System, a statewide database of disease
notifications held by NSW Health. Standard TB case
definitions are used.6 Clustered cases are defined as:
MIRU-linked cases – laboratory-confirmed TB cases with
the mycobacterial interspersed repetitive unit (MIRU)
pattern 2303425153322; and epidemiologically-linked
cases – clinical TB cases with no TB organism identified
but with epidemiological links to a MIRU cluster case.
Incidence rates per 100 000 population were calculated
using the Australian Bureau of Statistics estimated mid-
year NSW populations for 2000–2012, obtained from
NSW Health’s Secure Analytics for Population Health
Research and Intelligence.
ResultsIdentification of cases in the cluster
A total of 30 linked cases of TB were identified in the
period October 2000–July 2012 (Figure 1). Twenty-six of
the 30 cases shared the MIRU pattern for this cluster. The
remaining four were clinically diagnosed cases that had
strong epidemiological links to the cluster (e.g. child
household contacts of cases). One person developed TB
twice andwas counted twice in the cluster. This person had
household contact with several cases following successful
completion of directly observed treatment and so was
considered a case of reinfection. Most cases (n¼ 22) were
diagnosed on the NSW North Coast (the area covered by
the Northern NSW and Mid North Coast Local Health
Districts), with a further three cases in Sydney and five in
Queensland. The MIRU pattern for this cluster is found
almost exclusively in Aboriginal people. Only one non-
Aboriginal person in Australia has been identified as
having had this MIRU pattern since 2000: an elderly
overseas-born woman in Victoria. This woman had no
identifiable epidemiological link to the cluster cases, and
was therefore excluded from the cluster.
38 | Vol. 24(1) 2013 NSW Public Health Bulletin 10.1071/NB12113

The presence of a cluster became evident when several
cases of TB were diagnosed through contact tracing in
response to an Aboriginal person diagnosed with pulmo-
nary smear-positive TB on the NSW North Coast in 2003.
This person was estimated to have been infectious for
4 months prior to diagnosis, and assisted with the contact
tracing by disclosing a wide network of family and friends.
In 2004, an Aboriginal person in Queensland who was
newly diagnosed with TB and a North Coast Aboriginal
person who had been diagnosed with TB in 2000 were
found to share the same MIRU pattern as the initial case.
MIRU-linked cases continued to emerge despite imple-
mentation of TB control measures in line with state and
international protocols6,7 and additional community-based
screening where possible. Some cases were known con-
tacts of previous cases, however the geographic spread of
the disease broadened and the epidemiological links for
some cases were not immediately evident.
In 2006 an Aboriginal person diagnosed with MIRU-
linked TB in Sydney reported travelling to the North
Coast periodically however no epidemiological links with
the North Coast cases could be identified. Two further
MIRU-linked cases were diagnosed in Sydney: one
person diagnosed in 2009 who reported ‘‘knowing’’ the
first Sydney case and who had a history of travel to the
North Coast; and one person diagnosed in 2012 with no
identified connections to the North Coast or any cluster
cases. A Queensland person diagnosed with TB in 2006
was MIRU-linked to the cluster. It was subsequently
discovered that this person moved in the same social
circles as a North Coast person diagnosed in 2005, at the
time the North Coast person was infectious. A household
sub-cluster with three additional cases emerged around
this Queensland case.
The diagnosis in 2010 of a further five adults with TB on
the North Coast revealed significant information about the
connections between the North Coast cases, their contacts,
and their mobility practices and patterns. The North Coast
cases diagnosed in 2010 had epidemiological connections
with multiple cases in this TB cluster.
Characteristics of the cluster
Twenty-two of the 30 cases (73%) were male; the average
age of cases was 33.2 years (Standard Deviation¼ 15.8)
(Figure 2). Most cases (n¼ 22, 73%) presented with
pulmonary smear-positive TB; the remainder presented
with pulmonary smear-negative TB and extrapulmonary
TB. Cases reported having symptoms of TB for an average
of 5 months prior to seeking medical attention or being
identified through contact tracing (range 1–13 months).
Eight cases (27%) were identified through contact tracing.
Four of the 30 cases (13%) were children, all of whom had
household contact with an adult with pulmonary TB. This
particular MIRU pattern is susceptible to first-line TB
antibiotics, and all cases completed treatment. There have
been no known deaths due to TB in this cluster.
SinceOctober 2000, there have been 55 notifications of TB
in Aboriginal people in NSW, 25 of which (45%) are part
of this cluster. The average annual TB notification rate for
Aboriginal people in the North Coast area in the period
2000–2011 was 12.1 notifications per 100 000 population.
This rate is elevated compared to Aboriginal people in the
rest of NSW (1.7 per 100 000 population), and compared to
non-Aboriginal people in both the North Coast area
(1.6 notifications per 100 000 population) and the rest of
NSW (7.2 notifications per 100 000 population). The
increased rate of TB in Aboriginal people in the North
Coast area is entirely due to this cluster – of the TB
notifications in Aboriginal people in the North Coast area
since 2000, all but one case has been linked to this cluster.
The epidemiological links between these cases are com-
plex (Figure 3). Rather than a complete ‘map’ of links
02000 2003 2004 2005 2006 2007
Year of diagnosis2008 2009 2010 2011 2012
1
2
3
Num
ber
of c
ases
4
5
6
7
8
Figure 1. Tuberculosis cases by year of diagnosis, NSW/QLDcluster, October 2000–July 2012 (n5 30).Source: Notifiable Conditions Information ManagementSystem, NSW Ministry of Health.
MaleFemale
0–19
12
10
8
6
4
2
020–39
Age (years)
Num
ber
of c
ases
40�
Figure 2. Age and gender distribution of tuberculosis cases,NSW/QLD cluster, October 2000–July 2012.Source: Notifiable Conditions Information ManagementSystem, NSW Ministry of Health.
Ongoing transmission of tuberculosis in Aboriginal communities in NSW
Vol. 24(1) 2013 NSW Public Health Bulletin | 39
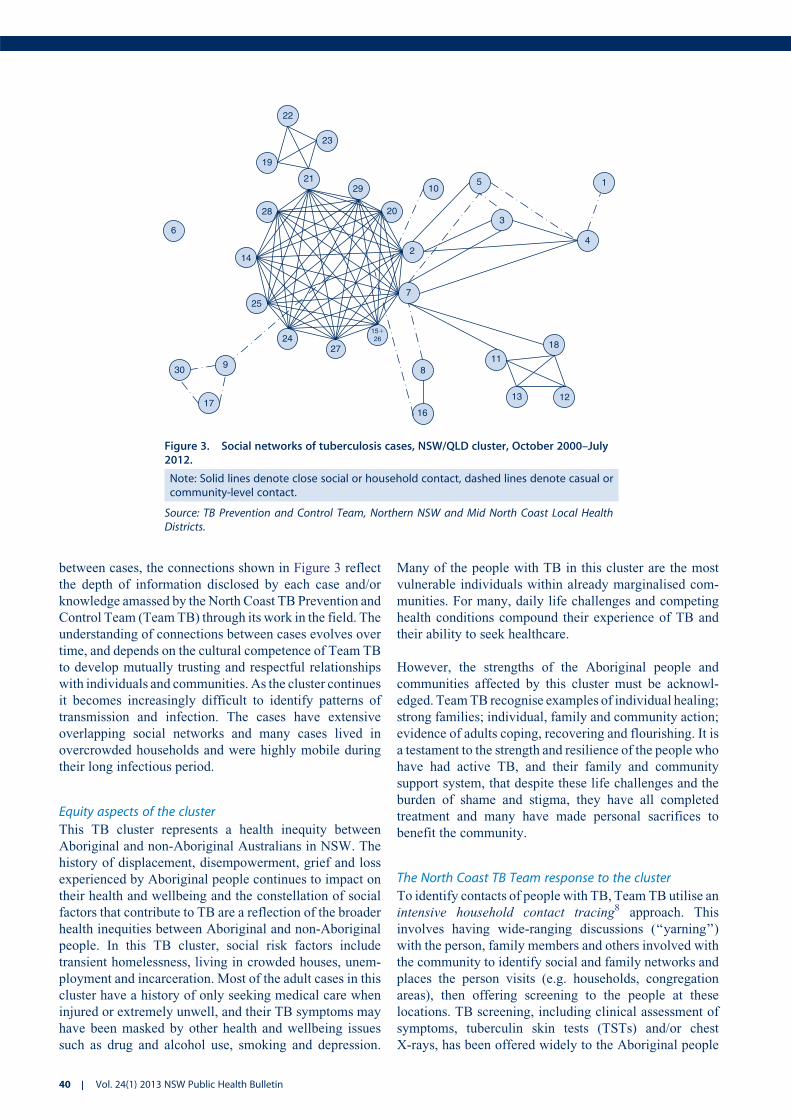
between cases, the connections shown in Figure 3 reflect
the depth of information disclosed by each case and/or
knowledge amassed by the North Coast TB Prevention and
Control Team (TeamTB) through its work in the field. The
understanding of connections between cases evolves over
time, and depends on the cultural competence of Team TB
to develop mutually trusting and respectful relationships
with individuals and communities. As the cluster continues
it becomes increasingly difficult to identify patterns of
transmission and infection. The cases have extensive
overlapping social networks and many cases lived in
overcrowded households and were highly mobile during
their long infectious period.
Equity aspects of the cluster
This TB cluster represents a health inequity between
Aboriginal and non-Aboriginal Australians in NSW. The
history of displacement, disempowerment, grief and loss
experienced by Aboriginal people continues to impact on
their health and wellbeing and the constellation of social
factors that contribute to TB are a reflection of the broader
health inequities between Aboriginal and non-Aboriginal
people. In this TB cluster, social risk factors include
transient homelessness, living in crowded houses, unem-
ployment and incarceration. Most of the adult cases in this
cluster have a history of only seeking medical care when
injured or extremely unwell, and their TB symptoms may
have been masked by other health and wellbeing issues
such as drug and alcohol use, smoking and depression.
Many of the people with TB in this cluster are the most
vulnerable individuals within already marginalised com-
munities. For many, daily life challenges and competing
health conditions compound their experience of TB and
their ability to seek healthcare.
However, the strengths of the Aboriginal people and
communities affected by this cluster must be acknowl-
edged. TeamTB recognise examples of individual healing;
strong families; individual, family and community action;
evidence of adults coping, recovering and flourishing. It is
a testament to the strength and resilience of the people who
have had active TB, and their family and community
support system, that despite these life challenges and the
burden of shame and stigma, they have all completed
treatment and many have made personal sacrifices to
benefit the community.
The North Coast TB Team response to the cluster
To identify contacts of people with TB, TeamTB utilise an
intensive household contact tracing8 approach. This
involves having wide-ranging discussions (‘‘yarning’’)
with the person, family members and others involved with
the community to identify social and family networks and
places the person visits (e.g. households, congregation
areas), then offering screening to the people at these
locations. TB screening, including clinical assessment of
symptoms, tuberculin skin tests (TSTs) and/or chest
X-rays, has been offered widely to the Aboriginal people
22
23
19
2129
20
10
2
3
5 1
4
7
2724
9
25
14
28
6
30
17
15�26
8
16
13
11
12
18
Figure 3. Social networks of tuberculosis cases, NSW/QLD cluster, October 2000–July2012.
Note: Solid lines denote close social or household contact, dashed lines denote casual orcommunity-level contact.
Source: TB Prevention and Control Team, Northern NSW and Mid North Coast Local HealthDistricts.
40 | Vol. 24(1) 2013 NSW Public Health Bulletin

in North Coast towns. This is in response to the Aboriginal
communities’ concern; recognition of the extended social
networks and high mobility in Aboriginal communities
which result in a high number of close contacts, many of
whom can be difficult to identify and/or locate; leads
provided through contact tracing; and identification that
not all infected people were being reached through contact
tracingmodels. Community-wide screening is also utilised
when the community is not aware of the identity of a case
as it allows for confidentiality to be maintained. These
screening approaches have been developed by Team TB in
conjunctionwith communities and local Aboriginal Health
Workers. Early in the public health response to the cluster,
‘concentric circle’ contact tracing was used in line with
NSW guidelines,6 however retrospective identification of
connections between cases andTST data revealed that with
this approach people at risk of infection were not always
nominated.
Team TB’s response to the cluster is guided by the
principles of cultural respect, equity and partnership with
Aboriginal communities9 and community engagement is
central to the public health response. In particular, Team
TBhas invested in the development of cultural competence
and awareness sharing with the community (i.e. two-way
learning). They have consulted with Aboriginal community
groups and leaders, a range of government and non-
government service providers, and Aboriginal people
affected by TB to develop appropriate response strategies.
Team TB participates in a range of activities with commu-
nities to facilitate shared ownership of solutions to the
ongoing transmission of TB. The recruitment of Aborigi-
nal Health Workers into Team TB has strengthened its
capacity to develop and implement strategies that are
acceptable to all parties, while being feasible within the
broader social and cultural context.
DiscussionThis paper describes the only reported instance of ongoing
transmission of TB in NSW, the public health response to
the cluster, and the rationale for this response.
The limitations of routine TB contact tracing approaches
have been documented in the international literature10,11
and are amplified in vulnerable groups such as Aboriginal
people.12 In this cluster, cases were identified using a
combination of contact tracing and community-wide
screening for Aboriginal people. Novel methods of contact
tracing that focus on social networks, locations and beha-
vioural factors have been successfully used to examine TB
clusters and outbreaks overseas13–16 and their application
in Australian Aboriginal communities warrants further
investigation.
The uptake of treatment for latent TB infection remains a
major ongoing challenge in the response to the cluster.
More than 1000 TSTs have been provided as part of
screening, and all individuals with latent TB infection
are offered preventive treatment. Uptake and completion
is high in high-risk child contacts, facilitated by directly
observed treatment or support and monitoring by TB
nurses. However, many infected adults decline treatment
for latent TB infection or fail to complete the 6-month
course of isoniazid. This highlights the significant ethical
tension between individual autonomy and community
benefit.
To date, TB prevention and control activities have concen-
trated on providing access to clinical services through
delivery of primary care focused on early diagnosis and
timely and effective treatment. The ongoing transmission
suggests closing the gap in TB rates between Aboriginal
and non-Aboriginal Australians involves acknowledging
that TB is embedded in a complex system17 influenced by
contemporary and historical social determinants of health.
It is time to consider a comprehensive primary health care
approach that addresses the range of social, environmental
and structural factors that contribute to TB and ill-health,
and those that contribute to good health.18 Team TB is
committed to operating on social justice principles with
practitioners dedicated to enabling individual clients and
communities19 and implementing micro-empowerment
strategies (e.g. working with people to build TB manage-
ment around how and where they live their lives, incorpo-
rating social and emotional care into TB management,
contributing to community-initiated events and programs
for community development, and giving ‘voice’ to people
who have been affected by TB).20
Empowerment is a recurrent theme throughout the litera-
ture on improving the health and wellbeing of Aboriginal
and Torres Strait Islander people. Empowerment is one of
the six components of the WHO Stop TB Strategy21 and is
incorporated inmanyTB control programs internationally.22
Furthermore, it is a viable public health strategy23 which
can be viewed from two complementary perspectives:
empowered communities can control TB and controlling
TB can empower communities. It is conceivable that
incorporating empowerment into the TB prevention and
control model could contribute more to the health of the
target group than just the elimination of TB. The challenge
is to move from business as usual to develop a deeper
understanding of the setting and to explore innovative and
novel ways to move from primary care towards primary
health care.
ConclusionThe ongoing transmission of TB amongst Aboriginal
Australians in NSW suggests closing the gap in TB rates
between Aboriginal and non-Aboriginal Australians
involves acknowledging that TB is embedded in a complex
system influenced by contemporary and historical social
Ongoing transmission of tuberculosis in Aboriginal communities in NSW
Vol. 24(1) 2013 NSW Public Health Bulletin | 41

determinants of health. An effective response depends on
working in partnership with Aboriginal communities to
develop strategies for TB control that empower communi-
ties and act on these social determinants of health.
AcknowledgmentsThe public health response to this TB cluster is a collaborative effort.
The authors acknowledge the contribution of Aboriginal community
members, TB nurses, Aboriginal Health Workers, public health unit
staff, clinicians, laboratory scientists, and other government and
community organisations in responding to this cluster. The authors
also acknowledge the expert guidance provided by the TB Cluster
Expert Panel, a subcommittee of the NSWTBAdvisory Committee.
References1. World Health Organization. Global tuberculosis report 2012.
Available at: http://apps.who.int/iris/bitstream/10665/75938/1/
9789241564502_eng.pdf (Cited 11 February 2013).
2. Barry C, Waring J, Stapleton R, Konstantinos A; National
Tuberculosis Advisory Committee, for the Communicable
Diseases Network Australia. Tuberculosis notifications in
Australia, 2008 and 2009. Commun Dis Intell 2012; 36(1):
82–94.
3. Moodie PM. Aboriginal health: Aborigines in Australian
society. Canberra: Australian National University Press; 1973.
4. Abrahams EW. Tuberculosis in Indigenous Australians. Med J
Aust 1975; 2(4 Suppl): 23–7.
5. Robertus LM, Konstantinos A, Hayman NE, Paterson DL.
Tuberculosis in the Australian Indigenous population: history,
current situation and future challenges. Aust N Z J Public Health
2011; 35: 6–9. doi:10.1111/j.1753-6405.2010.00663.x
6. NSW Health. Control guideline: Tuberculosis. Available at:
http://www.health.nsw.gov.au/factsheets/guideline/
tuberculosis.html (Cited 28 August 2012).
7. World Health Organization. Guidelines for treatment of tuber-
culosis. 4th ed. Geneva: World Health Organization; 2010.
8. Smart T. HIV and TB in practice for nurses: active TB case
finding. HIV & AIDS treatment in practice 2012; 196: 2–5.
9. Aboriginal Services Branch, NSW Department of Community
Services, Sydney. Working with Aboriginal people and
communities. Available at: http://www.community.nsw.gov.au/
docswr/_assets/main/documents/working_with_aboriginal.pdf
(Cited 14 February 2013).
10. ReichlerMR, Reves R, Bur S, ThompsonV,Mangura BT, Ford J
et al. Evaluation of investigations conducted to detect and
prevent transmission of tuberculosis. JAMA 2002; 287: 991–5.
doi:10.1001/jama.287.8.991
11. Marks SM, Taylor Z, Qualls NL, Shrestha-Kuwahara RJ,
Wilce MA, Nguyen CH. Outcomes of contact investigations of
infectious tuberculosis patients. Am J Respir Crit Care Med
2000; 162: 2033–8. doi:10.1164/ajrccm.162.6.2004022
12. Cook VJ, Shah L, Gardy J. Modern contact investigation
methods for enhancing tuberculosis control in aboriginal
communities. Int J Circumpolar Health 2012; 71: 18643.
doi:10.3402/ijch.v71i0.18643
13. McElroy PD, Rothenberg RB, Varghese R, Woodruff R, Minns
GO, Muth SQ et al. A network-informed approach to investi-
gating a tuberculosis outbreak: implications for enhancing
contact investigations. Int J Tuberc Lung Dis 2003; 7(Suppl 3):
S486–93.
14. FitzpatrickLK,Hardacker JA,HeirendtW,AgertonT, StreicherA,
Melnyk H et al. A preventable outbreak of tuberculosis investi-
gated through an intricate social network. Clin Infect Dis 2001;
33: 1801–6. doi:10.1086/323671
15. Sterling TR, Thompson D, Stanley RL, McElroy PD, Madison A,
Moore K et al. A multi-state outbreak of tuberculosis among
members of a highly mobile social network: implications
for tuberculosis elimination. Int J Tuberc Lung Dis 2000;
4: 1066–73.
16. Cook VJ, Sun SJ, Tapia J, Muth SQ, Arguello DF, Lewis BL
et al. Transmission network analysis in tuberculosis contact
investigations. J Infect Dis 2007; 196: 1517–27. doi:10.1086/
523109
17. van Beurden E, Kia A. Wicked problems and health promotion:
reflections on learning. Health Promot J Austr 2011; 22(2):
83–4.
18. Keleher H. Why primary health care offers a more comprehen-
sive approach to tackling health inequities than primary care.
Aust J Primary Health 2001; 7(2): 57–61. doi:10.1071/PY01035
19. World Health Organization. Ottawa Charter for Health Promo-
tion. Available at: http://www.who.int/healthpromotion/
conferences/previous/ottawa/en/ (Cited 16 October 2012).
20. Tsey K, Whiteside M, Haswell-Elkins M, Bainbridge R, Cadet-
James Y, Wilson A. Empowerment and Indigenous Australian
health: a synthesis of findings from the Family Wellbeing
formative research. Health Soc Care Community 2010; 18(2):
169–79. doi:10.1111/j.1365-2524.2009.00885.x
21. World Health Organization. The Stop TB Strategy. Available at:
http://www.who.int/tb/strategy/stop_tb_strategy/en/index.html
(Cited 16 October 2012).
22. World Health Organization and Stop TB Partnership. Empow-
erment and involvement of tuberculosis patients in tuberculosis
control: Documented experiences and interventions. Available
at: http://whqlibdoc.who.int/hq/2007/WHO_HTM_STB_2007.
39_eng.pdf (Cited 14 February 2013).
23. Wallerstein N. What is the evidence on effectiveness of
empowerment to improve health? Copenhagen: WHO Regional
Office for Europe (Health Evidence Network Report); 2006.
Available at: http://www.euro.who.int/__data/assets/pdf_file/
0010/74656/E88086.pdf (Cited 16 October 2012).
42 | Vol. 24(1) 2013 NSW Public Health Bulletin

Australia's role in promoting and supportingtuberculosis control in the WesternPacific Region
Kerrie A. Shaw
South Eastern Sydney Local Health District (Northern Sector)and St Vincent’s Hospital (formerly Australian RespiratoryCouncil, Sydney)
Email: [email protected]
Abstract: Twenty-one percent of the world’s
tuberculosis cases are found in theWestern Pacific
Region. The region has demonstrated a lower rate
of decline in incidence than the regions of Africa,
the Americas and Europe. Issues around drug
resistance, human immunodeficiency virus and
diabetes impact on the burden of tuberculosis
disease in the Western Pacific Region. Australia
has exhibited a low and relatively stable tubercu-
losis incidence rate but has not progressed toward
the desired international goal for tuberculosis
elimination (,1 case per million population).
The pathogenesis and transmission of tuberculosis
make it difficult to achieve elimination within a
geographically defined area. These aspects of
disease control are amplified by globalisation
and Australia’s increasing economic and strategic
engagement within the Western Pacific Region
and South-East Asia. Promoting and supporting
tuberculosis control within the Western Pacific
Region provides an opportunity for Australia to
maintain its low tuberculosis incidence rate and
progress toward elimination.
There has been major progress in reducing tuberculosis
(TB) incidence and deaths worldwide since the World
Health Organization (WHO) declared TB a global emer-
gency in 1993, yet the global situation continues to be
described as a TB epidemic.1
Significantly for Australia, 60% of the world’s TB cases
are found in the Asia Pacific, which constitutes the two
geographical areas described by WHO as the Western
Pacific Region (WPR) (which includes Australia) and the
South-East Asia Region (SEAR) (Figure 1). Both regions
demonstrated lower rates of decline in TB incidence from
2010 to 2011 than the regions of Africa, the Americas
and Europe (2.3%, 2.0%, 3.1%, 3.8%, 8.5% respectively).1
As demonstrated by national data, the profile of TB in
Australia is affected by the burden of TB in these two
regions, with approximately 73% of TB cases notified in
Australia being born in the WPR (30%) or the SEAR
(43%).1–3 This paper will outline the profile of TB in the
WPR, Australia’s current role in regional* TB control and
the importance of Australia’s strategic engagement in the
WPR in sustaining an effective local TB control program.
The Western Pacific RegionThe WPR (Figure 2) is home to nearly one-third of the
world’s population (approximately 1.8 billion people). It
comprises some 37 countries and is recognised as one of
the most diverse of the WHO regions, containing highly
developed countries (e.g. Australia, Japan, New Zealand,
the Republic of Korea and Singapore), some of the world’s
least developed countries (e.g. Cambodia, Kiribati, Samoa,
Solomon Islands and Vanuatu) and fast growing econo-
mies such as China and Viet Nam. Large variations in
population size exist between countries of the WPR, with
over 1 billion people residing in China and only 52 people
living in the Pitcairn Islands. Importantly, the WPR does
not include Indonesia, Timor-Leste, India or Bangladesh,
which contribute significantly to the burden of TB disease
in Australia;4 these countries are within the SEAR, which
is not the subject of this paper.
Tuberculosis control in the WPRWHO estimates that in 2011 there were approximately
1.7 million incident cases of TB in the WPR.1 The WPR
contains four of the 22 high TB incidence countries that
have received particular attention at the global level since
2000: Cambodia, China, the Philippines and Viet Nam
account for 17% of TB incident cases worldwide, and
almost 93% of the TB incident cases in the WPR.1
It is estimated that 28% of global multidrug-resistant
TB (MDR-TB) cases are within the WPR; China, the
Philippines and Viet Nam account for the majority of
*Unless otherwise indicated, the terms ‘regional’ and ‘region’ refer to the WPR.
10.1071/NB12119 Vol. 24(1) 2013 NSW Public Health Bulletin | 43

these cases.3 According to WHO, 84 countries have
reported cases of extensively drug-resistant TB (XDR-
TB).Within these countries, an average of 9% ofMDR-TB
cases have XDR-TB.1 Eight of the 37 (22%) countries of
the WPR have reported at least one case of XDR-TB.5
Particular challenges for TB control in Australia include its
proximity to, and relationship with, Papua New Guinea
(PNG), which had a TB incidence rate of 346 cases per
100 000 population in 2011.1 The Torres Strait Protected
Zone is an area within the narrow seaway separating
Australia and PNG; scattered throughout are over 100
islands (22 of which are currently inhabited). People from
the area are entitled to freemovement betweenAustralia and
PNG. Past uncertainty as to the role of different agencies in
treating people with TB in this area has resulted in a failure
to control TB in the Zone and has provided possible avenues
for transmission of MDR-TB to Australia. Significantly,
transmission ofMDR-TB has been recognised among PNG
nationals accessing health care in the Torres Strait Islands of
Queensland. From2004 to 2007, 24 cases ofMDR-TBwere
diagnosed among this group, representing a substantial
demand on human and financial resources and highlighting
the need for effective, collaborative TB control strate-
gies.2,4,6 While improvements in the care of MDR-TB have
made it possible to manage the disease in most cases, it
requires special multidisciplinary care by expert groups.2,4
MDR-TB cases arising in theWPRwill continue to have an
impact on TB control in Australia in the future. TB services
will need to plan to deal with these impacts.
The estimated prevalence of human immunodeficiency
virus (HIV) in new TB cases in the WPR was 2.3% in
2010,3 with countries ranging from less than 1%up to 15%.
WHO reports thatHIVhas the potential to reverse the gains
of TB control in several parts of the region, particularly in
Cambodia, Malaysia, PNG, Viet Nam and areas of China.3
Diabetes is associatedwith an increased risk of progression
to active TB disease. People with diabetes have a three
times greater risk of developing TB following exposure, a
four times greater risk of relapse post-TB treatment and a
five times greater risk of death during TB treatment.7 In
2011, the estimated prevalence of diabetes in theWPRwas
8.5% for the adult population; this is expected to increase
to 10.6% by 2030.8 Within the WPR, Pacific Island
countries/territories were reported as having the highest
diabetes prevalence rates (15.5%) globally in 2008 and
the largest rise in rates of fasting plasma glucose between
1980 and 2008.9 In Palau, Guam, Federated States of
WHO African Region
WHO Region of the Americas
WHO South-East Asia Region
WHO European Region
WHO Eastern Mediterranean Region
WHO Western Pacific Region
Figure 1. World Health Organization regions.Source: World Health Organization.
44 | Vol. 24(1) 2013 NSW Public Health Bulletin

Micronesia, Republic of Marshall Islands, American
Samoa and Commonwealth of Northern Mariana Islands
(Figure 2), TB programs are reporting 30–75% of their
caseload as having co-morbid diabetes.10 Diabetes is
reported to affect 4% of the Australian population, having
more than doubled between 1990 and 2008.11 If diabetes
prevalence rates continue to increase in Australia, this will
probably influence the incidence of TB. Furthermore,
increased numbers of people with co-morbid diabetes will
lead to increasingly complex casemanagement and greater
challenges for TB services.
The Regional Strategy to Stop Tuberculosis in the Western
Pacific (2011–2015)3 was adopted by the Western Pacific
Regional Office (WPRO) of WHO in October 2010
(Box 1). WHO data show that the WPR is on track to meet
the United Nations Millennium Development Goals to
halve the TB prevalence and mortality rates of the year
2000 by 2015.1
TB control strategies are implemented by each country in
the WPR through their national TB control programs.
Regional networks also exist to support these activities
and include not only the WPRO, but also the Union Asia
Pacific Region (Union APR) and the Secretariat of the
Pacific Community (SPC). These latter networks provide
structures through which the WPR can negotiate coopera-
tive activity with neighbouring regions such as the SEAR.
Australia’s current role in TB control in the WPRAustralia provides support for TB control in theWPR via a
number of government, non-government and international
organisations. Strengthening regional partnerships has
long been recognised by Australian TB authorities as an
important activity and is made explicit within the national
strategy for TB control.2,12 This approach also reflects
Australia’s current diplomatic approach which is ‘‘to
connect and create partnerships that build and strengthen
the global and regional rules-based order and have the
capacity to solve shared global problems’’.13 Regional
partnerships offer opportunities to advocate for local and
regional approaches to TB control, such as adequate
resourcing of TB programs; workforce development, edu-
cation and training; basic and operational research; as well
as technical assistance provided through structured pro-
grams which service the recipient and provider by offering
opportunities to gain and maintain skills. However,
strengthening regional TB partnerships has, to date, been
primarily a passive and opportunistic response by
Mongolia
ChinaJapan
Republic ofKorea
Lao People’sDemocratic Republic
Cambodia Viet Nam
Malaysia
Singapore BruneiDarussalam
Palau
Philippines
Hong Kong SARNorthern Mariana Islands
Guam
Federated States ofMicronesia
Nauru Kiribati
Marshall Islands
TuvaluTokelau
SamoaAmerican Samoa
Cook IslandsFrench Polynesia
Pitcairn Islands
New Zealand
AustraliaNew Caledonia
FijiTonga
Wallis & Futuna
Solomon IslandsPapua New Guinea
Vanuatu Niue
Macao SAR
Figure 2. Countries and areas of the World Health Organization Western Pacific Region.Source: World Health Organization.
Australia’s role in promoting and supporting tuberculosis control in the Western Pacific Region
Vol. 24(1) 2013 NSW Public Health Bulletin | 45

individuals and organisations within Australia to an
expressed need, rather than a structured strategic approach
to regional disease control.
The Australian Government is committed to the United
Nations Millennium Development Goals that aim to maxi-
mise the impact of foreign aid to improve the lives of the
poor. TB has long been associated with poverty and those
people vulnerable to ill health through socio-economic,
biological and environmental factors.14 Foreign aid con-
stitutes 2% ($5.2 billion) of the Federal Budget in 2012–13.
Seventy percent of the foreign aid budget in 2015 is to go to
the Asia Pacific Region;15 of this, approximately $1.5
billion will be spent in countries of the WPR. The funded
programs support TB control by addressing poverty,
improving policing and building stability (PNG, Solomon
Islands, Vanuatu, Kiribati, Tuvalu and Nauru); improving
access to immunisation, higher education and drinkable
water (Kiribati); and improving education and agricultural
productivity (Cambodia and Laos).16 Of the foreign aid
budget in 2012–13, $70 million is allocated to the Global
Fund to Fight AIDS, Tuberculosis and Malaria.
Specific Australian TB promotionand support in the WPRThe Australian Government has recently endorsed The
strategic plan for control of tuberculosis in Australia:
2011–2015.2 While this plan outlines a strategy for TB
control in Australia, it incorporates a regional approach to
disease control and aligns Australian initiatives with those
detailed in the WHO’s Regional Strategy to Stop Tubercu-
losis in the Western Pacific 2011–2015.3
There are a range of agencies supporting TB control in the
WPR. Australia’s TB laboratory network, along with those
from New Zealand and the United States, provide TB
culture and drug susceptibility testing to countries of the
WPR, as well as Timor-Leste. These networks also
contribute to regional laboratory capacity building through
education and training. Research organisations such as the
Woolcock Institute of Medical Research, the Centenary
Institute, the Burnet Institute, and theWalter andElizaHall
Institute ofMedical Research, aswell as variousAustralian
universities, have been investing in TB in the WPR and
contributing to increased regional capacity for operational
research. International advocacy agencies such as
RESULTS (International) Australia actively lobby the
Federal Government on regional aid issues, including TB.
Non-government agencies fund TB capacity building
projects, such as the partnership between the Australian
Respiratory Council (ARC), the Thoracic Society of
Australia and New Zealand and the Cambodia Anti-
Tuberculosis Association, combating TB in the villages
and factories of Phnom Penh.
The ARC is the Australian constituent member of the
International Union Against Tuberculosis and Lung
Disease (the Union), the international organisation spear-
heading global efforts against TB throughout the last
century. This relationship affords opportunities for region-
al dialogue on all aspects of TB control, via the UnionAPR
Council and Scientific Committees. The ARC has been
supporting regional education and training activities for
clinicians, laboratories, nurses and allied health workers
since the 1950s, most recently in partnership with the
WPRO, SPC, the Pacific Island Health Officers’ Associa-
tion and the United States Centers for Disease Control and
Prevention. Australian TB experts are engaged by coun-
tries themselves, the WPRO, the Union APR and SPC to
provide technical assistance to TB programs and to partic-
ipate in regional discussions on TB control, such as the
biennial Pacific Stop TBmeetings andUnionAPRRegional
Conferences.
WHO, the Union APR and the SPC all struggle to meet the
technical needs within the region. The strategic plan for
Box 1. Regional Strategy to Stop Tuberculosis (TB) in the Western Pacific (2011–2015)
Goal
To reduce by half the prevalence of andmortality from all forms of TB by 2015, relative to 2000 levels, in all countries with a high
burden of TB by moving towards universal access to diagnosis and treatment of all forms of TB, including smear-negative and
multidrug and extensively drug-resistant TB.
Objectives
1. Promoting universal and equitable access to quality TB diagnosis and treatment for all people
2. Strengthening TB laboratory capacity
3. Scaling up the programmatic management of drug-resistant TB
4. Expanding TB/HIV collaborative activities
5. Strengthening TB program management capacity
Source: World Health Organization. Regional Strategy to Stop Tuberculosis in the Western Pacific 2011–2015.
46 | Vol. 24(1) 2013 NSW Public Health Bulletin

control of tuberculosis in Australia: 2011–2015 offers an
opportunity for Australia to develop a more deliberate
and structured approach to regional engagement for
TB control.
TB control in AustraliaAs a developed nation and an island continent, Australia
has enjoyed low indices for burden of TB disease (mortali-
ty, incidence, HIV co-infection, MDR-TB and XDR-TB
disease).4 The incidence of TB in Australia has remained
low over the last 30 years (5–6 cases per 100 000 popula-
tion),4,17 however there has been little progress toward TB
elimination (,1 case per million population).1 Incidence
rates for the Australian-born population have decreased
while those for the overseas-born population are increas-
ing.4,17 There has been a continual increase in the number
and rate of multidrug-resistant cases since 1995 to a rate of
2.9% of TB cases in 2009 (n¼ 31).4,17 Almost 95% of
MDR-TB cases are in the overseas-born population.6
Regional success in controlling TB impacts on Australia’s
success in controlling this disease.2,4,6 The pathogenesis
and transmission of TB make it difficult to achieve
elimination within a geographically bound area.4 Globali-
sation and increasing economic and strategic engagement
within the region amplifies this effect. Australia is depen-
dent on immigration for population growth and economic
development.18 Australia’s ability to maintain current
indices of TB control and progress toward elimination
within this environment requires not only a range of
national strategies, but also international strategies which
contribute to global efforts to combat the disease. Immi-
gration trends need to be considered in the development of
strategies for controlling TB in Australia.
The Australian National TB Program requires the Com-
monwealth, states and territories to work together. The
Commonwealth monitors the incidence and prevalence of
TB on a national basis using data from the states and
territories. The National TB Advisory Committee pro-
vides expert guidance and support to the Commonwealth
on issues related to TB control. The states and territories
have complementary roles to the Commonwealth, includ-
ing managing TB services; ensuring close working rela-
tionships between public health, laboratories, clinicians
and TB services; and conducting research.12 The TB
programs in the states and territories are very differently
structured and each have their own models of care for
delivering TB services. Faced with increasing health
system rationalisation and focus on acute care delivery
and non-communicable diseases, Australian TB programs
are increasingly reporting concerns regarding their sus-
tainability and program maintenance.19–22 These con-
cerns relate to the ageing workforce, the provision of
training and education, service fragmentation, financial
resourcing, sustainable drug supply and access to vacci-
nation for at-risk groups.
Australia’s future role in TB control in the WPRWhile it has been a considerable achievement tomaintain a
low TB incidence rate in Australia, progression towards
TB elimination, and perhaps ongoing maintenance of
current achievements, presents a significant challenge.
The maintenance and advancement of TB control in
Australia requires: a commitment to TB program funding
at national, state and local levels; investment in basic and
operational TB research in Australia and the WPR; and
financial commitment to support regional collaboration
among experts to address local and regional issues and to
provide mentoring and technical support to regional part-
ners. Strategic engagement with regional partners provides
an opportunity to progress these objectives while also
providing opportunities for Australian health workers to
increase their knowledge and skills in TBmanagement and
to undertake TB research. Advocacy has a role to play in
increasing theAustralian public’s understanding of TB and
to mobilise community and public support for enhanced
efforts toward TB elimination in Australia and the region.
ConclusionThe profile of TB in the WPR is reflected in the profile of
TB in Australia. Australia’s role in the WPR includes a
range of capacity building, advocacy and research activi-
ties. Increased and strategic engagement within the region
offers Australia an opportunity to progress towards TB
elimination and to contribute to regional and global TB
elimination efforts.
References1. World Health Organization. Global tuberculosis report 2012.
Geneva: World Health Organization; 2012.
2. National Tuberculosis Advisory Committee (NTAC) of
Communicable Disease Network Australia (CDNA). The stra-
tegic plan for control of tuberculosis in Australia: 2011–2015.
Available at: http://www.health.gov.au/internet/main/
publishing.nsf/Content/cda-cdi3603i.htm (Cited 18 January
2013).
3. World Health Organization. Regional Strategy to Stop
Tuberculosis in the Western Pacific 2011–2015. Available at:
http://www.wpro.who.int/tb/documents/policy/2010/regional_
strategy/en/index.html (Cited 10 October 2012).
4. Barry C, Waring J, Stapeldon R, Konstantinos A; National
Tuberculosis Advisory Committee, for the Communicable Dis-
eases NetworkAustralia. Tuberculosis notifications inAustralia,
2008 and 2009. Commun Dis Intell 2012; 36(1): 82–94.
5. World Health Organization. Frequently asked questions - XDR-
TB.Available at: http://www.who.int/tb/challenges/xdr/faqs/en/
index.html (Cited 20 May 2013).
6. National Tuberculosis Advisory Committee multi-drug resistant
tuberculosis: information paper (October 2007). Commun Dis
Intell Q Rep 2007; 31(4): 406–9.
7. Baker MA, Harries AD, Jeon CY, Hart JE, Kapur A, Lonnroth K
et al. The impact of diabetes on tuberculosis treatment outcomes:
a systematic review. BMC Med 2011; 9: 81. doi:10.1186/1741-
7015-9-81
Australia’s role in promoting and supporting tuberculosis control in the Western Pacific Region
Vol. 24(1) 2013 NSW Public Health Bulletin | 47
8. International Diabetes Federation. Global Diabetes Atlas. 5th ed.
2012. Available at: http://www.idf.org/diabetesatlas/5e/
western-pacific (Cited 14 November 2012).
9. Danaei G, Finucane M, Lu Y, Singh GM, Cowan MJ, Paciorek
CJ et al. National, regional, and global trends in fasting plasma
glucose and diabetes prevalence since 1980: systematic analysis
of health examination surveys and epidemiological studies with
370 country-years and 2.7million participants. Lancet 2011; 378
(9785): 31–40.
10. Curry International Tuberculosis Center. CNTC Newsletter
Archive – Winter 2011. Standards for TB and Diabetes Devel-
oped for Pacific Islanders. Available at: http://www.currytb
center.uscf.edu/aboutus/newsarchive/ctnc_news_2011Q1.cfm
(Cited 20 October 2012).
11. Australian Institute of Health and Welfare. Diabetes prevalence
in Australia: detailed estimates for 2007–08; July 2011. Diabetes
Series no 17. Cat no. CVD 56. Canberra: AIHW.
12. National TB Advisory Committee (NTAC) of Communicable
Disease Network Australia (CDNA). National Strategic
Plan for TB Control in Australia beyond 2000. March 2002.
Available at: http://www.health.gov.au/internet/main/
publishing.nsf/Content/cda-pubs-other-tb_plan.htm (Cited
12 September 2012).
13. Rudd K. The rise of the Asia Pacific and the role of creative
middle power diplomacy (Speech). 19 May 2011. Available
at: http://www.foreignminister.gov.au/speeches/2011/
kr_sp_110519.html (Cited 22 October 2012).
14. World Health Organization. Addressing Poverty in TB Control:
Options for National TB Control Programmes. 2005. Available
at: http://whqlibdoc.who.int/hq/2005/WHO_HTM_TB_2005.
352.pdf (Cited 12 September 2012).
15. Australian Government. AusAID – Summary of Australia’s
Overseas Aid Program 2012–13, Budget Highlights. 8 May
2012. Available at: http://www.ausaid.gov.au/Budgets/
Documents/budget-highlights-2012-13.pdf (Cited
22 October 2012).
16. Australian Government. Minister for Foreign Affairs. Aid
Budget Statement 2012–13. Canberra. 8May 2012. Available at:
http://www.budget.gov.au/2012-13/content/ministerial_
statements/ausaid/download/ausaid.pdf (Cited
21 October 2012).
17. OliverG. Tuberculosis notifications inAustralia, 1994.Commun
Dis Intell 1996; 20(5): 108–15.
18. Australian Bureau of Statistics. Cultural Diversity in Australia –
Reflecting a Nation: Stories from the 2011 Census, 2012–2013.
21 March 2012. ABS Cat. No. 2071.0. Available at: http://
www.abs.gov.au/ausstats/[email protected]/Lookup/2071.0mainþfeatures902012-2013 (Cited 12 October 2012).
19. Moore T. Absolute disaster: TB centre faces closure. Brisbane
Times. 1 August 2012.
20. Banner P (Session Chair). Key initiatives, challenges and
activities for the respective Jurisdictional Programs. Australian
TB Conference, Sydney, 1–2 November 2012.
21. ShawK. Regional issues and challenges and the potential impact
on our Australian TB Program. Australian TB Conference,
Sydney, 1–2 November 2012.
22. Moore T. Campbell Newman hear our cry: nurses rally against
TB changes. Brisbane Times. 8 August 2012.
48 | Vol. 24(1) 2013 NSW Public Health Bulletin

Diagnosis, investigation and managementof tuberculosis at an Australian zoo
Kate E. CharlesworthA, Larry VogelnestB,
Nicola StephensC and Guy B. MarksD
ANSW Public Health Officer Training Program, NSW Ministryof Health
BTaronga Wildlife Hospital, Taronga Conservation SocietyAustralia
CHealth Protection Branch, Victorian Department of HealthDDepartment of Respiratory Medicine, Liverpool Hospital
Human diseaseTuberculosis (Mycobacterium tuberculosis) is the greatest
killer in human history, and it continues to be a significant
problem today: it is estimated that one in three people in the
world are infected with tuberculosis (TB).1 Althoughmore
than 95% of infections occur in developing countries, in an
increasingly globalisedworldwith high levels of travel and
migration it is important that countries such as Australia
(with a relatively low incidence: 6 cases per 100 000
population in 2009) remain vigilant about this disease.2
Zoonotic diseaseM. tuberculosis infections have been reported in a wide
range of animal species.3 This occurs by reverse zoonosis;
that is, a human pathogen transmitted to animals.
M. tuberculosis is emerging as an important disease of
elephants. In parts of Asia, where there are high rates of
human infection, many elephants are used in religious and
cultural ceremonies, for transport, entertainment and tour-
ismand live in close associationwith humans.Once infected
by humans, animal-to-animal transmission can occur.4
Tuberculosis at an Australian zooIn November 2010 a post-partum, clinically healthy Asian
elephant cow tested positive on trunk wash culture for
M. tuberculosis and subsequently underwent a 12-month
course of treatment. In September 2011, on a routine health
check, a male chimpanzee that had been unwell was found
to have advanced active TB and was euthanased. In
October 2011, genotyping confirmed the chimpanzee’s
isolate as identical to that of the elephant.
The animal investigation and management
The frequency of screening of elephants was increased and
the remaining 17 chimpanzees were screened. Six chim-
panzees had one or more positive TB tests but no evidence
of active disease. These chimpanzees were treated prophy-
lactically. Enhanced infection control and biosecurity
measures were implemented and all outgoing mammal
transactions were suspended. A program of screening and
monitoring for the Zoo’s entire mammal population
commenced. No cases of TB have since been diagnosed in
any Zoo mammal or wildlife from within the Zoo grounds.
The NSW Health investigation
After diagnosis of the elephant NSW Health screened, by
tuberculin skin test (TST), more than 50 Zoo staff who had
been in contact with the elephant. After the elephant and
chimpanzee were linked in October 2011, the investigation
was extended: an expert panel was convened and the
screening population was widened. A total of 138 staff
were screened by questionnaire and TST. Management
included enhanced infection control measures and com-
munication and education for Zoo staff.
No cases of active disease were found in Zoo staff. There
was a paired TST conversion in four of 47 cases who had
both pre- and post-exposure TSTs, and close contact with
the elephant appeared to be the most likely risk factor in
these conversions.
Transmission pathway investigation
There were several hypotheses as to how M. tuberculosis
may have been transmitted from the elephant to the
chimpanzee: aerosol, vector (e.g. bird, rodent, possum),
elephant faeces or fomite (any object or substance capable
of carrying infectious organisms, for example, soft vege-
tation such as leaves and branches used as animal food,
equipment, clothing, waste disposal bins). The investiga-
tion included literature reviews, international consultation,
on-site inspections, analysis of prevailing winds, analysis
of staff and volunteer screening results and questionnaires.
The study was unable to determine a plausible pathway of
transmission that was consistent with the known transmis-
sion dynamics of M. tuberculosis.
This study highlights the value of systematic risk assess-
ment in the management of TB in captive animals.
References1. Buff A, Raviglione M. Tuberculosis. In: Heymann DL, editor.
Control of Communicable Diseases Manual. Washington:
American Public Health Association; 2008. p. 639–60.
2. Barry C, Waring J, Stapledon R, Konstantinos A; National
Tuberculosis Advisory Committee, for the Communicable
Diseases Network Australia. Tuberculosis notifications in
Australia, 2008 and 2009.Commun Dis Intell 2012; 36(1): 82–94.
3. Vogelnest L. Tuberculosis: an emerging zoonosis. N S W Public
Health Bull 2013; 24(1): 32–3.
4. Angkawanish T, Wajjwalku W, Sirimalaisuwan A,
Mahasawangkul S, Kaewsakhorn T, Boonsri K et al.
Mycobacterium tuberculosis infection of domesticated Asian
elephants, Thailand. Emerg Infect Dis 2010; 16(12): 1949–51.
doi:10.3201/eid1612.100862
10.1071/NB13003 Vol. 24(1) 2013 NSW Public Health Bulletin | 49
BUG BREAKFAST IN THE BULLETIN

Leprosy
Praveena J. GunaratnamA, Warwick J. BrittonB
and Ann HofmeyrC
ANSW Public Health Officer Training Program,NSW Ministry of Health
BCentenary Institute of Cancer Medicine and Cell BiologyCDepartment of Clinical Infectious Diseases and Microbiology,Liverpool Hospital
Leprosy is a chronic disease caused by the bacillusMyco-
bacterium leprae, and is closely related to tuberculosis.
Leprosy remains a leading infectious cause of disability in
the world today; untreated it can lead to progressive and
permanent damage in the nerves, skin, limbs and eyes. It is
believed to be transmitted primarily from person-to-person
via nasal droplets. Although prevalence has reduced dra-
matically following the introduction of multidrug therapy,
there are still approximately 250 000 new cases of leprosy
every year, most of which occur in 17 countries including
India (accounting for about half of all new cases), Brazil,
Ethiopia, China and Indonesia.1
Leprosy is a relatively uncommon disease in Australia and
New South Wales (NSW), with just 24 notifications in the
state over the last 10 years. Most notifications are in
migrants from countries where leprosy is endemic, with
some locally acquired cases in Aboriginal communities.2
Leprosy is categorised according to the Ridley Jopling
classification. On one end of the spectrum are patients with
tuberculoid diseasewhohave good cell-mediated immunity
with few skin lesions and low bacterial load. At the other
extreme are patients with lepromatous leprosy who have
poor immunity and multiple lesions with high bacterial
load. Between these two classifications are the borderline
leprosy types, in which the immune response is thought to
be unstable.
The World Health Organization (WHO) has introduced a
simple classification that uses the number of skin lesions to
classify disease as paucibacillary (up to five skin lesions) or
multibacillary (more than five skin lesions). Multibacillary
leprosy roughly correlates with the lepromatous side of the
Ridley Jopling spectrum, and is both more infectious and
takes longer to treat than other forms of the disease.3
DiagnosisDiagnosis is based on clinical suspicion of leprosy as a
cause of skin lesions, or peripheral nerve thickening or
impairment in a person from a leprosy-endemic region.
Confirmation is by demonstration of acid-fast bacilli in
slit skin smears or biopsies. Other symptoms include
numbness or tingling in the hands and feet and swelling
of the face or earlobes. Nerve damage can take place
before, during or after treatment and may cause long-term
disability and disfigurement. Patients can suffer immune-
mediated reversal reactions during or after treatment,
including spontaneous increase in inflammation in skin
and nerve lesions, and erythema nodosum leprosum.
Reversal reactions occur in approximately 30% of multi-
bacillary patients and require treatment with corticoster-
oids for at least 5 months.
Most leprosy cases can be effectively treated with a multi-
drug regimen for 6 (paucibacillary cases) or 12 (multi-
bacillary cases) months. Patients are considered to be no
longer infectious once they start multidrug therapy, and
relapse rates are as low as 1% once treatment is complete.3
Prevention and controlThe Bacille Calmette-Guerin vaccine given to prevent
tuberculosis has a protective efficacy against leprosy of
between 28 and 60%, and vaccine administration to neo-
nates has contributed to a decrease in leprosy prevalence
worldwide.
Leprosy is not highly infectious and the absolute risk of
transmission has been estimated at 1% in endemic settings.
Risk factors include proximity to a case for a prolonged
period, for example through being in the same household.
A single dose of rifampicin given to contacts of multi-
bacillary patients has been found to reduce the incidence of
leprosy in a 2-year period.4
Management of leprosy cases is sometimes complicated by
the existing lack of clarity around the use of chemopro-
phylaxis in non-household contacts, as no definition exists
of the amount of time or closeness of contact which places
someone at risk. Further studies on the feasibility and cost-
effectiveness of administering chemoprophylaxis to non-
household contacts are needed.
References1. World Health Organization. Leprosy Update 2011. Wkly Epi-
demiol Rec 2011; 86: 389–99.
2. Slaon-Gardner T, Stirzaker S,KnuckeyD, PenningtonK,KnopeK,
Fitzsimmons G et al. Australia’s notifiable disease status 2009:
Annual report of the National Notifiable Diseases Surveillance
System. Commun Dis Intell 2011; 35: 61–131.
3. Rodrigues LC, Lockwood DNJ. Leprosy now: epidemiology,
progress, challenges, and research gaps. Lancet Infect Dis 2011;
11: 464–70. doi:10.1016/S1473-3099(11)70006-8
4. Moet FJ, PahanD,OskamL, Richardus J. Effectiveness of single
dose rifampicin in preventing leprosy in close contacts of
patients with newly diagnosed leprosy: cluster randomised
controlled trial. BMJ 2008; 336: 761–4. doi:10.1136/
bmj.39500.885752.BE
50 | Vol. 24(1) 2013 NSW Public Health Bulletin 10.1071/NB12068
BUG BREAKFAST IN THE BULLETIN

Communicable Diseases Report, NSW,November and December 2012
Communicable Diseases Branch
Health Protection NSW
For updated information, including data and facts
on specific diseases, visit www.health.nsw.gov.au
and click on Public Health and then Infectious
Diseases. The communicable diseases site is
available at: http://www.health.nsw.gov.au/
publichealth/infectious/index.asp.
Figure 1 and Tables 1 and 2 show notifications of commu-
nicable diseases with onset in November and December
2012 in New South Wales (NSW).
Enteric infectionsOutbreaks of suspected foodborne disease
There were seven outbreaks of suspected foodborne dis-
ease reported in NSW in the period (two in November and
five in December), affecting at least 59 people. All out-
breaks were thought to be caused by contaminated restau-
rant food. Of the seven outbreaks, three were reported
directly to Public Health Units by the treating doctors or
affected individuals, three were reported to the NSW Food
Authority and one was identified from an investigation of
Salmonella Singapore notifications clustered in time and
location.
S. Singapore, S. Typhimurium and Clostridium perfrin-
gens caused illness in one outbreak each. However, despite
thorough case interviews, the food vehicles could not
be identified in these outbreaks as cases consumed multi-
ple foods in each instance and no leftover foods were
available for testing. In the remaining four outbreaks, the
causative organism could not be identified due to either
lack of stool collection from ill people and/or lack of
sampling of suspected food vehicles.
Viral gastrointestinal disease
There were 115 outbreaks of gastroenteritis in institutions
reported in NSW in the period (72 in November and 43 in
December), affecting at least 1735 people. The previous
5-year average for this period was 51 outbreaks.
Of the 115 outbreaks:
• 52 outbreaks (45%) occurred in aged-care facilities;
41 (79%) of these had one or more stool samples
collected – norovirus was confirmed in 17 (41%) out-
breaks and rotavirus was confirmed in one (2%)
outbreak.
• 46 outbreaks (40%) occurred in child-care centres; 7
(15%) of these had one or more stool samples collected –
rotavirus was confirmed in one (14%) outbreak.
• 15 outbreaks (13%) occurred in hospitals; of these, one
or more stool samples were collected in 14 (93%)
outbreaks – norovirus was confirmed in 11 (79%) out-
breaks and rotavirus was confirmed in one (7%)
outbreak.
• Two outbreaks (2%) occurred in other health facilities
and no stool samples were collected.
A stool specimen was collected in 62 outbreaks (54%); of
these, no agent was identified in 32 outbreaks (52%).
Respiratory infectionsInfluenza
Influenza, as measured by the number of people who
presented with influenza-like illness to 59 of the state’s
largest emergency departments, continued to circulate at
low levels in NSW during November and December 2012.
In addition, the number of people who tested positive for
influenza A by diagnostic laboratories decreased to pre-
seasonal levels throughout November and December after
a peak in late June.
In November, there were:
• 68 presentations to emergency departments (rate 0.4 per
1000 presentations)
• 70 cases of laboratory-confirmed influenza including:
� 14 (20%) influenza A
� 56 (80%) influenza B.
In December, there were:
• 67 presentations to emergency departments (rate 0.4 per
1000 presentations)
• 45 cases of laboratory-confirmed influenza including:
� 25 (56%) influenza A
� 20 (44%) influenza B.
For a more detailed report on respiratory activity in NSW
see: http://www.health.nsw.gov.au/PublicHealth/Infectious/
influenza_reports.asp.
10.1071/NB13006 Vol. 24(1) 2013 NSW Public Health Bulletin | 51

Vaccine-preventable diseasesMeningococcal disease
Five cases ofmeningococcal disease were notified in NSW
in the period (three in November and two in December), a
decrease from nine notified for the same period in 2011.
The age of the cases ranged from 2 to 86 years; only one
case was aged less than 5 years. An elderly woman from
Hunter New England Local Health District died due to
meningococcal B infection during this period.
Of the five cases, three (60%) were due to serogroup B
(for which there is no vaccine), one (20%) was due to
serogroup C, and one (20%) was due to serogroup Y. The
notification of invasive meningococcal disease caused by
serogroup C was in a 26-year old male traveller who had
recently arrived from Europe.
Immunisation against meningococcal C disease is recom-
mended for all children at the age of 12 months, as well as
people at high risk of disease.1
Measles
Two cases of measles were notified in NSW in November
and none in December. This was a decrease compared to
the 77 notifications in September and October 2012. These
two cases were the last associated with the measles virus
genotype D8 outbreak that began in April. The outbreak
was linked to a young traveller who was infected in
Thailand.
The first case was a 13-year-old male from metropolitan
Sydney with an unknown vaccination history. He was
epidemiologically linked to his sister, who had previously
been notified with laboratory-confirmed measles (measles
virus genotype D8). The second case, the last of the
outbreak, was a 14-year-old unvaccinated male from
Sydney. The source of infection for this serologically-
confirmed measles infection remains unknown.
Two doses of measles-mumps-rubella vaccine are recom-
mended for all children (at 12 months and at 4 years of
age),1 as well as all young adults planning international
travel.
Pertussis
There were 741 pertussis notifications in NSW during the
reporting period (430 in November and 311 in December).
This is approximately one-third of the 2120 cases notified
for the same period in 2011, and represents the lowest
number of notifications for this 2-month period since
polymerase chain reaction diagnostic testing became
widely adopted in 2008. Most cases were in the 5–9-year
age group (n¼ 212), followed by the 10–14 (n¼ 153) and
0–4-year age groups (n¼ 117).
Direct protection for young infants remains available
through free vaccination for pertussis that is administered
at 2, 4 and 6 months of age. The first dose can be provided
as early as 6 weeks of age. There is also a booster dose at
3½ to 4 years. New parents and grandparents should also
discuss the benefits of pertussis vaccination for themselves
with their general practitioner.
Sexually transmissible infectionsand bloodborne virusesChlamydia
After reaching a peak of 2047 notifications in February
2012, the number of monthly chlamydia notifications has
decreased. There were 3291 notifications in NSW in
November and December 2012, identical to the same
period in 2011. A spike in chlamydia notifications is often
seen at the beginning of the year, though it was particularly
high in 2012.
Gonorrhoea
There were 635 confirmed cases of gonorrhoea notified in
NSW in November and December, an increase of 5.8%
compared to the same period in 2011 (n¼ 600). The
majority of notifications were in males (n¼ 508), and
the most commonly notified age group was 20–24 years
(n¼ 134).
Syphilis
There were 58 syphilis notifications in NSW in November
and 30 in December, a decrease since the monthly peak of
78 notifications in July. Delayed reportingmay account for
some of this decrease.
Lymphogranuloma venereum
There was an increase in the number of notifications of
lymphogranuloma venereum in the second half of 2012.
There were 11 notifications in NSW in November and
December, which is higher than the same period in 2011
(n¼ 4). Of the 11 notifications, all were male, ranging in
age from 18 to 75 years.
Reference1. National Health and Medical Research Council. The Australian
Immunisation Handbook. 9th ed. Canberra: Australian Govern-
ment Department of Health and Ageing; 2008.
52 | Vol. 24(1) 2013 NSW Public Health Bulletin

Figure 1. Reports of selected communicable diseases, NSW, Jan 2004 to Dec 2012, by month of onset.Preliminary data: case counts in recent months may increase because of reporting delays.Laboratory-confirmed cases only, except for measles, meningococcal disease and pertussis.BFV¼ Barmah Forest virus infections, RRV¼ Ross River virus infections, lab conf¼ laboratoryconfirmed, Men Gp C and Gp B¼meningococcal disease due to serogroup C andserogroup B infection, other/unk¼ other or unknown serogroups.NB: Multiple series in graphs are stacked, except gastroenteritis outbreaks.NB: Outbreaks are more likely to be reported by nursing homes and hospitals thanby other institutions.
0100200300400500600
Salmonella infections
048
12162024
Legionnaires� disease
0100200300400500
Cryptosporidiosis
0
5
10
15
20
25
Meningococcal disease
050
100150200250300350400450
Gonorrhoea
0
20
40
60
80Hepatitis A
080
160240320400480
Arbovirus infections
0400800
1200160020002400
Pertussis
010203040506070
Measles
Month of onset
data not comparable
Month of onset
0
40
80
120
160
0
1000
2000
3000
4000
Gastroenteritis outbreaks in institutionsCaseOutbreak
Cases Outbreaks
RRV BFV
Oct. 12–Dec. 12Male�5 y5–24 y
25–64 y65� yRural
50%
56%0%
67%7%
78%
Oct. 12–Dec. 12Male�5 y5–24 y
25–64 y65� yRural
45%
22%49%
26%3%
26%
Oct. 12–Dec. 12Male�5 y5–24 y
25–64 y65� yRural
81%
27%0%
72%1%
15%
Oct. 12–Dec. 12Male�5 y5–24 y
25–64 y65� yRural
64%
43%14%
36%7%
21%
Oct. 12–Dec. 12All outbreaksNursing homesHospitals
Child careSchoolsOther
183
1882
8003
Oct. 12–Dec. 12Male�5 y5–24 y
25–64 y65� yRural
93%
0%0%
43%57%21%
Oct. 12–Dec. 12Male�5 y5–24 y
25–64 y65� yRural
45%
55%15%
30%0%
25%
Oct. 12–Dec. 12Male�5 y5–24 y
25–64 y65� yRural
56%
22%22%
22%34%67%
Oct. 12–Dec. 12Male�5 y5–24 y
25–64 y65� yRural
46%
52%17%
25%6%
46%
Oct. 12–Dec. 12Male�5 y5–24 y
25–64 y65� yRural
51%
27%21%
40%12%40%
L. pneumophila
L. longbeachae
NSW PopulationMale�5 y5–24 y
25–64 y65� yRural
50%7%
27%53%13%46%
Men other/unk Men Gp C Men Gp B
S. Other S. Typhimurium
Measles lab confMeasles other
Jan. 04
Jan. 05
Jan. 06
Jan. 07
Jan. 08
Jan. 09
Jan.10
Jan.11
Jan.12
Jan. 04
Jan. 05
Jan. 06
Jan. 07
Jan. 08
Jan. 09
Jan.10
Jan.11
Jan.12
Jan. 04
Jan. 05
Jan. 06
Jan. 07
Jan. 08
Jan. 09
Jan.10
Jan.11
Jan.12
Jan. 04
Jan. 05
Jan. 06
Jan. 07
Jan. 08
Jan. 09
Jan.10
Jan.11
Jan.12
Jan. 04
Jan. 05
Jan. 06
Jan. 07
Jan. 08
Jan. 09
Jan.10
Jan.11
Jan.12
Jan. 04
Jan. 05
Jan. 06
Jan. 07
Jan. 08
Jan. 09
Jan.10
Jan.11
Jan.12
Jan. 04
Jan. 05
Jan. 06
Jan. 07
Jan. 08
Jan. 09
Jan.10
Jan.11
Jan.12
Jan. 04
Jan. 05
Jan. 06
Jan. 07
Jan. 08
Jan. 09
Jan.10
Jan.11
Jan.12
Jan. 04
Jan. 05
Jan. 06
Jan. 07
Jan. 08
Jan. 09
Jan.10
Jan.11
Jan.12
Jan. 04
Jan. 05
Jan. 06
Jan. 07
Jan. 08
Jan. 09
Jan.10
Jan.11
Jan.12
Communicable Diseases Report
Vol. 24(1) 2013 NSW Public Health Bulletin | 53
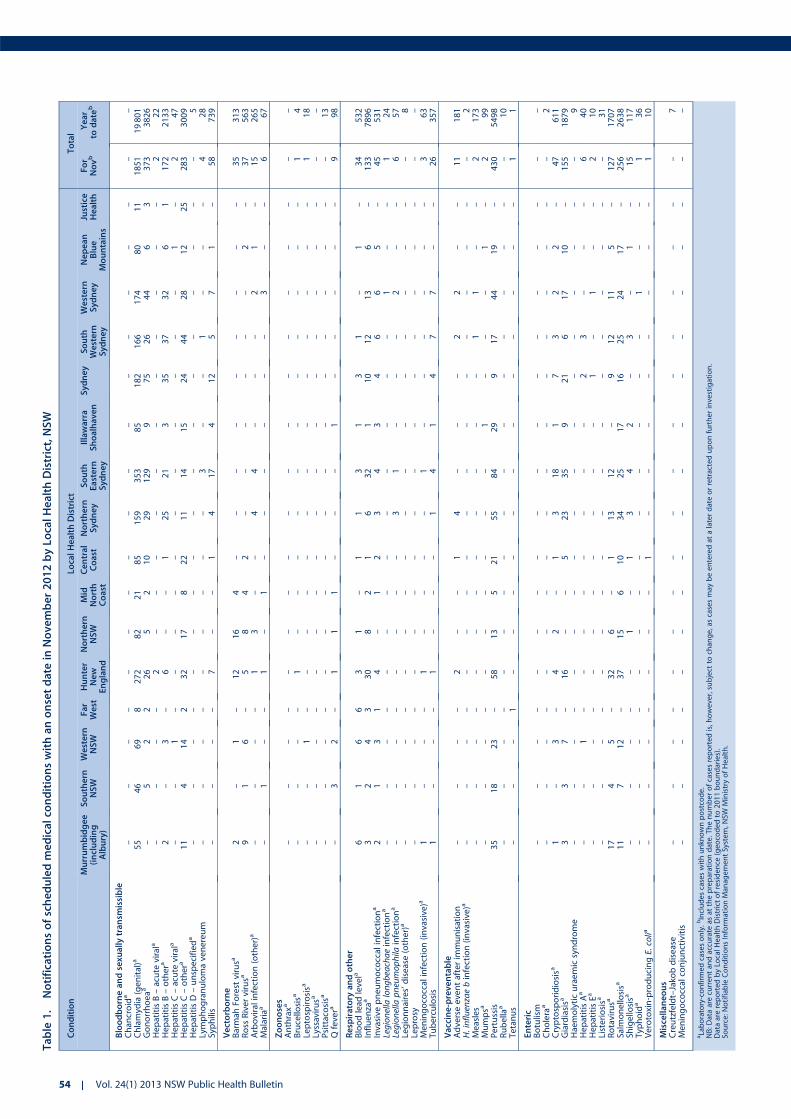
Table
1.
Notificationsofscheduledmedicalco
nditionswithanonsetdate
inNovember2012byLo
calHealthDistrict,NSW
Condition
LocalHealthDistrict
Total
Murrumbidgee
(including
Albury)
Southern
NSW
Western
NSW
Far
West
Hunter
New
England
Northern
NSW
Mid
North
Coast
Central
Coast
Northern
Syd
ney
South
Eastern
Syd
ney
Illawarra
Shoalhaven
Syd
ney
South
Western
Syd
ney
Western
Syd
ney
Nepean
Blue
Mountains
Justice
Health
For
Novb
Year
todate
b
Bloodborneandsexu
allytransm
issible
Chan
croid
a–
––
––
––
––
––
––
––
––
–Chlamyd
ia(genital)a
55
46
69
8272
82
21
85
159
353
85
182
166
174
80
11
1851
19801
Gonorrhoeaa
–5
22
26
52
10
29
129
975
26
44
63
373
3826
HepatitisB–acute
virala
––
––
2–
––
––
––
––
––
222
HepatitisB–othera
2–
3–
6–
–1
25
21
335
37
32
61
172
2133
HepatitisC–acute
virala
––
1–
––
––
––
––
––
1–
247
HepatitisC–othera
11
414
232
17
822
11
14
15
24
44
28
12
25
283
3009
HepatitisD–unspecifieda
––
––
––
––
––
––
––
––
–5
Lymphogranulomavenereum
––
––
––
––
–3
––
1–
––
428
Syphilis
––
––
7–
–1
417
412
57
1–
58
739
Vectorborne
Barmah
Forestvirusa
2–
1–
12
16
4–
––
––
––
––
35
313
Ross
Rivervirusa
91
6–
58
42
––
––
––
2–
37
563
Arboviralinfection(other)a
––
––
13
––
44
––
–2
1–
15
265
Malariaa
–1
––
1–
1–
––
––
–3
––
667
Zoonoses
Anthraxa
––
––
––
––
––
––
––
––
––
Brucello
sisa
––
––
1–
––
––
––
––
––
14
Leptospirosisa
––
1–
––
––
––
––
––
––
118
Lyssavirusa
––
––
––
––
––
––
––
––
––
Psittacosisa
––
––
––
––
––
––
––
––
–13
Qfevera
–3
2–
11
1–
––
1–
––
––
998
Respiratory
andother
Bloodlead
levela
61
66
31
–1
13
13
1–
1–
34
532
Influenza
a3
24
330
82
16
32
110
12
13
6–
133
7896
Invasive
pneumococcalinfectiona
21
31
4–
12
34
34
66
5–
45
531
Legionella
longbeachaeinfectiona
––
––
––
––
––
––
–1
––
124
Legionella
pneumophila
infectiona
––
––
––
––
31
––
–2
––
657
Legionnaires’disease(other)a
––
––
––
––
––
––
––
––
–8
Leprosy
––
––
––
––
––
––
––
––
––
Meningococcalinfection(invasive)a
1–
––
1–
––
–1
––
––
––
363
Tuberculosis
1–
––
1–
––
14
14
77
––
26
357
Vaccine-preventable
Adverseeventafterim
munisation
––
––
2–
–1
4–
––
22
––
11
181
H.influenzaebinfection(invasive)a
––
––
––
––
––
––
––
––
–2
Measles
––
––
––
––
––
––
11
––
2173
Mumpsa
––
––
––
––
––
1–
––
1–
299
Pertussis
35
18
23
–58
13
521
55
84
29
917
44
19
–430
5498
Rubella
a–
––
––
––
––
––
––
––
––
10
Tetanus
––
–1
––
––
––
––
––
––
11
Enteric
Botulism
––
––
––
––
––
––
––
––
––
Cholera
a–
––
––
––
––
––
––
––
––
2Cryptosporidiosisa
1–
3–
42
–1
318
17
32
2–
47
611
Giardiasisa
33
7–
16
––
523
35
921
617
10
–155
1879
Haemolyticuraemicsyndrome
––
––
––
––
––
––
––
––
–9
HepatitisAa
––
1–
––
––
––
–2
3–
––
640
HepatitisEa
––
––
––
––
––
–1
–1
––
210
Listeriosisa
––
––
––
––
––
––
––
––
–31
Rotavirusa
17
45
–32
6–
113
12
–9
12
11
5–
127
1707
Salm
onello
sisa
11
712
–37
15
610
34
25
17
16
25
24
17
–256
2638
Shigello
sisa
––
––
–1
–1
34
2–
3–
1–
15
117
Typ
hoid
a–
––
––
––
––
––
––
1–
–1
36
Verotoxin-producingE.colia
––
––
––
–1
––
––
––
––
110
Miscellaneous
Creutzfeldt–Jako
bdisease
––
––
––
––
––
––
––
––
–7
Meningococcalconjunctivitis
––
––
––
––
––
––
––
––
––
aLaboratory-confirm
edcasesonly.bIncludescaseswithunkn
ownpostcode.
NB:D
ataarecurrentan
daccurate
asat
thepreparationdate.Thenumberofcasesreported
is,h
owever,subject
tochan
ge,ascasesmay
beenteredat
alaterdateorretracteduponfurtherinvestigation.
Dataarereported
byLo
calH
ealth
Districtofresidence
(geocodedto
2011boundaries).
Source:Notifiab
leConditionsInform
ationMan
agementSystem,N
SWMinistryofHealth.
54 | Vol. 24(1) 2013 NSW Public Health Bulletin

Table
2.
Notificationsofscheduledmedicalco
nditionswithanonsetdate
inDecember2012byLo
calHealthDistrict,NSW
Condition
LocalHealthDistrict
Total
Murrumbidgee
(including
Albury)
Southern
NSW
Western
NSW
Far
West
Hunter
New
England
Northern
NSW
Mid
North
Coast
Central
Coast
Northern
Syd
ney
South
Eastern
Syd
ney
Illawarra
Shoalhaven
Syd
ney
South
Western
Syd
ney
Western
Syd
ney
Nepean
Blue
Mountains
Justice
Health
For
Decb
Year
todate
b
Bloodborneandsexu
allytransm
issible
Chan
croid
a–
––
––
––
––
––
––
––
––
–Chlamyd
ia(genital)a
60
24
57
6223
50
30
75
123
220
81
141
126
142
70
11
1440
21241
Gonorrhoeaa
11
61
14
62
714
74
564
13
43
10
1262
4088
HepatitisB–acute
virala
––
––
21
––
–2
––
1–
1–
729
HepatitisB–othera
21
11
51
–3
25
81
23
33
50
12
157
2290
HepatitisC–acute
virala
––
3–
––
––
––
––
––
–1
451
HepatitisC–othera
10
11
10
128
18
413
12
12
21
17
20
20
918
224
3233
HepatitisD–unspecifieda
––
––
––
––
––
––
––
––
–5
Lymphogranulomavenereum
––
––
––
––
–5
–2
––
––
735
Syphilis
––
––
11
–1
412
31
15
1–
30
769
Vectorborne
Barmah
Forestvirusa
––
––
12
65
21
–3
1–
––
–30
343
Ross
Rivervirusa
81
41
66
11
2–
2–
1–
2–
35
598
Arboviralinfection(other)a
––
––
22
––
4–
11
21
––
13
278
Malariaa
––
––
1–
––
––
––
–1
––
269
Zoonoses
Anthraxa
––
––
––
––
––
––
––
––
––
Brucello
sisa
––
––
––
––
––
––
––
––
–4
Leptospirosisa
––
––
1–
––
––
––
––
––
119
Lyssavirusa
––
––
––
––
––
––
––
––
––
Psittacosisa
––
––
––
––
––
––
––
––
–13
Qfevera
––
––
21
1–
1–
––
––
––
5103
Respiratory
andother
Bloodlead
levela
––
7–
6–
–1
–1
––
–1
3–
19
551
Influenza
a1
14
211
61
111
23
55
10
43
–88
7984
Invasive
pneumococcalinfectiona
11
––
51
11
26
5–
24
3–
32
563
Legionella
longbeachaeinfectiona
––
––
––
––
––
––
––
––
–24
Legionella
pneumophila
infectiona
––
––
––
––
2–
1–
–1
––
461
Legionnaires’disease(other)a
––
––
––
––
––
––
––
––
–8
Leprosy
––
––
––
––
––
––
––
––
––
Meningococcalinfection(invasive)a
–1
––
––
––
––
–1
––
––
265
Tuberculosis
1–
––
1–
––
–3
–5
71
––
18
375
Vaccine-preventable
Adverseeventafterim
munisation
1–
2–
1–
––
––
1–
11
––
7188
H.influenzaebinfection(invasive)a
––
––
––
––
––
––
––
––
–2
Measles
––
––
––
––
––
––
––
––
–173
Mumpsa
––
––
–2
––
–1
––
11
––
5104
Pertussis
29
16
12
–28
19
114
51
38
22
13
14
41
13
–311
5809
Rubella
a–
––
––
––
––
––
––
––
––
10
Tetanus
––
––
––
––
––
––
––
––
–1
Enteric
Botulism
––
––
––
––
––
––
––
––
––
Cholera
a–
––
––
––
––
––
––
––
––
2Cryptosporidiosisa
11
6–
64
–1
618
310
57
1–
69
680
Giardiasisa
53
9–
20
11
321
29
213
11
54
–127
2006
Haemolyticuraemicsyndrome
––
––
––
––
––
––
––
––
–9
HepatitisAa
––
––
––
––
1–
––
–1
––
242
HepatitisEa
––
––
––
––
––
––
––
––
–10
Listeriosisa
––
––
––
––
13
31
1–
––
940
Rotavirusa
43
3–
15
5–
––
6–
22
41
–45
1752
Salm
onello
sisa
20
39
131
19
14
10
37
40
15
22
26
38
15
–300
2938
Shigello
sisa
––
––
–1
––
11
–1
––
––
4121
Typ
hoid
a–
––
––
––
–1
2–
–2
1–
–6
42
Verotoxin-producingE.colia
––
––
1–
––
––
––
––
––
111
Miscellaneous
Creutzfeldt–Jako
bdisease
––
––
––
––
––
––
––
––
–7
Meningococcalconjunctivitis
––
––
––
––
––
––
––
––
––
aLaboratory-confirm
edcasesonly.bIncludescaseswithunkn
ownpostcode.
NB:D
ataarecurrentan
daccurate
asat
thepreparationdate.Thenumberofcasesreportedis,h
owever,subject
tochan
ge,ascasesmay
beenteredat
alaterdateorretracteduponfurther
investigation.
DataarereportedbyLo
calH
ealth
Districtofresidence
(geocodedto
2011boundaries).
Source:N
otifiab
leConditionsInform
ationMan
agementSystem,N
SWMinistryofHealth.
Communicable Diseases Report
Vol. 24(1) 2013 NSW Public Health Bulletin | 55

ContentsTuberculosis in NSW
1 Tuberculosis, public health and gatheringnew evidence to guide control efforts
Amanda Christensen, Chris Lowbridge,
Guy B. Marks and Vitali Sintchenko
3 EpiReview: Tuberculosis in NSW, 2009–2011
Chris Lowbridge, Amanda Christensenand Jeremy M. McAnulty
10 The use of mycobacterial interspersed repetitiveunit typing and whole genome sequencing to inform
tuberculosis prevention and control activities
Gwendolyn L. Gilbert and Vitali Sintchenko
15 Diagnosis, treatment and prevention of tuberculosisin children
Philip Britton, Carlos M. Perez-Velez and Ben J. Marais
22 Tuberculosis: an old world disease providing
new world challenges in NSW
Guy B. Marks, Amanda Christensen,
Vitali Sintchenko and Chris Lowbridge
24 Monitoring for adverse events among patients
on tuberculosis therapy
David Michail
27 Tuberculosis contact tracing within a schoolenvironment: lessons for the future
Pam Banner
29 Costs of a contact screening activity
in a neonatal intensive care unit
Kate E. Fisher, Nicole F. Cook and Guy B. Marks
32 Tuberculosis: an emerging zoonosis
Larry Vogelnest
34 What do we know about the outcomesof tuberculosis contact investigations in NSW?
Claudia C. Dobler
38 Ongoing transmission of tuberculosis
in Aboriginal communities in NSW
Sue Devlin and Erin Passmore
43 Australia’s role in promoting and supporting
tuberculosis control in the Western Pacific Region
Kerrie A. Shaw
Bug Breakfast in the Bulletin49 Diagnosis, investigation and management
of tuberculosis at an Australian zoo
Kate E. Charlesworth, Larry Vogelnest,Nicola Stephens and Guy B. Marks
50 Leprosy
Praveena J. Gunaratnam, Warwick J. Britton
and Ann Hofmeyr
Communicable Diseases Report, NSW51 November and December 2012
NSW PUBLIC HEALTH BULLETINTheNSW Public Health Bulletin is a peer-reviewedjournal produced by the NSWMinistry of Healthand indexed in Medline. It has a NSW focus,however, it aims to support the practice of publichealth more broadly.
Editors
Ms Beth StickneyBSc, Dipl Nutr Diet, MPH
Mr Andrew MilatBHMS Ed (Hons), MPH (Hons)
Editorial Manager
Kristy Goldsworthy
Editorial correspondence
Please address all correspondence andsubmissions to:The Editor, NSW Public Health BulletinLocked Mail Bag 961North Sydney NSW 2059 AustraliaEmail: [email protected]: +61 2 9424 5876Fax: +61 2 9391 9232
Submission of articles
The Bulletin accepts proffered andcommissioned articles along with shortreports, on all aspects of public health.Articles should be 1500–2000 words, notincluding tables and figures, and shouldinclude an abstract of up to 150 words.Articles should follow the journal style andlayout as closely as possible, as described inthe Instructions to Authors. Articles should beemailed in a Word for Windows format to:[email protected], and shouldbe accompanied by a covering letter signedby all authors and a License to Publish. TheInstructions to Authors, License to Publish andother useful information can be downloadedfrom the Bulletin website.
Distribution
The Bulletin is freely available from the Bulletinwebsite. Copies of the current issue and backissues can be downloaded in both PDF andHTML formats. If you would like to be notified
when new issues of the Bulletin are availableonline, subscribe to the early alert emailsystem at the Bulletin website. The early alertemail contains the contents of each new issuealong with electronic links to the articles.To receive a printed copy of the Bulletin,subscribe online at the Bulletin website, orcontact your local public health unit or theeditorial office.eISSN 1834-8610
The Bulletin uses digital publishing at all stagesof production as a priority over print. TheBulletin is printed on archival quality, chlorine-free paper using low volatility vegetable-based inks and uses computer-to-platetechnology. The acid-free paper meets thestandards of the American National StandardsInstitute for Information Sciences–Permanence of Paper for Printed LibraryMaterials, ANSI Z39.48-1992.
Website: www.publish.csiro.au/journals/phbCopyright & 2013 NSW Ministry of Health
56 | Vol. 24(1) 2013 NSW Public Health Bulletin


![WELCOME [storage.cloversites.com]storage.cloversites.com/grovecityalliancechurch/documents/Bulletin 01.05.13 2.pdfAdult Ministry Children’s Ministry Youth Ministry M&M Tube Fundraiser](https://img.pdfslide.net/doc/110x75/610008f953f4110c4f5ac2c2/welcome-010513-2pdf-adult-ministry-childrenas-ministry-youth-ministry-mm.jpg)