Embed Size (px)
Citation preview

Measuring of development&
Measuring of inequality
Nta UGC-NET dec-2018
UGC-NET PAPER-2 (ECO)
Online batch ,Lecture-29
Growth and Development, topic 1

Measuring of development

1.Measuring development
4.Gender inequality
Index.
2.HDI(1990)
1.PQLI(1979)
3.Multy-dimensional Poverty index(MPI)
2010
HDIReplaced HPI 1997

He therefore, combines three component indicators of Infant Mortality, Life Expectancy and Basic Literacy to measure performance in meeting the basic needs of the people.
1. Physical Quality Of Life Index (PQLI):
In 1979, D. Morris constructed a composite Physical Quality of Life Index (PQLI).
life expectancy is measured in terms of years, infant mortality rate in terms of per thousand and basic literacy rate in terms of percentage.

the choice of indicators are:
1. Life Expectancy
Indicator (LEI)
3. Literacy Indicator (LI)
2. Infant Mortality Indicator
(IMI)
For life exp. Upper limit – 77 years.Lower limit- 28 years.
For IMI-Upper limit- 09Lower - 229
For literacy rate. Upper limit – 100Lower limit- 0
Short forms- L.I.L

PQLI index is measured as-
PQLI= LEI+IMI+LI
3
PQLI is published by UNDP.
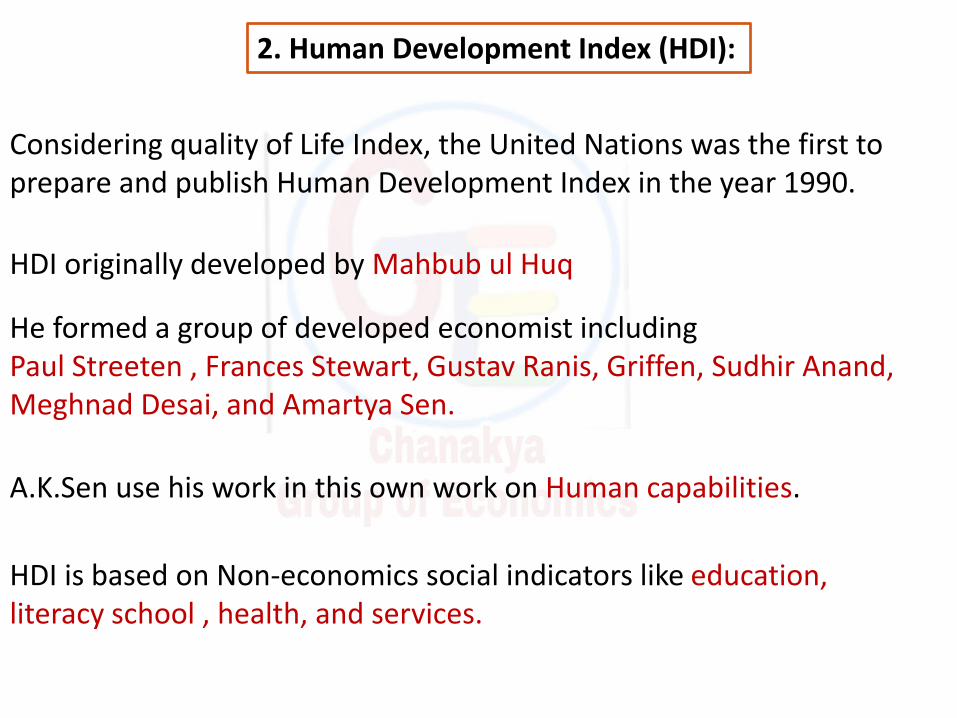
Considering quality of Life Index, the United Nations was the first to prepare and publish Human Development Index in the year 1990.
2. Human Development Index (HDI):
HDI originally developed by Mahbub ul Huq
He formed a group of developed economist including Paul Streeten , Frances Stewart, Gustav Ranis, Griffen, Sudhir Anand, Meghnad Desai, and Amartya Sen.
A.K.Sen use his work in this own work on Human capabilities.
HDI is based on Non-economics social indicators like education, literacy school , health, and services.
HDI undertaken by UNDP.
HDI rank all the countries vary within the 0 to 1 range.
0.80- 1= very high ranking 0.50-0.799= high ranking.0.338- 0.499= medium ranking.0- 0.337= low ranking.

the choice of indicators are:
1. Life Expectancy at birth(longivity)
3.Per capita income.2.Literacy rate.
(i) Living a long life or Longevity (LEI)
(iii) Standard of living on Real per capita GDP (SLI).
(ii) Being knowledgeable on Educational Attainment (Index EAI).
HDI = (1/3) (LEI + EAI + SLI)
Life expectancy – from 0 to 85 years.
Value vary form- 0 to 100
PCI vary from 100$ t0 75000$

It means education attained by the people of the country on an average basis.
(i) Longevity (LEF):
Longevity means life expectancy at birth. It refers to the number of years a newly born baby is expected to live. Life expectancy in India at present is 66 years.
(ii) Educational Attainment (EAI):
(а) Adult literacy rate (ALR)(b) Gross enrolment ratio (GER)
(a) Adult Literacy Rate (ALR):The rate or the percentage of people aged 15 and above who can understand, read and write a short and simple statement in their everyday life are known as literate.

(b) Gross Enrolment Ratio (GER):Gross Enrolment Ratio refers to the number of students enrolled at different levels of education. It is the percentage of population of different age groups engaged in educational pursuit.
(iii) Real GDP Per Capita or Standard of Living (SLI):It is considered as a measure of the standard of living of the people of a country.
In order to calculate human development index we are required to study and analyse longevity, educational attainment and real GDP per capita.

HDI and India
India rank 131 in 2017.130 in 2016, among 188 nations .
India HDI value is 0.640
Sri Lanka- 76.Maldives- 105Pak- 150Nepal-149
Norway- 1st
Australia- 2nd

In other words, none of these factors alone determines the welfare of the people. At the same time, we should note that National Income is not itself the single representative factor of welfare.
Quality Of Life Index (QLI):
Quality of life of the people is another index to measure the standard of living of the people in an economy.
It is influenced by national and per capita income of the people.
Many other factors like consumption, output, health, environment, education, freedom, security, non-violence peaceful atmosphere etc. also influence human welfare directly or indirectly.

The Global Multidimensional Poverty Index (MPI) was developed in 2010 by the Oxford Poverty & Human Development Initiative (OPHI) and the United Nations Development Programme.
3.Global Multidimensional Poverty Index (MPI)
and uses different factors to determine poverty beyond income-based lists. It replaced the previous Human Poverty Index.
The global MPI is released annually by OPHI and the results published on its website.
The global Multidimensional Poverty Index (MPI) is an international measure of acute poverty covering over 100 developing countries.

Dimension Indicators
Health•Child Mortality•Nutrition
Education•Years of schooling•School attendance
Living Standards
•Cooking fuel•Toilet•Water•Electricity•Floor•Assets
Global Multidimensional Poverty Index (MPI) indicators.

H: Percentage of people who are MPI poor (incidence of poverty)
A: Average intensity of MPI poverty across the poor (%)
The MPI is calculated as follows:
MPI= H * A
India has been ranked 37th out of 103 nations in the 2017 global Multi-dimensional Poverty Index (MPI),
according to a new report by the Oxford Poverty & Human Development Initiative. The OPHI is an economic research centre at the Oxford University, led by Professor Sabina Alkire.

4.Human Poverty Index
It was considered to better reflect the extent of deprivation in developed countries compared to the HDI.
The Human Poverty Index (HPI) was an indication of the standard of living in a country,
developed by the United Nations (UN) to complement the Human Development Index (HDI) and was first reported as part of the Human Development Report in 1997.
In 2010 it was Replaced by the UN's Multidimensional Poverty Index.

The HPI is derived separately for developing countries and a group of select high-income countries to better reflect socio-economic differences and also the widely different measures of deprivation in the two groups
longevity, knowledge and a decent standard of living.
The HPI concentrates on the deprivation in the three essential elements of human life already reflected in the HDI:

According to the UNDP, this index is a composite measure to quantify the loss of achievement within a country due to gender inequality
5.Gender Inequality Index (GII)
The Gender Inequality Index (GII) is an index for measurement of gender disparity that was introduced in the 2010 Human Development Report 20th anniversary edition by the United Nations Development Programme (UNDP).
It uses three dimensions to measure opportunity cost: reproductive health, empowerment, and labor market participation.

India ranks low at 108th position out of 144 countries in Global Gender Gap Index 2017 released by WEF Global Gender Gap
The new index was introduced as an experimental measure to remedy the shortcomings of the previous indicators, the Gender Development Index(GDI) and the Gender Empowerment Measure (GEM),
both of which were introduced in the 1995 Human Development Report

Measuring of inequality

1.The Lorenz Curve:
An American statistician Conard Lorenz (1905) used a diagram to show the relationship between the population groups and their respective shares.
The same diagram (Lorenz Curve) is used to show the relative inequality in the distribution of income at the world level.
The Lorenz Curve is obtained by plotting the cumulative percentage of the nation’s income against the cumulative percentage of the nation’s households or population receiving this income.

Generally, income is represented on the vertical axis of the diagram and households or population on the horizontal axis .
The Lorenz Curve is given by the indicated intermediate curve with the shaded area indicating the deviation from absolute equality and hence giving us a measure of the degree of inequality of income distribution.
a straight upward sloping line of absolute equality.
The curve on extreme right side of the figure the right angled line represents the limiting case of absolute inequality.

in actual practice no nation shows a completely equal distribution of income.
The lowest 20% of the population (or families) generally receive substantially less than 20% of income, whereas the highest 20% of the population (or families) receive more than 20% of incomes.
In that case there will be a curvature in the Lorenz curve as shown in the deviation zone.

If there is a trend towards a more equal distribution of income, the Lorenz curve will flatten out and move closer to the straight, bisecting line.
Indeed, if all of the income of a country were received by just one family, the curve would be a vertical line at a right angle to the horizontal axis like the extreme right hand side of the figure.
Lorenz curve is always right side of the equality line.
The more unequal the distribution of income, the more curvature there will be in the Lorenz curve.
2. The Gini Ratio:
with 0 representing perfect equality and 1 representing perfect inequality. Values over 1 are theoretically possible due to negative income or wealth.
The Gini index or Gini coefficient is a statistical measure of distribution developed by the Italian statistician Corrado Gini in 1912.
It is often used to measure economic inequality, measuring income distribution or, less commonly, wealth distribution among a population.
The coefficient ranges from 0 (or 0%) to 1 (or 100%),
It is abtain by ratio of area bw diagonal line and Lorenz curve to the total area.
A country in which one resident earned all the income, while everyone else earned nothing, would have an income Gini coefficient of 1.
A country in which every resident has the same income would have an income Gini coefficient of 0.
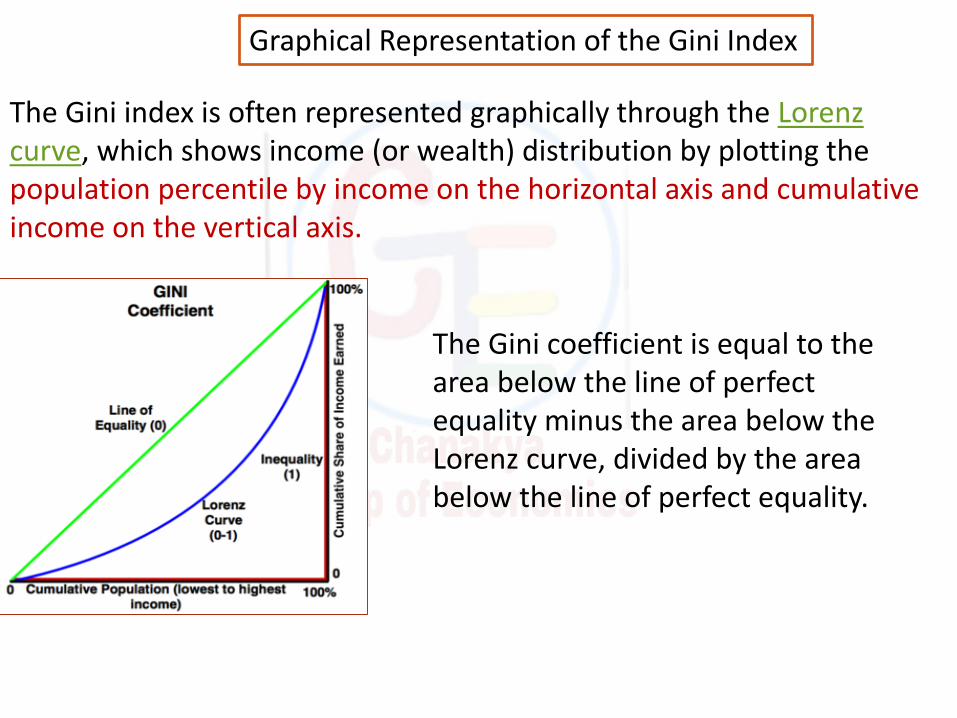
Graphical Representation of the Gini Index
The Gini index is often represented graphically through the Lorenz curve, which shows income (or wealth) distribution by plotting the population percentile by income on the horizontal axis and cumulative income on the vertical axis.
The Gini coefficient is equal to the area below the line of perfect equality minus the area below the Lorenz curve, divided by the area below the line of perfect equality.


3.Palma Ratio
It is the ratio of the richest 10% of the population’s share of gross national income (GNI) divided by the poorest 40%’s share.
The Palma ratio is a measure of inequality.

Kuznet’s Inverted U-Hypothesis on Income Inequality
Simon Kuznets put forward the hypothesis that relationship between per capita national income and the degree of inequality in income distribution may be of the form of inverted-U.
In his 1955 study he calculated the Kuznets’ ratios and found that the developing countries tend to have a higher degree of inequality whereas the rich developed countries tend to have a lower degree of inequality.

where as a country develops and its per capita income rises, the degree of income inequality initially rises and after reaching the maximum level, it falls as GDP per capita increases further.
According to the Kuznets’ Inverted U-hypothesis, as per capita national income of a country increases, in the initial stages of growth,
inequality in income distribution rises and after reaching the highest degree in the intermediate level the income inequality falls

Theories of development
Nta UGC-NET dec-2018
UGC-NET PAPER-2 (ECO)
Online batch ,Lecture-30
Growth and Development, topic-2


![NTA-UGC-NET | Concept of Consumption Function · 2021. 6. 14. · NTA-UGC-NET | Concept of Consumption Function Absolute Income Hypothesis [Fundamental Psychological Law]- Keynes](https://img.pdfslide.net/doc/110x75/613d8366e1ef621e9f2dc527/nta-ugc-net-concept-of-consumption-function-2021-6-14-nta-ugc-net-concept.jpg)