Embed Size (px)
Citation preview

NTIA Technical Report TR-11-479
Case Study: Investigation of Interference into 5 GHz Weather Radars from Unlicensed National Information
Infrastructure Devices, Part II
John E. Carroll Geoffrey A. Sanders
Frank H. Sanders Robert L. Sole


NTIA Technical Report TR-11-479
Case Study: Investigation of Interference into 5 GHz Weather Radars from Unlicensed National Information
Infrastructure Devices, Part II
John E. Carroll Geoffrey A. Sanders
Frank H. Sanders Robert L. Sole
U.S. DEPARTMENT OF COMMERCE
July 2011


iii
DISCLAIMER
Certain commercial equipment and materials are identified in this report to specify adequately
the technical aspects of the reported results. In no case does such identification imply
recommendation or endorsement by the National Telecommunications and Information
Administration, nor does it imply that the material or equipment identified is the best available
for this purpose.


v
CONTENTS
Page
1 INTRODUCTION.................................................................................................................... 1
2 U-NII DEVICES TESTED ....................................................................................................... 4
3 TEST WAVEFORMS .............................................................................................................. 5
4 ITS LABORATORY MEASUREMENT RESULTS ................................................................ 6
4.1 Test Results of DFS Detection Capability with Emulated TDWR Waveforms
and with the Bin 1 Waveform ...................................................................................... 7
4.2 Effects of Varying Master Device Talk/Listen Ratio for Manufacturer A’s
Device ......................................................................................................................... 8
4.3 U-NII Device Emission Spectra ................................................................................... 9
5 TDWR PSF TEST AND MEASUREMENT RESULTS......................................................... 11
5.1 Measurements of Actual TDWR Emissions in the Time Domain................................ 13
5.2 U-NII DFS Performance Against Actual TDWR Waveforms ..................................... 15
5.3 Qualitative Determination of U-NII I/N Levels that Cause TDWR PPI Strobes .......... 16
5.4 Effects of TDWR Antenna Sidelobes on PPI Displays ............................................... 19
5.5 U-NII Device Off-Tuning For Strobe Elimination ...................................................... 20
6 SUMMARY OF TEST RESULTS ......................................................................................... 22
7 REFERENCES ...................................................................................................................... 24
8 ACKNOWLEDGEMENTS .................................................................................................... 25
APPENDIX: INTERFERENCE-TO-NOISE RATIO IN RADAR RECEIVER
PERFORMANCE TESTS ................................................................................... 27

vi
FIGURES
Page
Figure 1. An example of interference artifacts on the San Juan TDWR PPI display. ...................2
Figure 2. ITS Laboratory Test Setup............................................................................................6
Figure 3. Radiated emission spectra, normalized to zero dB at the fundamental frequency
(itself normalized to zero hertz) of several 5-GHz U-NII devices. .............................. 10
Figure 4. Geometry of the PSF TDWR and the FAA warehouse facility where the U-NII
master devices were located. .................................................................................... 12
Figure 5. Block diagram for injection of U-NII interference waveforms into the TDWR
receiver. Items shown in red were provided by NTIA. ............................................... 13
Figure 6. Power received from the TDWR at the FAA warehouse facility U-NII location
throughout one complete monitor-mode scan. ........................................................... 14
Figure 7. A single TDWR pulse in the time domain at the U-NII location. ................................ 15
Figure 8. TDWR meteorological display PPI showing effects of frame-based interference
(Manufacturer E) injected on a hardline from a VSG at baseline (no
interference), and I/N = -12 dB, -9 dB, and -6 dB, respectively. ................................. 17
Figure 9. TDWR meteorological display PPI showing effects of frame-based interference
(Manufacturer E) injected on a hardline from a VSG at I/N = -3 dB, 0 dB, +3 dB,
and +25 dB, respectively. .......................................................................................... 18
Figure 10. TDWR 360-degree-scan interference strobes generated by a U-NII transmitter
(Manufacturer D, Model 1) on a rooftop 2.97 miles (4.78 km) from the TDWR,
at an azimuth indicated by the red arrows and at a height of 35 feet (10.6 m)
above the ground. ...................................................................................................... 20
TABLES
Page
Table 1. FCC-certified U-NII devices used for DFS performance testing .....................................4
Table 2. Waveform test categories ...............................................................................................5
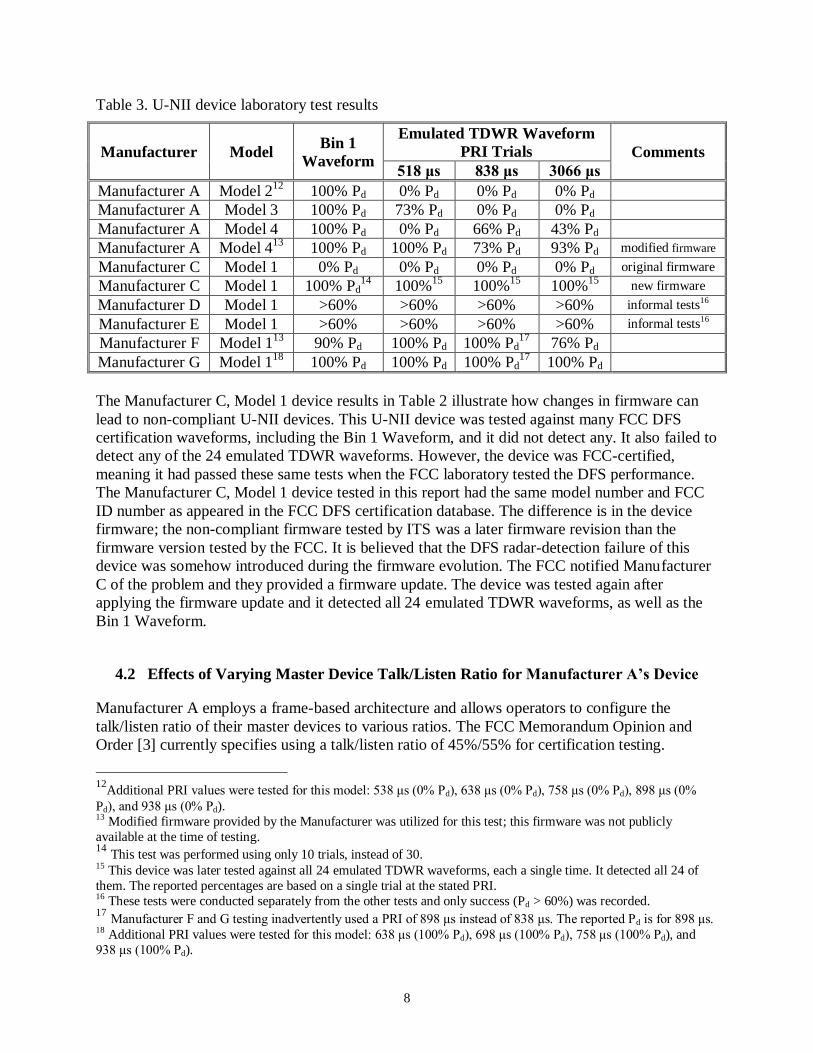
Table 3. U-NII device laboratory test results ...............................................................................8
Table 4. Results of Manufacturer A, Model 2, talk/listen ratio tests .............................................9
Table 5. Summary of DFS detection of selected, actual TDWR waveforms ............................... 16
Table A-1. Effective radar receiver noise-limit increase, (I+N)/N, as a function of I/N .............. 28

vii
ABBREVIATIONS/ACRONYMS
AWG Arbitrary Waveform Generator
AGL Above Ground Level
CBS Cavity Backed Spiral
dB decibel
dBi decibels relative to isotropic
dBm decibels relative to 1 milliwatt
DFS Dynamic Frequency Selection
DOC Department of Commerce
EIRP Equivalent Isotropically Radiated Power
FAA Federal Aviation Administration
FCC Federal Communications Commission
GHz gigahertz
IEEE Institute of Electrical and Electronics Engineers
IF Intermediate Frequency
I/N Interference-to-Noise Ratio
ITS Institute for Telecommunication Sciences
LNA Low Noise Amplifier
MHz megahertz
NTIA National Telecommunications and Information Administration
OSM Office of Spectrum Management
Pd Probability of Detection
PPI Plan Position Indicator
PRI Pulse Repetition Interval
PSF Program Support Facility
RF Radio Frequency
TDWR Terminal Doppler Weather Radar
U-NII Unlicensed National Information Infrastructure
µs microsecond
VSA Vector Signal Analyzer
VSG Vector Signal Generator


ix
EXECUTIVE SUMMARY
In early 2009, the Federal Aviation Administration (FAA) reported interference to their Terminal
Doppler Weather Radars (TDWR) that operate in the 5600–5650 MHz band and provide
quantitative measurements of gust fronts, windshear, microbursts and other weather hazards for
improving the safety of operations in and around major airports (45 airports at the time of this
writing). Engineers from both the Institute for Telecommunication Sciences (ITS), part of the
National Telecommunications and Information Administration (NTIA), and the FAA traveled to
a site of reported TDWR interference in San Juan, Puerto Rico. They performed an extensive
series of field measurements in the San Juan area and determined the interference to be from
unlicensed national information infrastructure (U-NII) dynamic frequency selection (DFS)
devices, from different manufacturers, operating in the same frequency band as these Federal
radar systems. These U-NII devices employ technology that is supposed to detect the presence of
nearby radar systems and change operating frequencies to prevent interference with incumbent
radar systems. Part I of this report series details the results of this measurement effort.
After determining the interference source in San Juan, Puerto Rico, ITS engineers tested these
U-NII devices in controlled environments at the ITS laboratory in Boulder, Colorado and at an
engineering TWDR system at the FAA’s TDWR Program Support Facility (PSF) in Oklahoma
City, Oklahoma. ITS tested several U-NII devices, some of which were provided by
manufacturers, against emulated TDWR waveforms and FCC certification waveforms at the ITS
laboratory, and waveforms generated by an actual TDWR at the PSF. Representatives from the
respective U-NII manufacturers were present to witness testing and to provide engineering
support. The primary goals of these tests were to: examine DFS detection performance of U-NII
devices in the presence of TDWR signals; explore the interference levels at which TDWR
performance visibly degrades; examine the U-NII device frequency off-tuning required to
eliminate interference artifacts on the TDWR display from incorrectly configured U-NII devices;
and explore how U-NII device energy coupling into TDWR antenna sidelobes impacts azimuthal
direction finding. These performance tests and field measurements are described in this report.
In laboratory tests with emulated TDWR waveforms, four U-NII devices performed as intended
off-the-shelf. One U-NII device did not detect the TDWR waveforms off-the-shelf (although, it
did detect waveforms used in FCC certification). Eventually, this U-NII device detected
emulated TDWR signals with prototype firmware, provided by the manufacturer that altered the
DFS detection algorithms. A different U-NII device was tested against FCC DFS certification
waveforms and it did not detect any. It also failed to detect any emulated TDWR waveforms.
The device, however, was FCC certified, meaning it had passed these same tests when the FCC
laboratory tested its DFS performance. A firmware update from the manufacturer eventually
rectified this problem, illustrating how firmware upgrades can lead to DFS non-compliance.
In radiated tests with waveforms generated by an actual TDWR, U-NII device radar detection
performance was found to be in agreement with laboratory testing. U-NII devices that failed to
detect and avoid the TDWR generated interference artifacts on the TDWR display. Properly
operating U-NII devices did not generate interference artifacts on a TDWR display when they
operated on the nearest available frequencies (relative to the TDWR fundamental frequency)
where their DFS functionality did not detect the TDWR. With the antenna geometry and
distances tested in this report, a nominal minimum 20-MHz center-to-center frequency
x
separation between the TDWR and the U-NII device was found to eliminate TDWR display
interference artifacts.
Part III of this report series describes engineering solutions including frequency separation.
These solutions may be used as part of a strategic plan to resolve interference to TDWRs.

CASE STUDY: INVESTIGATION OF INTERFERENCE INTO 5 GHz WEATHER
RADARS FROM UNLICENSED NATIONAL INFORMATION INFRASTRUCTURE
DEVICES, PART II
John E. Carroll1, Geoffrey A. Sanders
1, Frank H. Sanders
1, and Robert L. Sole
2
In early 2009, the Federal Aviation Administration (FAA) became aware of
interference to Terminal Doppler Weather Radars (TDWRs) that operate in the 5600–
5650 MHz band and provide quantitative measurements of gust fronts, windshear,
microbursts, and other weather hazards for improved safety of operations in and
around major airports. Institute for Telecommunication Sciences (ITS) engineers,
with assistance from FAA engineers, determined the interference to be from
unlicensed national information infrastructure (U-NII) dynamic frequency selection
(DFS) devices, from several manufacturers, operating in the same frequency band as
TDWR systems. These devices operate in the same bands as these Federal radar
systems, but employ DFS technology that is supposed to detect the presence of
nearby radar systems and change operating frequencies to prevent interference with
incumbent radar systems. This report describes measurements and results from
controlled laboratory and field testing of these U-NII devices. This is the second of a
three-part series of reports that describe research efforts by the ITS engineers, with
assistance from FAA engineers, to determine the cause of the interference, examine
the effects of the interference on TDWR systems, and engineer solutions.
Key words: dynamic frequency selection; unlicensed national information
infrastructure; spectrum sharing technology; radar interference; RF interference; radar
performance degradation; terminal Doppler weather radar
1 INTRODUCTION
The Terminal Doppler Weather Radar (TDWR) system, introduced in 1993, operates in the
5600–5650 MHz band, and provides quantitative measurements of gust fronts, windshear,
microbursts, and other weather hazards that are used to improve the safety of operations at major
airports (45 airports at the time of this writing). “During the period from 1964 to 1986, at least 32
accidents and incidents have occurred in which windshear was identified as a contributing factor.
These accidents resulted in over 600 fatalities and nearly 250 injuries. There is evidence to
suggest that if undocumented “close calls” and general aviation statistics were included, these
figures would be much higher.” [1] TDWRs improve the management of air traffic through
forecasting of gust fronts and induced wind shifts, detection of precipitation, and detection of
other hazardous weather phenomena including turbulence and tornados.
Beginning in early 2009, the Federal Aviation Administration (FAA) became aware of
interference to TDWRs, including one in San Juan, Puerto Rico. An informal investigation by
1 Institute for Telecommunication Sciences, National Telecommunications and Information Administration (NTIA),
U.S. Department of Commerce, Boulder, Colorado. 2 Office of Spectrum Management (OSM), NTIA, Washington, DC.

2
the FAA concluded that Unlicensed National Information Infrastructure (U-NII) devices were
responsible. U-NII systems can now operate in the 5250–5350 and 5470–5725 MHz bands,
alongside many Federal radar systems, including the TDWR, but are required to employ
dynamic frequency selection (DFS) technology to detect the presence of a nearby radar system
and change operating frequencies to prevent interference to the radar. The Federal
Communications Commission (FCC), the National Telecommunications and Information
Administration (NTIA), other Federal agencies, and industry representatives collaborated to
develop rules and compliance measurement procedures for U-NII devices equipped with DFS
technology. After three years of bench and field testing prototypes from many manufacturers, the
DFS rules were finalized in March 2006 and the first DFS device certification was granted in
August 2006. The U-NII devices are authorized to operate under Part 15 rules for unlicensed
devices and as such they are not permitted to cause interference to allocated and protected
systems.3 References to DFS operational behavior and a brief overview of DFS appear in [2] and
[3].
Interference sources cause interference strobes to appear on the TDWR plan position indicator
(PPI) scopes. These strobes are sometimes referred to as “jam strobes” and appear as blacked-out
zones on the PPI. Figure 1 shows an example of interference strobes from the TDWR in San
Juan, Puerto Rico, marked with white lines for graphical clarity.
Figure 1. An example of interference artifacts on the San Juan TDWR PPI display. 4
3. “Operation of an intentional, unintentional, or incidental radiator is subject to the conditions that no harmful interference is caused and that interference must be accepted that may be caused by the operation of an authorized
radio station, by another intentional or unintentional radiator, by industrial, scientific and medical (ISM) equipment,
or by an incidental radiator.” 47 CFR § 15.5(b) (2009-2010). 4 Map image © 2010 Google, Map Data © 2000 European Technologies, © 2000 TeleAtlas, NASA, © 2008 Digital
Globe
3
At the request of the FAA, ITS and OSM engineers participated in a TDWR interference study in
San Juan, Puerto Rico from March 9th
through 20th, 2009 and performed a series of field
measurements that confirmed 5 GHz U-NII devices, from various manufacturers, as the
interference source.
Additional testing was performed in 2009 at the ITS laboratory in Boulder, Colorado and the
FAA Mike Monroney Aeronautical Center TDWR program support facility (PSF) in Oklahoma
City, Oklahoma, with various 5-GHz U-NII devices in controlled laboratory and field
environments. Laboratory testing consisted of synthesizing 24 unique TDWR waveforms whose
parameters were provided by the FAA. The 24 waveforms were generated using an Agilent
E4438C vector signal generator (VSG). Supplemental laboratory testing of the U-NII devices
against the “Bin 1 Waveform” [2] used in the FCC certification process was also performed.
Field testing took place at the TDWR PSF. The TDWR PSF possesses an engineering TDWR
that is not a part of the national TDWR network and it was made available for these tests.
These laboratory tests examined DFS detection performance of U-NII devices, from various
manufacturers, in the presence of emulated TDWR signals. The field tests examined DFS
detection performance of the same U-NII devices in the presence of an actual TDWR system,
explored the interference levels at which TDWR performance visibly degrades, examined U-NII
device frequency off-tuning required to eliminate interference strobes from incorrectly
configured U-NII devices, and explored how U-NII device energy coupling into TDWR antenna
sidelobes impacts azimuthal direction finding.

4
2 U-NII DEVICES TESTED
The U-NII devices shown in Table 1 were tested at the ITS laboratory in Boulder, Colorado and
at the TDWR PSF, in Oklahoma City, Oklahoma, with an engineering TDWR system. As
indicated in the table, some devices were procured by NTIA, while others were provided by
manufacturers. IEEE 802.11, IEEE 802.16 and proprietary frame-based signal architectures were
tested.
Table 1. FCC-certified U-NII devices used for DFS performance testing
Device
Manufacturer5 Model Ownership
Signal
Architecture
Modulation
Bandwidth
Manufacturer A Model 2 NTIA Frame-Based 20 MHz
Manufacturer A Model 3 NTIA Frame-Based 20 MHz
Manufacturer A Model 46 Manufacturer Frame-Based 21 MHz
Manufacturer C Model 1 NTIA IEEE 802.167 20 MHz
Manufacturer D Model 1 NTIA Frame-Based 20 MHz
Manufacturer E Model 1 NTIA Frame-Based 20 MHz
Manufacturer F Model 1 manufacturer IEEE 802.11 20 MHz
Manufacturer G Model 1 manufacturer IEEE 802.11 40 MHz8
In the 802.11 architecture, data is transmitted at the first available opportunity, so the channel is
accessed on a per-packet basis. In 802.11 networks, channel time is randomly competed for. In
802.16 and other proprietary frame-based architectures, channel access is on a per-frame basis
and may contain more than one data packet. In these network types, channel time is partitioned
into dedicated transmit and receive segments. In this report, the term “frame-based” only refers
to proprietary frame-based architectures. The 802.16 protocol (commonly referred to as
WiMAX) is frame-based, however, it is not proprietary.
All tested U-NII devices used publicly available firmware unless otherwise noted.
Manufacturer A supplied a modified device for testing, which was loaded with firmware
developed specifically for these tests; the modified firmware is not currently deployed in
production Model 4 units from that manufacturer.
A Model 1 U-NII device from Manufacturer F was also modified for the testing. The
modification allowed it to operate in the 5600–5650 MHz frequency range for the purpose of this
testing; this manufacturer does not market U-NII devices that operate in this frequency range in
North America.
5 Manufacturer B did not provide, nor would they supply to NTIA, a device for this testing. 6 The modified unit from Manufacturer A had no FCC ID because it was a prototype that had not yet been tested by
the FCC. 7 At the time of testing, this device was not WiMax-Forum certified, but nominally 802.16-compliant devices are
commonly referred to as “WiMax” and that usage is adopted here. 802.16 is a frame-based signal architecture. 8 The unit from Manufacturer G had more than one bandwidth mode available; 40 MHz was selected for this testing.

5
3 TEST WAVEFORMS
Three waveform categories, listed in Table 2, were used to test the DFS detection performance of
the U-NII devices in Table 1. The first two categories are generated using a VSG. The first
category is the “Short Pulse Radar Type 1 Waveform [3],” hereafter referred to in this document
as the “Bin 1 Waveform.” This waveform is currently used by the FCC in their certification
process for 5-GHz U-NII devices. It was developed specifically to protect the TDWR.
For the second waveform category, ITS engineers created 24 unique VSG waveforms based on
TDWR waveform parameters provided by the FAA. These waveforms replicate the 24 available
waveforms in use by the TDWR. For the sake of clarity, these waveforms are referred to as
“emulated TDWR waveforms,” in that they have pulse parameters that are identical to those of
an actual TDWR system, but are generated using a VSG. Only two parameters in the 24
emulated TDWR waveforms vary: pulse repetition interval (PRI) and pulses per burst (pulses per
burst is a function of PRI).
Waveforms transmitted by an actual TDWR system constitute the third category. These
waveforms are referred to as “actual TDWR waveforms” in this document.
Table 2. Waveform test categories
Waveform
Category
Pulse
Width PRI Pulse Type
Pulses per
burst
Bin 1
Waveform 1 µs 1438 µs Unmodulated 18
emulated
TDWR 1 µs
518–3066 µs
(24 discrete values) Unmodulated 18–102
actual
TDWR 1 µs
518–3066 µs
(24 discrete values) Unmodulated N/A
9
There are two key differences between the actual TDWR waveform category and the emulated
TDWR waveform category. First, the emulated TDWR waveforms are a product of low-power,
solid-state electronics. The actual TDWR waveforms are a product of high-power klystron
vacuum tube amplifiers.
Secondly, unlike the emulated TDWR waveforms, the actual TDWR system will not transmit
discrete bursts of pulses in boresight10
mode or monitor-mode11
. In monitor-mode, the TDWR
system will vary PRI values as a function of antenna elevation angle. A given external location
will observe a constant stream of pulses for a given PRI with varying amplitude (due to antenna
sidelobe coupling) while the radar completes one azimuthal scan. This pulse sequence will
continue with varying PRIs and amplitudes while the TDWR completes an entire scan, then the
cycle will repeat.
9 Due to TDWR antenna sidelobe coupling and changes in antenna elevation angle, an external location will
experience a continuous sequence of pulses with varying PRIs and amplitudes. 10 Boresight refers to the configuration where the TDWR antenna is fixed in both azimuth and elevation. 11
A second scan mode, known as “hazardous mode” is used by the TDWR but was not tested in this study.

6
4 ITS LABORATORY MEASUREMENT RESULTS
The objectives of these laboratory tests were to:
Test off-the-shelf 5-GHz U-NII devices for their DFS performance against the Bin 1
Waveform [2] and against emulated TDWR waveforms.
Examine the effects on probability of detection (Pd) under different transmit and receive
duty cycles. Some U-NII devices allow the user to modify the talk/listen ratio [2] of the
device and, consequently, the duty cycle.
Measure the emission spectra of the U-NII devices.
The test setup is shown in Figure 2.
Figure 2. ITS Laboratory Test Setup.
Due to time constraints, it was not feasible to test each U-NII device against all 24 emulated
TDWR waveforms. Rather, the U-NII devices were tested against the lowest, midmost, and
highest available PRI of the 24 waveforms. These PRIs correspond to 518 μs, 838 μs (some tests
inadvertently used 898 μs), and 3066 μs, respectively. At the request of the FAA, U-NII device
response to additional PRIs was also examined during laboratory testing.

7
4.1 Test Results of DFS Detection Capability with Emulated TDWR Waveforms and with
the Bin 1 Waveform
U-NII device response to the Bin 1 Waveform was first tested for each U-NII device. Emulated
TDWR waveforms were subsequently tested. All waveforms were configured to transmit on the
U-NII device operating frequency.
To reduce measurement uncertainty, trials for each waveform category were repeated 30 times.
During each trial, the device’s response (detection or no detection) to a given waveform was
recorded. A successful detection was determined in one of two ways. The first was to monitor
the U-NII device operating frequency with a spectrum analyzer and observe. If the U-NII device
transmission ceased after a radar waveform was transmitted, the trial was considered to be a
successful detection. The second method of determining a successful detection was to monitor
the U-NII device’s diagnostic information. Some manufacturers include notification of radar
waveform detection in their device firmware.
The overall Pd for each tested waveform is shown in Table 3. The Pd was calculated by dividing
the number of successful detections by the number of trials. A minimum successful Pd of 60%
against the Bin 1 Waveform is required to attain FCC certification [3]. Each U-NII device was
tested in the In-Service Monitoring mode, with data being sent across the U-NII network.
Some U-NII master devices [3] allow their talk/listen ratio to be configured. On master devices
that allow their talk/listen ratio to be configured, the ratio was set to 45%/55% [3] for the results
shown in Table 3. At this ratio, the U-NII device will, in any one frame duration, transmit during
45% of the frame time and listen for the remaining 55%. Other frame-based systems tested had a
fixed ratio of 50%/50%, which is not user-accessible.
8
Table 3. U-NII device laboratory test results
Manufacturer Model Bin 1
Waveform
Emulated TDWR Waveform
PRI Trials Comments
518 μs 838 μs 3066 μs
Manufacturer A Model 212
100% Pd 0% Pd 0% Pd 0% Pd
Manufacturer A Model 3 100% Pd 73% Pd 0% Pd 0% Pd
Manufacturer A Model 4 100% Pd 0% Pd 66% Pd 43% Pd
Manufacturer A Model 413
100% Pd 100% Pd 73% Pd 93% Pd modified firmware
Manufacturer C Model 1 0% Pd 0% Pd 0% Pd 0% Pd original firmware
Manufacturer C Model 1 100% Pd14
100%15
100%15
100%15
new firmware
Manufacturer D Model 1 >60% >60% >60% >60% informal tests16
Manufacturer E Model 1 >60% >60% >60% >60% informal tests16
Manufacturer F Model 113
90% Pd 100% Pd 100% Pd17
76% Pd
Manufacturer G Model 118
100% Pd 100% Pd 100% Pd17
100% Pd
The Manufacturer C, Model 1 device results in Table 2 illustrate how changes in firmware can
lead to non-compliant U-NII devices. This U-NII device was tested against many FCC DFS
certification waveforms, including the Bin 1 Waveform, and it did not detect any. It also failed to
detect any of the 24 emulated TDWR waveforms. However, the device was FCC-certified,
meaning it had passed these same tests when the FCC laboratory tested the DFS performance.
The Manufacturer C, Model 1 device tested in this report had the same model number and FCC
ID number as appeared in the FCC DFS certification database. The difference is in the device
firmware; the non-compliant firmware tested by ITS was a later firmware revision than the
firmware version tested by the FCC. It is believed that the DFS radar-detection failure of this
device was somehow introduced during the firmware evolution. The FCC notified Manufacturer
C of the problem and they provided a firmware update. The device was tested again after
applying the firmware update and it detected all 24 emulated TDWR waveforms, as well as the
Bin 1 Waveform.
4.2 Effects of Varying Master Device Talk/Listen Ratio for Manufacturer A’s Device
Manufacturer A employs a frame-based architecture and allows operators to configure the
talk/listen ratio of their master devices to various ratios. The FCC Memorandum Opinion and
Order [3] currently specifies using a talk/listen ratio of 45%/55% for certification testing.
12
Additional PRI values were tested for this model: 538 μs (0% Pd), 638 μs (0% Pd), 758 μs (0% Pd), 898 μs (0%
Pd), and 938 μs (0% Pd).
13 Modified firmware provided by the Manufacturer was utilized for this test; this firmware was not publicly
available at the time of testing. 14
This test was performed using only 10 trials, instead of 30. 15 This device was later tested against all 24 emulated TDWR waveforms, each a single time. It detected all 24 of
them. The reported percentages are based on a single trial at the stated PRI. 16 These tests were conducted separately from the other tests and only success (Pd > 60%) was recorded. 17
Manufacturer F and G testing inadvertently used a PRI of 898 μs instead of 838 μs. The reported Pd is for 898 μs. 18 Additional PRI values were tested for this model: 638 μs (100% Pd), 698 μs (100% Pd), 758 μs (100% Pd), and
938 μs (100% Pd).
9
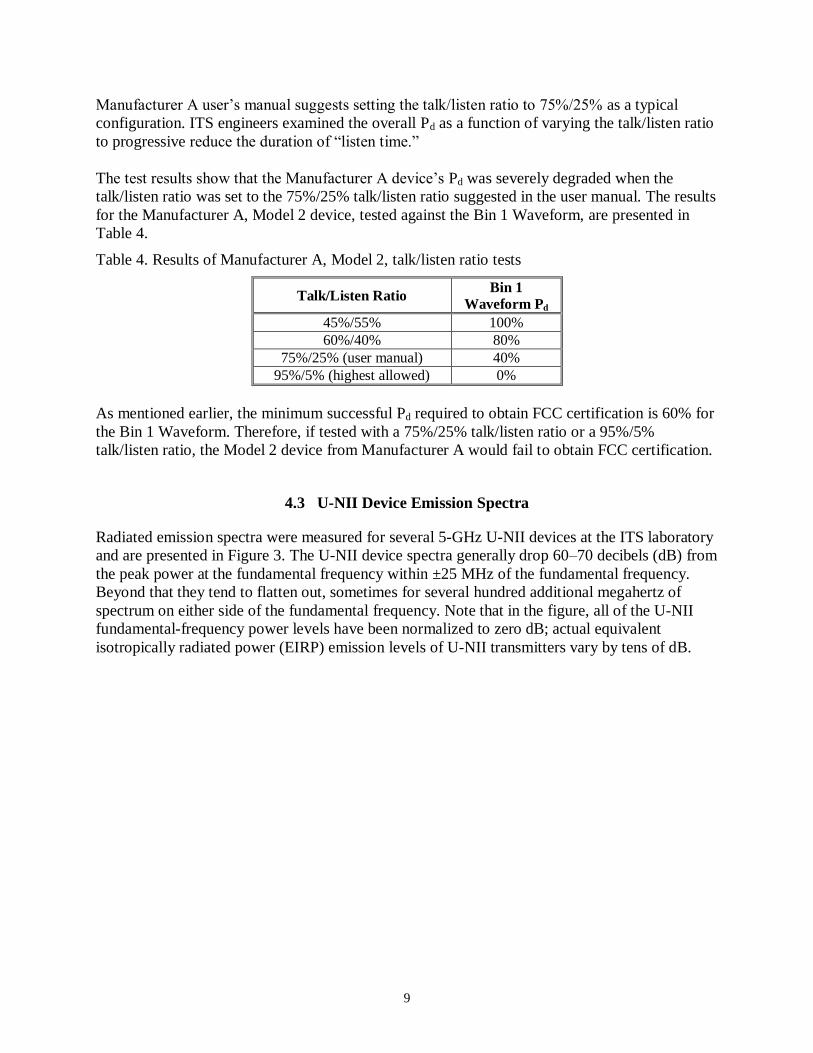
Manufacturer A user’s manual suggests setting the talk/listen ratio to 75%/25% as a typical
configuration. ITS engineers examined the overall Pd as a function of varying the talk/listen ratio
to progressive reduce the duration of “listen time.”
The test results show that the Manufacturer A device’s Pd was severely degraded when the
talk/listen ratio was set to the 75%/25% talk/listen ratio suggested in the user manual. The results
for the Manufacturer A, Model 2 device, tested against the Bin 1 Waveform, are presented in
Table 4.
Table 4. Results of Manufacturer A, Model 2, talk/listen ratio tests
Talk/Listen Ratio Bin 1
Waveform Pd
45%/55% 100%
60%/40% 80%
75%/25% (user manual) 40%
95%/5% (highest allowed) 0%
As mentioned earlier, the minimum successful Pd required to obtain FCC certification is 60% for
the Bin 1 Waveform. Therefore, if tested with a 75%/25% talk/listen ratio or a 95%/5%
talk/listen ratio, the Model 2 device from Manufacturer A would fail to obtain FCC certification.
4.3 U-NII Device Emission Spectra
Radiated emission spectra were measured for several 5-GHz U-NII devices at the ITS laboratory
and are presented in Figure 3. The U-NII device spectra generally drop 60–70 decibels (dB) from
the peak power at the fundamental frequency within ±25 MHz of the fundamental frequency.
Beyond that they tend to flatten out, sometimes for several hundred additional megahertz of
spectrum on either side of the fundamental frequency. Note that in the figure, all of the U-NII
fundamental-frequency power levels have been normalized to zero dB; actual equivalent
isotropically radiated power (EIRP) emission levels of U-NII transmitters vary by tens of dB.

10
Figure 3. Radiated emission spectra, normalized to zero dB at the fundamental frequency (itself
normalized to zero hertz) of several 5-GHz U-NII devices.

11
5 TDWR PSF TEST AND MEASUREMENT RESULTS
The objectives of the work at the FAA’s TDWR PSF were to:
Determine whether selected U-NII devices can reliably detect the TDWR signal in
boresight mode and monitor-mode.
Use emulated U-NII signals produced by a vector signal generator (VSG) coupled into
the TDWR receiver via a hardline coupler to determine, qualitatively, the visible effects
on the TDWR PPI at calibrated levels of interference power, I, to radar-receiver noise
power, N, or (I/N), in the TDWR receiver.19
These data were gathered for both the
existing (legacy) TDWR receiver and for a new model of TDWR receiver that is
currently in development but has not yet been deployed at operational sites, known as the
“Sigmet RVP8.”
Determine the effect of TDWR antenna sidelobes on the reported interference azimuths
on the PPI display.
Measure the emissions of an actual TDWR system in the time and frequency domains.
Determine the amount of required frequency off-tuning of a incorrectly functioning
U-NII device to eliminate strobes on the PPI display.
To meet the first two test objectives, a suitable location for U-NII operation was identified where
the signal power of the TDWR exceeded the -62 to -64 dBm FCC DFS detection threshold. An
FAA warehouse located 2.97 miles (4.78 km) northeast of the TDWR was used for this purpose
(Figure 4). The U-NII devices were positioned on the rooftop of the warehouse, 35 feet (10.6 m)
above the ground, with a clear line-of-sight to the 80-foot-high (24.3-meter-high) TDWR
antenna. The NTIA/ITS RSMS-4 vehicle, positioned next to the warehouse, provided electrical
power and housing for computer control of the U-NII devices via cabling that was draped over
the side of the building.
19
See the Appendix of this report. Also, refer to [4] for the definition and meaning of this parameter.

12
Figure 4. Geometry of the PSF TDWR and the FAA warehouse facility where the U-NII master
devices were located. 20
20 Map image © 2010 Google, Map Data © 2000 European Technologies, © 2000 TeleAtlas, NASA, © 2008 Digital
Globe
13
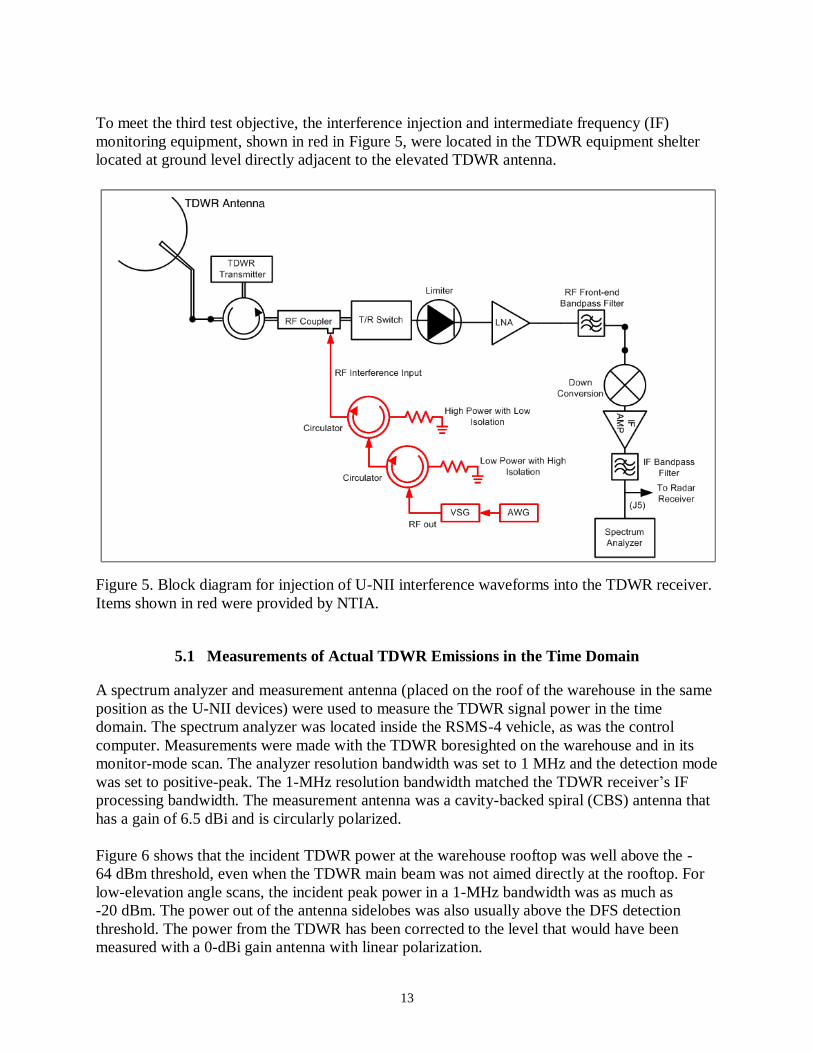
To meet the third test objective, the interference injection and intermediate frequency (IF)
monitoring equipment, shown in red in Figure 5, were located in the TDWR equipment shelter
located at ground level directly adjacent to the elevated TDWR antenna.
Figure 5. Block diagram for injection of U-NII interference waveforms into the TDWR receiver.
Items shown in red were provided by NTIA.
5.1 Measurements of Actual TDWR Emissions in the Time Domain
A spectrum analyzer and measurement antenna (placed on the roof of the warehouse in the same
position as the U-NII devices) were used to measure the TDWR signal power in the time
domain. The spectrum analyzer was located inside the RSMS-4 vehicle, as was the control
computer. Measurements were made with the TDWR boresighted on the warehouse and in its
monitor-mode scan. The analyzer resolution bandwidth was set to 1 MHz and the detection mode
was set to positive-peak. The 1-MHz resolution bandwidth matched the TDWR receiver’s IF
processing bandwidth. The measurement antenna was a cavity-backed spiral (CBS) antenna that
has a gain of 6.5 dBi and is circularly polarized.
Figure 6 shows that the incident TDWR power at the warehouse rooftop was well above the -
64 dBm threshold, even when the TDWR main beam was not aimed directly at the rooftop. For
low-elevation angle scans, the incident peak power in a 1-MHz bandwidth was as much as
-20 dBm. The power out of the antenna sidelobes was also usually above the DFS detection
threshold. The power from the TDWR has been corrected to the level that would have been
measured with a 0-dBi gain antenna with linear polarization.

14
Figure 6. Power received from the TDWR at the FAA warehouse facility U-NII location
throughout one complete monitor-mode scan.
Measurements were also made of individual pulses in the time domain to show that the radar
pulse-shape envelopes were without distortion at the U-NII location. A typical pulse envelope
measured at that location is shown in Figure 7. As shown in this figure, the pulse is very similar
to the transmitted rectangular pulse shape.

15
Figure 7. A single TDWR pulse in the time domain at the U-NII location.
5.2 U-NII DFS Performance Against Actual TDWR Waveforms
Each of the U-NII devices in Table 1 was tested in the presence of actual TDWR emissions, with
the U-NII master device placed on the warehouse rooftop. For all but one case, the U-NII client
device [3] was nearly co-located on the rooftop.21
An MPEG test file was streamed between the
master and client device to simulate a loaded U-NII channel. U-NII device detection capability
was tested while the TDWR operated in monitor-mode scan where the PRI varies with the
antenna elevation angle. Fixed PRI testing was performed with the antenna beam boresighted on
the warehouse rooftop with PRI values of: 518, 598, 798, 838, and 3066 µs. Table 5 summarizes
the results for U-NII detection of selected TDWR PRI values, spanning the range of PRI values
available in the radar design. Each PRI was tested between five to ten times per device.
21 In one exception, a Manufacturer D U-NII device was located about 2.3 miles (3.7 km) from the warehouse and
0.72 miles (1.15 km) from the TDWR, on the tower of an L-Band radar system. This separation between the U-NII
device pair was necessary to ensure the proper functioning of the U-NII devices.

16
Table 5. Summary of DFS detection of selected, actual TDWR waveforms
U-NII
Device
TDWR Waveform PRI Trials Monitor
Mode 518 µs 598 µs 798 µs 838 µs 3066 µs
Mfr. A
Model 2 100%
0% 0% 0% 0% no
Mfr. A
Model 422
100% 100% 100% 100% 100% yes
Mfr. C
Model 1 0% 0% 0% 0% 0% yes
23
Mfr. D
Model 1 100% 100% 100% 100% 100%
24 yes
Mfr. E
Model 1 100% 100% 100% 100% 100% N/A
Mfr. F
Model 1 100% 100% 100% 100% 100% N/A
Mfr. G
Model 1 100% 100% 100% 100% 100% N/A
The Model 2 device from Manufacturer A with the off-the-shelf firmware available at the time
and the Manufacturer C device did not reliably detect the TDWR waveforms. Five U-NII
devices, including the Model 4 device from Manufacturer A (using modified firmware not
publicly available) reliably detected all of the actual TDWR waveforms.
5.3 Qualitative Determination of U-NII I/N Levels that Cause TDWR PPI Strobes
Emissions of selected U-NII devices were digitized using an Agilent 89601 vector signal
analyzer (VSA) at the ITS laboratory in Boulder, Colorado. The recordings were injected
(Figure 5) into the TDWR receiver, generated with an Agilent E4438C VSG, at the RF stage to
determine the Interference-to-Noise (I/N) levels at which strobes appear on the meteorological
PPI display. The simulated U-NII emissions were co-channel with the TDWR. The PPI screens
were recorded in JPEG format for each I/N level25
for each U-NII waveform. The test equipment
was set up so that the Arbitrary Waveform Generator (AWG) would trigger the VSG to output
U-NII device emissions such that 10 azimuths of interference would be visible on the PPI when
the strobe threshold was exceeded. This process was repeated for both the existing (legacy)
TDWR receiver as well as the newly developed TDWR receiver (Sigmet RVP8) which has not
yet been deployed operationally. Tests in Oklahoma City with the RVP8, showed corresponding
levels of effects at I/N levels that were 3 dB lower than observed with the legacy receiver.
22 Modified firmware was used for this device; this firmware was not publicly available at the time of testing. 23 The device took approximately 12 minutes to detect the TDWR. In general, the device did not detect the TDWR
waveforms. 24 The device took anywhere from 45 seconds to 135 seconds to detect the 3066 µs PRI. 25
See the Appendix to this report. Additionally, the I/N measurement method described here is detailed in [3].
17
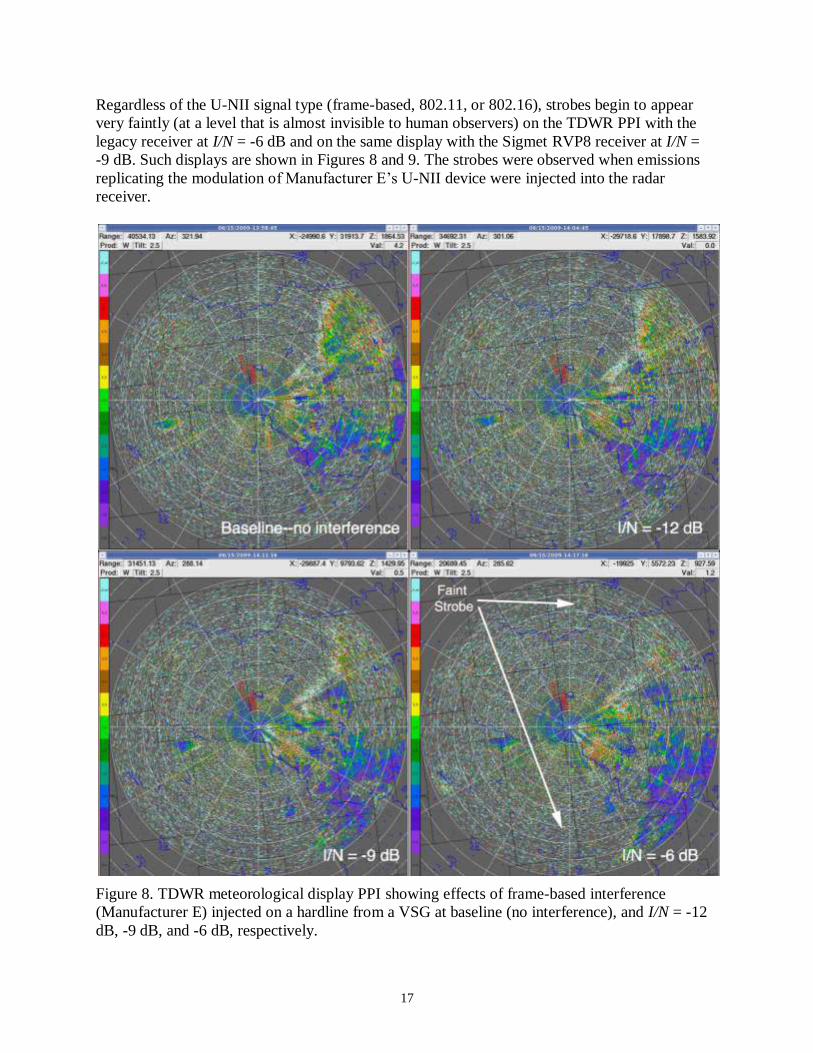
Regardless of the U-NII signal type (frame-based, 802.11, or 802.16), strobes begin to appear
very faintly (at a level that is almost invisible to human observers) on the TDWR PPI with the
legacy receiver at I/N = -6 dB and on the same display with the Sigmet RVP8 receiver at I/N =
-9 dB. Such displays are shown in Figures 8 and 9. The strobes were observed when emissions
replicating the modulation of Manufacturer E’s U-NII device were injected into the radar
receiver.
Figure 8. TDWR meteorological display PPI showing effects of frame-based interference
(Manufacturer E) injected on a hardline from a VSG at baseline (no interference), and I/N = -12
dB, -9 dB, and -6 dB, respectively.

18
Figure 9. TDWR meteorological display PPI showing effects of frame-based interference
(Manufacturer E) injected on a hardline from a VSG at I/N = -3 dB, 0 dB, +3 dB, and +25 dB,
respectively.
It is important to note that the possibility of TDWR data corruption exists at I/N levels below the
point at which visible strobes occur on the PPI [4]. The effects of this are insidious; data
gathered from certain azimuths may be corrupt, but no indication to the user exists. During these
tests, NTIA and FAA engineers had no readily available mechanism to confirm if this was
occurring.

19
5.4 Effects of TDWR Antenna Sidelobes on PPI Displays
For this portion of testing, some of the U-NII devices were forced to not vacate the TDWR
channel when the radar was detected.26
The purpose was to observe interference strobes on the
PPI display in such a way as to replicate the behavior of U-NII devices that might not, due to a
failure of DFS sensing, vacate a TDWR’s frequency.
The results showed that co-channel U-NII emissions at a distance of 2.97 miles (4.78 km) from
the TDWR receiver can produce strong (meaning well-defined and opaque) interference strobes
on the radar’s PPI display.
It was also observed that single U-NII sources produce strobes on multiple azimuths, as shown in
Figure 10. The PPI in Figure 10 shows areas of non-U-NII clutter; these areas of clutter were
visible on the PPI with the U-NII devices powered off. The U-NII device strobes are due to
coupling from the U-NII to the sidelobes of the TDWR antenna. As the TDWR antenna main
beam elevation angle increases from 0.3 degrees to 30.6 degrees, the coupling of the U-NII
signal into the TDWR antenna side lobes causes the intensity and azimuths of the strobes to vary
considerably. Strobe width increases as interference power in the TDWR antenna pattern
increases, resulting in variation in the interference azimuthal widths. In this geometry, a single
strobe occurring on the U-NII azimuth is never witnessed, instead strong strobes occur on
azimuths that are anywhere from tens of degrees to as much as 180 degrees away from the U-NII
azimuth, and sometimes are not observed on the U-NII azimuth at all. (It is emphasized that this
U-NII device had to be forced, via the use of an engineering mode not accessible to users, to
operate co-channel with the TDWR for this strobe test. Operated under normal DFS software
control, it would not tune closer than 41 MHz to the TDWR frequency, and did not produce
strobes under that condition.)
The implications of this sidelobe-coupling behavior are:
1. A single U-NII device can and will produce strobes on multiple azimuths on a TDWR
display.
2. The strobe azimuths will vary as a function of the TDWR antenna main beam elevation
angle.
3. At some TDWR antenna main beam elevation angles, no strobes will occur on the actual
azimuth of the U-NII device, but some strobes will occur on azimuths on either side of the
true azimuth of the U-NII device.
4. Locating incorrectly operating U-NII devices based on observed strobe azimuths on the
TDWR PPI display will generally be a difficult problem to solve.
26 This non-vacating behavior was accomplished by accessing U-NII test-and-engineering modes that are not
accessible to users.

20
5. If any U-NII device that is producing strobes at a TDWR field site can be located,
multiple strobe azimuths may be eliminated.
Figure 10. TDWR 360-degree-scan interference strobes generated by a U-NII transmitter
(Manufacturer D, Model 1) on a rooftop 2.97 miles (4.78 km) from the TDWR, at an azimuth
indicated by the red arrows and at a height of 35 feet (10.6 m) above the ground.
5.5 U-NII Device Off-Tuning For Strobe Elimination
Some of the U-NII devices were again forced to not vacate the TDWR channel when the radar
was detected. The purpose was to observe interference strobes on the PPI display in such a way
as to replicate the behavior of U-NII devices that might not, due to a failure of DFS sensing,
vacate a TDWR’s frequency. U-NII device frequencies were then manually tuned away from the

21
TDWR operating frequency until PPI strobes disappeared. During the field tests at the TDWR
PSF, the coupling between the U-NII device antennas and the TDWR antenna was mainbeam-to-
sidelobe.27
In this geometry, a frequency separation of 10 MHz (or more) between the TDWR
frequency and the 3-dB point of the U-NII device emission spectra or a nominal minimum
20-MHz center-to-center frequency separation between the TDWR and the U-NII device was
found to eliminate PPI strobes. This observation is based on measurements of a limited number
of U-NII devices (five) operating line-of-sight to the TDWR in this geometry.
As was earlier observed in San Juan, PR (Part I of this series), the coupling between the U-NII
transmitter antennas and the TDWR antenna can often actually be mainbeam-to-mainbeam. This
interference coupling scenario could not be empirically examined at the TDWR PSF location due
to logistics. Report III of this series discusses mainbeam-to-mainbeam coupling in further detail.
27 The TDWR antenna height above ground level (AGL) was 98 feet (29.8 m) and the U-NII height was 40 feet
(12.2 m) AGL, at a separation distance of 2.97 miles (4.78 km).

22
6 SUMMARY OF TEST RESULTS
1. A Model 2 U-NII device from Manufacturer A detected the Bin 1 Waveform used in FCC
certification but did not detect the emulated or actual TDWR waveforms at the ITS
Laboratory or at the TDWR PSF.
2. A Model 2 U-NII device from Manufacturer A with modified firmware (provided by the
manufacturer) successfully detected the emulated and actual TDWR waveforms at the ITS
lab and at the TDWR PSF.
3. The Manufacturer A U-NII devices’ ability to detect the radar signal in the ITS laboratory
was severely degraded using the Bin 1 Waveform for in-service monitoring when the
talk/listen ratio was set to the user manual suggested value of 75%/25%.
4. A Model 1 device from Manufacturer C failed to detect the actual TDWR signal at the
TDWR PSF during boresight testing, only detected the actual TDWR signal at the TDWR
PSF on two out of four monitor-mode scans, failed to detect the Bin 1 Waveform, and
failed to detect all 24 emulated TDWR waveforms during laboratory testing. This device
was certified for DFS functionality with a different firmware revision number than the one
that failed both the laboratory and field tests, although it was still using the original FCC ID
number. After new firmware was loaded onto this device, it successfully detected the Bin 1
Waveform and all 24 emulated TDWR waveforms during subsequent laboratory testing.
5. Four off-the-shelf U-NII devices from Manufacturers D, E, F and G reliably detected the
actual TDWR waveforms at the TDWR PSF; a device from Manufacturer A reliably
detected the actual TDWR signals after a firmware upgrade provided by the manufacturer
(see item 2 above).
6. Properly operating U-NII devices did not generate strobes on the TDWR PPI display when
they operated on the nearest available frequencies (relative to the TDWR fundamental
frequency) and when their DFS functionality did not detect the TDWR emission.
7. A frequency separation of 10 MHz (or more) between the TDWR center frequency and the
3-dB point of the U-NII device emission spectra or a nominal minimum 20-MHz center-to-
center frequency separation between the TDWR and the U-NII device was found to
eliminate PPI strobes in interference geometries with U-NII device mainbeam to TDWR
antenna sidelobe coupling. This observation is based on measurements of a limited number
of U-NII devices operating line-of-sight to the TDWR.
8. The results of laboratory versus field measurements and tests of the DFS functionality of
the seven U-NII devices that were evaluated are in agreement with each other. Therefore,
any additional testing with U-NII devices (for their ability to detect the actual TDWR radar
signals) can be done in the ITS or FCC laboratories with emulated TDWR signals.
Additional in-situ tests at TDWR facilities are not necessary.

23
9. Strobes appear very faintly on the TDWR PPI at some elevation angles at an I/N of -6 dB,
regardless of the type of U-NII signal modulation, for the existing (legacy) TDWR
receiver. They appear faintly at an I/N of -9 dB for the newly developed, but not-yet-
deployed RVP828
TDWR receiver. Strobes become progressively stronger in appearance as
the I/N level increases.
10. The TDWR sidelobe interaction with a single U-NII interference source will generate
strobes at multiple azimuths on the PPI display. The response depends on the TDWR
antenna main beam elevation angle: this sidelobe coupling occurs even when the TDWR
main beam is elevated substantially above the angle where it would directly illuminate a U-
NII location. In this geometry, little or no strobe activity occurs solely on the U-NII
azimuth; instead, strong strobes occur on azimuths that are anywhere from tens of degrees
to as much as 180 degrees away from the U-NII azimuth. This increases the difficulty of
identifying interference sources based on strobe-azimuth data, but also means that
elimination of a single U-NII interference source may eliminate multiple TDWR strobes.
28 Two new TDWR receiver designs, the 14-bit RVP8 and the 16-bit RVP9, are currently in progress. The RVP9 is
predicted to show interference effects at I/N levels that are around -12 dB, but no RVP9 was yet available for
evaluation when the U-NII interference tests were performed.

24
7 REFERENCES
[1] U.S. Department of Transportation, Federal Aviation Administration, Advisory Circular
00-54, Pilot Windshear Guide, Nov. 1988.
<http://rgl.faa.gov/Regulatory_and_Guidance_Library/rgAdvisoryCircular.nsf/list/AC%20
00-54/$FILE/AC00-54.pdf>, accessed on Sept. 25, 2010.
[2] Carroll, J. E., F. H. Sanders, R. L. Sole, and G. A. Sanders, “Case Study: Investigation of
Interference into 5 GHz Weather Radars from Unlicensed National Information
Infrastructure Devices, Part I”, NTIA Report TR-11-473, November 2010. Downloadable
at: <http://www.its.bldrdoc.gov/pub/ntia-rpt/11-473/>.
[3] Federal Communications Commission, Revision of Parts 2 and 15 of the Commission’s
Rules to Permit Unlicensed National Information Infrastructure (U-NII) devices in the 5
GHz band, ET Docket No.03-122, Memorandum Opinion and Order, 21 FCC Record 7672
(2006). <http://hraunfoss.fcc.gov/edocs_public/attachmatch/FCC-06-96A1.pdf>, accessed
on Jul. 8, 2010.
[4] Sanders, F. H., R. L. Sole, B. L. Bedford, D. Franc, and T. Pawlowitz, “Effects of RF
Interference on Radar Receivers”, NTIA Report TR-06-444, September 2006.
Downloadable at: <http://www.its.bldrdoc.gov/pub/ntia-rpt/06-444/>.

25
8 ACKNOWLEDGEMENTS
The authors wish to recognize Rajiv Gautam, Aaron Tuttle, and Tim Pigg from the FAA for their
support in the characterization of the TDWR. Their knowledge proved critical to the success of
this effort.

26

27
APPENDIX: INTERFERENCE-TO-NOISE RATIO IN RADAR RECEIVER
PERFORMANCE TESTS
Microwave radar receivers detect objects in space (generically referred to as targets) by
processing the power in successive transmitted-pulse echoes in such a way as to reinforce a
series of echoes from a single object or weather phenomenon into a power level that exceeds a
detection threshold. Non-meteorological radars perform this target-detection function for discrete
targets such as aircraft, while meteorological radars detect spatially-extended atmospheric
phenomena. All microwave radars are ultimately limited in their target-detection capability by
electronic noise that is generated by thermal electrons in the receiver circuitry. In many radar
receivers, the performance of a single component, the RF front-end low-noise amplifier (LNA),
determines the overall thermal-noise limit for the entire receiver, and thus is critically important
to the overall performance of the entire receiver. The thermal noise generated by an LNA is
equal to the fundamental noise limit imposed by quantum-atomic physics, multiplied by a
coefficient called the noise factor:
( ) (1)
where:
n = noise power generated by the LNA (W);
k = Boltzmann’s constant, 1.38 x 10⁻²³
J/K;
T = temperature of the receiver (K);
B = bandwidth of the receiver circuitry (Hz);
nf = noise factor of the LNA (dimensionless).
Rendered into decibel terms, (1) becomes:
( ) (
) (
) (2)
where:
N = noise power generated by the LNA (conventionally dBW or dBm);
NF = 10log10(nf) = so-called noise figure of the LNA.
For T = 290 K and B is 1 Hz, 10log10(kTB) = -204 dBW = -174 dBm. For a TDWR with a
1 MHz-wide receiver bandwidth, the value of 10log10(kTB) is (-174 dBm + 60 dB) = -114 dBm.
If the noise figure, NF, of the LNA is 1 dB, then the thermal noise limit, N, against which
meteorological phenomena must be detected is N = -113 dBm.
Due to engineering limitations on the EIRP that radar transmitters can generate, along with the
relatively small reflection cross sections of most radar targets, the pulse-echo energy from most
radar targets, including meteorological phenomena, is actually lower than N. Such energy can
nevertheless be detected for two reasons: first, since the pulse-echo energy adds linearly to the
thermal noise power in the receiver, the sum of the two power levels can sometimes be detected

28
directly; second, radar receivers do not generally detect the echoes of single pulses, but instead
use the coherently correlated power in successive pulse echoes to integrate a final power level
that does exceed N.
Radars that detect and track aircraft typically need 15-20 successive pulse echoes to form a
detectable target in the receiver circuitry, while meteorological radars need about 30-50
successive pulse echoes to form detectable patterns of atmospheric phenomena. This requirement
for a minimum number of pulse echoes to detect targets, combined with the minimum requisite
interval between pulses to meet maximum-range requirements, ultimately determines the rate at
which a radar beam can be scanned through space.
The most important point to understand about this entire process is that all microwave radars
operate against their own receiver’s thermal noise. But just as echo power from desired targets or
meteorological phenomena adds to N, so too does RF interference energy in the receiver add to
N. As RF interference power, i, adds to n, desired targets are obscured in the radar receiver
detection circuitry. In the presence of interference power the radar power level against which
targets must be detected is not n, but instead is (i + n). Consider, for example, a situation in
which the level of i is 9 dB lower than n. In that case, the sum of the two power levels, expressed
in decibels, is:
( ) (
) ( )
where N is normalized to 0 dB, and i and n are the linear power levels corresponding to the
decibel values of I and N.
If the interference power is 6 dB lower than the radar receiver’s inherent thermal noise floor,
then the sum of the two quantities raises the effective limit against which targets must be
detected by 10log10(0.25+1) = 1 dB. If the interference power is equal to the radar receiver’s
inherent noise floor, then the effective limit against which targets must be detected increases by
10log10(1+1) = 3 dB, and so on. Table A-1 shows how effective radar receiver noise,
(
)
(in decibels), varies as a function of I/N.
Table A-1. Effective radar receiver noise-limit increase, (I+N)/N, as a function of I/N
I/N Effective Increase in Radar Receiver Noise, (I+N)/N
-9 dB 0.5 dB
-6 dB 1 dB
0 dB 3 dB
10 dB 10.4 dB (notice that (I+N)/N approaches I/N as I N)
Because the ratio, I/N, of the interference power level to the radar receiver’s inherent noise-
power level is the quantity of concern in this analysis, measurements of radar receiver
performance in the presence of interference are always quantified by NTIA in terms of radar
target-detection performance as a function of that ratio. NTIA studies [1] have shown that when
I/N = -6 dB, most radars begin to show measurable losses in target-detection performance.

FORM NTIA-29 U.S. DEPARTMENT OF COMMERCE
(4-80) NAT’L. TELECOMMUNICATIONS AND INFORMATION ADMINISTRATION
BIBLIOGRAPHIC DATA SHEET
1. PUBLICATION NO.
TR-11-479
2. Government Accession No.
3. Recipient’s Accession No.
4. TITLE AND SUBTITLE
Case Study: Investigation of Interference into 5 GHz Weather Radars from
Unlicensed National Information Infrastructure Devices, Part II
5. Publication Date
July 2011
6. Performing Organization
Code
7. AUTHOR(S)
John E. Carroll, Geoffrey A. Sanders, Frank H. Sanders and Robert L. Sole
9. Project/Task/Work Unit No.
3152011-300
8. PERFORMING ORGANIZATION NAME AND ADDRESS Institute for Telecommunication Sciences
National Telecommunications & Information Administration
U.S. Department of Commerce
325 Broadway
Boulder, CO 80305
10. Contract/Grant No.
11. Sponsoring Organization Name and Address
National Telecommunications & Information Administration
Herbert C. Hoover Building
14th & Constitution Ave., NW
Washington, DC 20230
12. Type of Report and Period
Covered
14. SUPPLEMENTARY NOTES
15. ABSTRACT
In early 2009, the Federal Aviation Administration (FAA) became aware of interference to Terminal Doppler
Weather Radars (TDWRs) that operate in the 5600–5650 MHz band and provide quantitative measurements of gust
fronts, windshear, microbursts, and other weather hazards for improved safety of operations in and around major
airports. Institute for Telecommunication Sciences (ITS) engineers, with assistance from FAA engineers, determined
the interference to be from unlicensed national information infrastructure (U-NII) dynamic frequency selection
(DFS) devices, from several manufacturers, operating in the same frequency band as TDWR systems. These devices
operate in the same bands as these Federal radar systems, but employ DFS technology that is supposed to detect the
presence of nearby radar systems and change operating frequencies to prevent interference with incumbent radar
systems. This report describes measurements and results from controlled laboratory and field testing of these U-NII
devices. This is the second of a three-part series of reports that describe research efforts by the ITS engineers, with
assistance from FAA engineers, to determine the cause of the interference, examine the effects of the interference on
TDWR systems, and engineer solutions.
16. Key Words
dynamic frequency selection; unlicensed national information infrastructure; spectrum sharing technology; radar
interference; RF interference; radar performance degradation ; terminal doppler weather radar
17. AVAILABILITY STATEMENT
UNLIMITED.
18. Security Class. (This report)
Unclassified
20. Number of pages
27
19. Security Class. (This page)
Unclassified
21. Price:


NTIA FORMAL PUBLICATION SERIES
NTIA MONOGRAPH (MG) A scholarly, professionally oriented publication dealing with state-of-the-art research or an authoritative treatment of a broad area. Expected to have long-lasting value.
NTIA SPECIAL PUBLICATION (SP) Conference proceedings, bibliographies, selected speeches, course and instructional materials, directories, and major studies mandated by Congress.
NTIA REPORT (TR) Important contributions to existing knowledge of less breadth than a monograph, such as results of completed projects and major activities. Subsets of this series include:
NTIA RESTRICTED REPORT (RR) Contributions that are limited in distribution because of national security classification or Departmental constraints.
NTIA CONTRACTOR REPORT (CR) Information generated under an NTIA contract or grant, written by the contractor, and considered an important contribution to existing knowledge.
JOINT NTIA/OTHER-AGENCY REPORT (JR) This report receives both local NTIA and other agency review. Both agencies’ logos and report series numbering appear on the cover.
NTIA SOFTWARE & DATA PRODUCTS (SD) Software such as programs, test data, and sound/video files. This series can be used to transfer technology to U.S. industry.
NTIA HANDBOOK (HB) Information pertaining to technical procedures, reference and data guides, and formal user's manuals that are expected to be pertinent for a long time.
NTIA TECHNICAL MEMORANDUM (TM) Technical information typically of less breadth than an NTIA Report. The series includes data, preliminary project results, and information for a specific, limited audience.
For information about NTIA publications, contact the NTIA/ITS Technical Publications Office at 325 Broadway, Boulder, CO, 80305 Tel. (303) 497-3572 or e-mail [email protected]. This report is for sale by the National Technical Information Service, 5285 Port Royal Road, Springfield, VA 22161,Tel. (800) 553-6847.