Embed Size (px)
Citation preview
NTPC Limited
Investor Presentation
August 2014
Vision
� To be the world’s largest and best power producer, powering India’s growth
Mission
� Develop and provide reliable power, related products and services at competitive prices, integrating
multiple energy sources with innovative and eco friendly technologies and contribute to society
NTPC: VISION AND CORE VALUES
Core Values
To be the world’s largest and best power producer, To be the world’s largest and best power producer,
powering India’s growthpowering India’s growth
BE-COMMITTED
2
OUTLINE
About NTPC
Recent Financial Highlights
Opportunities and Sectoral Growth Drivers
Competitive PositionCompetitive Position
Risks and Mitigants
Growth and Capex Plans
Sustainability Initiatives
3
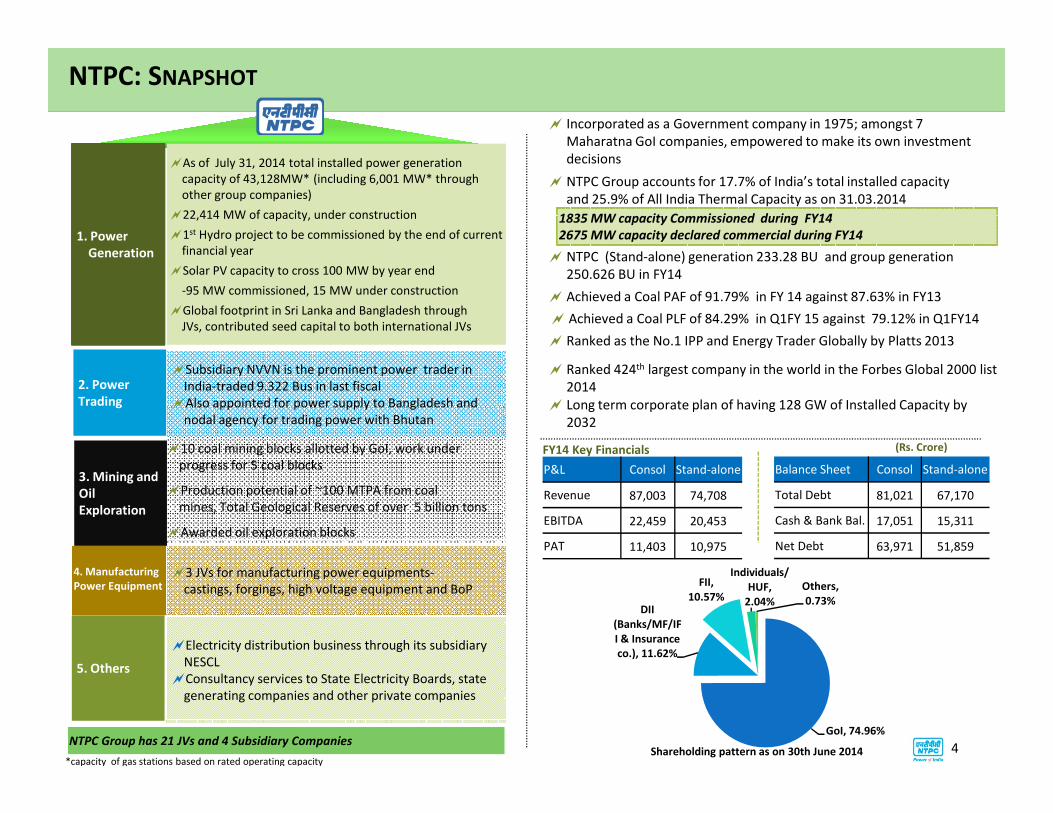
� NTPC (Stand-alone) generation 233.28 BU and group generation
250.626 BU in FY14
NTPC: SNAPSHOT
� NTPC Group accounts for 17.7% of India’s total installed capacity
and 25.9% of All India Thermal Capacity as on 31.03.2014
� Ranked as the No.1 IPP and Energy Trader Globally by Platts 2013
� Ranked 424th largest company in the world in the Forbes Global 2000 list
2014
�As of July 31, 2014 total installed power generation
capacity of 43,128MW* (including 6,001 MW* through
other group companies)
�22,414 MW of capacity, under construction
�1st Hydro project to be commissioned by the end of current
financial year
�Solar PV capacity to cross 100 MW by year end
-95 MW commissioned, 15 MW under construction
�Global footprint in Sri Lanka and Bangladesh through
JVs, contributed seed capital to both international JVs
1. Power
Generation
�Subsidiary NVVN is the prominent power trader in
India-traded 9.322 Bus in last fiscal
�Also appointed for power supply to Bangladesh and
2. Power
Trading
� Incorporated as a Government company in 1975; amongst 7
Maharatna GoI companies, empowered to make its own investment
decisions
1835 MW capacity Commissioned during FY14
2675 MW capacity declared commercial during FY14
� Long term corporate plan of having 128 GW of Installed Capacity by
� Achieved a Coal PAF of 91.79% in FY 14 against 87.63% in FY13
� Achieved a Coal PLF of 84.29% in Q1FY 15 against 79.12% in Q1FY14
GoI, 74.96%
DII
(Banks/MF/IF
I & Insurance
co.), 11.62%
FII,
10.57%
Individuals/
HUF,
2.04%
Others,
0.73%
Shareholding pattern as on 30th June 2014
Balance Sheet Consol Stand-alone
Total Debt 81,021 67,170
Cash & Bank Bal. 17,051 15,311
Net Debt 63,971 51,859
P&L Consol Stand-alone
Revenue 87,003 74,708
EBITDA 22,459 20,453
PAT 11,403 10,975
4
�Also appointed for power supply to Bangladesh and
nodal agency for trading power with Bhutan
Trading
�10 coal mining blocks allotted by GoI, work under
progress for 5 coal blocks
�Production potential of ~100 MTPA from coal
mines, Total Geological Reserves of over 5 billion tons
�Awarded oil exploration blocks
3. Mining and
Oil
Exploration
�3 JVs for manufacturing power equipments-
castings, forgings, high voltage equipment and BoP
4. Manufacturing
Power Equipment
�Electricity distribution business through its subsidiary
NESCL
�Consultancy services to State Electricity Boards, state
generating companies and other private companies
5. Others
FY14 Key Financials
NTPC Group has 21 JVs and 4 Subsidiary Companies
(Rs. Crore)
� Long term corporate plan of having 128 GW of Installed Capacity by
2032
*capacity of gas stations based on rated operating capacity
NTPC*
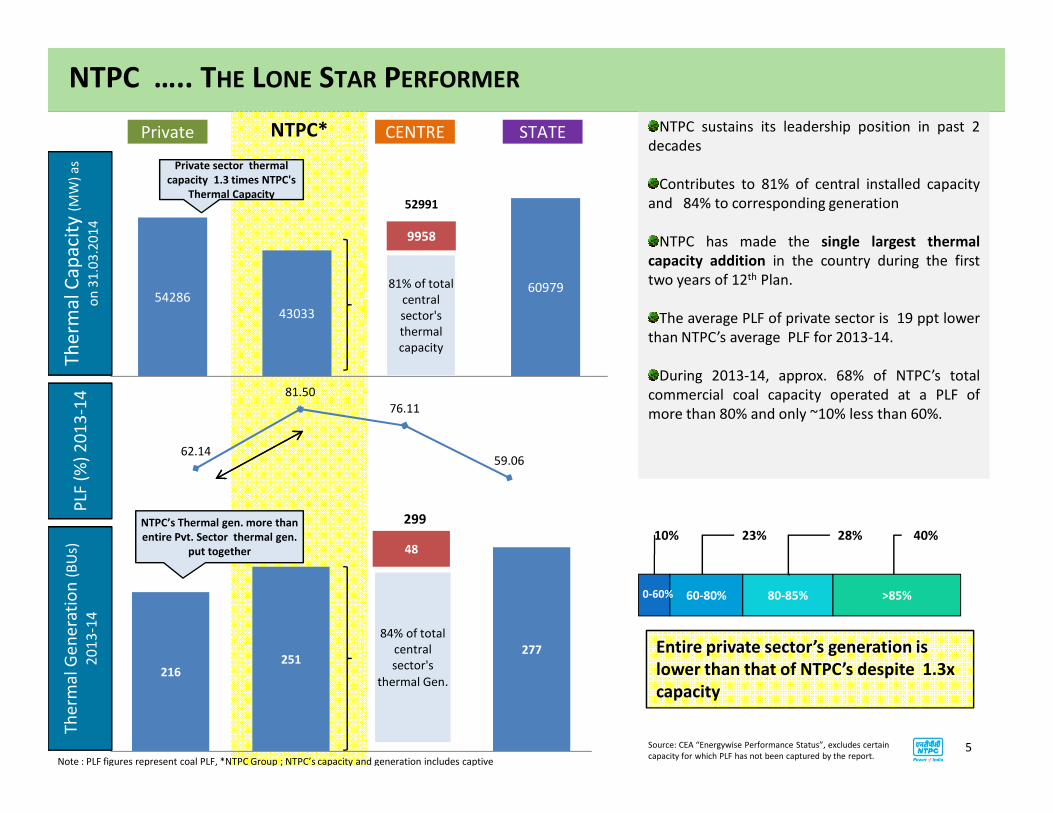
NTPC ….. THE LONE STAR PERFORMER
81.50
76.11
54286
43033
60979
9958
52991
Private sector thermal
capacity 1.3 times NTPC's
Thermal Capacity
Private
81% of total
central
sector's
thermal
capacity
CENTRE STATE
Th
erm
al C
ap
aci
ty (M
W)
as
on
31
.03
.20
14
14
NTPC sustains its leadership position in past 2
decades
Contributes to 81% of central installed capacity
and 84% to corresponding generation
NTPC has made the single largest thermal
capacity addition in the country during the first
two years of 12th Plan.
The average PLF of private sector is 19 ppt lower
than NTPC’s average PLF for 2013-14.
During 2013-14, approx. 68% of NTPC’s total
commercial coal capacity operated at a PLF of
more than 80% and only ~10% less than 60%.
216251
277
48
84% of total
central
sector's
thermal Gen.
NTPC’s Thermal gen. more than
entire Pvt. Sector thermal gen.
put together
62.14
76.11
59.06
299
Th
erm
al
Ge
ne
rati
on
(B
Us)
20
13
-14
PLF
(%
) 2
01
3-1
4
more than 80% and only ~10% less than 60%.
Source: CEA “Energywise Performance Status”, excludes certain
capacity for which PLF has not been captured by the report.Note : PLF figures represent coal PLF, *NTPC Group ; NTPC’s capacity and generation includes captive
0-60% 60-80% 80-85% >85%
10% 23% 28% 40%
Entire private sector’s generation is
lower than that of NTPC’s despite 1.3x
capacity
5
Rs Crore
Market Cap as
on 31.03.2014
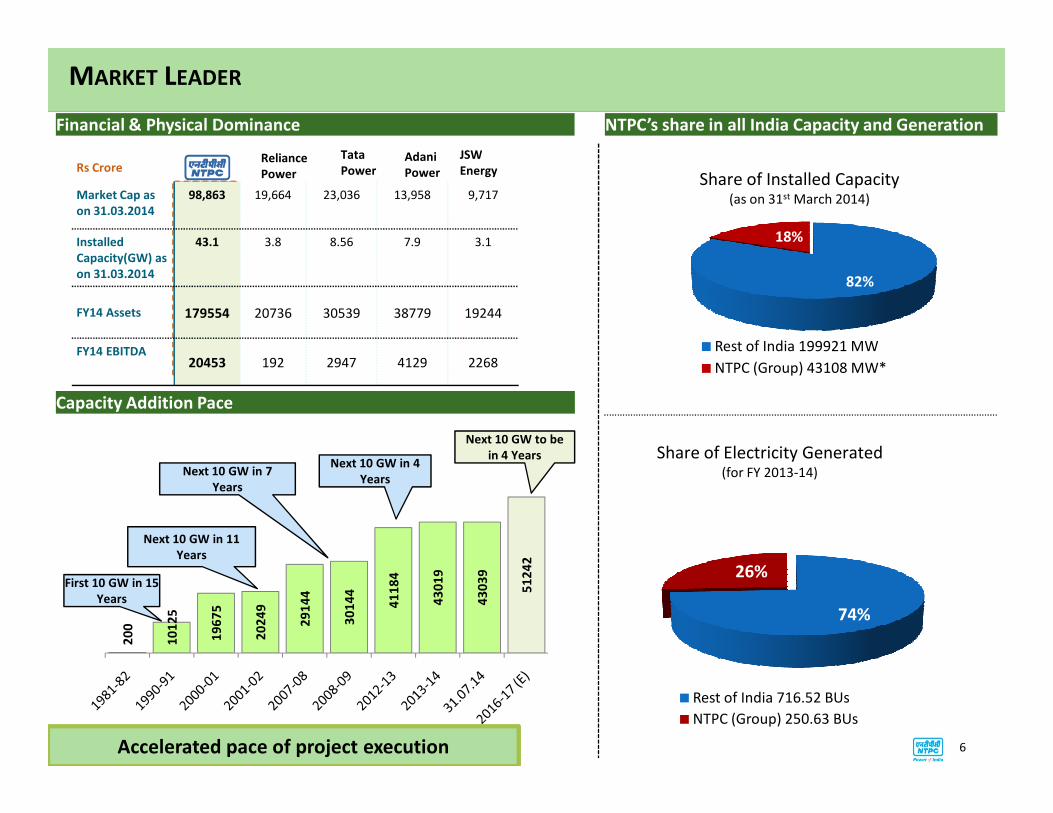
98,863 19,664 23,036 13,958 9,717
Installed
Capacity(GW) as
on 31.03.2014
43.1 3.8 8.56 7.9 3.1
FY14 Assets 179554 20736 30539 38779 19244
FY14 EBITDA20453 192 2947 4129 2268
Financial & Physical Dominance
MARKET LEADER
Reliance
Power
JSW
EnergyAdani
Power
Tata
Power
Capacity Addition Pace
NTPC’s share in all India Capacity and Generation
82%
18%
Rest of India 199921 MW
NTPC (Group) 43108 MW*
Share of Installed Capacity(as on 31st March 2014)
6
Capacity Addition Pace
20
0
10
12
5
19
67
5
20
24
9
29
14
4
30
14
4
41
18
4
43
01
9
43
03
9
51
24
2
First 10 GW in 15
Years
Next 10 GW in 11
Years
Next 10 GW in 7
Years
Next 10 GW in 4
Years
Next 10 GW to be
in 4 Years
74%
26%
Rest of India 716.52 BUs
NTPC (Group) 250.63 BUs
Share of Electricity Generated (for FY 2013-14)
Accelerated pace of project execution
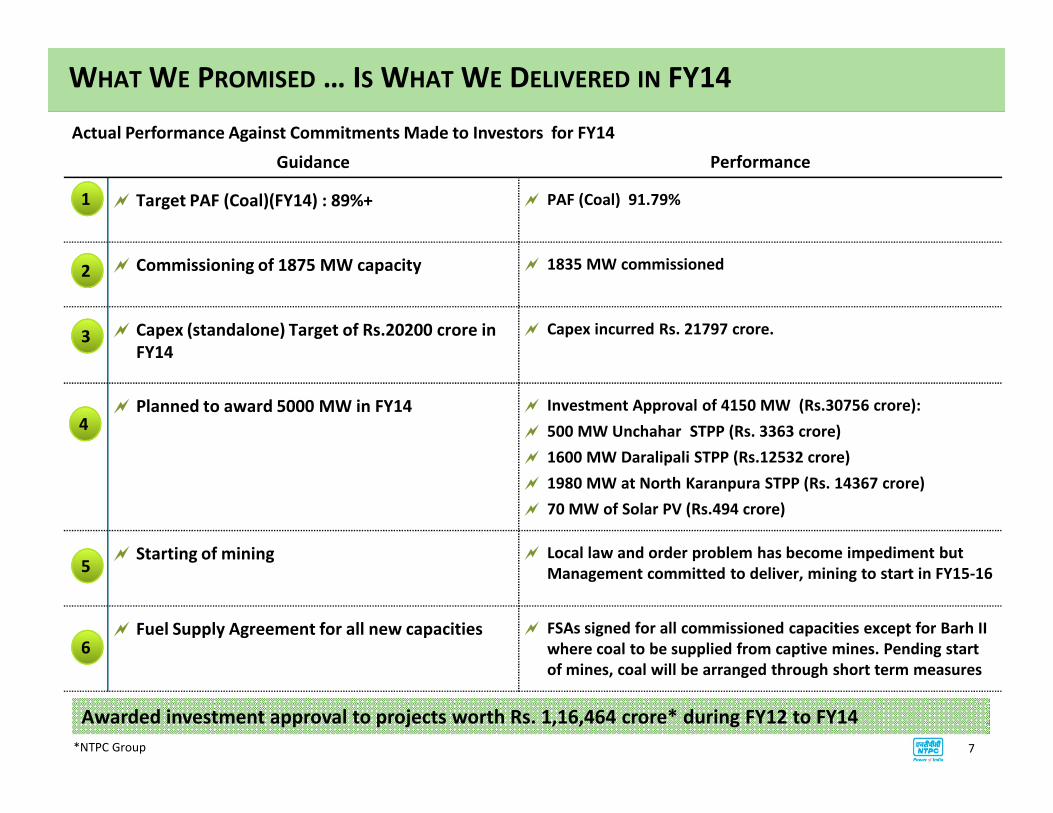
WHAT WE PROMISED … IS WHAT WE DELIVERED IN FY14
Guidance Performance
� Target PAF (Coal)(FY14) : 89%+ � PAF (Coal) 91.79%
� Commissioning of 1875 MW capacity � 1835 MW commissioned
� Capex (standalone) Target of Rs.20200 crore in
FY14
� Capex incurred Rs. 21797 crore.
� Planned to award 5000 MW in FY14 � Investment Approval of 4150 MW (Rs.30756 crore):
Actual Performance Against Commitments Made to Investors for FY14
1
2
3
� Planned to award 5000 MW in FY14 � Investment Approval of 4150 MW (Rs.30756 crore):
� 500 MW Unchahar STPP (Rs. 3363 crore)
� 1600 MW Daralipali STPP (Rs.12532 crore)
� 1980 MW at North Karanpura STPP (Rs. 14367 crore)
� 70 MW of Solar PV (Rs.494 crore)
� Starting of mining � Local law and order problem has become impediment but
Management committed to deliver, mining to start in FY15-16
� Fuel Supply Agreement for all new capacities � FSAs signed for all commissioned capacities except for Barh II
where coal to be supplied from captive mines. Pending start
of mines, coal will be arranged through short term measures
4
5
6
7
Awarded investment approval to projects worth Rs. 1,16,464 crore* during FY12 to FY14
*NTPC Group
UNPARALLELED COLLECTION EFFICIENCY
SJVNL
BBMB
NHDC
PGCIL
THDC
NEEPCO
NPCIL
NLC
NHPC
DVC
Outstanding dues of power utilities (principal and surcharge) payable to Central
Public Sector Undertakings (CPSUs) as on 30.04.2014 (Source : CEA Report)
NTPC has 0 dues*
Average Debtor Days*
35
30
26
2011-12 2012-13 2013-14
Inspite of largest billing size of
NTPC, same/similar external
environment , customers, tripartite
agreements collection efficiency
remains high.
0 1000 2000 3000 4000 5000 6000 7000 8000
NTPC
DVC :Damodar Valley Corporation ;
NHPC :National Hydro Power Corporation
NLC :Nyveli Lignite Corporation
NPCIL : Nuclear Power Corporation of India Ltd.
NEEPCO :North Eastern Electric Power Corporation Ltd
PGCIL :Power Grid Corporation of India Ltd
SJVNL :Satluj Jal Vidyut Nigam Ltd
THDC :Tehri Hydro Development Corporation
BBMB :Bhakra Beas Management Board
NTPC has 0 dues*
*excluding unbilled revenue and net of provisions for doubtful debts
Payment Security Mechanisms
Rebate Schemes
100% collection efficiency 11th year in succession in FY14
Rs. crore
*outstanding for a period higher than 90 days 8
Sipat 2,980MW
Lara 1,600MW
Durgapur
(120MW)
Mouda (2,320MW)Kawas
(645MW)
Gandhar
(648MW)
Talcher Thermal
Talcher Kaniha
(3,000MW) + 10MW Solar
Bhilai
574MW
Rourkela
(120MW)Korba(2,600MW)
Kahalgaon (2,340MW)
Kanti
(610MW)
Barh 3,300MW
Nabinagar(1,000MW + 1980 MW)
Tanda (440MW)
Unchahar (1,550MW) &(10 MW Solar)
Meja (1,320MW)
Vindhyachal (4,760MW)
Singrauli (2,023MW)
Auraiya (652MW)
Anta
(413MW)
Jhajjar (1,500MW)
Badarpur (705MW)NCTPP (1,820MW)
Faridabad (430MW +5MW Solar)
Dadri (817MW) Dadri SolarPV (5MW)Lata Tapovan (171MW)
Koldam
(800MW)
Rihand 3,000MW Farakka 2,100MW
Bongaigaon (750MW)
Tapovan Vishnugad (520MW)
Gadarwara (1600 MW)
Rajgarh Solar PV
50 MW Daralipali
(1600MW)
NKP 1980MW
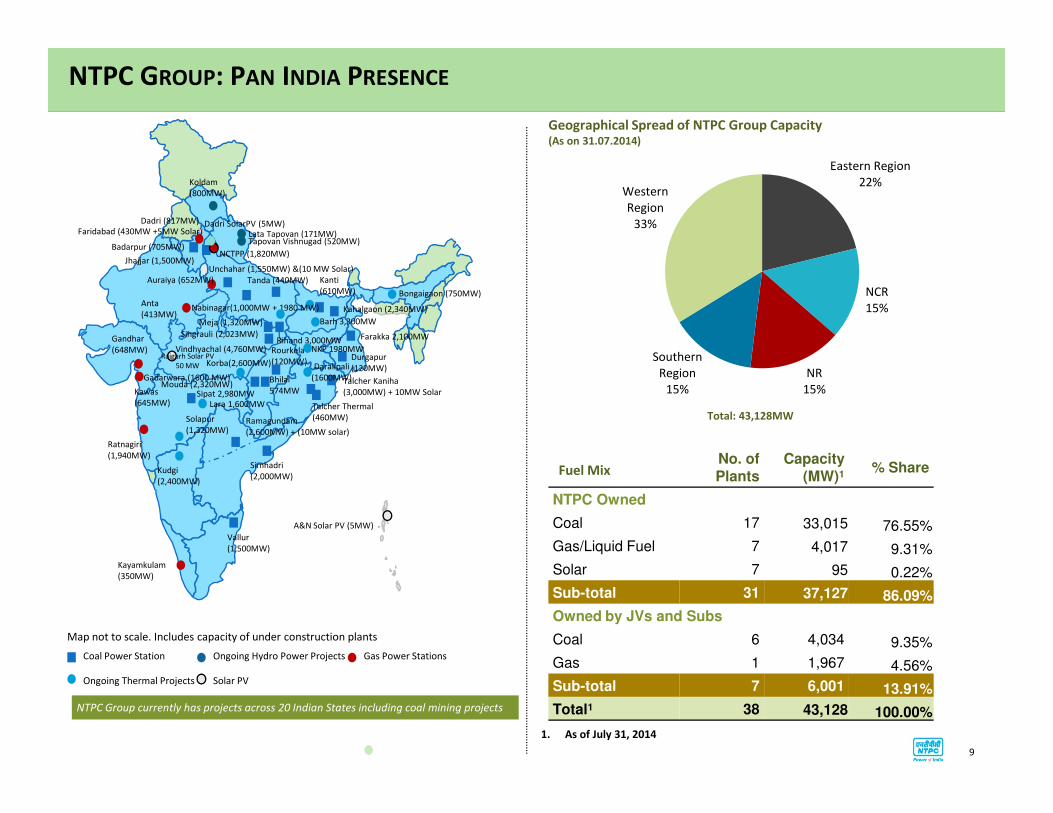
NTPC GROUP: PAN INDIA PRESENCE
Geographical Spread of NTPC Group Capacity(As on 31.07.2014)
Eastern Region
22%
NCR
15%
NR
15%
Southern
Region
15%
Western
Region
33%
Lara 1,600MW
Kayamkulam
(350MW)
Vallur
(1,500MW)
Kudgi
(2,400MW)
Ratnagiri
(1,940MW)
Solapur
(1,320MW)
Simhadri
(2,000MW)
Ramagundam
(2,600MW) + (10MW solar)
(645MW) Talcher Thermal
(460MW)
A&N Solar PV (5MW)
9
Fuel MixNo. of Plants
Capacity (MW)1
% Share
NTPC Owned
Coal 17 33,015 76.55%
Gas/Liquid Fuel 7 4,017 9.31%
Solar 7 95 0.22%
Sub-total 31 37,127 86.09%
Owned by JVs and Subs
Coal 6 4,034 9.35%
Gas 1 1,967 4.56%
Sub-total 7 6,001 13.91%
Total1 38 43,128 100.00%
1. As of July 31, 2014
NTPC Group currently has projects across 20 Indian States including coal mining projects
Coal Power Station Ongoing Hydro Power Projects Gas Power Stations
Ongoing Thermal Projects Solar PV
Map not to scale. Includes capacity of under construction plants
Total: 43,128MW
RECENT FINANCIAL HIGHLIGHTS
10
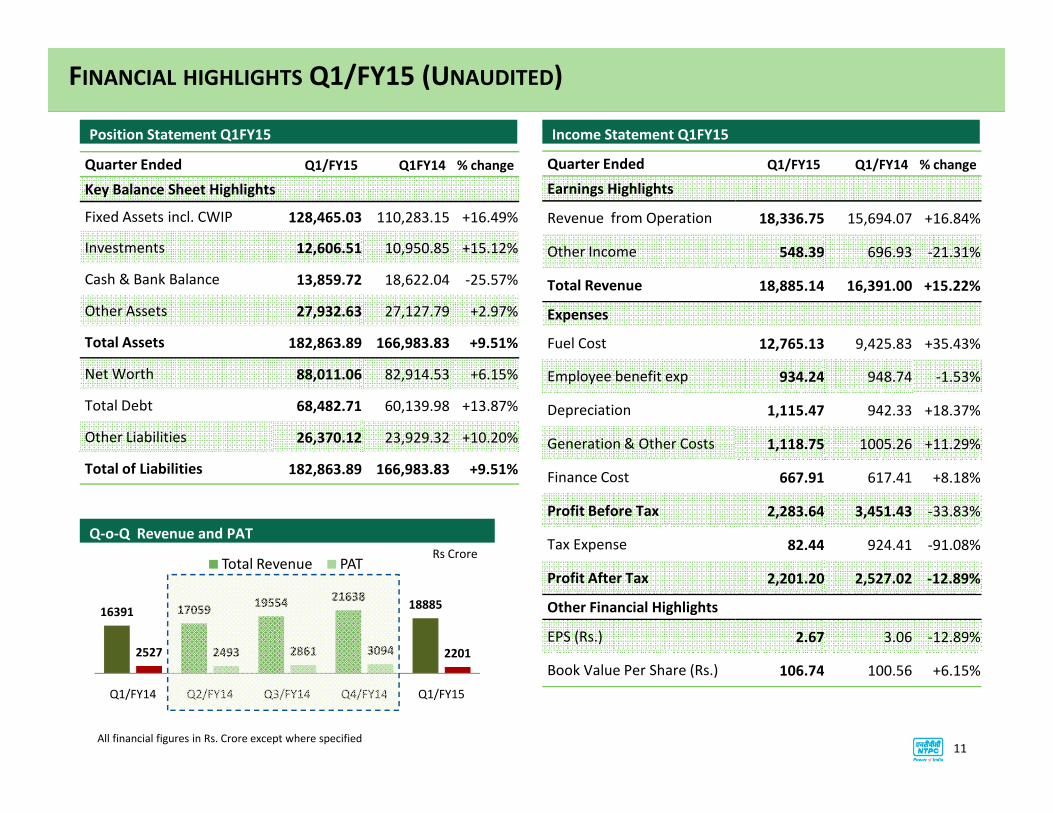
FINANCIAL HIGHLIGHTS Q1/FY15 (UNAUDITED)
Income Statement Q1FY15
Quarter Ended Q1/FY15 Q1/FY14 % change
Earnings Highlights
Revenue from Operation 18,336.75 15,694.07 +16.84%
Other Income 548.39 696.93 -21.31%
Total Revenue 18,885.14 16,391.00 +15.22%
Expenses
Fuel Cost 12,765.13 9,425.83 +35.43%
Employee benefit exp 934.24 948.74 -1.53%
Depreciation 1,115.47 942.33 +18.37%
Position Statement Q1FY15
Quarter Ended Q1/FY15 Q1FY14 % change
Key Balance Sheet Highlights
Fixed Assets incl. CWIP 128,465.03 110,283.15 +16.49%
Investments 12,606.51 10,950.85 +15.12%
Cash & Bank Balance 13,859.72 18,622.04 -25.57%
Other Assets 27,932.63 27,127.79 +2.97%
Total Assets 182,863.89 166,983.83 +9.51%
Net Worth 88,011.06 82,914.53 +6.15%
Total Debt 68,482.71 60,139.98 +13.87%
16391 1705919554
2163818885
2527 2493 2861 3094 2201
Q1/FY14 Q2/FY14 Q3/FY14 Q4/FY14 Q1/FY15
Total Revenue PAT
Depreciation 1,115.47 942.33 +18.37%
Generation & Other Costs 1,118.75 1005.26 +11.29%
Finance Cost 667.91 617.41 +8.18%
Profit Before Tax 2,283.64 3,451.43 -33.83%
Tax Expense 82.44 924.41 -91.08%
Profit After Tax 2,201.20 2,527.02 -12.89%
Other Financial Highlights
EPS (Rs.) 2.67 3.06 -12.89%
Book Value Per Share (Rs.) 106.74 100.56 +6.15%
Q-o-Q Revenue and PAT
Rs Crore
Total Debt 68,482.71 60,139.98 +13.87%
Other Liabilities 26,370.12 23,929.32 +10.20%
Total of Liabilities 182,863.89 166,983.83 +9.51%
11All financial figures in Rs. Crore except where specified
21,797
15000
20000
25000
-
25
50
75
100
125
Fixed Assets Incl CWIP Investment in JV Subs Cash & Bank
Rs.
Th
ou
san
ds
cro
re
FY10 FY11 FY12
FY13 FY14
17% CAGR
21% CAGR
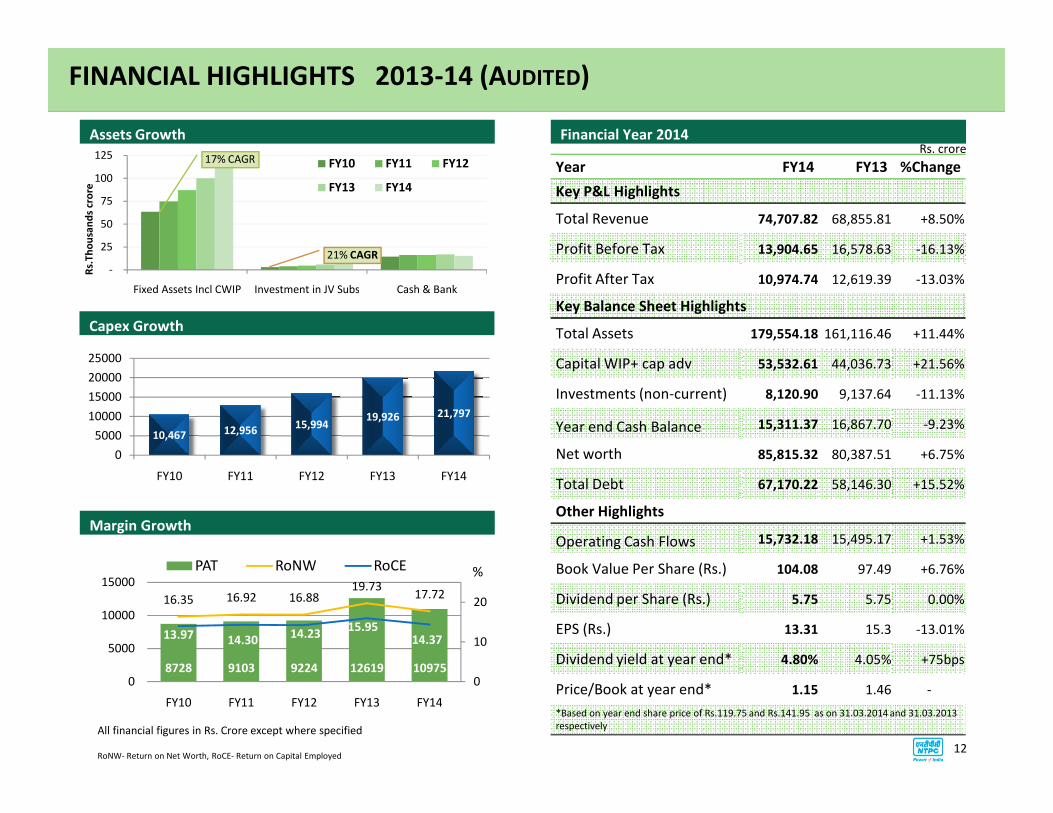
FINANCIAL HIGHLIGHTS 2013-14 (AUDITED)
Financial Year 2014
Year FY14 FY13 %Change
Key P&L Highlights
Total Revenue 74,707.82 68,855.81 +8.50%
Profit Before Tax 13,904.65 16,578.63 -16.13%
Profit After Tax 10,974.74 12,619.39 -13.03%
Key Balance Sheet Highlights
Total Assets 179,554.18 161,116.46 +11.44%
Capital WIP+ cap adv 53,532.61 44,036.73 +21.56%
Investments (non-current) 8,120.90 9,137.64 -11.13%
Assets Growth
Capex Growth
Rs. crore
10,467 12,95615,994
19,926 21,797
0
5000
10000
FY10 FY11 FY12 FY13 FY14
Year end Cash Balance 15,311.37 16,867.70 -9.23%
Net worth 85,815.32 80,387.51 +6.75%
Total Debt 67,170.22 58,146.30 +15.52%
Other Highlights
Operating Cash Flows 15,732.18 15,495.17 +1.53%
Book Value Per Share (Rs.) 104.08 97.49 +6.76%
Dividend per Share (Rs.) 5.75 5.75 0.00%
EPS (Rs.) 13.31 15.3 -13.01%
Dividend yield at year end* 4.80% 4.05% +75bps
Price/Book at year end* 1.15 1.46 -
*Based on year end share price of Rs.119.75 and Rs.141.95 as on 31.03.2014 and 31.03.2013
respectively
8728 9103 9224 12619 10975
16.35 16.92 16.8819.73
17.72
13.97 14.3014.23
15.9514.37
0
10
20
0
5000
10000
15000
FY10 FY11 FY12 FY13 FY14
PAT RoNW RoCE %
Margin Growth
12
All financial figures in Rs. Crore except where specified
RoNW- Return on Net Worth, RoCE- Return on Capital Employed
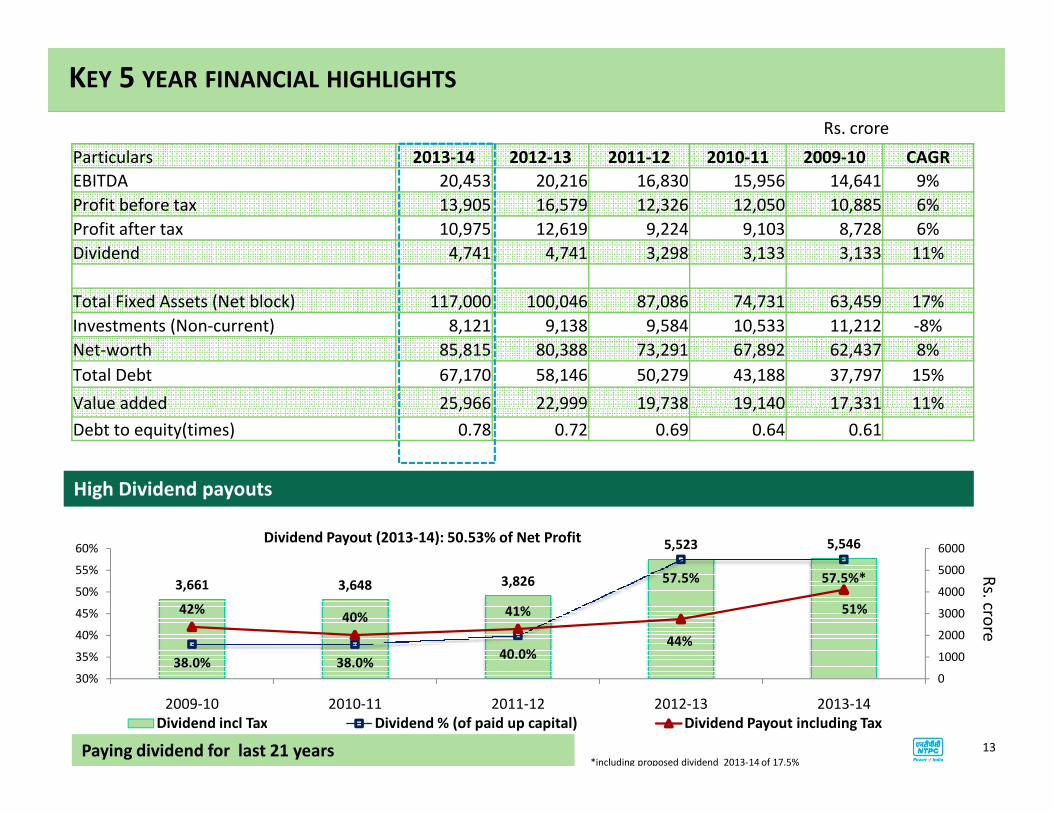
Particulars 2013-14 2012-13 2011-12 2010-11 2009-10 CAGR
EBITDA 20,453 20,216 16,830 15,956 14,641 9%
Profit before tax 13,905 16,579 12,326 12,050 10,885 6%
Profit after tax 10,975 12,619 9,224 9,103 8,728 6%
Dividend 4,741 4,741 3,298 3,133 3,133 11%
Total Fixed Assets (Net block) 117,000 100,046 87,086 74,731 63,459 17%
Investments (Non-current) 8,121 9,138 9,584 10,533 11,212 -8%
Net-worth 85,815 80,388 73,291 67,892 62,437 8%
Total Debt 67,170 58,146 50,279 43,188 37,797 15%
Value added 25,966 22,999 19,738 19,140 17,331 11%
KEY 5 YEAR FINANCIAL HIGHLIGHTS
Rs. crore
Value added 25,966 22,999 19,738 19,140 17,331 11%
Debt to equity(times) 0.78 0.72 0.69 0.64 0.61
3,661 3,648 3,826
5,523 5,546
38.0% 38.0%40.0%
57.5% 57.5%*
42%40% 41%
44%
51%
0
1000
2000
3000
4000
5000
6000
30%
35%
40%
45%
50%
55%
60%
2009-10 2010-11 2011-12 2012-13 2013-14
Dividend Payout (2013-14): 50.53% of Net Profit
Dividend incl Tax Dividend % (of paid up capital) Dividend Payout including Tax
*including proposed dividend 2013-14 of 17.5%
Rs. cro
re
High Dividend payoutsHigh Dividend payouts
Paying dividend for last 21 years 13

OPPORTUNITIES AND SECTORAL GROWTH DRIVERS
14
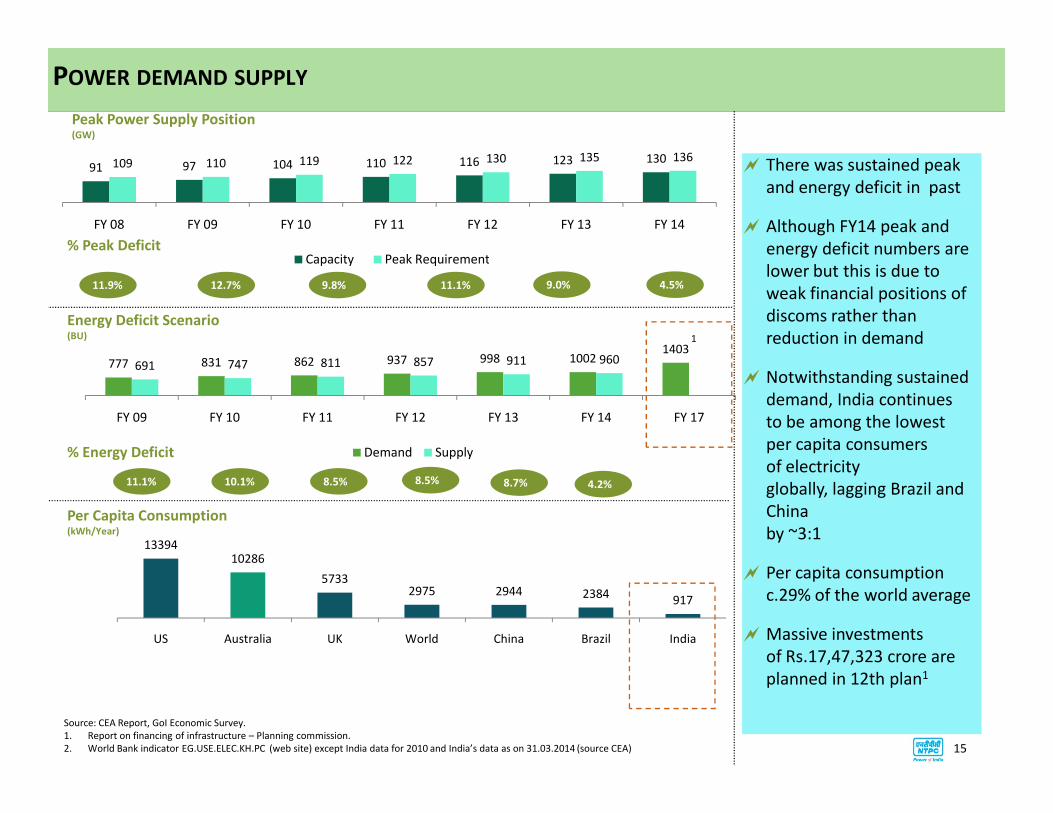
91 97 104 110 116 123 130109 110 119 122 130 135 136
FY 08 FY 09 FY 10 FY 11 FY 12 FY 13 FY 14
Capacity Peak Requirement
777 831 862 937 998 10021403
691 747 811 857 911 960
POWER DEMAND SUPPLY
Peak Power Supply Position(GW)
% Peak Deficit
Energy Deficit Scenario(BU)
9.0% 4.5%11.9% 12.7% 9.8% 11.1%
� There was sustained peak
and energy deficit in past
� Although FY14 peak and
energy deficit numbers are
lower but this is due to
weak financial positions of
discoms rather than
reduction in demand
� Notwithstanding sustained
demand, India continues
1
1339410286
57332975 2944 2384
917
US Australia UK World China Brazil India
FY 09 FY 10 FY 11 FY 12 FY 13 FY 14 FY 17
Demand Supply
Per Capita Consumption(kWh/Year)
% Energy Deficit
8.7% 4.2%8.5%
demand, India continues
to be among the lowest
per capita consumers
of electricity
globally, lagging Brazil and
China
by ~3:1
� Per capita consumption
c.29% of the world average
� Massive investments
of Rs.17,47,323 crore are
planned in 12th plan1
Source: CEA Report, GoI Economic Survey.
1. Report on financing of infrastructure – Planning commission.
2. World Bank indicator EG.USE.ELEC.KH.PC (web site) except India data for 2010 and India’s data as on 31.03.2014 (source CEA)
11.1% 10.1% 8.5%
15
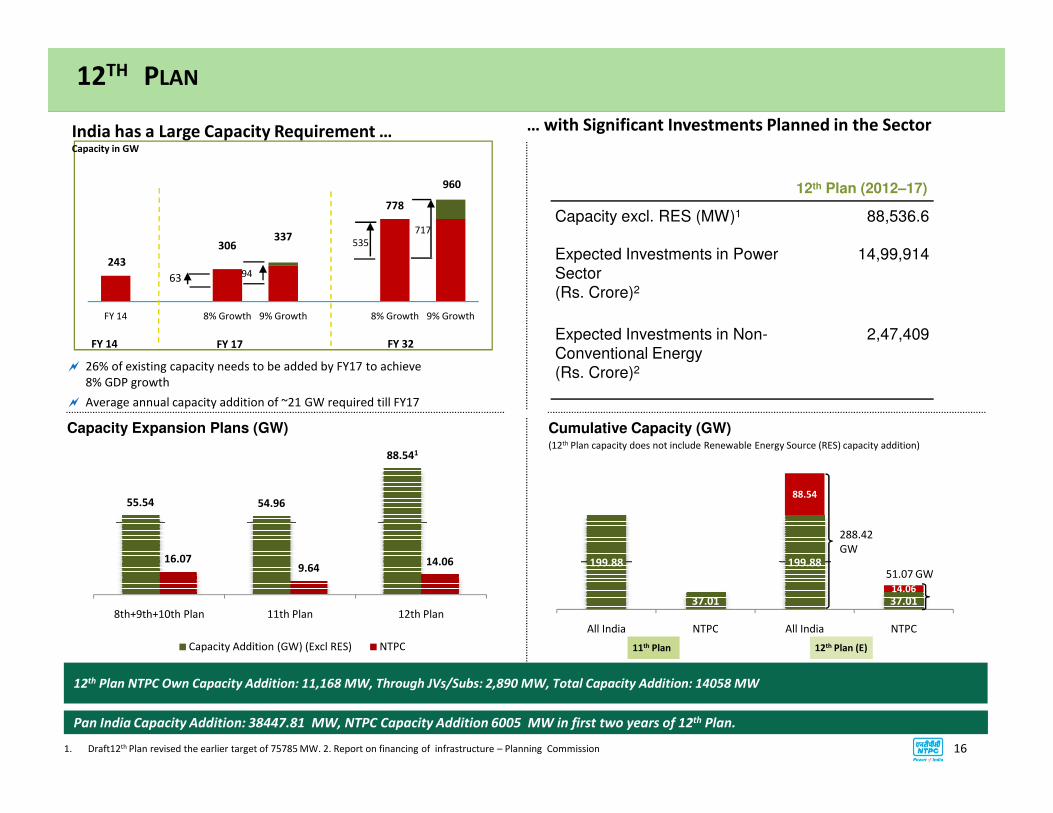
243
306337
778
960
FY 14 8% Growth 9% Growth 8% Growth 9% Growth
12TH PLAN
12th Plan (2012–17)
Capacity excl. RES (MW)1 88,536.6
Expected Investments in Power
Sector
(Rs. Crore)2
14,99,914
Expected Investments in Non-
Conventional Energy
(Rs. Crore)2
2,47,409
9463
535
717
India has a Large Capacity Requirement …Capacity in GW
� 26% of existing capacity needs to be added by FY17 to achieve
8% GDP growth
� Average annual capacity addition of ~21 GW required till FY17
… with Significant Investments Planned in the Sector
FY 17 FY 32FY 14
199.88
37.01
199.88
37.01
88.54
14.06
All India NTPC All India NTPC
� Average annual capacity addition of ~21 GW required till FY17
Capacity Expansion Plans (GW) Cumulative Capacity (GW)
288.42
GW
(12th Plan capacity does not include Renewable Energy Source (RES) capacity addition)
12th Plan (E)
51.07 GW
11th Plan
55.54 54.96
88.541
16.079.64
14.06
8th+9th+10th Plan 11th Plan 12th Plan
Capacity Addition (GW) (Excl RES) NTPC
12th Plan NTPC Own Capacity Addition: 11,168 MW, Through JVs/Subs: 2,890 MW, Total Capacity Addition: 14058 MW
161. Draft12th Plan revised the earlier target of 75785 MW. 2. Report on financing of infrastructure – Planning Commission
Pan India Capacity Addition: 38447.81 MW, NTPC Capacity Addition 6005 MW in first two years of 12th Plan.

COMPETITIVE POSITION
17
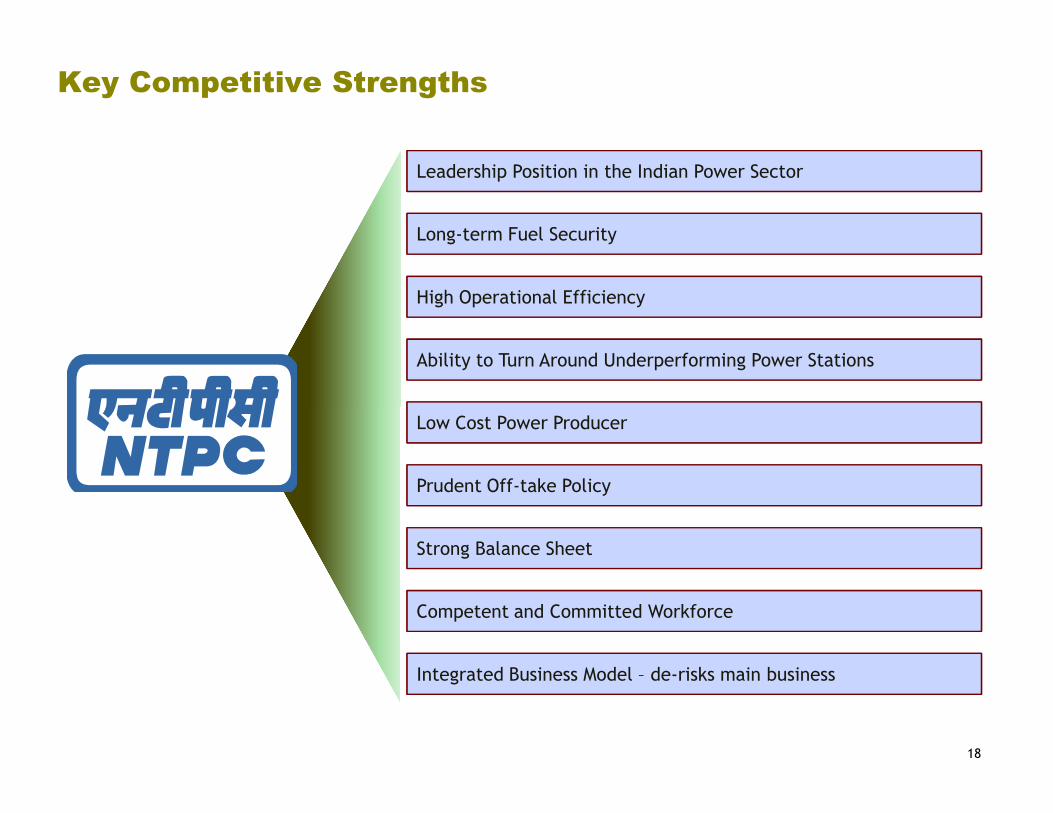
Key Competitive Strengths
Leadership Position in the Indian Power Sector
Long-term Fuel Security
High Operational Efficiency
Ability to Turn Around Underperforming Power Stations
Low Cost Power Producer
Prudent Off-take Policy
Strong Balance Sheet
Competent and Committed Workforce
Integrated Business Model – de-risks main business
18

Post
CSAs signed(MW)Commissioned Standalone Capacity
Coal
89%
Gas
11%
LONG-TERM FUEL SECURITY
�NTPC implements projects only upon establishing availability of fuel
�‘Maharatna’ status provides very high level of autonomy with regards to
investments in backward integration and new fuel sources
�By 2032, NTPC will substantially reduce dependence on fossil fuels
Cu
rre
nt
Ca
pa
city
Bre
ak
-up
Capacity Break-up
(By Fuel)1
Captive/
e-auction
2%Railways
Coal Transportation (Standalone Commissioned Capacity)
Pre 2009 CSA
23895
72%
Post
2009 CSA
8460
26% Non-CSA
660
2%
Pre 2009 CSA Post 2009 CSA Non-CSA
19
Co
al:
Lo
ng
-te
rm F
ue
l S
ecu
rity
�Standalone Capacity of 32,355 MW is covered by long term Coal Supply Agreements (CSA) which have been signed with CIL & SCCL.
� Additionally, CSA for 1160 MW yet to be commissioned projects have been signed.
�75% of coal capacity is linked by own merry go round rail system/belt conveyor system to coal mines representing 10 out of 17 coal plants.
�For group companies, CSAs for 4,390MW have been signed in
2%
MGR
75%
Railways
23%
Captive/ e-auction
83.1%73.1% 70.9%
1.7%1.4%
1.4%1.8% 6.0%
15.3% 23.6% 21.7%
2014-15 2015-16 2016-17
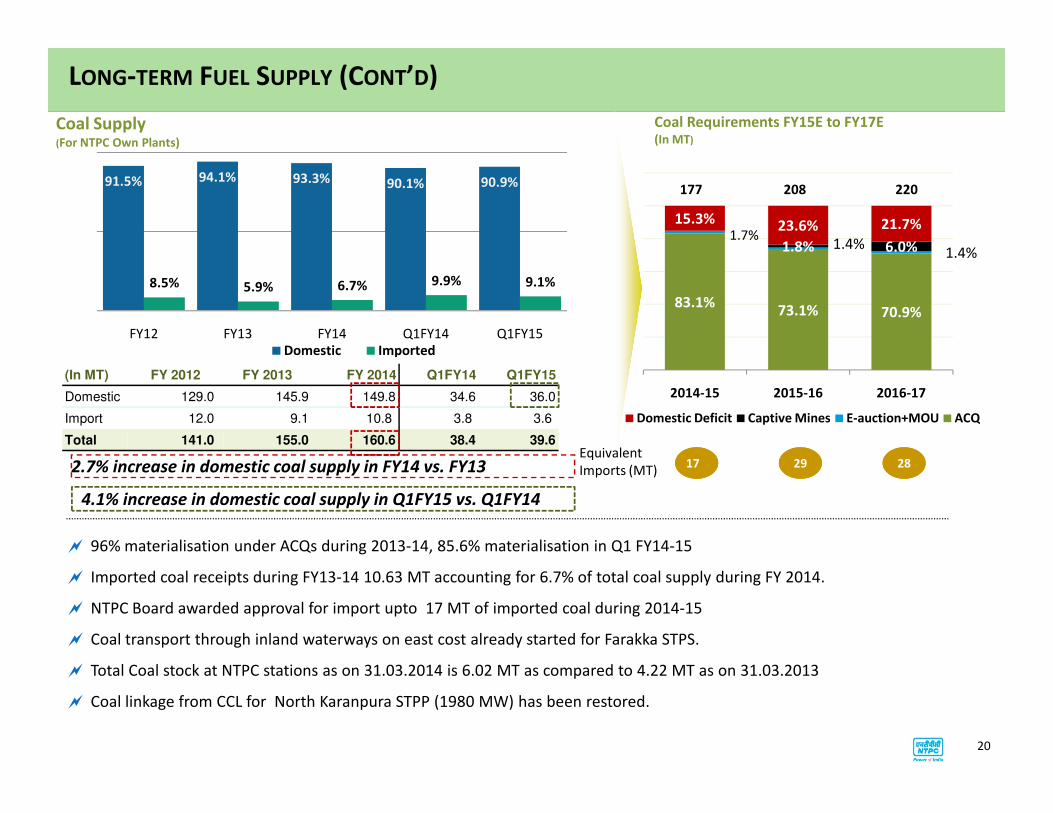
LONG-TERM FUEL SUPPLY (CONT’D)
Coal Supply(For NTPC Own Plants)
Coal Requirements FY15E to FY17E(In MT)
(In MT) FY 2012 FY 2013 FY 2014 Q1FY14 Q1FY15
Domestic 129.0 145.9 149.8 34.6 36.0
177 208 22091.5% 94.1% 93.3% 90.1% 90.9%
8.5% 5.9% 6.7% 9.9% 9.1%
FY12 FY13 FY14 Q1FY14 Q1FY15
Domestic Imported
Domestic Deficit Captive Mines E-auction+MOU ACQ
20
� 96% materialisation under ACQs during 2013-14, 85.6% materialisation in Q1 FY14-15
� Imported coal receipts during FY13-14 10.63 MT accounting for 6.7% of total coal supply during FY 2014.
� NTPC Board awarded approval for import upto 17 MT of imported coal during 2014-15
� Coal transport through inland waterways on east cost already started for Farakka STPS.
� Total Coal stock at NTPC stations as on 31.03.2014 is 6.02 MT as compared to 4.22 MT as on 31.03.2013
� Coal linkage from CCL for North Karanpura STPP (1980 MW) has been restored.
Import 12.0 9.1 10.8 3.8 3.6
Total 141.0 155.0 160.6 38.4 39.6
17 29 28Equivalent
Imports (MT)2.7% increase in domestic coal supply in FY14 vs. FY13
4.1% increase in domestic coal supply in Q1FY15 vs. Q1FY14
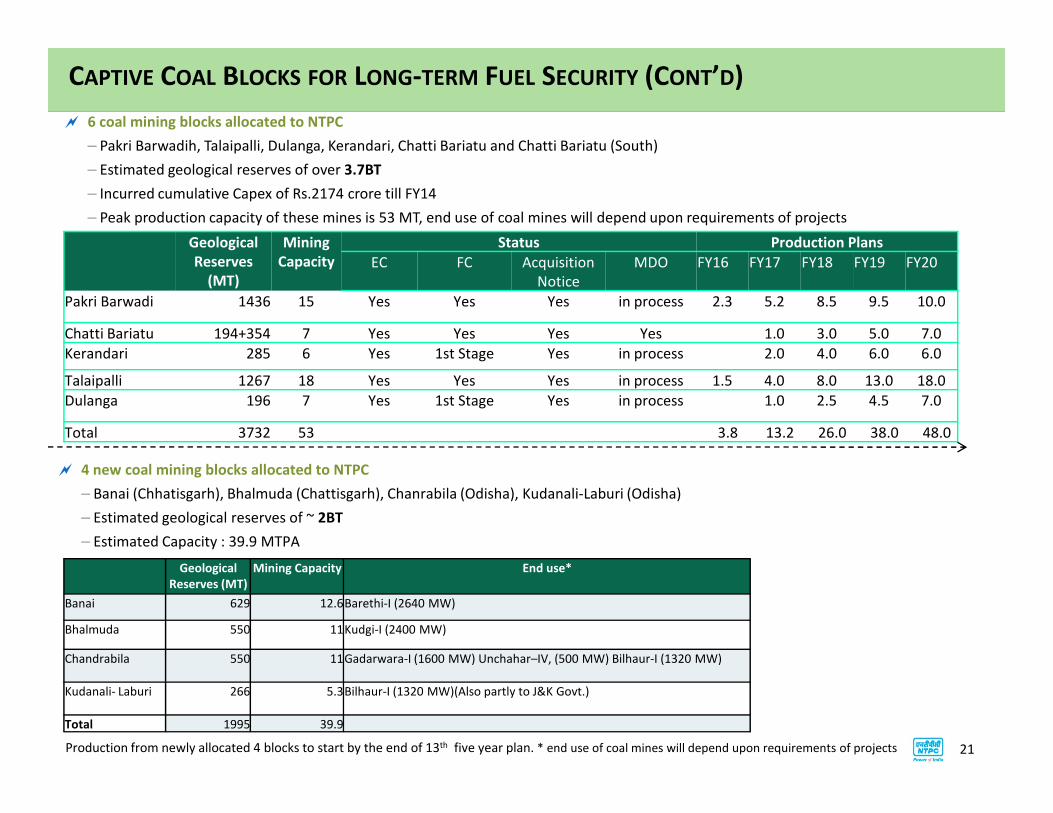
CAPTIVE COAL BLOCKS FOR LONG-TERM FUEL SECURITY (CONT’D)
Geological
Reserves
(MT)
Mining
Capacity
Status Production Plans
EC FC Acquisition
Notice
MDO FY16 FY17 FY18 FY19 FY20
Pakri Barwadi 1436 15 Yes Yes Yes in process 2.3 5.2 8.5 9.5 10.0
Chatti Bariatu 194+354 7 Yes Yes Yes Yes 1.0 3.0 5.0 7.0
Kerandari 285 6 Yes 1st Stage Yes in process 2.0 4.0 6.0 6.0
Talaipalli 1267 18 Yes Yes Yes in process 1.5 4.0 8.0 13.0 18.0
Dulanga 196 7 Yes 1st Stage Yes in process 1.0 2.5 4.5 7.0
� 6 coal mining blocks allocated to NTPC
– Pakri Barwadih, Talaipalli, Dulanga, Kerandari, Chatti Bariatu and Chatti Bariatu (South)
– Estimated geological reserves of over 3.7BT
– Incurred cumulative Capex of Rs.2174 crore till FY14
– Peak production capacity of these mines is 53 MT, end use of coal mines will depend upon requirements of projects
21
Dulanga 196 7 Yes 1st Stage Yes in process 1.0 2.5 4.5 7.0
Total 3732 53 3.8 13.2 26.0 38.0 48.0
� 4 new coal mining blocks allocated to NTPC
– Banai (Chhatisgarh), Bhalmuda (Chattisgarh), Chanrabila (Odisha), Kudanali-Laburi (Odisha)
– Estimated geological reserves of ~ 2BT
– Estimated Capacity : 39.9 MTPA
Geological
Reserves (MT)
Mining Capacity End use*
Banai 629 12.6Barethi-I (2640 MW)
Bhalmuda 550 11Kudgi-I (2400 MW)
Chandrabila 550 11Gadarwara-I (1600 MW) Unchahar–IV, (500 MW) Bilhaur-I (1320 MW)
Kudanali- Laburi 266 5.3Bilhaur-I (1320 MW)(Also partly to J&K Govt.)
Total 1995 39.9
Production from newly allocated 4 blocks to start by the end of 13th five year plan. * end use of coal mines will depend upon requirements of projects
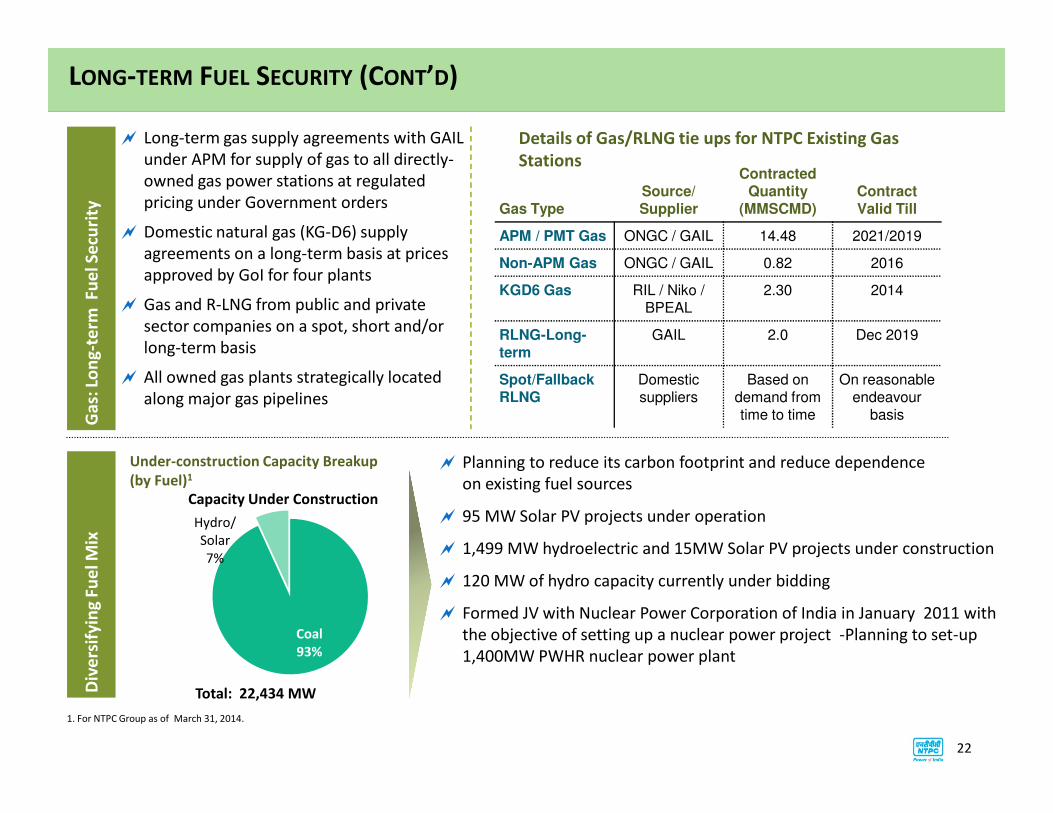
LONG-TERM FUEL SECURITY (CONT’D)
� Long-term gas supply agreements with GAIL
under APM for supply of gas to all directly-
owned gas power stations at regulated
pricing under Government orders
� Domestic natural gas (KG-D6) supply
agreements on a long-term basis at prices
approved by GoI for four plants
� Gas and R-LNG from public and private
sector companies on a spot, short and/or
long-term basis
� All owned gas plants strategically located
along major gas pipelines
Ga
s: L
on
g-t
erm
Fu
el
Se
curi
ty Gas TypeSource/ Supplier
Contracted Quantity
(MMSCMD)Contract Valid Till
APM / PMT Gas ONGC / GAIL 14.48 2021/2019
Non-APM Gas ONGC / GAIL 0.82 2016
KGD6 Gas RIL / Niko / BPEAL
2.30 2014
RLNG-Long-term
GAIL 2.0 Dec 2019
Spot/FallbackRLNG
Domestic suppliers
Based on demand from time to time
On reasonable endeavour
basis
Details of Gas/RLNG tie ups for NTPC Existing Gas
Stations
� Planning to reduce its carbon footprint and reduce dependence
on existing fuel sources
� 95 MW Solar PV projects under operation
� 1,499 MW hydroelectric and 15MW Solar PV projects under construction
� 120 MW of hydro capacity currently under bidding
� Formed JV with Nuclear Power Corporation of India in January 2011 with
the objective of setting up a nuclear power project -Planning to set-up
1,400MW PWHR nuclear power plant
22
Under-construction Capacity Breakup
(by Fuel)1
along major gas pipelines
1. For NTPC Group as of March 31, 2014.
Ga
s:
Div
ers
ify
ing
Fu
el
Mix
time to time basis
Total: 22,434 MW
Coal
93%
Hydro/
Solar
7%
Capacity Under Construction
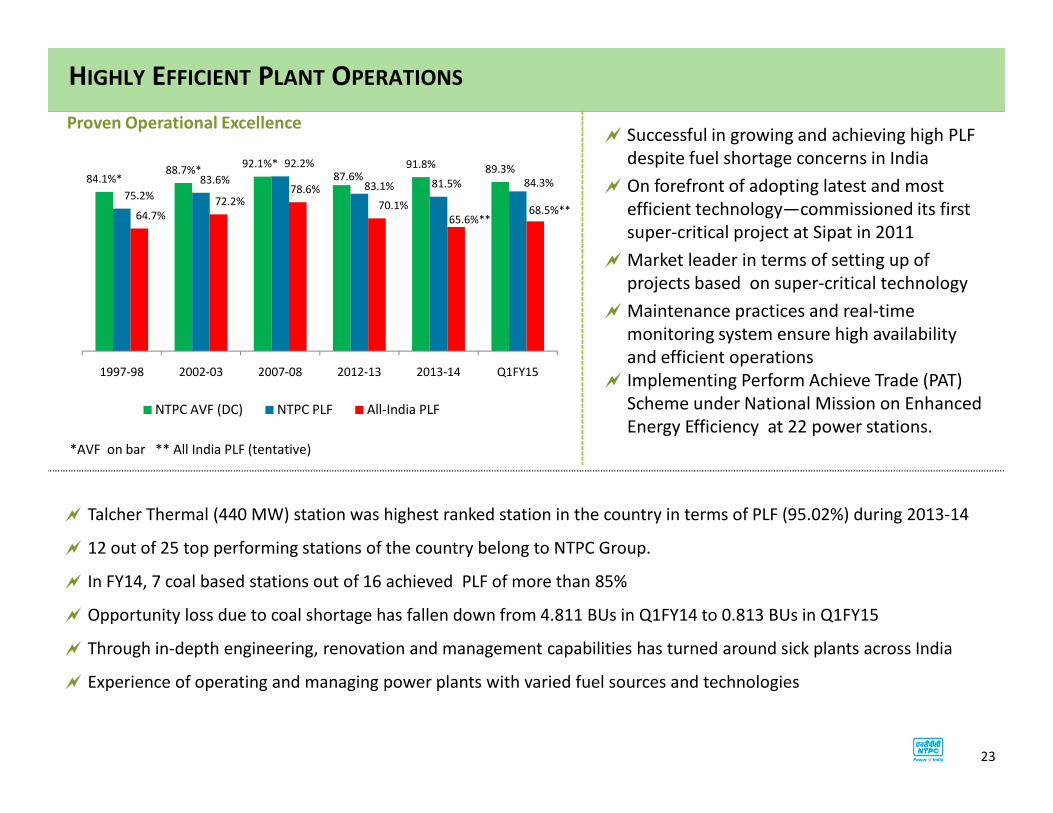
84.1%*88.7%*
92.1%*87.6%
91.8% 89.3%
75.2%
83.6%
92.2%
83.1% 81.5% 84.3%
64.7%
72.2%78.6%
70.1%
65.6%**68.5%**
1997-98 2002-03 2007-08 2012-13 2013-14 Q1FY15
NTPC AVF (DC) NTPC PLF All-India PLF
HIGHLY EFFICIENT PLANT OPERATIONS
� Successful in growing and achieving high PLF
despite fuel shortage concerns in India
� On forefront of adopting latest and most
efficient technology—commissioned its first
super-critical project at Sipat in 2011
� Market leader in terms of setting up of
projects based on super-critical technology
� Maintenance practices and real-time
monitoring system ensure high availability
and efficient operations
� Implementing Perform Achieve Trade (PAT)
Scheme under National Mission on Enhanced
Proven Operational Excellence
NTPC AVF (DC) NTPC PLF All-India PLF
23
Scheme under National Mission on Enhanced
Energy Efficiency at 22 power stations.
� Talcher Thermal (440 MW) station was highest ranked station in the country in terms of PLF (95.02%) during 2013-14
� 12 out of 25 top performing stations of the country belong to NTPC Group.
� In FY14, 7 coal based stations out of 16 achieved PLF of more than 85%
� Opportunity loss due to coal shortage has fallen down from 4.811 BUs in Q1FY14 to 0.813 BUs in Q1FY15
� Through in-depth engineering, renovation and management capabilities has turned around sick plants across India
� Experience of operating and managing power plants with varied fuel sources and technologies
*AVF on bar ** All India PLF (tentative)
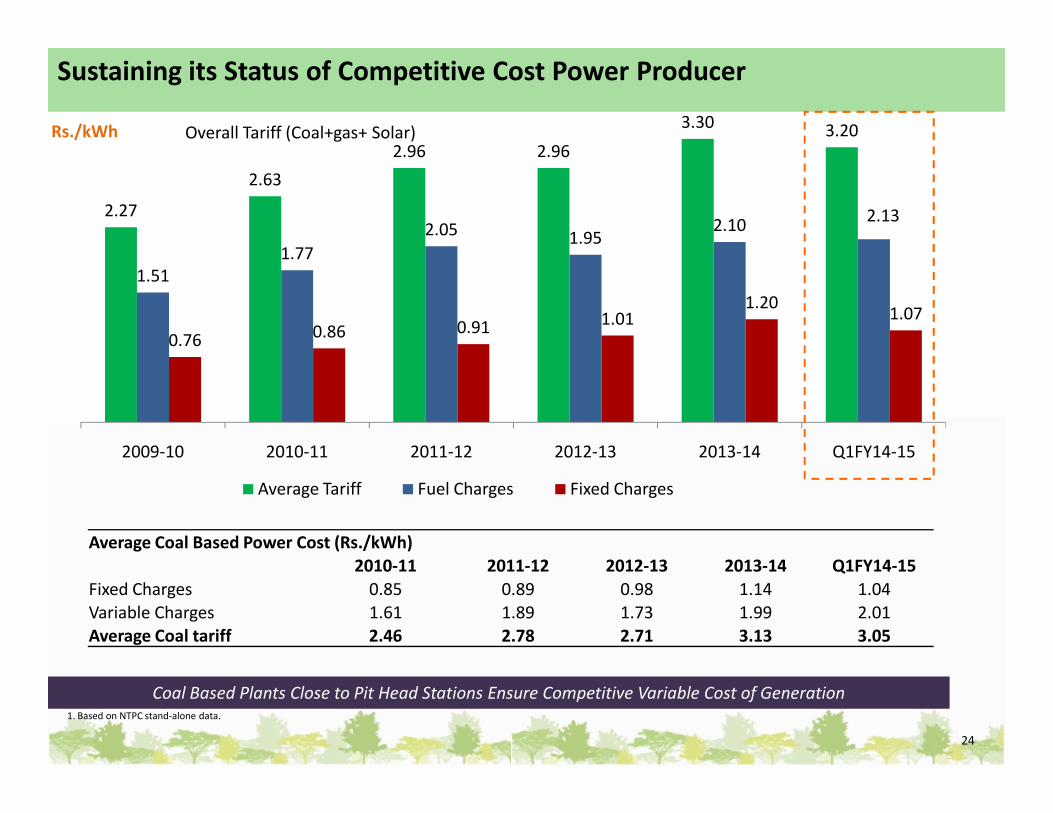
2.27
2.63
2.96 2.96
3.303.20
1.51
1.77
2.051.95
2.102.13
0.760.86 0.91
1.011.20
1.07
Sustaining its Status of Competitive Cost Power Producer
Rs./kWh Overall Tariff (Coal+gas+ Solar)
2009-10 2010-11 2011-12 2012-13 2013-14 Q1FY14-15
Average Tariff Fuel Charges Fixed Charges
24
Coal Based Plants Close to Pit Head Stations Ensure Competitive Variable Cost of Generation1. Based on NTPC stand-alone data.
Average Coal Based Power Cost (Rs./kWh)
2010-11 2011-12 2012-13 2013-14 Q1FY14-15
Fixed Charges 0.85 0.89 0.98 1.14 1.04
Variable Charges 1.61 1.89 1.73 1.99 2.01
Average Coal tariff 2.46 2.78 2.71 3.13 3.05
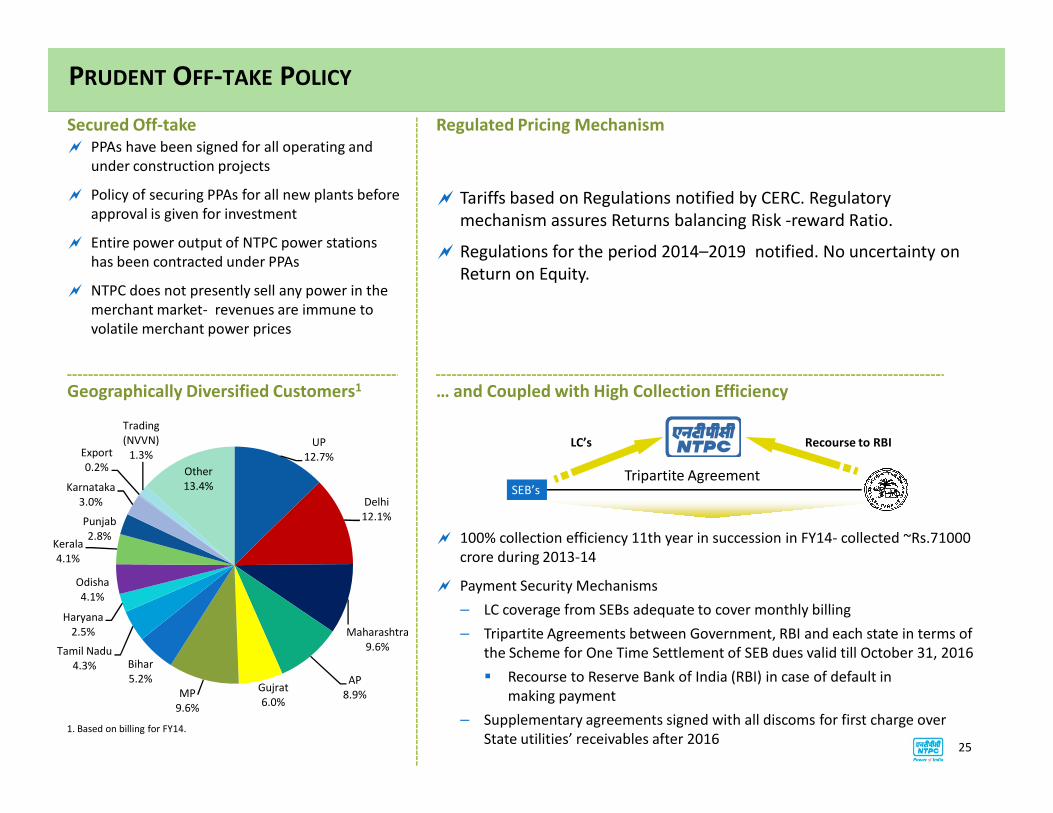
� PPAs have been signed for all operating and
under construction projects
� Policy of securing PPAs for all new plants before
approval is given for investment
� Entire power output of NTPC power stations
has been contracted under PPAs
� NTPC does not presently sell any power in the
merchant market- revenues are immune to
volatile merchant power prices
� Tariffs based on Regulations notified by CERC. Regulatory
mechanism assures Returns balancing Risk -reward Ratio.
� Regulations for the period 2014–2019 notified. No uncertainty on
Return on Equity.
PRUDENT OFF-TAKE POLICY
Regulated Pricing MechanismSecured Off-take
… and Coupled with High Collection EfficiencyGeographically Diversified Customers1
25
� 100% collection efficiency 11th year in succession in FY14- collected ~Rs.71000
crore during 2013-14
� Payment Security Mechanisms
– LC coverage from SEBs adequate to cover monthly billing
– Tripartite Agreements between Government, RBI and each state in terms of
the Scheme for One Time Settlement of SEB dues valid till October 31, 2016
� Recourse to Reserve Bank of India (RBI) in case of default in
making payment
– Supplementary agreements signed with all discoms for first charge over
State utilities’ receivables after 20161. Based on billing for FY14.
SEB’sTripartite Agreement
LC’s Recourse to RBIUP
12.7%
Delhi
12.1%
Maharashtra
9.6%
AP
8.9%Gujrat
6.0%MP
9.6%
Bihar
5.2%
Tamil Nadu
4.3%
Haryana
2.5%
Odisha
4.1%
Kerala
4.1%
Punjab
2.8%
Karnataka
3.0%
Export
0.2%
Trading
(NVVN)
1.3%
Other
13.4%
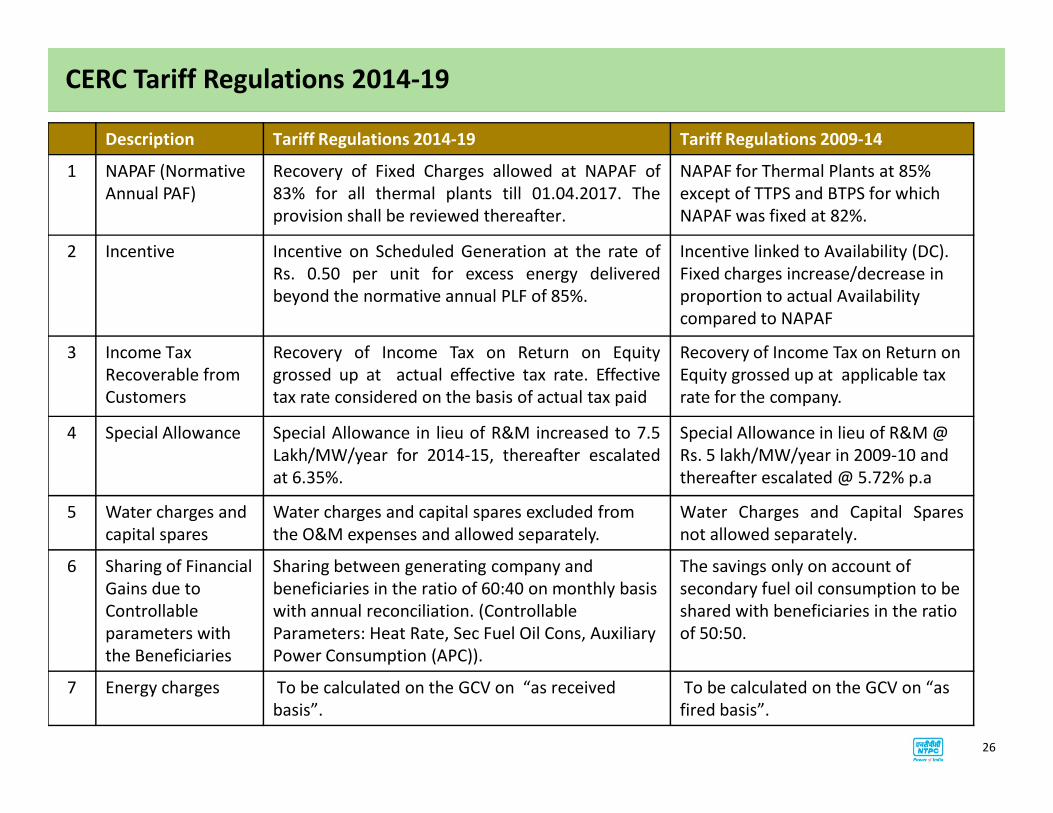
Description Tariff Regulations 2014-19 Tariff Regulations 2009-14
1 NAPAF (Normative
Annual PAF)
Recovery of Fixed Charges allowed at NAPAF of
83% for all thermal plants till 01.04.2017. The
provision shall be reviewed thereafter.
NAPAF for Thermal Plants at 85%
except of TTPS and BTPS for which
NAPAF was fixed at 82%.
2 Incentive Incentive on Scheduled Generation at the rate of
Rs. 0.50 per unit for excess energy delivered
beyond the normative annual PLF of 85%.
Incentive linked to Availability (DC).
Fixed charges increase/decrease in
proportion to actual Availability
compared to NAPAF
3 Income Tax
Recoverable from
Customers
Recovery of Income Tax on Return on Equity
grossed up at actual effective tax rate. Effective
tax rate considered on the basis of actual tax paid
Recovery of Income Tax on Return on
Equity grossed up at applicable tax
rate for the company.
CERC Tariff Regulations 2014-19
4 Special Allowance Special Allowance in lieu of R&M increased to 7.5
Lakh/MW/year for 2014-15, thereafter escalated
at 6.35%.
Special Allowance in lieu of R&M @
Rs. 5 lakh/MW/year in 2009-10 and
thereafter escalated @ 5.72% p.a
5 Water charges and
capital spares
Water charges and capital spares excluded from
the O&M expenses and allowed separately.
Water Charges and Capital Spares
not allowed separately.
6 Sharing of Financial
Gains due to
Controllable
parameters with
the Beneficiaries
Sharing between generating company and
beneficiaries in the ratio of 60:40 on monthly basis
with annual reconciliation. (Controllable
Parameters: Heat Rate, Sec Fuel Oil Cons, Auxiliary
Power Consumption (APC)).
The savings only on account of
secondary fuel oil consumption to be
shared with beneficiaries in the ratio
of 50:50.
7 Energy charges To be calculated on the GCV on “as received
basis”.
To be calculated on the GCV on “as
fired basis”.
26
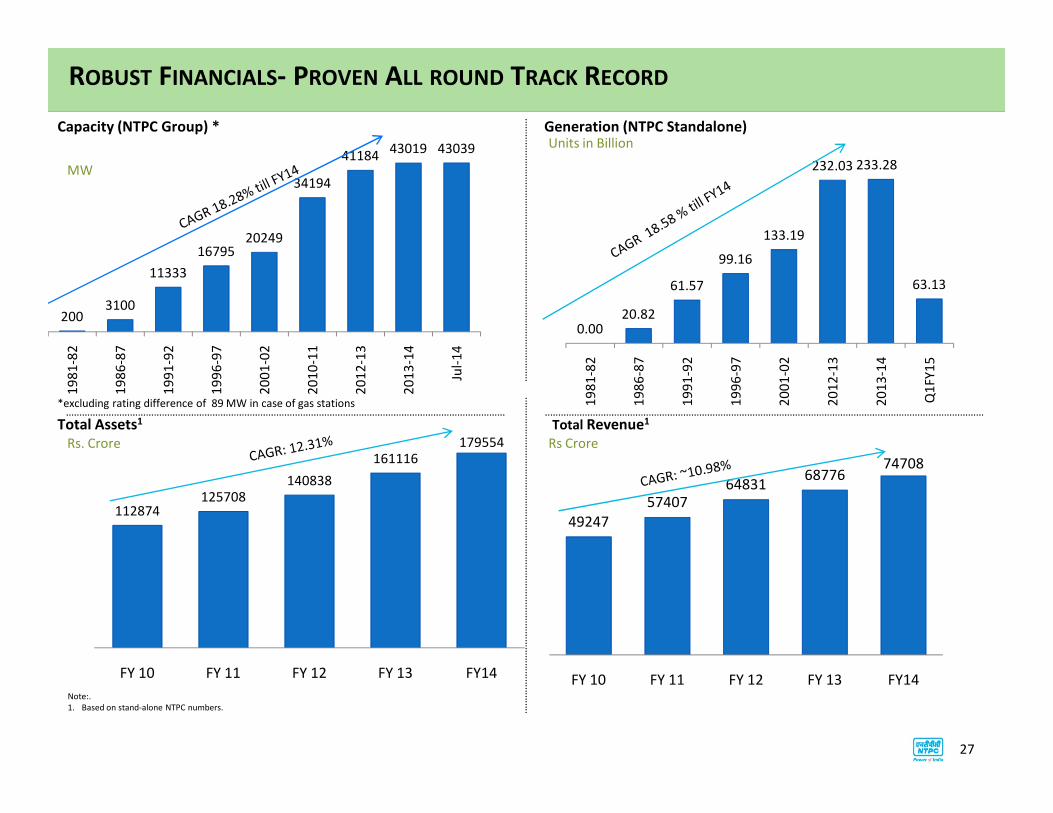
ROBUST FINANCIALS- PROVEN ALL ROUND TRACK RECORD
Capacity (NTPC Group) * Generation (NTPC Standalone)
0.0020.82
61.57
99.16
133.19
232.03 233.28
63.13
19
81
-82
19
86
-87
19
91
-92
19
96
-97
20
01
-02
20
12
-13
20
13
-14
Q1
FY
15
2003100
11333
1679520249
34194
4118443019 43039
19
81
-82
19
86
-87
19
91
-92
19
96
-97
20
01
-02
20
10
-11
20
12
-13
20
13
-14
Jul-
14
MW
Units in Billion
*excluding rating difference of 89 MW in case of gas stations
49247
5740764831
6877674708
FY 10 FY 11 FY 12 FY 13 FY14
Total Revenue1Total Assets1
112874125708
140838
161116179554
FY 10 FY 11 FY 12 FY 13 FY14
27
Rs. Crore Rs Crore
Note:.
1. Based on stand-alone NTPC numbers.
*excluding rating difference of 89 MW in case of gas stations
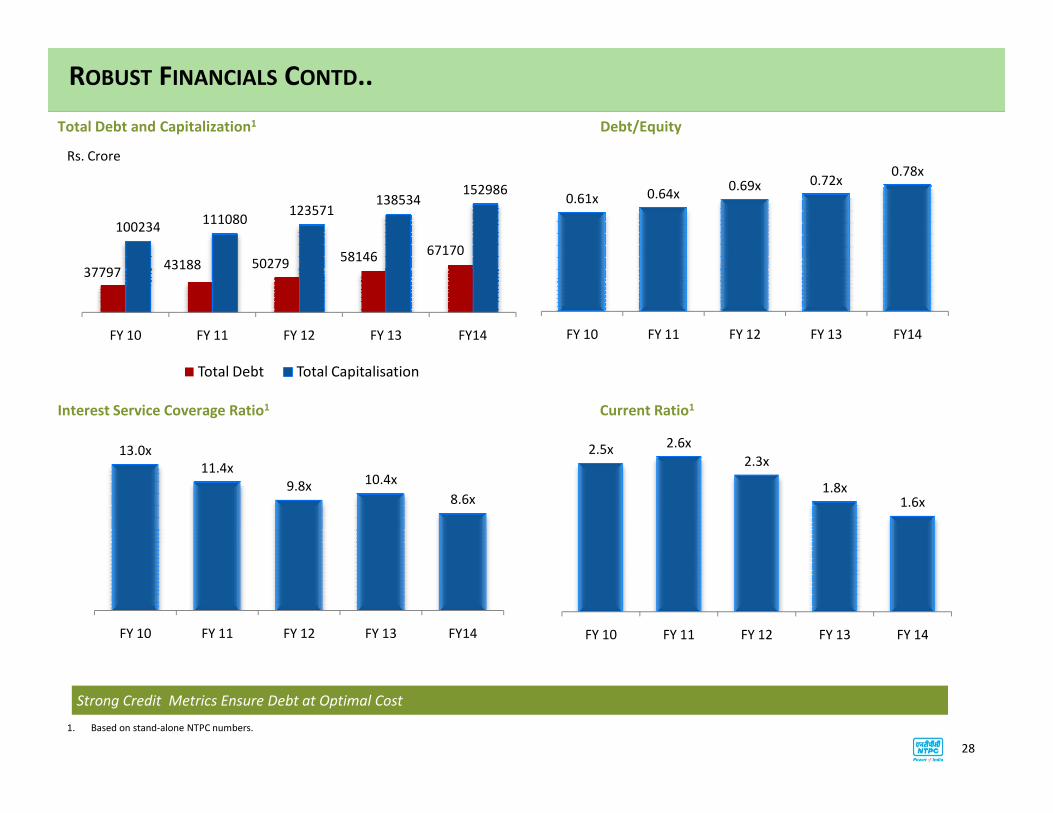
3779743188 50279
58146 67170
100234111080
123571138534
152986
FY 10 FY 11 FY 12 FY 13 FY14
Total Debt Total Capitalisation
0.61x 0.64x0.69x 0.72x
0.78x
FY 10 FY 11 FY 12 FY 13 FY14
ROBUST FINANCIALS CONTD..
Total Debt and Capitalization1
Interest Service Coverage Ratio1
Debt/Equity
Current Ratio1
Rs. Crore
2.5x 2.6x
2.3x
1.8x1.6x
FY 10 FY 11 FY 12 FY 13 FY 14
Interest Service Coverage Ratio1 Current Ratio1
1. Based on stand-alone NTPC numbers.
Strong Credit Metrics Ensure Debt at Optimal Cost
13.0x
11.4x
9.8x 10.4x
8.6x
FY 10 FY 11 FY 12 FY 13 FY14
28
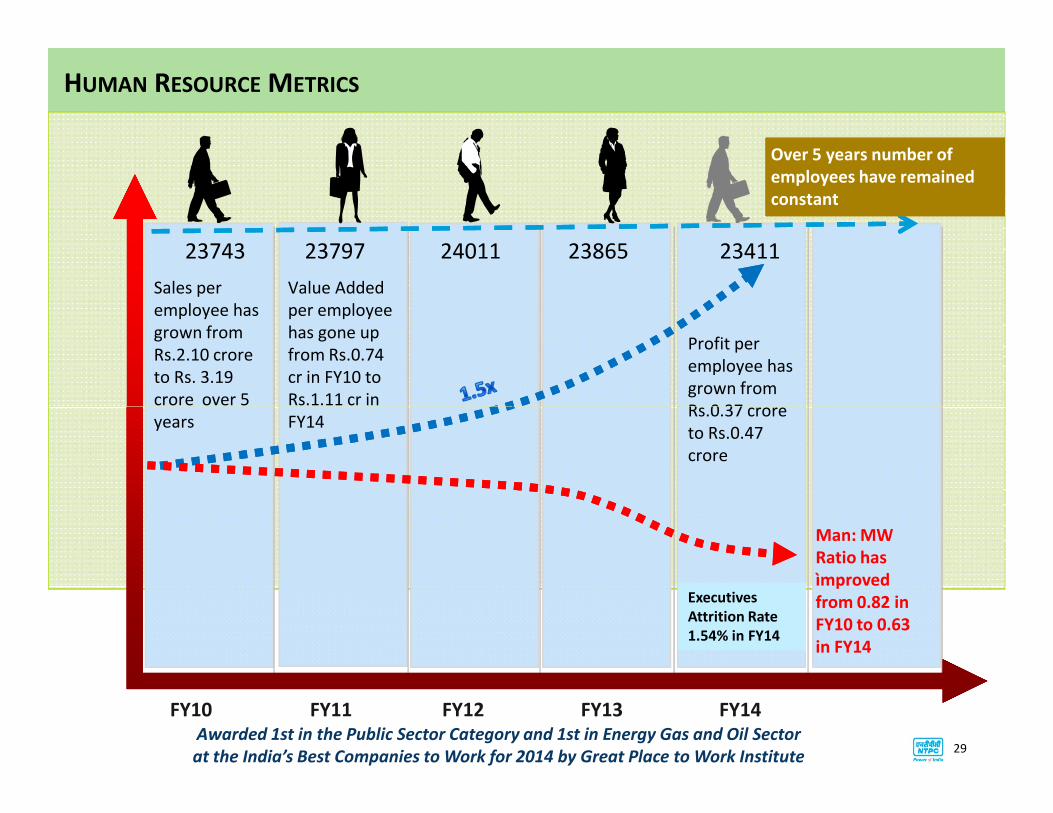
HUMAN RESOURCE METRICS
Profit per
employee has
grown from
Rs.0.37 crore
Sales per
employee has
grown from
Rs.2.10 crore
to Rs. 3.19
crore over 5
23743 23797 24011 23865
Over 5 years number of
employees have remained
constant
Value Added
per employee
has gone up
from Rs.0.74
cr in FY10 to
Rs.1.11 cr in
23411
Man: MW
Ratio has
ìmproved
from 0.82 in
FY10 to 0.63
in FY14
FY14FY13FY12FY11FY10
Rs.0.37 crore
to Rs.0.47
crore
crore over 5
years
Rs.1.11 cr in
FY14
Awarded 1st in the Public Sector Category and 1st in Energy Gas and Oil Sector
at the India’s Best Companies to Work for 2014 by Great Place to Work Institute29
Executives
Attrition Rate
1.54% in FY14
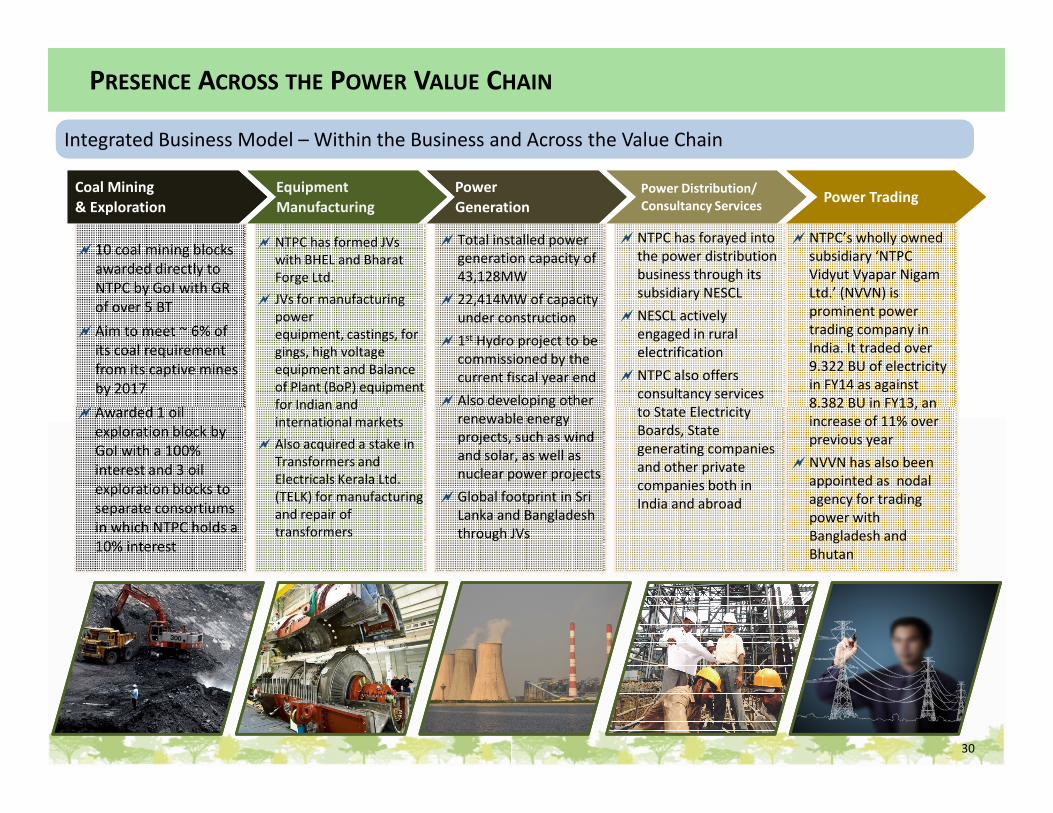
�10 coal mining blocks
awarded directly to
NTPC by GoI with GR
of over 5 BT
�Aim to meet ~ 6% of
its coal requirement
from its captive mines
by 2017
�Awarded 1 oil
�NTPC has forayed into
the power distribution
business through its
subsidiary NESCL
�NESCL actively
engaged in rural
electrification
�NTPC also offers
consultancy services
to State Electricity
� NTPC has formed JVs
with BHEL and Bharat
Forge Ltd.
� JVs for manufacturing
power
equipment, castings, for
gings, high voltage
equipment and Balance
of Plant (BoP) equipment
for Indian and
� Total installed power
generation capacity of
43,128MW
� 22,414MW of capacity
under construction
� 1st Hydro project to be
commissioned by the
current fiscal year end
� Also developing other
Integrated Business Model – Within the Business and Across the Value ChainIntegrated Business Model – Within the Business and Across the Value Chain
�NTPC’s wholly owned
subsidiary ‘NTPC
Vidyut Vyapar Nigam
Ltd.’ (NVVN) is
prominent power
trading company in
India. It traded over
9.322 BU of electricity
in FY14 as against
8.382 BU in FY13, an
Coal Mining
& Exploration
Coal Mining
& Exploration
Power Distribution/
Consultancy Services
Power Distribution/
Consultancy Services
Equipment
Manufacturing
Equipment
Manufacturing
Power
Generation
Power
GenerationPower Trading Power Trading
PRESENCE ACROSS THE POWER VALUE CHAIN
�Awarded 1 oil
exploration block by
GoI with a 100%
interest and 3 oil
exploration blocks to
separate consortiums
in which NTPC holds a
10% interest
to State Electricity
Boards, State
generating companies
and other private
companies both in
India and abroad
for Indian and
international markets
� Also acquired a stake in
Transformers and
Electricals Kerala Ltd.
(TELK) for manufacturing
and repair of
transformers
� Also developing other
renewable energy
projects, such as wind
and solar, as well as
nuclear power projects
�Global footprint in Sri
Lanka and Bangladesh
through JVs
8.382 BU in FY13, an
increase of 11% over
previous year
�NVVN has also been
appointed as nodal
agency for trading
power with
Bangladesh and
Bhutan
30
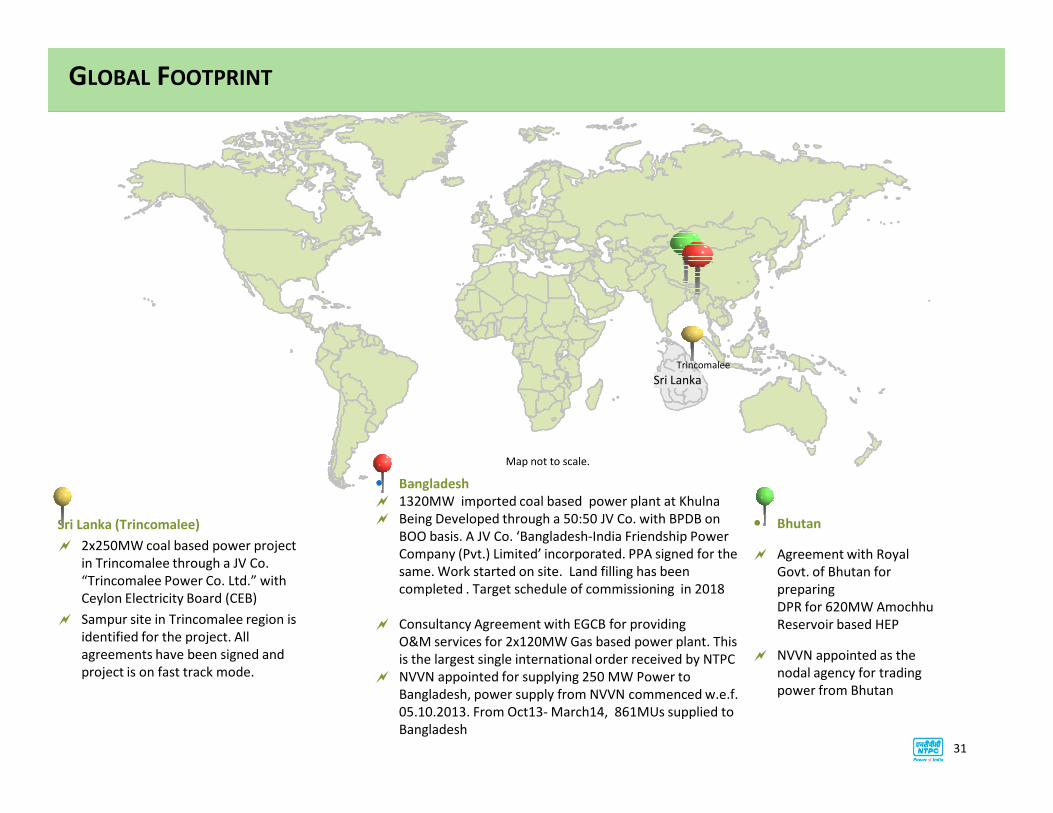
GLOBAL FOOTPRINT
Sri Lanka
Trincomalee
� Bhutan
� Agreement with Royal
Govt. of Bhutan for
preparing
DPR for 620MW Amochhu
Reservoir based HEP
� NVVN appointed as the
nodal agency for trading
power from Bhutan
Sri Lanka (Trincomalee)
� 2x250MW coal based power project
in Trincomalee through a JV Co.
“Trincomalee Power Co. Ltd.” with
Ceylon Electricity Board (CEB)
� Sampur site in Trincomalee region is
identified for the project. All
agreements have been signed and
project is on fast track mode.
� Bangladesh
� 1320MW imported coal based power plant at Khulna
� Being Developed through a 50:50 JV Co. with BPDB on
BOO basis. A JV Co. ‘Bangladesh-India Friendship Power
Company (Pvt.) Limited’ incorporated. PPA signed for the
same. Work started on site. Land filling has been
completed . Target schedule of commissioning in 2018
� Consultancy Agreement with EGCB for providing
O&M services for 2x120MW Gas based power plant. This
is the largest single international order received by NTPC
� NVVN appointed for supplying 250 MW Power to
Bangladesh, power supply from NVVN commenced w.e.f.
05.10.2013. From Oct13- March14, 861MUs supplied to
Bangladesh
Map not to scale.
31
RISKS AND MITIGATION
32
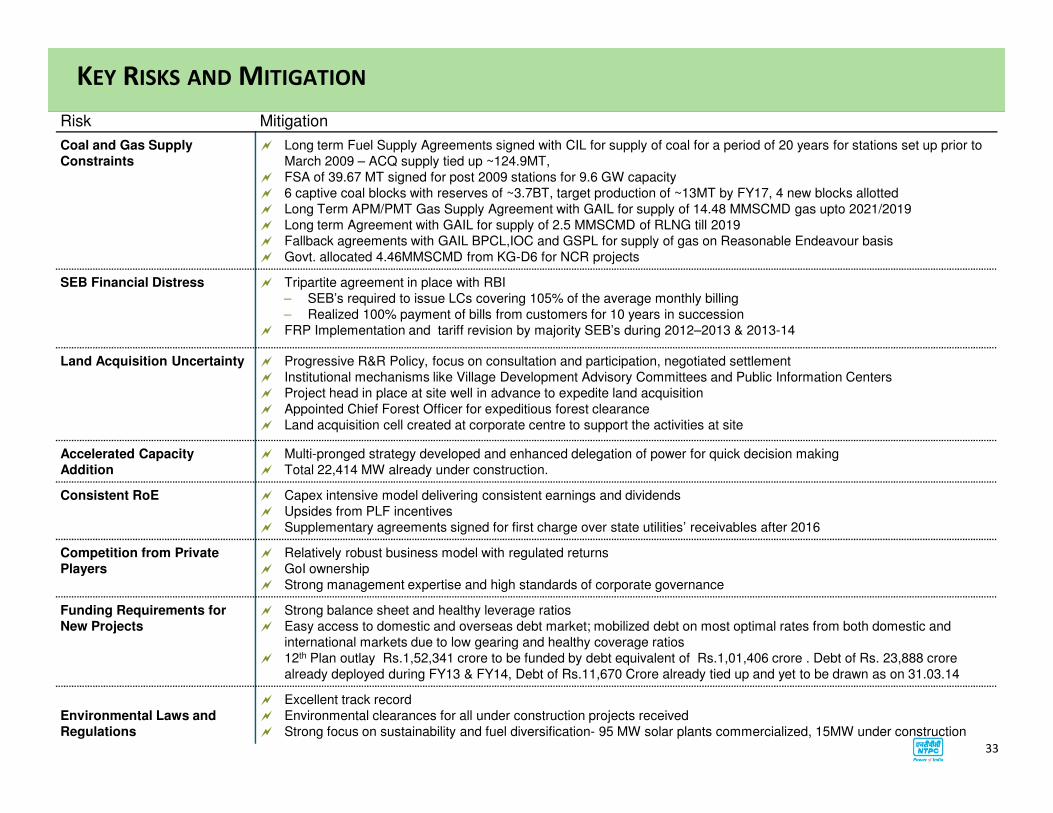
Risk Mitigation
Coal and Gas Supply
Constraints
� Long term Fuel Supply Agreements signed with CIL for supply of coal for a period of 20 years for stations set up prior to
March 2009 – ACQ supply tied up ~124.9MT,
� FSA of 39.67 MT signed for post 2009 stations for 9.6 GW capacity
� 6 captive coal blocks with reserves of ~3.7BT, target production of ~13MT by FY17, 4 new blocks allotted
� Long Term APM/PMT Gas Supply Agreement with GAIL for supply of 14.48 MMSCMD gas upto 2021/2019
� Long term Agreement with GAIL for supply of 2.5 MMSCMD of RLNG till 2019
� Fallback agreements with GAIL BPCL,IOC and GSPL for supply of gas on Reasonable Endeavour basis
� Govt. allocated 4.46MMSCMD from KG-D6 for NCR projects
SEB Financial Distress � Tripartite agreement in place with RBI
– SEB’s required to issue LCs covering 105% of the average monthly billing
– Realized 100% payment of bills from customers for 10 years in succession
� FRP Implementation and tariff revision by majority SEB’s during 2012–2013 & 2013-14
Land Acquisition Uncertainty � Progressive R&R Policy, focus on consultation and participation, negotiated settlement
� Institutional mechanisms like Village Development Advisory Committees and Public Information Centers
� Project head in place at site well in advance to expedite land acquisition
� Appointed Chief Forest Officer for expeditious forest clearance
KEY RISKS AND MITIGATION
� Appointed Chief Forest Officer for expeditious forest clearance
� Land acquisition cell created at corporate centre to support the activities at site
Accelerated Capacity
Addition
� Multi-pronged strategy developed and enhanced delegation of power for quick decision making
� Total 22,414 MW already under construction.
Consistent RoE � Capex intensive model delivering consistent earnings and dividends
� Upsides from PLF incentives
� Supplementary agreements signed for first charge over state utilities’ receivables after 2016
Competition from Private
Players
� Relatively robust business model with regulated returns
� GoI ownership
� Strong management expertise and high standards of corporate governance
Funding Requirements for
New Projects
� Strong balance sheet and healthy leverage ratios
� Easy access to domestic and overseas debt market; mobilized debt on most optimal rates from both domestic and
international markets due to low gearing and healthy coverage ratios
� 12th Plan outlay Rs.1,52,341 crore to be funded by debt equivalent of Rs.1,01,406 crore . Debt of Rs. 23,888 crore
already deployed during FY13 & FY14, Debt of Rs.11,670 Crore already tied up and yet to be drawn as on 31.03.14
Environmental Laws and
Regulations
� Excellent track record
� Environmental clearances for all under construction projects received
� Strong focus on sustainability and fuel diversification- 95 MW solar plants commercialized, 15MW under construction
33
GROWTH AND CAPEX PLANS
34
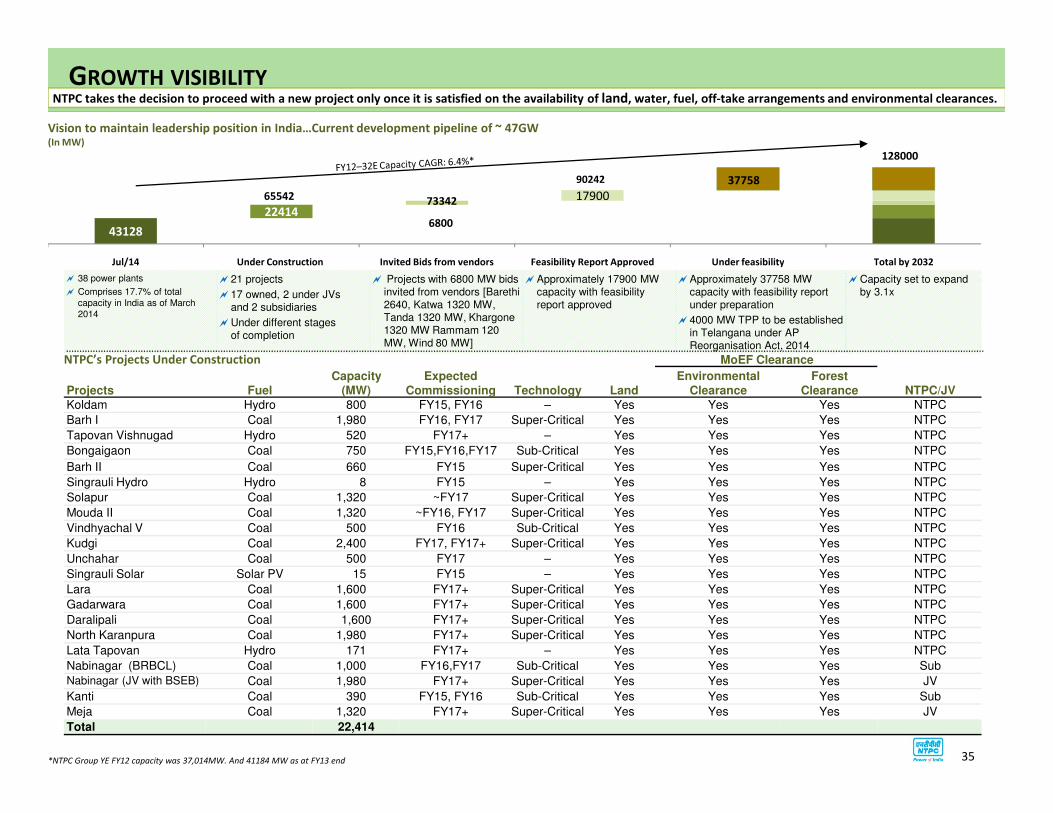
� 38 power plants
� Comprises 17.7% of total
capacity in India as of March
2014
�21 projects
�17 owned, 2 under JVsand 2 subsidiaries
�Under different stages of completion
� Projects with 6800 MW bids invited from vendors [Barethi2640, Katwa 1320 MW, Tanda 1320 MW, Khargone1320 MW Rammam 120 MW, Wind 80 MW]
�Approximately 17900 MW capacity with feasibility report approved
�Approximately 37758 MW capacity with feasibility report under preparation
�4000 MW TPP to be established in Telangana under AP Reorganisation Act, 2014
�Capacity set to expand by 3.1x
43128
22414
17900
Jul/14 Under Construction Invited Bids from vendors Feasibility Report Approved Under feasibility Total by 2032
128000
65542 73342
90242
6800
37758
GROWTH VISIBILITYNTPC takes the decision to proceed with a new project only once it is satisfied on the availability of land, water, fuel, off-take arrangements and environmental clearances.
Projects FuelCapacity
(MW)Expected
Commissioning Technology Land
MoEF Clearance
Environmental Clearance
Forest Clearance NTPC/JV
Koldam Hydro 800 FY15, FY16 – Yes Yes Yes NTPC
Vision to maintain leadership position in India…Current development pipeline of ~ 47GW (In MW)
NTPC’s Projects Under Construction
Koldam Hydro 800 FY15, FY16 – Yes Yes Yes NTPC
Barh I Coal 1,980 FY16, FY17 Super-Critical Yes Yes Yes NTPC
Tapovan Vishnugad Hydro 520 FY17+ – Yes Yes Yes NTPC
Bongaigaon Coal 750 FY15,FY16,FY17 Sub-Critical Yes Yes Yes NTPC
Barh II Coal 660 FY15 Super-Critical Yes Yes Yes NTPC
Singrauli Hydro Hydro 8 FY15 – Yes Yes Yes NTPC
Solapur Coal 1,320 ~FY17 Super-Critical Yes Yes Yes NTPC
Mouda II Coal 1,320 ~FY16, FY17 Super-Critical Yes Yes Yes NTPC
Vindhyachal V Coal 500 FY16 Sub-Critical Yes Yes Yes NTPC
Kudgi Coal 2,400 FY17, FY17+ Super-Critical Yes Yes Yes NTPC
Unchahar Coal 500 FY17 – Yes Yes Yes NTPC
Singrauli Solar Solar PV 15 FY15 – Yes Yes Yes NTPC
Lara Coal 1,600 FY17+ Super-Critical Yes Yes Yes NTPC
Gadarwara Coal 1,600 FY17+ Super-Critical Yes Yes Yes NTPC
Daralipali Coal 1,600 FY17+ Super-Critical Yes Yes Yes NTPC
North Karanpura Coal 1,980 FY17+ Super-Critical Yes Yes Yes NTPC
Lata Tapovan Hydro 171 FY17+ – Yes Yes Yes NTPC
Nabinagar (BRBCL) Coal 1,000 FY16,FY17 Sub-Critical Yes Yes Yes Sub
Nabinagar (JV with BSEB) Coal 1,980 FY17+ Super-Critical Yes Yes Yes JV
Kanti Coal 390 FY15, FY16 Sub-Critical Yes Yes Yes Sub
Meja Coal 1,320 FY17+ Super-Critical Yes Yes Yes JV
Total 22,414
*NTPC Group YE FY12 capacity was 37,014MW. And 41184 MW as at FY13 end 35
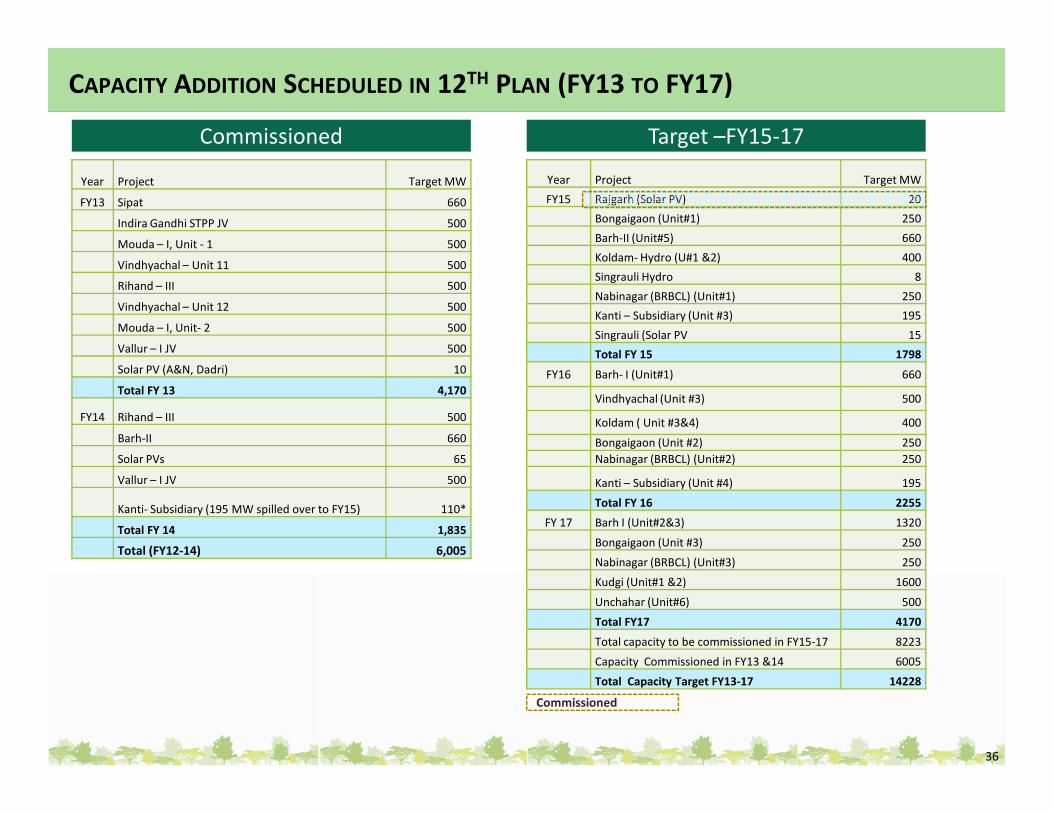
Year Project Target MW
FY13 Sipat 660
Indira Gandhi STPP JV 500
Mouda – I, Unit - 1 500
Vindhyachal – Unit 11 500
Rihand – III 500
Vindhyachal – Unit 12 500
Mouda – I, Unit- 2 500
Vallur – I JV 500
Solar PV (A&N, Dadri) 10
Total FY 13 4,170
CAPACITY ADDITION SCHEDULED IN 12TH PLAN (FY13 TO FY17)
Year Project Target MW
FY15 Rajgarh (Solar PV) 20
Bongaigaon (Unit#1) 250
Barh-II (Unit#5) 660
Koldam- Hydro (U#1 &2) 400
Singrauli Hydro 8
Nabinagar (BRBCL) (Unit#1) 250
Kanti – Subsidiary (Unit #3) 195
Singrauli (Solar PV 15
Total FY 15 1798
FY16 Barh- I (Unit#1) 660
Vindhyachal (Unit #3) 500
Commissioned Target –FY15-17
FY14 Rihand – III 500
Barh-II 660
Solar PVs 65
Vallur – I JV 500
Kanti- Subsidiary (195 MW spilled over to FY15) 110*
Total FY 14 1,835
Total (FY12-14) 6,005
36
Koldam ( Unit #3&4) 400
Bongaigaon (Unit #2) 250
Nabinagar (BRBCL) (Unit#2) 250
Kanti – Subsidiary (Unit #4) 195
Total FY 16 2255
FY 17 Barh I (Unit#2&3) 1320
Bongaigaon (Unit #3) 250
Nabinagar (BRBCL) (Unit#3) 250
Kudgi (Unit#1 &2) 1600
Unchahar (Unit#6) 500
Total FY17 4170
Total capacity to be commissioned in FY15-17 8223
Capacity Commissioned in FY13 &14 6005
Total Capacity Target FY13-17 14228
Commissioned
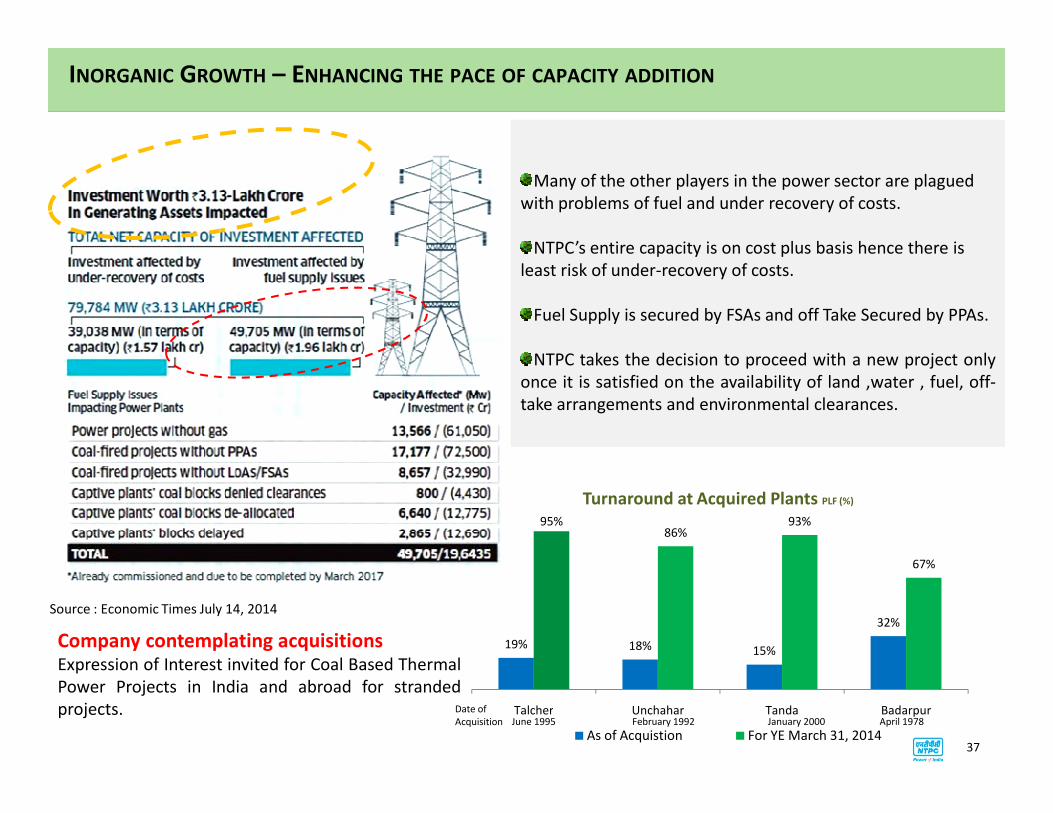
Many of the other players in the power sector are plagued
with problems of fuel and under recovery of costs.
NTPC’s entire capacity is on cost plus basis hence there is
least risk of under-recovery of costs.
Fuel Supply is secured by FSAs and off Take Secured by PPAs.
NTPC takes the decision to proceed with a new project only
once it is satisfied on the availability of land ,water , fuel, off-
take arrangements and environmental clearances.
INORGANIC GROWTH – ENHANCING THE PACE OF CAPACITY ADDITION
take arrangements and environmental clearances.
Source : Economic Times July 14, 2014
Company contemplating acquisitionsExpression of Interest invited for Coal Based Thermal
Power Projects in India and abroad for stranded
projects.
19% 18% 15%
32%
95%86%
93%
67%
Talcher Unchahar Tanda Badarpur
As of Acquistion For YE March 31, 2014
Turnaround at Acquired Plants PLF (%)
Date of
Acquisition June 1995 February 1992 January 2000 April 1978
37
SUSTAINABILITY INITIATIVES
38
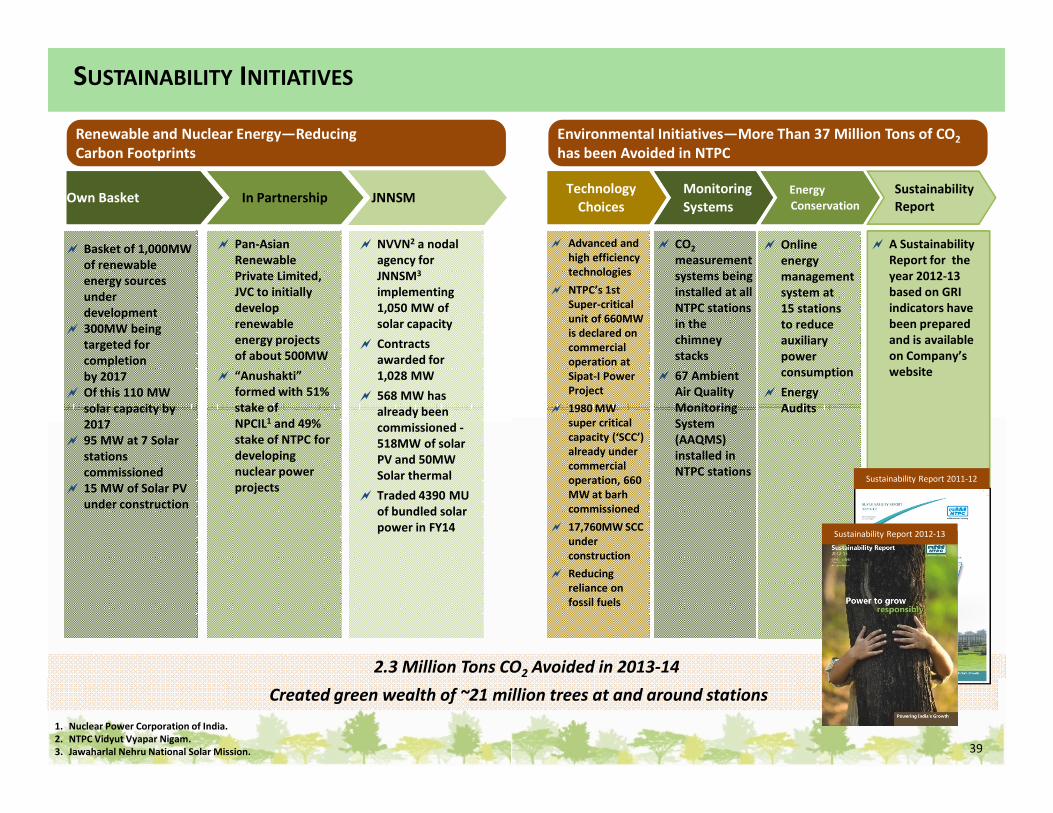
SUSTAINABILITY INITIATIVES
Renewable and Nuclear Energy—Reducing
Carbon Footprints
Environmental Initiatives—More Than 37 Million Tons of CO2
has been Avoided in NTPC
� Basket of 1,000MW
of renewable
energy sources
under
development
� 300MW being
targeted for
completion
by 2017
� Of this 110 MW
solar capacity by
� Pan-Asian
Renewable
Private Limited,
JVC to initially
develop
renewable
energy projects
of about 500MW
� “Anushakti”
formed with 51%
stake of
� NVVN2 a nodal
agency for
JNNSM3
implementing
1,050 MW of
solar capacity
� Contracts
awarded for
1,028 MW
� 568 MW has
already been
Own BasketOwn Basket In PartnershipIn Partnership JNNSM
� Advanced and
high efficiency
technologies
� NTPC’s 1st
Super-critical
unit of 660MW
is declared on
commercial
operation at
Sipat-I Power
Project
� 1980 MW
Technology
Choices
Technology
Choices
� CO2
measurement
systems being
installed at all
NTPC stations
in the
chimney
stacks
� 67 Ambient
Air Quality
Monitoring
Monitoring
Systems
Monitoring
Systems
� Online
energy
management
system at
15 stations
to reduce
auxiliary
power
consumption
� Energy
Audits
Energy
Conservation
Energy
Conservation
� A Sustainability
Report for the
year 2012-13
based on GRI
indicators have
been prepared
and is available
on Company’s
website
Sustainability
Report
2.3 Million Tons CO2 Avoided in 2013-14
solar capacity by
2017
� 95 MW at 7 Solar
stations
commissioned
� 15 MW of Solar PV
under construction
stake of
NPCIL1 and 49%
stake of NTPC for
developing
nuclear power
projects
already been
commissioned -
518MW of solar
PV and 50MW
Solar thermal
� Traded 4390 MU
of bundled solar
power in FY14
1. Nuclear Power Corporation of India.
2. NTPC Vidyut Vyapar Nigam.
3. Jawaharlal Nehru National Solar Mission.
� 1980 MW
super critical
capacity (‘SCC’)
already under
commercial
operation, 660
MW at barh
commissioned
� 17,760MW SCC
under
construction
� Reducing
reliance on
fossil fuels
Monitoring
System
(AAQMS)
installed in
NTPC stations
Audits
39
Created green wealth of ~21 million trees at and around stations
Sustainability Report 2011-12
Sustainability Report 2012-13
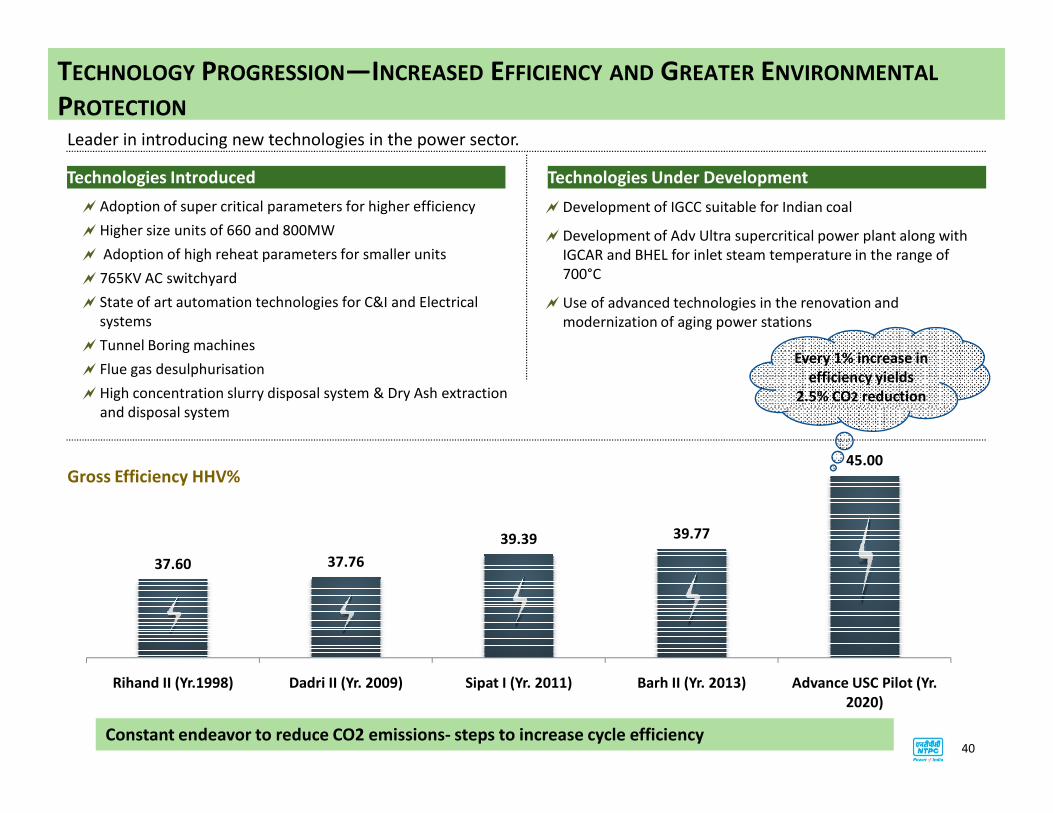
TECHNOLOGY PROGRESSION—INCREASED EFFICIENCY AND GREATER ENVIRONMENTAL
PROTECTION
�Adoption of super critical parameters for higher efficiency
�Higher size units of 660 and 800MW
� Adoption of high reheat parameters for smaller units
�765KV AC switchyard
� State of art automation technologies for C&I and Electrical
systems
� Tunnel Boring machines
� Flue gas desulphurisation
�High concentration slurry disposal system & Dry Ash extraction
and disposal system
Leader in introducing new technologies in the power sector.
�Development of IGCC suitable for Indian coal
�Development of Adv Ultra supercritical power plant along with
IGCAR and BHEL for inlet steam temperature in the range of
700°C
�Use of advanced technologies in the renovation and
modernization of aging power stations
Technologies Introduced Technologies Under Development
Every 1% increase in
efficiency yields
2.5% CO2 reductionand disposal system
Gross Efficiency HHV%
37.60 37.76
39.39 39.77
45.00
Rihand II (Yr.1998) Dadri II (Yr. 2009) Sipat I (Yr. 2011) Barh II (Yr. 2013) Advance USC Pilot (Yr.
2020)
40Constant endeavor to reduce CO2 emissions- steps to increase cycle efficiency
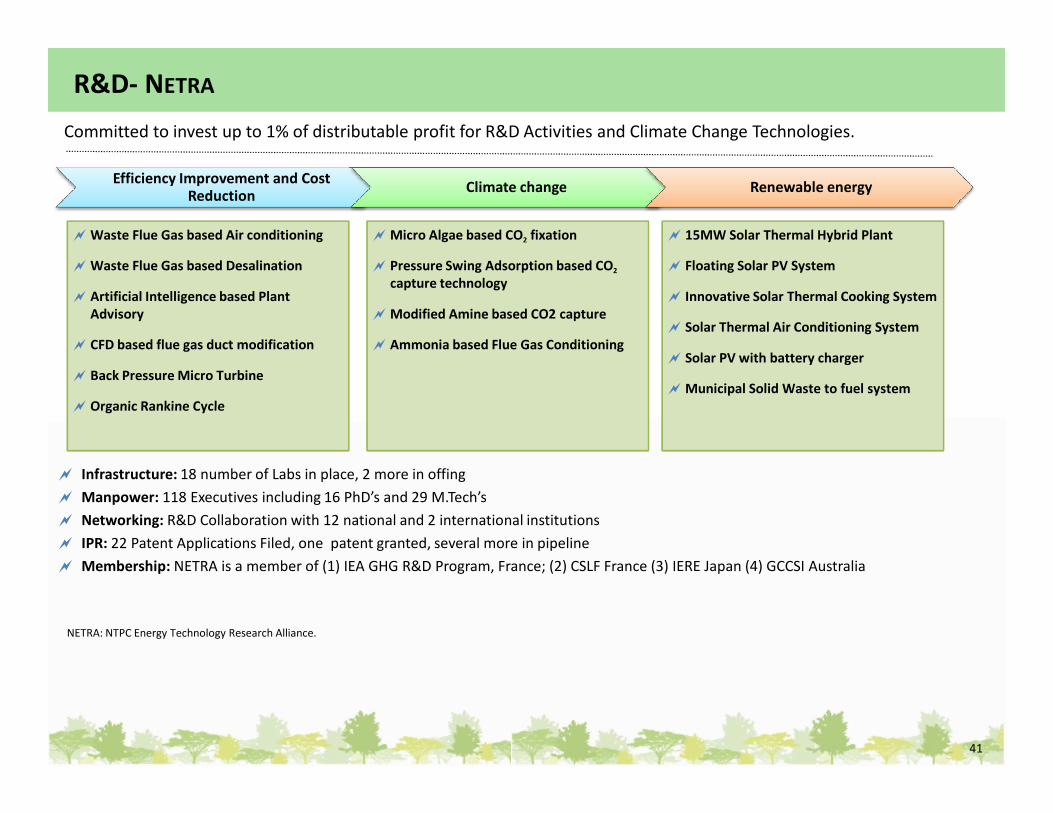
R&D- NETRA
Committed to invest up to 1% of distributable profit for R&D Activities and Climate Change Technologies.
Efficiency Improvement and Cost Reduction
Climate change Renewable energy
� Waste Flue Gas based Air conditioning
� Waste Flue Gas based Desalination
� Artificial Intelligence based Plant
Advisory
� CFD based flue gas duct modification
� Back Pressure Micro Turbine
� Organic Rankine Cycle
� Micro Algae based CO2 fixation
� Pressure Swing Adsorption based CO2
capture technology
� Modified Amine based CO2 capture
� Ammonia based Flue Gas Conditioning
� 15MW Solar Thermal Hybrid Plant
� Floating Solar PV System
� Innovative Solar Thermal Cooking System
� Solar Thermal Air Conditioning System
� Solar PV with battery charger
� Municipal Solid Waste to fuel system
� Infrastructure: 18 number of Labs in place, 2 more in offing
� Manpower: 118 Executives including 16 PhD’s and 29 M.Tech’s
� Networking: R&D Collaboration with 12 national and 2 international institutions
� IPR: 22 Patent Applications Filed, one patent granted, several more in pipeline
� Membership: NETRA is a member of (1) IEA GHG R&D Program, France; (2) CSLF France (3) IERE Japan (4) GCCSI Australia
NETRA: NTPC Energy Technology Research Alliance.
� Organic Rankine Cycle
41
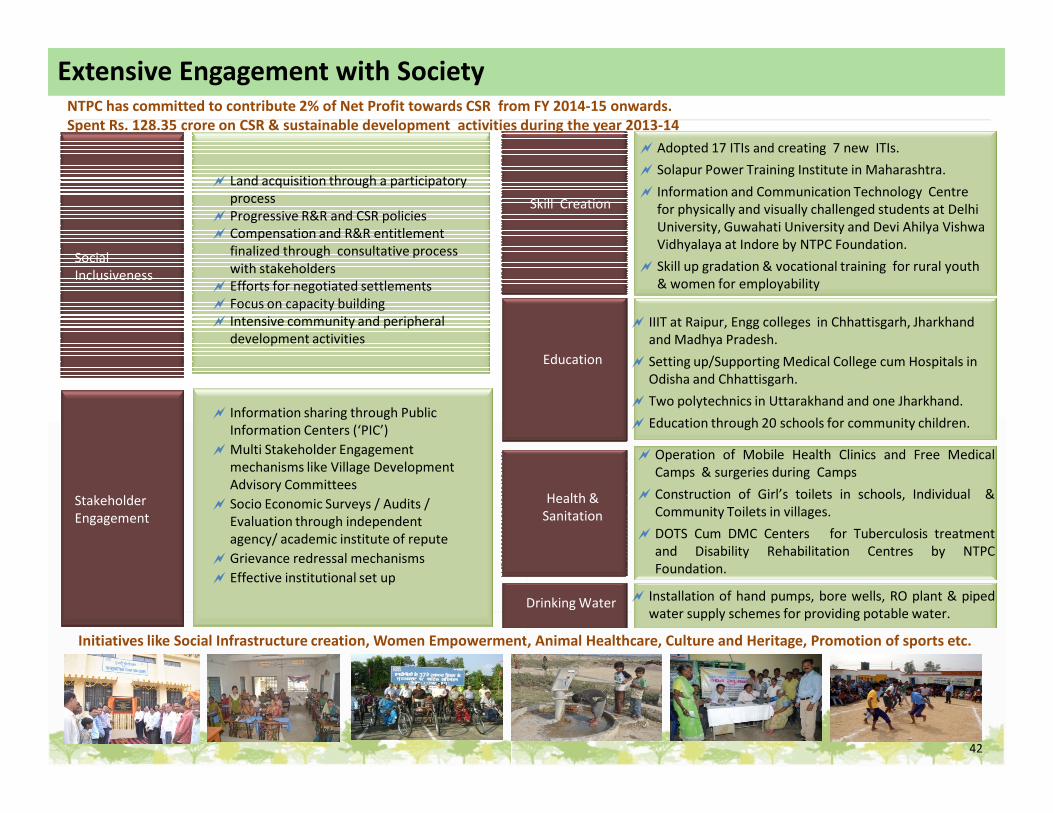
� Adopted 17 ITIs and creating 7 new ITIs.
� Solapur Power Training Institute in Maharashtra.
� Information and Communication Technology Centre
for physically and visually challenged students at Delhi
University, Guwahati University and Devi Ahilya Vishwa
Vidhyalaya at Indore by NTPC Foundation.
� Skill up gradation & vocational training for rural youth
& women for employability
Skill Creation
� Land acquisition through a participatory
process
� Progressive R&R and CSR policies
� Compensation and R&R entitlement
finalized through consultative process
with stakeholders
� Efforts for negotiated settlements
� Focus on capacity building
� Intensive community and peripheral
development activities
Extensive Engagement with Society
Social
Inclusiveness
� Information sharing through Public
Education
� IIIT at Raipur, Engg colleges in Chhattisgarh, Jharkhand
and Madhya Pradesh.
� Setting up/Supporting Medical College cum Hospitals in
Odisha and Chhattisgarh.
� Two polytechnics in Uttarakhand and one Jharkhand.
NTPC has committed to contribute 2% of Net Profit towards CSR from FY 2014-15 onwards.
Spent Rs. 128.35 crore on CSR & sustainable development activities during the year 2013-14
Initiatives like Social Infrastructure creation, Women Empowerment, Animal Healthcare, Culture and Heritage, Promotion of sports etc.
Stakeholder
Engagement
� Information sharing through Public
Information Centers (‘PIC’)
� Multi Stakeholder Engagement
mechanisms like Village Development
Advisory Committees
� Socio Economic Surveys / Audits /
Evaluation through independent
agency/ academic institute of repute
� Grievance redressal mechanisms
� Effective institutional set up
42
Health &
Sanitation
Drinking Water
� Two polytechnics in Uttarakhand and one Jharkhand.
� Education through 20 schools for community children.
� Operation of Mobile Health Clinics and Free Medical
Camps & surgeries during Camps
� Construction of Girl’s toilets in schools, Individual &
Community Toilets in villages.
� DOTS Cum DMC Centers for Tuberculosis treatment
and Disability Rehabilitation Centres by NTPC
Foundation.
� Installation of hand pumps, bore wells, RO plant & piped
water supply schemes for providing potable water.
• This presentation is issued by NTPC Limited (the “Company”) for general information purposes only and does not constitute any recommendation or form part f any offer or invitation or
inducement to sell or issue, or any solicitation of any offer to purchase or subscribe for, any securities of the Company, nor shall it or any part of it or the fact of its distribution form the
basis of, or be relied on in connection with, any contract or commitment thereof. This presentation does not solicit any action based on the material contained herein. Nothing in this
presentation is intended by the Company to be construed as legal, accounting or tax advice
• This presentation has been prepared by the Company based upon information available in the public domain. This presentation has not been approved and will not be reviewed or
approved by any statutory or regulatory authority in India or by any Stock Exchange in India.
• This presentation may include statements which may constitute forward-looking statements relating to the business, financial performance, strategy and results of the Company and/or
the industry in which it operates. Forward-looking statements are statements concerning future circumstances and results, and any other statements that are not historical
facts, sometimes identified by the words "believes", "expects", "predicts", "intends", "projects", "plans", "estimates", "aims", "foresees", "anticipates", "targets", and similar expressions.
The forward-looking statements, including those cited from third party sources, contained in this presentation are based on numerous assumptions and are uncertain and subject to risks.
A multitude of factors including, but not limited to, changes in demand, competition and technology, can cause actual events, performance or results to differ significantly from any
anticipated development. Neither the Company nor its Directors, Promoter, affiliates or advisors or representatives nor any of its or their parent or subsidiary undertakings or any such
person's officers or employees gives any assurance that the assumptions underlying such forward-looking statements are free from errors nor do any of them accept any responsibility for
the future accuracy of the forward-looking statements contained in this Presentation or the actual occurrence of the forecasted developments. Forward-looking statements speak only as
of the date of this presentation. The Company expressly disclaims any obligation or undertaking to release any update or revisions to any forward-looking statements in this presentation
as a result of any change in expectations or any change in events, conditions, assumptions or circumstances on which these forward-looking statements are based.
• The information contained in these materials has not been independently verified. None of the Company, its Directors, Promoter or affiliates, nor any of its or their respective
DISCLAIMER
• The information contained in these materials has not been independently verified. None of the Company, its Directors, Promoter or affiliates, nor any of its or their respective
employees, advisers or representatives or any other person accepts any responsibility or liability whatsoever, whether arising in tort, contract or otherwise, for any errors, omissions or
inaccuracies in such information or opinions or for any loss, cost or damage suffered or incurred howsoever arising, directly or indirectly, from any use of this document or its contents or
otherwise in connection with this document, and makes no representation or warranty, express or implied, for the contents of this document including its
accuracy, fairness, completeness or verification or for any other statement made or purported to be made by or on behalf of any of them, and nothing in this document may be relied
upon as a promise or representation in any respect. Past performance is not a guide for future performance. The information contained in this presentation is current and, if not stated
otherwise, made as of the date of this presentation. The Company undertakes no obligation to update or revise any information in this presentation as a result of new information, future
events or otherwise. Any person or party intending to provide finance or to invest in the securities or businesses of the Company should do so after seeking their own professional advice
and after carrying out their own due diligence and conducting their own analysis of the Company and its market position.
• This presentation is strictly confidential and may not be copied or disseminated, in whole or in part, and in any manner or for any purpose. No person is authorized to give any
information or to make any representation not contained in or inconsistent with this presentation and if given or made, such information or representation must not be relied upon as
having been authorized by any person. Failure to comply with this restriction may constitute a violation of applicable securities laws. Neither this document nor any part or copy of it may
be distributed, directly or indirectly, or published in the United States. The distribution of this document in other jurisdictions may be restricted by law and persons in to whose possession
this presentation comes should inform themselves about and observe any such restrictions. By reviewing this presentation, you agree to be bound by the foregoing limitations. You
further represent and agree that (i) you are located outside the United States and you are permitted under the laws of your jurisdiction to receive this presentation or (ii) you are located
in the United States and are a “qualified institutional buyer” (as defined in Rule 144A under the Securities Act of 1933, as amended (the “Securities Act”).
• This presentation is not an offer to sell or a solicitation of any offer to buy the securities of the Company in the United States or in any other jurisdiction where such offer or sale would be
unlawful. Securities may not be offered, sold, resold, pledged, delivered, distributed or transferred, directly or indirectly, into or within the United States absent registration under the
Securities Act, except pursuant to an exemption from, or in a transaction not subject to, the registration requirements of the Securities Act and in compliance with the applicable
securities laws of any state or other jurisdiction of the United States.
43

www.ntpc.co.in


![llf crc=cn - NRPC · Request Detail 1 NTPC [ DELHI ] Anta(NTPC)-Swaimadhopur ... NTPC [ DELHI ] Anta(NTPC)-Lalsot(RVPNL) 2(220 kV) Powergrid Continuous. Annual Bay …](https://img.pdfslide.net/doc/110x75/5acd10827f8b9a93268d2ca5/llf-crccn-detail-1-ntpc-delhi-antantpc-swaimadhopur-ntpc-delhi-.jpg)