Embed Size (px)
Citation preview

TECHNICAL ADVISEMENT MEMORANDUM NO. 106-9 ~ - - . . .. a b , - - - ” * f
RELIABILITY ASSESSMENT OF THE GEOS A POWER S U P P L Y i PRC-D-1110 f; .- -.-__ -.* . .
11 October 1965 . I ”-,*
Prepared by
Charles E. Bloomquist Donald B. Le- inson
r
Robert J. Mulvihill
GPO PRICE $
CFSTI PRICE(S) $
Hard copy (HC) / . 0 ,
Microfiche (MF)
ff 653 July65
i P L A N N I N G R E S E A R C H C O - A T - P W ” ‘ __ ---_ _ _ . - + -------- -‘ 1 - LOS A N G E L E S , CALIF. I W A S H I N G T O N , D.C.
I , .I ,,
https://ntrs.nasa.gov/search.jsp?R=19660003579 2020-03-10T20:04:33+00:00Z

TECHNICAL ADVISEMENT MEMORANDUM NO. 106-9
To: P r o g r a m Manager, Geodetic Satellite Physics and Astronomy P r o g r a m s , Office of Space Science and Applications, NASA He adqua rt e r s
From: PRC GEOS Reliability Asses sment Team
Subject: Reliability Assessment of the GEOS A Power Supply
1. Introduction
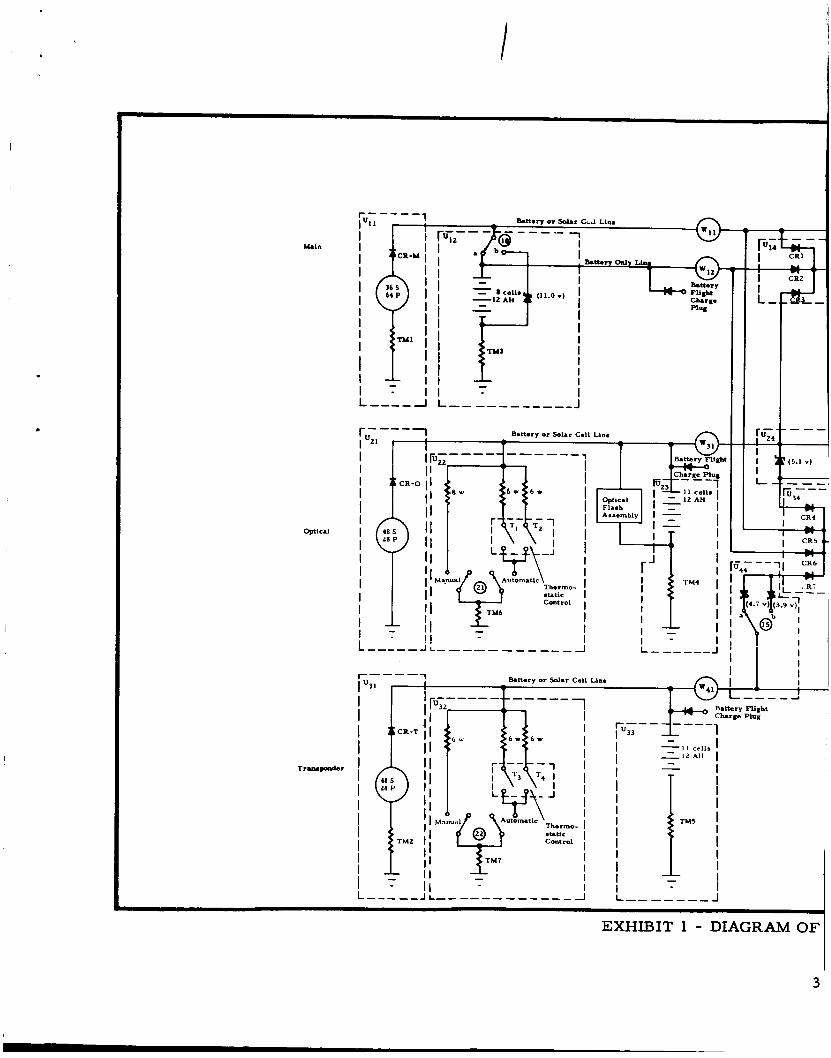
Exhibit 1 is the diagram of the power supply that will be used
fo r modeling purposes. The blocks labeled U. r ep resen t par t icular
collections of electronic pa r t s , and the c i r c l e s labeled W represent
par t icu lar I' output I' points of interest .
1, j
i, j
The GEOS power supply system compr ises th ree subsystems: (1) the main power supply, ( 2 ) the optical power supply, and (3) the t r ans -
ponder power supply.
W 5 2 , a r e ORed together so that the loads connected to these points will
have a higher probability of receiving the i r required power.
power subsystems a r e designed to supply the i r respective loads within
the operational constraints of the spacecraf t system.
a r r a y , f o r example, can supply pwwer to all loads zor;nccted t z it with-
out the aid of the main battery. The bat tery, in this c a s e , is provided
for eclipse operation. The optical and transponder so l a r a r r a y s , how-
e v e r , require the help of batteries to supply the peak cu r ren t demands
of the loads which the so la r cells alone cannot furnish,
As shown in Exhibit 1, two outputs, W22 and
The three
The main so la r
In the case of the transponder power supply, the SECOR t r ans -
ponder will requi re 32.8 watts of power when in the t r ansmi t mode.
The range and range ra te transponder requi res 15.3 watts in the t r a n s -
mit mode.
11.6 watts.
peak cu r ren t s of approximately 13.5 amperes for ,short durations.
The t ransponder solar a r r a y is capable of providing only
Fur the rmore , the optical beacon flash assembly requi res
The ' ,
&
1

optical solar a r r a y is capable of only 1.2 amperes when at an optimum
sun angle. In both cases , ba t te r ies a r e required for proper operation.
Thus, failure of the bat tery in these subsystems resu l t s in fa i lure of
the pr imary function of the associated subsystem.
Several commands a r e provided for increased flexibility of oper-
The transponder and optical supplies a r e each provided with a ation.
sys t em of power dump r e s i s t o r s , the purpose of which is to prevent
overcharging, and consequent overheating, of the bat ter ies . These are
normally switched in and out automatically by thermostat ic switches that
sense battery temperature . However, the power dump r e s i s t o r s can be
manually controlled f rom the ground via commands in the event of mal-
function o r i f additional control is required.
The main battery can be switched in o r out as required by use of
commands 10a and lob. This gives protection against bat tery failure
and a l so provides a means of protecting the bat tery f rom overheating
i f most of the "main" loads happen to be disconnected. During normal
operation, however, the main power supply load demand is expected to
be near ly constant, thus eliminating the need fo r power dump protection
of this battery. The main and memory d-c/d-c conver te rs a r e operated
in switchable standby redundancy. The command conver te r , of neces-
si ty, is operated in active redundancy.
plus the availability of various commands fo r the power supply sys tem
that permit switching, isolating, and bypassing- -has provided a flexible
overall design.
The use of redundant c i rcu i t s - -
Those fai lure effects of the pr ime power sys tem which can occur
as a resul t of component fa i lures a r e tabulated in the appendix to this
TAM. The probability of occurrence of these fai lure effects is shown
in the following analysis to be low.
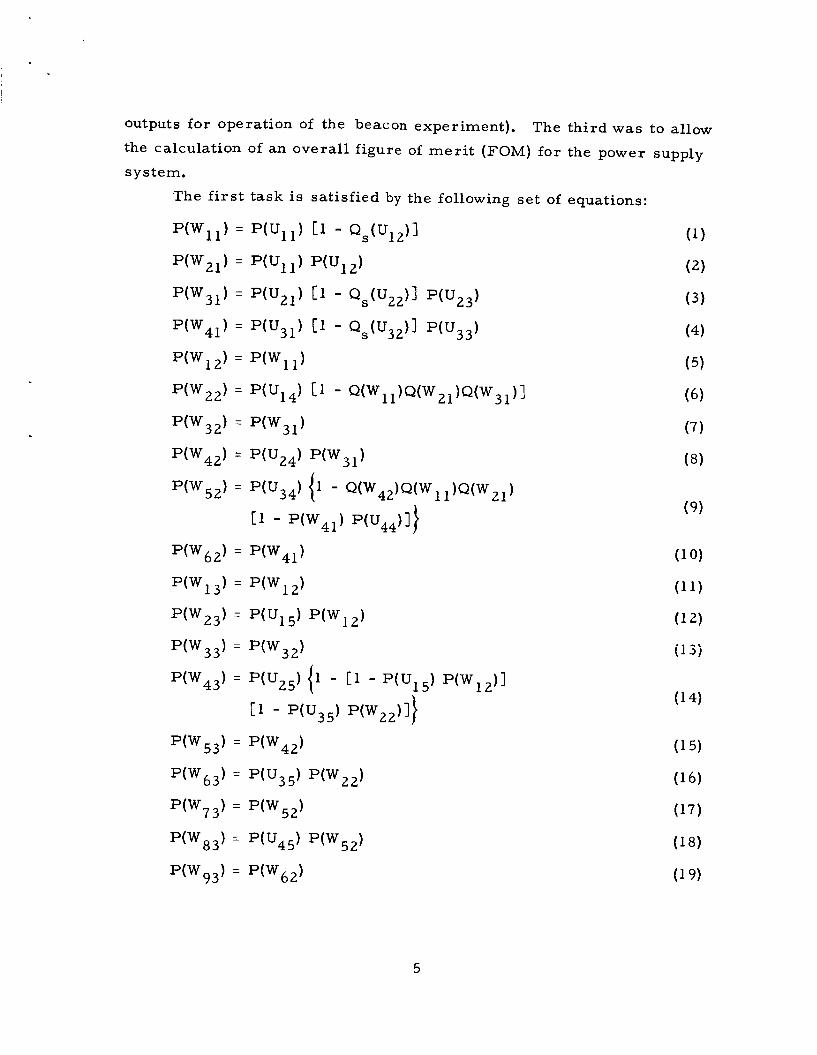
The models were developed with th ree tasks in mind. The first was to allow the calculation of the probability of having the proper out-
put at each of the 19 output points at the end of one year.
was to allow the calculation of par t icular combinations of outputs of in-
t e r e s t (e. g. , the probability that the power supply will provide sufficient
The second
4 *
2
I
MAl"
Optic.1
I I I I I I I I I I I
EXHIBIT 1 - DIAGRAM OF
3
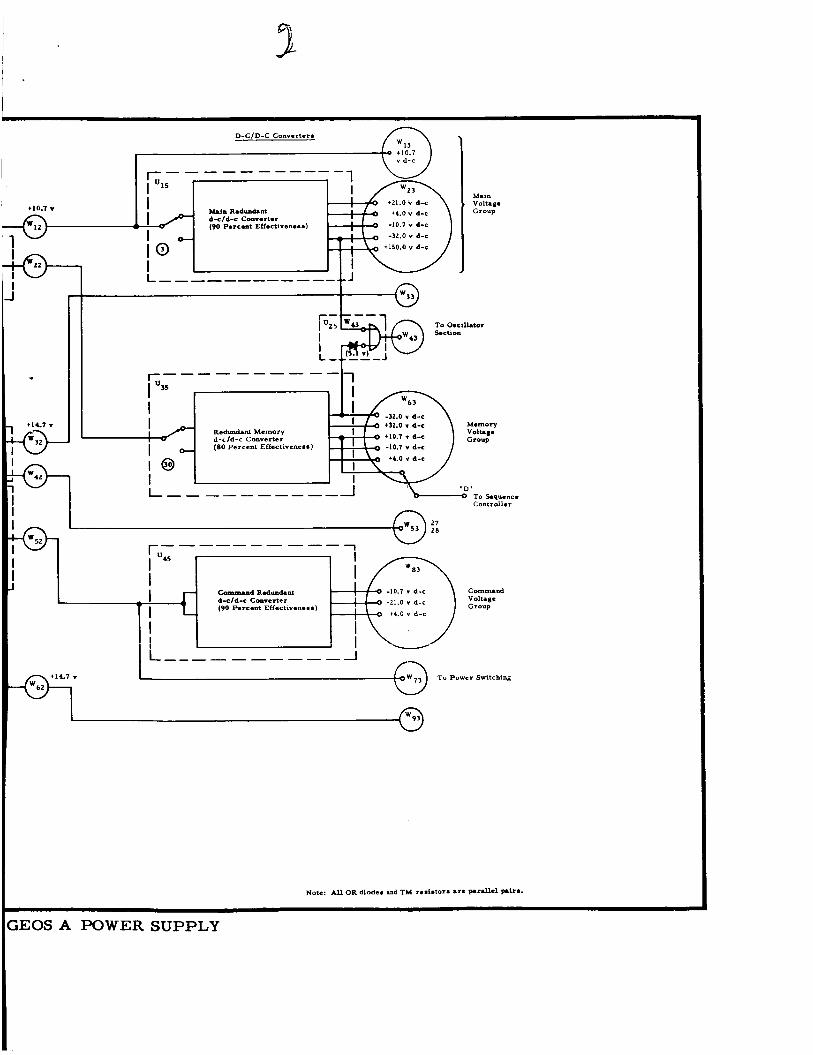
D-CID-C Converter.
t14.7 v
Main vo1tap. Croup
I----------- 1
I I
I I Q I L - - - - - - - - -
I “35
I
Redudant Memory d-cld-c Converter (80 Percent Effectiveness)
Contr0ll.r
I commnd V o l t n p croup
-10.7 r d-c 121.0 v d-c
i4.0 Y d-c !.*)
I
I
Note: All OR diodes and TM resistor. Ire plrdlel PI? . .
;EOS A POWER SUPPLY
5
where P ( U . . ) = probability that the
P(W. . ) = probability that the 1, J
1* J
(i, j)th unit is operable
(i, j) th output is available
Q ( X i s j ) = 1 - P ( X i , j) where X. stands f o r U. . o r W. . 1, j 1 s J 1s J
Qs(U. . ) = probability that the 1s J
unit U is shorted i, j
All of the above equations a r e a function of time, but, s ince they will be
evaluated only at the end of one yea r , the t ime notation is suppressed.
Achievement of the second task will , in general , requi re addi-
tional input information. However, anticipating the requirement for
the probability of adequate power for the optical beacon, the following
equations will satisfy. Let P(0P) be the probability of being able to
provide sufficient power for the optical beacon, assuming that, i f nec-
e s sa ry , the other experiments will be sacrificed. Then,
Equation (20) follows f rom Exhibit 1 and f rom the fact that the optical
power source is both necessary and sufficient for the beacon experiment.
The third task is accomplished as follows:
a distinct entity, is considered to be in one of 2
each having a different combination of the n units shown in Exhibit 1
operating, with the remainder failed). To each of these s ta tes , a value
is assigned in t e r m s of the effect on the experimental payload.
des i red figure of m e r i t is then defined as
The power supply, as n possible s ta tes (i. e. ,
The
2n
FOM = 1 P(Sk) V(Sk)
k= 1
where S
in the kth state, and V(Sk) is the relative value of the kth state.
vast major i ty of possible s ta tes will effectively
represents the kth s ta te , P(Sk) is the probability of being
The k
1 d rop out of the
'Dependent on number of decimal places car r ied .
6
expression because of e i ther insignificant value o r insignificant
probability.
2. Unit Probabilitv Calculations
The prerequis i tes f o r the calculation of any of the above tasks
a r e the various unit probabilities.
fo re be devoted to deriving these probabilities.
The following subsections will there-
a. Solar Arrays: U i i , U21, u31
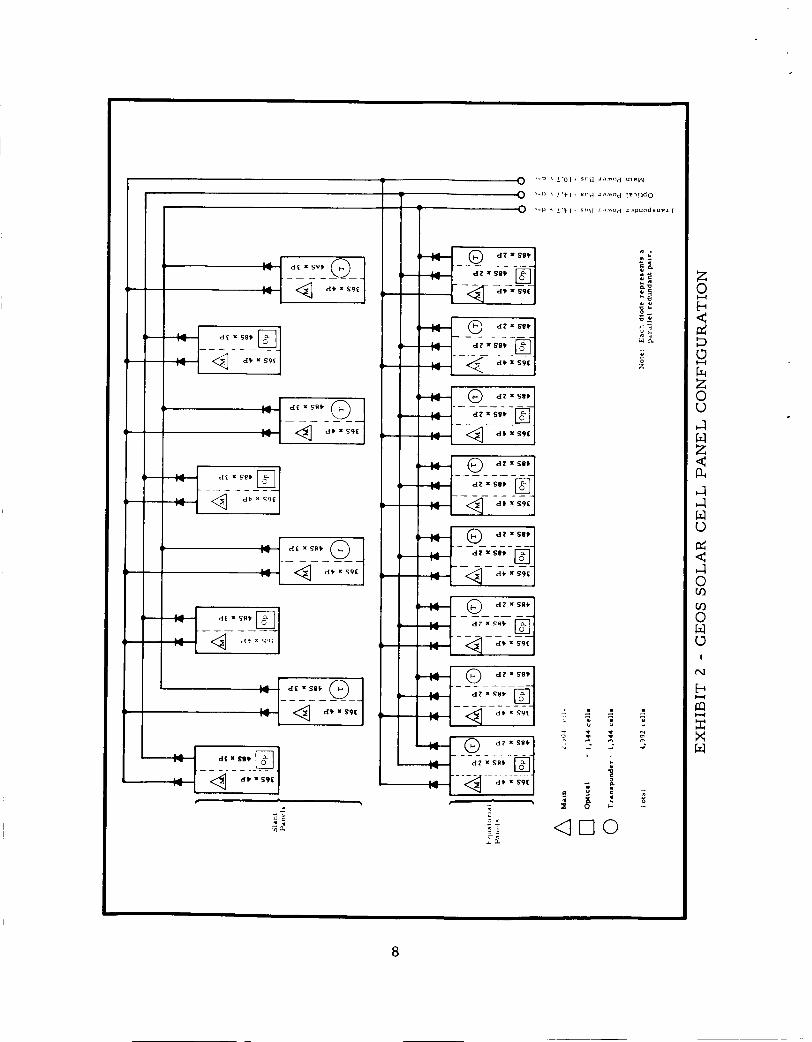
Exhibit 2 presents the configurations of the GEOS so lar
ce l l panels and blocking diodes.
a r r a y s contain a paral le l pair of r e s i s to r s f o r te lemetry purposes, as
indicated in Exhibit 1. Fai lure of an a r r a y is assumed to occur i f
(1) both te lemetry r e s i s to r s fail open, (2) the number of blocking diode
pa i r s failing open is sufficient to cause significant reduction of the
available power output, o r (3) the number of failed solar cel ls is suffi-
cient to cause significant reduction of the available power output.
In addition, the main and transponder
The probability of occurrence of the first event is readily shown
to be insignificant; it may be expressed as
[k(l - e- 'Rj ]2
where
u r e s that a r e "opens."
presented in TAM No. 106-6,
3 x , which, for all practical purposes, can be neglected.
X R is the r e s i s to r failure r a t e and k is the proportion of fail-
Utilizing the failure ra tes and open/ shor t ratio 1 th i s probability is seen to be l e s s than
The probability of occurrence of the second event is determined
as follows: The probability of a single pair of diodes failing open is
Component Part Fai lure Rate Assignments f o r Reliability Assessment 1
of the GEOS Satell i te, Technical Advisement Memorandum No. 106-6 (PRC D-1027), 8 June 1965.
7
8
-7 -6 which is 2 3 x 10 , utilizing a k of 1 / 2 and a X of 0.13 x 10 . If k is assumed to be unity f o r the sake of conservat ism, the probability
of failure of a redundant pair of diodes is 1.3 x . The probability
of n such fai lures in a n a r r a y i s given by (y)pnqN-n where N is the -6 number of redundant diode pa i rs in the a r r a y and p is, say, 1.3 x 10
and q = 1 - p . The following table summar izes these probabilities f o r
the three a r r a y s being considered.
D
Number of Redundant Main Optical Beacon
Blocking Diode Power and Transponder Pairs Failed Supply Power Supplies
0 1 - (21 x l o -6 ) 1 - (16 x
2 1 21 x 16 x
Again, the probability of failure due to the blocking diodes is seen to be
negligible.
The third event is somewhat m o r e difficult to evaluate. The ap-
proach is a s follows:
ce l l s on one panel which contribute the i r output t o one of the three
pr ime power sources.
and 12 each for the transponder and optical so l a r a r r a y s , as shown in
Exhibit 2.
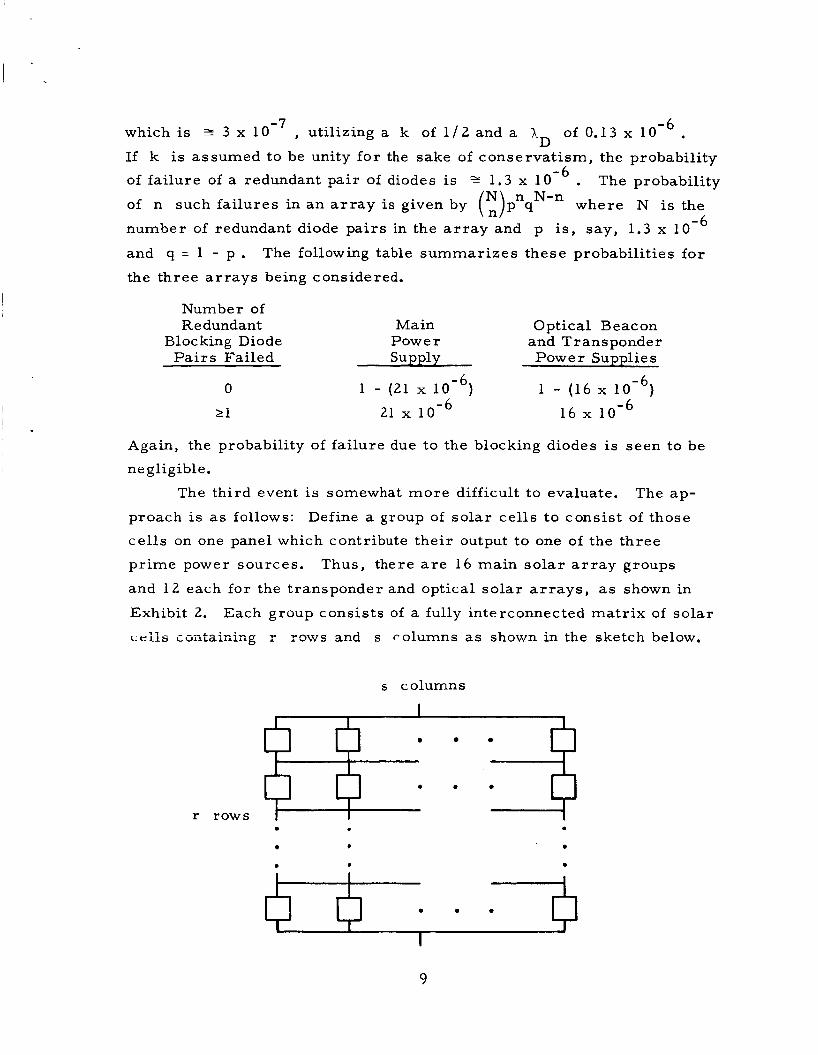
cells coiitair;ing r r c w s and s columns as shown in the sketch below.
Define a group of so la r ce l l s t o consis t of those
Thus, there a r e 16 main so la r a r r a y groups
Each group consis ts of a fully interconnected matrix of so la r
r rows
s columns
I
0 0 * * *
9
Failure of a group is assumed to be solely the resul t of open so lar
ce l l s , and the la t te r a r e assumed to occur at a ra te of 0.1 fa i lures per
million hours.
"Failure" in this context means lo s s of cu r ren t output of the group.
Taking the maximum available cu r ren t output (no failed so la r cel ls) as
I , the current output with so la r cel ls failed is assumed to be I 1
where m is the maximum number of failed ce l l s in the r rows of the
group. the relative cur ren t output is
s fa i lures , there is ze ro cu r ren t out of that group.
( -3 That is , i f in all rows of the group there is at most one fa i lure ,
1 - - , whereas , if at l ea s t one row has S
F o r a one-year period, the probability of fa i lure of a single so l a r
cel l is approximately 0.001. The probability of exactly m fai lures in
a par t icular row is
s -m P(m) = (A) (O.OO1)m (0.999)
It is c lear that P(m) is negligible for m 2 2 for the c a s e s under
consideration, and hence each row may be t rea ted as a two-stated device.
Thus, the probability that a par t icular group will have its maximum avail-
able output current i s simply the probability that t he re a r e no fai lures in
the r rows, i . e . ,
P(I) = (0,999lrS , (23 )
and the probability of having a relative cu r ren t output of I(l - i) f rom
a par t icular group is 1 - P(1) . Finally, the probability that exactly g groups of a par t icular type
are "failed" is given by
where C is the total number of groups of a par t icu lar type.
Letting M denote the main a r r a y ,
10
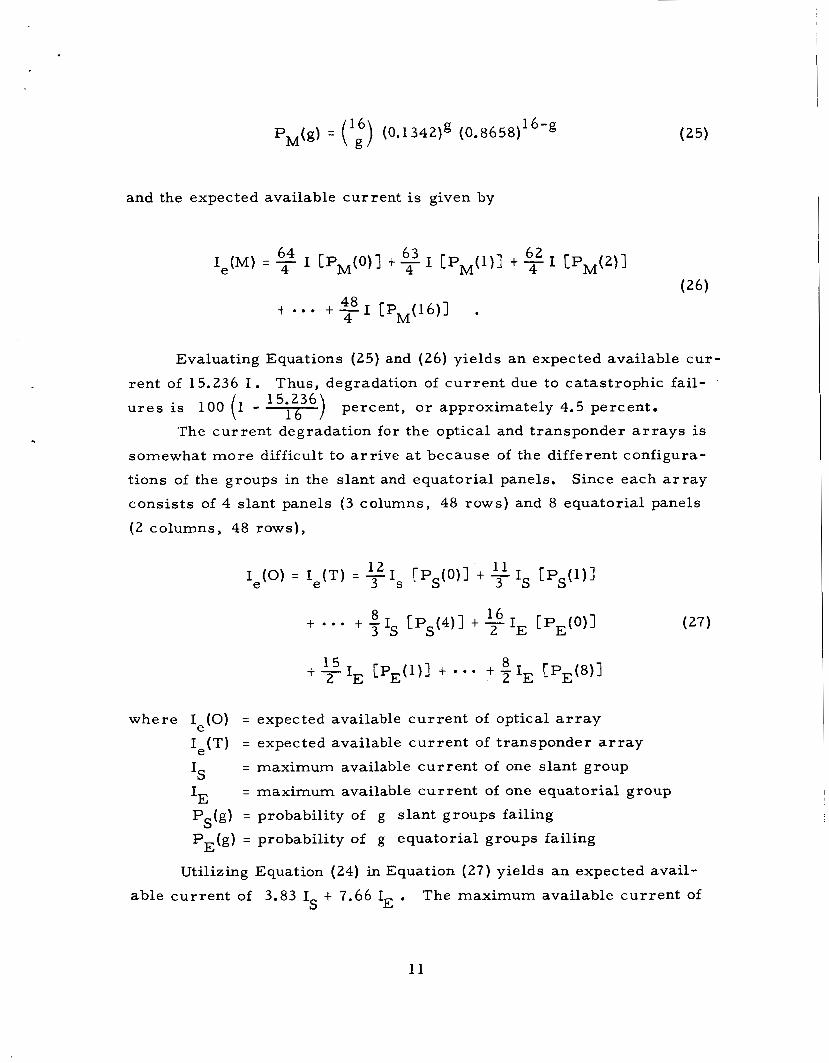
P,(g) = ('l) (0.1342)g (0.8658) 16-g
and the expected available current is given by
Evaluating Equations (25) and (26) yields an expected available c u r -
rent of 15.236 I .
u r e s is 100 (1 - ,T) percent, o r approximately 4.5 percent.
The cur ren t degradation for the optical and t ransponder a r r a y s is
somewhat more difficult to a r r ive at because of the different configura-
t ions of the groups in the slant and equatorial panels. Since each a r r a y
consis ts of 4 slant panels (3 columns, 48 rows) and 8 equatorial panels
( 2 columns, 48 rows),
Thus, degradation of cu r ren t due to catastrophic fail- 15.236
8 16 +- ... + - I 3 s CPS(4)1 -t 2 IE [PE(0)1
where I (0) = expected available cu r ren t of optical a r r a y e Ie(T) = expected available cu r ren t of transponder a r r a y
= maximum available cu r ren t of one s lant group
= maximum available cu r ren t of one equatorial group IS
IE P (g) = probability of g s lant groups failing
P (g) = probability of g equatorial groups failing S
E
Utilizing Equation (24) in Equation (27) yields an expected avail-
The maximum available cu r ren t of able cu r ren t of 3.83 I + 7.66 IE . S
11
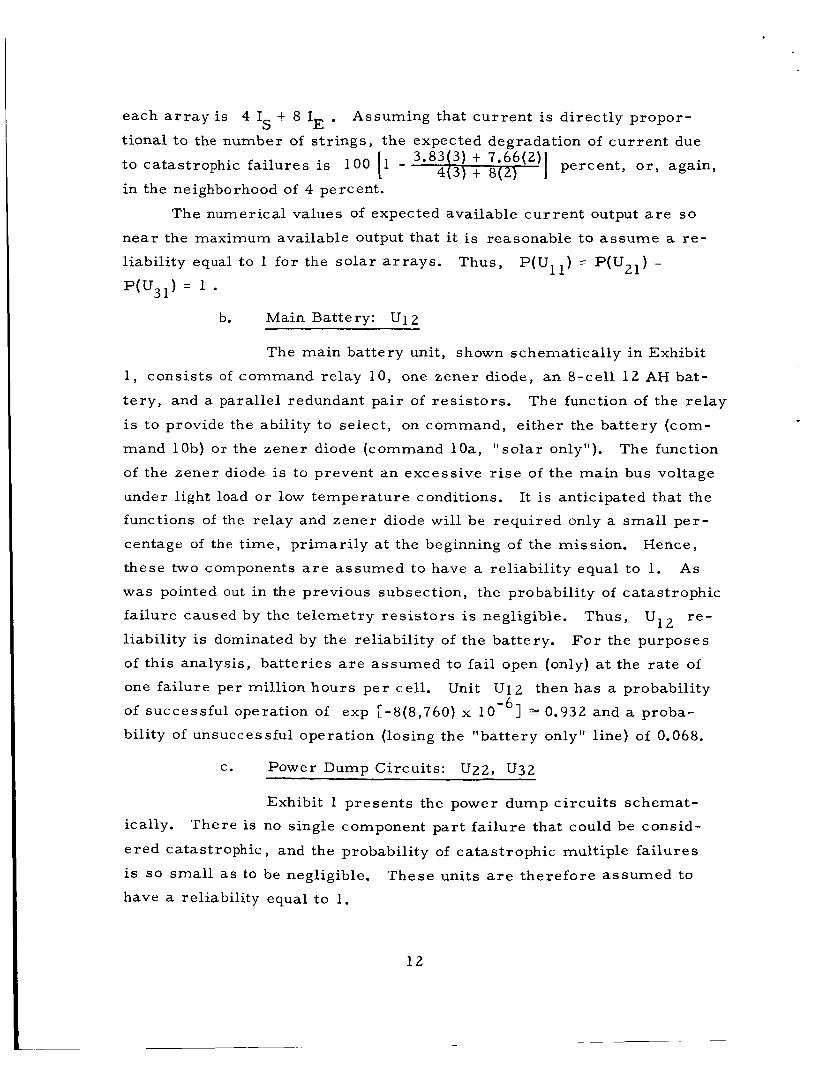
each a r r a y is 4 I t 8 IE . Assuming that cu r ren t is direct ly propor- S tional to the number of s t r ings , the expected degradation of cu r ren t due
to catastrophic fa i lures is 100 [l - percent , o r , again, 1 3.83(3) t 7.66(2) 4(3) t 8(2)
in the neighborhood of 4 percent.
The numerical values of expected
nea r the maximum available output that
liability equal t o 1 f o r the so la r a r r a y s .
P (U3$ = 1 . b. Main Battery: U12
available cu r ren t output a r e so
it is reasonable to a s sume a re-
Thus, P ( U l l ) = P(U21) =
The main bat tery unit, shown schematically in Exhibit
1 , consis ts of command relay 10, one zener diode, an 8-cell 12 AH bat-
t e ry , and a parallel redundant pa i r of res i s tors .
is to provide the ability to select , on command, either the bat tery (com-
mand lob) or the zener diode (command loa, " so la r only"). The function
of the zener diode is to prevent an excessive r i s e of the main bus voltage
under light load o r low tempera ture conditions. It i s anticipated that the
functions of the relay and zener diode will be required only a small pe r -
centage of the t ime, pr imar i ly at the beginning of the mission.
these two components a r e assumed to have a reliabil i ty equal to 1.
was pointed out in the previous subsection, the probability of catastrophic
fa i lure caused by the te lemetry r e s i s t o r s is negligible. Thus, U12 r e -
liability is dominated by the reliability of the battery. F o r the purposes
of this analysis, bat ter ies a r e assumed to fail open (only) at the ra te of
one failure per million hours pe r cell. Unit U12 then has a probability
of successful operation of exp [-8(8,760) x 10
bility of unsuccessful operation (losing the "bat tery only" l ine) of 0.068.
The function of the relay
Hence,
As
-6 1 5 0.932 and a proba-
c. Power Dump Circuits: U22, u32
Exhibit 1 presents the power dump c i rcu i t s schemat-
ically. There is no single component par t fa i lure that could be consid-
e red catastrophic, and the probability of catastrophic multiple fa i lures
is S O smal l as to be negligible.
have a reliability equal to 1 . These units are therefore assumed to
12
d.
guments similar
exp [ - 11 (8,760)
e.
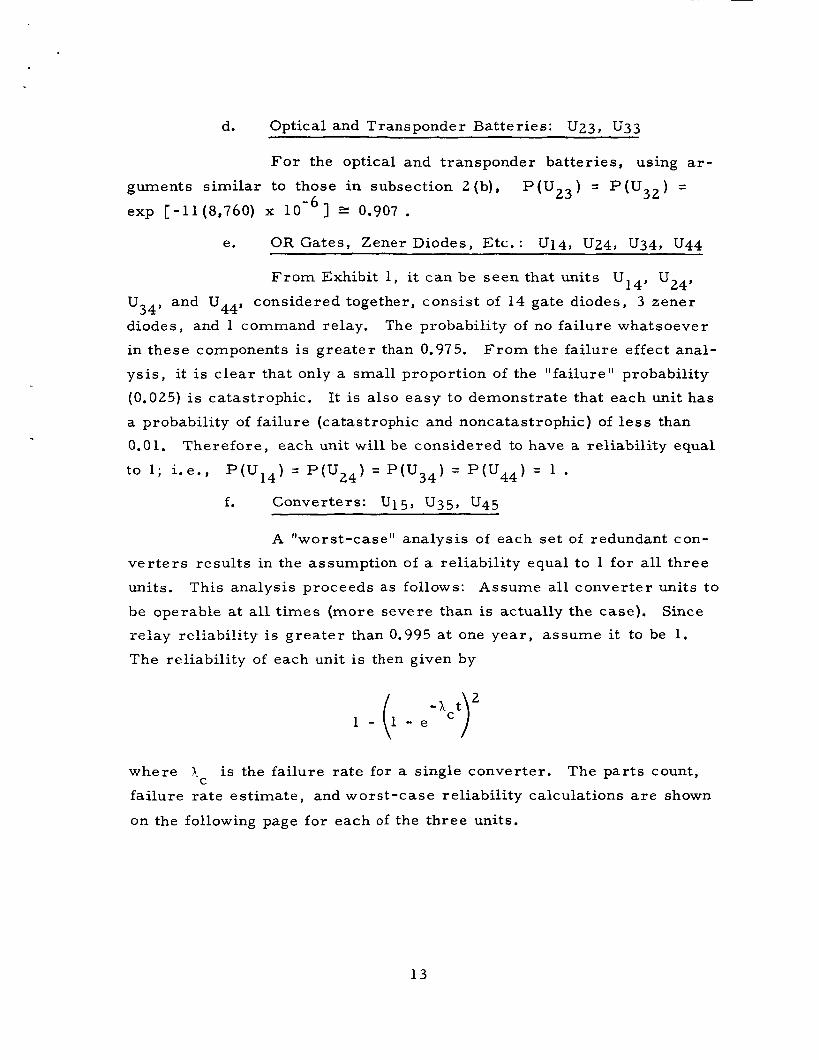
Optical and Transponder Bat ter ies : U23, U33
F o r the optical and transponder bat ter ies , using ar-
to those in subsection 2(b) , P ( U 2 3 ) = P ( U 3 2 ) = x 0.907 . OR Gates, Zener Diodes, Etc. : U14, U24, U34, U44
14' '24' F r o m Exhibit 1, it can be seen that units U
and U44, considered together, consis t of 14 gate diodes, 3 zener u34' diodes, and 1 command relay.
in these components is g rea t e r than 0.975.
ys i s , it is c l ea r that only a small proportion of the "failure" probability (0.025) is catastrophic. It is also easy to demonstrate that each unit has
a probability of failure (catastrophic and noncatastrophic) of l e s s than
0.01.
The probability of no fai lure whatsoever
F r o m the failure effect anal-
Therefore , each unit will be considered to have a reliability equal
to 1; i . e . ,
f. Converters: U15, U35, U45
A "worst-case" analysis of each se t of redundant con-
v e r t e r s resul ts in the assumption of a reliability equal t o 1 for all three
units.
be operable at all times (more severe than is actually the case).
re lay reliability is g rea t e r than 0.995 at one yea r , assume it to be 1.
The reliability of each unit is then given by
This analysis proceeds as follows: Assume all converter units to
Since
where
fai lure ra te es t imate , and worst-case reliabil i ty calculations a r e shown
on the following page for each of the three units.
Xc is the fai lure rate for a single converter . The pa r t s count,
13
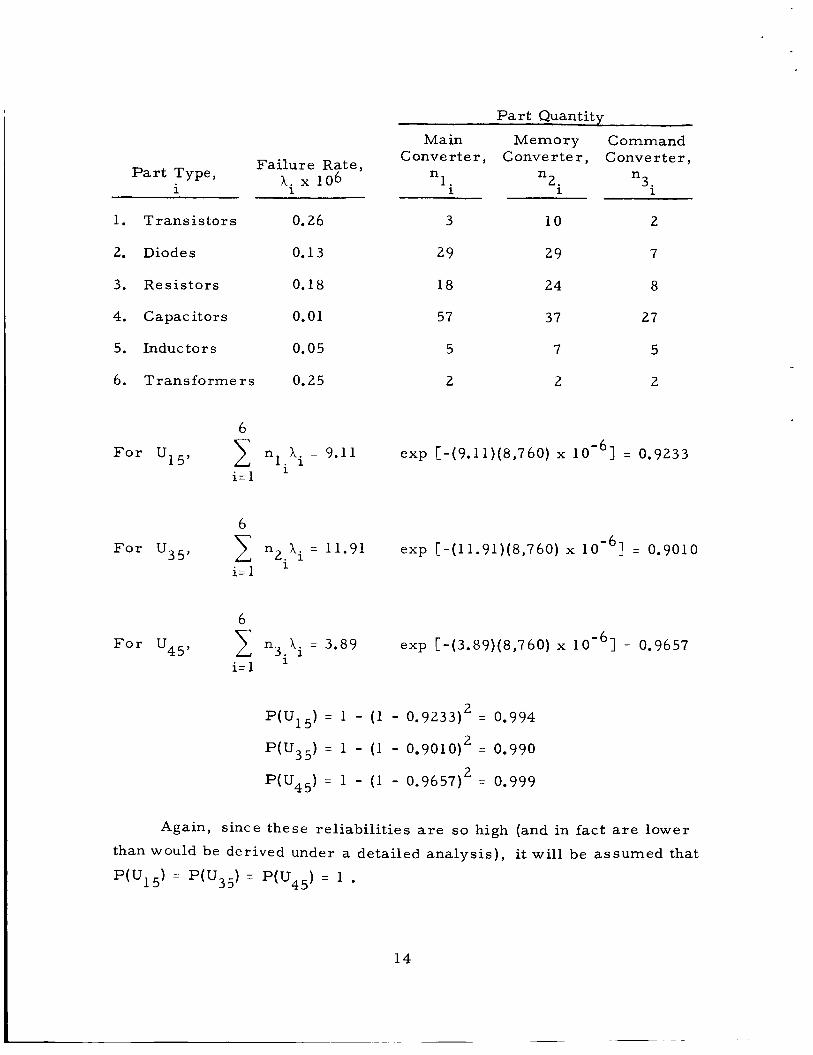
Failure Rate, 1; x 106 Part Type,
I A
1. Trans is tors 0.26
2. Diodes 0.13
3. Resis tors 0.18
4. Capacitors 0.01
5. Inductors 0.05
6. Transformers 0.25
6 1 n3.Xi = 3.89 i= 1 1
Pa r t Quantity
Main Memory Command Converter , C onve r t e r , Converter ,
n n n 1. 2. 3: I i i
3 10 2
29 29 7
18 24 8
57 37 27
5 7 5
2 2 2
exp [-(9.11)(8,760) x = 0.9233
exp [-(3.89)(8,760) x = 0.9657
P(U45) = 1 - (1 - 0.9657)' = 0.999
Again, since these rel iabi l i t ies are so high (and in fact are lower
than would be derived under a detailed analysis) , it will be assumed that
P(U15) = P(U3) = P ( u ~ ~ ) = 1 .
14
g- OR Gate: U25
Unit U25 is an OR gate to provide -32 volts to the os-
ci l la tor section f rom ei ther the main o r the m e m o r y converter.
the logic of the previous subsection, 1 is a l so a reasonable reliabil i ty
prediction for this unit.
Using
1
2
3
4
5
6
7
8
9
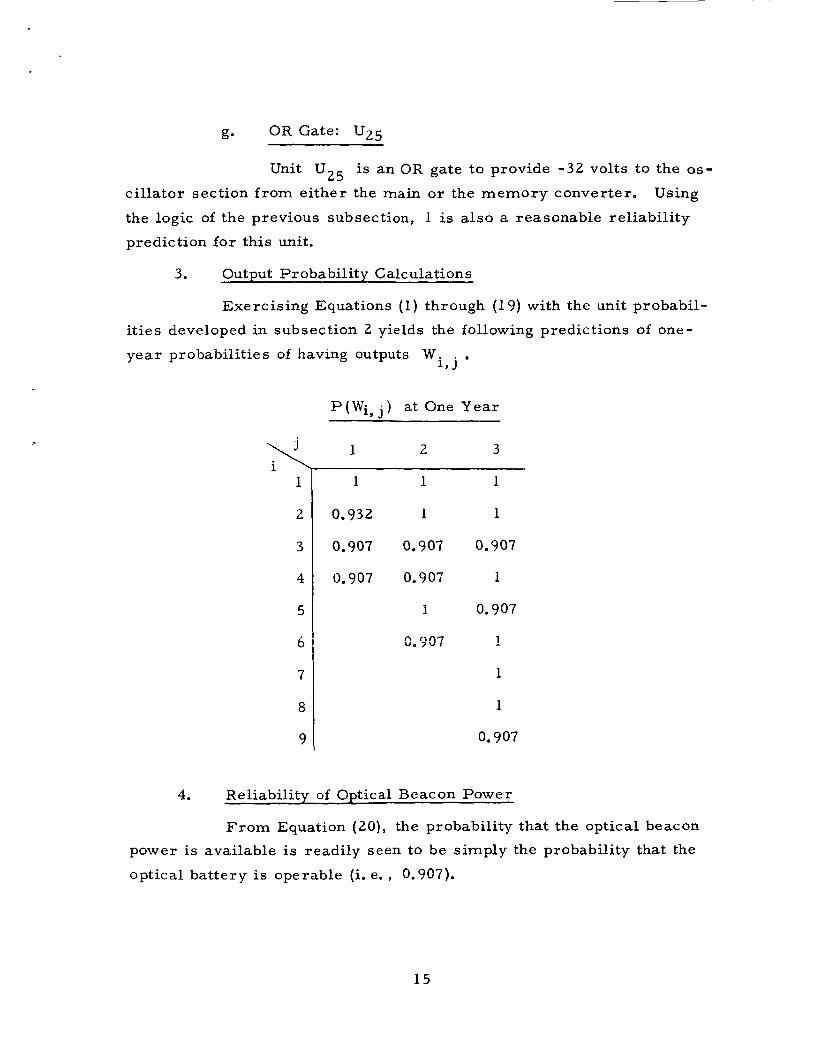
3. Output Probability Calculations
Exercising Equations (1) through (19) with the unit probabil-
i t ies developed in subsection 2 yields the following predictions of one-
yea r probabilities of having outputs w i , j *
1
0.932
0.907
0.907
P ( W i , j ) at One Year
1 2 3
1 1
1 1
0.907 0.907
0.907 1
1 0.907
1
1
1
0.907
n nn7 u. 7 U l
4. Reliability of Optical Beacon Power
F r o m Equation (20), the probability that the optical beacon
power is available is readily seen to be simply the probability that the
optical bat tery is operable (i. e. , 0.907).
15
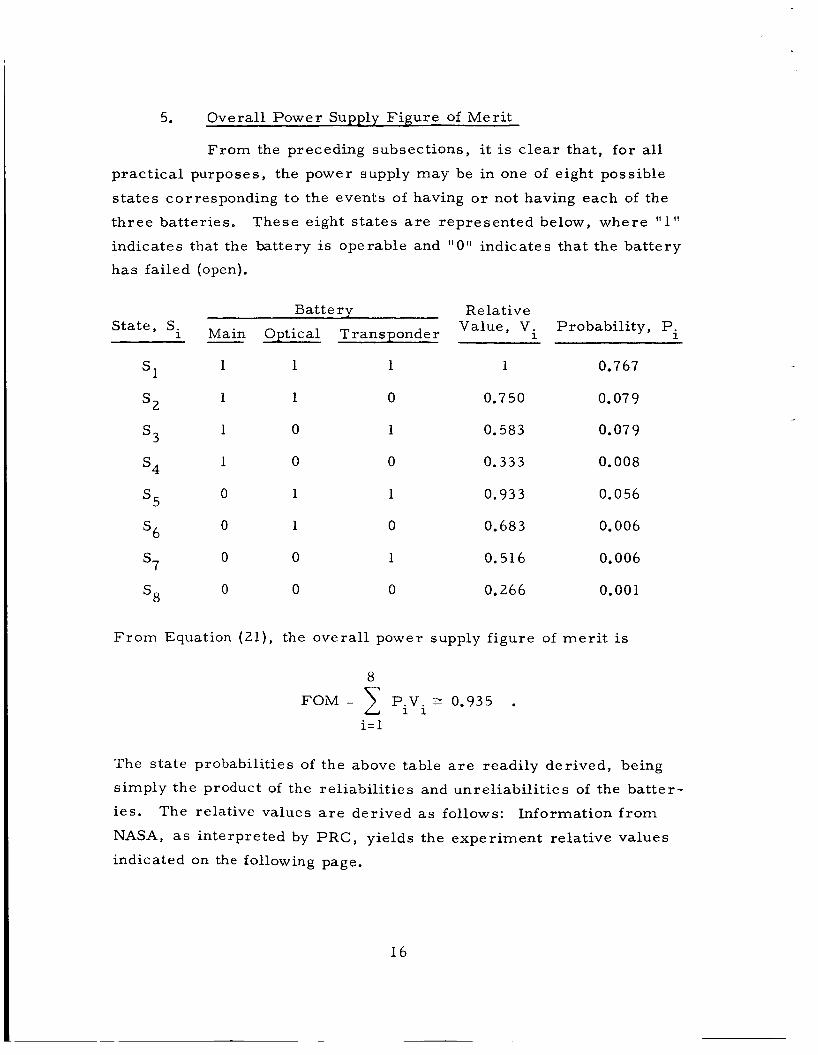
5. Overall Power Supply F igure of Meri t
F r o m the preceding subsections, it is c l ea r that , for all
pract ical purposes, the power supply may be in one of eight possible
s ta tes corresponding to the events of having o r not having each of the
th ree batteries. These eight s ta tes a r e represented below, where "1"
indicates that the battery is operable and l lO ' t indicates that the bat tery
has failed (open),
Battery Relative Value, Vi Probability, Pi si Main Optical Transponder
1 1 1 1 0.767
1 1 0 0.750 0.07 9
1 0 1 0.583 0.07 9
1 0 0 0.333 0.008
s5 0 1 1 0.933 0.056
0 1 0 0.683 0.006 ' 6
0 0 1 0.516 0.006
0 0 0 0.266 0.001
s1
s2
s3
s4
s7
' 8
F r o m Equation (21) , the overal l power supply figure of m e r i t is
8
FOM = 1 P.V. 2 0.935 . 1 1
i= 1
The s ta te probabilities of the above table a r e readily der ived, being
simply the product of the reliabil i t ies and unrel iabi l i t ies of the bat ter-
ies. The relative values a r e derived as follows: Information f r o m
NASA, as interpreted by PRC, yields the experiment relative values
indicated on the following page.
16
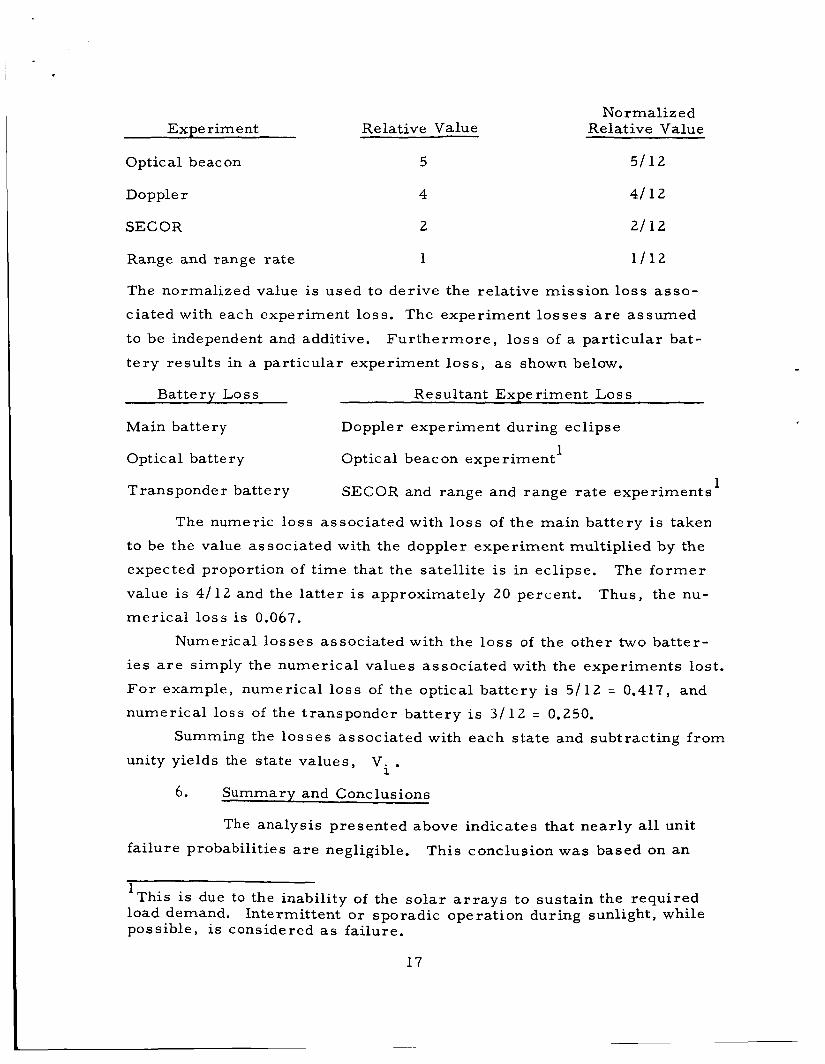
Experiment Relative Value Normalized
Relative Value
Optical beacon 5 5/12
Doppler 4 4/12
SECOR 2 2/12
Range and range rate 1 1 / 1 2
The normalized value is used to der ive the relative mission lo s s a s s o -
ciated with each experiment loss. The experiment l o s ses a r e assumed
to be independent and additive.
t e r y resul ts in a par t icular experiment l o s s , as shown below.
Fur the rmore , l o s s of a par t icular bat-
Batterv Loss Resultant ExDeriment Loss
Main battery Doppler experiment during eclipse 1
Optical battery Optical beacon experiment
Transponder battery 1 SECOR and range and range ra te experiments
The numeric loss associated with lo s s of the main bat tery is taken
to be the value associated with the doppler experiment multiplied by the
expected proportion of t ime that the satell i te is in eclipse. The f o r m e r
value is 4/12 and the la t te r is approximately 20 percent. Thus, the nu-
mer ica l loss is 0.067.
Numerical losses associated with the lo s s of the other two bat ter-
i es a r e simply the numerical values associated with the experiments lost.
F o r example, numerical l o s s of the optical bat tery is 5 /12 = 0.417, and
numerical loss of the transponder bat tery is 3/12 = 0.250.
Summing the lo s ses associated with each s ta te and subtracting from
unity yields the state values, v i . 6. Summary and Conclusions
The analysis presented above indicates that near ly all unit
fa i lure probabilities a r e negligible. This conclusion was based on an
This is due to the inability of the so la r a r r a y s to sustain the required 1
load demand. possible, i s considered as failure.
Intermittent o r sporadic ope ration during sunlight, while
17

extensive fai lure effect analysis of the unit in question, and all assump-
tions in the numerical analysis were made in the direction of conserva-
tism.l The final resul t of a power supply figure of m e r i t of 0.935 means
that, on the basis of the analysis presented, at the end of one year the
power supply is expected to perform 93.5 percent of the function r e -
quired of it. The fact that MIL-HDBK-217 fai lure r a t e s were used in
the calculations leads one to believe that the est imate is conservative
(low).
In conclusion, it seems c lear that the power supply portion of the
GEOS satell i te is extremely well designed f rom a reliabil i ty point of
view.
this time.
t icular ly the optical and transponder bat ter ies) would be the obvious focal
point.
Fu r the r efforts t o increase its reliabil i ty s e e m unwarranted at
If such efforts were to be expended, then the bat ter ies (par -
1 I The model equations and approach are presented in detail so that, i f f u r the r study is des i red in any o r all a r e a s , it may be accomplished with a minimum of additional effort.
18
APPENDIX
GEOS PRIME POWER SYSTEM FAILURE EFFECTS

.
c
APPENDIX
GEOS PRIME POWER SYSTEM FAILURE EFFECTS
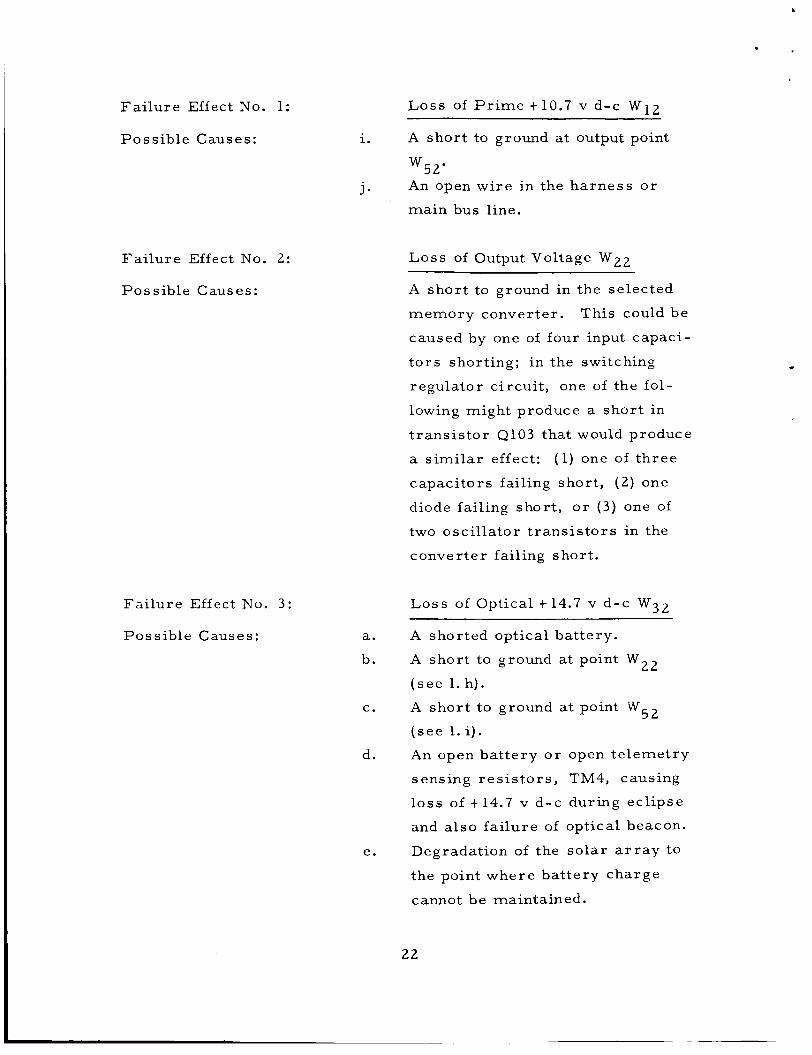
Fai lure Effect No. 1:
Possible Causes: a.
b.
C.
d.
e.
f .
g.
h.
Loss of P r i m e t 10.7 v d-c W12
A shorted main bat tery when in com-
mand lob.
A shorted 11-volt zener diode when
in command loa.
A shor t to ground by a component
within the selected main d-c /d-c
converter ; e. g . , (1) 1 zener diode,
( 2 ) ei ther of 2 t r ans i s to r s , o r (3) 1 of 13 capacitors.
Loss of the entire solar a r r a y ,
which would cause eventual loss
of the main bat tery; this might be
caused by an open of both telem-
e t ry sensing r e s i s to r s , TM1.
An open bat tery o r an open in both
te lemetry sensing r e s i s to r s , TM3,
either producing t h e S ~ L U ~ : effect
(namely, fa i lure of t 10.7 v d-c
during eclipse).
A shor t to ground developing in the
t 10.7 v d-c line connecting the
te lemetry t ime marke r .
A shor t to ground in the boom squib
and gravity-gradient attitude con-
t ro l unit.
A short to ground at output point
w22*
21
b
.
Fa i lu re Effect No . 1:
P o s sible C aus e s :
Fai lure Effect NO. 2:
Possible Causes:
Fa i lure Effect No . 3:
Possible Causes:
Loss of P r i m e t 10.7 v d-c W12
A shor t to ground a t output point
w52' An open wire in the ha rness o r
main bus line.
1.
j -
Loss of Output Voltage W22
A shor t to ground in the selected
memory converter. This could be
caused by one of four input capaci-
t o r s shorting; in the switching
regulator c i rcui t , one of the fol-
lowing might produce a shor t in
t rans is tor Q103 that would produce
a s imi la r effect:
capaci tors failing short , ( 2 ) one
diode failing short , o r (3) one of
two oscil lator t r ans i s to r s in the
converter failing short .
(1) one of th ree
LOSS of Optical t 14.7 v d-c W32
a. A shorted optical battery.
b. A shor t to ground at point W 2 2
( see 1. h).
A shor t to ground at point W 5 2
( s ee l . i ) .
An open bat tery o r open te lemet ry
sensing r e s i s to r s , TM4, causing
loss of t 14.7 v d-c during ecl ipse
and a l so fa i lure of optical beacon.
Degradation of the so la r a r r a y to
the point where bat tery charge
cannot be maintained.
c.
d.
e.
22
4
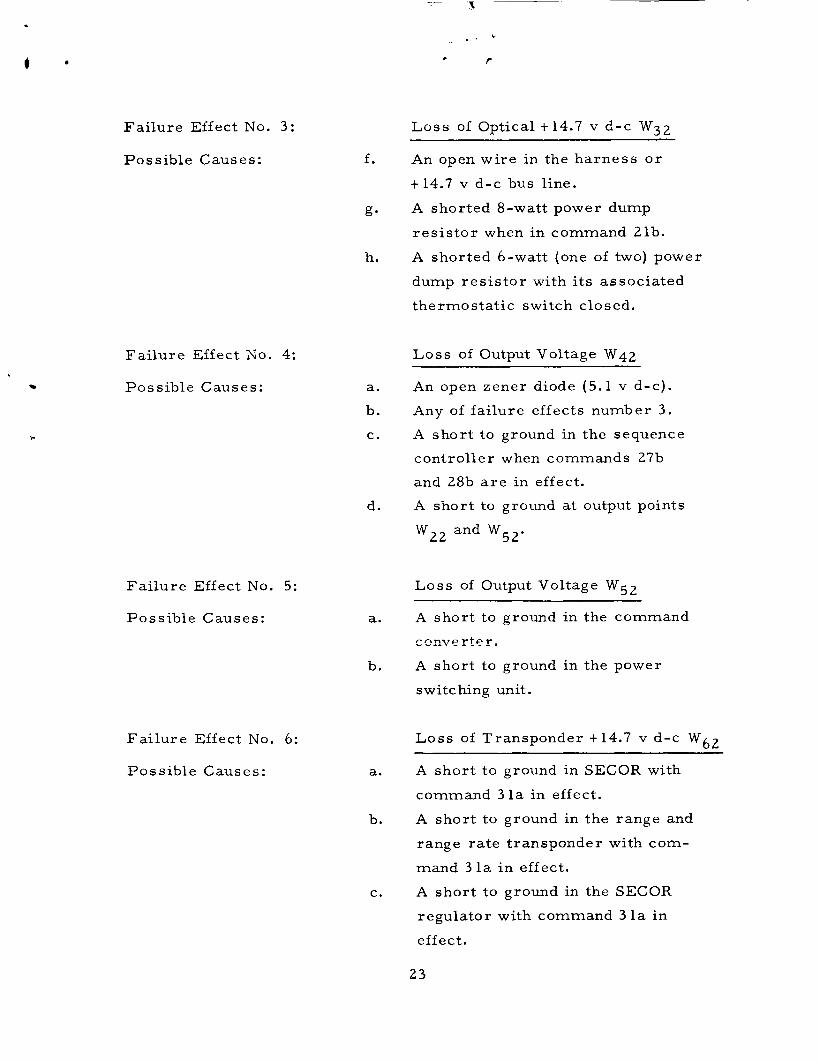
Fai lure Effect NO. 3:
Poss ib le Causes :
Loss of Optical t 14.7 v l - c W32
An open wi re in the ha rness o r
t 14.7 v d-c bus line.
A shorted 8-watt power dump
r e s i s t o r when in command 21b.
A shorted 6-watt (one of two) power
dump r e s i s t o r with its associated
thermostat ic switch closed.
f .
g.
h.
Fa i lu re Effect NO. 4:
Poss ib le Causes:
Fa i lu re Effect No . 5:
P o s s ible Causes :
Fa i lu re Effect No. 6:
Poss ib le Causes:
Loss of Output Voltage W42 ~- ~
a.
b.
c.
An open zener diode (5.1 v d-c).
Any of fa i lure effects number 3 .
A shor t to ground in the sequence
control ler when commands 27b
and 28b a r e in effect.
A shor t to ground a t output points
W22 and W52.
d.
Loss of Output Voltage W52
a. A shor t to ground in the command
c. "Eve r t e r
A shor t to ground in the power
switching unit.
b.
Loss of Transponder t 14.7 v d-c Wb2
A shor t to ground in SECOR with
command 31a in effect.
A shor t to ground in the range and
range rate transponder with com-
mand 3 la in effect .
A shor t to ground in the SECOR
regulator with command 31a i n
effect.
a.
b.
c.
23
a . c
7 . L
*
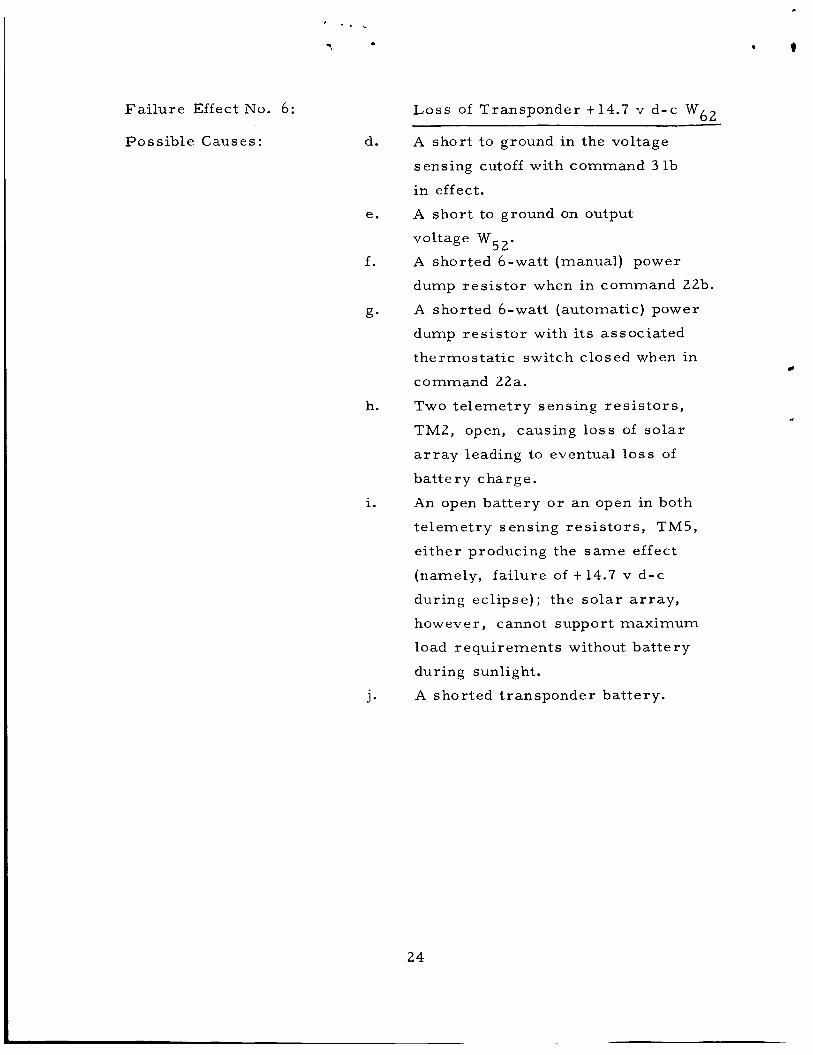
Fa i lu re Effect No. 6:
Poss ib le Causes:
Loss of Transponder t 14.7 v d-c w62
A shor t to ground in the voltage
sensing cutoff with command 3 lb
in effect.
A shor t to ground on output
voltage W
d.
e.
52' f . A shorted 6-watt (manual) power
dump re s i s to r when in command 22b.
A shorted 6-watt (automatic) power
dump re s i s to r with i t s associated
thermostat ic switch closed when in
command 22a.
g.
h. Two te lemet ry sensing r e s i s to r s ,
TM2, open, causing loss of so la r
a r r a y leading to eventual loss of
bat tery charge.
An open bat tery o r an open in both
te lemet ry sensing r e s i s to r s , TM5,
ei ther producing the s a m e effect
(namely, fa i lure of t 14.7 v d-c
during ecl ipse) ; the so la r a r r a y ,
however, cannot support maximum
load requirements without ba t te ry
during sunlight.
1.
j. A shorted t ransponder battery.
24


![TRANSPONDER BYPASS: SENTRY KEY [INSTALLATION GUIDE] · Transponder Bypass: RF override via induction w/ loop antenna (transponder incl. no key required). This transponder bypass kit](https://img.pdfslide.net/doc/110x75/5f51bec37e825f53705baf2b/transponder-bypass-sentry-key-installation-guide-transponder-bypass-rf-override.jpg)