Embed Size (px)
Citation preview
Nuclear Magnetic ResonanceANIMATED ILLUSTRATIONS
MS Powerpoint Presentation Files
Uses Animation Schemes as available in MS XP or MS
2003 versions
A class room educational material
File-5 NMR Spectrometer: Instrumentation
http://ugc-inno-nehu.com/links_from_web.html
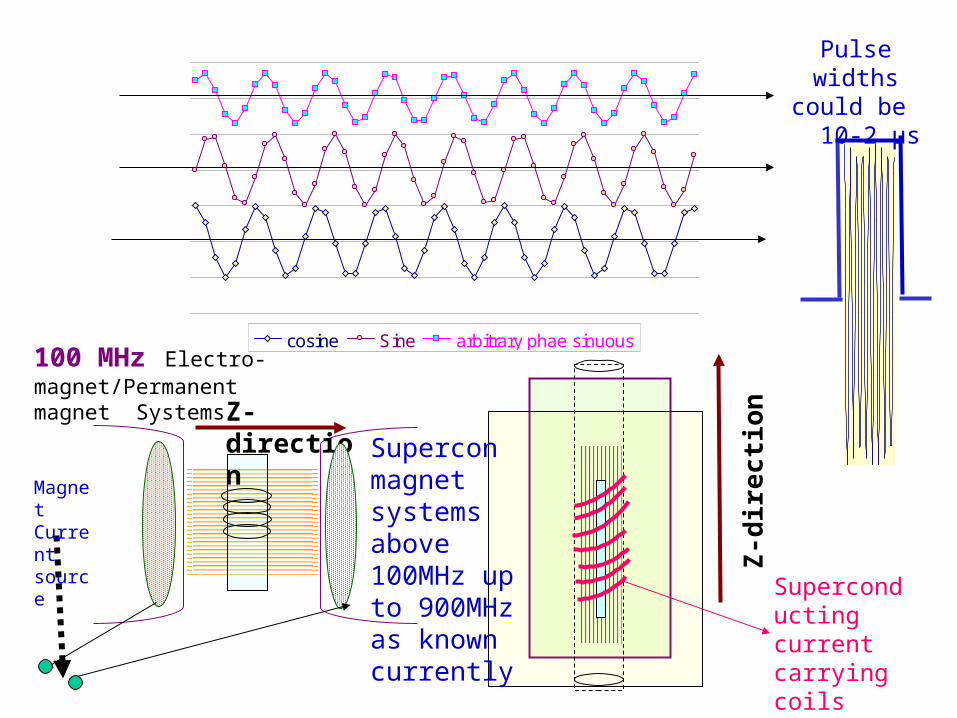
cosine Sine arbitrary phae sinuous
Z-direction
Z-d
irec
tion
100 MHz Electro-magnet/Permanent magnet Systems
Supercon magnet systems above 100MHz up to 900MHz as known currently
Magnet Current source
Superconducting current carrying coils
Pulse widths could be
10-2 μs
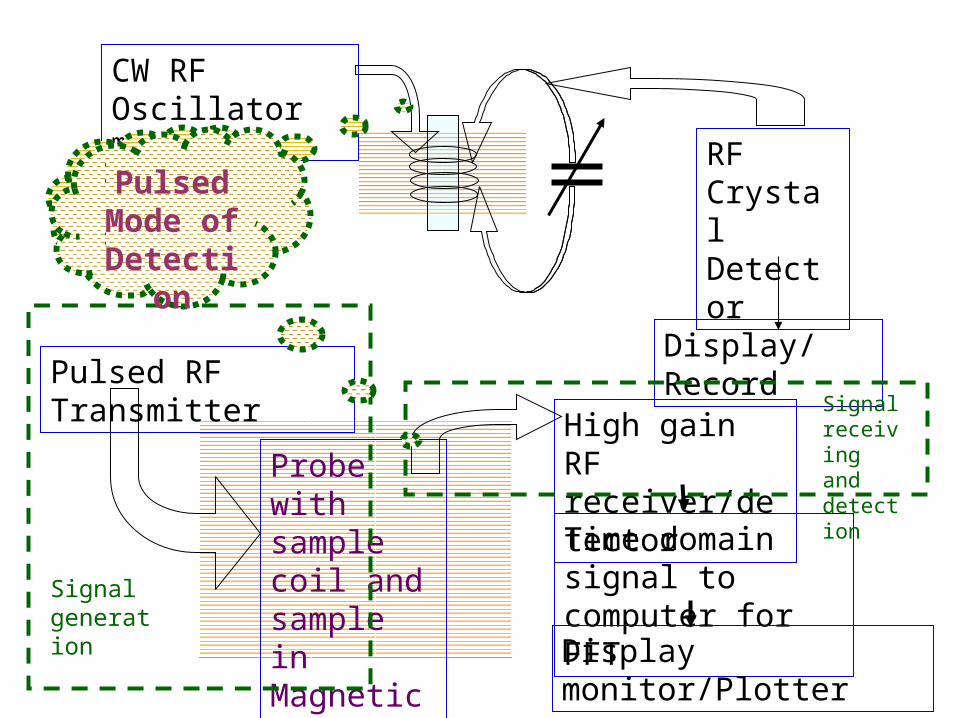
CW RF Oscillator mw power
RF Crystal Detector
Display/RecordPulsed RF Transmitter
Probe with sample coil and sample in Magnetic Field
High gain RF receiver/detector
Time domain signal to computer for FFT
Display monitor/Plotter
Signal generation
Signal receiving and detection
CW Mode of detectio
n
Pulsed Mode of
Detection
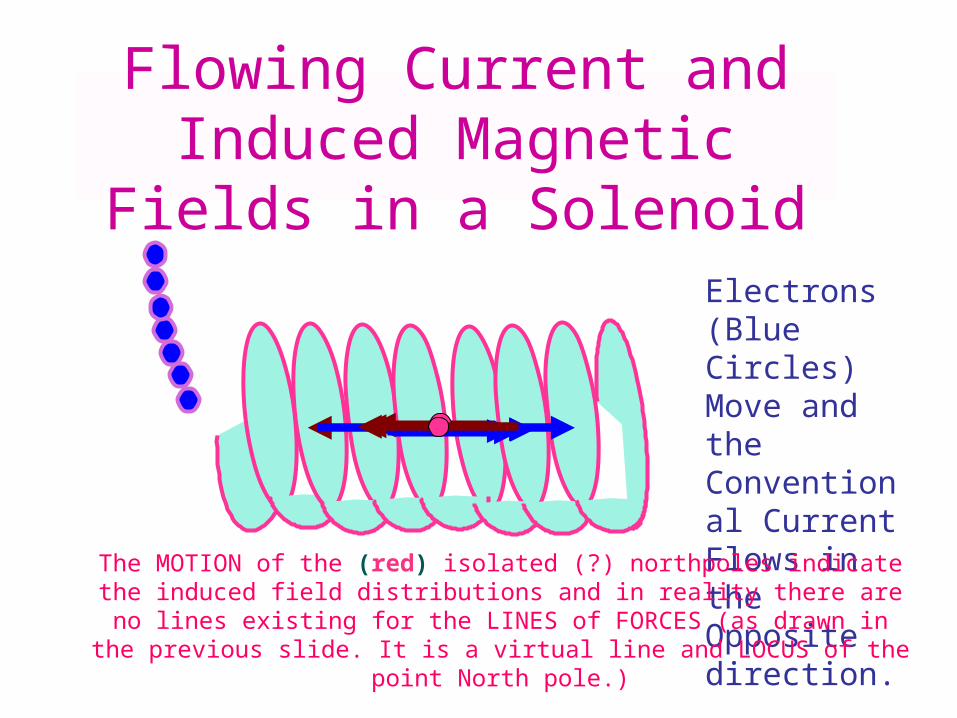
Flowing Current and Induced Magnetic Fields in a Solenoid
Electrons (Blue Circles) Move and the Conventional Current Flows in the Opposite direction.
The MOTION of the (red) isolated (?) northpoles indicate the induced field distributions and in reality there are no lines existing for the LINES of FORCES (as drawn in the previous slide. It is a virtual line and LOCUS of the point North pole.)
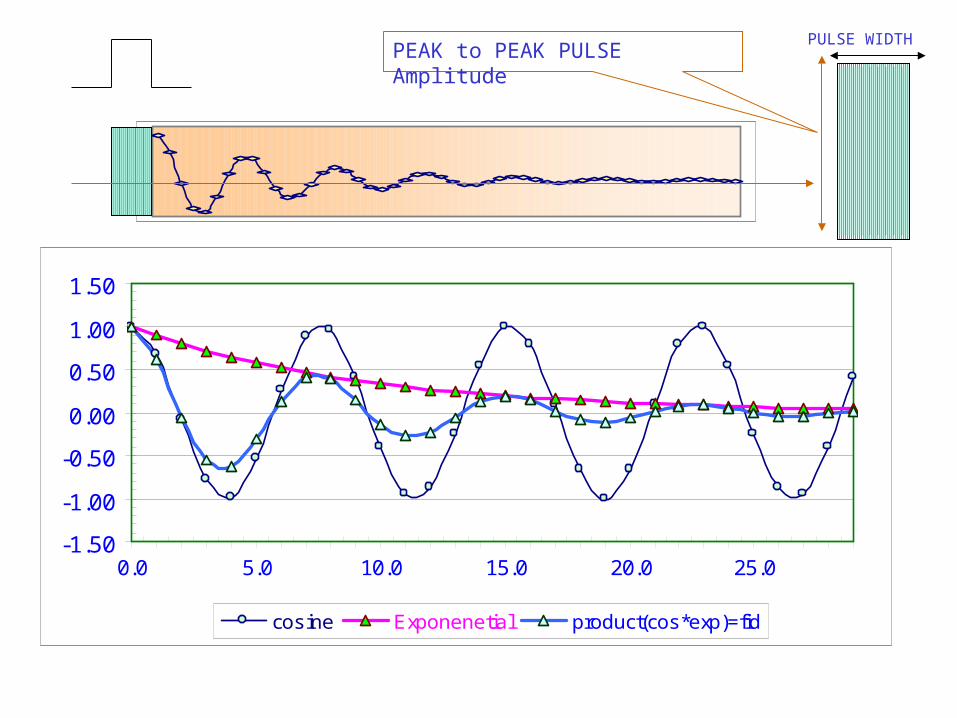
-1.50
-1.00
-0.50
0.00
0.50
1.00
1.50
0.0 5.0 10.0 15.0 20.0 25.0
cosine Exponenetial product(cos*exp)=fid
PULSE WIDTHPEAK to PEAK PULSE Amplitude
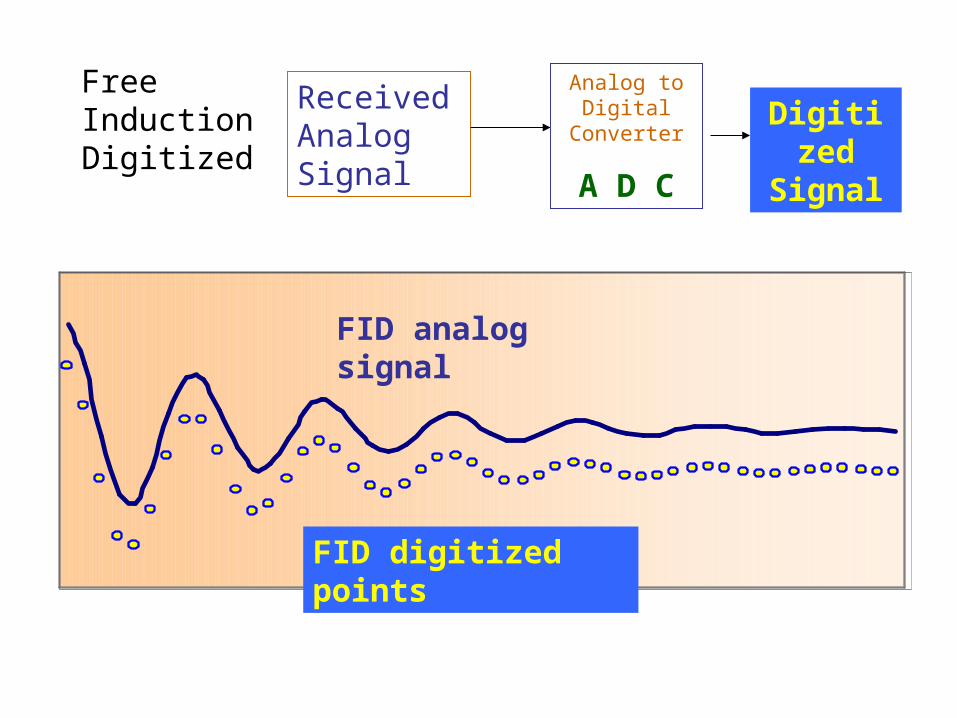
Free Induction Digitized
FID analog signal
FID digitized points
Received Analog Signal
Analog to Digital
Converter
A D C
Digitized Signal
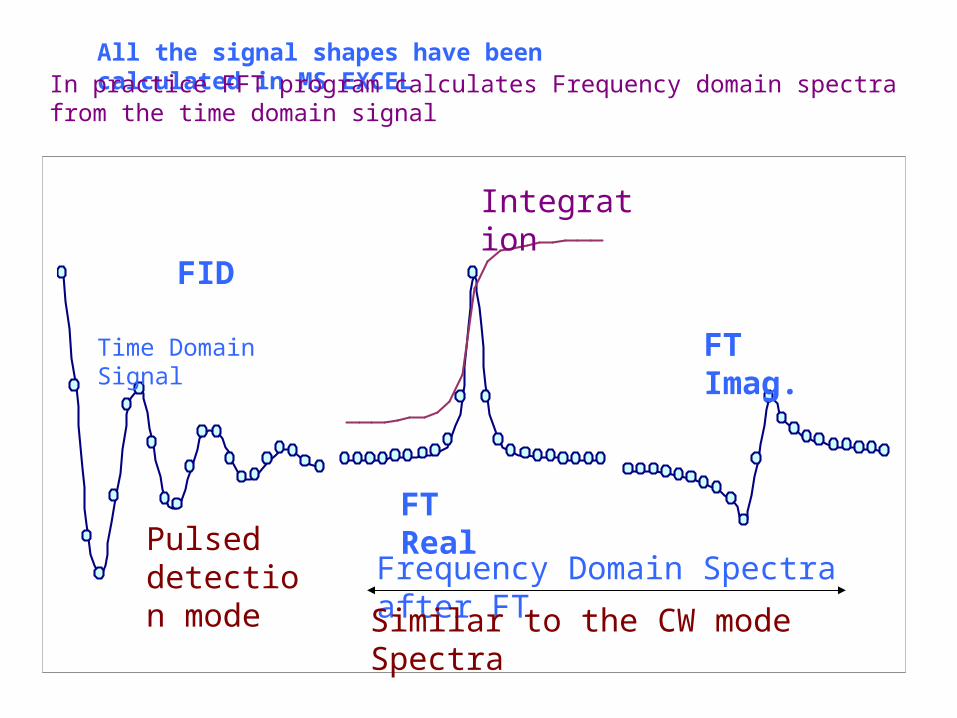
FID
FT Real
FT Imag.
Integration
All the signal shapes have been calculated in MS EXCELIn practice FFT program calculates Frequency domain spectra from the time domain signal
Time Domain Signal
Frequency Domain Spectra after FT
Similar to the CW mode Spectra
Pulsed detection mode
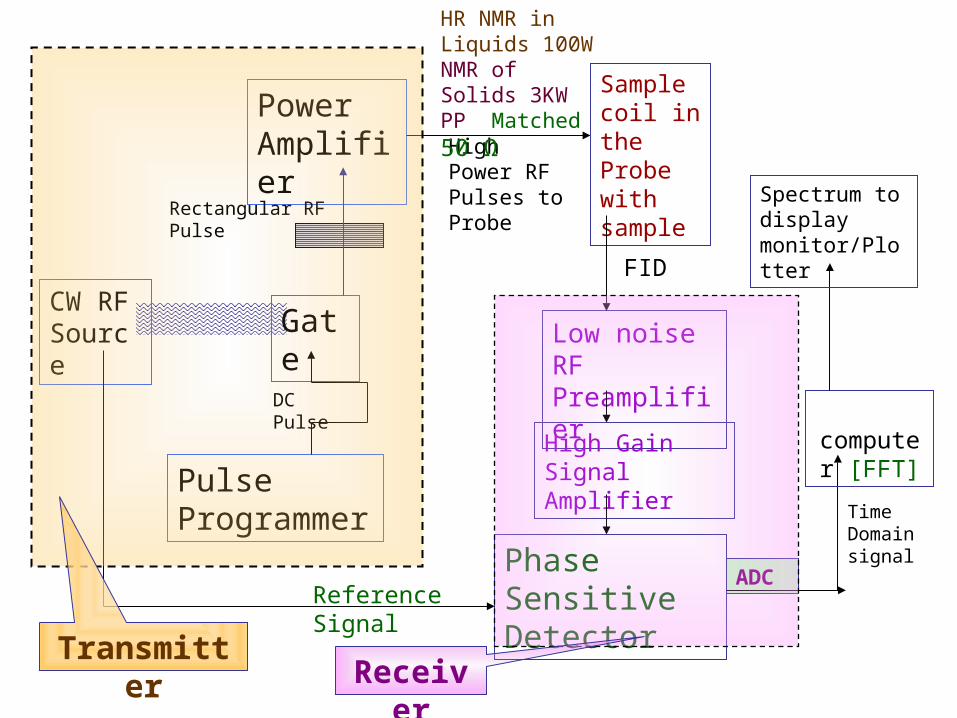
ADC
CW RF Source Gate
Pulse Programmer
DC Pulse
Power Amplifier
Rectangular RF Pulse
Sample coil in the Probe with sample
Low noise RF Preamplifier
FID
High Gain Signal Amplifier
Phase Sensitive DetectorReference Signal
computer [FFT]
Spectrum to display monitor/Plotter
High Power RF Pulses to Probe
HR NMR in Liquids 100W NMR of Solids 3KW PP Matched 50 Ω
Time Domain signal
TransmitterReceiver
CW Mode
Sample tube with sample
RF Bridge (Hybrid Junction)
RF Source (sweep generator)
Scope
50Ω
RF Signal receiver- detector
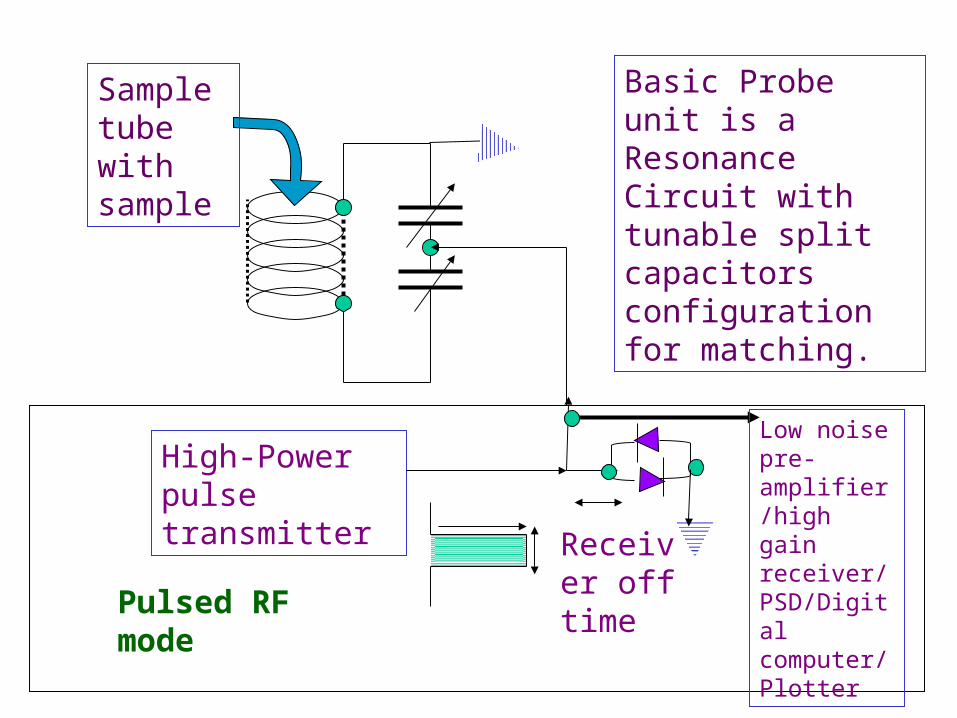
Basic Probe unit is a Resonance Circuit with tunable split capacitors configuration for matching.
CW Mode
High-Power pulse transmitter
Receiver off time
Low noise pre-amplifier /high gain receiver/PSD/Digital computer/Plotter
Pulsed RF mode
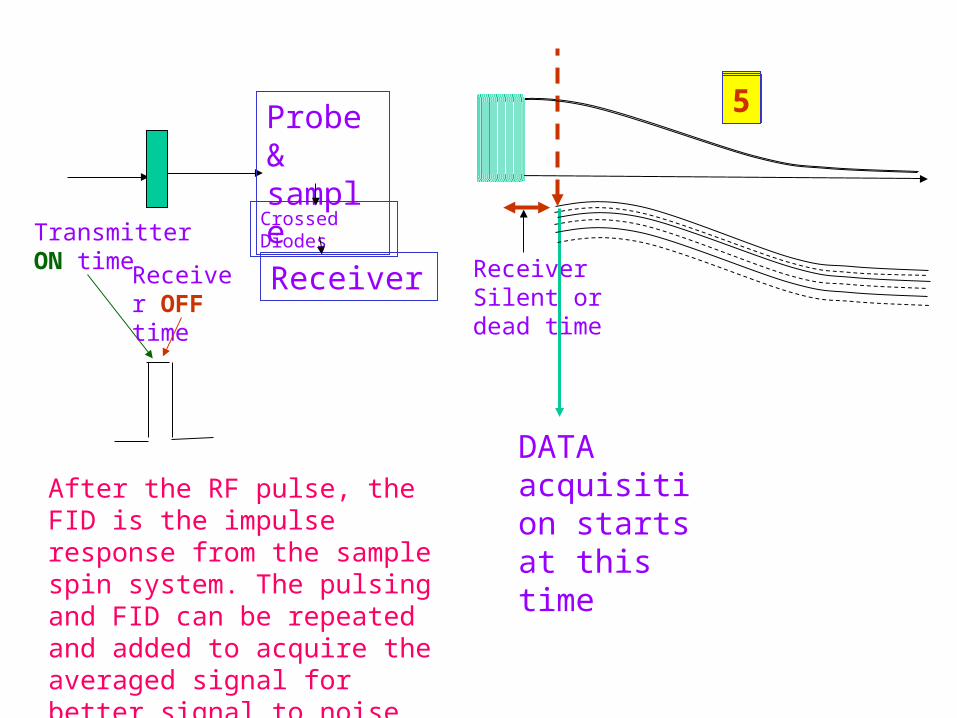
Transmitter ON time
Probe & sample
Crossed Diodes
ReceiverReceiver OFF time
Receiver Silent or dead time
DATA acquisition starts at this time
12345
After the RF pulse, the FID is the impulse response from the sample spin system. The pulsing and FID can be repeated and added to acquire the averaged signal for better signal to noise ratio
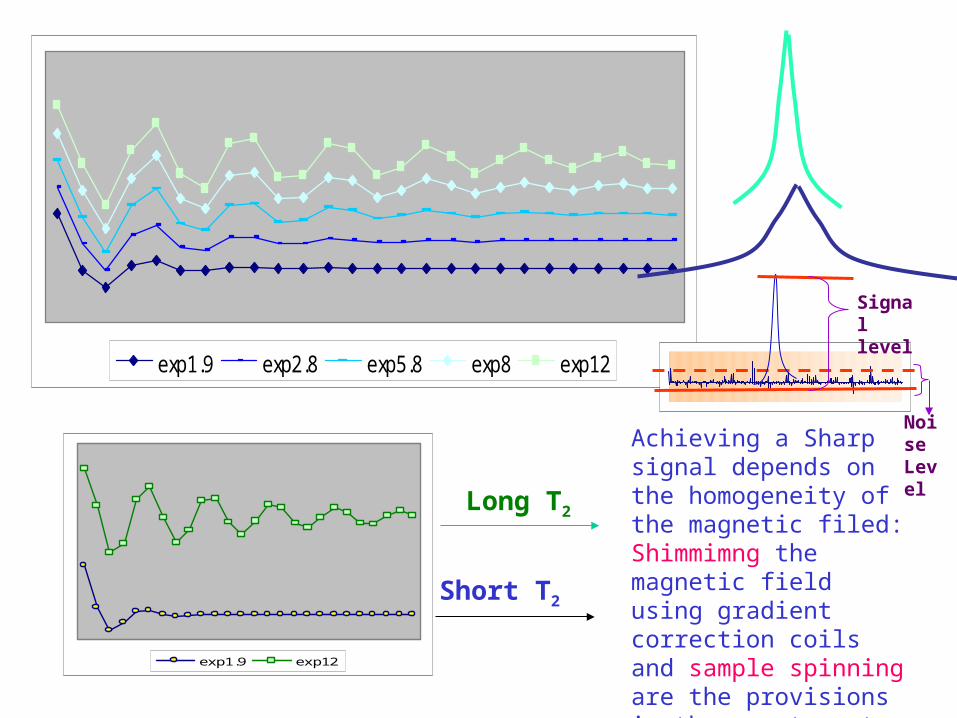
exp1.9 exp2.8 exp5.8 exp8 exp12
exp1.9 exp12
Long T2
Short T2
Achieving a Sharp signal depends on the homogeneity of the magnetic filed: Shimmimng the magnetic field using gradient correction coils and sample spinning are the provisions in the spectrometer system for improving the homogeneity
Signal level
Noise Level
HR PMR ch3ch2oh
0
1
2
3
4
5
23487398123148173198223248273298323348
frequency from TMS
Inte
nsi
ty/A
mp
litu
de
HR PMR ch3ch2oh
Moderate Resolution
HR PMR Spectrum
CH3
CH2OH
δ= 1.13 ppm
TMS δ= 0 ppm
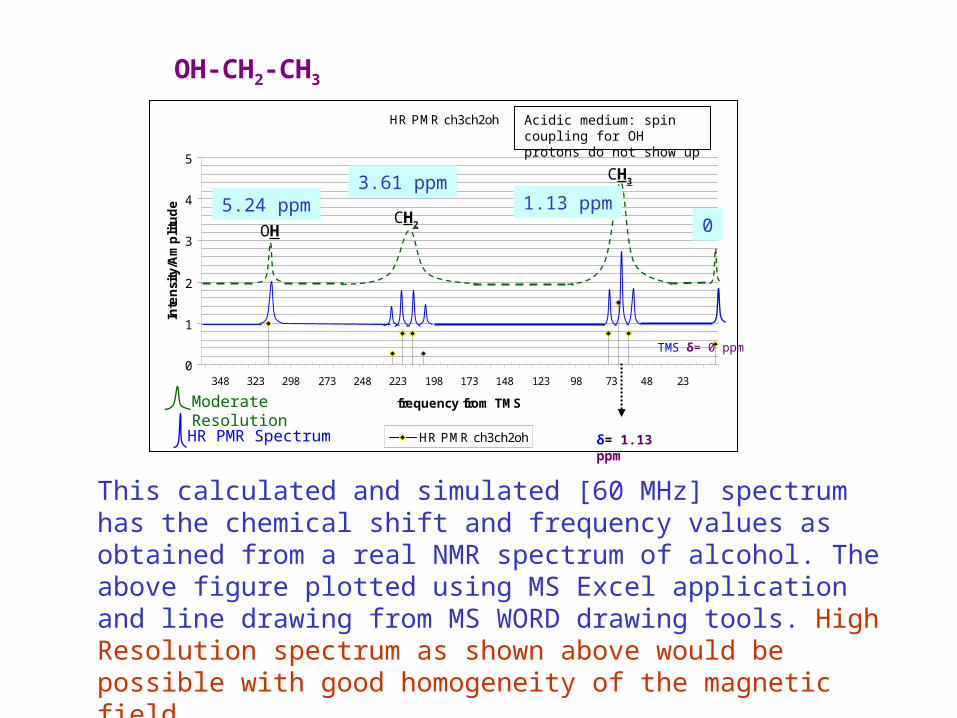
Acidic medium: spin coupling for OH protons do not show up
This calculated and simulated [60 MHz] spectrum has the chemical shift and frequency values as obtained from a real NMR spectrum of alcohol. The above figure plotted using MS Excel application and line drawing from MS WORD drawing tools. High Resolution spectrum as shown above would be possible with good homogeneity of the magnetic field.
5.24 ppm3.61 ppm
1.13 ppm0
OH-CH2-CH3
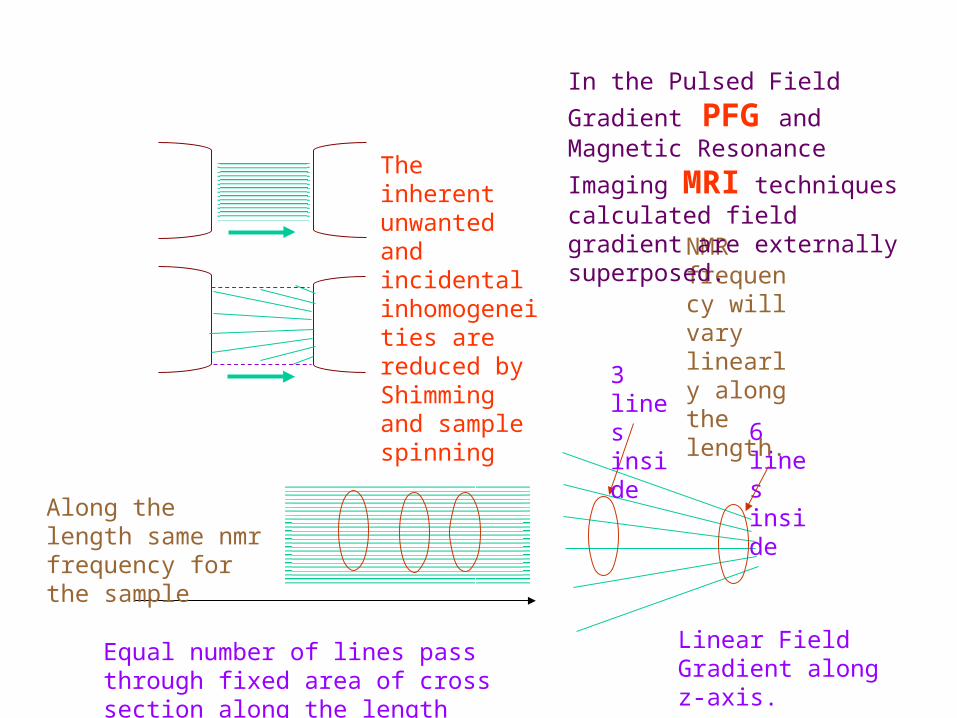
Equal number of lines pass through fixed area of cross section along the length
3 lines inside
6 lines inside
Linear Field Gradient along z-axis.
Along the length same nmr frequency for the sample
NMR frequency will vary linearly along the length.
In the Pulsed Field Gradient PFG and Magnetic Resonance Imaging
MRI techniques calculated field gradient are externally superposed.
The inherent unwanted and incidental inhomogeneities are reduced by Shimming and sample spinning