Embed Size (px)
Citation preview

Bioelectrochemistry 87 (2012) 3–8
Contents lists available at ScienceDirect
Bioelectrochemistry
j ourna l homepage: www.e lsev ie r.com/ locate /b ioe lechem
Nucleoside analogue electrochemical behaviour and in situ evaluation ofDNA–clofarabine interaction
H. Eda Satana a,b, A. Dora R. Pontinha a, Victor C. Diculescu a, Ana Maria Oliveira-Brett a,⁎a Departamento de Química, Faculdade de Ciências e Tecnologia, Universidade de Coimbra, 3004-535, Coimbra, Portugalb Department of Analytical Chemistry, Faculty of Pharmacy, Gazi University, 06330, Etiler, Ankara, Turkey
⁎ Corresponding author. Tel./fax: +351 239 835295.E-mail address: [email protected] (A.M. Oliveira-Brett).
1567-5394/$ – see front matter © 2011 Elsevier B.V. Aldoi:10.1016/j.bioelechem.2011.07.004
a b s t r a c t
a r t i c l e i n f oArticle history:Received 14 April 2011Received in revised form 18 July 2011Accepted 18 July 2011Available online 27 July 2011
Keywords:ClofarabineDNAOxidationVoltammetry
Nucleoside analogues have had a substantial impact on the treatment of cancer, especially haematologicalmalignancies. The electrochemical behaviour of the nucleoside analogue clofarabine (CLF) was investigated at aglassy carbon electrode using cyclic, differential pulse and square wave voltammetry in different pH supportingelectrolytes. The oxidation process of CLF is irreversible and pH-dependent with transfer of two protons and twoelectrons, following a diffusion controlled mechanism. The oxidation mechanism of CLF involves deprotonationand leads to the formation of a hydroxylated species that undergoes reversible redox reactions. The interaction ofDNA and the antileukemia drug CLF was investigated using a dsDNA–electrochemical biosensor in incubatedsolutions by differential pulse voltammetry. The CLF–DNA interaction leads to changes in theDNAmorphologicalstructure, confirmed using the purinic homo-polynucleotide single stranded sequences of guanosine andadenosine, poly[G] and poly[A]-electrochemical biosensors.
l rights reserved.
© 2011 Elsevier B.V. All rights reserved.
1. Introduction
Cancer is a disease in which cells grow beyond the normal limits anddestroy the tissues. Cancer is treated with surgery, chemotherapy,radiationor sometimes a combinationof these treatments. Chemotherapyutilises chemicals that interfere with the cell division process, damagingproteins or DNA, so that cancer cells undergo apoptosis.
There are many types of medicines used to treat cancer. Nucleosideanalogues comprise a major class of chemotherapeutic agents for thetreatment of cancer, especially leukaemia, and viral diseases [1]. Becauseof their structural similarity, these analogues are takenup by cells, turnedto their triphosphate species and incorporated into DNA or RNA [2].
Clofarabine (CLF), (2-chloro-9-(2-deoxy-2-fluoro-beta-D-arabi-nofuranosyl) adenine), Scheme 1, is a new generation of adenosineanalogues with higher stability in the plasma and acidic gastricmedia. Like other purine analogues, CLF includes the 2-halogenatedaglycone, which provides resistance to deamination by adenosinedeaminase. In addition, CLF also contains fluorine at the secondposition of the sugar, which protects from bacterial purine nucleo-side phosphorylase and from acid hydrolysis. The stability of CLF inacidic media makes its oral usage possible in cancer treatment.Moreover, it exhibits the highest lipophilicity when compared torelated analogues [3]. The mechanism of its anti-cancer activity is a
combination of inhibition of DNA synthesis, RNA reductase andstimulation of apoptosis.
After entry into cells, CLF is phosphorylated to its monophosphateand finally to triphosphate derivatives by deoxycytidine kinase anddeoxyguanosine kinase [4,5], which incorporate into DNA, leading toinhibition of nucleic acid synthesis and repair mechanism, finallycausing cell death. Although there are no evidence of directinteraction between CLF and DNA, there is biological relevance toinvestigate its interaction with DNA because this drug has easy accessto the interior of the cells.
Due to the importance of CLF in biological systems the develop-ment of analytical methods for its determination in biological fluids aswell as interaction with important biomolecules is of great interest.Being a relatively new drug, very few methods have appeared in theliterature for the determination of CLF. Most of them are based on highperformance liquid chromatography. For the determination of CLF inmouse plasma, the chemical extraction of the compound wasachieved using either ultra performance liquid chromatography ormicro column HPLC coupled to either quadrupole ion trap massspectrometry or triple quadrupole mass spectrometry [6]. The samemethod was also used for the determination of CLF in serum samplesof patients undergoing hemodialysis [7]. Another study is based onthe identification and separation of impurities and metabolites using1H NMR [8].
Due to their high sensitivity, voltammetric methods have beensuccessfully used for thedetection anddeterminationofmanybiologicalcompounds. Moreover, investigations of the redox behaviour ofbiologically occurring compounds by means of electrochemical

O
HOH
FH
HH
HO
N
N N
N
NH2
Cl
Scheme 1. Chemical structure of CLF.
4 H.E. Satana et al. / Bioelectrochemistry 87 (2012) 3–8
techniques have the potential for providing valuable insights into theredox reaction mechanisms of these molecules.
Interaction of a damaging agent with DNA causes changing of theelectrochemical properties of the DNA recognition layer and thiseffect is turned to measurable electrical signals. DNA damage andinteraction caused by hazardous compounds, such as metals orpharmaceutical drugs, can be detected [9–12].
The electrochemical oxidation of CLF was investigated for the firsttime using cyclic, square wave and differential pulse voltammetry at aglassy carbon electrode. The DNA–electrochemical biosensor, anelectrode with DNA immobilised on the surface, was used toinvestigate the CLF–DNA interaction. The results presented willcontribute to the clarification of the mechanism by which CLF caninteract with DNA.
2. Experimental
2.1. Materials and reagents
Clofarabine (CLF), double stranded (dsDNA), polyadenylic acid(Poly[A]) and polyguanilic acid (Poly[G]) were obtained from Sigmaand used without further purification. A stock solution of 1.6 mM CLFwas prepared in deionised water and stored at 5 °C.
Solutions of different concentrations of CLF were prepared bydilution of the appropriate quantity in supporting electrolyte. Stocksolutions of 186 μg mL− 1 dsDNA, 477 μg mL− 1 Poly[G], and587 μg mL−1 Poly[A] were prepared in deionized water and dilutedto the desired concentrations in pH 4.5 0.1 M acetate buffer.
All supporting electrolyte solutions (Table 1) were prepared usinganalytical grade reagents and purified water from a Millipore Milli-Qsystem (conductivity≤0.1 μS cm−1).
Table 1Supporting electrolyte buffer solutions.
pH Composition
2.0 HCl+KCl3.4 HAcO+NaAcO4.3 HAcO+NaAcO4.5 HAcO+NaAcO5.4 HAcO+NaAcO6.1 NaH2PO4+Na2HPO4
7.0 NaH2PO4+Na2HPO4
8.0 NaH2PO4+Na2HPO4
9.2 NH3+NH4Cl10.5 NH3+NH4Cl12.0 NaOH+KCl
2.2. Apparatus
Voltammetric experiments were carried out using a μAutolabrunningwith GPES 4.9 software, Eco-Chemie, Utrecht, The Netherlands.Measurements were carried out using a three-electrode system in a0.5 mL one-compartment electrochemical cell (Cypress System Inc.,USA). Glassy carbon electrode (GCE, d=1.5 mm) was the workingelectrode, Pt wire the counter electrode and the Ag/AgCl (3 M KCl)reference electrode.
The pHmeasurementswere carried outwith a CrisonmicropH 2001pH-metre with an Ingold combined glass electrode. All experimentswere done at room temperature (25±1 °C) and microvolumes weremeasured using EP-10 and EP-100 Plus Motorized Microliter Pippettes(Rainin Instrument Co. Inc., Woburn, USA).
The experimental conditions for differential pulse (DP) voltammetrywere: pulse amplitude 50 mV, pulse width 70 ms and scan rate5 mV s−1. For square wave (SW) voltammetry a frequency of 50 Hzand a potential increment of 2 mV, corresponding to an effective scanrate of 100 mV s−1 were used.
TheGCEwaspolishedusingdiamondspray, particle size3 μm,(Kemet,UK)before eachelectrochemical experiment. After polishing, itwas rinsedthoroughly with Milli-Q water. Following this mechanical treatment, theGCE was placed in buffer supporting electrolyte and voltammogramswere recorded until a steady state baseline voltammogramwas obtained.This procedure ensured very reproducible experimental results.
2.3. Acquisition and presentation of voltammetric data
All the voltammograms presented were background-subtractedand baseline-corrected using the moving average application with astep window of 5 mV included in GPES version 4.9 software. Thismathematical treatment improves the visualization and identificationof peaks over the baseline without introducing any artefact, althoughthe peak intensity is, in some cases, reduced (b10%) relative to that ofthe untreated curve. This mathematical treatment of the originalvoltammograms was used in the presentation of all experimentalvoltammograms for a better and clearer identification of the peaks.Nevertheless, the values for peak current presented in all plots weredetermined from the original untreated voltammograms aftersubtraction of the baseline.
2.4. Incubation procedure and DNA–biosensor preparation
In the incubation procedure, 100 μg mL−1 dsDNA were mixed with2 μM CLF in pH 4.5 0.1 M acetate buffer, and 100 μg mL−1 Poly[G] orPoly[A]weremixedwith5 μMCLF inpH4.50.1 Macetatebuffer, and thenincubated at room temperature during different time periods. Controlsolutions of CLF, dsDNA, Poly[G] and Poly[A]were also prepared in pH 4.50.1 M acetate buffer and stored during the same time periods and insimilar conditions as the CLF–dsDNA, CLF-Poly[G] and CLF-Poly[A]incubated solutions.
The thin layer dsDNA-modified electrode was prepared depositingthree drops of 5 μL each containing 50 μg mL−1 dsDNA on the GCEsurface. After placing each drop on the electrode surface, thebiosensor was allowed to dry under the constant flux of N2.
The dsDNA–electrochemical biosensor was incubated in 100 μMCLF solution during different times. Then, in order to remove unboundmolecules from the surface, the electrode was carefully rinsed withdeionized water and transferred to supporting electrolyte. AfterwardsDP voltammograms were recorded and the dsDNA film was removedfrom the electrode surface. A new biosensor was prepared for eachexperiment. Poly[G] and Poly[A]-electrochemical biosensors wereprepared from a 25 μg mL−1 solution, using the same procedure.Systematic studies to clarify the interaction mechanism of CLF withdsDNA, Poly[A] and Poly[G] were carried out at the modified GCEusing DP voltammetry that, because of its high sensitivity and

5H.E. Satana et al. / Bioelectrochemistry 87 (2012) 3–8
selectivity, enables the rapid detection of minor changes in the dsDNAmorphological structure and of DNA oxidative damage.
3. Results and discussion
The electrochemical behaviour of CLF was investigated by CV, DP,and SW voltammetry using a GCE. The electrochemical measurementswere performed in different pH electrolyte buffer solutions.
The interaction between CLF and DNA was investigated inincubated solutions and with the multilayer dsDNA, and polyhomo-nucleotides, poly[G] and poly[A]-electrochemical biosensors using DPvoltammetry.
3.1. Electrooxidation behaviour of CLB
3.1.1. Cyclic voltammetryCVs were performed in 300 μM CLF in all buffer electrolytes, scan
rate 100 mV s−1. In the first anodic scan in pH 4.3 0.1 M acetatebuffer, peak 1a, at Epa1 =+1.47 V, and in the reverse scan peak 2c, atEpc2 =+0.30 V, were observed, Fig. 1. Changing the scan direction, on
the second voltammogram, the anodic peak 2a, at Epa2 =+0.33 V,
occurred. Peaks 2c−2a correspond to the redox processes of the CLFoxidation product formed on GCE surface. The CLF oxidation peak 1acurrent decreased in successive voltammograms, Fig. 1A, due to theadsorption of CLF oxidation product on the electrode surface.
For 2.0bpHb8.0, a similar behaviour was observed, the peakpotentials being pH-dependent. The current of peak 2c increased withdecreasing pH. For pHb2.0 no oxidation peak of CLF was observed buttwo anodic peaks for pHN8.0 occurred.
-0.5 0.0 0.5 1.0 1.5
2c
2a
1a
-0.55 -0.20 0.15 0.50 0.85 1.20 1.55
2c
1a500 mV s
-1
400 mV s-1
200 mV s-1
100 mV s-1
50 mV s-1
25 mV s-1
5 mV s-1
1 µA
5 µA
E / V (vs. Ag/AgCl)
E / V (vs. Ag/AgCl)
B
A
Fig. 1. CVs in 300 μM CLF in pH 4.3 0.1 M acetate buffer solution, N2 saturated: (A) (•••)first, (▬) secondscans and ( )first scanof acetate buffer atν=500 mV s−1, (B) differentscan rates.
The effect of scan ratewas also evaluated and CVswere recorded in300 μM CLF solution in pH 4.3 0.1 M acetate buffer at scan ratesbetween 5 and 500 mV s−1, Fig. 1B. Between measurements, theelectrode surface was always polished in order to ensure a cleansurface to avoid possible problems due to adsorption. The peak 1aalways appeared on the first scan and the pair of peaks 2a−2c onsubsequent scans. Also, peak 1a current increasedwith increasing scanrate, following a linear dependence with square root of scan rate, inagreement with a diffusion-controlled process [13].
3.1.2. Differential pulse voltammetryThe electrochemical behaviour of CLF was also examined in
2.0bpHb12.0 buffer supporting electrolytes with 300 μM CLF usingDP voltammetry, Fig. 2A.
For 2.0bpHb8.0, the oxidation of CLF is pH-dependent and thevariation of peak 1a potential is linear, Epa(V)=1.640–0.059 pH,Fig. 2B. The slope of the line, 59 mV per pH unit indicates that thesame number of proton and electron are involved in the oxidation ofCLF. The width at half-height of peak 1a was W1/2~46 mV for thelowest concentrations used (between 1.6 and 25.3 μM, see belowSection 3.1.5) close to the theoretical value for the transfer of twoelectrons [13]. Thus, the oxidation of CLF occurs with a transfer of twoelectrons and two protons, and the peak current increases up untilpH=4.0 and afterwards decreases with increasing pH, Fig. 2A.
The CLF peak 1a current decreased for different pHs in successiveDP voltammograms. The oxidation peak 1a disappeared in the secondscan in strong acidic media, pHb2.0. For pHN8.0, peak 1a was splitinto two peaks, Fig. 2A, due to the degradation of CLF in alkalinemedia.
On the second and following scans a new oxidation pH-dependentpeak 2a related with the oxidation of CLF oxidation product occurred.
0.4
0.81.2
1.6
46
810
12
E / V (vs. A
g/AgCl)pH
200 nA
2 3 4 5 6 7 8 91.0
1.1
1.2
1.3
1.4
1.5
pH
Epa
/ V
(vs
. Ag/
AgC
l)
0.0
0.5
1.0
1.5
2.0
2.5
3.0B
I pa /
µµA
A
Fig. 2. (A) 3D plots of DP voltammograms base-line corrected in 300 μM CLF; (B) Plot ofpeak 1a (■) Epa and (□) Ipa versus pH. Dotted line corresponds to 59 mV per pH unit.
6 H.E. Satana et al. / Bioelectrochemistry 87 (2012) 3–8
Increasing the pH, peak 2a potential decreased. The slopeof the Epa2 versuspH was −59 mV per pH unit, as the width at half-height of the peak 2awas W1/2~81 mV, close to the theoretical value for the transfer of oneelectron [13], themechanismof peak 2a oxidation involves the transfer ofone electron and one proton.
3.1.3. Square wave voltammetrySW voltammetry has some advantages such as greater speed of
analysis, lower consumption of the electroactive species, and lessblocking of electrode surface by the compounds. Since in SWvoltammetry the current is sampled in both positive and negative--going pulses, oxidation and reduction peaks of the electroactivecompound at the electrode surface can be obtained simultaneouslyand the reversibility of the electron transfer reaction monitored byplotting the forward and backward components of the total current.
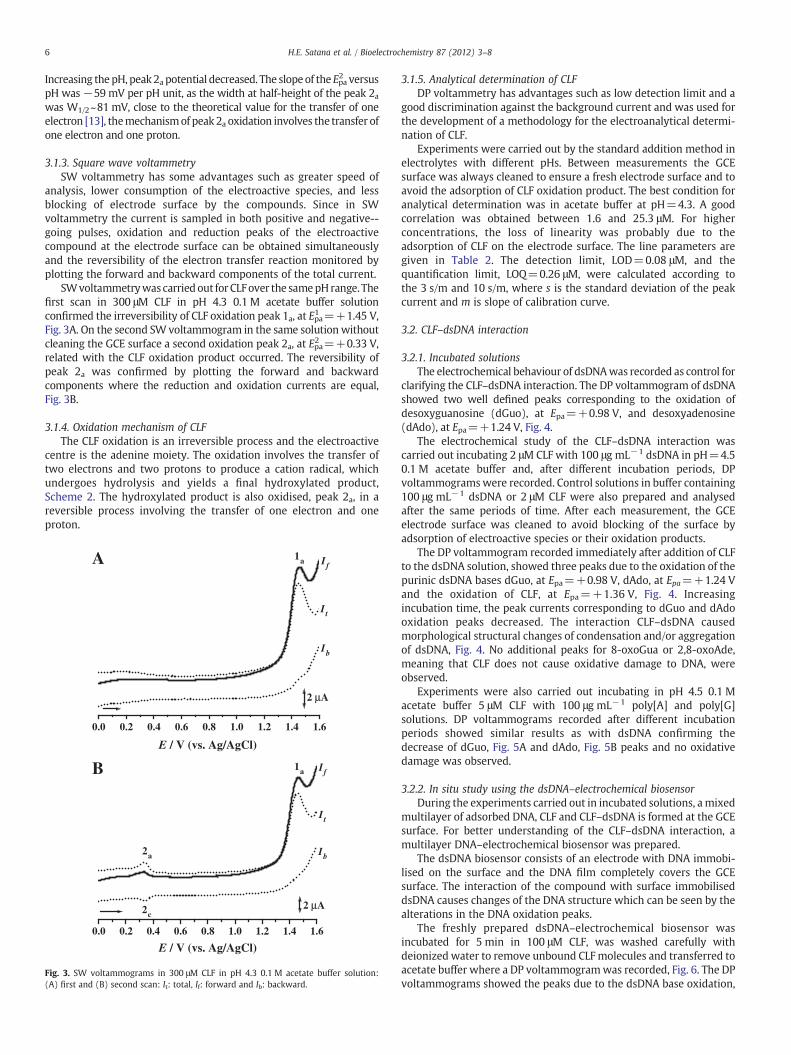
SWvoltammetrywas carriedout for CLFover the samepHrange. Thefirst scan in 300 μM CLF in pH 4.3 0.1 M acetate buffer solutionconfirmed the irreversibility of CLF oxidation peak 1a, at Epa1 =+1.45 V,Fig. 3A. On the second SW voltammogram in the same solution withoutcleaning the GCE surface a second oxidation peak 2a, at Epa2 =+0.33 V,related with the CLF oxidation product occurred. The reversibility ofpeak 2a was confirmed by plotting the forward and backwardcomponents where the reduction and oxidation currents are equal,Fig. 3B.
3.1.4. Oxidation mechanism of CLFThe CLF oxidation is an irreversible process and the electroactive
centre is the adenine moiety. The oxidation involves the transfer oftwo electrons and two protons to produce a cation radical, whichundergoes hydrolysis and yields a final hydroxylated product,Scheme 2. The hydroxylated product is also oxidised, peak 2a, in areversible process involving the transfer of one electron and oneproton.
0.0 0.2 0.4 0.6 0.8 1.0 1.2 1.4 1.6
1a
Ib
If
It
2 µA
2 µA
0.0 0.2 0.4 0.6 0.8 1.0 1.2 1.4 1.6
2c
2a
1aB
Ib
It
If
E / V (vs. Ag/AgCl)
E / V (vs. Ag/AgCl)
A
Fig. 3. SW voltammograms in 300 μM CLF in pH 4.3 0.1 M acetate buffer solution:(A) first and (B) second scan: It: total, If: forward and Ib: backward.
3.1.5. Analytical determination of CLFDP voltammetry has advantages such as low detection limit and a
good discrimination against the background current and was used forthe development of a methodology for the electroanalytical determi-nation of CLF.
Experiments were carried out by the standard addition method inelectrolytes with different pHs. Between measurements the GCEsurface was always cleaned to ensure a fresh electrode surface and toavoid the adsorption of CLF oxidation product. The best condition foranalytical determination was in acetate buffer at pH=4.3. A goodcorrelation was obtained between 1.6 and 25.3 μM. For higherconcentrations, the loss of linearity was probably due to theadsorption of CLF on the electrode surface. The line parameters aregiven in Table 2. The detection limit, LOD=0.08 μM, and thequantification limit, LOQ=0.26 μM, were calculated according tothe 3 s/m and 10 s/m, where s is the standard deviation of the peakcurrent and m is slope of calibration curve.
3.2. CLF–dsDNA interaction
3.2.1. Incubated solutionsThe electrochemical behaviour of dsDNAwas recorded as control for
clarifying the CLF–dsDNA interaction. The DP voltammogram of dsDNAshowed two well defined peaks corresponding to the oxidation ofdesoxyguanosine (dGuo), at Epa=+0.98 V, and desoxyadenosine(dAdo), at Epa=+1.24 V, Fig. 4.
The electrochemical study of the CLF–dsDNA interaction wascarried out incubating 2 μM CLF with 100 μg mL−1 dsDNA in pH=4.50.1 M acetate buffer and, after different incubation periods, DPvoltammogramswere recorded. Control solutions in buffer containing100 μg mL−1 dsDNA or 2 μM CLF were also prepared and analysedafter the same periods of time. After each measurement, the GCEelectrode surface was cleaned to avoid blocking of the surface byadsorption of electroactive species or their oxidation products.
The DP voltammogram recorded immediately after addition of CLFto the dsDNA solution, showed three peaks due to the oxidation of thepurinic dsDNA bases dGuo, at Epa=+0.98 V, dAdo, at Epa=+1.24 Vand the oxidation of CLF, at Epa=+1.36 V, Fig. 4. Increasingincubation time, the peak currents corresponding to dGuo and dAdooxidation peaks decreased. The interaction CLF–dsDNA causedmorphological structural changes of condensation and/or aggregationof dsDNA, Fig. 4. No additional peaks for 8-oxoGua or 2,8-oxoAde,meaning that CLF does not cause oxidative damage to DNA, wereobserved.
Experiments were also carried out incubating in pH 4.5 0.1 Macetate buffer 5 μM CLF with 100 μg mL−1 poly[A] and poly[G]solutions. DP voltammograms recorded after different incubationperiods showed similar results as with dsDNA confirming thedecrease of dGuo, Fig. 5A and dAdo, Fig. 5B peaks and no oxidativedamage was observed.
3.2.2. In situ study using the dsDNA–electrochemical biosensorDuring the experiments carried out in incubated solutions, amixed
multilayer of adsorbed DNA, CLF and CLF–dsDNA is formed at the GCEsurface. For better understanding of the CLF–dsDNA interaction, amultilayer DNA–electrochemical biosensor was prepared.
The dsDNA biosensor consists of an electrode with DNA immobi-lised on the surface and the DNA film completely covers the GCEsurface. The interaction of the compound with surface immobiliseddsDNA causes changes of the DNA structure which can be seen by thealterations in the DNA oxidation peaks.
The freshly prepared dsDNA–electrochemical biosensor wasincubated for 5 min in 100 μM CLF, was washed carefully withdeionized water to remove unbound CLF molecules and transferred toacetate buffer where a DP voltammogramwas recorded, Fig. 6. The DPvoltammograms showed the peaks due to the dsDNA base oxidation,

N
N N
N
NH2 NH2 NH2
Cl
N
N N
N
Cl
OHN
N N
N
Cl
O
R R R
-2e- -2H+ -1e- -1H+
+1e- +1H+
peak 1a peak 2a
peak 2c
Scheme 2. Proposed CLF oxidation mechanism.
0.3 0.5 0.7 0.9 1.1 1.3 1.5
CLF
dGuo
dAdo
5 nA
E / V (vs. Ag/AgCl)
Fig. 4. DP voltammograms base-line corrected in 100 μg mL−1 dsDNA in pH 4.5 0.1 Macetate buffer (▬) control and after incubation with 2 μMCLF during (╸╸╸) 0 h, (•••) 2 hand ( ) 4 h.
A
CLF
dGuo
7H.E. Satana et al. / Bioelectrochemistry 87 (2012) 3–8
smaller relative to the control, followed by a peak at a higher potentialdue to CLF oxidation.
This experiment was repeated, always using a newly preparedbiosensor, testing incubation times of 10 and 15 minutes, and adecrease of dsDNA base oxidation peaks with increasing incubationtimewas observed. The CLF oxidation peak increasedwith time due toincorporation and pre-concentration into the DNA film.
The decrease in dGuo and dAdo oxidation peaks with increasingincubation time in CLF corresponds to the condensation of the dsDNAmorphological structure. Nevertheless, no oxidative DNA damageoccurred during CLF–dsDNA interaction, since no peaks correspondingto 8-oxoGua or 2,8-oxoA were observed.
In order to obtain more detailed information about the natureof the interaction between CLF–dsDNA interaction, the GCEsurface was modified, as described in Section 2.4, and Poly[G] andPoly[A]-electrochemical biosensors were prepared.
The control Poly[G]-electrochemical biosensors showed only thedGuo peak, at Epa=+0.98 V, Fig. 7A. In a new experiment, newlyprepared Poly[G]-electrochemical biosensors were incubated in100 μM CLF during different times and the peaks corresponding tothe oxidation of dGuo and CLF decreased with increasing incubationtime, Fig. 7A.
The control Poly[A]-electrochemical biosensors showed only thedAdo peak, at Epa=+ 1.24 V, Fig. 7B. In another experiment, newlyprepared Poly[A]-electrochemical biosensors were also incubated in100 μMCLF during different times and the peaks corresponding to theoxidation of dAdo and CLF decreased with increasing incubation time,Fig. 7B.
It was confirmed that the interaction CLF–dsDNA is not specific to agiven type of dsDNA base and does not cause oxidative damage.
0.3 0.5 0.7 0.9 1.1 1.3 1.5
100 nA
B
CLF
dAdo
50 nA
E / V (vs. Ag/AgCl)
4. Conclusions
The electrochemical behaviour of CLF, a drug used to treat variouslymphocytic cancers, was studied using cyclic, differential pulse andsquare wave voltammetry and a glassy carbon electrode. Theoxidation of CLF is irreversible, pH-dependent, and leads to ahydroxylated product. The oxidation product of clofarabine un-dergoes reversible oxidation.
The interaction between dsDNA and CLF in incubated solutionsand using dsDNA, Poly[G], and Poly[A]-electrochemical biosensorswas investigated showing that CLF interacts with dsDNA, confirmedby decreasing of the dGuo and dAdo oxidation peaks with increasingincubation time in solutions containing CLF.
The CLF–dsDNA interaction causes condensation of the dsDNAmorphological structure, is not specific to a given type of base, anddoes not cause oxidative damage.
Table 2Regression and validation data of CLF.
Linearity(μM)
Slope(A M−1)
Intercept (A) R2 LOD (μM) LOQ (μM) RSD%
1.6–25.3 1.87×10⁻⁸ −2.87×10⁻⁹ 0.9997 0.08 0.26 2.14
0.3 0.5 0.7 0.9 1.1 1.3 1.5
E / V (vs. Ag/AgCl)
Fig. 5. DP voltammograms base-line corrected in 100 μg mL−1 of (A) Poly[G] and(B) Poly[A] in pH 4.5 0.1 M acetate buffer: (▬) control and after incubation with 5 μMCLF during (╸╸╸) 0 h, (•••) 2 h and ( ) 4 h.

0.3 0.5 0.7 0.9 1.1 1.3 1.5
CLF
dGuo
dAdo
10 nA
E / V (vs. Ag/AgCl)
Fig. 6. DP voltammograms base-line corrected in pH 4.5 0.1 M acetate buffer withdsDNA-electrochemical biosensors (▬) control and after incubation with 100 μM CLFduring (╸╸╸) 5 min, (•••) 10 min and ( ) 15 min.
0.4 0.6 0.8 1.0 1.2 1.4
A
CLF
dGuo
20 nA
0.4 0.6 0.8 1.0 1.2 1.4
B
CLF
dAdo
50 nA
E / V (vs. Ag/AgCl)
E / V (vs. Ag/AgCl)
Fig. 7. DP voltammograms base-line corrected in pH 4.5 0.1 M acetate buffer with(A) Poly[G] and (B) Poly[A]-electrochemical biosensors: (▬) control and afterincubation with 100 μM CLF during (╸╸╸) 5 min, (•••) 10 min and ( ) 15 min.
8 H.E. Satana et al. / Bioelectrochemistry 87 (2012) 3–8
Acknowledgements
Financial support from The Scientific and Technological ResearchCouncil of Turkey (TUBITAK) — International Postdoctoral ResearchFellowship Programme (BIDEB) (H.E. Satana) and Fundação para aCiência e Tecnologia (FCT), PhD grant SFRH/BD/46026/2008 (A.D.R.Pontinha), Post-Doctoral Grant SFRH/BPD/36110/2007 (V.C. Diculescu),
project PTDC/QUI/65255/2006, PTDC/QUI/098562/2008 andPTDC/SAU-BEB/104643/2008, POCI (co-financed by the EuropeanCommunity Fund FEDER), CEMUC-R (Research Unit 285) are gratefullyacknowledged.
References
[1] T. Robak, A. Korycka, M. Kasznicki, A. Wrzesien-Kus, P. Smolewski, Purinenucleoside analogues for the treatment of hematological malignancies: pharma-cology and clinical applications, Curr. Cancer Drug Targets 5 (2005) 421–444.
[2] A. Zhenchuk, K. Lotfi, G. Juliusson, F. Albertioni, Mechanism of anti-cancer actionand pharmacology of clofarabine, Biochem. Pharmacol. 78 (2009) 1351–1359.
[3] V.Reichelova, J. Liliemark, F.Albertioni, Liquidchromatographic studyof acidstabilityof 2-chloro-2'-arabino-fluoro-2′-deoxyadenosine, 2-chloro-2′-deoxyadenosine andrelated analogues, J. Pharmaceut. Biomed. 13 (1995) 711–714.
[4] A.H. Sjoberg, L. Wang, S. Eriksson, Substrate specificity of human recombinantmitochondrial deoxyguanosine kinase with cytostatic and antiviral purine andpyrimidine analogs, Mol. Pharmacol. 53 (1998) 270–273.
[5] X. Wang, F. Albertioni, Effect of clofarabine on apoptosis and DNA synthesis inhuman epithelial colon cancer cells, Nucleosides Nucleotides Nucleic Acids 29(2010) 414–418.
[6] Y. Hsieh, C.J.G. Duncan, S. Lee, M. Liu, Comparison of fast liquid chromatography/tandem mass spectrometric methods for simultaneous determination of cladribineand clofarabine in mouse plasma, J. Pharmaceut. Biomed. 44 (2007) 492–497.
[7] P.G. Steinherz, N. Shukla, R. Kobos, S. Latcha, Effect of hemodialysis on the plasmalevels of clofarabine, Pediatr. Blood Cancer 55 (2010) 196–198.
[8] B.G. Anderson, W.E. Bauta, W.R. Cantrell, T. Engles, D.P. Lovett, Isolation, synthesis,and characterization of impurities and degradants from the clofarabine process,Org. Proces. Res. Dev. 12 (2008) 1229–1237.
[9] F. Jelen, M. Fojta, E. Palacek, Voltammetry of native double-stranded, denaturatedand degraded DNA, J. Electroanal. Chem. 427 (1997) 49–56.
[10] A.M. Oliveira-Brett, J.A.P. Piedade, L.A. Silva, V.C. Diculescu, Voltammetricdetermination of all DNA nucleotides, Anal. Biochem. 332 (2004) 321–329.
[11] X. Cai, G. Rivas, H. Shirashi, P. Farias, J. Wang, M. Tomschikb, F. Jelenb, E. Palecek,Electrochemical analysis of formation of polynucleotide complexes in solutionand at electrode surfaces, Anal. Chim. Acta 344 (1997) 65–76.
[12] A.M. Chiorcea-Paquim, O. Corduneanu, S.C.B. Oliveira, V.C. Diculescu, A.M.Oliveira-Brett, Electrochemical and AFM evaluation of hazard compounds —DNA interaction, Electrochim. Acta 54 (2009) 1978–1985.
[13] C.M.A. Brett, A.M. Oliveira Brett, Electrochemistry. Principles, Methods andApplications, Oxford University Press, UK, 1993.