Embed Size (px)
Citation preview

Nuevos FNuevos Fáármacos.rmacos.Nuevas Nuevas CoformulacionesCoformulaciones
VII Curso Avances en Infección VIH y Hepatitis ViralesLa Coruña, 1 de Febrero de 2013
Santiago MorenoHospital Ramón y Cajal. Madrid.

Tratamiento Antirretroviral Optimo¿Qué queremos?¿Qué necesitamos?
Máxima eficacia virológica— CV <50 copias/mL en 85% (ITT)
Excelente tolerancia— Suspensiones por EA <5% a 48 semanas
No toxicidad a largo plazo— No lipoatrofia, hiperlipidemia (otros: RCV, hueso, riñón..?)
No selección de resistencias— No resistencias cruzadas. Fácilmente rescatable.
Comodidad de administración— Pocas dosis, pocas pastillas, pocos requerimientos
Precio
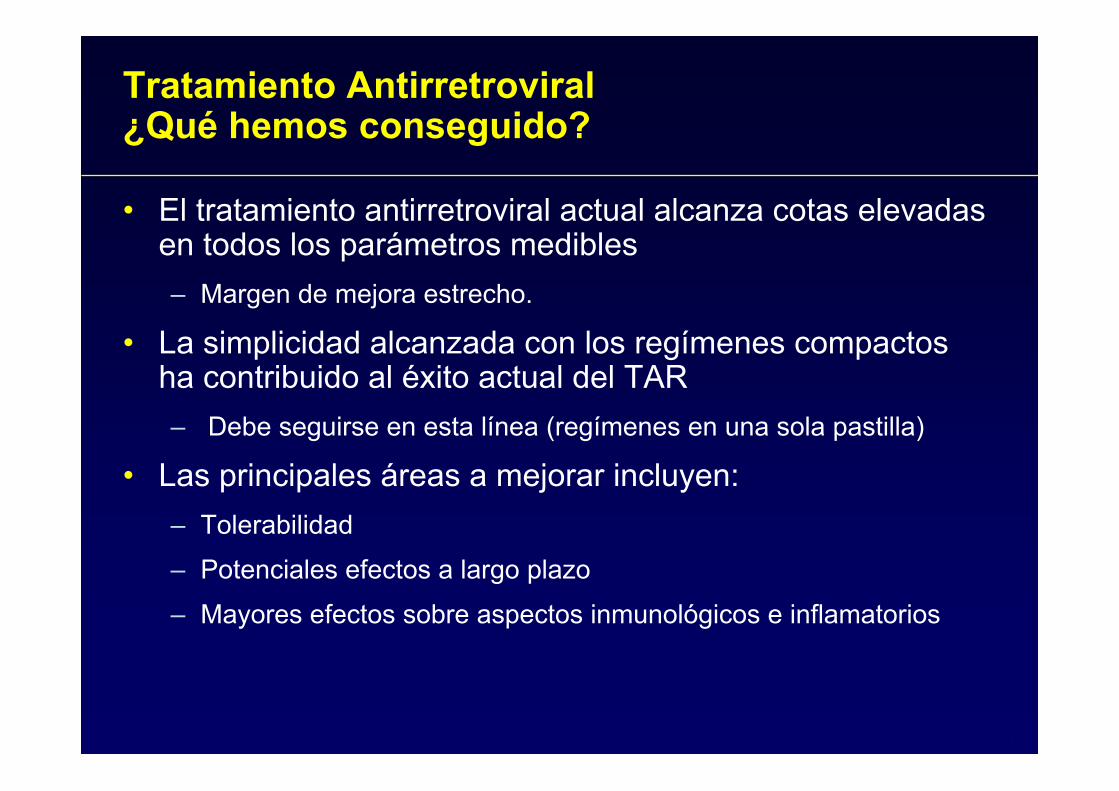
• El tratamiento antirretroviral actual alcanza cotas elevadas en todos los parámetros medibles– Margen de mejora estrecho.
• La simplicidad alcanzada con los regímenes compactos ha contribuido al éxito actual del TAR– Debe seguirse en esta línea (regímenes en una sola pastilla)
• Las principales áreas a mejorar incluyen:– Tolerabilidad
– Potenciales efectos a largo plazo
– Mayores efectos sobre aspectos inmunológicos e inflamatorios
Maggiolo F et al. HIV9, November 2008, Glasgow. Poster# P-167. ATRIPLA® is not indicated for treatment-naïve patients in the EU
Tratamiento Antirretroviral ¿Qué hemos conseguido?

Nuevos Fármacos. Nuevas Coformulaciones.
• Análogos de Nucleósidos– Profármaco de Tenofovir
• No Análogos de Nucleósidos– Rilpivirina
• Inhibidores de la Integrasa– Elvitegravir– Dolutegravir

Nuevos Fármacos. Nuevas Coformulaciones.
• Análogos de Nucleósidos– Profármaco de Tenofovir
• No Análogos de Nucleósidos– Rilpivirina
• Inhibidores de la Integrasa– Elvitegravir– Dolutegravir

STaRStudy Design
Multicenter, international, randomized, open-label, Phase 3b, 96-week study
RPV/FTC/TDFSTR
EFV/FTC/TDFSTR
ARV-naiveHIV-1 RNA >2500 c/mL
Sensitivity to EFV, FTC, RPV, TDF(N=786)
Stratified by HIV RNA (≤ or >100,000 c/mL)
n=394
n=392
96 Weeks
Primary endpoint: Efficacy of the 2 STRs by proportion with HIV-1 RNA <50 c/mL atWeek 48 (FDA Snapshot analysis); non-inferiority margin of 12%
Secondary endpoints: Safety and efficacy of the 2 STRs by proportion withHIV-1 RNA <50 c/mL at Week 96 (FDA Snapshot analysis)
Change in CD4 cell count at Weeks 48 and 96Genotype/phenotype resistance at time of virologic failure
48 WeeksPrimary Endpoint
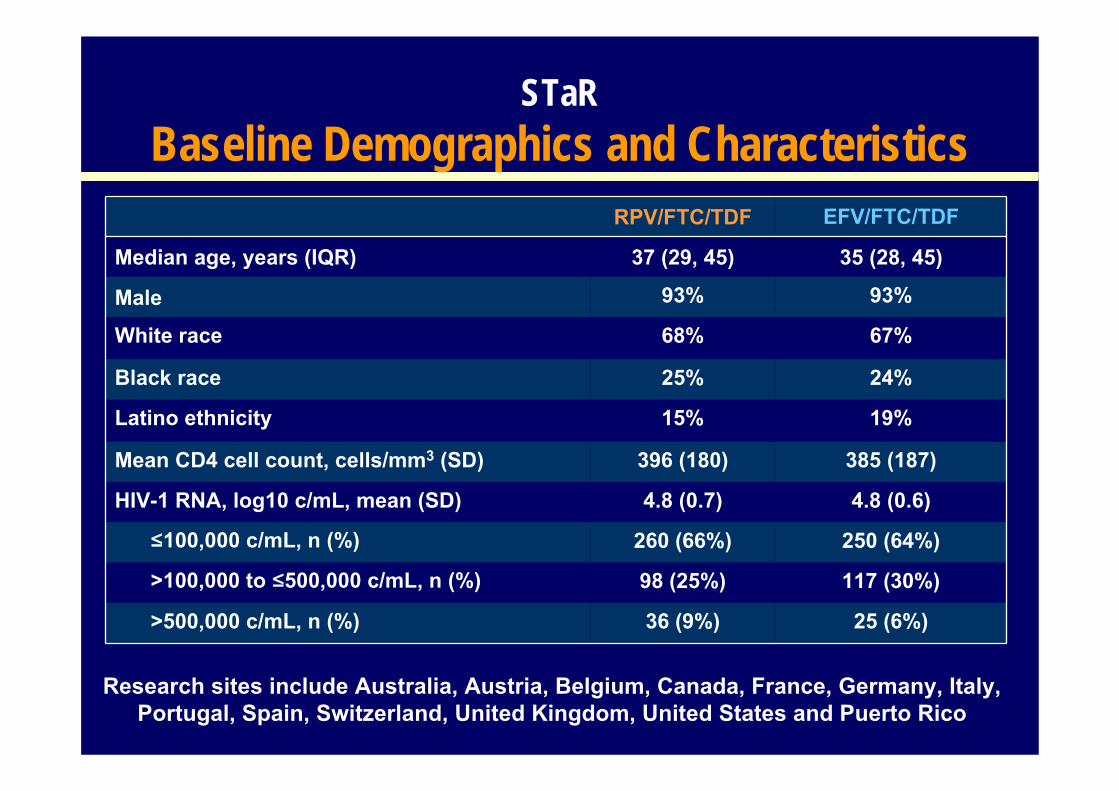
STaRBaseline Demographics and Characteristics
RPV/FTC/TDF EFV/FTC/TDF
Median age, years (IQR) 37 (29, 45) 35 (28, 45)
Male 93% 93%
White race 68% 67%
Black race 25% 24%
Latino ethnicity 15% 19%
Mean CD4 cell count, cells/mm3 (SD) 396 (180) 385 (187)
HIV-1 RNA, log10 c/mL, mean (SD) 4.8 (0.7) 4.8 (0.6)
≤100,000 c/mL, n (%) 260 (66%) 250 (64%)
>100,000 to ≤500,000 c/mL, n (%) 98 (25%) 117 (30%)
>500,000 c/mL, n (%) 36 (9%) 25 (6%)
Research sites include Australia, Austria, Belgium, Canada, France, Germany, Italy, Portugal, Spain, Switzerland, United Kingdom, United States and Puerto Rico

95% CI for Difference86
8 6
82
613
0102030405060708090
100
VirologicSuppression
Virologic Failure No W48 Data
Prop
ortio
n of
Sub
ject
s, %
4.1-1.1 9.2
-12 0 12
FavorsEFV/FTC/TDF
FavorsRPV/FTC/TDF
% %
RPVFTC//TDF is non-inferior to EFV/FTC/TDF
STaRVirologic Suppression and CD4 Change at Week 48
FDA Snapshot Analysis – ITT Population
■ RPV/FTC/TDF
■ EFV/FTC/TDF
(HIV-1 RNA <50 c/mL)
CD4 count change (cells/mm3): RPV/FTC/TDF +200 vs EFV/FTC/TDF +191 (p=0.34)
338/394
320/392 32/394 22/392 24/394 50/392
p=0.12

STaRVirologic Suppression at Week 48 FDA Snapshot Analysis by
Baseline HIV-1 RNA Stratified by 100,000 c/mL
95% CI for Difference
FavorsEFV/FTC/TDF
< 100K
> 100K
FavorsRPV/FTC/TDF
-12 0 +12
1.1 13.4
-1.8-11.1 7.5
7.2
◙
◙
RPV/FTC/TDF compared to EFV/FTC/TDFSuperior for subjects with baseline HIV-1 RNA <100,000 c/mL
Non-inferior for subjects with baseline HIV-1 RNA >100,000 c/mL
898082 82
0
20
40
60
80
100
<100K >100K
HIV
-1 R
NA
<50
c/m
L (%
)
RPV/FTC/TDF EFV/FTC/TDF
Baseline HIV-1 RNA copies/mL
231/260 204/250 107/134 116/142p=0.70
p=0.02

STaRVirologic Suppression at Week 48 FDA Snapshot
Analysis by Baseline HIV-1 RNA
8983
7282 82 80
0
20
40
60
80
100
≤100K >100 - 500K >500K
HIV
-1 R
NA
< 50
c/m
L (%
)
RPV/FTC/TDF EFV/FTC/TDF
204/250
81/98
96/117
26/36
20/25
* Post hoc analyses; analyses for non-inferiority only pre-specified for ≤100,000 c/mL and >100,000 c/mL
*
231/260
Baseline HIV-1 RNA copies/mL
*

STaR & ECHO/THRIVE& ECHO/THRIVEVirologic Failure at Week 48 per FDA Snapshot
Overall and by Baseline HIV-1 RNA
Baseline HIV-1 RNA copies/mL
ECHO/THRIVETVD Subsets*
*COMPLERA Prescribing Information. Gilead Sciences Inc. 2011.
135
2030
83
1118
0102030405060708090
100
Overall ≤100K >100-500K >500K
Viro
logi
c Fa
ilure
(%)
STaR
8 56 3
RPV/FTC/TDF
EFV/FTC/TDF
RPV+FTC/TDF
EFV+FTC/TDF
ECHO/THRIVE: Two Phase III double-blinded, double dummy, mulitcenter 96 week studies in treatment-naïve HIV-1 infected subjects randomized to receive either RPV (25mg) or EFV (600mg) in combination with 2 NRTIs (ECHO, FTC/TDF; THRIVE, Investigator’s choice [FTC/TDF, n=406; 3TC/AZT, n=204; 3TC/ABC, n=68]). In the pooled TVD subset analysis (N=1096), RPV+TVD was non-inferior to EFV+TVD (HIV-1 RNA <50 c/mL [83%, 81%])

STaR & ECHO/THRIVE& ECHO/THRIVEVirologic Failure at Week 48 per FDA Snapshot
Overall and by Baseline HIV-1 RNA
Baseline HIV-1 RNA copies/mL
ECHO/THRIVETVD Subsets*
*COMPLERA Prescribing Information. Gilead Sciences Inc. 2011.
135
2030
83
1118
0102030405060708090
100
Overall ≤100K >100-500K >500K
Viro
logi
c Fa
ilure
(%)
STaR
8 5 106 39
RPV/FTC/TDF
EFV/FTC/TDF
RPV+FTC/TDF
EFV+FTC/TDF
ECHO/THRIVE: Two Phase III double-blinded, double dummy, mulitcenter 96 week studies in treatment-naïve HIV-1 infected subjects randomized to receive either RPV (25mg) or EFV (600mg) in combination with 2 NRTIs (ECHO, FTC/TDF; THRIVE, Investigator’s choice [FTC/TDF, n=406; 3TC/AZT, n=204; 3TC/ABC, n=68]). In the pooled TVD subset analysis (N=1096), RPV+TVD was non-inferior to EFV+TVD (HIV-1 RNA <50 c/mL [83%, 81%])

STaR & ECHO/THRIVE& ECHO/THRIVEVirologic Failure at Week 48 per FDA Snapshot
Overall and by Baseline HIV-1 RNA
Baseline HIV-1 RNA copies/mL
ECHO/THRIVETVD Subsets*
*COMPLERA Prescribing Information. Gilead Sciences Inc. 2011.
135
2030
83
1118
0102030405060708090
100
Overall ≤100K >100-500K >500K
Viro
logi
c Fa
ilure
(%)
STaR
8 5 10
25
6 39
16
RPV/FTC/TDF
EFV/FTC/TDF
RPV+FTC/TDF
EFV+FTC/TDF
ECHO/THRIVE: Two Phase III double-blinded, double dummy, mulitcenter 96 week studies in treatment-naïve HIV-1 infected subjects randomized to receive either RPV (25mg) or EFV (600mg) in combination with 2 NRTIs (ECHO, FTC/TDF; THRIVE, Investigator’s choice [FTC/TDF, n=406; 3TC/AZT, n=204; 3TC/ABC, n=68]). In the pooled TVD subset analysis (N=1096), RPV+TVD was non-inferior to EFV+TVD (HIV-1 RNA <50 c/mL [83%, 81%])

STaR vs ECHO and THRIVEResistance Analysis Through Week 48
RPV/FTC/TDF(n=394)
EFV/FTC/TDF(n=392)
RPV+FTC/TDF(n=550)
EFV+FTC/TDF(n=546)
Subjects with Resistance Data 11% 3%Subjects with Resistance to ARVs 7% 2%Any Primary NNRTI-R 6% 2%Key NNRTI-R E138K/Q (4%) K103N (1%)
Y181C/I (1%)K101E (1%)
Any Primary NRTI-R 7% 1%Key NRTI-R M184V/I(6%) M184V/I (1%)
K65R/N (1%) K65R/N (0.4%)Within Baseline (BL) HIV-1 RNA≤100,000 copies/mL at BL 2% 1%>100,000–500,000 copies/mL at BL 9% 2%>500,000 copies/mL at BL 21% 7%
STaR* ECHO/THRIVE TVD Subset†
*Subjects who experienced suboptimal virologic response (HIV-1 RNA ≥50 c/mL and <1 log10 below BL at W8 and confirmed at subsequent visit), virologic rebound (2 consecutive visits with HIV-1 RNA either ≥400 c/mL after achieving HIV-1 RNA <50 c/mL, or >1 log10 increase from nadir), or had HIV-1 RNA ≥400 c/mL at W48 or their last visit (at or after W8)‡ Subjects who were either never suppressed (never having achieved 2 consecutive VL values <50 c/mL and having an increase in HIV-1 RNA ≥0.5 log10 c/mL above the nadir) or virologic rebound (first achieving two consecutive HIV-1 RNA values <50 c/mL and having 2 consecutive, or single when last available, HIV-1 RNA values ≥50 c/mL). Rimsky et al (2012) JAIDS

STaR vs ECHO and THRIVEResistance Analysis Through Week 48
RPV/FTC/TDF(n=394)
EFV/FTC/TDF(n=392)
RPV+FTC/TDF(n=550)
EFV+FTC/TDF(n=546)
Subjects with Resistance Data 5% 2% 11% 3%Subjects with Resistance to ARVs 4% 1% 7% 2%Any Primary NNRTI-R 4% 1% 6% 2%Key NNRTI-R E138K/Q (2%) K103N (0.3%) E138K/Q (4%) K103N (1%)
Y181C/I (2%) Y181C/I (1%)K101E (1%) K101E (1%)
Any Primary NRTI-R 4% 0.3% 7% 1%Key NRTI-R M184V/I (4%) M184I (0.3%) M184V/I(6%) M184V/I (1%)
K65R/N (1%) K65R/N (1%) K65R/N (0.4%)Within Baseline (BL) HIV-1 RNA≤100,000 copies/mL at BL 2% 1% 2% 1%>100,000–500,000 copies/mL at BL 5% 0 9% 2%>500,000 copies/mL at BL 19% 4% 21% 7%
STaR* ECHO/THRIVE TVD Subset†
The STRs used in STaR, compared to the STR components used in ECHO and THRIVE, demonstrated less emergent resistance
*Subjects who experienced suboptimal virologic response (HIV-1 RNA ≥50 c/mL and <1 log10 below BL at W8 and confirmed at subsequent visit), virologic rebound (2 consecutive visits with HIV-1 RNA either ≥400 c/mL after achieving HIV-1 RNA <50 c/mL, or >1 log10 increase from nadir), or had HIV-1 RNA ≥400 c/mL at W48 or their last visit (at or after W8)† Subjects who were either never suppressed (never having achieved 2 consecutive VL values <50 c/mL and having an increase in HIV-1 RNA ≥0.5 log10 c/mL above the nadir) or virologic rebound (first achieving two consecutive HIV-1 RNA values <50 c/mL and having 2 consecutive, or single when last available, HIV-1 RNA values ≥50 c/mL). Rimsky et al (2012) JAIDS

STaRAll Grades Treatment-Emergent Pre-specified
Adverse Events* Through Week 48
Psychiatric Events, n (%) 62 (16%) 147 (38%) p< 0.001Events >5% of subjects†, either arm
Abnormal Dreams 23 (6%) 96 (25%)
Depression 26 (7%) 35 (9%)Anxiety, nervousness 20 (5%) 34 (9%)
*prespecified evaluation for common adverse events, US Efavirenz Prescribing Information† 1 (0.3%) suicide occurred in the EFV/FTC/TDF arm, day 36 of study
RPV/FTC/TDF(n=394)
EFV/FTC/TDF(n=392)
Nervous System Events, n (%) 117 (30%) 198 (51%) p< 0.001
Events >5% of subjects, either armDizziness, vertigo, balance disorder 30 (8%) 100 (26%)
Insomnia 38 (10%) 55 (14%)
Somnolence 10 (3%) 27 (7%)
Headache 49 (12%) 53 (14%)

STaRAdverse Events Leading to Discontinuation
of Study Drug Through Week 48RPV/FTC/TDF
(n=394)EFV/FTC/TDF
(n=392)Discontinuations* Due to Adverse Event (AE),
n (%) 10 (2.5%) 34 (8.7%) P<0.001
*per safety population
AE leading to discontinuation in >1 subject in either arm
Nervous System EventsDizziness 0Abnormal Dreams or Nightmare 0Insomnia 1 (0.3%)
Psychiatric DisordersDepression, Anxiety or Depressed Mood 0Suicidal Ideation 0
GI, General, Skin DisordersDiarrhea 0 Fatigue 0Pyrexia 0Toxic Skin Eruption 0
5 (1.3%)6 (1.5%)3 (0.8%)
9 (2.3%)2 (0.5%)
2 (0.5%)2 (0.5%)2 (0.5%)2 (0.5%)

STaRChanges from Baseline Through Week 48
in Fasting LipidsM
ean
Cha
nges
from
BL,
mm
ol/L
(mg/
dL)
0,03 0,03
-0,09
0,05
0,57
0,36
0,09
0,21
0,12
0,02
0,08
0,18
0,28
0,38
0,48
0,58
TC LDL TG HDL
TC - total cholesterol, LDL - low-density lipoprotein, TG - triglycerides, HDL - high-density lipoprotein
■ RPV/FTC/TDF
■ EFV/FTC/TDF
p<0.001 for all the above comparisons between treatment groups using ANOVA
Change in TC:HDL at Week 48 was -0.2 in both arms
4.24 4.22 2.69 2.66 1.37 1.46 1.14 1.14Mean Baseline Values, mmol/L
(+22)
(+2)
(+14)
(+8)
(+8)
(-8)(+1) (+1)
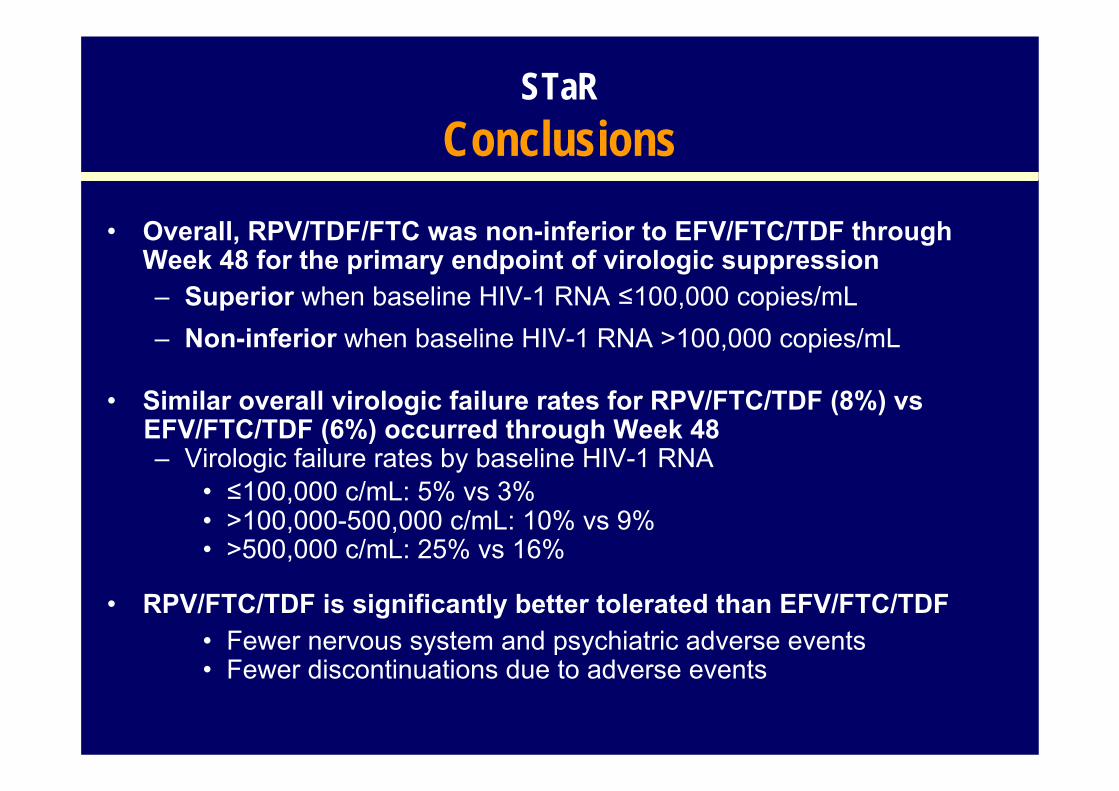
• Overall, RPV/TDF/FTC was non-inferior to EFV/FTC/TDF through Week 48 for the primary endpoint of virologic suppression– Superior when baseline HIV-1 RNA ≤100,000 copies/mL – Non-inferior when baseline HIV-1 RNA >100,000 copies/mL
• Similar overall virologic failure rates for RPV/FTC/TDF (8%) vsEFV/FTC/TDF (6%) occurred through Week 48– Virologic failure rates by baseline HIV-1 RNA
• ≤100,000 c/mL: 5% vs 3%• >100,000-500,000 c/mL: 10% vs 9%• >500,000 c/mL: 25% vs 16%
• RPV/FTC/TDF is significantly better tolerated than EFV/FTC/TDF• Fewer nervous system and psychiatric adverse events• Fewer discontinuations due to adverse events
STaRConclusions

SPIRIT: Switching to Emtricitibine/Rilpivirine/Tenofovir DF Single-Tablet Regimen from Boosted
Protease Inhibitor Maintains HIV Suppression through Week 48
Martin Fisher, Frank Pallela, Pablo Tebas, Brian Gazzard, Peter Ruane, Jan van Lunzen, David Shamblaw, Jason Flamm, Ramin Ebrahimi, Kirsten
White, Bill Guyer, Danielle Porter, Todd Fralich
Eleventh International Congress on Drug Therapy in HIV InfectionGlasgow, ScotlandNovember 14, 2012
GS-US-264-0106 NCT01252940Poster P285

Primary Endpoint: Non-inferiority (12% margin) of RPV/FTC/TDF to PI+RTV+2 NRTIs by FDAsnapshot analysis HIV-1 RNA <50 copies/mL at 24 weeks1
Secondary Endpoints: Proportion of subjects on RPV/FTC/TDF who have HIV1 RNA <50 copies/mLat Week 48
Change in fasting lipid parameters and CD4 cell count at 241,2 and 48 weeksSafety and tolerability to PI+RTV+2NRTIs at 241 and 48 weeksProportion of subjects who have HIV1 RNA <50 copies/mL (missing =excluded) through Week 48
SPIRITStudy Design
RPV/FTC/TDF STR
24 weeks 48 weeksPrimary Endpoint Secondary Endpoint
n=317
n=159PI + RTV +2 NRTIs
Switching boosted PI to Rilpivirine In-combination with Truvada as an STRMulticenter, international, randomized, open-label, Phase 3b, 48-week study
2:1
1. Palella F, et al. IAC 2012; Washington, DC. Oral TUAB01042. Tebas P, et al. LIPO 2012; Washington, DC. #018
• Stable PI + RTV + 2 NRTI ≥ 6 months with VL <50 c/mL
• On 1st or 2nd regimen• No prior NNRTI use• No known resistance to study
agents
(N=476)
RPV/FTC/TDF STR
RPV/FTC/TDF STR

Switching to RPV/FTC/TDF was non-inferior* to remaining on PI+RTV+2NRTIs for 24 weeks (delta 3.8, CI [-1.6, 9.1]). Similar rates of virologic suppression were also seen with 48 weeks of
treatment with RPV/FTC/TDF
SPIRIT Virologic Suppression at Weeks 24 and 48 FDA Snapshot Analysis – ITT Population
2,58,2
89,3
0
10
20
30
40
50
60
70
80
90
100
VirologicSuppression
Virologic Failure No Data
RPV/FTC/TDF (immediate switch, Day 1 to W48)
CD4 count change (cells/mm3): Week 24, RPV/FTC/TDF immediate switch +20, PI+RTV+2NRTIs +32,RPV/FTC/TDF delayed switch -7. Week 48, RPV/FTC/TDF immediate switch +10
Pro
porti
on o
f Sub
ject
s, %
(HIV-1 RNA <50 c/mL)
RPV/FTC/TDF (immediate switch, Day 1 to W24)
PI+RTV+2NRTIs (delayed, Day 1 to W24)
0.9 5.4
RPV/FTC/TDF (delayed switch, W24 to W48)
92.1
1.36.65 5
93.789.9
0102030405060708090
100
Virologic Suppression Virologic Failure
No Data
FDA Snapshot at 24 Weeks FDA Snapshot at 48 Weeks
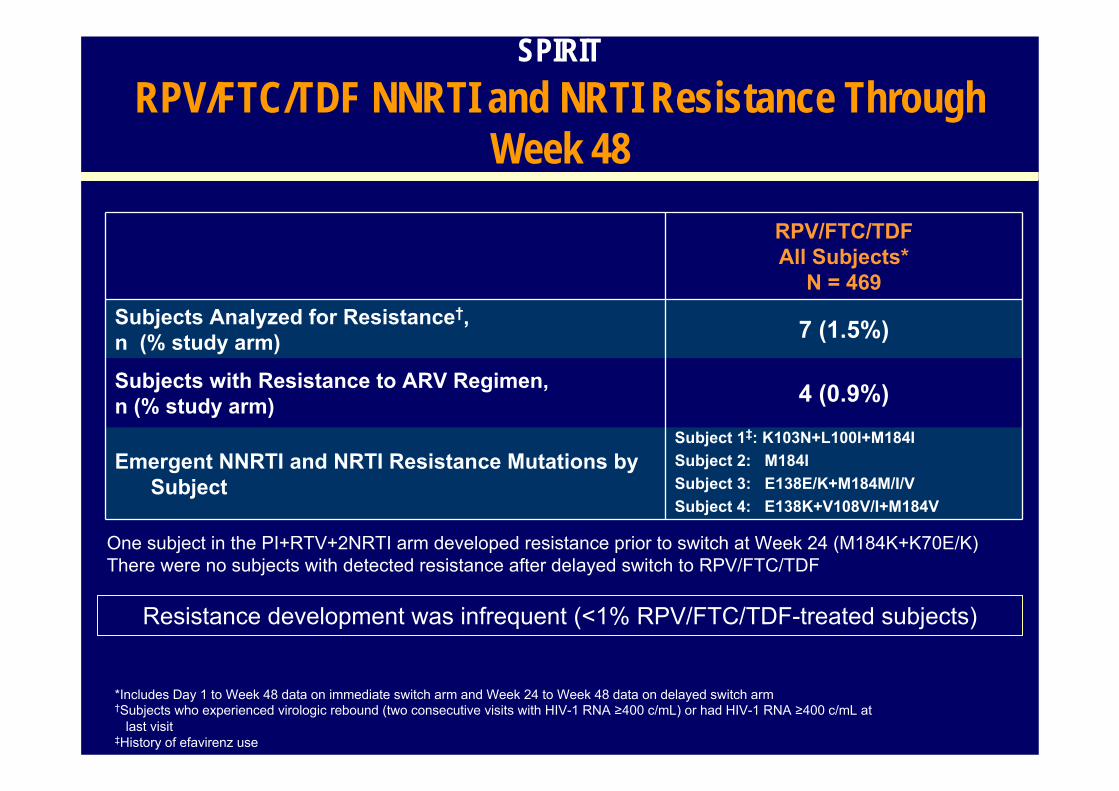
SPIRITRPV/FTC/TDF NNRTI and NRTI Resistance Through
Week 48RPV/FTC/TDFAll Subjects*
N = 469Subjects Analyzed for Resistance†, n (% study arm) 7 (1.5%)
Subjects with Resistance to ARV Regimen,n (% study arm) 4 (0.9%)
Emergent NNRTI and NRTI Resistance Mutations by Subject
Subject 1‡: K103N+L100I+M184ISubject 2: M184ISubject 3: E138E/K+M184M/I/VSubject 4: E138K+V108V/I+M184V
*Includes Day 1 to Week 48 data on immediate switch arm and Week 24 to Week 48 data on delayed switch arm†Subjects who experienced virologic rebound (two consecutive visits with HIV-1 RNA ≥400 c/mL) or had HIV-1 RNA ≥400 c/mL at
last visit‡History of efavirenz use
Resistance development was infrequent (<1% RPV/FTC/TDF-treated subjects)
One subject in the PI+RTV+2NRTI arm developed resistance prior to switch at Week 24 (M184K+K70E/K)There were no subjects with detected resistance after delayed switch to RPV/FTC/TDF

RPV/FTC/TDF(Immediate,D1 to W24)
N = 317
RPV/FTC/TDF(Delayed,
W24 to W48)N = 152
RPV/FTC/TDF(Immediate,D1 to W48)
N = 317
RPV/FTC/TDF (Total,
D1 to W48)N = 469
Subjects with Pre-existing K103N, n 18 6 18 24
Snapshot Outcome, n
Virologic Suppression 18 5 17 22
Virologic Failure 0 0 1a 1a
No Data in Window 0 1b 0 1b
SPIRITTreatment Response Among RPV/FTC/TDF-Treated
Subjects with Pre-Existing K103N
RPV/FTC/TDF-treated subjects with pre-existing K103N had a high response rate
a Failed with resistance, pre-existing K103N and V179I and acquired M184V, E138K, and V108V/I while on study drug b Missing data during window but on study drug, suppressed at prior visit

SPIRITChanges from Baseline in Fasting Lipids
Mea
n C
hang
es fr
om B
L, m
mol
/L (m
g/dL
)
TC LDL TG HDL
TC - total cholesterol, LDL - low-density lipoprotein, TG - triglycerides, HDL - high-density lipoprotein
Switching to RPV/FTC/TDF resulted in improvement in fasting lipids, including TC, LDL, TGs, and TC:HDL ratio at Week 24 and maintained through Week 48
RPV/FTC/TDF (immediate, D1-W24)PI+RTV+2NRTIs (D1-W24)RPV/FTC/TDF (delayed, W24-W48)RPV/FTC/TDF (immediate, D1-W48)
(-25)
(-1)
(-25) (-24)
(-16)(-14)
(-16)
(-53)
(3)
(-80)
(-64)
(-4)(-1) (-2) (-2)
Cha
nge
in T
C:H
DL
ratio
-0.27
.08
-0.21
-0.35
0
0.1
-0.1
-0.2
-0.3
-0.4
0
-0.03
-0.41
-0.05-0.1
-.60
-.41
-.65
-.03
.03
-0.05
-.90
-.36
-.65-.72
-.62
-0.9-0.8-0.7-0.6-0.5-0.4-0.3-0.2-0.1
0
-

SPIRITGrade 3 or 4 Adverse Events and
Laboratory AbnormalitiesRPV/FTC/TDF
N = 317(Immediate
switch, at W48)
PI+RTV+2NRTIsN = 159(at W24)
RPV/FTC/TDFN = 152
(Delayed switch,at W24)
Grade 3 or 4 Adverse Events 18 (5.7%) 11 (6.9%) 12* (7.9%)
Grade 3 or 4 Laboratory Abnormalities 28† (8.8%) 18‡ (11.3%) 23§ (15.2%)
Adverse events and laboratory abnormalities occurring in ≥1% of subjects:*creatine kinase increase†ALT, AST, creatine kinase, hematuria‡ AST, bilirubin, creatine kinase, triglycerides§ ALT, AST, creatine kinase, glycosuria

• Through 24 weeks, switching to RPV/FTC/TDF was non-inferior to remaining on PI+RTV+2NRTIs (93.7% versus 89.9%)
– In the delayed switch arm, virologic suppression was maintained through 24 weeks with RPV/FTC/TDF (92.1%)
– In the immediate switch arm, virologic suppression was maintained through 48 weeks after switching to RPV/FTC/TDF (89.3%)
• Lower rate of virologic failure observed in subjects switching to RPV/FTC/TDF (0.9%) compared to remaining on PI+RTV+2NRTIs (5.0%) at Week 24
– Low rate of virologic failure (1.3%) was also seen in the delayed switch arm – At 48 weeks, RPV/FTC/TDF maintained a low rate (2.5%) of virologic failure
• Resistance development was infrequent with switching to RPV/FTC/TDF
• Switching to RPV/FTC/TDF resulted in improvement in fasting lipids, including TC, LDL, TGs, and TC:HDL ratio at Week 24 and is maintained through Week 48
SPIRITConclusions

GS‐264‐112: Food Effect Study Effect of food on the PK of FTC/RPV/TDF STRStudy treatments
Single dose of the FTC/RPV/TDF STR with standard meal (540 kcal, 21 g fat)Single dose of the FTC/RPV/TDF STR under fasting conditionsSingle dose of the FTC/RPV/TDF STR with light meal (390 kcal, 12 g fat)
RPV Pharmacokinetics
Relative to fasting conditions, RPV exposures were modestly higher following light meal or standard meal RPV exposures were narrowly outside the lack of food effect bounds for the light meal versus standard meal comparison
Administration of FTC/RPV/TDF with a light meal or standard meal results in a modest increase in RPV and TFV exposures versus fasting conditions
Ramanathan, et al. HIV‐11 2012; Glasgow. Poster
0 6 12 18 240
50
100
150
48 96 144 192
Fasted ConditionsLight Meal (390 kcal, 12 g fat)
Standard Meal (540 kcal, 21 g fat)
Mean (SD)Time (h)
RPV Con
cent
ration (n
g/mL)
28

Nuevos Fármacos. Nuevas Coformulaciones.
• Análogos de Nucleósidos– Profármaco de Tenofovir
• No Análogos de Nucleósidos– Rilpivirina
• Inhibidores de la Integrasa– Elvitegravir– Dolutegravir

30
Elvitegravir/Cobicistat/Emtricitabine/Tenofovir DF (STB) Has Durable
Efficacy and Differentiated Safety Compared to Atazanavir Boosted by
Ritonavir Plus Emtricitabine/Tenofovir DF in Treatment-naive HIV-1 Infected
Patients: Week 96 Results
Rockstroh JK, DeJesus E, Henry K et al.
HIV11 2012Oral presentation O424 B

Treatment naive.• HIV-1 RNA ≥ 5000 c/mL• Any CD4 cell count• eGFR ≥70 mL/min
• Randomized 1:1• Stratification by
HIV-1 RNA (≤ vs >100,000 c/mL)
week 48 week 96
Study 103: Phase III treatment naive, EVG/COBI/FTC/TDF vs ATV/r + FTC/TDF
Primary endpoint: HIV-1 RNA <50 c/mL b by snapshot analysis (ITT)
Non-inferiority margin (wk 48): 12%
31
* EVG/COBITDF/FTC fixed dose combination (FDC) is an investigational compound, currently not approved for HIV treatment
Secondary endpoint
EVG/COBI/FTC/TDF (STB) QDATV/r + FTC/TDF Placebo QD
ATV/r + FTC/TDF QDSTB Placebo QD
Rockstroh, et al. HIV11 2012, oral presentation O424B
(n = 350)
(n = 350)
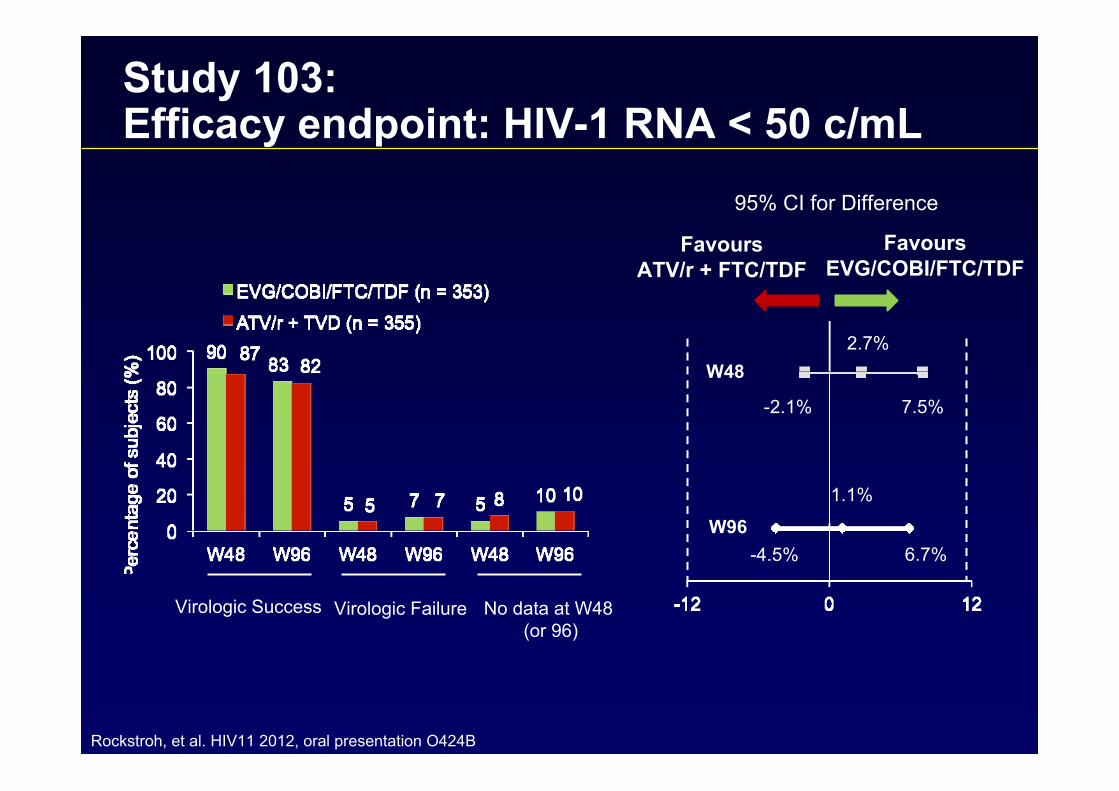
Study 103:Efficacy endpoint: HIV-1 RNA < 50 c/mL
Virologic Success Virologic Failure No data at W48 (or 96)
-4.5%
1.1%
6.7%
-2.1%
2.7%
7.5%
W48
W96
95% CI for Difference
FavoursATV/r + FTC/TDF
FavoursEVG/COBI/FTC/TDF
Rockstroh, et al. HIV11 2012, oral presentation O424B

Study 103: Efficacy by baseline HIV-1 RNA and CD4 subgroups
*Virologic success (HIV-1 RNA < 50 copies/mL) as defined by FDA Snapshot algorithm^p-value for the homogeneity test was based on the Wald test of the interaction between treatment and subgroup
p = 0.85 ^ p = 0.62 ^
HIV-1 RNA (c/mL) CD4 (cells/μL)
171/203
123/150
150/177
144/176
179/214
113/141
158/192
134/163
Rockstroh, et al. HIV11 2012, oral presentation O424B

Study 103: HIV-1 RNA < 50 c/mL through week 96 (M=F)
100
90
80
70
60
5040
3020
100
0 24 48 72 96
Week
Sub
ject
s w
ith H
IV-1
RN
A <
50
c/m
L (%
) 92%
88% 85%
87%
(p = 0.15) (p = 0.60)
EVG/COBI/FTC/TDF (n = 353)
ATV/r + FTC/TDF (n = 355)
Rockstroh, et al. HIV11 2012, oral presentation O424B

Study 103: Integrase, PI, NRTI resistance through week 96
EVG/COBI/FTC/TDF (n = 353)
ATV/r + FTC/TDF (n = 355)
W48 W96 W48 W96Emergent resistance, n (%)
5 (1%) +1 (+0.3%)
0 0
Primary INSTI-R or PI-R, n (%)
E92QN155HQ148R
T66I
4 (1%)
1221
+1 (0.3%)
+1000
I50LI84VN88S
0
000
0
000
Primary NRTI-R, n (%)
M184V/IK65R
4 (1%)
41
+1 (+0%)
+10
M184V/IK65R
0
00
0
00
Rockstroh, et al. HIV11 2012, oral presentation O424B

Study 103:Adverse events leading to study drug DC
EVG/COBI/FTC/TDF(n = 353)
ATV/r + FTC/TDF (n = 355)
Overall DC rateW48 W96
14%(n = 49)
W48 W9615%
(n = 55)AE Leading to Study Drug DC* 4%
(n = 15)6%
(n = 21)DiarrhoeaPyrexiaNauseaVomitingFatigueOcular IcterusJaundiceRenal eventsDizzinessDrug eruption
0.6%0.6%0.3%0.3%0.3%
00
0.6%00
0000000
+0.3%00
0.3%0
1.1%0.6%0.6%1.1%0.6%0.3%0.6%0.6%
0000000
+0.3%00
* > 1 subject in either treatment group cumulatively at Week 96Rockstroh, et al. HIV11 2012, oral presentation O424B

EVG/COBI/FTC/TDF20
10
0
-10
-20
-30
-40
Study 103: Changes in eGFR from baseline and from week 4
0 24 48 72 96
20
10
0
-10
-20
-30
-400 24 48 72 96
WeekWeek
-9.5
-12.3
-9.5
-12.7
-1.8-4.4-4.2
-2.0
Change from BL in eGFR (mL/min) (Median [IQR])
Change from Wk 4 in eGFR (mL/min) (Median [IQR])
ATV/r + FTC/TDF
Rockstroh, et al. HIV11 2012, oral presentation O424B

Study 103: Changes in fasting lipids
No difference in change in TC to HDL ratio at Week 48 or 96
EVG/COBI/FTC/TDF
ATV/r + FTC/TDF
25
20
15
10
5
0
0.6
0.4
0.2
0.0
Total Cholesterol
LDL HDL
p = 0.048 p = 0.32 p = 0.24
Med
ian
Cha
nge
at W
k96
(mg/
dL)
(mm
ol/L)
25
20
15
10
5
0
0.25
0.20
0.10
0.00
Triglycerides
p = 0.012
Med
ian
Cha
nge
at W
k96
(mg/
dL)
(mm
ol/L)
0.05
0.15
Rockstroh, et al. HIV11 2012, oral presentation O424B

Study 103:Conclusions
• Robust and durable efficacy of EVG/COBI/FTC/TDF at Week 96– Comparable to ATV/r + FTC/TDF– Consistent across a broad range of baseline
characteristics including HIV-1 RNA and CD4 cells• Low rates of resistance • EVG/COBI/FTC/TDF was well-tolerated
– Similar and low rates of treatment discontinuation– Early small increase in serum creatinine remained
unchanged after Week 24– One new renal discontinuation after Week 48
Rockstroh, et al. HIV11 2012, oral presentation O424B

XIX International AIDS ConferenceJuly 22-27, 2012; Washington, DC
Shionogi–ViiV Healthcare LLC
Francois Raffi1, Anita Rachlis2, Hans-Jürgen Stellbrink3, David Hardy4, Carlo Torti5, Chloe Orkin6, Mark Bloch7, Daniel Podzamczer8, Vadim Pokrovsky9, Steve Almond10, David Margolis11, and Sherene Min11 on behalf of the extended SPRING-2 study team1University of Nantes, Nantes, France, 2Sunnybrook & Women's College Health Sciences Centre, Toronto, Canada, 3IPM Study Center, Hamburg, Germany, 4Cedars-Sinai Medical Center, Los Angeles, United States, 5Azienda Ospedaliera Spedali Civili, Brescia, Italy, 6Royal London Hospital, London, United Kingdom, 7Holdsworth House Medical Practice, Darlinghurst, Australia, 8Hospital Universitari de Bellvitge, Barcelona, Spain, 9Russian Federal Guidance Centre of AIDS, Moscow, Russian Federation, 10GlaxoSmithKline, Mississauga, Canada, 11GlaxoSmithKline, Research Triangle Park, United States
Once-daily Dolutegravir (DTG; S/GSK1349572) is Non-inferior to Raltegravir (RAL) in Antiretroviral-naive Adults. 48 Week Results from SPRING-2 (ING113086)

11th International Congress on Drug Therapy in HIV InfectionNovember 11-15, 2012; Glasgow, UK
● Phase III, randomized, double-blind, double-placebo, multicenter, parallel-group, non-inferiority study, ART-naive patients
● All arms include 2 NRTI backbone given once daily (ABC/3TC or TDF/FTC)● Primary endpoint: % <50 c/mL at 48 weeks (“snapshot”) , non-inferiority
margin 10%
SPRING-2 (ING113086) Study Design
HIV ART-naiveHIV-1 RNA ≥1000 c/mL
1:1 RandomizationStratified by VL
and NRTI DTG PBO QD + RAL 400 mg BID + 2 NRTIs*
DTG 50 mg QD+ RAL PBO BID + 2 NRTIs*
Nonrandomized phaseRandomized phase
Week 96Randomization Week 48
DTG 50 mg QD open-label + 2 NRTIs
*Investigator’s selection ABC/3TC or TDF/FTC

11th International Congress on Drug Therapy in HIV InfectionNovember 11-15, 2012; Glasgow, UK
DTG 50 mg QDn=411
RAL 400 mg BIDn=411
Age Median (y) 37 35
Gender Male 85% 86%
Race White 84% 86%African American/African heritage 12% 9%Other 4% 5%
Baseline HIV-1 RNA Median (log10 c/mL) 4.52 4.58>100,000 c/mL 28% 28%
Baseline CD4+ Median (cells/mm3) 359 362<200 cells/mm3 13% 12%
Hepatitis coinfection HBV 2% 2%HCV 10% 9%
Investigator-selected dual NRTIs
TDF/FTC 59% 60%ABC/3TC 41% 40%
Baseline Characteristics

11th International Congress on Drug Therapy in HIV InfectionNovember 11-15, 2012; Glasgow, UK
Virologic Success Over TimeDTG 88%
RAL 85%
100
90
80
70
60
50
40
30
20
10
0
BL W4 W8 W12 W16 W24 W32 W40 W48
Week
Prop
ortio
n <5
0 c/
mL
(%)
DTG 50 mg QD
RAL 400 mg BID
Median (IQR) Change From Baseline CD4+ Cell Count (cells/mm3)W4 W24 W48
DTG 50 mg QD 87 (26, 149) 183 (100, 295) 230 (128, 338)RAL 400 mg BID 88 (32, 163) 182 (94, 296) 230 (139, 354)

11th International Congress on Drug Therapy in HIV InfectionNovember 11-15, 2012; Glasgow, UK
● Amongst DTG-treated subjects, no integrase nor NRTI mutations were detected through Week 48
Protocol-Defined Virologic Failure (PDVF): Genotype
DTG 50 mg QDn=411
RAL 400 mg BIDn=411
Subjects with PDVF 20 (5%) 28 (7%)
IN genotypic results at BL and time of PDVF
8 18
INI-r mutations 0 1/18 (6%)a
PR/RT genotypic results at BL and time of PDVF
12 19
NRTI-r mutations 0 4/19 (21%)a,b,c,d
Mutations by subject in the RAL 400 mg BID arm:a T97T/A, E138E/D, V151V/I, N155H + A62A/V, K65K/R, K70K/E, M184Vb, c, d A62A/V (n=1), M184M/I (n=1), M184M/V (n=1)

11th International Congress on Drug Therapy in HIV InfectionNovember 11-15, 2012; Glasgow, UK
Renal Safety● No withdrawals due to renal events ● Small increase in creatinine due to blockade of Cr secretion1
● DTG does not affect actual glomerular filtration rate (GFR)1
1 Koteff J et al, 51st ICAAC, Sept 2011.
DTG 50 mg QD RAL 400 mg BIDCreatinine
Maximum emergent toxicity Grade 1/2 10 (2%) / 1 (<1%) 7 (2%) / 0Urine albumin/creatinine
Median change (IQR) from baseline (mg/mmol CR)
Week 48 0.00 (-0.30, 0.20) 0.00 (-0.20, 0.20)
Change in serum creatinine, Mean (+/- SD) 25
20
15
10
5
0
-5
Mea
n ch
ange
from
bas
elin
e of
cre
atin
ine
(μm
ol/L
)
2 4 8 12 16 24 32 40 48
10
0
-10
-20
30
Mea
n ch
ange
from
bas
elin
e (m
L/m
in)
BL 4 12 24 48
DTG 50 mg QDn=411
RAL 400 mg BIDn=411
Change in creatinine clearance, Mean (+/- SD)
Week Week
Baseline (ml/min): DTG: 125 vs. RAL: 128
+12.3
+4.7 -15.5
-5.4
Baseline (µmol/L): DTG: 74.7 vs. RAL: 75.2

XIX International AIDS ConferenceJuly 22-27, 2012; Washington, DC
Shionogi–ViiV Healthcare LLC
S. Walmsley1, A. Antela2, N. Clumeck3, D. Duiculescu4, A. Eberhard5, F. Gutiérrez6, L. Hocqueloux7, F. Maggiolo8, U. Sandkovsky9, C. Granier10, B. Wynne10, K. Pappa10
Dolutegravir (DTG; S/GSK1349572) + Abacavir/Lamivudine Once Daily Statistically Superior to Tenofovir/Emtricitabine/Efavirenz: 48-Week Results - SINGLE (ING114467)
1U Hlth. Network, Toronto, Canada, 2Hosp. Clinico U, Santiago de Compostela, Spain, 3Ctr Hosp USaint-Pierre, Brussels, Belgium, 4Infectious Tropical Diseases Hosp Dr. Victor Babes, Bucharest, Romania, 5MVZ KarlsplatzHIV Res/Clin Care Ctr, Munich, Germany, 6Hosp U de Elche, Alicante, Spain, 7Ctr Hosp Regional d’Orléans, Orléans, France, 8Antiviral Therapy Unit Ospedali Riuniti, Bergamo, Italy, 9U Nebraska Med Ctr, Omaha, NE, 10GlaxoSmithKline, RTP, NC.

11th International Congress on Drug Therapy in HIV InfectionNovember 11-15, 2012; Glasgow, UK
Study Design
Primary endpoint: Proportion with HIV-1 RNA <50 c/mL at Week 48, FDA snapshot analysis, -10% non-inferiority margin with pre-specified tests for superioritySecondary endpoints:Tolerability, long-term safety, immunologic, health outcome and viral resistance
HIV+ ART-naïveVL ≥1,000 c/mL
HLA-B*5701 negativeCreatinine clearance >50mL/min
Stratified by: Baseline plasma HIV-1 RNA and CD4 cell count Atripla QD + DTG plus ABC/3TC FDC Placebo
DTG 50mg plus ABC/3TC FDC QD+ Atripla (ATR) Placebo
Week 96Randomization Week 48Primary analysis
Walmsley S, et al. 52nd ICAAC. 9-12 Sept 2012. Abstract H-556b.

11th International Congress on Drug Therapy in HIV InfectionNovember 11-15, 2012; Glasgow, UK
Subject Disposition
12% Subjects Withdrawn (N=51)
Adverse eventSuspected HSR
10 (2%)2 (<1%)
Lack of efficacy(Virologic failure)
14 (3%)
Protocol deviation 7 (2%)
Lost to follow-up 14 (3%)
Investigator discretion 1 (<1%)
Withdrew consent 5 (1%)
Randomized and Treated(N=414)
Randomized and Treated(N=419)
20% Subjects Withdrawn(N=84)
Adverse eventSuspected HSR
42 (10%)4 (<1%)
Lack of efficacy(Virologic failure)
13 (3%)
Protocol deviation 7 (2%)
Lost to follow-up 9 (2%)
Investigator discretion 2 (<1%)
Withdrew consent 11 (3%)
88% Continued (N=363)
80% Continued (N=335)
Randomized DTG+ABC/3TC 50mg OD (N=422)
(N=422)
Randomized Atripla OD(N=422)
Screened(N= 1090)
Walmsley S, et al. 52nd ICAAC. 9-12 Sept 2012. Abstract H-556b.
11th International Congress on Drug Therapy in HIV InfectionNovember 11-15, 2012; Glasgow, UK
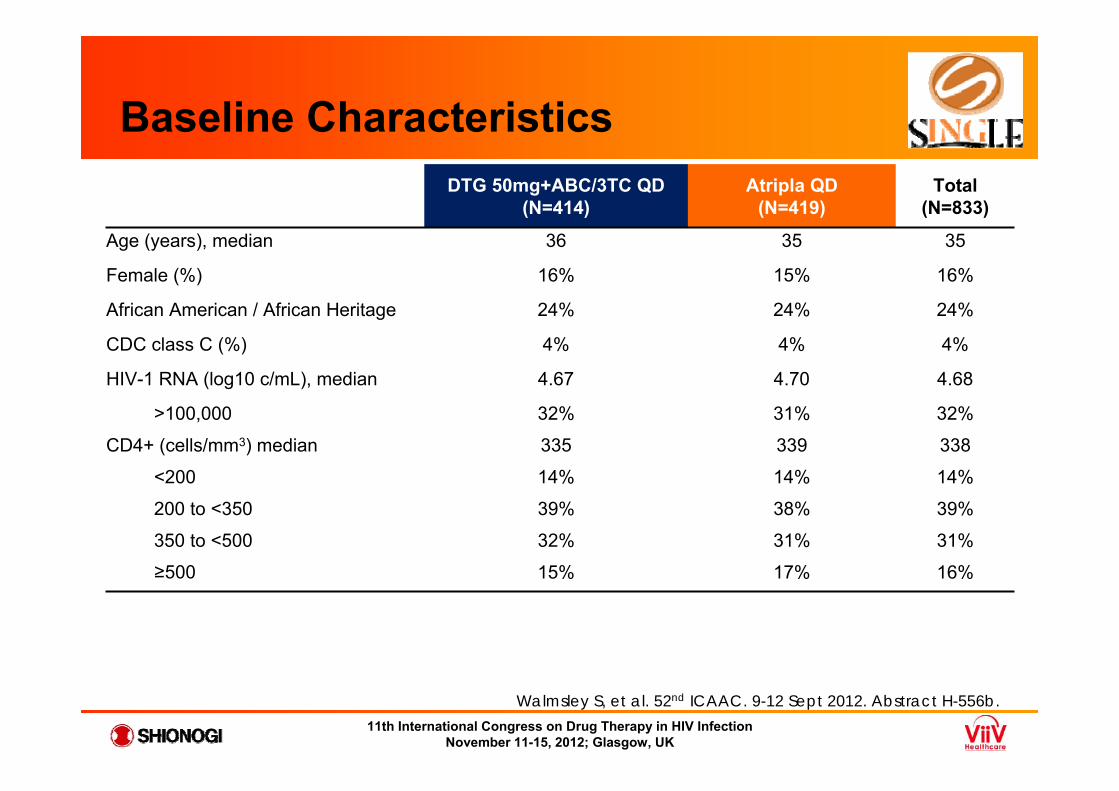
Baseline CharacteristicsDTG 50mg+ABC/3TC QD
(N=414)Atripla QD
(N=419)Total
(N=833)
Age (years), median 36 35 35
Female (%) 16% 15% 16%
African American / African Heritage 24% 24% 24%
CDC class C (%) 4% 4% 4%
HIV-1 RNA (log10 c/mL), median 4.67 4.70 4.68
>100,000 32% 31% 32%
CD4+ (cells/mm3) median 335 339 338
<200 14% 14% 14%
200 to <350 39% 38% 39%
350 to <500 32% 31% 31%
≥500 15% 17% 16%
Walmsley S, et al. 52nd ICAAC. 9-12 Sept 2012. Abstract H-556b.
11th International Congress on Drug Therapy in HIV InfectionNovember 11-15, 2012; Glasgow, UK
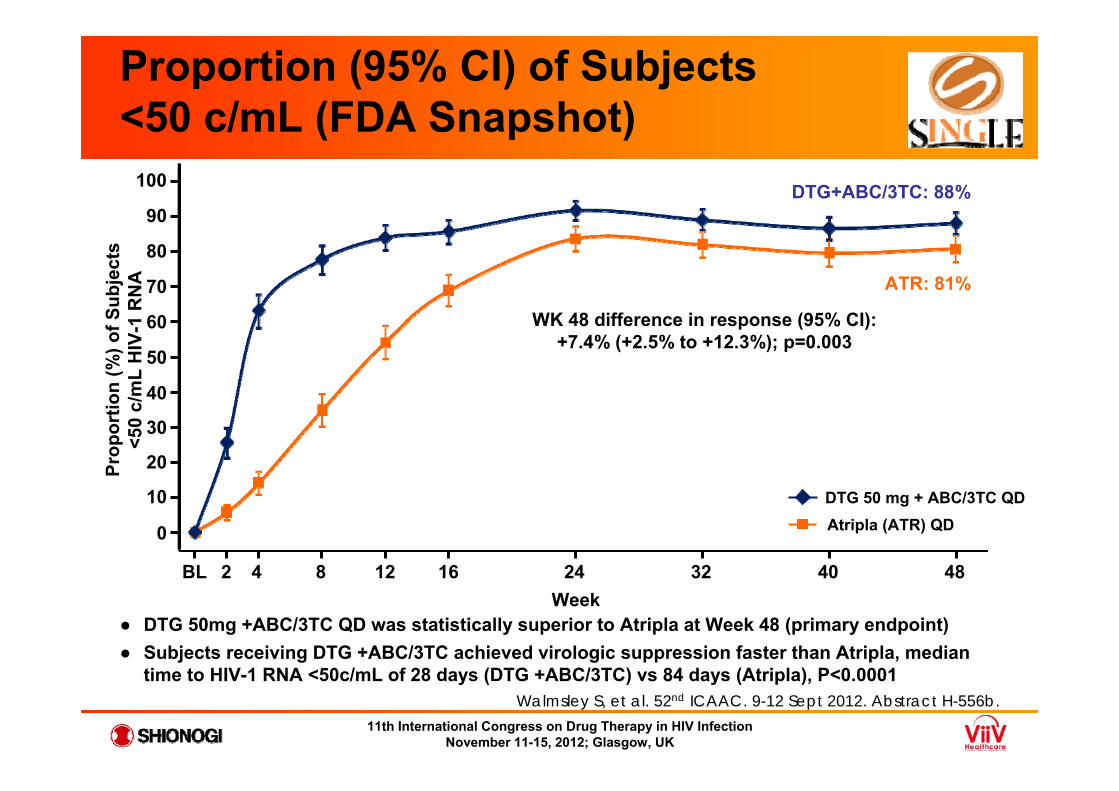
Proportion (95% CI) of Subjects <50 c/mL (FDA Snapshot)
Week
Atripla (ATR) QDDTG 50 mg + ABC/3TC QD
BL 2 4 8 12 16 24 32 40 48
0
10
20
30
40
50
60
70
80
90
100
Prop
ortio
n (%
) of S
ubje
cts
<50
c/m
L H
IV-1
RN
A
DTG+ABC/3TC: 88%
ATR: 81%
WK 48 difference in response (95% CI): +7.4% (+2.5% to +12.3%); p=0.003
● DTG 50mg +ABC/3TC QD was statistically superior to Atripla at Week 48 (primary endpoint)● Subjects receiving DTG +ABC/3TC achieved virologic suppression faster than Atripla, median
time to HIV-1 RNA <50c/mL of 28 days (DTG +ABC/3TC) vs 84 days (Atripla), P<0.0001 Walmsley S, et al. 52nd ICAAC. 9-12 Sept 2012. Abstract H-556b.

11th International Congress on Drug Therapy in HIV InfectionNovember 11-15, 2012; Glasgow, UK
DTG 50mg+ABC/3TC QD
(N=414)Atripla QD
(N=419)
Subjects with PDVF 18 (4%) 17 (4%)
PDVF genotypic population 11 9
PDVF Genotypic (RT Results at Baseline and PDVF) 9 9NRTI tmt-emergent major mutations 0 1(K65R)
NNRTI tmt-emergent major mutations 0 4 (K101E,K103N, G190A)*
PDVF Genotypic (IN Results at Baseline and PDVF) 7 7INI-r tmt-emergent major substitution 0** 0
* n=1 with K101E, n=1 with K103N, n=1 with G190A and n=1 with K103N+G190A**E157Q/P polymorphism detected with no significant change in IN phenotypic susceptibility
Virology: Resistance
Walmsley S, et al. 52nd ICAAC. 9-12 Sept 2012. Abstract H-556b.

11th International Congress on Drug Therapy in HIV InfectionNovember 11-15, 2012; Glasgow, UK
Renal Safety
DTG 50 mg+ABC/3TC QD Atripla QD
Urine albumin/creatinineMedian change (IQR) from baseline (mg/mmol CR) to Week 48 0.00 (-0.30, 0.30) +0.05 (-0.20, 0.30)
1. Koteff, J. et al. Br J Clin Pharmacol. In press; 2012 Aug.
● Small increase in creatinine due to blockade of Cr secretion1
● DTG does not affect actual glomerular filtration rate (GFR)1
Creatinine (CR) conversion10μmol/L= 0.11 mg/dL
DTG 50mg + ABC/3TC QD Atripla QD
Mea
n C
hang
e Fr
om
Bas
elin
e of
CR
(μm
ol/L
)
4 8 12 16 24 32 40 48Week
2
Walmsley S, et al. 52nd ICAAC. 9-12 Sept 2012. Abstract H-556b.

11th International Congress on Drug Therapy in HIV InfectionNovember 11-15, 2012; Glasgow, UK
SPRING-2 Primary Endpoint by NRTI and BLVL
● Proportion of subjects with HIV RNA <50 c/mL at Week 48 by BLVL and investigator-chosen NRTIs (ABC/3TC or TDF/FTC)
● ABC/3TC and TDF/FTC response rates were equivalent irrespective of baseline viral load (BLVL)
● Supporting analyses (split by INI) are presented in poster (Eron et al, HIV11 Poster P204)
*Pro
port
ion
of s
ubje
cts
with
HIV
R
NA
<50
cop
ies/
mL
(%)
225/2
57 (8
8%)
306/3
35 (9
1%)
36/42
(86%
)72
/88 (8
2%)
13/16
(81%
)29
/38 (7
6%)
13/18
(72%
)18
/28 (6
4%)
<100k100-250k
250-500k >500k
ABC/3TC TDF/FTC
Eron J, et al. HIV11; Glasgow, Scotland; November 11-15, 2012; Abst. P204.

11th International Congress on Drug Therapy in HIV InfectionNovember 11-15, 2012; Glasgow, UK
G Nichols,1 R Grossberg,2 A Lazzarin,3 F Maggiolo,4 A Mills,5 J-M Molina,6G Pialoux,7 D Wright,8 M Ait-Khaled,9 J Huang,10 C Vavro,1 B Wynne,11 J Yeo9
1GlaxoSmithKline, Research Triangle Park, NC, USA; 2Montefiore Medical Centre, New York, NY, USA; 3San Raffaele Scientific Institute, Milan, Italy; 4Ospedali Riuniti, Bergamo, Italy; 5Anthony Mills MD Inc, Los Angeles, CA, USA; 6Hospital Saint-Louis, Paris, France; 7Hospital Tenon, Paris, France; 8Central Texas Clinical Research, Austin, TX, USA; 9GlaxoSmithKline, London, UK; 10GlaxoSmithKline, Mississauga, ON, Canada; 11GlaxoSmithKline, Philadelphia, PA, USA
Antiviral Activity of Dolutegravir in Subjects With Failure on an Integrase Inhibitor-Based Regimen: Week 24 Phase 3 Results From VIKING-3

11th International Congress on Drug Therapy in HIV InfectionNovember 11-15, 2012; Glasgow, UK
Study Design
Screening periodup to a maximum of 42 days
Functional monotherapy
phaseHIV-1 RNA ≥500 copies/mL*Resistance to RAL and/or EVG*Resistance to ≥2 ART classes other than INIs
Screening visit ~Day -35 Day 1 Day 8 Week 24 analysis
Optimised phase
DTG 50 mg BID+
optimised background regimen with OSS ≥1
DTG 50 mg BID and continue
failing regimen
Week 48 analysis
*Screening or documented historical evidence.
OSS (overall susceptibility score) determined by Monogram Biosciences
Nichols, G. et al. HIV11, Glasgow, UK; 11-15 November 2012 ; Oral # O232.

11th International Congress on Drug Therapy in HIV InfectionNovember 11-15, 2012; Glasgow, UK
Day 8 and Week 24 Efficacy Endpoints
● Day 8 change from BL:-1.43 log10 copies/mL, P<0.001– 95% CI, -1.52 to -1.34
(ITT-E, N=183)
● Week 24 by Snapshot (MSDF): 72/114 (63%) <50 copies/mL – 37/114 (32%) were virologic
non-responders- 6/114 (5%) changed OBR
– Only 5/114 (4%) were non-responders for discontinuation due to AEs
Week 24 population (N=114) was those subjects who had opportunity to reach Week 24 at time of data cut-off
Perc
enta
ge o
f sub
ject
s w
ith H
IV-1
R
NA
<50
cop
ies/
mL
Overall, 63% were fully suppressed at Week 24 by
Snapshot algorithm
70
50
20
0
D8 W4 W8 W12 W16 W24
100
10
30
40
60
80
90
BL
Time
Nichols, G. et al. HIV11, Glasgow, UK; 11-15 November 2012 ; Oral # O232.

11th International Congress on Drug Therapy in HIV InfectionNovember 11-15, 2012; Glasgow, UK
● In multivariate analyses of baseline factors on Week 24 response rates, the presence of Q148 + ≥2 mutations and increasing DTG FC were highly correlated with fewer subjects achieving <50 copies/mL (P≤0.001)
● Increasing OBR activity score did not impact response– In patients with OSS=1, the most common active ARVs were TDF, T20, MVC and ETR– Overall, only 23% (28/114) received a PI/r as the fully active ARV in OBR– In most cases, the 2nd and 3rd active ARV was an NRTI
Week 24 Response by Mutation Category and OBR Overall Susceptibility Score (OSS)
HIV-1 RNA <50 copies/mL at Week 24 (Snapshot) (N=101)
Derived IN mutation group* OSS=0 OSS=1 OSS≥2 Total
No Q148,** n (%) 2/2 (100) 24/29 (83) 31/41 (76) 57 (79)
Q148 + 1,† n (%) 2/2 (100) 3/7 (43) 4/11 (36) 9 (45)
Q148 +≥ 2,† n (%) 1/2 (50) 0/7 (0) 0 1 (11)
* Virus from the ≥2 primary mutations group was re-categorized to the Q148+ or No Q148 groups as appropriate**143, 155, 66, 92, historical resistance evidence only. †G140A/C/S, E138A/K/T, L74I
Nichols, G. et al. HIV11, Glasgow, UK; 11-15 November 2012 ; Oral # O232.

Nuevos Fármacos. Nuevas Coformulaciones.¿Qué aportan?
• Se mantiene la simplicidad (1 pastilla/día)• Se mejora la tolerabilidad
– Rilpivirina, Elvitegravir y Dolutegravir• Se mejora la toxicidad a largo plazo
– ABC/3TC/DTG• Se mejora el perfil de resistencias
– DTG

Non-nucleoside RTIs• RPV/TDF/FTCNon-nucleoside RTIs• RPV/TDF/FTC
The Future: More ARVs, More FDCs and STRs
Protease Inhibitors• DRV/COBI/FTC/7340• ATV/COBI• DRV/COBI
Integrase Inhibitors• EVG/COBI/FTC/TDF• EVG/COBI/FTC/7340• DOL/ABC/3TC