Embed Size (px)
Citation preview
NUMBERS AND NARRATIVE: MODELING, STORY TELLING AND INVESTING
Aswath Damodaran
A valuaAon of Amazon in October 2014
Let’s start with an experiment
3
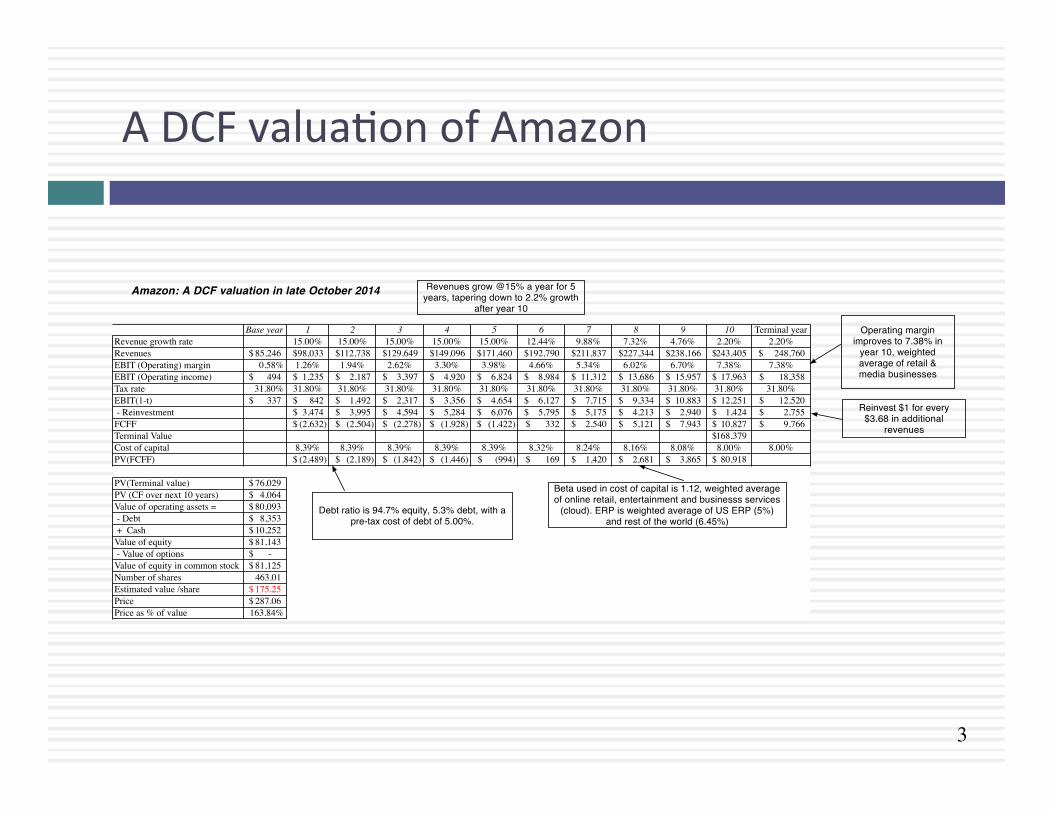
A DCF valuaAon of Amazon
Revenues grow @15% a year for 5 years, tapering down to 2.2% growth
after year 10
Operating margin improves to 7.38% in
year 10, weighted average of retail & media businesses
Reinvest $1 for every $3.68 in additional
revenues
Base year 1 2 3 4 5 6 7 8 9 10 Terminal yearRevenue growth rate 15.00% 15.00% 15.00% 15.00% 15.00% 12.44% 9.88% 7.32% 4.76% 2.20% 2.20%Revenues 85,246$ 98,033$ 112,738$ 129,649$ 149,096$ 171,460$ 192,790$ 211,837$ 227,344$ 238,166$ 243,405$ 248,760$ EBIT (Operating) margin 0.58% 1.26% 1.94% 2.62% 3.30% 3.98% 4.66% 5.34% 6.02% 6.70% 7.38% 7.38%EBIT (Operating income) 494$ 1,235$ 2,187$ 3,397$ 4,920$ 6,824$ 8,984$ 11,312$ 13,686$ 15,957$ 17,963$ 18,358$ Tax rate 31.80% 31.80% 31.80% 31.80% 31.80% 31.80% 31.80% 31.80% 31.80% 31.80% 31.80% 31.80%EBIT(1-t) 337$ 842$ 1,492$ 2,317$ 3,356$ 4,654$ 6,127$ 7,715$ 9,334$ 10,883$ 12,251$ 12,520$ - Reinvestment 3,474$ 3,995$ 4,594$ 5,284$ 6,076$ 5,795$ 5,175$ 4,213$ 2,940$ 1,424$ 2,755$ FCFF (2,632)$ (2,504)$ (2,278)$ (1,928)$ (1,422)$ 332$ 2,540$ 5,121$ 7,943$ 10,827$ 9,766$ Terminal Value 168,379$ Cost of capital 8.39% 8.39% 8.39% 8.39% 8.39% 8.32% 8.24% 8.16% 8.08% 8.00% 8.00%PV(FCFF) (2,489)$ (2,189)$ (1,842)$ (1,446)$ (994)$ 169$ 1,420$ 2,681$ 3,865$ 80,918$
PV(Terminal value) 76,029$ PV (CF over next 10 years) 4,064$ Value of operating assets = 80,093$ - Debt 8,353$ + Cash 10,252$ Value of equity 81,143$ - Value of options -$ Value of equity in common stock 81,125$ Number of shares 463.01 Estimated value /share 175.25$ Price 287.06$ Price as % of value 163.84%
Debt ratio is 94.7% equity, 5.3% debt, with a pre-tax cost of debt of 5.00%.
Beta used in cost of capital is 1.12, weighted average of online retail, entertainment and businesss services
(cloud). ERP is weighted average of US ERP (5%) and rest of the world (6.45%)
Amazon: A DCF valuation in late October 2014
4
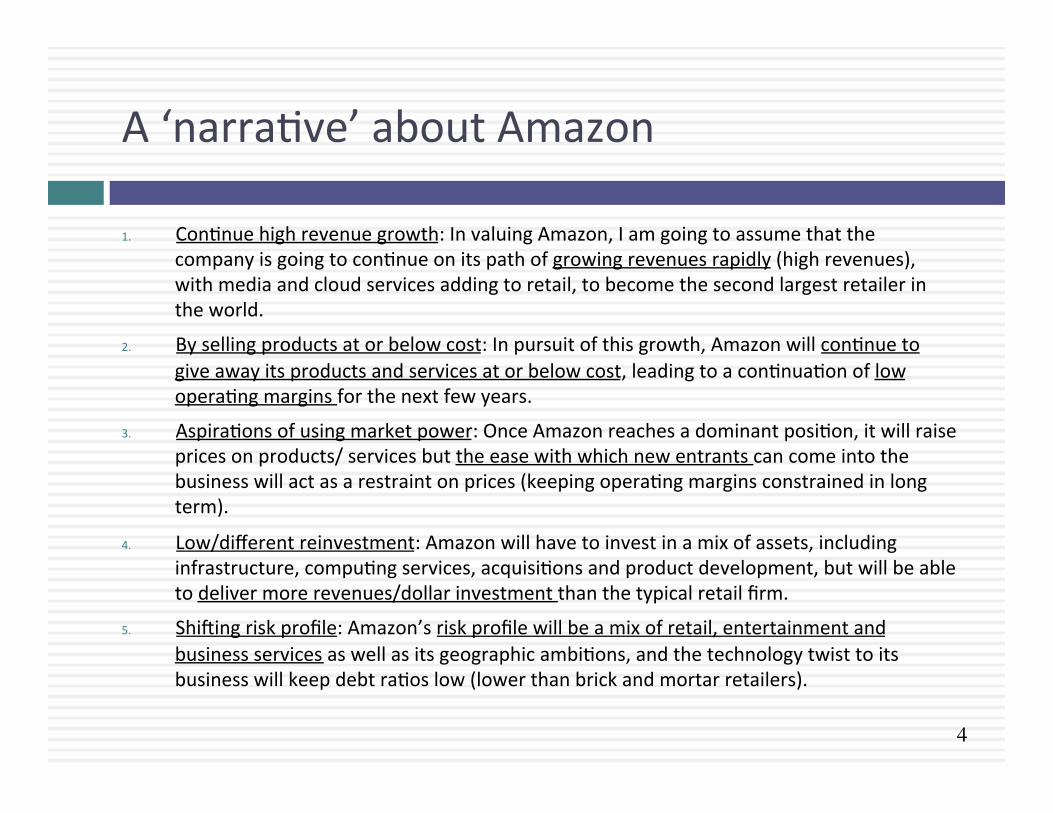
A ‘narraAve’ about Amazon
1. ConAnue high revenue growth: In valuing Amazon, I am going to assume that the company is going to conAnue on its path of growing revenues rapidly (high revenues), with media and cloud services adding to retail, to become the second largest retailer in the world.
2. By selling products at or below cost: In pursuit of this growth, Amazon will conAnue to give away its products and services at or below cost, leading to a conAnuaAon of low operaAng margins for the next few years.
3. AspiraAons of using market power: Once Amazon reaches a dominant posiAon, it will raise prices on products/ services but the ease with which new entrants can come into the business will act as a restraint on prices (keeping operaAng margins constrained in long term).
4. Low/different reinvestment: Amazon will have to invest in a mix of assets, including infrastructure, compuAng services, acquisiAons and product development, but will be able to deliver more revenues/dollar investment than the typical retail firm.
5. Shi^ing risk profile: Amazon’s risk profile will be a mix of retail, entertainment and business services as well as its geographic ambiAons, and the technology twist to its business will keep debt raAos low (lower than brick and mortar retailers).
5
A quick test
¨ Now that you have been exposed to two different valuaAons of Amazon, one driven enArely by numbers and one set as a story, which one do you find more credible? a. The DCF valuaAon b. The Amazon story
¨ Which one are you more likely to remember tomorrow? a. The DCF valuaAon b. The Amazon story
¨ What would your biggest concern be with each one?
6
Marrying numbers & narraAve
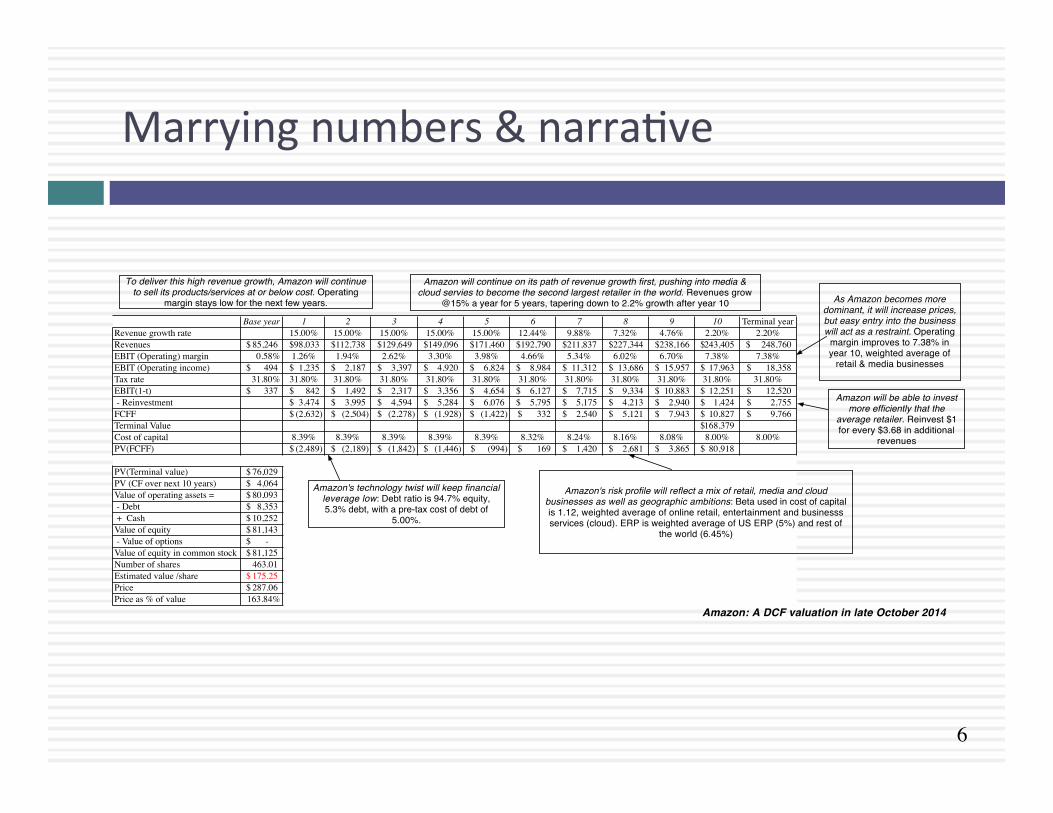
Amazon will continue on its path of revenue growth first, pushing into media & cloud servies to become the second largest retailer in the world. Revenues grow
@15% a year for 5 years, tapering down to 2.2% growth after year 10 As Amazon becomes more dominant, it will increase prices, but easy entry into the business will act as a restraint. Operating
margin improves to 7.38% in year 10, weighted average of
retail & media businesses
Amazon will be able to invest more efficiently that the
average retailer. Reinvest $1 for every $3.68 in additional
revenues
Base year 1 2 3 4 5 6 7 8 9 10 Terminal yearRevenue growth rate 15.00% 15.00% 15.00% 15.00% 15.00% 12.44% 9.88% 7.32% 4.76% 2.20% 2.20%Revenues 85,246$ 98,033$ 112,738$ 129,649$ 149,096$ 171,460$ 192,790$ 211,837$ 227,344$ 238,166$ 243,405$ 248,760$ EBIT (Operating) margin 0.58% 1.26% 1.94% 2.62% 3.30% 3.98% 4.66% 5.34% 6.02% 6.70% 7.38% 7.38%EBIT (Operating income) 494$ 1,235$ 2,187$ 3,397$ 4,920$ 6,824$ 8,984$ 11,312$ 13,686$ 15,957$ 17,963$ 18,358$ Tax rate 31.80% 31.80% 31.80% 31.80% 31.80% 31.80% 31.80% 31.80% 31.80% 31.80% 31.80% 31.80%EBIT(1-t) 337$ 842$ 1,492$ 2,317$ 3,356$ 4,654$ 6,127$ 7,715$ 9,334$ 10,883$ 12,251$ 12,520$ - Reinvestment 3,474$ 3,995$ 4,594$ 5,284$ 6,076$ 5,795$ 5,175$ 4,213$ 2,940$ 1,424$ 2,755$ FCFF (2,632)$ (2,504)$ (2,278)$ (1,928)$ (1,422)$ 332$ 2,540$ 5,121$ 7,943$ 10,827$ 9,766$ Terminal Value 168,379$ Cost of capital 8.39% 8.39% 8.39% 8.39% 8.39% 8.32% 8.24% 8.16% 8.08% 8.00% 8.00%PV(FCFF) (2,489)$ (2,189)$ (1,842)$ (1,446)$ (994)$ 169$ 1,420$ 2,681$ 3,865$ 80,918$
PV(Terminal value) 76,029$ PV (CF over next 10 years) 4,064$ Value of operating assets = 80,093$ - Debt 8,353$ + Cash 10,252$ Value of equity 81,143$ - Value of options -$ Value of equity in common stock 81,125$ Number of shares 463.01 Estimated value /share 175.25$ Price 287.06$ Price as % of value 163.84%
Amazon's technology twist will keep financial leverage low: Debt ratio is 94.7% equity, 5.3% debt, with a pre-tax cost of debt of
5.00%.
Amazon's risk profile will reflect a mix of retail, media and cloud businesses as well as geographic ambitions: Beta used in cost of capital is 1.12, weighted average of online retail, entertainment and businesss services (cloud). ERP is weighted average of US ERP (5%) and rest of
the world (6.45%)
Amazon: A DCF valuation in late October 2014
To deliver this high revenue growth, Amazon will continue to sell its products/services at or below cost. Operating
margin stays low for the next few years.
Vive le difference!
Numbers person or Story teller?

8
Le^ Brain and Right Brain
9
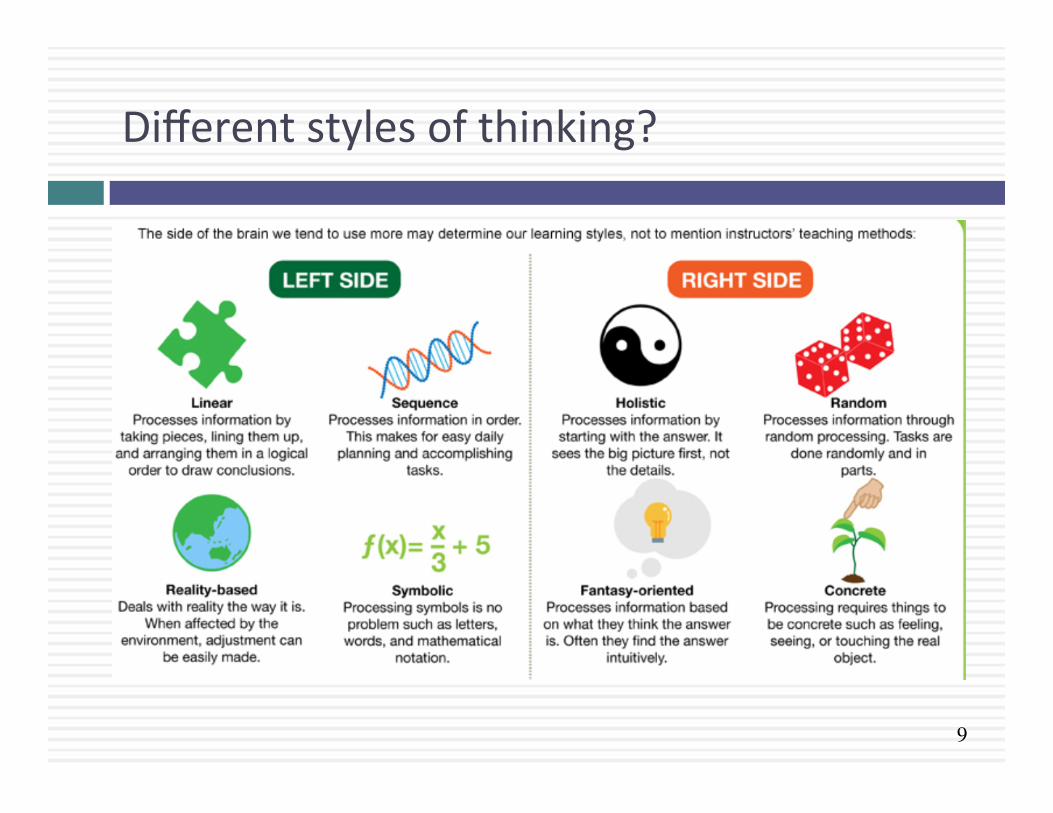
Different styles of thinking?
10
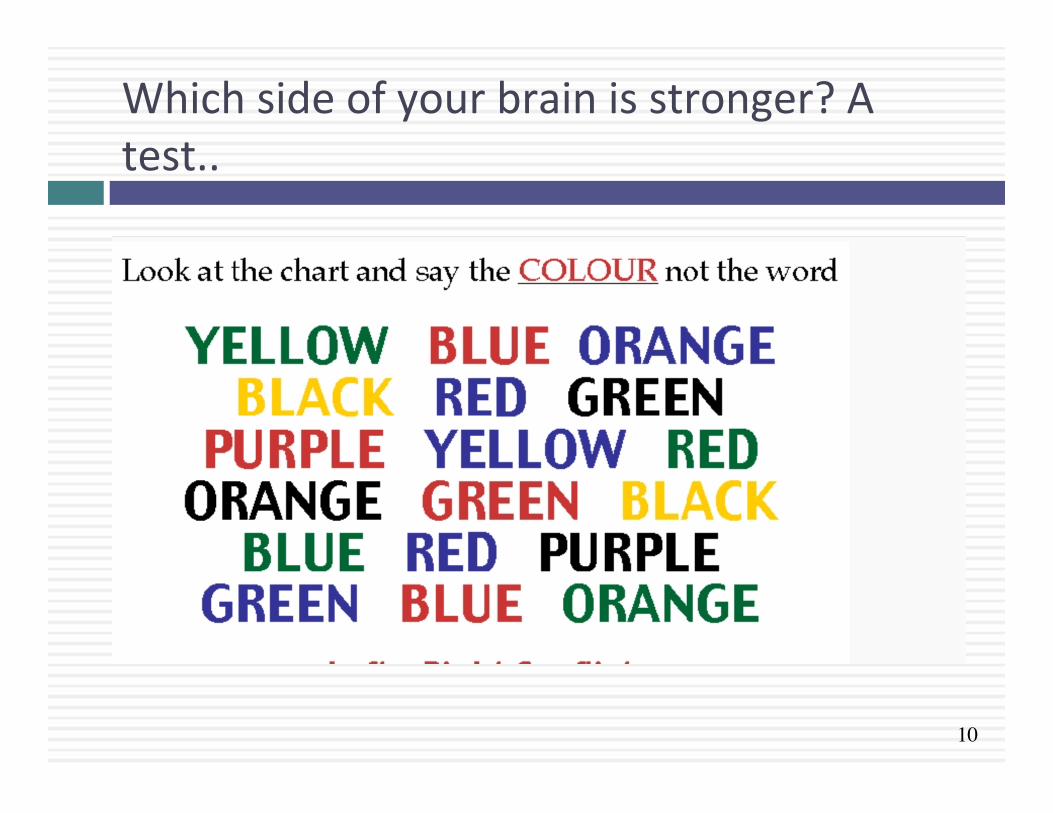
Which side of your brain is stronger? A test..
”Jargon seems to be (the only place) where the right brain and the le^ brain meet”
Seeng up the contrast
12
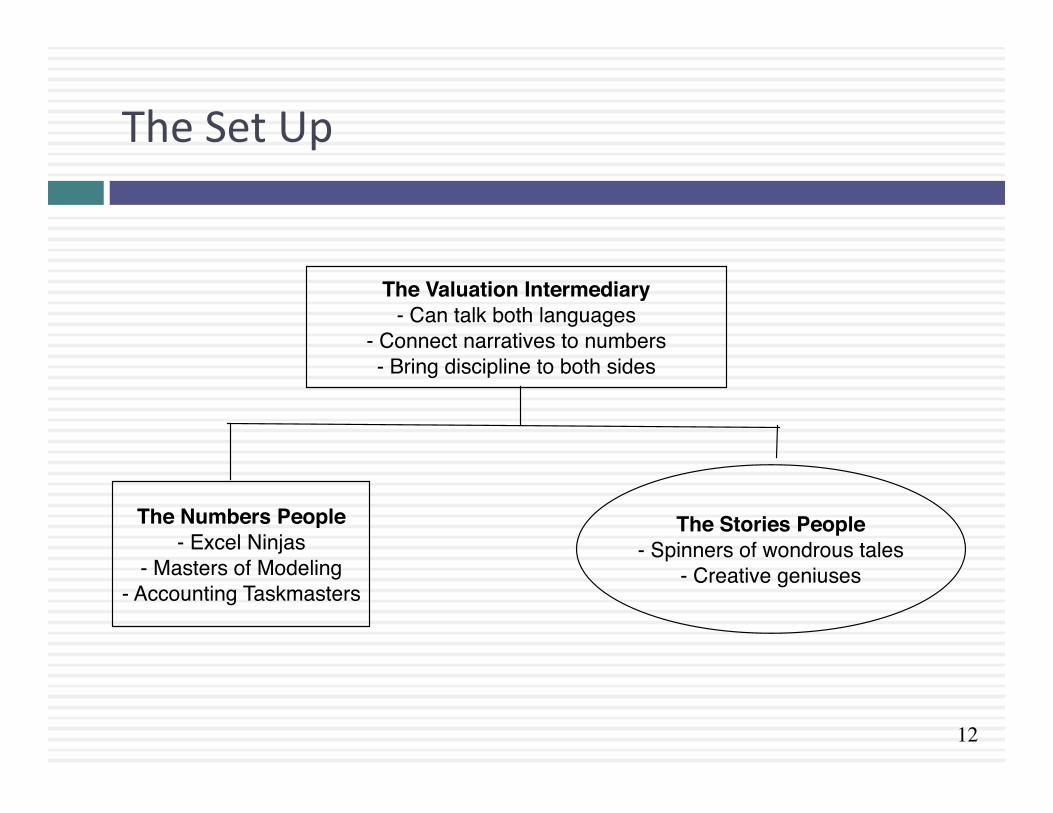
The Set Up
The Numbers People- Excel Ninjas
- Masters of Modeling- Accounting Taskmasters
The Stories People- Spinners of wondrous tales
- Creative geniuses
The Valuation Intermediary- Can talk both languages
- Connect narratives to numbers- Bring discipline to both sides
13
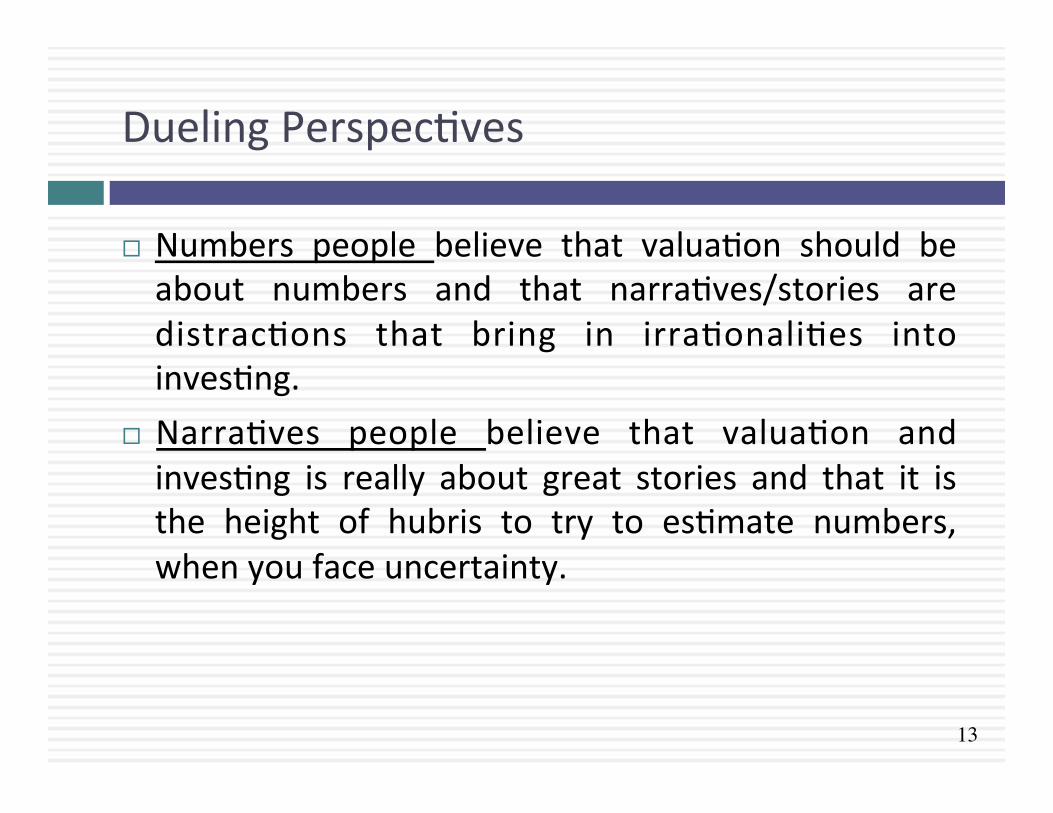
Dueling PerspecAves
¨ Numbers people believe that valuaAon should be about numbers and that narraAves/stories are distracAons that bring in irraAonaliAes into invesAng.
¨ NarraAves people believe that valuaAon and invesAng is really about great stories and that it is the height of hubris to try to esAmate numbers, when you face uncertainty.
14
The Great Divide
¨ They speak different languages: Numbers and narraAve people speak different languages and o^en don’t understand what the other side is saying.
¨ Each side thinks it occupies the high ground: Each side thinks that it occupies the high ground and believes in the worst caricatures it can of the other side.
Just the facts, ma’am!
The Numbers People
16
The Numbers Game: The building blocks
¨ AccounAng: The game starts with accounAng statements, with more value to greater detail. Not only is every piece of the accounAng statement taken apart, but so is every footnote. FASB pronouncements are studied like the scriptures, parsed for meaning.
¨ Modeling: The next step is modeling the company, again in as much depth as possible.
¨ Data: Judgments based on data are valued more than judgments based upon intuiAon or experience.
¨ ValuaAon: The final aspect is valuaAon, with mastery of model mechanics equaAng to beher valuaAon.
17
1. AccounAng Mission Creep
¨ AccounAng earnings are viewed as measures of economic earnings: AccounAng measures of earnings at every level (EBITDA, operaAng income and net income) are given special respect and treat them as economic earnings.
¨ AccounAng book value for assets is treated as having significant meaning, used by some as a proxy for invested capital in a business and by others as a measure of fair value in the business.
¨ AccounAng rule makers are considered the arbiters of that which is right and reasonable.
18
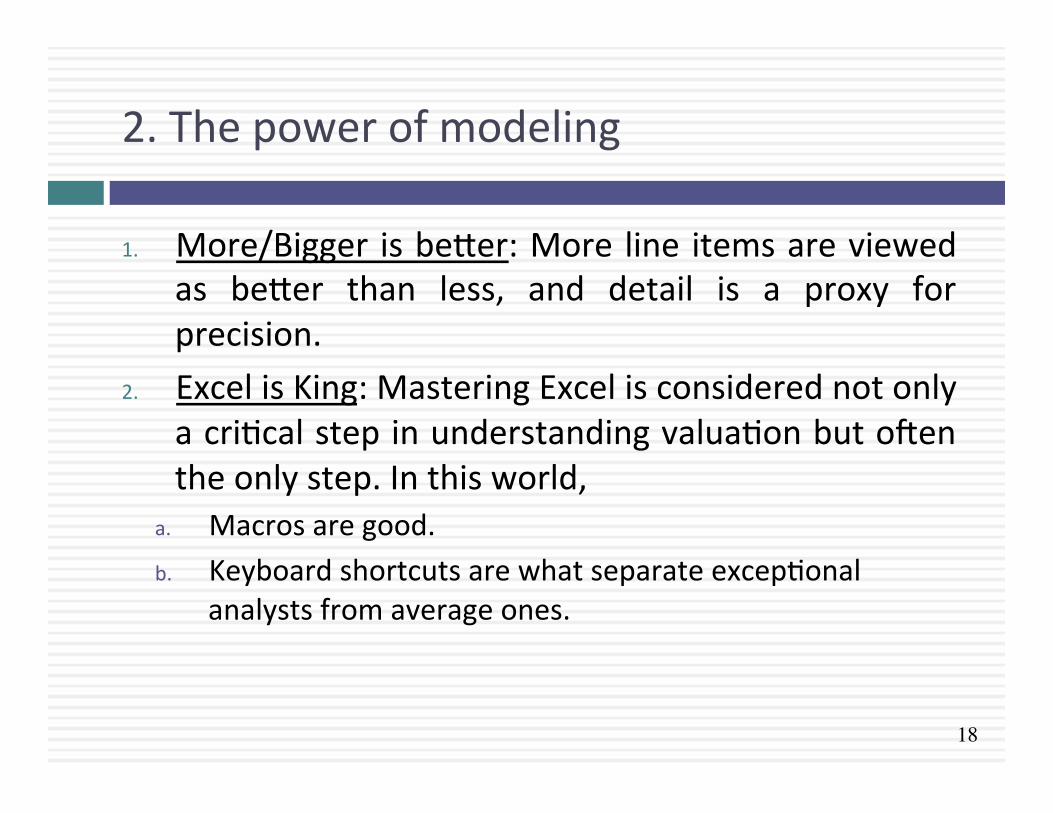
2. The power of modeling
1. More/Bigger is beher: More line items are viewed as beher than less, and detail is a proxy for precision.
2. Excel is King: Mastering Excel is considered not only a criAcal step in understanding valuaAon but o^en the only step. In this world,
a. Macros are good. b. Keyboard shortcuts are what separate excepAonal
analysts from average ones.
19
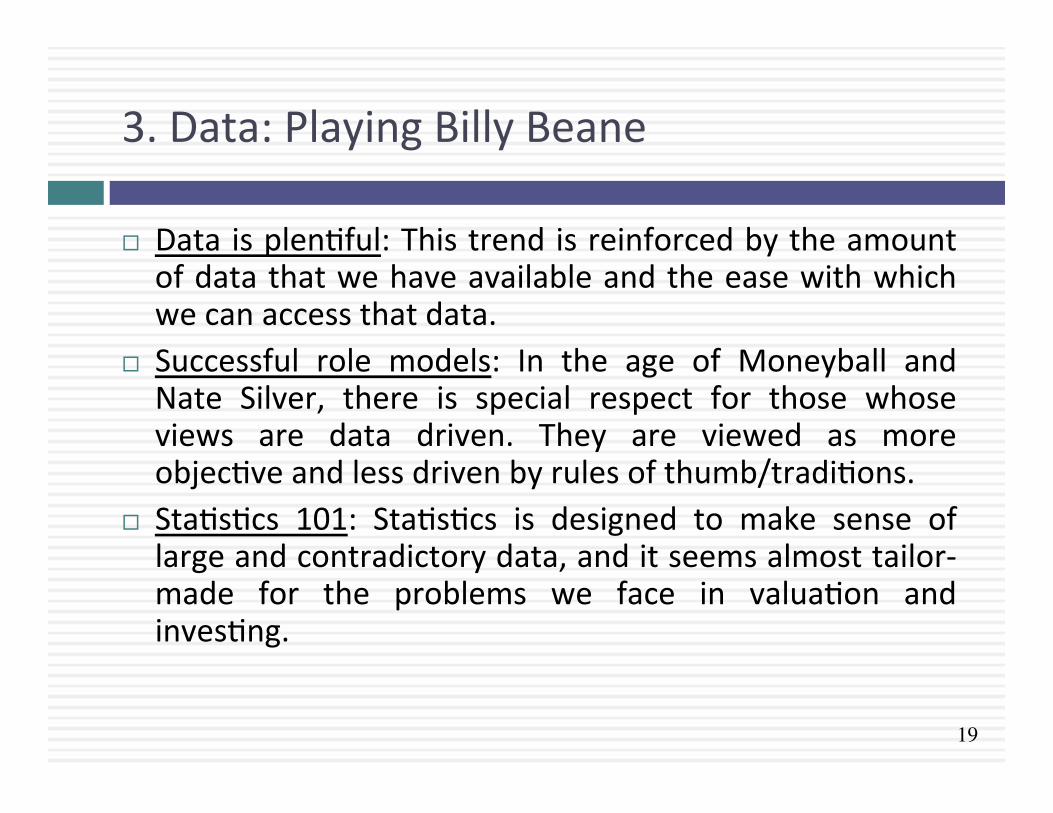
3. Data: Playing Billy Beane
¨ Data is plenAful: This trend is reinforced by the amount of data that we have available and the ease with which we can access that data.
¨ Successful role models: In the age of Moneyball and Nate Silver, there is special respect for those whose views are data driven. They are viewed as more objecAve and less driven by rules of thumb/tradiAons.
¨ StaAsAcs 101: StaAsAcs is designed to make sense of large and contradictory data, and it seems almost tailor-‐made for the problems we face in valuaAon and invesAng.
20
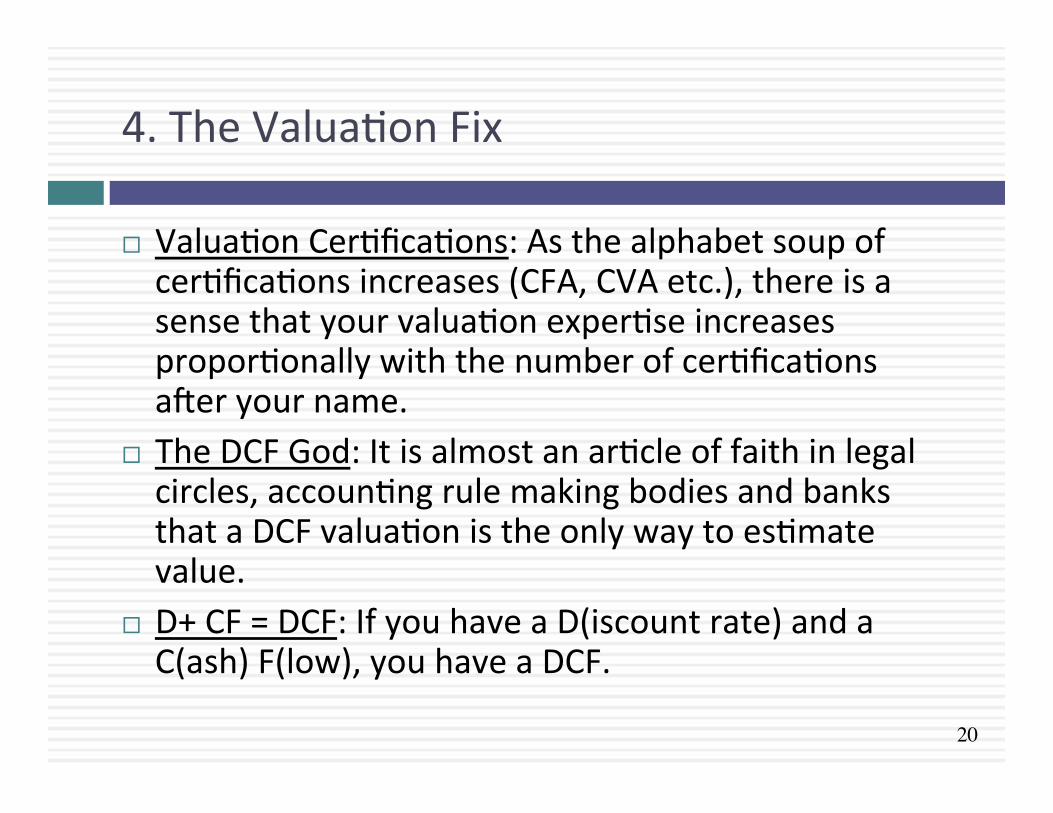
4. The ValuaAon Fix
¨ ValuaAon CerAficaAons: As the alphabet soup of cerAficaAons increases (CFA, CVA etc.), there is a sense that your valuaAon experAse increases proporAonally with the number of cerAficaAons a^er your name.
¨ The DCF God: It is almost an arAcle of faith in legal circles, accounAng rule making bodies and banks that a DCF valuaAon is the only way to esAmate value.
¨ D+ CF = DCF: If you have a D(iscount rate) and a C(ash) F(low), you have a DCF.
21
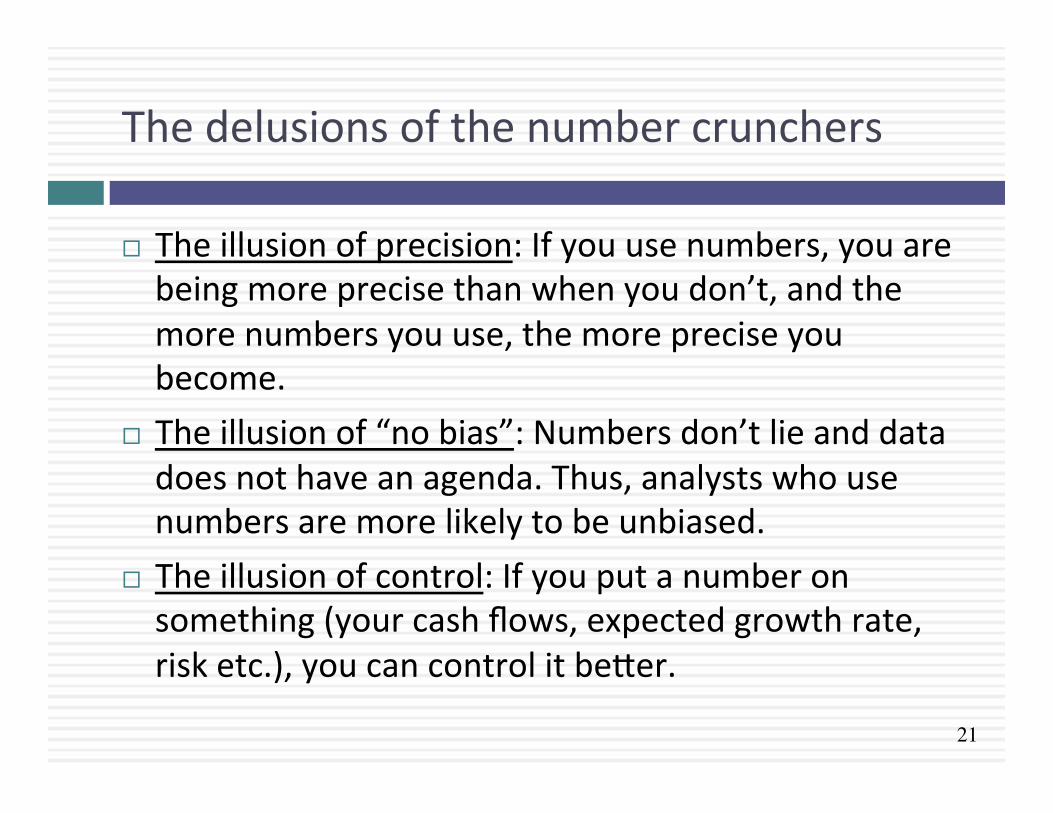
The delusions of the number crunchers
¨ The illusion of precision: If you use numbers, you are being more precise than when you don’t, and the more numbers you use, the more precise you become.
¨ The illusion of “no bias”: Numbers don’t lie and data does not have an agenda. Thus, analysts who use numbers are more likely to be unbiased.
¨ The illusion of control: If you put a number on something (your cash flows, expected growth rate, risk etc.), you can control it beher.
22
All numbers, all the Ame: The dangerous limits
¨ Boring and unconvincing (but inAmidaAng): A valuaAon that is all numbers and no narraAve will not draw in skepAcs or convince investors. It may inAmidate them (and that may very well be the reason you use them).
¨ Miss internal inconsistencies: By leeng your valuaAon be all about the numbers, you may miss a chance at spoeng internal inconsistencies or serious problems.
¨ The Echo Chamber: If you are surrounded by other numbers people (quants), it becomes easy to find agreement about using valuaAon pracAces that may be patently wrong or are noisy.
“You're never going to kill storytelling, because it's built into the human plan. We come with it.”
The Story People
24
The NarraAve Game
¨ In the narraAve game, you have a story to tell about an investment and if it has enough of a hook to it, hope to draw investors into the investment.
¨ You are measured by how well your story is structured and how you tell it, rather than the numbers that may or may not be backing it.
¨ At best, the numbers, if they are used, are almost an a^er thought at the end of the story, rather than being Aed to the story.
25
1. The power of the anecdote
¨ Research in psychology point to an undeniable fact. Human beings respond beher to stories than to abstracAons of numbers. That reflects evoluAon, and as one psychologist put it, “our brains our belief engines that employ associa4on learning to seek and find pa8erns”. Anecdotal evidence is as old as man, but the scienAfic method is only a few hundred years in the making.
¨ This is true in business as well, where story telling o^en is much more effecAve at selling people on an investment than the numbers that may be presented.
¨ In business educaAon, the use of cases shows the power of story telling in conveying larger themes. More generally, as a teacher, I am well aware of the power of good anecdote to back up theory, models or science.
26
2. The weight of experience
¨ Building on the theme of story telling, a story told by someone who was part of it is viewed as much more credible than one told by someone from the outside. And success in the past experience is viewed as a predictor of future success, even if it is not.
¨ And psychological studies indicate that it can affect choices. QuoAng, “In the case of decisions from descrip.on, people make choices as if they overweight the probability of rare events, as described by prospect theory. We found that in the case of decisions from experience, in contrast, people make choices as if they underweight the probability of rare events”.
27
3. The appeal to emoAons/ common sense
¨ The best stories have emoAonal pulls, that drag listeners in because they can relate to that emoAon.
¨ The emoAons that these stories appeal to are generally a mix of the crass (greed, envy) and the noble (change the world, do good, alter the (bad) status quo).
28
The delusions of the story tellers
1. Number crunchers don’t dream in technicolour: CreaAvity and Numbers are mutually exclusive. If you talk about numbers, you cannot be creaAve, and if you are being creaAve, talk about numbers only crimps your creaAve insAncts.
2. CreaAvity is deserving of reward: If your story is good, your business will success and your investment will pay off.
3. Experience is the best teacher: If you have pulled this off before (started and succeeded at running a business), your story is more believable.
29
All narraAve, all the Ame: The dangerous limits
¨ Fantasyland & Fairy tales: A narraAve-‐based valuaAon, which has lihle, if any, numbers to back it up, can very quickly veer away from reality into fantasy.
¨ The Echo Chamber: If your circle is filled with people who are also unconstrained story tellers, not only do you feed on each other, but the stories tend to get more and more fantasAc.
¨ No measurement mechanism or feedback look: If you don’t use numbers in any meaningful way to sell an investment, you have no way of measuring whether your narraAve is holding up and what you might need to do to set it right, if it is not.
“Be transparently wrong than opaquely right”
ValuaAon as a bridge
31
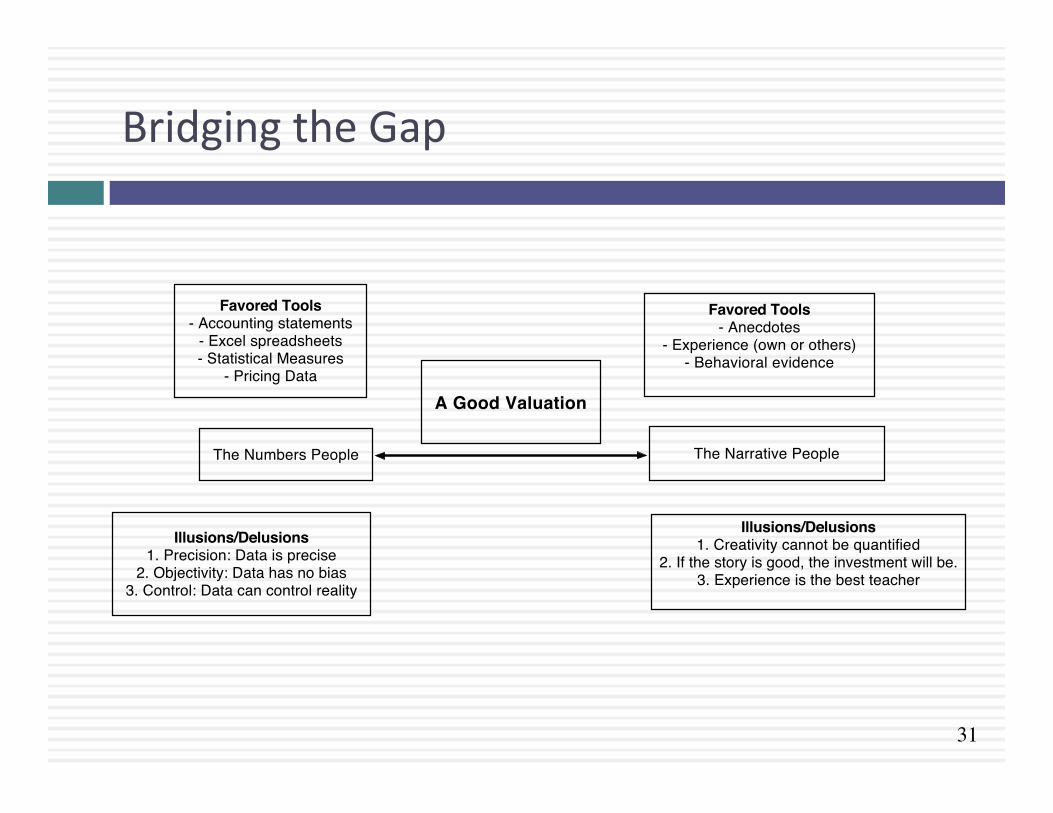
Bridging the Gap
The Numbers People
Favored Tools- Accounting statements
- Excel spreadsheets- Statistical Measures
- Pricing Data
Illusions/Delusions1. Precision: Data is precise
2. Objectivity: Data has no bias3. Control: Data can control reality
The Narrative People
Favored Tools- Anecdotes
- Experience (own or others)- Behavioral evidence
Illusions/Delusions1. Creativity cannot be quantified
2. If the story is good, the investment will be.3. Experience is the best teacher
A Good Valuation
32
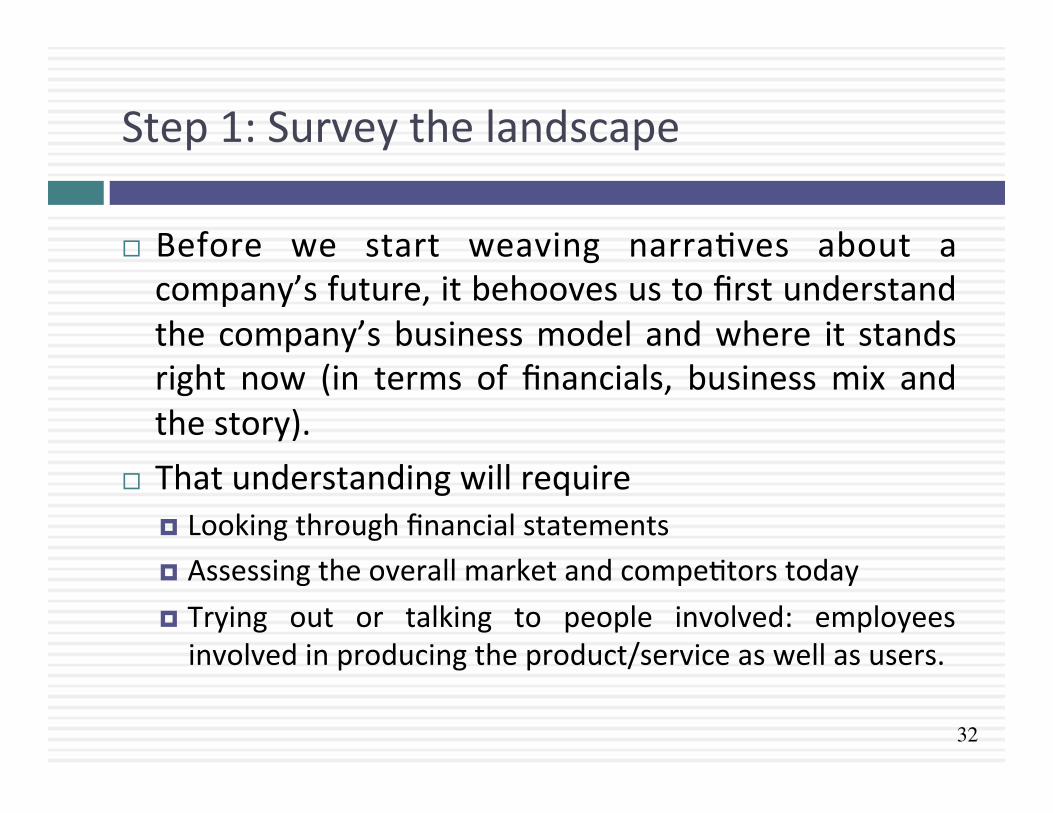
Step 1: Survey the landscape
¨ Before we start weaving narraAves about a company’s future, it behooves us to first understand the company’s business model and where it stands right now (in terms of financials, business mix and the story).
¨ That understanding will require ¤ Looking through financial statements ¤ Assessing the overall market and compeAtors today ¤ Trying out or talking to people involved: employees involved in producing the product/service as well as users.
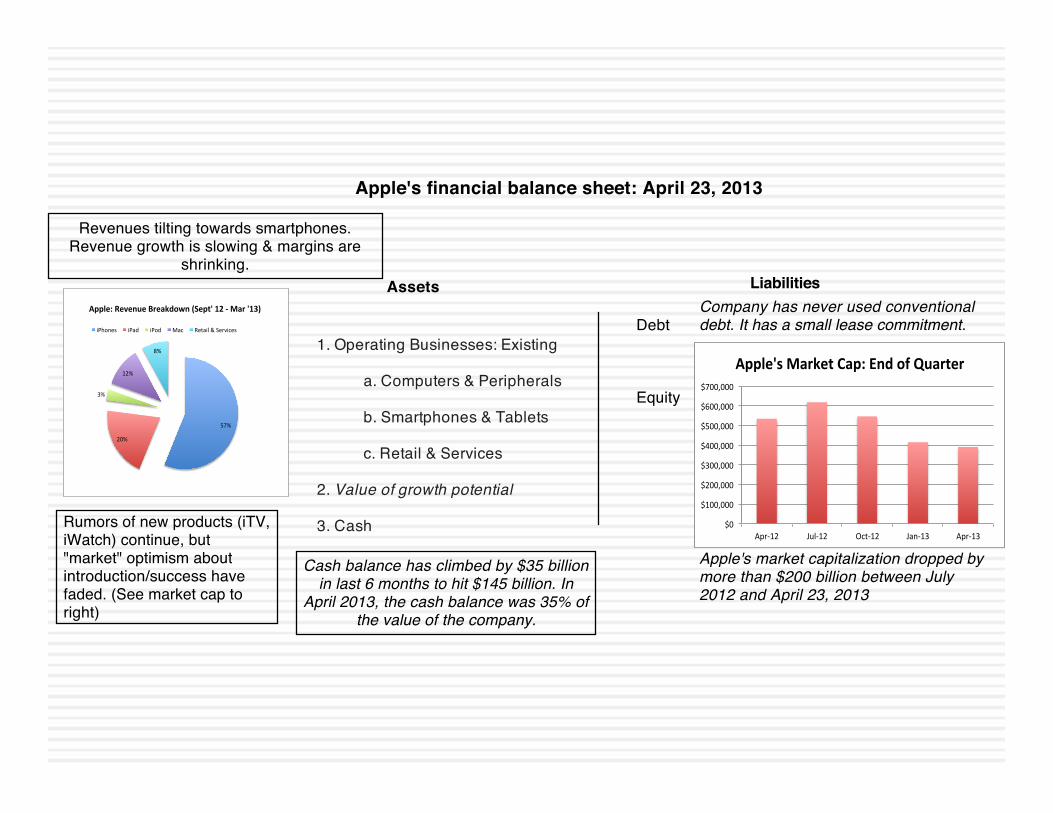
1. Operating Businesses: Existing
a. Computers & Peripherals
b. Smartphones & Tablets
c. Retail & Services
2. Value of growth potential
3. Cash
Debt
Equity
Assets Liabilities
Apple's financial balance sheet: April 23, 2013
57%$
20%$
3%$
12%$
8%$
Apple:&Revenue&Breakdown&(Sept'&12&8&Mar&'13)&
iPhones$ iPad$ iPod$ Mac$ Retail$&$Services$
$0#
$100,000#
$200,000#
$300,000#
$400,000#
$500,000#
$600,000#
$700,000#
Apr/12# Jul/12# Oct/12# Jan/13# Apr/13#
Apple's'Market'Cap:'End'of'Quarter'
Apple's market capitalization dropped by more than $200 billion between July 2012 and April 23, 2013
Cash balance has climbed by $35 billion in last 6 months to hit $145 billion. In
April 2013, the cash balance was 35% of the value of the company.
Rumors of new products (iTV, iWatch) continue, but "market" optimism about introduction/success have faded. (See market cap to right)
Company has never used conventional debt. It has a small lease commitment.
Revenues tilting towards smartphones. Revenue growth is slowing & margins are
shrinking.
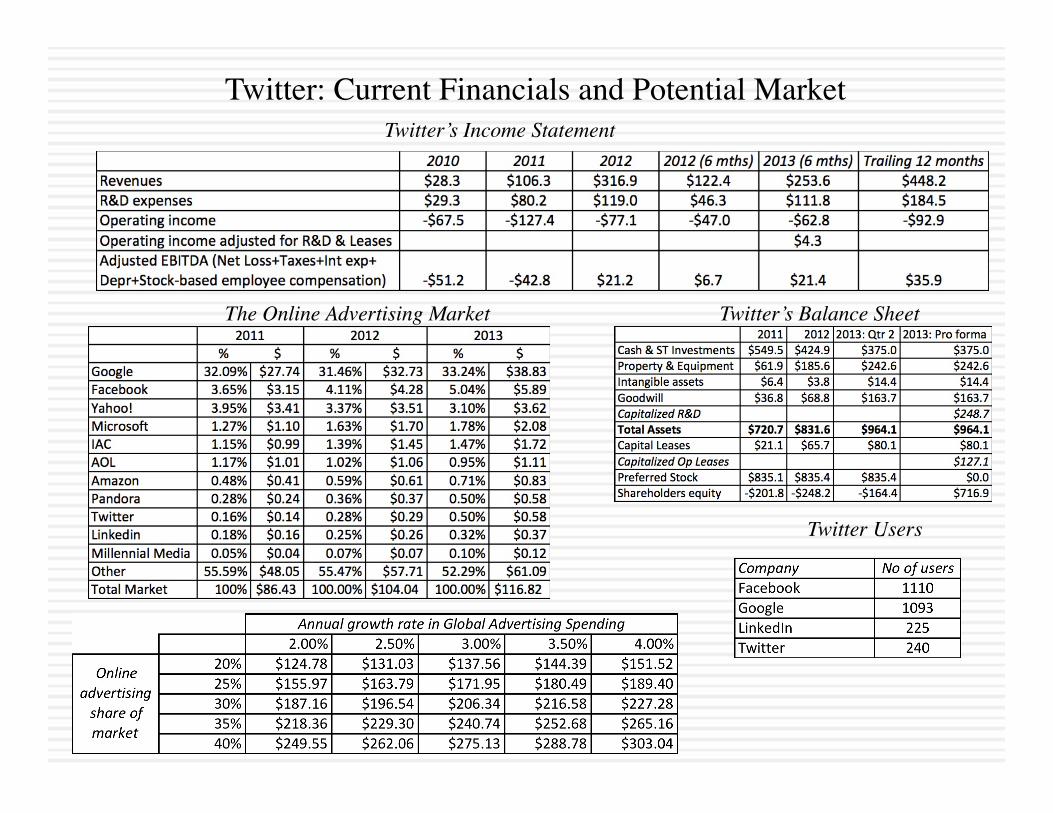
Twitter: Current Financials and Potential MarketTwitter’s Income Statement
Twitter’s Balance SheetThe Online Advertising Market
Twitter Users
36
Step 2: Create a narraAve for the future
¨ Every valuaAon starts with a narraAve, a story that you see unfolding for your company in the future.
¨ In developing this narraAve, you will be making assessments of your company (its products, its management), the market or markets that you see it growing in, the compeAAon it faces and will face and the macro environment in which it operates. ¤ Rule 1: Keep it simple. ¤ Rule 2: Keep it focused.
37
Three narraAves: Apple, Twiher and Uber
1. Apple (April 2013): Apple is a cash machine that derives much of its value from the smartphone business that is seeing growth slow and compeAAon increase. Its size will make it difficult to create disrupAon that will create meaningful high growth.
2. TwiDer (October 2013): Twiher is an innovaAve social media company which will be successful in its quest in online adverAsing, but because of its structure (140 characters), it will not be a dominant player.
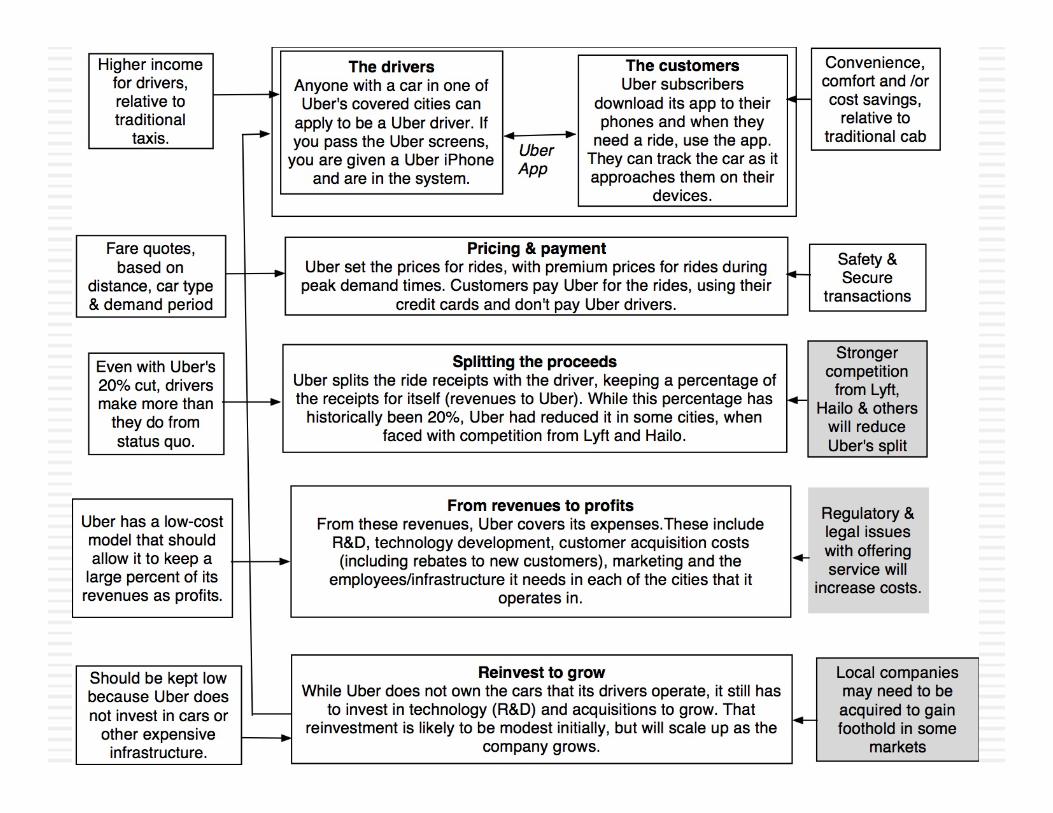
3. Uber (June 2014): Uber will expand the car service market moderately, primarily in urban environments, and use its compeAAve advantages to get a significant but not dominant market share and maintain its profit margins.
38
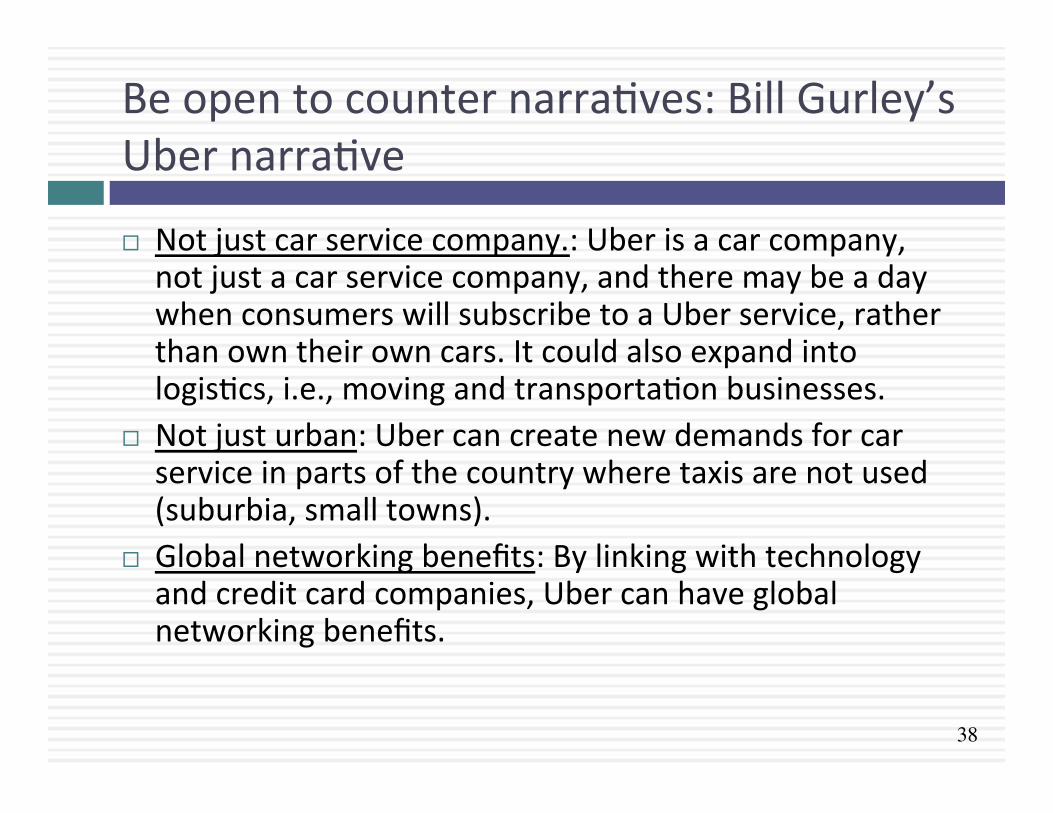
Be open to counter narraAves: Bill Gurley’s Uber narraAve
¨ Not just car service company.: Uber is a car company, not just a car service company, and there may be a day when consumers will subscribe to a Uber service, rather than own their own cars. It could also expand into logisAcs, i.e., moving and transportaAon businesses.
¨ Not just urban: Uber can create new demands for car service in parts of the country where taxis are not used (suburbia, small towns).
¨ Global networking benefits: By linking with technology and credit card companies, Uber can have global networking benefits.
39
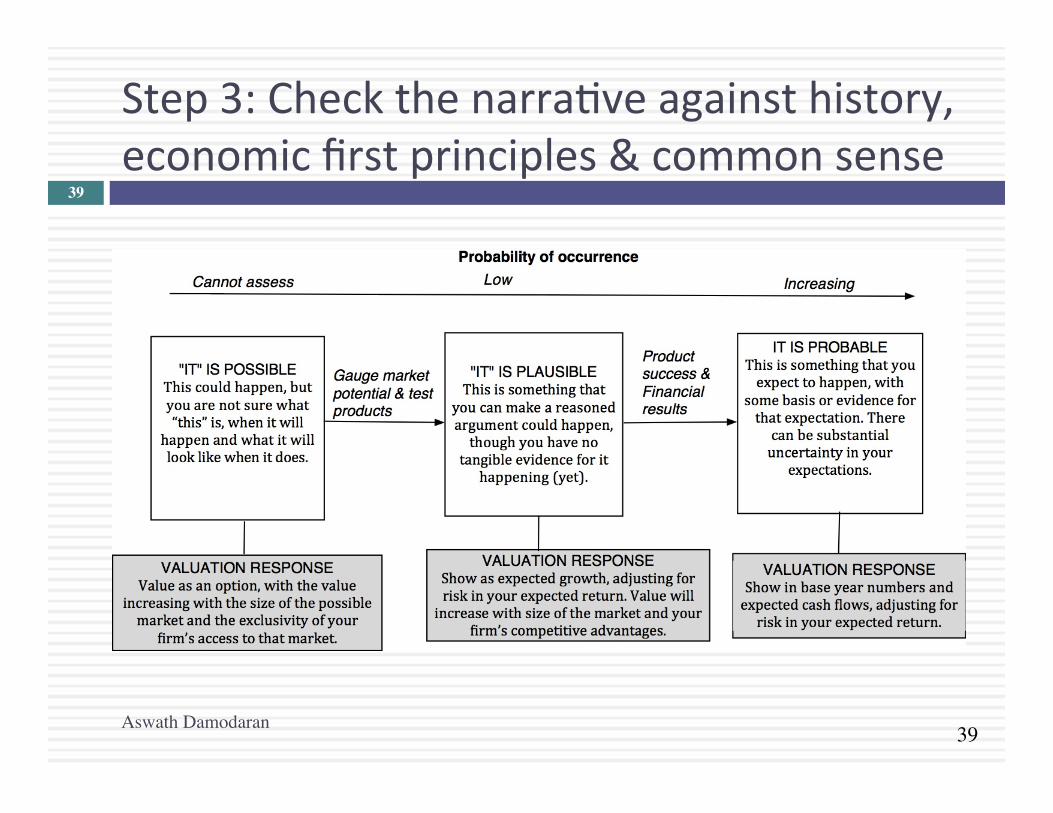
Step 3: Check the narraAve against history, economic first principles & common sense
Aswath Damodaran
39
40
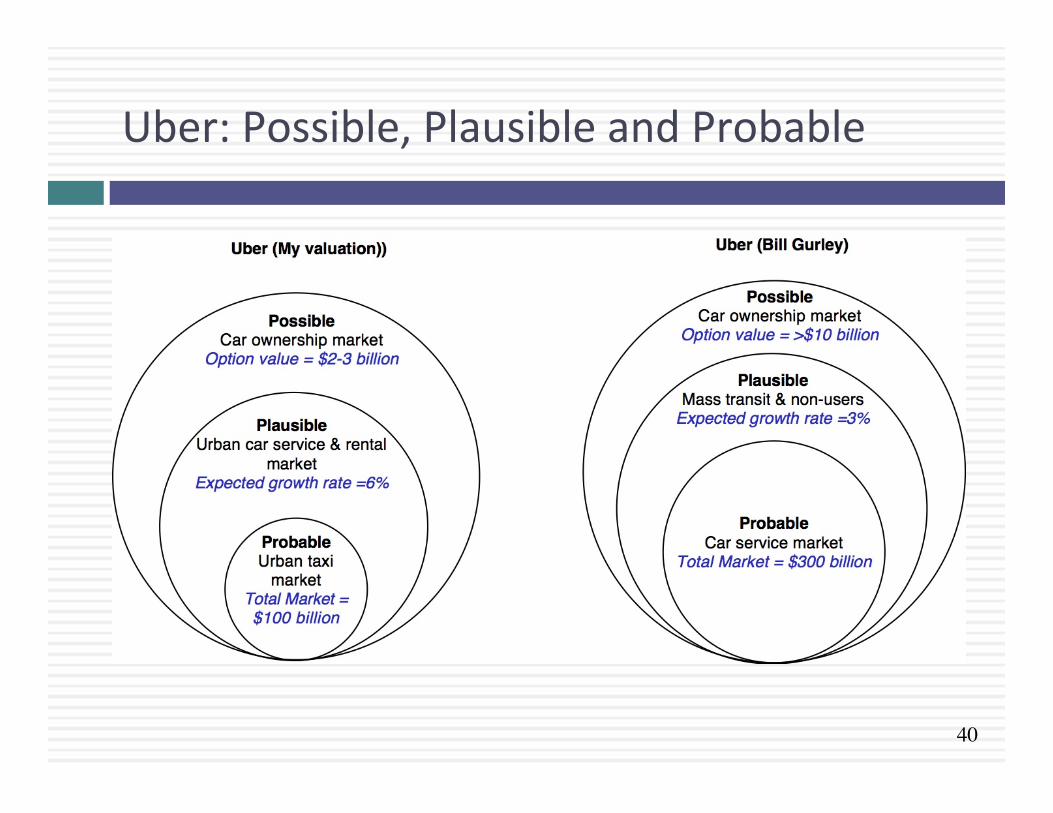
Uber: Possible, Plausible and Probable
41
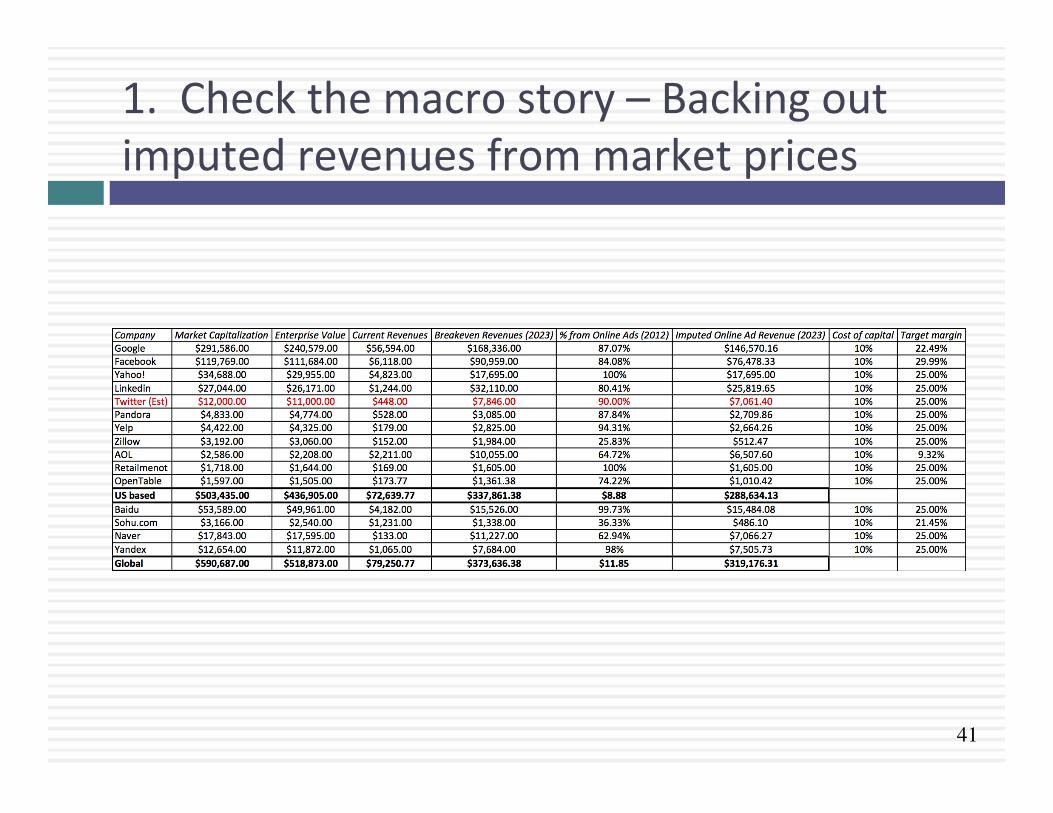
1. Check the macro story – Backing out imputed revenues from market prices
42
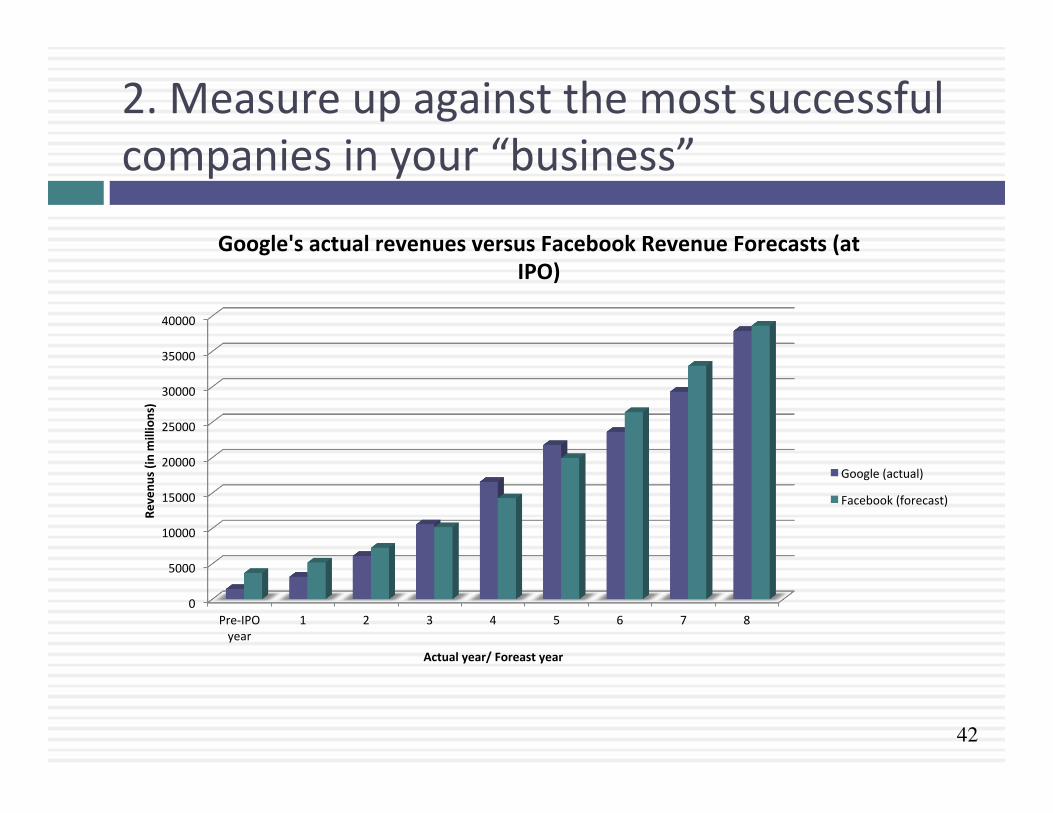
2. Measure up against the most successful companies in your “business”
0
5000
10000
15000
20000
25000
30000
35000
40000
Pre-‐IPO year
1 2 3 4 5 6 7 8
Revenu
s (in m
illions)
Actual year/ Foreast year
Google's actual revenues versus Facebook Revenue Forecasts (at IPO)
Google (actual)
Facebook (forecast)
43
3. IdenAfy the losers
¨ Apple: If Apple conAnues to dominate the smart phone business and generate high operaAng margins, the losers will be the other smart phone companies. (Do you buy that?)
¨ Twiher: If Twiher ends up with a market share of 20-‐25% of the online ad market, the losers will have to be Google and Facebook. (If you are also valuing those companies, are you showing dropping market shares for these companies?)
¨ Uber: If Uber succeeds as a urban car service company, that will be devastaAng for tradiAonal taxi cab companies (Work through the consequences for taxi cab medallion prices). If it succeeds as a logisAcs company, that will be bad for automobile companies. (Do you think that you should sell them short?)
44
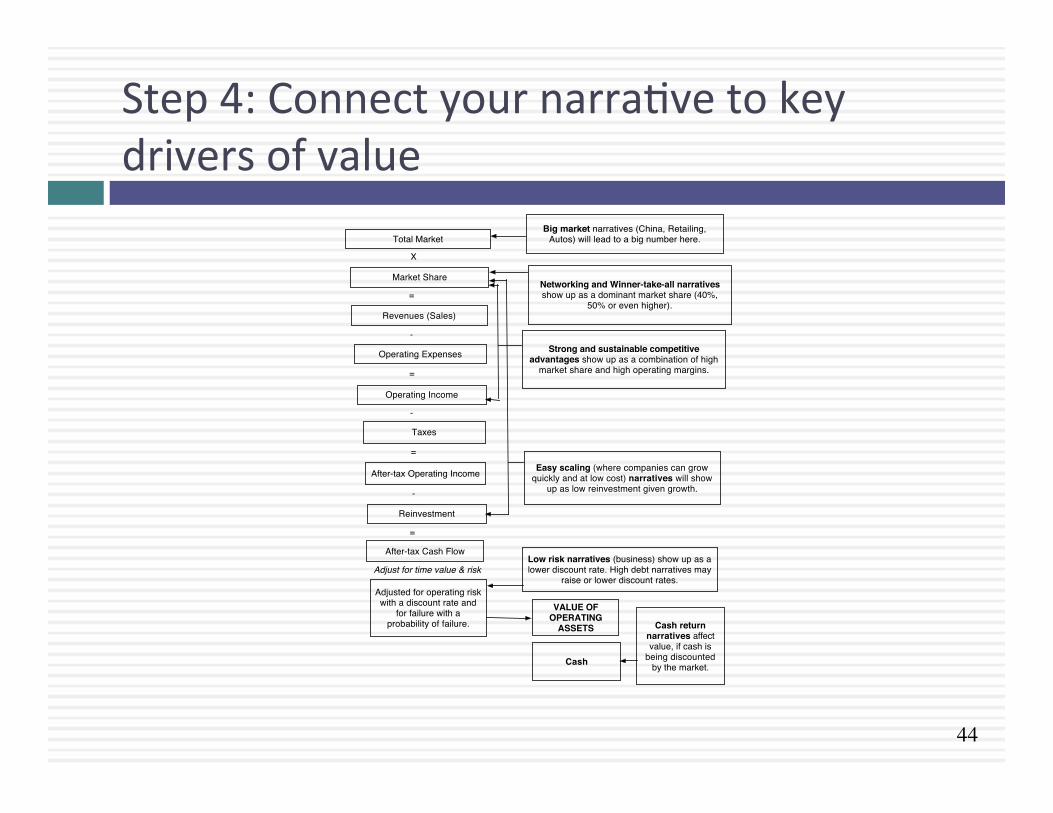
Step 4: Connect your narraAve to key drivers of value
Total Market
X
Market Share
=
Revenues (Sales)
-
Operating Expenses
=
Operating Income
-
Taxes
=
After-tax Operating Income
-
Big market narratives (China, Retailing, Autos) will lead to a big number here.
Reinvestment
=
After-tax Cash Flow
Networking and Winner-take-all narratives show up as a dominant market share (40%,
50% or even higher).
Strong and sustainable competitive advantages show up as a combination of high
market share and high operating margins.
Easy scaling (where companies can grow quickly and at low cost) narratives will show
up as low reinvestment given growth.
Low risk narratives (business) show up as a lower discount rate. High debt narratives may
raise or lower discount rates.Adjusted for operating risk with a discount rate and
for failure with a probability of failure.
VALUE OF OPERATING
ASSETS
Adjust for time value & risk
Cash
Cash return narratives affect value, if cash is
being discounted by the market.
45
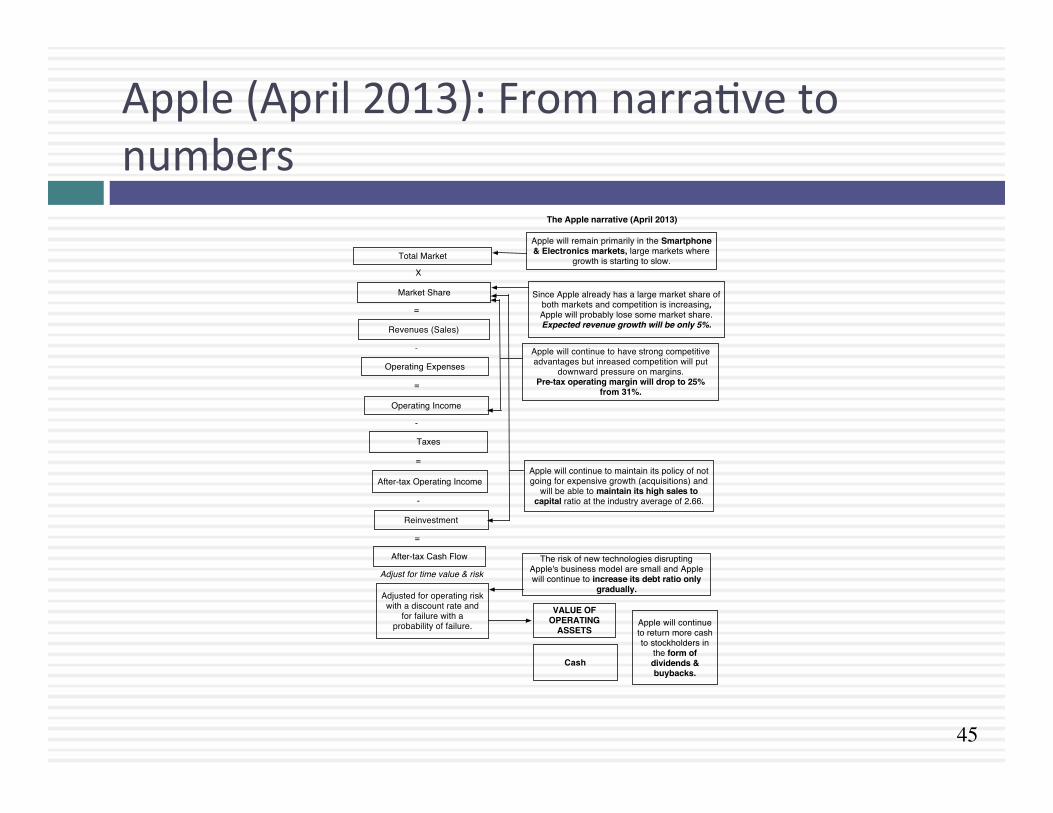
Apple (April 2013): From narraAve to numbers
Total Market
X
Market Share
=
Revenues (Sales)
-
Operating Expenses
=
Operating Income
-
Taxes
=
After-tax Operating Income
-
Apple will remain primarily in the Smartphone & Electronics markets, large markets where
growth is starting to slow.
Reinvestment
=
After-tax Cash Flow
Since Apple already has a large market share of both markets and competition is increasing, Apple will probably lose some market share. Expected revenue growth will be only 5%.
Apple will continue to have strong competitive advantages but inreased competition will put
downward pressure on margins.Pre-tax operating margin will drop to 25%
from 31%.
Apple will continue to maintain its policy of not going for expensive growth (acquisitions) and
will be able to maintain its high sales to capital ratio at the industry average of 2.66.
The risk of new technologies disrupting Apple's business model are small and Apple will continue to increase its debt ratio only
gradually.Adjusted for operating risk with a discount rate and
for failure with a probability of failure.
VALUE OF OPERATING
ASSETS
Adjust for time value & risk
The Apple narrative (April 2013)
Cash
Apple will continue to return more cash to stockholders in
the form of dividends & buybacks.
46
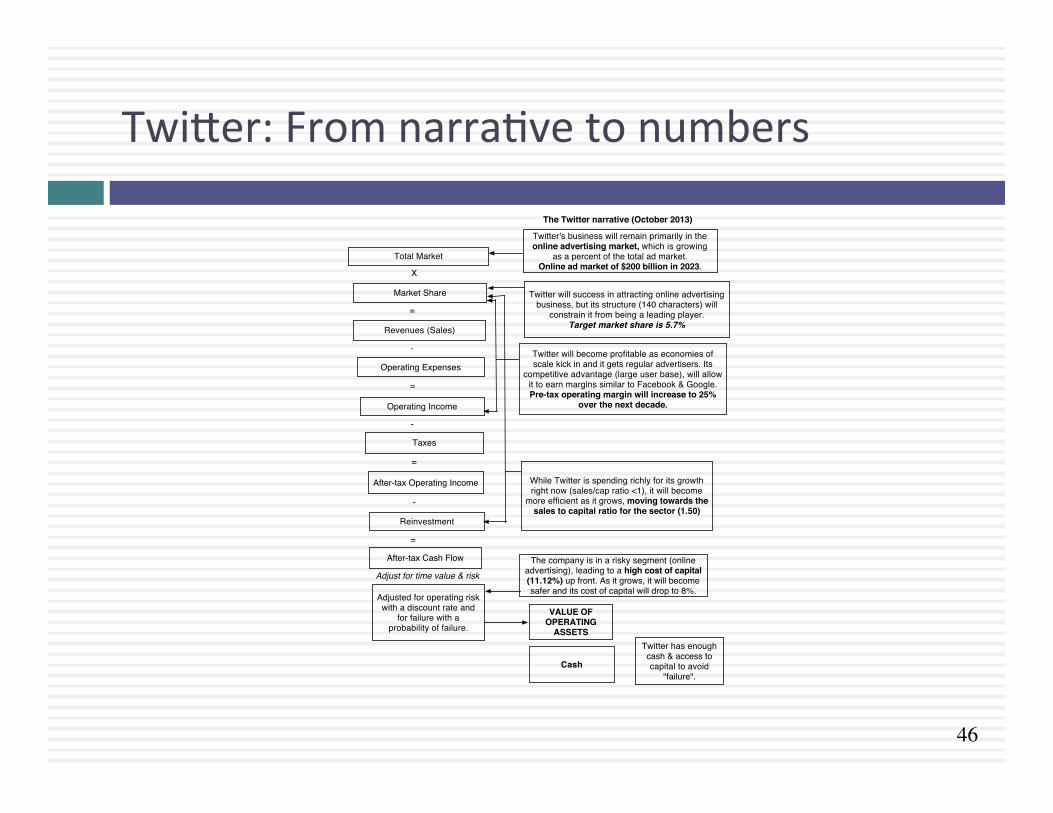
Twiher: From narraAve to numbers
Total Market
X
Market Share
=
Revenues (Sales)
-
Operating Expenses
=
Operating Income
-
Taxes
=
After-tax Operating Income
-
Twitter's business will remain primarily in the online advertising market, which is growing
as a percent of the total ad market.Online ad market of $200 billion in 2023.
Reinvestment
=
After-tax Cash Flow
Twitter will success in attracting online advertising business, but its structure (140 characters) will
constrain it from being a leading player.Target market share is 5.7%
Twitter will become profitable as economies of scale kick in and it gets regular advertisers. Its
competitive advantage (large user base), will allow it to earn margins similar to Facebook & Google.Pre-tax operating margin will increase to 25%
over the next decade.
While Twitter is spending richly for its growth right now (sales/cap ratio <1), it will become
more efficient as it grows, moving towards the sales to capital ratio for the sector (1.50)
The company is in a risky segment (online advertising), leading to a high cost of capital (11.12%) up front. As it grows, it will become safer and its cost of capital will drop to 8%.
Adjusted for operating risk with a discount rate and
for failure with a probability of failure.
VALUE OF OPERATING
ASSETS
Adjust for time value & risk
The Twitter narrative (October 2013)
Cash
Twitter has enough cash & access to capital to avoid
"failure".
47
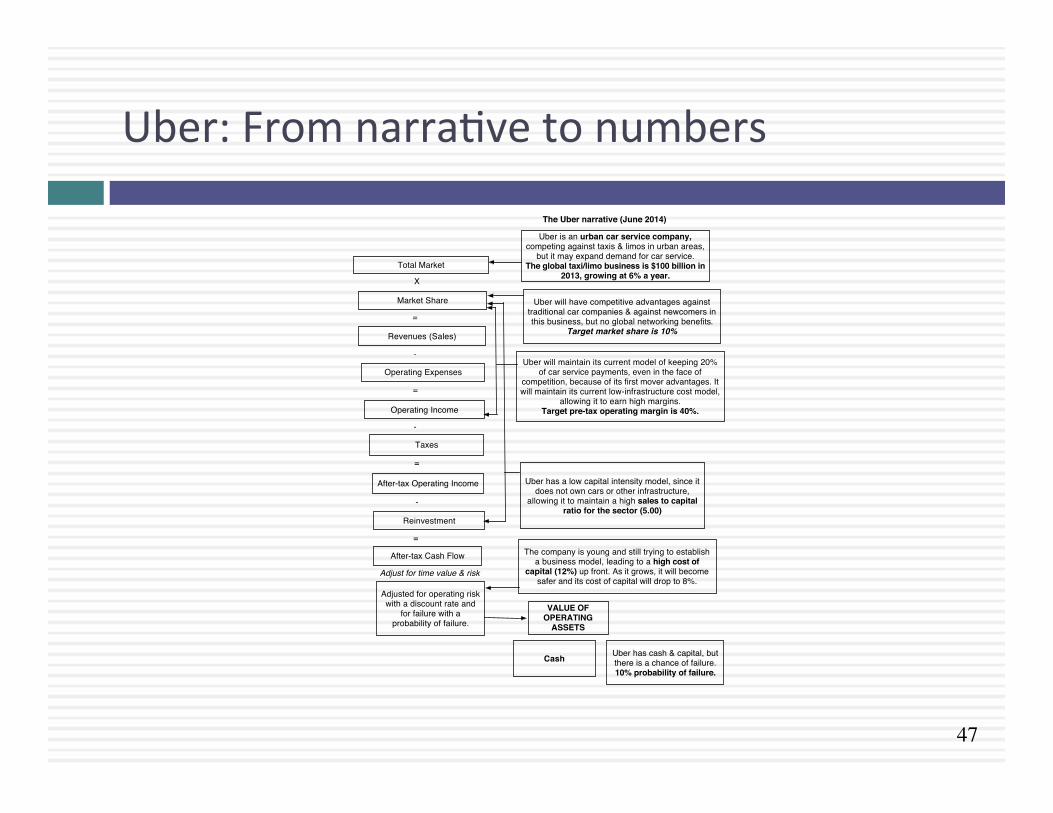
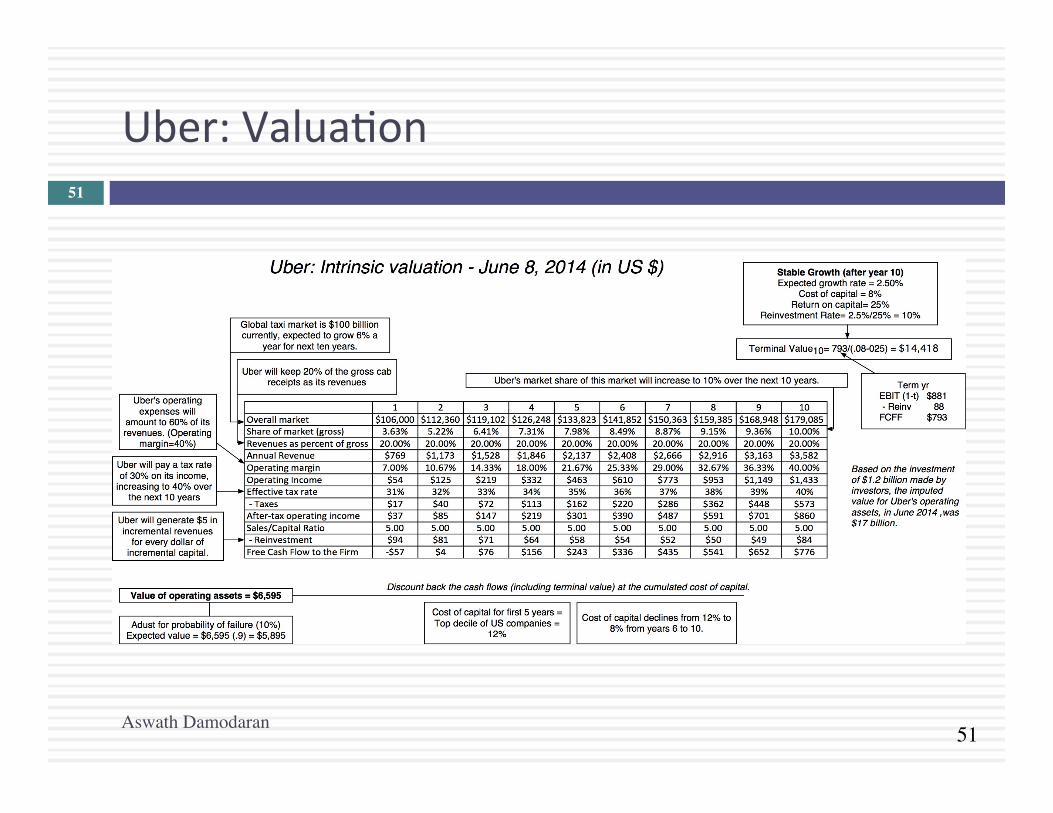
Uber: From narraAve to numbers
Total Market
X
Market Share
=
Revenues (Sales)
-
Operating Expenses
=
Operating Income
-
Taxes
=
After-tax Operating Income
-
Uber is an urban car service company, competing against taxis & limos in urban areas,
but it may expand demand for car service.The global taxi/limo business is $100 billion in
2013, growing at 6% a year.
Reinvestment
=
After-tax Cash Flow
Uber will have competitive advantages against traditional car companies & against newcomers in this business, but no global networking benefits.
Target market share is 10%
Uber will maintain its current model of keeping 20% of car service payments, even in the face of
competition, because of its first mover advantages. It will maintain its current low-infrastructure cost model,
allowing it to earn high margins.Target pre-tax operating margin is 40%.
Uber has a low capital intensity model, since it does not own cars or other infrastructure,
allowing it to maintain a high sales to capital ratio for the sector (5.00)
The company is young and still trying to establish a business model, leading to a high cost of
capital (12%) up front. As it grows, it will become safer and its cost of capital will drop to 8%.
Adjusted for operating risk with a discount rate and
for failure with a probability of failure.
VALUE OF OPERATING
ASSETS
Adjust for time value & risk
The Uber narrative (June 2014)
Cash Uber has cash & capital, but there is a chance of failure.10% probability of failure.
48
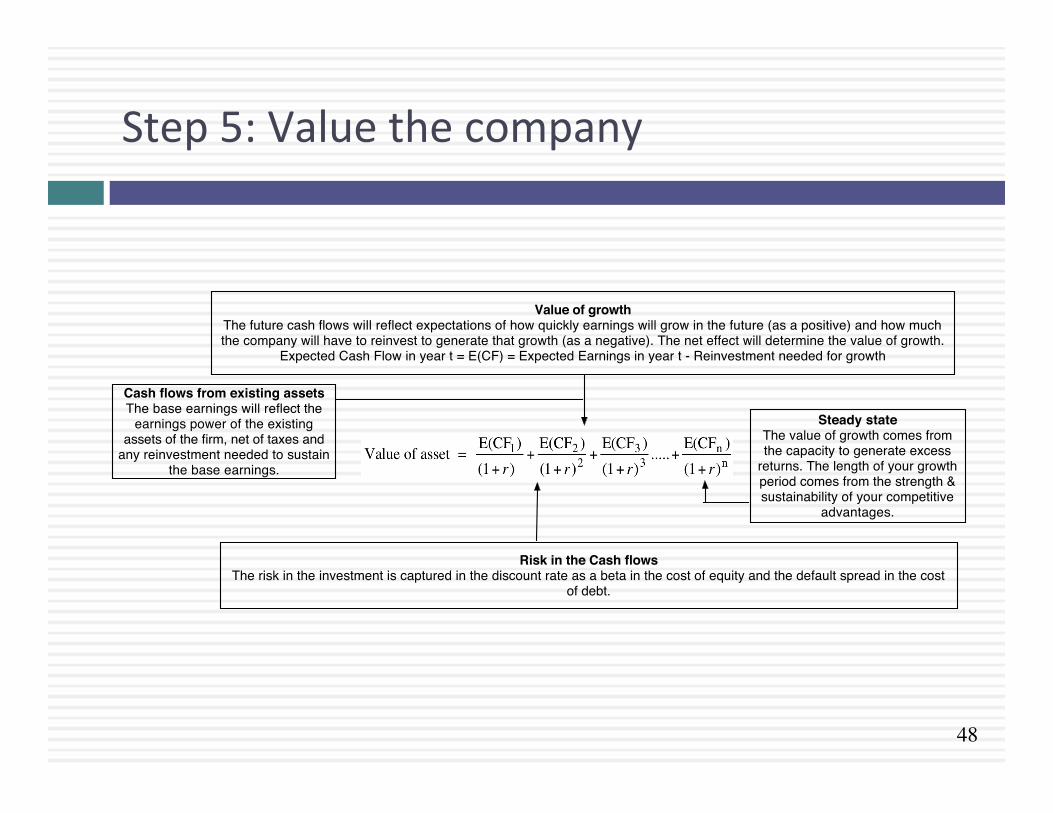
Step 5: Value the company
Cash flows from existing assetsThe base earnings will reflect the
earnings power of the existing assets of the firm, net of taxes and
any reinvestment needed to sustain the base earnings.
Value of growthThe future cash flows will reflect expectations of how quickly earnings will grow in the future (as a positive) and how much the company will have to reinvest to generate that growth (as a negative). The net effect will determine the value of growth.
Expected Cash Flow in year t = E(CF) = Expected Earnings in year t - Reinvestment needed for growth
Risk in the Cash flowsThe risk in the investment is captured in the discount rate as a beta in the cost of equity and the default spread in the cost
of debt.
Steady stateThe value of growth comes from the capacity to generate excess
returns. The length of your growth period comes from the strength & sustainability of your competitive
advantages.
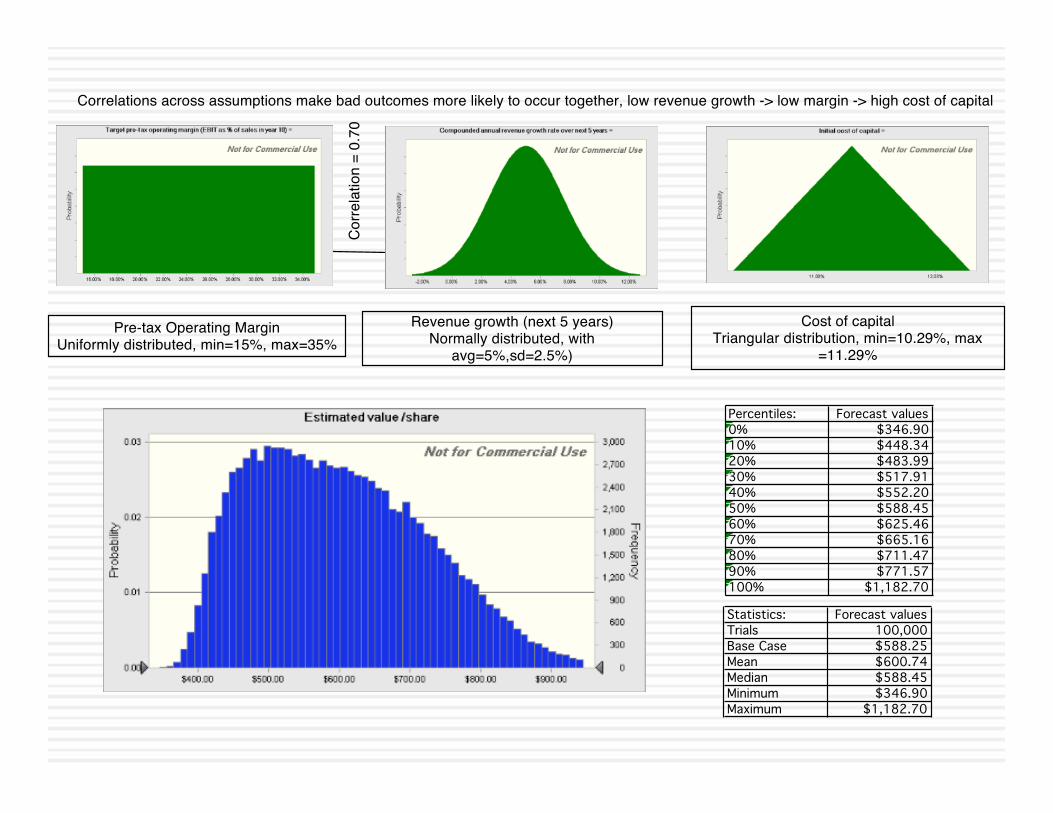
Revenue growth (next 5 years)Normally distributed, with
avg=5%,sd=2.5%)
Pre-tax Operating MarginUniformly distributed, min=15%, max=35%
Cost of capitalTriangular distribution, min=10.29%, max
=11.29%Co
rrela
tion
= 0.
70
Correlations across assumptions make bad outcomes more likely to occur together, low revenue growth -> low margin -> high cost of capital
Percentiles: Forecast values0% $346.9010% $448.3420% $483.9930% $517.9140% $552.2050% $588.4560% $625.4670% $665.1680% $711.4790% $771.57100% $1,182.70
Statistics: Forecast valuesTrials 100,000Base Case $588.25Mean $600.74Median $588.45Minimum $346.90Maximum $1,182.70
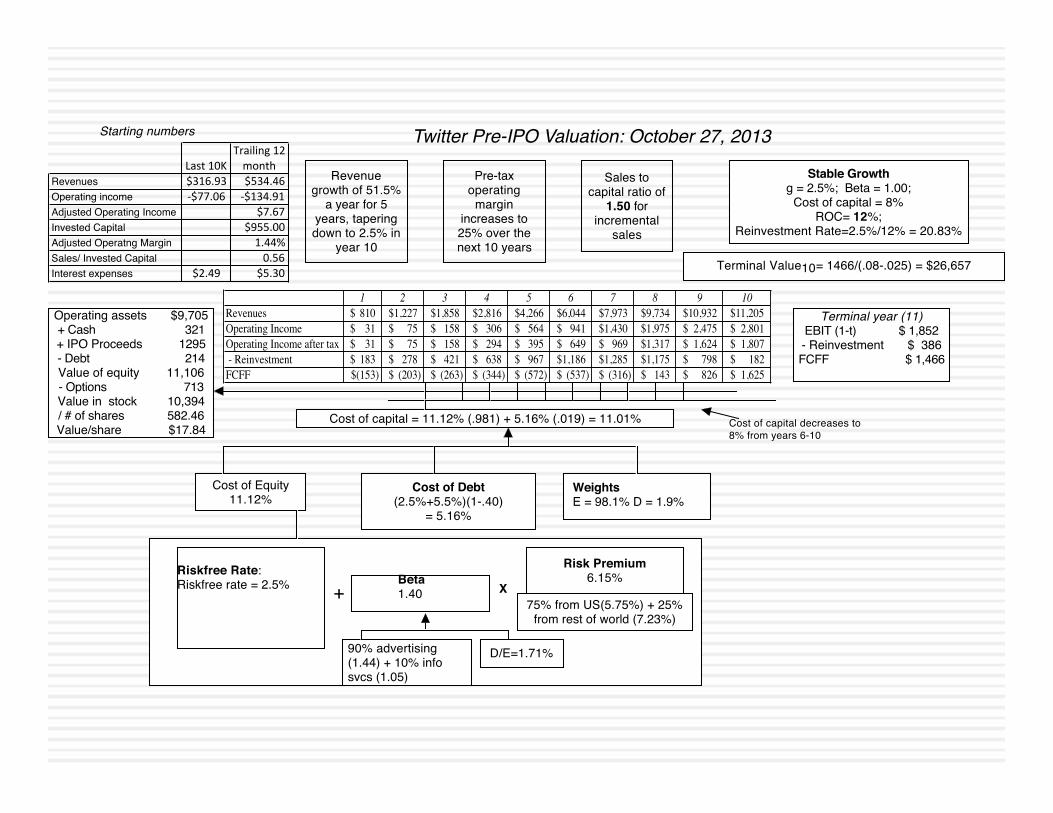
Terminal year (11)EBIT (1-t) $ 1,852- Reinvestment $ 386FCFF $ 1,466
Terminal Value10= 1466/(.08-.025) = $26,657
Cost of capital = 11.12% (.981) + 5.16% (.019) = 11.01%
90% advertising (1.44) + 10% info svcs (1.05)
Risk Premium6.15%
Operating assets $9,705+ Cash 321+ IPO Proceeds 1295- Debt 214Value of equity 11,106- Options 713Value in stock 10,394/ # of shares 582.46Value/share $17.84
Cost of Debt(2.5%+5.5%)(1-.40)
= 5.16%
Cost of Equity11.12%
Stable Growthg = 2.5%; Beta = 1.00;
Cost of capital = 8% ROC= 12%;
Reinvestment Rate=2.5%/12% = 20.83%
WeightsE = 98.1% D = 1.9%
Riskfree Rate:Riskfree rate = 2.5% +
Beta 1.40 X
Cost of capital decreases to 8% from years 6-10
D/E=1.71%
Twitter Pre-IPO Valuation: October 27, 2013
Revenue growth of 51.5%
a year for 5 years, tapering down to 2.5% in
year 10
Pre-tax operating
margin increases to 25% over the next 10 years
Sales to capital ratio of
1.50 for incremental
sales
Starting numbers
75% from US(5.75%) + 25% from rest of world (7.23%)
Last%10KTrailing%12%month
Revenues $316.93 $534.46Operating income :$77.06 :$134.91Adjusted Operating Income $7.67Invested Capital $955.00Adjusted Operatng Margin 1.44%Sales/ Invested Capital 0.56Interest expenses $2.49 $5.30
1 2 3 4 5 6 7 8 9 10Revenues 810$ 1,227$ 1,858$ 2,816$ 4,266$ 6,044$ 7,973$ 9,734$ 10,932$ 11,205$ Operating Income 31$ 75$ 158$ 306$ 564$ 941$ 1,430$ 1,975$ 2,475$ 2,801$ Operating Income after tax 31$ 75$ 158$ 294$ 395$ 649$ 969$ 1,317$ 1,624$ 1,807$ - Reinvestment 183$ 278$ 421$ 638$ 967$ 1,186$ 1,285$ 1,175$ 798$ 182$ FCFF (153)$ (203)$ (263)$ (344)$ (572)$ (537)$ (316)$ 143$ 826$ 1,625$
51
Uber: ValuaAon
Aswath Damodaran
51
52
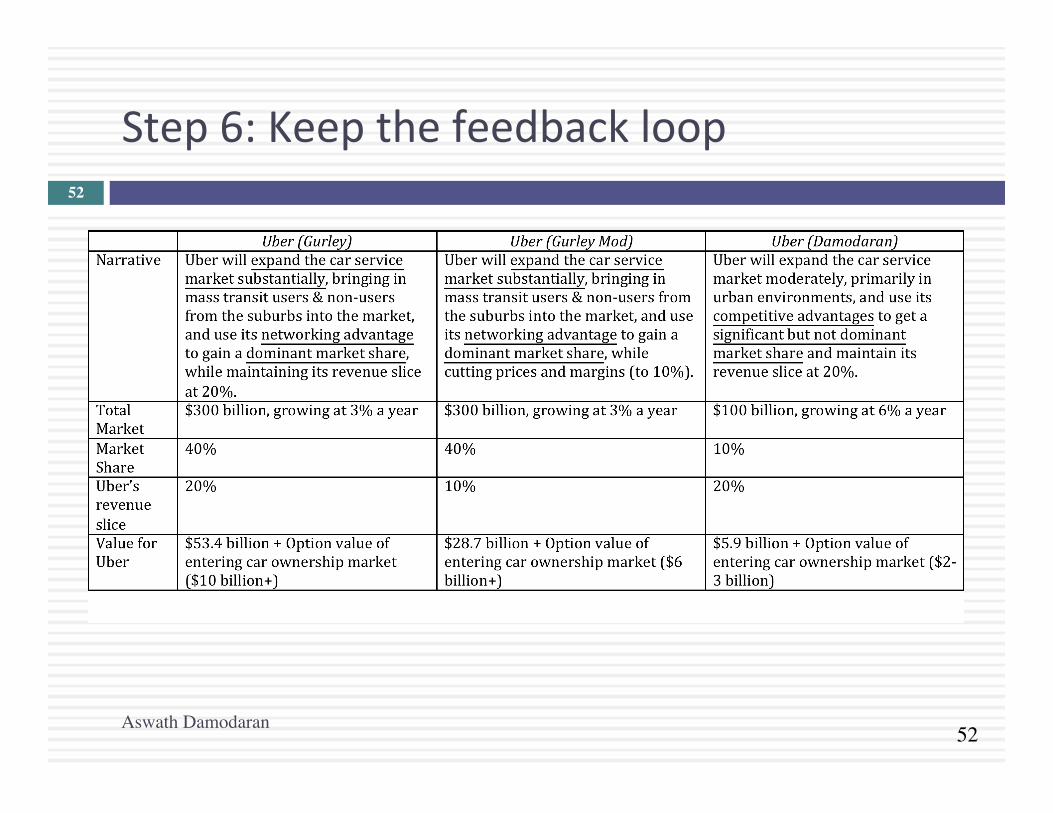
Step 6: Keep the feedback loop
Aswath Damodaran
52
“When my informaAon changes, I alter my conclusions. What do you do, sir?”
Lord Keynes
NarraAve breaks, shi^s & changes
54
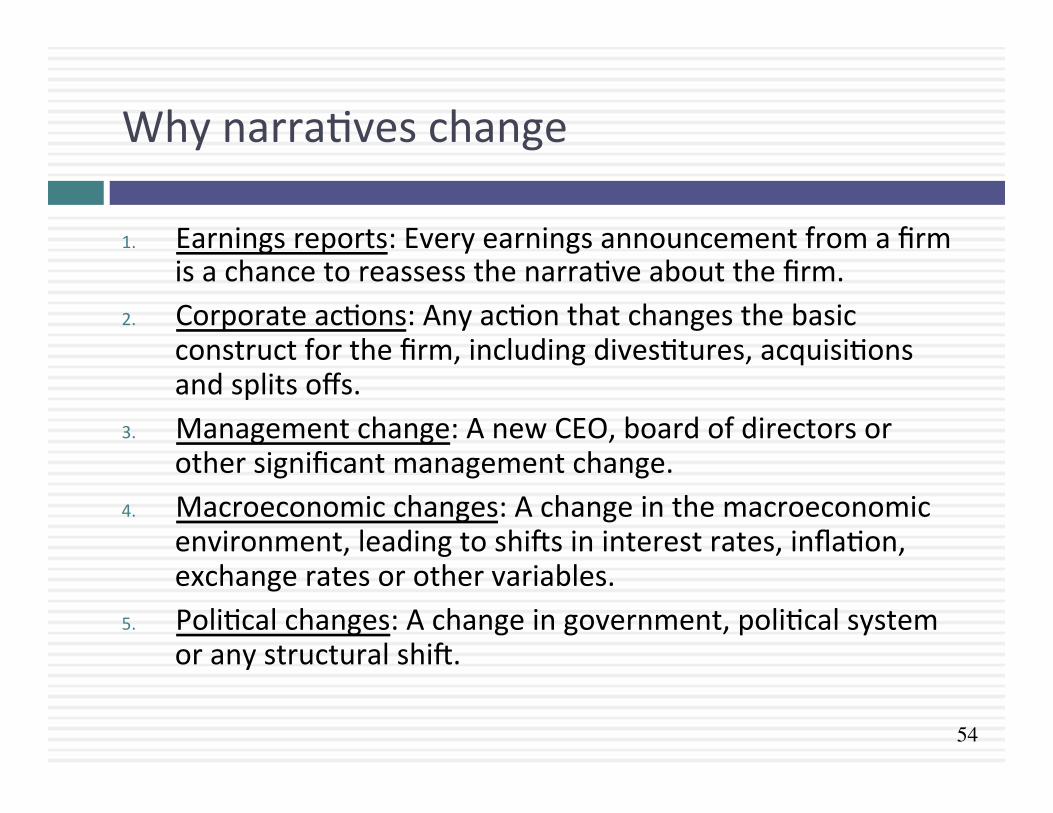
Why narraAves change
1. Earnings reports: Every earnings announcement from a firm is a chance to reassess the narraAve about the firm.
2. Corporate acAons: Any acAon that changes the basic construct for the firm, including divesAtures, acquisiAons and splits offs.
3. Management change: A new CEO, board of directors or other significant management change.
4. Macroeconomic changes: A change in the macroeconomic environment, leading to shi^s in interest rates, inflaAon, exchange rates or other variables.
5. PoliAcal changes: A change in government, poliAcal system or any structural shi^.
55
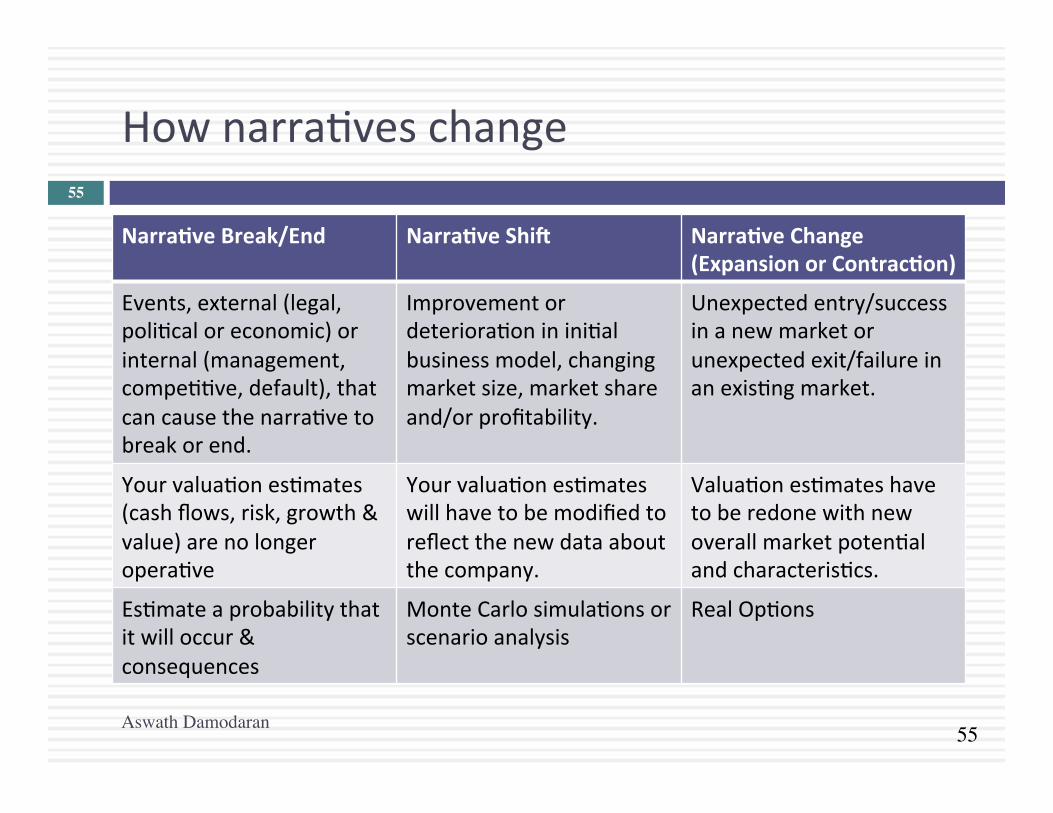
How narraAves change
Narra.ve Break/End Narra.ve ShiT Narra.ve Change (Expansion or Contrac.on)
Events, external (legal, poliAcal or economic) or internal (management, compeAAve, default), that can cause the narraAve to break or end.
Improvement or deterioraAon in iniAal business model, changing market size, market share and/or profitability.
Unexpected entry/success in a new market or unexpected exit/failure in an exisAng market.
Your valuaAon esAmates (cash flows, risk, growth & value) are no longer operaAve
Your valuaAon esAmates will have to be modified to reflect the new data about the company.
ValuaAon esAmates have to be redone with new overall market potenAal and characterisAcs.
EsAmate a probability that it will occur & consequences
Monte Carlo simulaAons or scenario analysis
Real OpAons
Aswath Damodaran
55
56
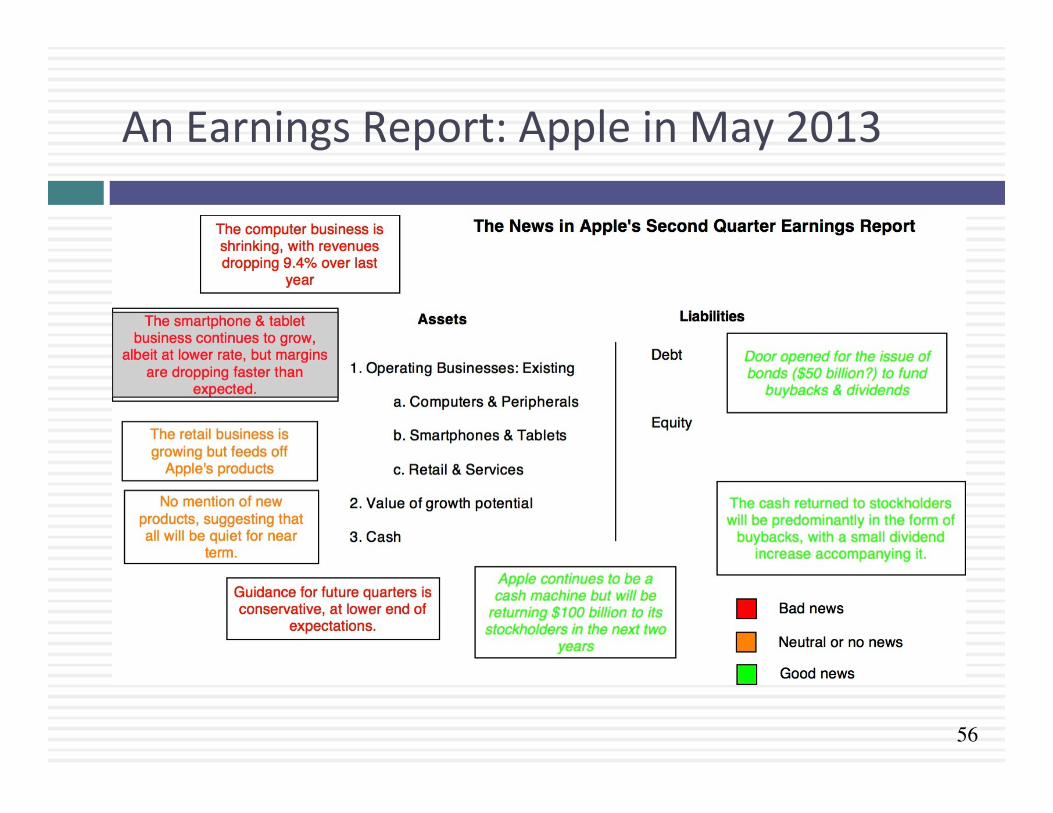
An Earnings Report: Apple in May 2013
57
Apple: Another Earnings Report (September 2014)
In September 2014, Apple reported its third quarter earnings. While much of the informaAon followed predictable paherns (Apple sAll gets the bulk of its revenues from smartphones, a market that is seeing slowing growth and smaller margins), Apple did announce two new products: the iWatch and Apple Pay. 1. Do you think either of these new products has the
capacity to alter the current narraAve for Apple? 2. If so, which one has the greater potenAal? 3. What are some of the indicators you will track to see if
this potenAal is being captured?
58
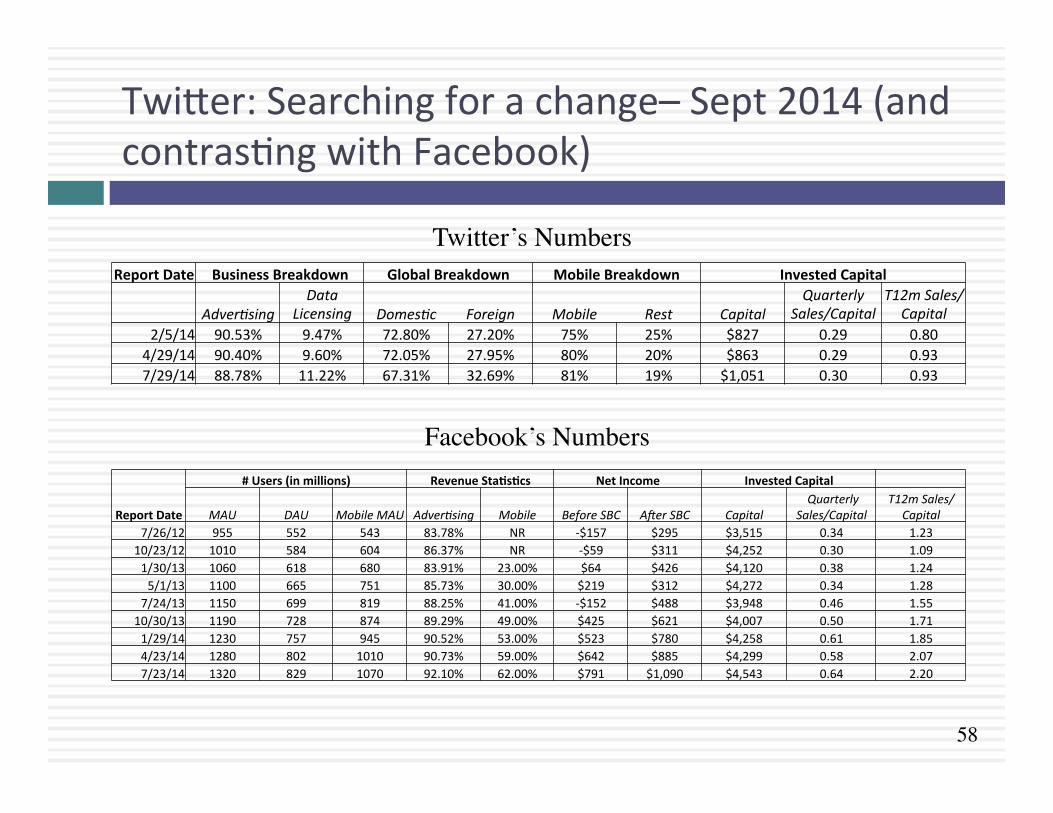
Twiher: Searching for a change– Sept 2014 (and contrasAng with Facebook)
Report Date Business Breakdown Global Breakdown Mobile Breakdown Invested Capital
Adver4sing Data
Licensing Domes4c Foreign Mobile Rest Capital Quarterly
Sales/Capital T12m Sales/
Capital 2/5/14 90.53% 9.47% 72.80% 27.20% 75% 25% $827 0.29 0.80 4/29/14 90.40% 9.60% 72.05% 27.95% 80% 20% $863 0.29 0.93 7/29/14 88.78% 11.22% 67.31% 32.69% 81% 19% $1,051 0.30 0.93
Twitter’s Numbers
Report Date
# Users (in millions) Revenue Sta.s.cs Net Income Invested Capital
MAU DAU Mobile MAU Adver4sing Mobile Before SBC AKer SBC Capital Quarterly
Sales/Capital T12m Sales/
Capital 7/26/12 955 552 543 83.78% NR -‐$157 $295 $3,515 0.34 1.23 10/23/12 1010 584 604 86.37% NR -‐$59 $311 $4,252 0.30 1.09 1/30/13 1060 618 680 83.91% 23.00% $64 $426 $4,120 0.38 1.24 5/1/13 1100 665 751 85.73% 30.00% $219 $312 $4,272 0.34 1.28 7/24/13 1150 699 819 88.25% 41.00% -‐$152 $488 $3,948 0.46 1.55 10/30/13 1190 728 874 89.29% 49.00% $425 $621 $4,007 0.50 1.71 1/29/14 1230 757 945 90.52% 53.00% $523 $780 $4,258 0.61 1.85 4/23/14 1280 802 1010 90.73% 59.00% $642 $885 $4,299 0.58 2.07 7/23/14 1320 829 1070 92.10% 62.00% $791 $1,090 $4,543 0.64 2.20
Facebook’s Numbers
59
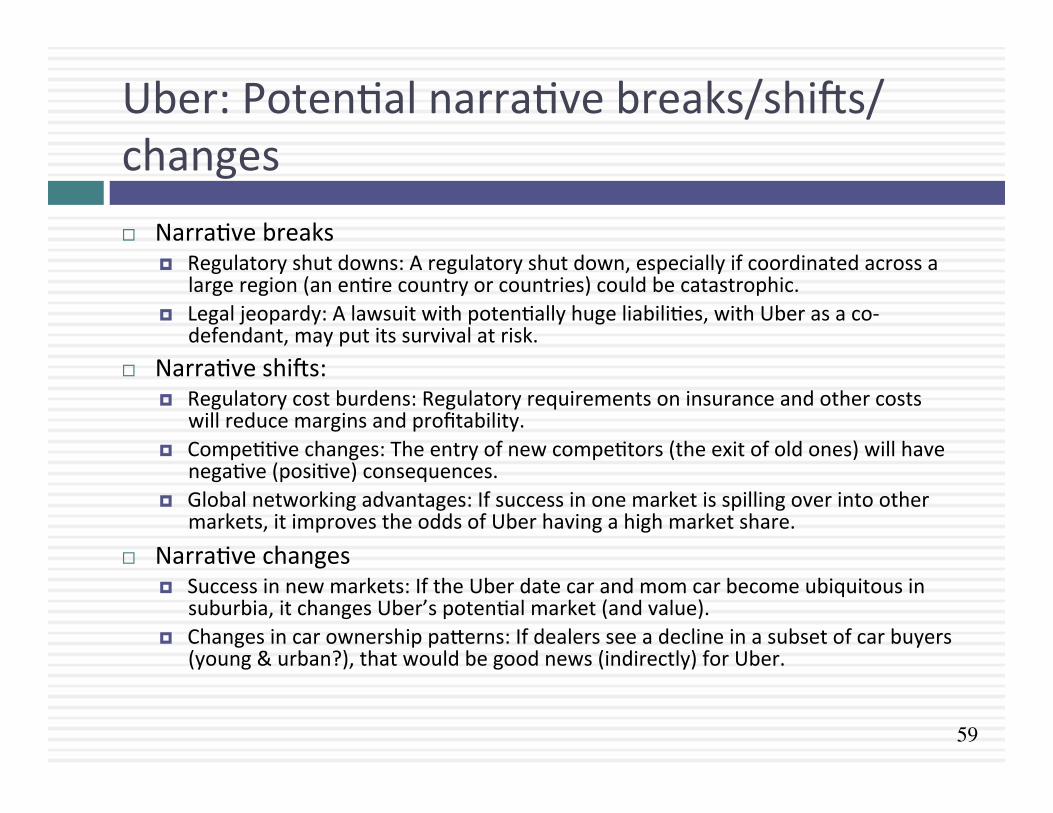
Uber: PotenAal narraAve breaks/shi^s/changes ¨ NarraAve breaks
¤ Regulatory shut downs: A regulatory shut down, especially if coordinated across a large region (an enAre country or countries) could be catastrophic.
¤ Legal jeopardy: A lawsuit with potenAally huge liabiliAes, with Uber as a co-‐defendant, may put its survival at risk.
¨ NarraAve shi^s: ¤ Regulatory cost burdens: Regulatory requirements on insurance and other costs
will reduce margins and profitability. ¤ CompeAAve changes: The entry of new compeAtors (the exit of old ones) will have
negaAve (posiAve) consequences. ¤ Global networking advantages: If success in one market is spilling over into other
markets, it improves the odds of Uber having a high market share. ¨ NarraAve changes
¤ Success in new markets: If the Uber date car and mom car become ubiquitous in suburbia, it changes Uber’s potenAal market (and value).
¤ Changes in car ownership paherns: If dealers see a decline in a subset of car buyers (young & urban?), that would be good news (indirectly) for Uber.
“Management is, above all, a pracAce where art, science, and cra^ meet”
Management: NarraAves, Numbers and AcAons
61
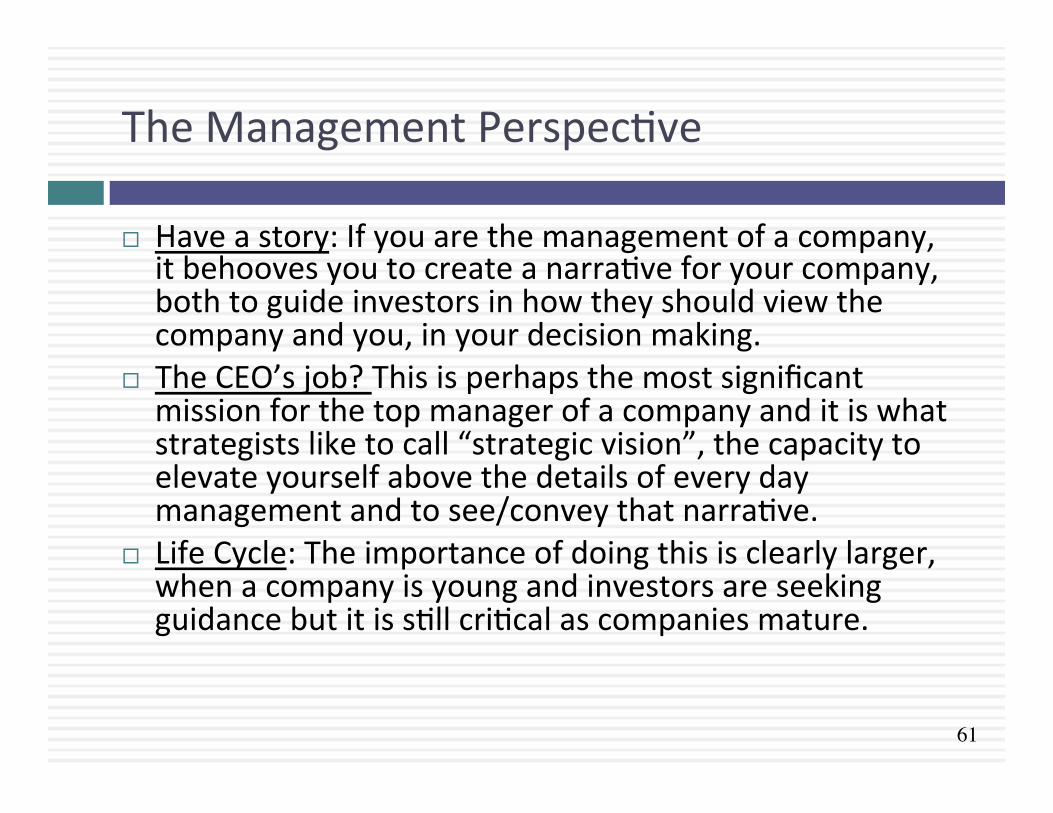
The Management PerspecAve
¨ Have a story: If you are the management of a company, it behooves you to create a narraAve for your company, both to guide investors in how they should view the company and you, in your decision making.
¨ The CEO’s job? This is perhaps the most significant mission for the top manager of a company and it is what strategists like to call “strategic vision”, the capacity to elevate yourself above the details of every day management and to see/convey that narraAve.
¨ Life Cycle: The importance of doing this is clearly larger, when a company is young and investors are seeking guidance but it is sAll criAcal as companies mature.
62
1. Develop a compelling, coherent narraAve
1. Think like an investor: The steps involved in investors deriving a narraAve for a company are idenAcal to those needed by management: you have to develop a narraAve, grounded in reality.
2. Use evidence (informaAon) for feedback: The difference is that as managers, you have more power to act to deliver on that narraAve and to potenAally make it more expansive.
3. And your influence over outcomes: You also have access to more informaAon, some of which may lead you to narrow your narraAve and others to alter it.
63
2. Sell it to investors/employees/customers
1. CommunicaAon skills: You have to be able to sell the narraAve to investors, with just the right mix of numbers and story telling. You also have to get employees in your company to buy into your narraAve and customers to go along.
2. Past experience: You will have more credibility, if you have converted narraAve to numbers before, in other companies.
3. Charisma: Like anyone selling a big story, it helps to have a big personality and the charisma to get people to believe in your narraAve (and in your capacity to convert the narraAve to numbers).
64
3. Act consistently with your narraAve
¨ If you have sold the world on your narraAve, you should act consistently with that narraAve in terms of ¤ Where, how much and when you invest the company’s resources.
¤ The trade offs you make in decisions ¤ The measures that you use to evaluate yourself and your progress on the narraAve.
¨ If you act in ways that are inconsistent with your own narraAve, you will lose long term (even if you may gain short term). Not only will you lose credibility with your investors, but your employees will take their cues from you about what mahers and what does not.
65
4. Try to deliver numbers that back up narraAve and be accountable when you do not..
1. Link numbers to narraAve: When you report numbers to your investors, it is important that you Ae those numbers (and how they are changing) with your narraAve.
2. If numbers confirm narraAve, restate the narraAve: If the numbers are advancing your narraAve, you should not only take credit for them but use it as your chance to restate your narraAve.
3. Don’t hide from bad numbers: If the numbers are contrary to narraAve, face up to them and either explain why your narraAve has not changed (in spite of the numbers) or has changed (because of the numbers)
66
5. Don’t get distracted
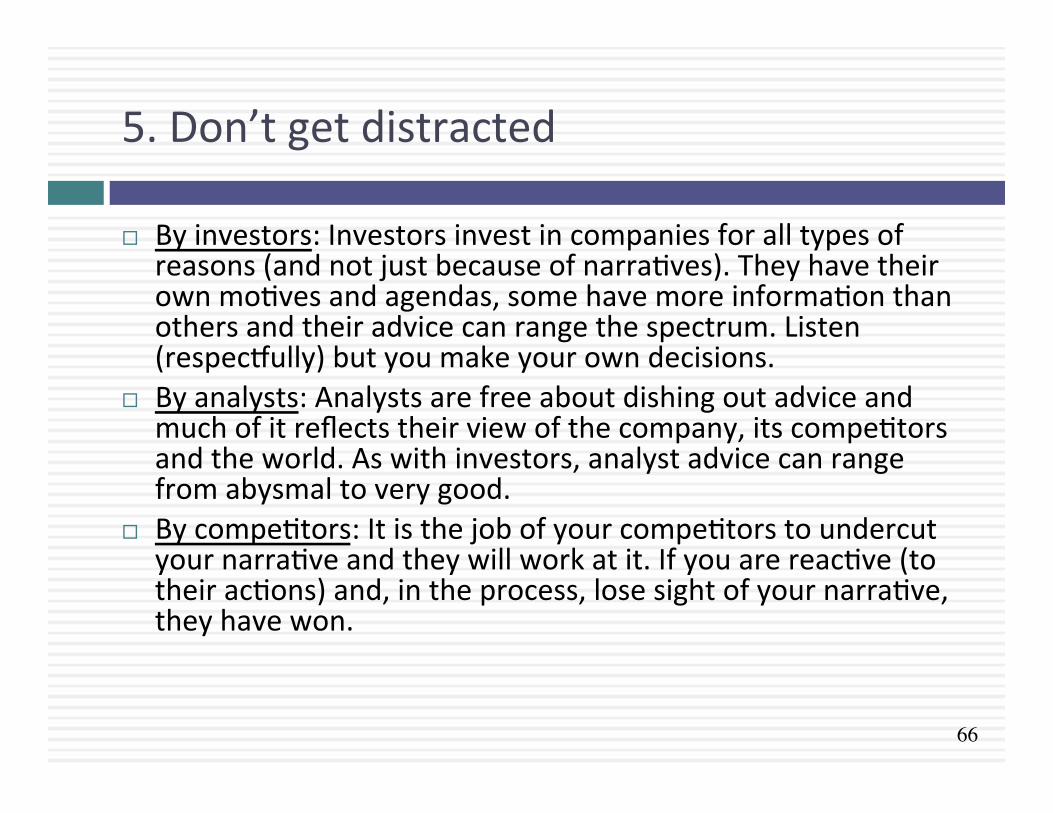
¨ By investors: Investors invest in companies for all types of reasons (and not just because of narraAves). They have their own moAves and agendas, some have more informaAon than others and their advice can range the spectrum. Listen (respeczully) but you make your own decisions.
¨ By analysts: Analysts are free about dishing out advice and much of it reflects their view of the company, its compeAtors and the world. As with investors, analyst advice can range from abysmal to very good.
¨ By compeAtors: It is the job of your compeAtors to undercut your narraAve and they will work at it. If you are reacAve (to their acAons) and, in the process, lose sight of your narraAve, they have won.
“Growing old is mandatory; growing up is opAonal.”
A Company’s Life Cycle: NarraAve & Numbers
68
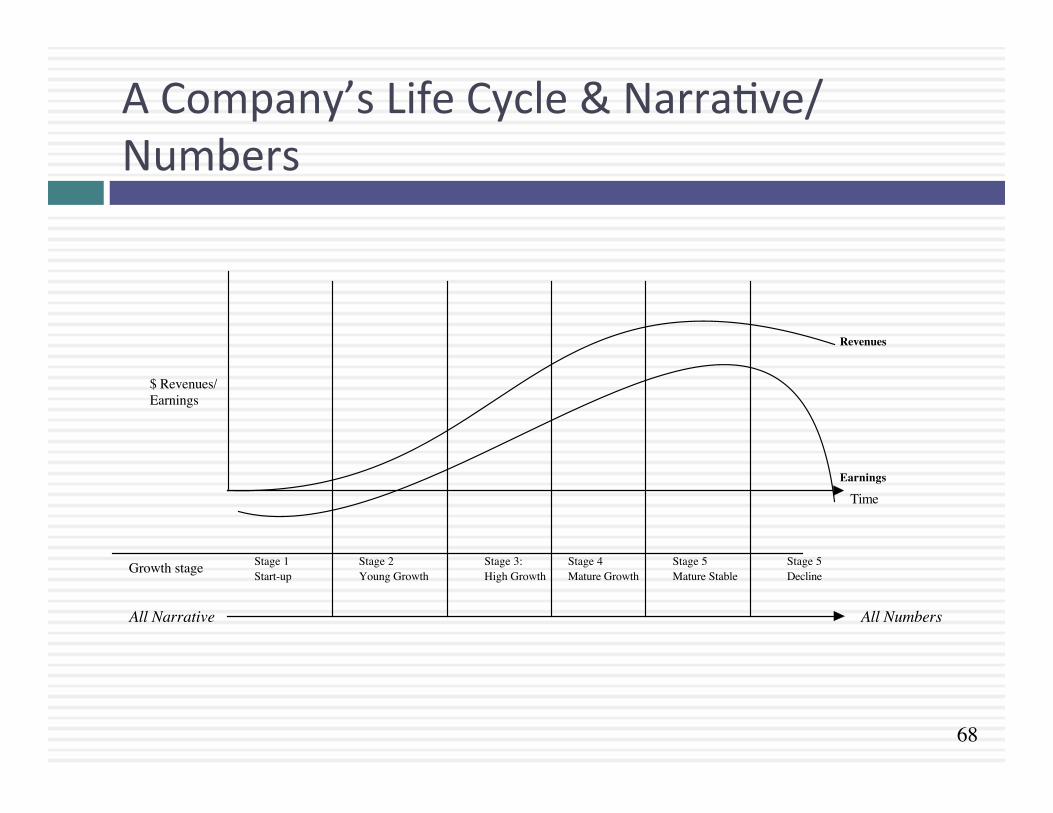
A Company’s Life Cycle & NarraAve/Numbers
Stage 2Young Growth
Stage 1Start-up
Stage 4Mature Growth
Stage 5Decline
Revenues
Earnings
Stage 3:High Growth
All Narrative
Growth stage
$ Revenues/Earnings
Time
Stage 5Mature Stable
All Numbers
69
As companies age, the emphasis shi^s..
¨ Early in a company’s life, when all you have are ideas and no clear business plan, it is all about the narraAve. Not surprisingly, the most successful managers/investors at this stage are people who are stronger on narraAve.
¨ As companies age, the emphasis shi^s to numbers, partly because more of the value is determined by the narraAve that has actually unfolded and partly because there are more numbers to focus on. The most successful managers/investors become people who are stronger on numbers.
70
As emphasis shi^s, managers and investors can resist, adapt or move on
¨ As young start-‐ups succeed and start moving into the growth, the managers who were instrumental in their success have three choices: ¤ Adapt and adjust their focus to include numbers, without giving up their narraAve.
¤ Stay completely focused on narraAve and ignore numbers. ¤ Hand over control of the operaAng details of the company to a numbers person while handling the narraAve part.
¨ With investors, the transiAon is made easier by the existence of public markets. As companies go public, these investors can cash out and go back to their preferred habitat. Investors who stray far from their strengths will pay a price.
71
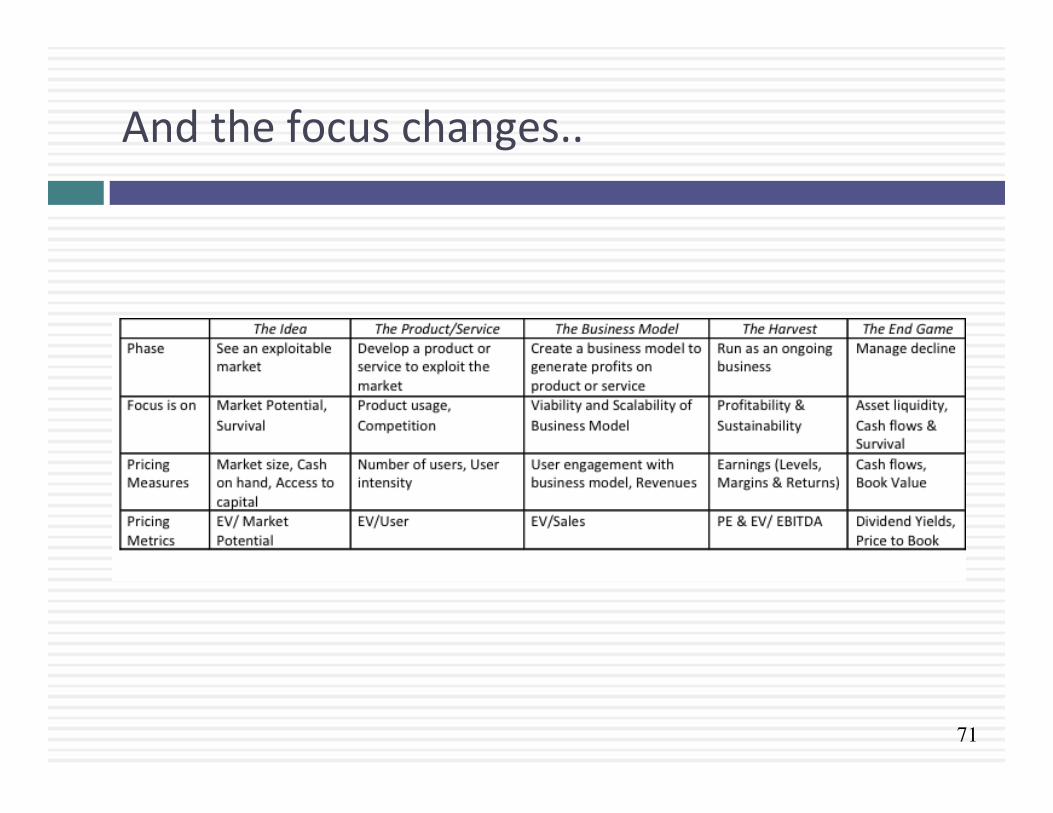
And the focus changes..

“There is no real ending. It’s just the place where you stop the story.”
The End