Embed Size (px)
Citation preview
1
2018 Ohio State University Injury Biomechanics Symposium
This paper has not been peer- reviewed.
Numerical Analysis of Driver Thoracolumbar Spine Response in
Frontal Crash Reconstruction
Xin Ye1,2
, Derek Jones1,2
, James Gaewsky1,2
, Logan Miller1,2
,
Joel Stitzel1,2
, Ashley Weaver1,2
1 Wake Forest University School of Medicine;
2 Virginia Tech -Wake Forest University Center
for Injury Biomechanics
ABSTRACT
This study aimed to reconstruct 11 motor vehicle crashes (six with thoracolumbar fractures and
five without thoracolumbar fractures), and analyze the fracture mechanism, fracture pattern,
associated vehicle parameters and driver attributes affecting fracture risk. Eleven frontal
crashes were reconstructed with a finite element simplified vehicle model (SVM). The SVM was
tuned to each case vehicle and the Total HUman Model for Safety (THUMS) v4.01 was scaled
and positioned in a baseline configuration to mimic the pre-crash driver posture. For the six
thoracolumbar fracture cases, 120 simulations to quantify uncertainty and variation were
performed using a Latin Hypercube Design of Experiments (DOE) to vary: seat track position,
seatback angle, steering column angle, steering column position, and D-ring height. Vertebral
loads and bending moments were analyzed. Maximum principal strain and stress were collected
in the vertebral cortical and trabecular bone. DOE data were fit to regression models to examine
occupant positioning and thoracolumbar response correlations. Of the 11 cases, both the
vertebral compression force and bending moment progressively increased from superior to
inferior vertebrae. Two thoracic spine fracture cases had higher compression force and bending
moment across all thoracic vertebral levels, compared to nine cases without thoracic spine
fractures (force: 1200.6 vs. 640.8 N; moment: 13.7 vs. 9.2 Nm). While there was no apparent
difference in bending moment at the L1-L2 vertebrae, lumbar fracture cases exhibited higher
vertebral bending moments in L3-L4 (fracture/non-fracture: 45.7 vs. 33.8 Nm). A rearward seat
track position and reclined seatback increased the thoracic spine bending moment by 111-329%.
A more reclined seatback increased the lumbar force and bending moment by 16-165% and 67-
172%, respectively. This study provided a computational framework for assessing
thoracolumbar fractures, and also quantified the effect of pre-crash driver posture on fracture
risk. Results aid in the understanding of factors contributing to thoracolumbar fractures.
INTRODUCTION
Despite recent advancement in vehicle crashworthiness, thoracic and lumbar spine
fractures remain a problem. The incidence of thoracolumbar fractures in frontal crashes has
increased as a function of vehicle model year from 1986 to 2008 in National Automotive
Sampling System-Crashworthiness Data System (NASS-CDS) (Pintar et al. 2012). Other
analyses of NASS-CDS, the National Trauma Databank (NTDB) and National Inpatient Sample
(NIS) have shown thoracolumbar spine injury incidence increased over time when adjusting for
2
2018 Ohio State University Injury Biomechanics Symposium
This paper has not been peer- reviewed.
age (Doud et al. 2015). Similarly, vertebral fracture incidence increased in motor vehicle crashes
(MVCs) from 1994 to 2002 in Crash Outcome Data Evaluation System data, despite the
concomitant increase in seatbelt and airbag use (Wang et al. 2009). Analysis of 1996-2011 Crash
Injury Research and Engineering Network (CIREN) data demonstrated an increasing incidence
of thoracolumbar fractures with age and seatbelt use (Rao et al. 2014).
While compressive loading and bending moment were believed to be the predominant
injury mechanism for thoracolumbar fractures, there is no established injury assessment for
thoracolumbar fractures in MVC standards throughout the world (Stemper et al. 2015,
Yoganandan et al. 2013). Countermeasures, including seatbelts and airbags, are effective in
reducing MVC fatalities and injury severity, but they may not fully protect the thoracolumbar
spine (Pintar et al. 2012, Rao et al. 2014).
The Total HUman Model for Safety (THUMS) finite element (FE) full human body
model has been used to computationally simulate occupant response in side and frontal impact
scenarios (Danelson et al. 2015, Gaewsky et al. 2015, Golman, Danelson and Stitzel 2015,
Iwamoto, Nakahira and Kimpara 2015, Jones et al. 2016b, Ye et al. 2018). Previous studies used
computational models to analyze driver kinematics and lower thoracic spine injury in racing cars
during frontal impacts (Katsuhara et al. 2017). The biomechanics of lumbar spine motion and
stiffness has also been characterized in frontal crash simulations (Arun et al. 2017). However,
there is a lack of existing injury criteria to quantify the severity of thoracolumbar fractures, and
few studies have examined the contributing factors, including driver posture and vehicle
attributes, on thoracolumbar fracture outcomes.
The aim of this study was to evaluate thoracolumbar fractures from FE reconstruction of
MVCs, and to examine factors affecting fracture risk. It is hypothesized that force and moment
data derived from simulations could quantify thoracolumbar fracture severity and reflect the
fracture incidence.
METHODS
CIREN/NASS-CDS Case Selection
Eleven full-frontal crashes were selected for FE reconstruction from the NASS-CDS and
CIREN databases (Table 1). Each frontal planar MVC case had a Collision Deformation
Classification (CDC) code of “FDEW” and a principal direction of force (PDOF) between 350°
and 10°. All cases involved belted drivers and vehicle model years of 2002 and later. Crashes
with frontal airbag deployment and an event data recorder (EDR)-measured longitudinal Delta-V
between 30-72 km/h were selected for similar severity to regulatory crash tests. Of the 11
selected cases, six cases had one or more Abbreviated Injury Scale (AIS) 2 + thoracolumbar
fractures. Injury information for each of the six cases with thoracolumbar fractures, including
computed tomography (CT) scans and BioTab records documenting injury mechanisms, were
collected and analyzed (Schneider et al. 2011). The injury mechanism of each fracture was also
reviewed by an orthopaedic surgeon, and compared with the crash reconstruction results.
3
2018 Ohio State University Injury Biomechanics Symposium
This paper has not been peer- reviewed.
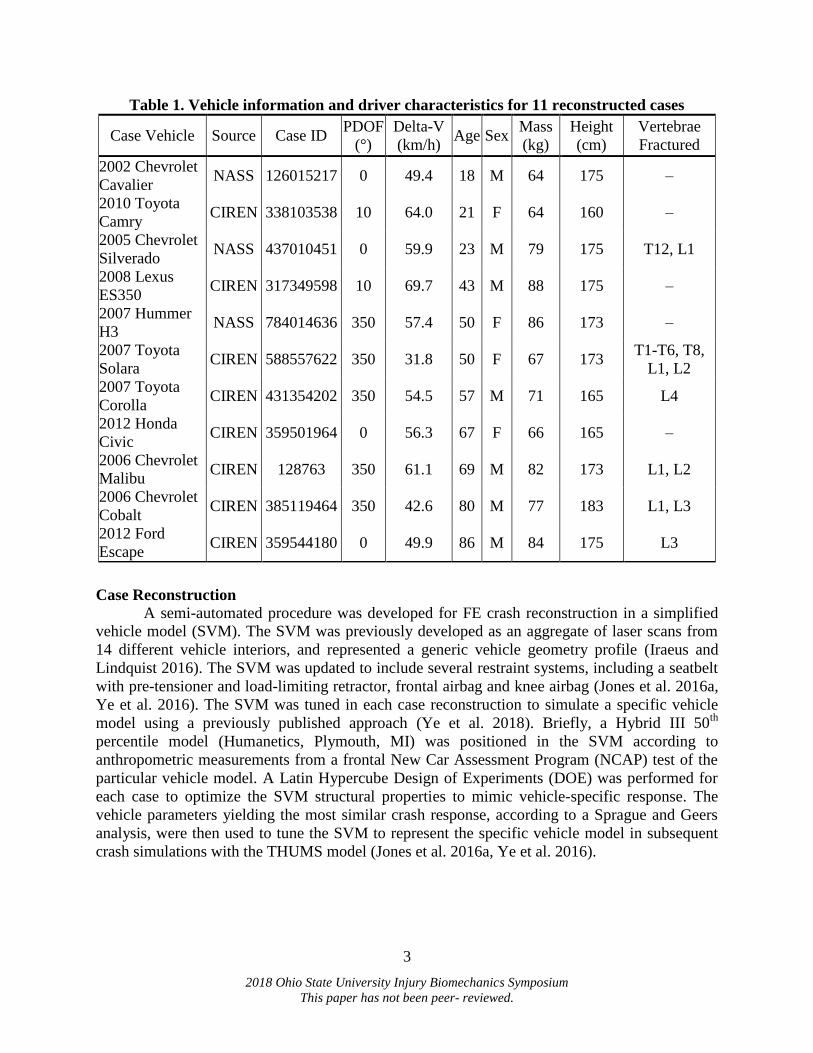
Table 1. Vehicle information and driver characteristics for 11 reconstructed cases
Case Vehicle Source Case ID PDOF
(°)
Delta-V
(km/h) Age Sex
Mass
(kg)
Height
(cm)
Vertebrae
Fractured
2002 Chevrolet
Cavalier NASS 126015217 0 49.4 18 M 64 175 ‒
2010 Toyota
Camry CIREN 338103538 10 64.0 21 F 64 160 ‒
2005 Chevrolet
Silverado NASS 437010451 0 59.9 23 M 79 175 T12, L1
2008 Lexus
ES350 CIREN 317349598 10 69.7 43 M 88 175 ‒
2007 Hummer
H3 NASS 784014636 350 57.4 50 F 86 173 ‒
2007 Toyota
Solara CIREN 588557622 350 31.8 50 F 67 173
T1-T6, T8,
L1, L2
2007 Toyota
Corolla CIREN 431354202 350 54.5 57 M 71 165 L4
2012 Honda
Civic CIREN 359501964 0 56.3 67 F 66 165 ‒
2006 Chevrolet
Malibu CIREN 128763 350 61.1 69 M 82 173 L1, L2
2006 Chevrolet
Cobalt CIREN 385119464 350 42.6 80 M 77 183 L1, L3
2012 Ford
Escape CIREN 359544180 0 49.9 86 M 84 175 L3
Case Reconstruction
A semi-automated procedure was developed for FE crash reconstruction in a simplified
vehicle model (SVM). The SVM was previously developed as an aggregate of laser scans from
14 different vehicle interiors, and represented a generic vehicle geometry profile (Iraeus and
Lindquist 2016). The SVM was updated to include several restraint systems, including a seatbelt
with pre-tensioner and load-limiting retractor, frontal airbag and knee airbag (Jones et al. 2016a,
Ye et al. 2016). The SVM was tuned in each case reconstruction to simulate a specific vehicle
model using a previously published approach (Ye et al. 2018). Briefly, a Hybrid III 50th
percentile model (Humanetics, Plymouth, MI) was positioned in the SVM according to
anthropometric measurements from a frontal New Car Assessment Program (NCAP) test of the
particular vehicle model. A Latin Hypercube Design of Experiments (DOE) was performed for
each case to optimize the SVM structural properties to mimic vehicle-specific response. The
vehicle parameters yielding the most similar crash response, according to a Sprague and Geers
analysis, were then used to tune the SVM to represent the specific vehicle model in subsequent
crash simulations with the THUMS model (Jones et al. 2016a, Ye et al. 2016).
4
2018 Ohio State University Injury Biomechanics Symposium
This paper has not been peer- reviewed.
THUMS Modeling
Isometric scaling was applied to the THUMS v4.01 model using a combination of height
and mass scaling factors to minimize the error between THUMS and case-specific driver
anthropometry (Eqn 1-3) (Miller et al. 2016). The scale factor in Eqn 3 was used to scale the
THUMS length in the X, Y, and Z dimensions simultaneously.
ℎ𝑒𝑖𝑔ℎ𝑡 𝑓𝑎𝑐𝑡𝑜𝑟 =𝑐𝑎𝑠𝑒 𝑜𝑐𝑐𝑢𝑝𝑎𝑛𝑡 ℎ𝑒𝑖𝑔ℎ𝑡
𝑇𝐻𝑈𝑀𝑆 𝑚𝑜𝑑𝑒𝑙 ℎ𝑒𝑖𝑔ℎ𝑡
Eqn1
𝑚𝑎𝑠𝑠 𝑓𝑎𝑐𝑡𝑜𝑟 = √𝑐𝑎𝑠𝑒 𝑜𝑐𝑐𝑢𝑝𝑎𝑛𝑡 𝑚𝑎𝑠𝑠
𝑇𝐻𝑈𝑀𝑆 𝑚𝑜𝑑𝑒𝑙 𝑚𝑎𝑠𝑠
3
Eqn2
𝑠𝑐𝑎𝑙𝑒 𝑓𝑎𝑐𝑡𝑜𝑟 =ℎ𝑒𝑖𝑔ℎ𝑡 𝑓𝑎𝑐𝑡𝑜𝑟 + 𝑚𝑎𝑠𝑠 𝑓𝑎𝑐𝑡𝑜𝑟
2 Eqn3
The THUMS was gravitationally settled in the global-Z direction, and positioned in the
baseline posture, based on the longitudinal seat track position, seatback angle, D-ring anchor
height, steering column position and steering column angle recorded in NASS-CDS or CIREN.
For the six thoracolumbar fracture cases, these five parameters were varied using a Latin
Hypercube DOE to investigate the pre-crash driving posture effect on thoracolumbar fracture
risk (Table 2). In the DOE, 120 simulations were conducted to quantify uncertainty and response
variation for each case, with the range of each occupant positioning parameter identified from
frontal NCAP crash test reports of comparable vehicle models, based on the vehicle year and
model interchange list (Anderson 2004). For each of the baseline cases and associated DOEs
with the positioned THUMS, the EDR crash pulse from the CIREN or NASS-CDS case was
applied to the SVM.
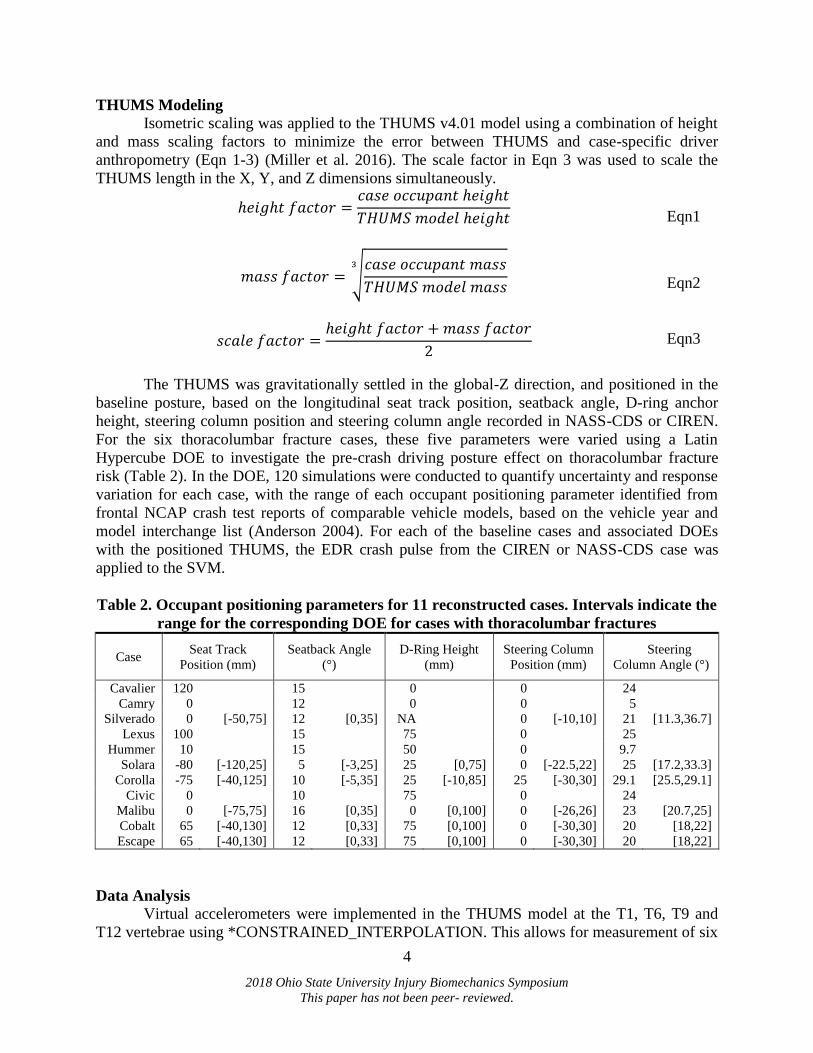
Table 2. Occupant positioning parameters for 11 reconstructed cases. Intervals indicate the
range for the corresponding DOE for cases with thoracolumbar fractures
Case Seat Track
Position (mm)
Seatback Angle
(°)
D-Ring Height
(mm)
Steering Column
Position (mm)
Steering
Column Angle (°)
Cavalier 120 15 0 0 24
Camry 0 12 0 0 5
Silverado 0 [-50,75] 12 [0,35] NA 0 [-10,10] 21 [11.3,36.7]
Lexus 100 15 75 0 25
Hummer 10 15 50 0 9.7
Solara -80 [-120,25] 5 [-3,25] 25 [0,75] 0 [-22.5,22] 25 [17.2,33.3]
Corolla -75 [-40,125] 10 [-5,35] 25 [-10,85] 25 [-30,30] 29.1 [25.5,29.1]
Civic 0 10 75 0 24
Malibu 0 [-75,75] 16 [0,35] 0 [0,100] 0 [-26,26] 23 [20.7,25]
Cobalt 65 [-40,130] 12 [0,33] 75 [0,100] 0 [-30,30] 20 [18,22]
Escape 65 [-40,130] 12 [0,33] 75 [0,100] 0 [-30,30] 20 [18,22]
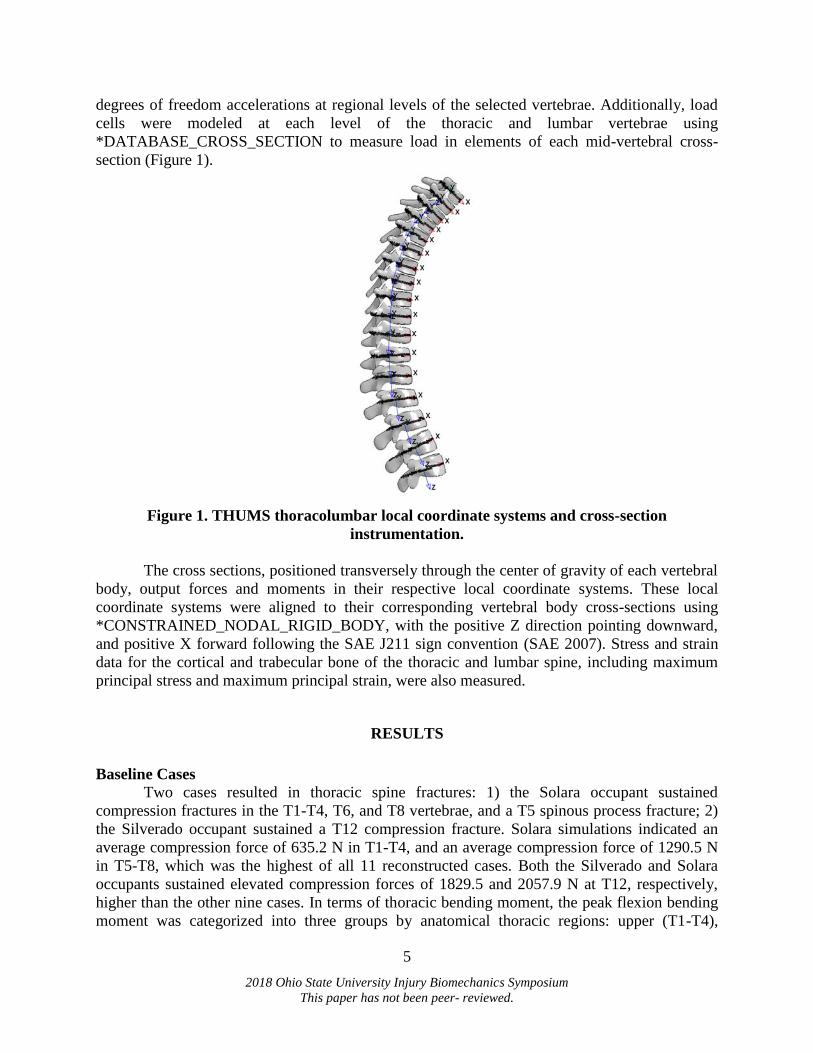
Data Analysis Virtual accelerometers were implemented in the THUMS model at the T1, T6, T9 and
T12 vertebrae using *CONSTRAINED_INTERPOLATION. This allows for measurement of six
5
2018 Ohio State University Injury Biomechanics Symposium
This paper has not been peer- reviewed.
degrees of freedom accelerations at regional levels of the selected vertebrae. Additionally, load
cells were modeled at each level of the thoracic and lumbar vertebrae using
*DATABASE_CROSS_SECTION to measure load in elements of each mid-vertebral cross-
section (Figure 1).
Figure 1. THUMS thoracolumbar local coordinate systems and cross-section
instrumentation.
The cross sections, positioned transversely through the center of gravity of each vertebral
body, output forces and moments in their respective local coordinate systems. These local
coordinate systems were aligned to their corresponding vertebral body cross-sections using
*CONSTRAINED_NODAL_RIGID_BODY, with the positive Z direction pointing downward,
and positive X forward following the SAE J211 sign convention (SAE 2007). Stress and strain
data for the cortical and trabecular bone of the thoracic and lumbar spine, including maximum
principal stress and maximum principal strain, were also measured.
RESULTS
Baseline Cases
Two cases resulted in thoracic spine fractures: 1) the Solara occupant sustained
compression fractures in the T1-T4, T6, and T8 vertebrae, and a T5 spinous process fracture; 2)
the Silverado occupant sustained a T12 compression fracture. Solara simulations indicated an
average compression force of 635.2 N in T1-T4, and an average compression force of 1290.5 N
in T5-T8, which was the highest of all 11 reconstructed cases. Both the Silverado and Solara
occupants sustained elevated compression forces of 1829.5 and 2057.9 N at T12, respectively,
higher than the other nine cases. In terms of thoracic bending moment, the peak flexion bending
moment was categorized into three groups by anatomical thoracic regions: upper (T1-T4),
6
2018 Ohio State University Injury Biomechanics Symposium
This paper has not been peer- reviewed.
middle (T5-T8), and lower (T9-T12). On average, the two cases with thoracic spine fractures
sustained higher bending moments at all three thoracic spine levels (upper: 14.5, middle: 14.0,
lower: 12.7 Nm), compared to the nine cases without thoracic spine fractures (upper: 8.5, middle:
7.1, lower: 12.1 Nm).
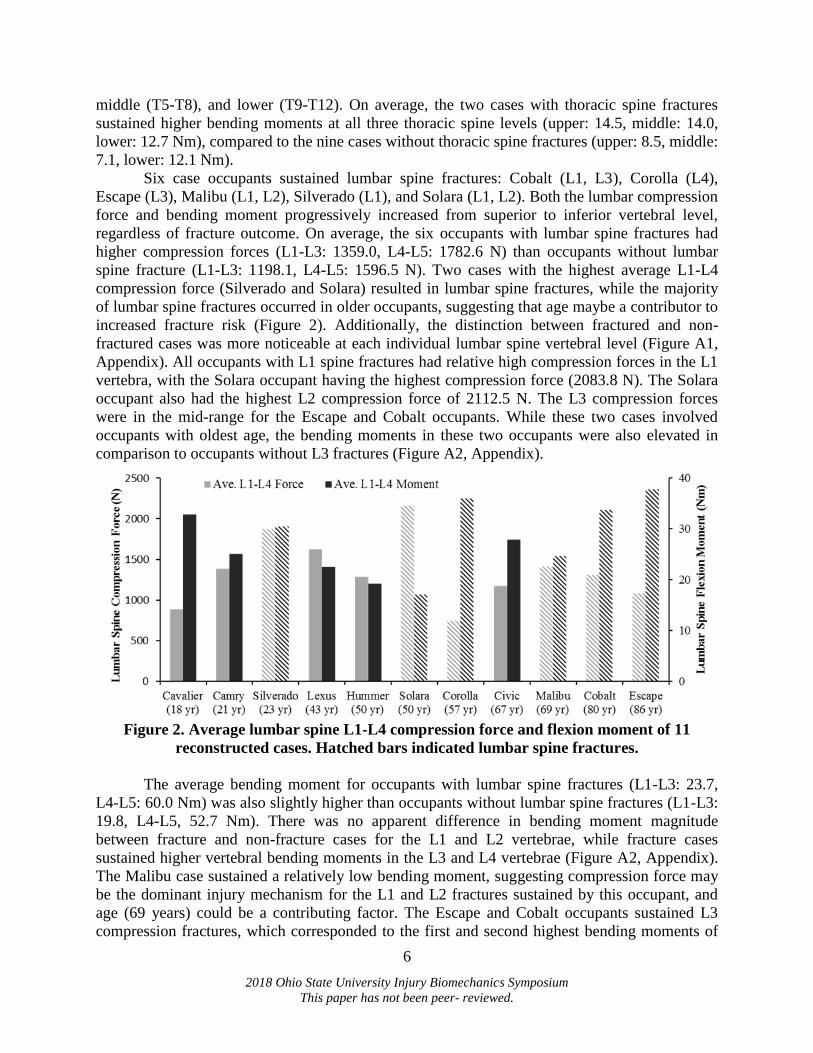
Six case occupants sustained lumbar spine fractures: Cobalt (L1, L3), Corolla (L4),
Escape (L3), Malibu (L1, L2), Silverado (L1), and Solara (L1, L2). Both the lumbar compression
force and bending moment progressively increased from superior to inferior vertebral level,
regardless of fracture outcome. On average, the six occupants with lumbar spine fractures had
higher compression forces (L1-L3: 1359.0, L4-L5: 1782.6 N) than occupants without lumbar
spine fracture (L1-L3: 1198.1, L4-L5: 1596.5 N). Two cases with the highest average L1-L4
compression force (Silverado and Solara) resulted in lumbar spine fractures, while the majority
of lumbar spine fractures occurred in older occupants, suggesting that age maybe a contributor to
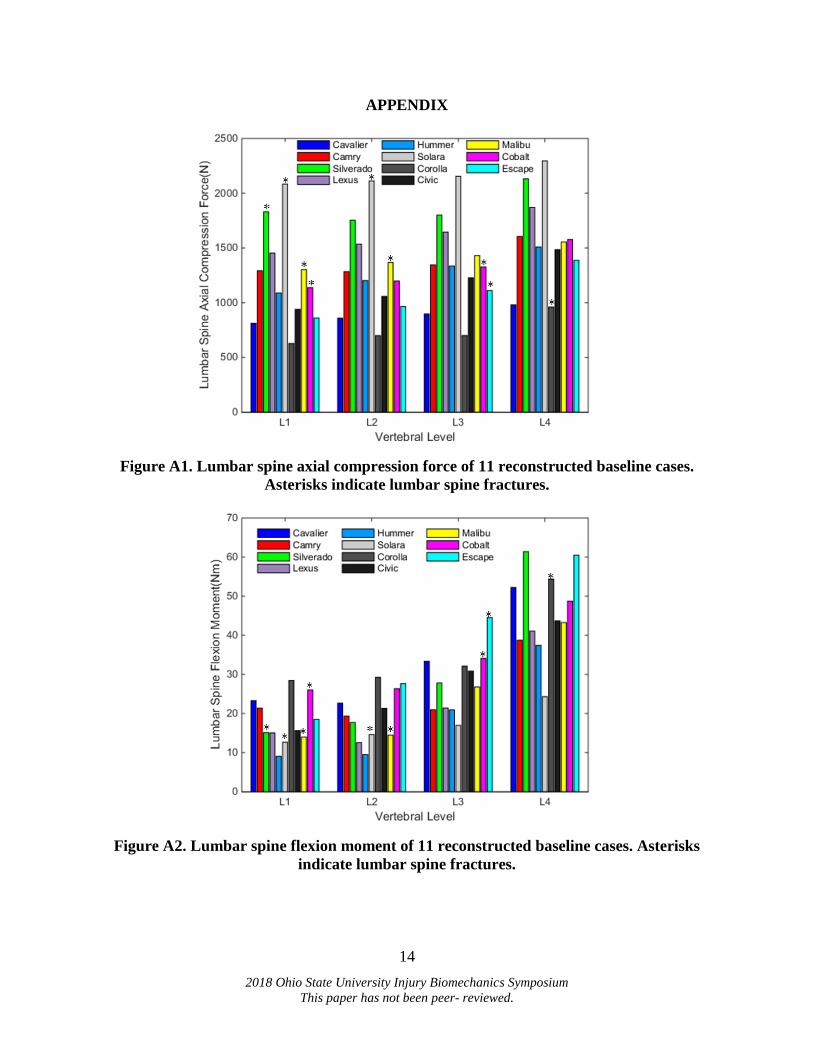
increased fracture risk (Figure 2). Additionally, the distinction between fractured and non-
fractured cases was more noticeable at each individual lumbar spine vertebral level (Figure A1,
Appendix). All occupants with L1 spine fractures had relative high compression forces in the L1
vertebra, with the Solara occupant having the highest compression force (2083.8 N). The Solara
occupant also had the highest L2 compression force of 2112.5 N. The L3 compression forces
were in the mid-range for the Escape and Cobalt occupants. While these two cases involved
occupants with oldest age, the bending moments in these two occupants were also elevated in
comparison to occupants without L3 fractures (Figure A2, Appendix).
Figure 2. Average lumbar spine L1-L4 compression force and flexion moment of 11
reconstructed cases. Hatched bars indicated lumbar spine fractures.
The average bending moment for occupants with lumbar spine fractures (L1-L3: 23.7,
L4-L5: 60.0 Nm) was also slightly higher than occupants without lumbar spine fractures (L1-L3:
19.8, L4-L5, 52.7 Nm). There was no apparent difference in bending moment magnitude
between fracture and non-fracture cases for the L1 and L2 vertebrae, while fracture cases
sustained higher vertebral bending moments in the L3 and L4 vertebrae (Figure A2, Appendix).
The Malibu case sustained a relatively low bending moment, suggesting compression force may
be the dominant injury mechanism for the L1 and L2 fractures sustained by this occupant, and
age (69 years) could be a contributing factor. The Escape and Cobalt occupants sustained L3
compression fractures, which corresponded to the first and second highest bending moments of
7
2018 Ohio State University Injury Biomechanics Symposium
This paper has not been peer- reviewed.
44.5 and 34.1 Nm, respectively. Similarly, the Corolla occupant had a L4 endplate fracture,
which was reflected by a 54.4 Nm (third highest in magnitude) L4 bending moment. In contrary
to the high axial compression force, both the Silverado (15.1, 17.7 Nm) and Solara (12.6, 14.6
Nm) occupants had lower bending moments at the L1 and L2 vertebral levels.
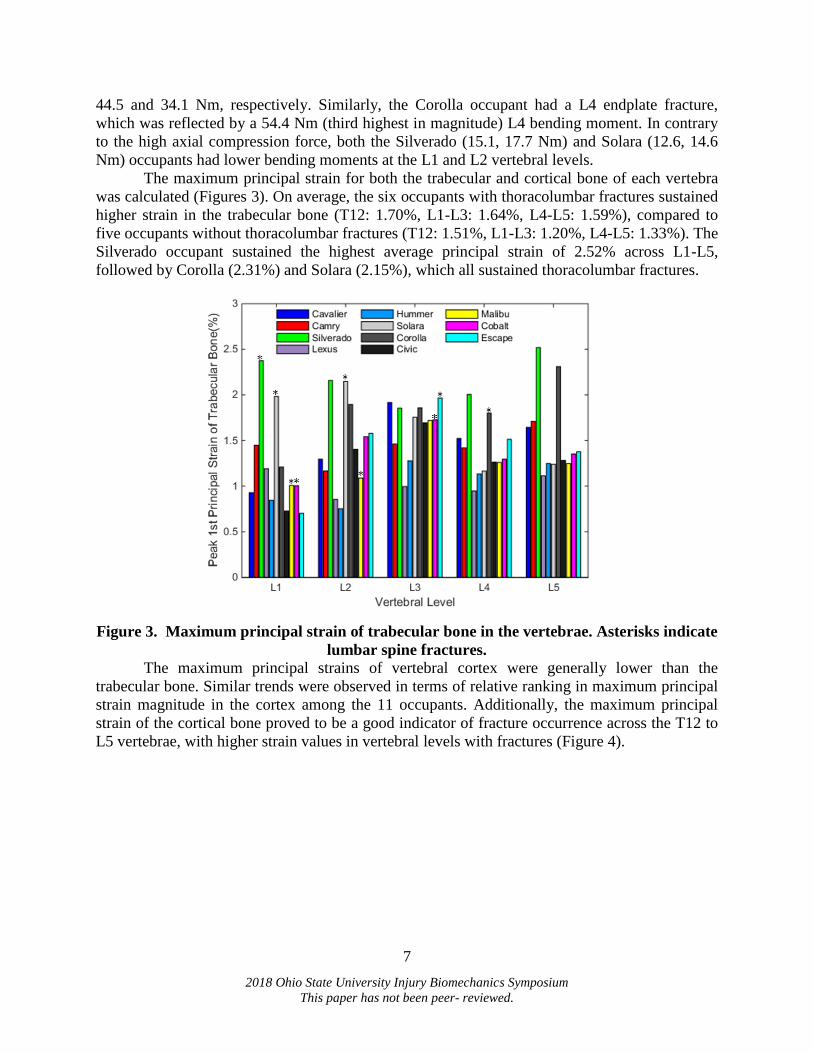
The maximum principal strain for both the trabecular and cortical bone of each vertebra
was calculated (Figures 3). On average, the six occupants with thoracolumbar fractures sustained
higher strain in the trabecular bone (T12: 1.70%, L1-L3: 1.64%, L4-L5: 1.59%), compared to
five occupants without thoracolumbar fractures (T12: 1.51%, L1-L3: 1.20%, L4-L5: 1.33%). The
Silverado occupant sustained the highest average principal strain of 2.52% across L1-L5,
followed by Corolla (2.31%) and Solara (2.15%), which all sustained thoracolumbar fractures.
Figure 3. Maximum principal strain of trabecular bone in the vertebrae. Asterisks indicate
lumbar spine fractures.
The maximum principal strains of vertebral cortex were generally lower than the
trabecular bone. Similar trends were observed in terms of relative ranking in maximum principal
strain magnitude in the cortex among the 11 occupants. Additionally, the maximum principal
strain of the cortical bone proved to be a good indicator of fracture occurrence across the T12 to
L5 vertebrae, with higher strain values in vertebral levels with fractures (Figure 4).
8
2018 Ohio State University Injury Biomechanics Symposium
This paper has not been peer- reviewed.
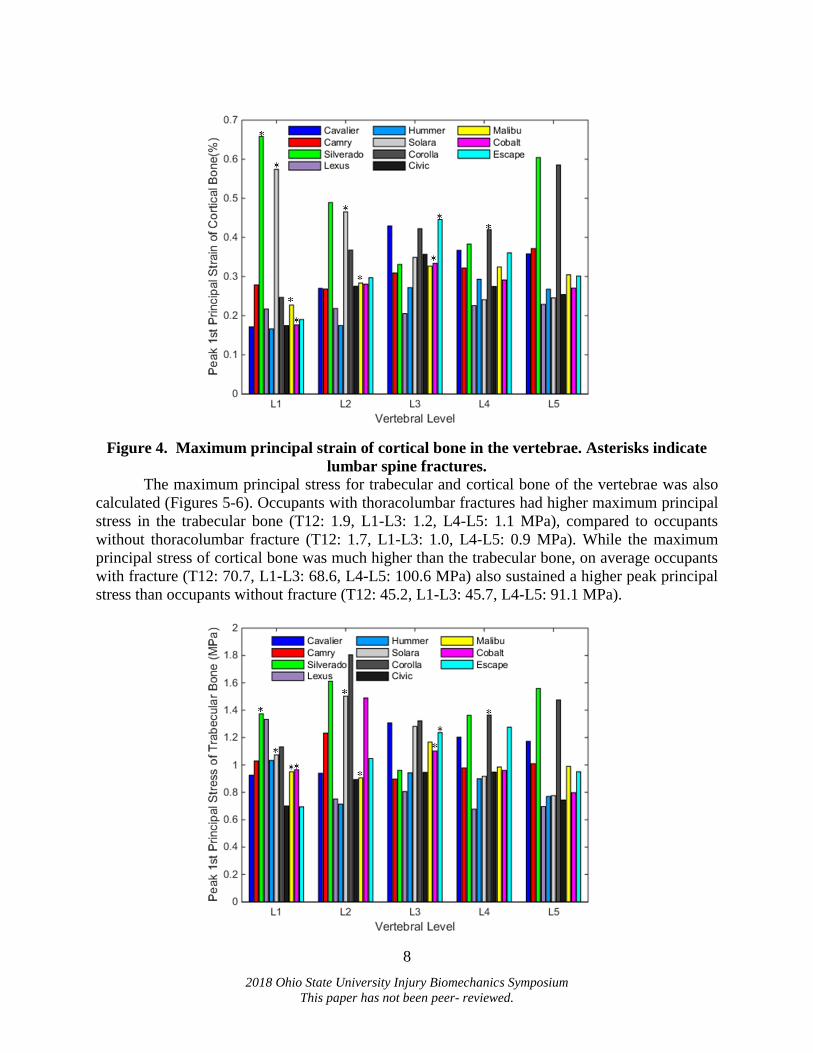
Figure 4. Maximum principal strain of cortical bone in the vertebrae. Asterisks indicate
lumbar spine fractures.
The maximum principal stress for trabecular and cortical bone of the vertebrae was also
calculated (Figures 5-6). Occupants with thoracolumbar fractures had higher maximum principal
stress in the trabecular bone (T12: 1.9, L1-L3: 1.2, L4-L5: 1.1 MPa), compared to occupants
without thoracolumbar fracture (T12: 1.7, L1-L3: 1.0, L4-L5: 0.9 MPa). While the maximum
principal stress of cortical bone was much higher than the trabecular bone, on average occupants
with fracture (T12: 70.7, L1-L3: 68.6, L4-L5: 100.6 MPa) also sustained a higher peak principal
stress than occupants without fracture (T12: 45.2, L1-L3: 45.7, L4-L5: 91.1 MPa).
9
2018 Ohio State University Injury Biomechanics Symposium
This paper has not been peer- reviewed.
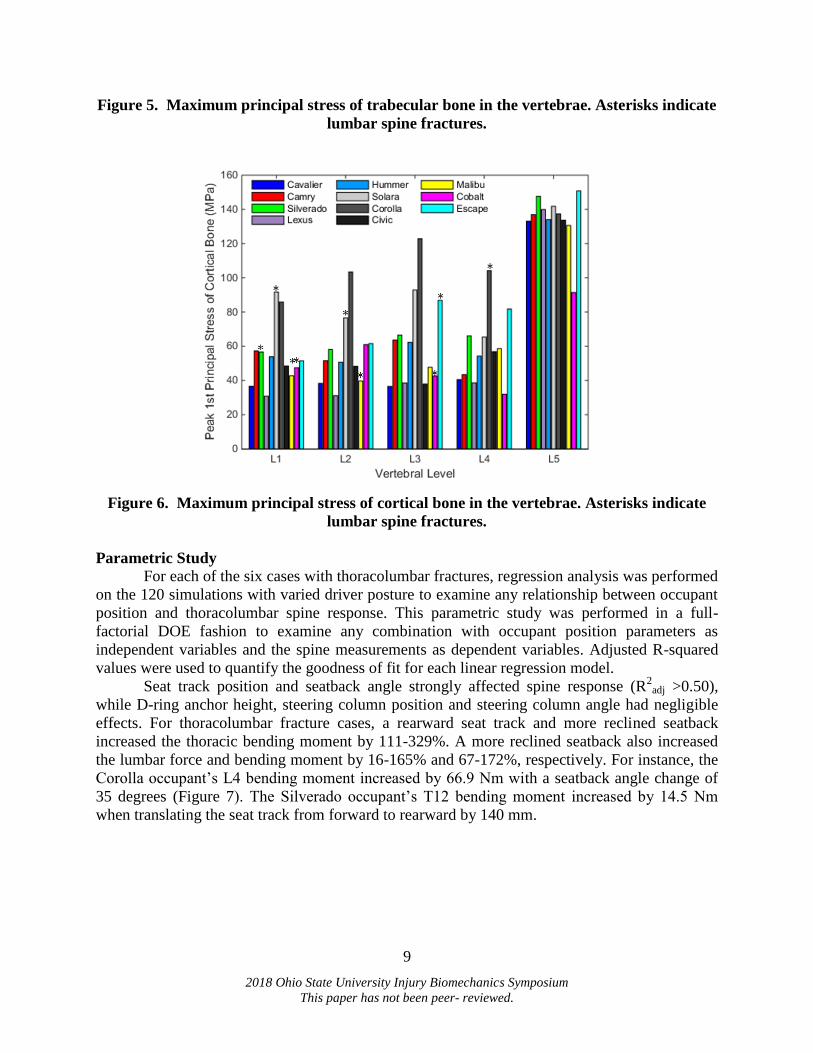
Figure 5. Maximum principal stress of trabecular bone in the vertebrae. Asterisks indicate
lumbar spine fractures.
Figure 6. Maximum principal stress of cortical bone in the vertebrae. Asterisks indicate
lumbar spine fractures.
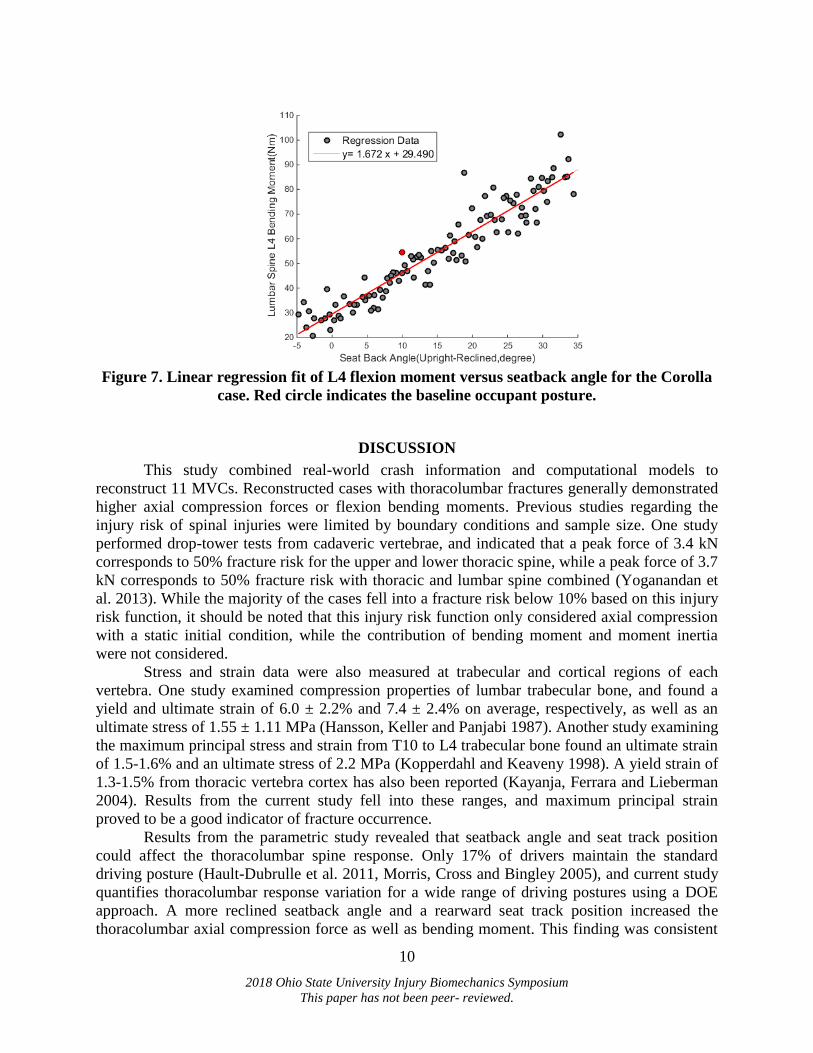
Parametric Study For each of the six cases with thoracolumbar fractures, regression analysis was performed
on the 120 simulations with varied driver posture to examine any relationship between occupant
position and thoracolumbar spine response. This parametric study was performed in a full-
factorial DOE fashion to examine any combination with occupant position parameters as
independent variables and the spine measurements as dependent variables. Adjusted R-squared
values were used to quantify the goodness of fit for each linear regression model.
Seat track position and seatback angle strongly affected spine response (R2
adj >0.50),
while D-ring anchor height, steering column position and steering column angle had negligible
effects. For thoracolumbar fracture cases, a rearward seat track and more reclined seatback
increased the thoracic bending moment by 111-329%. A more reclined seatback also increased
the lumbar force and bending moment by 16-165% and 67-172%, respectively. For instance, the
Corolla occupant’s L4 bending moment increased by 66.9 Nm with a seatback angle change of
35 degrees (Figure 7). The Silverado occupant’s T12 bending moment increased by 14.5 Nm
when translating the seat track from forward to rearward by 140 mm.
10
2018 Ohio State University Injury Biomechanics Symposium
This paper has not been peer- reviewed.
Figure 7. Linear regression fit of L4 flexion moment versus seatback angle for the Corolla
case. Red circle indicates the baseline occupant posture.
DISCUSSION
This study combined real-world crash information and computational models to
reconstruct 11 MVCs. Reconstructed cases with thoracolumbar fractures generally demonstrated
higher axial compression forces or flexion bending moments. Previous studies regarding the
injury risk of spinal injuries were limited by boundary conditions and sample size. One study
performed drop-tower tests from cadaveric vertebrae, and indicated that a peak force of 3.4 kN
corresponds to 50% fracture risk for the upper and lower thoracic spine, while a peak force of 3.7
kN corresponds to 50% fracture risk with thoracic and lumbar spine combined (Yoganandan et
al. 2013). While the majority of the cases fell into a fracture risk below 10% based on this injury
risk function, it should be noted that this injury risk function only considered axial compression
with a static initial condition, while the contribution of bending moment and moment inertia
were not considered.
Stress and strain data were also measured at trabecular and cortical regions of each
vertebra. One study examined compression properties of lumbar trabecular bone, and found a
yield and ultimate strain of 6.0 ± 2.2% and 7.4 ± 2.4% on average, respectively, as well as an
ultimate stress of 1.55 ± 1.11 MPa (Hansson, Keller and Panjabi 1987). Another study examining
the maximum principal stress and strain from T10 to L4 trabecular bone found an ultimate strain
of 1.5-1.6% and an ultimate stress of 2.2 MPa (Kopperdahl and Keaveny 1998). A yield strain of
1.3-1.5% from thoracic vertebra cortex has also been reported (Kayanja, Ferrara and Lieberman
2004). Results from the current study fell into these ranges, and maximum principal strain
proved to be a good indicator of fracture occurrence.
Results from the parametric study revealed that seatback angle and seat track position
could affect the thoracolumbar spine response. Only 17% of drivers maintain the standard
driving posture (Hault-Dubrulle et al. 2011, Morris, Cross and Bingley 2005), and current study
quantifies thoracolumbar response variation for a wide range of driving postures using a DOE
approach. A more reclined seatback angle and a rearward seat track position increased the
thoracolumbar axial compression force as well as bending moment. This finding was consistent
11
2018 Ohio State University Injury Biomechanics Symposium
This paper has not been peer- reviewed.
with a previous study of crash reconstruction based on four MVCs (Jones et al. 2016b). Another
study supported this finding, and found an increased mortality risk in both partially reclined
(Odds Ratio, OR: 1.15; 95% Confidence Interval, CI: 1.05-1.26) and fully reclined (OR: 1.77;
CI: 1.09-2.88) occupants (Dissanaike et al. 2008). Future studies could optimize seat design and
position with an imminent crash to better protect the occupant from sustaining thoracolumbar
fractures.
Several limitations exist in addition to those mentioned. First, occupant-specific bone
quality was not considered in the crash reconstructions. Age is significantly associated with an
increased risk of lumbar fractures, with each year in age increasing the odds of lumbar fracture
by 4.0% (Kaufman et al. 2013). Several cases with thoracolumbar fractures involved older
occupants, and the potential effect of osteopenia and osteoporosis was not considered at this
juncture. Future studies could improve human body model biofidelity by incorporating morphing
techniques and material property tuning to better represent specific occupants (Schoell et al.
2015, Vavalle et al. 2014, Zhang et al. 2017). Additionally, this study evaluated a limited sample
of MVCs, and multiple confounding factors, including vehicle intrusions, seatbelt submarining,
and pre-crash braking were not evaluated. Regardless, these crash reconstructions accurately
estimated the increased axial force or bending moment of the thoracolumbar spine, and
correlated well with the fracture occurrence.
CONCLUSIONS
In conclusion, 11 frontal MVCs, including six with thoracolumbar fractures, were
selected from CIREN and NASS-CDS and reconstructed using a SVM and the THUMS FE
model. This study developed a computational framework to assess thoracolumbar fractures based
on kinetic and kinematic data, and elucidated the effect of pre-crash driver posture on
thoracolumbar spine response using a parametric study. Results aid in the development of injury
criteria to better quantify thoracolumbar injury severity, and the understanding of thoracolumbar
fracture mechanisms and prevention.
ACKNOWLEDGEMENTS
Funding was provided by Toyota’s Collaborative Safety Research Center. The authors
thank the National Highway Traffic Safety Administration for support of the CIREN program
and the WFU-VT CIREN Center (Cooperative Agreement DTN22-10-H-00294). Views
expressed are those of the authors and do not represent the views of the sponsors.
REFERENCES
Anderson, G. (2004) Vehicle Year and Model Interchange List. Scalia Safety Engineering.
Arun, M. W., P. Hadagali, K. Driesslein, W. Curry, N. Yoganandan & F. A. Pintar (2017)
Biomechanics of lumbar motion-segments in dynamic compression. Stapp Car Crash J,
61, 1-25.
Danelson, K. A., A. J. Golman, A. R. Kemper, F. S. Gayzik, H. Clay Gabler, S. M. Duma & J.
D. Stitzel (2015) Finite element comparison of human and Hybrid III responses in a
frontal impact. Accident Analysis & Prevention, 85, 125-56.
Dissanaike, S., R. Kaufman, C. D. Mack, C. Mock & E. Bulger (2008) The effect of reclined
seats on mortality in motor vehicle collisions. Journal of Trauma and Acute Care
Surgery, 64, 614-619.
12
2018 Ohio State University Injury Biomechanics Symposium
This paper has not been peer- reviewed.
Doud, A. N., A. A. Weaver, J. W. Talton, R. T. Barnard, J. W. Meredith, J. D. Stitzel, P. Miller
& A. N. Miller (2015) Has the incidence of thoracolumbar spine injuries increased in the
United States from 1998 to 2011? Clinical Orthopaedics and Related Research, 473,
297-304.
Gaewsky, J. P., A. A. Weaver, B. Koya & J. D. Stitzel (2015) Driver Injury Risk Variability in
Finite Element Reconstructions of Crash Injury Research and Engineering Network
(CIREN) Frontal Motor Vehicle Crashes. Traffic Injury Prevention, 16 Suppl 2, S124-31.
Golman, A. J., K. A. Danelson & J. D. Stitzel (2015) Robust human body model injury
prediction in simulated side impact crashes. Computer methods in biomechanics and
biomedical engineering, 1-16.
Hansson, T. H., T. S. Keller & M. M. Panjabi (1987) A study of the compressive properties of
lumbar vertebral trabeculae: effects of tissue characteristics. Spine (Phila Pa 1976), 12,
56-62.
Hault-Dubrulle, A., F. Robache, M. P. Pacaux & H. Morvan (2011) Determination of pre-impact
occupant postures and analysis of consequences on injury outcome. Part I: a driving
simulator study. Accident Analysis & Prevention, 43, 66-74.
Iraeus, J. & M. Lindquist (2016) Development and validation of a generic finite element vehicle
buck model for the analysis of driver rib fractures in real life nearside oblique frontal
crashes. Accident Analysis & Prevention, 95, 42-56.
Iwamoto, M., Y. Nakahira & H. Kimpara (2015) Development and Validation of the Total
HUman Model for Safety (THUMS) Toward Further Understanding of Occupant Injury
Mechanisms in Precrash and During Crash. Traffic Injury Prevention, 16 Suppl 1, S36-
48.
Jones, D., J. Gaewsky, A. Weaver & J. Stitzel (2016a) A semi-automated approach to real world
motor vehicle crash reconstruction using a generic simplified vehicle buck model. SAE
International Journal of Transportation Safety 4, 267-277.
Jones, D. A., J. P. Gaewsky, M. E. Kelley, A. A. Weaver, A. N. Miller & J. D. Stitzel (2016b)
Lumbar vertebrae fracture injury risk in finite element reconstruction of CIREN and
NASS frontal motor vehicle crashes. Traffic Injury Prevention, 17 Suppl 1, 109-15.
Katsuhara, T., Y. Takahira, S. Hayashi, Y. Kitagawa & T. Yasuki (2017) Analysis of Driver
Kinematics and Lower Thoracic Spine Injury in World Endurance Championship Race
Cars during Frontal Impacts. SAE International Journal of Transportation Safety, 5, 120-
132.
Kaufman, R. P., R. P. Ching, M. M. Willis, C. D. Mack, J. A. Gross & E. M. Bulger (2013)
Burst fractures of the lumbar spine in frontal crashes. Accident Analysis & Prevention,
59, 153-63.
Kayanja, M. M., L. A. Ferrara & I. H. Lieberman (2004) Distribution of anterior cortical shear
strain after a thoracic wedge compression fracture. The Spine Journal, 4, 76-87.
Kopperdahl, D. L. & T. M. Keaveny (1998) Yield strain behavior of trabecular bone. Journal of
Biomechanics, 31, 601-8.
Miller, L., J. Gaewsky, A. Weaver, J. Stitzel & N. White. 2016. Regional Level Crash Induced
Injury Metrics Implemented within THUMS v4. 01. SAE Technical Paper.
Morris, R., G. Cross & L. Bingley. 2005. Improved understanding of passenger behaviour during
pre-impact events to aid smart restraint development. In Proceedings of the 19th
International Technical Conference on the Enhanced Safety of Vehilces (ESV),
Washington DC, USA, June, 6-9.
13
2018 Ohio State University Injury Biomechanics Symposium
This paper has not been peer- reviewed.
Pintar, F. A., N. Yoganandan, D. J. Maiman, M. Scarboro & R. W. Rudd. 2012. Thoracolumbar
spine fractures in frontal impact crashes. In Annu Proc Assoc Adv Automot Med. , 277.
Association for the Advancement of Automotive Medicine.
Rao, R. D., C. A. Berry, N. Yoganandan & A. Agarwal (2014) Occupant and crash
characteristics in thoracic and lumbar spine injuries resulting from motor vehicle
collisions. The Spine Journal, 14, 2355-2365.
SAE, S. (2007) J211-1 Instrumentation for Impact Test—Part 1—Electronic Instrumentation.
SAE International.
Schneider, L. W., J. D. Rupp, M. Scarboro, F. Pintar, K. B. Arbogast, R. W. Rudd, M. R. Sochor,
J. Stitzel, C. Sherwood & J. B. MacWilliams (2011) BioTab—a new method for
analyzing and documenting injury causation in motor-vehicle crashes. Traffic Injury
Prevention, 12, 256-265.
Schoell, S. L., A. A. Weaver, N. A. Vavalle & J. D. Stitzel (2015) Age-and sex-specific thorax
finite element model development and simulation. Traffic Injury Prevention, 16, S57-
S65.
Stemper, B. D., N. Yoganandan, J. L. Baisden, S. Umale, A. S. Shah, B. S. Shender & G. R.
Paskoff (2015) Rate-dependent fracture characteristics of lumbar vertebral bodies.
Journal of the mechanical behavior of biomedical materials, 41, 271-279.
Vavalle, N. A., S. L. Schoell, A. A. Weaver, J. D. Stitzel & F. S. Gayzik (2014) Application of
radial basis function methods in the development of a 95th percentile male seated fea
model. Stapp Car Crash J, 58, 361.
Wang, M. C., F. Pintar, N. Yoganandan & D. J. Maiman (2009) The continued burden of spine
fractures after motor vehicle crashes. Journal of neurosurgery: Spine, 10, 86-92.
Ye, X., J. P. Gaewsky, B. Koya, D. A. Jones, R. Barnard, A. A. Weaver & J. D. Stitzel (2016)
Automated Analysis of Driver Response in a Finite Element Crash Test Reconstruction.
Biomed Sci Instrum Vol. 52, 66-74.
Ye, X., J. P. Gaewsky, L. E. Miller, D. A. Jones, M. E. Kelley, J. D. Suhey, B. Koya, A. A.
Weaver & J. D. Stitzel (2018) Numerical investigation of driver lower extremity injuries
in finite element frontal crash reconstruction. Traffic Injury Prevention, 19, S21-S28.
Yoganandan, N., M. W. Arun, B. D. Stemper, F. A. Pintar & D. J. Maiman (2013) Biomechanics
of human thoracolumbar spinal column trauma from vertical impact loading. Annals of
advances in automotive medicine, 57, 155.
Zhang, K., L. Cao, A. Fanta, M. P. Reed, M. Neal, J.-T. Wang, C.-H. Lin & J. Hu (2017) An
automated method to morph finite element whole-body human models with a wide range
of stature and body shape for both men and women. Journal of Biomechanics.
14
2018 Ohio State University Injury Biomechanics Symposium
This paper has not been peer- reviewed.
APPENDIX
Figure A1. Lumbar spine axial compression force of 11 reconstructed baseline cases.
Asterisks indicate lumbar spine fractures.
Figure A2. Lumbar spine flexion moment of 11 reconstructed baseline cases. Asterisks
indicate lumbar spine fractures.