Embed Size (px)
Citation preview

Journal of Energy and Power Engineering 9 (2015) 539-547 doi: 10.17265/1934-8975/2015.06.004
Numerical Analysis of Self-wastage Phenomena Caused
by Sodium-Water Reaction in Sodium-Cooled Fast
Reactor through Simulant Experiment
Sunghyon Jang1, Takashi Takata1 and Akira Yamguchi2
1. Graduate School of Engineering, Osaka University, Osaka 565-0871, Japan
2. Graduate School of Engineering, University of Tokyo, Ibaraki 319-1188, Japan
Received: February 12, 2015 / Accepted: May 04, 2015 / Published: June 30, 2015. Abstract: A water leakage on the surface of heat transfer tube in a steam generator of sodium-cooled fast reactor causes SWR (sodium-water reaction). The SWR damages the leak surface and gives rise to the leak enlargement. Most of initial leakage starts from micro leak (less than 0.5 g/s). However, the leak rate increases more than two orders of magnitude and the resultant leak damages surrounding heat transfer tubes and it brings secondary failure of the heat transfer tube. Evaluation of the leak enlargement is necessary to assess the leak rate increase, so that evaluate the possibility of secondary failure. In this study, a simulant experiment, which uses neutralization reaction, is proposed to reproduce the leak enlargement. To examine the feasibility of the experiment, numerical simulations are carried out. From the result, a funnel-shaped nozzle enlargement is observed and the shape similar to the shape of the enlarged nozzle from the SWAT (sodium-water reaction test loop) experiment.
Key words: Sodium-cooled fast reactor, self-wastage phenomena, sodium-water reaction, simulant experiment, CFD (computational fluid dyanamics).
1. Introduction
SWR (sodium-water reaction) is a design basis
accident of a SFR (sodium-cooled fast reactor). A
breach of the heat transfer tube in a steam generator
results in contact with liquid sodium with water vapor.
Typical phenomena are deterioration of the tube wall
material and its removal due to the corrosion and the
erosion. As results, the breach is enlarged at its initial
site, and it brings a sharp increase of leak rate. The
enlargement of leak caused by the SWR is called
self-wastage phenomena. According to experimental
researches, it has been observed that, even though the
initial leak rate is small (less than 0.05 g/s), the leak
rate increases more than two orders of magnitude over
a period of about 10 s [1, 2]. Thus, there is a danger that
Corresponding author: Sunghyon Jang, Ph.D. candidate,
research fields: thermal hydraulics and CFD of sodium fast reactor. E-mail: [email protected].
the resultant leak rate caused by the self-wastage might
be in the region of a small leak, or even an intermediate
leak which would then give rise to problems of target
wastage. Therefore, it is an important issue to
understand the behavior of micro-leak for the design of
the leak detector and shutdown systems. So far, the
phenomena of self-wastage have been studied
experimentally by several investigators [3-7]. These
experimental studies focused on deriving the
relationship between the initial leak rate and the
resultant leak rate. However, these mock-up tests had
uncertainties and limitations since the SWR is complex,
and the experimental measurement technology is not
well matured enough to unroll the reaction mechanism
in detail.
Recently, numerical approach using
multi-dimensional analysis code such as SERAPHIM
(sodium-water reaction analysis: physics of
interdisciplinary multi-phase flow) code was
D DAVID PUBLISHING
Numerical Analysis of Self-wastage Phenomena Caused by Sodium-Water Reaction in Sodium-Cooled Fast Reactor through Simulant Experiment
540
attempted to depict the self-wastage phenomena [8].
However, these numerical approaches have some
limitations to simulate the phenomena due to
complexity of the self-wastage phenomena and large
computational load for the analysis.
So we suggested a new method to assess the
self-wastage phenomena through a simulant
experiment. This new approach focuses on reproducing
the self-wastage phenomena. Since the self-wastage
phenomena are attributed to a chemical reaction takes
place near the exit of the leak. We assumed that, it is
able to evaluate the damage on the surface of the leak
by making the neutralization reaction with HCl
(hydrochloric acid) solution and NaOH (sodium
hydroxide) solution.
In this paper, at first, we design the concept of the
simulant experiment. Then, as a preliminary
investigation, numerical analysis is carried out to
validate the feasibility of the method and to decide
experimental condition. In the analysis, governing
equations of concentrations of acid and alkali are
implemented into a commercial CFD (computational
fluid dynamics) tool, Fluent Ver.6.3.26.
2. Sketch of the Simulant Experiment
2.1 SWAT (Sodium-Water Reaction Test Loop)
Experiment
Experimental studies on the self-wastage
phenomena had been carried out to simulate SFR
prototype MONJU steam generators tubes in the small
leak SWAT by PNC (Power Reactor and Nuclear Fuel
Development Cooperation), Japan [9]. Slit-type nozzle
has the same thickness as the actual heat transfer tube
were used to the micro-leak behavior in the Monju
steam generator. Through the experiment, the
relationship between the average leak rate, the sodium
temperature and the self-wastage rate were derived.
Also it was reported that, the enlarged orifice diameter
of the leaks were in a certain range, with no relations to
the average leak rates, the materials, the temperatures,
and the initial nozzle shape [10]. Generally, however, it
is expected that, the self-wastage phenomena are
complex that many parameters such as leak rate,
sodium temperature, leak geometry and so on, are
related. In addition, high chemical activity of the
reaction and opacity of sodium in the liquid state make
hard to evaluate quantitative analysis of the
self-wastage phenomena.
2.2 Simulant Material
To elucidate the self-wastage phenomena and
evaluate quantitative analysis, simulant experiment is
designed. The self-wastage phenomena are attributed
to the interaction between the wall material and the
corrosion and the erosion by the SWR. This
combination of the erosive and corrosive effects of the
SWR is so complicated that it is hard to evaluate the
self-wastage phenomena quantitatively. However,
from a phenomenological viewpoint, it can be said that,
the self-wastage phenomena are attributed to an
exothermic reaction which take places around the exit
of the leak. Thus, the idea of adopting an exothermic
reaction is proposed to simulate the self-wastage
phenomena. The neutralization is an exothermic
reaction when HCl and NaOH aqueous solution are
mixed the following exothermic reaction takes place.
(aq) (aq) (aq) 2HCl + NaOH NaCl + H O +ΔH (1)
As a result of the reaction, the reaction heat (ΔH =
55.6 kJ/mol ) releases. Paraffin wax 115 F, which has a
relatively low melting point (115 F, 319.2 K), is
adopted as simulant to represent the tube wall. When
the neutralization reaction takes places on the leak exit,
it is expected that, the temperature in the reaction zone
increases beyond the melting point of the wax so that
the wax in that area is melted by the reaction heat. As
the reaction continues, the enlargement advances
through the nozzle wall. This procedure reproduces the
crack enlargement by the self-wastage phenomena.
2.3 Experimental Procedure
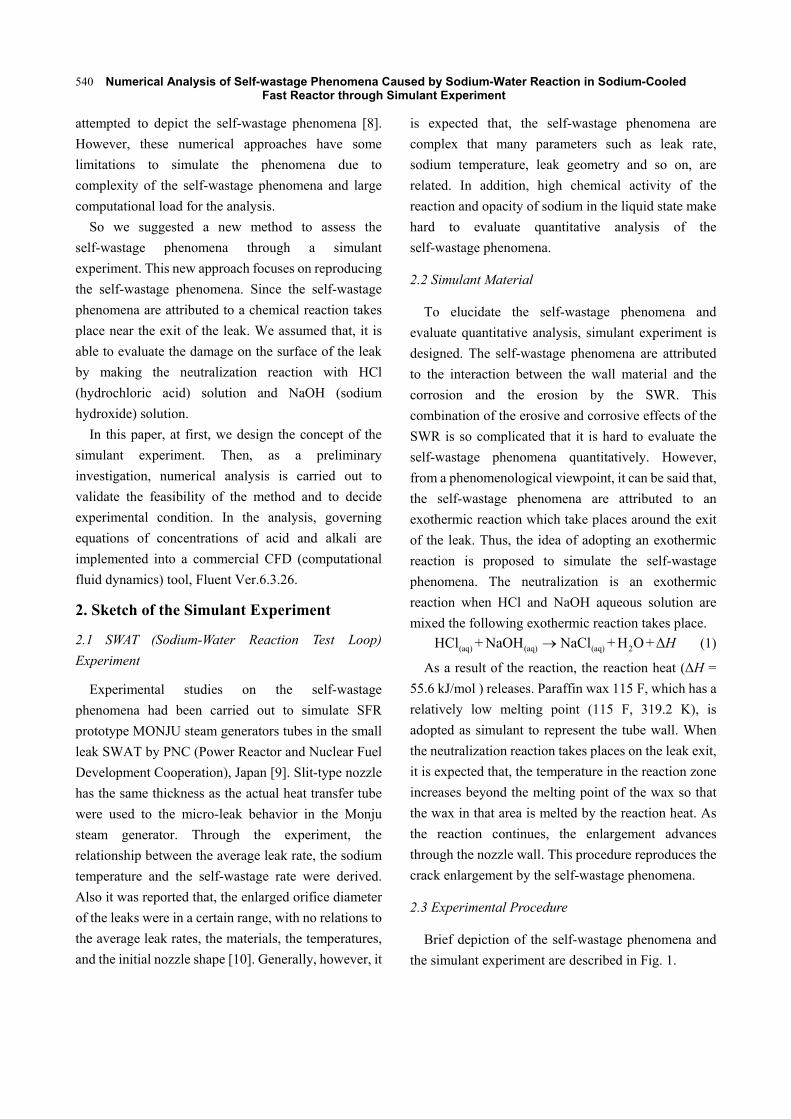
Brief depiction of the self-wastage phenomena and
the simulant experiment are described in Fig. 1.
Numerical Analysis of Self-wastage Phenomena Caused by Sodium-Water Reaction in Sodium-Cooled Fast Reactor through Simulant Experiment
541
Fig. 1 Overview of self-wastage and simulant experiment.
(1) The self-wastage phenomena are attributed to a
chemical reaction, which is followed by reaction heat,
takes place at the initial leak site;
(2) The wastage phenomena start from the sodium
side and advance through the tube thickness. As the
leak gets enlarged by the self-wastage, the reaction
zone advances toward the water/vapor side. As a result
of the enlargement, the corrosive reactants reach the
tube wall. Thus, the sodium water reaction will be
continued. The leak rate has stability in this stage;
(3) When the wastage develop to a certain depth to
the water side, the remaining tube wall will be removed
by high-inner pressure of the vapor, so that the leak rate
will be sharply increased. Then the sodium water
reaction zone migrates to the sodium side, so that the
self-wastage is mitigated;
(4) HCl and NaOH are used as simulant. Paraffin
wax 115 F is chosen as nozzle simulant to represents
the heat transfer tube. In the experiment, HCl solution
is injected into the reaction tank which is filled with
NaOH solution through the paraffin wax nozzle, so that
the neutralization reaction would occur at the exit of
the nozzle and the reaction heat will be released;
(5) If the temperature of the surface of the wax
exceeds the melting point of the paraffin wax, the
surface will be melted, and the nozzle will be enlarged.
As the wax is melted, new reaction zone advanced
through the wall;
(6) When the enlargement reaches to the HCl side,
investigate the geometry of the enlarged nozzle, the
effect of the self-wastage on the heat transfer tube
could be evaluated.
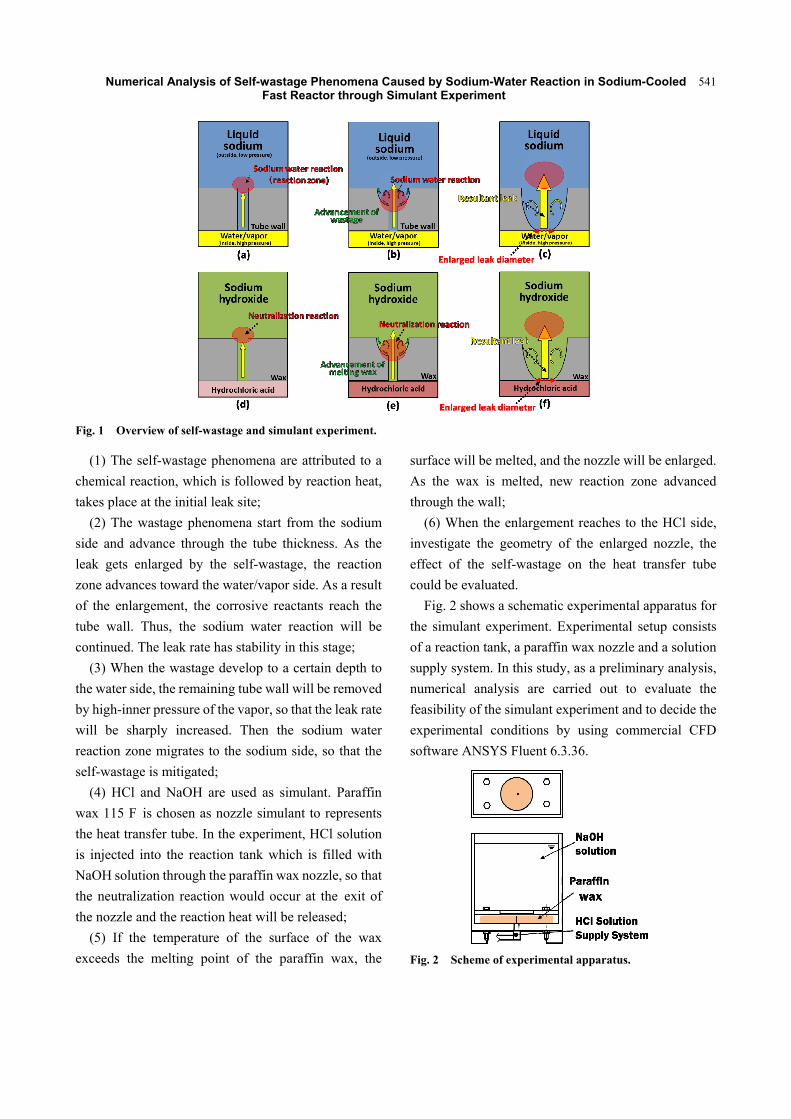
Fig. 2 shows a schematic experimental apparatus for
the simulant experiment. Experimental setup consists
of a reaction tank, a paraffin wax nozzle and a solution
supply system. In this study, as a preliminary analysis,
numerical analysis are carried out to evaluate the
feasibility of the simulant experiment and to decide the
experimental conditions by using commercial CFD
software ANSYS Fluent 6.3.36.
Fig. 2 Scheme of experimental apparatus.

Numerical Analysis of Self-wastage Phenomena Caused by Sodium-Water Reaction in Sodium-Cooled Fast Reactor through Simulant Experiment
542
3. Numerical Feasibility Analysis
3.1 Governing Equations
A two-dimensional unsteady flow of mass transfer
with a chemical reaction has been calculated in this
study. The conservation equation for chemical species
is given by Eq. (2):
-i i i iY vY J Rt
(2)
where, Ri is the net rate of production of mass of
species; Yi is the per unit volume by chemical reaction; Ji is the diffusion flux of species i, which arises due to
concentration gradients. For the net reaction rate, the
laminar finite-rate model is adopted. Chemical species
are computed based on the Arrhenius expression [11].
The net source of chemical species i due to the reaction
is computed as the sum of the Arrhenius reaction
sources over the NR reaction which the species
participate in Eq. (3):
,,1
RN
i ri w ir
R M R
(3)
where, Mw, i is the molecular weight of species i and Ri, r
is the Arrhenius molar rate of creation/destruction of
species i in reaction r. Reaction occur in the continuous
phase at wall surfaces. The molar rate of species i in
reaction is given by Eq. (4):
, ,
, ,
j r j r
i r F j rR k C
(4)
where, kF = rate constant for reaction; Cj, r = molar
concentration of species j in reaction r; ,j r = rate
exponent for reactant species j in reaction r; ,j r =
rate exponent for product species j in reaction r.
The rate constant can be computed from the
Arrhenius equation shown as below:
- /aE RTr rk A e (5)
where, Ar = pre-exponential factor (mol-1·m3·s-1); Ea =
activation energy for the reaction (J·mol-1); R =
universal gas constant (J·mol-1·K-1).
3.2 Numerical Approach
Numerical approach to evaluate the self-enlargement
of the leak consists of the three parts: construction of
analytical model; wastage rate evaluation using local
thermal hydraulic properties; remeshing process is
based on the local wastage rate.
It requires large computational load to carry out a
calculation during the whole time span of the
phenomena. According to experimental results, after
wastage starts from the sodium side, the leak rate stay
almost unchanged until the thin edge of the wall is
removed. Thus, the wastage phenomenon during this
period can be regarded as steady. Therefore, instead of
transient numerical calculations which consider the
whole series of event at one time, a stepwise
calculation is designed. At first, a transient calculation
is carried out over a small period time until it reaches
the steady condition. Then, the amount of the wastage
rate is evaluated from the thermal properties from the
numerical calculation, and then a new analytical mesh
model is reconstructed. Fig. 3 shows the numerical
procedure of the simulant experiment.
Step I: Determining an initial nozzle size: in order
to achieve dynamic similarity between the SWAT
experiment and the numerical analysis, Re number of
the analysis is decided to be equal to that of the
SWAT-2 experiment. The nozzle geometry is
decided to have the same as aspect ratio of the real
nozzle;
Step II: Investigation local thermal properties and
evaluate the amount of the melting wax: carry out an
unsteady numerical simulation for a certain period
until it reaches steady state. Then obtain thermal
properties such as temperature contour in the wax and
species distribution at the exit of the nozzle. In real
phenomena, the crack progresses according to the
crystal grain boundary of the material. It is assumed
that, the wax also melted according to the contour line
of the melting point of the wax;
Step III: Remeshing based on the melting wax: the
new mesh grid is produced by changing solid cells to
fluid cells according to the temperature contour of the
melting point which is obtained from the Step II;

Numerical Analysis of Self-wastage Phenomena Caused by Sodium-Water Reaction in Sodium-Cooled Fast Reactor through Simulant Experiment
543
Fig. 3 Numerical procedure for simulant experiment.
Step IV: Iteration from the Step II to Step III: iterate
from the Step II to Step III until the thickness of the
remained wax on HCl side become 15% of the
original thickness. This value is decided from the
general viewpoint of probabilistic fracture mechanics
of the failure of the heat transfer tube under high
pressure;
Step V: Evaluating the geometry of the enlarged
nozzle: when the thickness of the region of melted
wax reaches the 85% of the initial thickness,
investigate the geometry of the enlarged nozzle on the
sodium side.
3.3 Analytical Model and Conditions
For the numerical calculation, a commercial
software ANSYS Fluent 6.326 was used. Table 1
shows the experimental conditions of the SWAT-2 and
the analytical conditions for simulant experiment [12].
As the same as the SWAT-2 experiment, a slit-type
artificial crack is adopted as initial leak. Fig. 4 shows
two-dimensional analytical region and its mesh
arrangements. The region contains the reaction tank,
Table 1 Experiment and analytical conditions of SWAT-2.
(a) SWAT-2 experiment conditions
Experimental conditions
Tube material 2.25 Cr-1 Mo
Tube thickness 3.84 mm
Sodium temperature 470 °C
Sodium pressure 1.47 × 10⁻¹ MPa
Steam temperature 470 °C
Steam pressure 12.8 MPa
Initial crack width 15 μm
Initial leak rate 3.4 × 10⁻⁴ g/s
Average leak rate 2.5 × 10⁻⁵ g/s
(b) Analytical conditions for simulant
Initial condition
Temperature 298 K
Fluid NaOH
Concentration 5.0 mol/L
Boundary condition
Inlet
Fluid HCl
Velocity 0.05 m/s
Concentration 5.0 mol/L
Analytical condition
Number of cells 9,961
Time step 5.0 μs
Fig. 4 Analytical region for initial calculation.
the paraffin wax and the nozzle. The thickness of the
wax in the simulant material is decided as 2 mm from
the viewpoint of the convenience in manufacturing.
The width of the nozzle is determined to have the same
aspect ratio with the crack of the SWAT-2 experiment
so that the geometrical similarity is achieved between
the real prototype and the simulant material. As shown
in Fig. 4, the width of the initial nozzle is divided
Numerical Analysis of Self-wastage Phenomena Caused by Sodium-Water Reaction in Sodium-Cooled Fast Reactor through Simulant Experiment
544
equally into 11 cells (I). The meshes of the other region
are divided into 111 (I) × 59 (J) for reaction tank, 50 (I)
× 42 (J) for the wax, and each element increases with
the ratio of 1.1. The total number of the meshes is
approximately 10,000. In order to attain the dynamic
similarity of the flow between the two models, the
initial leak rate in the simulant experiment is decided to
have the same Reynolds number with the real condition.
For the inlet boundary, constant inlet velocity is
adopted, and the inlet velocity is decided to have the
same Reynolds number with the real condition had
constant flow rate (2.35 × 10⁻⁵ g/s) and the outlet
boundary, constant pressure condition is used. The side
walls of the reaction tank are the free-slip condition and
the heat exchange between the fluids, and the surface of
the wax on the top of the wax is considered.
4. Results and Discussion
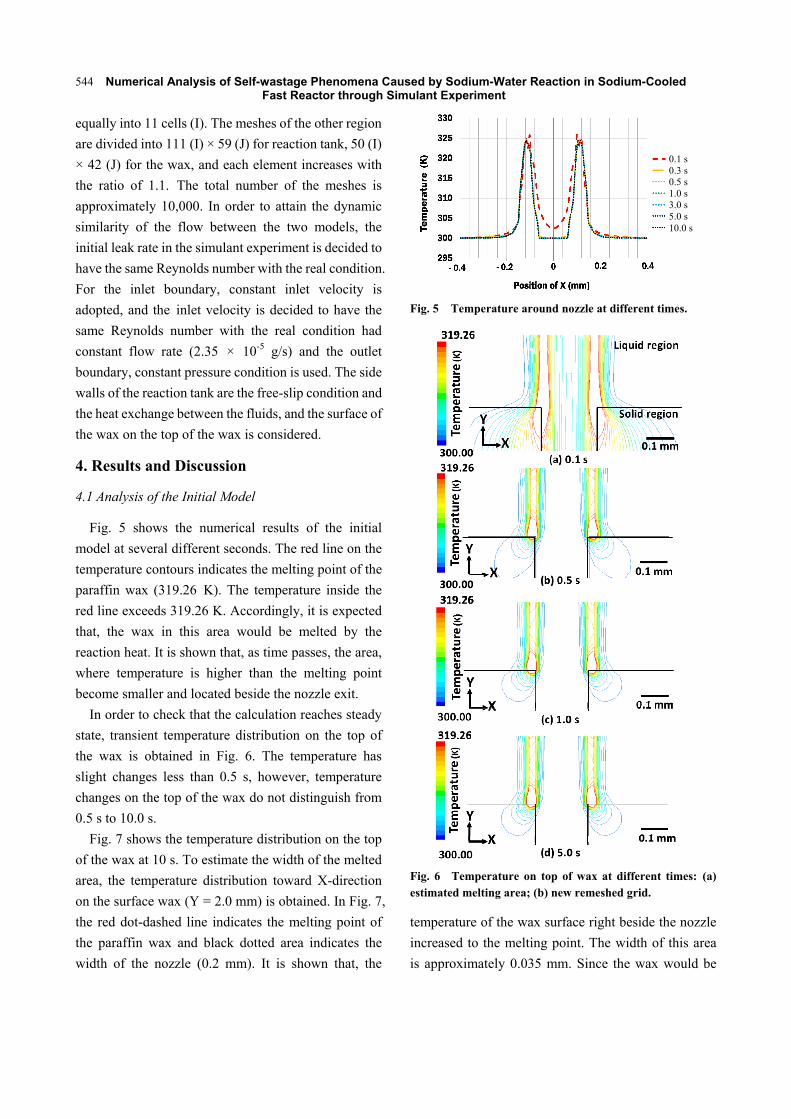
4.1 Analysis of the Initial Model
Fig. 5 shows the numerical results of the initial
model at several different seconds. The red line on the
temperature contours indicates the melting point of the
paraffin wax (319.26 K). The temperature inside the
red line exceeds 319.26 K. Accordingly, it is expected
that, the wax in this area would be melted by the
reaction heat. It is shown that, as time passes, the area,
where temperature is higher than the melting point
become smaller and located beside the nozzle exit.
In order to check that the calculation reaches steady
state, transient temperature distribution on the top of
the wax is obtained in Fig. 6. The temperature has
slight changes less than 0.5 s, however, temperature
changes on the top of the wax do not distinguish from
0.5 s to 10.0 s.
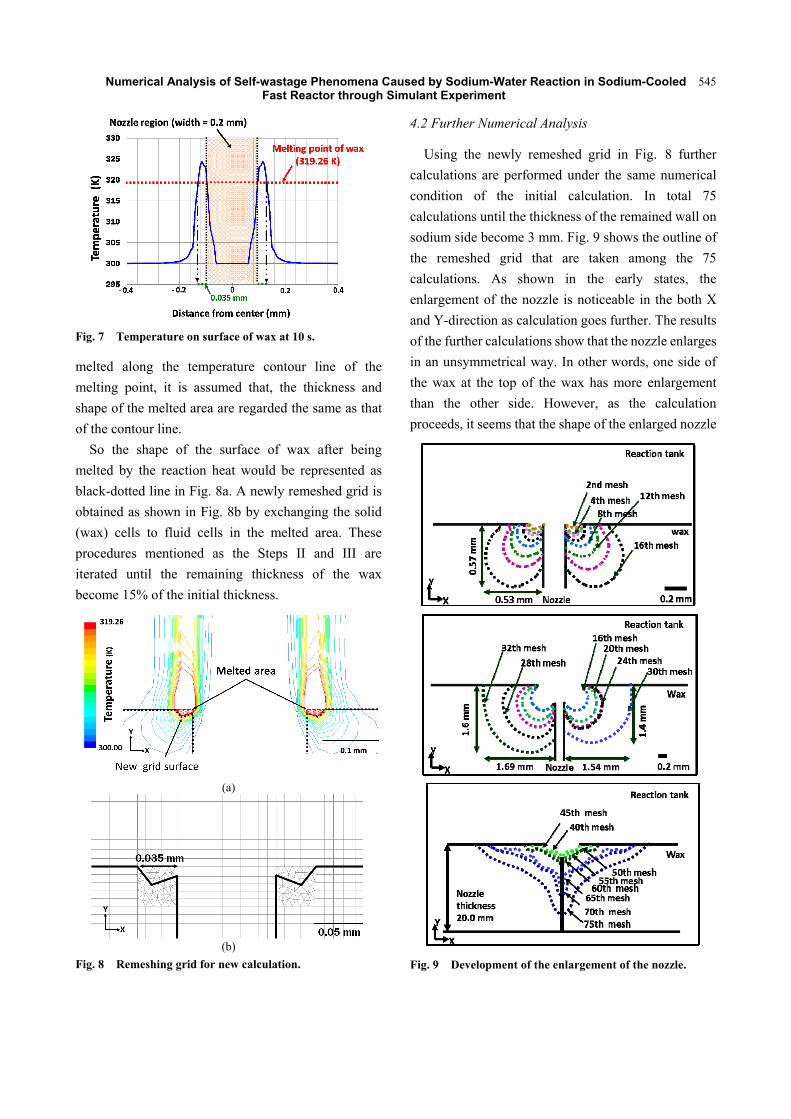
Fig. 7 shows the temperature distribution on the top
of the wax at 10 s. To estimate the width of the melted
area, the temperature distribution toward X-direction
on the surface wax (Y = 2.0 mm) is obtained. In Fig. 7,
the red dot-dashed line indicates the melting point of
the paraffin wax and black dotted area indicates the
width of the nozzle (0.2 mm). It is shown that, the
Fig. 5 Temperature around nozzle at different times.
Fig. 6 Temperature on top of wax at different times: (a) estimated melting area; (b) new remeshed grid.
temperature of the wax surface right beside the nozzle
increased to the melting point. The width of this area
is approximately 0.035 mm. Since the wax would be
0.1 s 0.3 s 0.5 s 1.0 s 3.0 s 5.0 s 10.0 s
Numerical Analysis of Self-wastage Phenomena Caused by Sodium-Water Reaction in Sodium-Cooled Fast Reactor through Simulant Experiment
545
Fig. 7 Temperature on surface of wax at 10 s.
melted along the temperature contour line of the
melting point, it is assumed that, the thickness and
shape of the melted area are regarded the same as that
of the contour line.
So the shape of the surface of wax after being
melted by the reaction heat would be represented as
black-dotted line in Fig. 8a. A newly remeshed grid is
obtained as shown in Fig. 8b by exchanging the solid
(wax) cells to fluid cells in the melted area. These
procedures mentioned as the Steps II and III are
iterated until the remaining thickness of the wax
become 15% of the initial thickness.
(a)
(b)
Fig. 8 Remeshing grid for new calculation.
4.2 Further Numerical Analysis
Using the newly remeshed grid in Fig. 8 further
calculations are performed under the same numerical
condition of the initial calculation. In total 75
calculations until the thickness of the remained wall on
sodium side become 3 mm. Fig. 9 shows the outline of
the remeshed grid that are taken among the 75
calculations. As shown in the early states, the
enlargement of the nozzle is noticeable in the both X
and Y-direction as calculation goes further. The results
of the further calculations show that the nozzle enlarges
in an unsymmetrical way. In other words, one side of
the wax at the top of the wax has more enlargement
than the other side. However, as the calculation
proceeds, it seems that the shape of the enlarged nozzle
Fig. 9 Development of the enlargement of the nozzle.

Numerical Analysis of Self-wastage Phenomena Caused by Sodium-Water Reaction in Sodium-Cooled Fast Reactor through Simulant Experiment
546
becomes almost symmetric again. Accordingly from
the 40th calculation, even though the estimated
enlarged nozzle shape is unsymmetrical, it is assumed
that, the nozzle enlarged to have a symmetric shape.
Through 75 calculations, it is found that, the
enlargement advances until 15% of the initial tube
thickness. So it is regarded that, the self-wastage
phenomena are suppressed. Therefore, the numerical
calculation is terminated.
4.3 Evaluation of Geometry of the Enlarged Nozzle
In the real condition, high pressure is working on the
steam side, so that when the remaining tube wall
reaches certain thickness, the remaining diaphragm of
the wall would be removed by the steam jet. As a result,
the width of the crack will be enlarged, and the
remaining wall thickness will also be increased. In this
study, it is assumed that, the when the remaining wall
thickness become 15% of the original thickness, nozzle
enlargement on HCl side take place, and the nozzle is
regarded as penetrated. Fig. 10 shows the shape of the
enlarged nozzle. The width of the complete enlarged
nozzle is 3.52 mm which is 17.6 times as bigger than
the initial width of the nozzle (0.2 mm). The shape of
the enlarged nozzle is like a funnel shape with a larger
opening toward the NaOH side.
Kuroha [13] reported that, the shapes of penetrated
nozzle observed in the SWAT-2 test were like a funnel
with a larger opening toward the sodium side. Fig. 11
shows the sectional morphology on complete
self-wasted crack. In the present study, the aspect ratio
of the nozzle and Re number are matched with the
SWAT experimental data. As a result, a similar shape
of the cross section of the enlarged nozzle is obtained.
Regarding the dimension of the enlarged nozzle,
SWAT experimental data about the ratio of the
diameter of the enlarged crack and the initial crack has
ranged from 3.30 to 34.52. In this study, the ratio of
the enlarged nozzle width and the initial width was
17.6. It is hard to say that, the process of simulant
experiment and that of a real experiment are exactly
Fig. 10 Geometry of penetrated nozzle.
Fig. 11 Sectional morphology on self-wasted crack.
same, but from the ratio of the enlarged nozzle width
and the initial width, it can be expected that, the
simulant experiment shows similarity with the
SWAT-2 experimental data.
5. Conclusions
The simulant experimental methodology of leak
enlargement by the self-wastage phenomena is
proposed. In the experiment, HCl, NaOH aqueous
solution and the paraffin wax are used as a simulant.
The reaction heat released by the neutralization
reaction with HCl and NaOH is used to reproduce the
self-wastage phenomena. By injecting the HCl solution
through a narrow wax nozzle, making the
neutralization reaction near the outside of the nozzle.
As a result of the release of the heat, the paraffin wax in
the reaction zone would be melted, and the
enlargement of the nozzle takes place.
To evaluate the feasibility of this methodology a
computational analysis procedure is devised, and a
preliminary numerical calculation is carried out. The
Numerical Analysis of Self-wastage Phenomena Caused by Sodium-Water Reaction in Sodium-Cooled Fast Reactor through Simulant Experiment
547
enlargement of wax nozzle is estimated by using the
temperature contour in the wax around the outside of
the nozzle. Through the series of calculations, it is
proved that, the propagation of the nozzle enlargement
takes place due to the reaction heat of the neutralization
and the enlargement advances toward HCl side. It is
assumed that, when remained wall thickness becomes
15% of the initial thickness, the enlargement is
terminated. The shape of the complete enlarged nozzle
is a conical pit, and this shows a similarity with the
cross section of the complete enlarged crack of
SWAT-2 experiment. The ratio of the width of the
enlarged nozzle and that of the initial nozzle is 17.6,
and it also has a similar tendency with the real ratio that
is from 3.30 to 34.52.
The experimental condition is determined through
this study. HCl solution is injected with 0.5 m/s
velocity through the wax nozzle (width = 0.2 mm), and
the flow has dynamic similarity with the flow in the
real experiment (No. 2020) of SWAT-2 experiment.
Also, it is proved that, there is a possibility to evaluate
the effect of parameters such as injection rate, nozzle
geometry in simulant experiment.
References
[1] Sandusky, D. W. 1975. Small-Leak Behavior Summary Report on Scoping Tests. Technical report.
[2] Hori, M. 1980. “Sodium/Water Reactions in Liquid Metal Fast Breeder Reactions.” Atomic Energy Review 18 (3): 707-78.
[3] Green, D. A. 1976. “Small Leak Damage and Protection Systems in Steam Generators.” In Proceedings of the International Conference of Liquid Metal Technology in Energy Production, 233-41.
[4] Quinet, J. L., and Lannou, L. 1979. “LMFBR Steam Generators: Behavior of Heat Exchange Tubes Faced with
a Through Crack Resulting in Contact Between Sodium and Water.” Nuclear Technology 46 (3): 582-90.
[5] Sandusky, D. W. 1974. “Behavior of Small Leaks in
LMFBR Steam Generator.” Trans. Am. Nucl. Soc. 19
(October): 106-7.
[6] Sandusky, D. W. 1976. “Small Leak Shutdown,
Location and Behavior in LMFBR Steam Generators.”
In Proceedings of the International Conference on
Liquid Metal Techonolgy in Energy Production,
226-32.
[7] Abe, Y., Shimoyama, K., and Kurihara, A. 2014.
Development of Experimental Method for Self-wastage
Behavior in Sodium-Water Reaction—Development of
Test Rig (SWAT-2R) and Study for Experimental
Procedure. JAEA (Japan Atomic Energy
Agency)-Technology 2014-026.
[8] Takata, T., and Yamaguchi, A. 2002. Numerical
Thermal-Hydraulic Study on Sodium-Water
Phenomena—Development of Computational Code
“SERAPHIM”. Nuclear Cycle Development Institute
Technical report.
[9] Kuroha, M., Inoue, S., Daigo, Y., and Sato, M. 1980.
Preliminal Study of Micro-defect Self-wastage on 2
1/4Cr-1Mo Steel Nozzles for LMFBR Steam
Generators—Studies of Micro-leak Sodium-Water
Reactions (1). PNC ZN941 80-135.
[10] Kuroha, M., and Shimoyama, K. 1986. Micro-leak
Behavior on LMFBR Monju Steam Generator Tube
Material. PNC ZN941 86-027.
[11] Ansys. 2006. “Fluent 6.3 User’s Guide.” Fluent Inc.
[12] Kuroha, M., Sasaki, K., Kawabe, H., Yamada, T., and Sato,
M. 1982. “Study of Micro-defect Self-wastage Phenomena
on LMBR Prototype Steam Generator’s Tube—Studies of
Micro-leak Sodium-Water Reactions (2).” In PNC TN941
82-101, Ibaraki: Japan Nuclear Cycle Development
Institute, 23.
[13] Kuroha, M., Sasaki, K., Kawabe, H., Yamada, T., and Sato,
M. 1982. “Study of Micro-defect Self-wastage Phenomena
on LMBR Prototype Steam Generator’s Tube—Studies of
Micro-leak Sodium-Water Reactions (2).” In PNC TN941
82-101, Ibaraki: Japan Nuclear Cycle Development
Institute, 57.