Embed Size (px)
Citation preview

Volume 7, Number 5 (October 2014) p. 747-774 • ISSN 1983-4195
© 2014 IBRACON
Numerical and experimental analysis of time-dependent load transfer in reinforced concrete columns
Análise numérica e experimental da transferência de carga do concreto para a armadura em pilares
a Departamento de Estruturas e Geotécnica, Escola Politécnica, Universidade de São Paulo, São Paulo, SP, Brasil. Received: 28 Aug 2012 • Accepted: 22 Jan 2013 • Available Online: 02 Oct 2014
Abstract
Resumo
A study was conducted to assess the influence of the steel reinforcement ratio in concrete columns on their properties of creep and shrinkage. Experimental tests and three-dimensional finite element-based simulations of the experimental curves from plain concrete cylinders and plain con-crete columns derived by curve fitting were performed using the ACI 209 model available in DIANA 9.3. Columns with longitudinal reinforcement ratios of 0%, 1.4% and 2.8%, loaded to 30% and 40% of their 7-day compressive strength, were investigated. The results indicated that numerical simulation does not predict experimental data for a long period. However, simulations fitted with experimental curves derived from plain concrete columns presented values close to those of experimental data for 91 days.
Keywords: column, reinforced concrete, creep, shrinkage, load transfer.
Este trabalho tem o objetivo de analisar a influência da taxa de armadura na transferência de carga devida à fluência e retração. Esta análise foi feita confrontando resultados da análise experimental e da modelagem tridimensional de pilares de concreto com taxas de armadura de 0%, 1,4% e 2,8%, carregados com 30% e 40% da resistência média a compressão aos 7 dias. Foram consideradas as curvas de fluência e retração do modelo ACI209 disponível no programa DIANA 9.3, as curvas de fluência provenientes da calibração do modelo visco elástico do programa utilizando tanto resultados experimentais de fluência de corpo de prova quanto do pilar sem armadura. A partir dos resultados foi possível concluir que, embora a simulação numérica não seja capaz de reproduzir o comportamento do concreto ao longo do tempo, utilizando a curva de fluência calibrada com resultados experimentais do pilar sem armadura, é possível representar a redistribuição de tensões nos pilares para 91 dias.
Palavras-chave: pilar, concreto armado, fluência, retração, transferência de carga.
L. T. KATAOKA a
T. N. BITTENCOURT a

748 IBRACON Structures and Materials Journal • 2014 • vol. 7 • nº 5
Numerical and experimental analysis of time-dependent load transfer in reinforced concrete columns
1. Introduction
The time-dependent behavior of concrete due to its creep and shrinkage properties exerts a considerable influence on the perfor-mance of concrete structures, which may cause excessive strain and stress redistribution (AL-MANASSEER and LAM [1]). Over time, if not detected and treated properly, this excessive strain and redistribution of stresses can lead to the deterioration of concrete structures and even their collapse, resulting in considerable eco-nomic and social costs (Almeida [2]). In reinforced concrete columns, creep and shrinkage lead to grad-ual load transfer from concrete to reinforcement. Assuming that cross sections remain flat caused by small strains due to creep and shrinkage under load, the stresses decrease in the concrete and increase in the reinforcing bars over time. Stress redistribution induced by creep and shrinkage may cause the rebars in under-reinforced columns to reach their yield point or eccentrically loaded columns to buckle, even under in-service loads (RÜSCH [3]; NEV-ILLE [4]). In short columns, creep causes a small decrease in con-crete strength (MAUCH [5]). This load redistribution also allows the load borne by a column to be determined, should a load transfer be necessary due to the removal of a column (CASTRO et al. [6]). Based on experimental results of reinforced concrete columns, TAKEUTI [7] found that strain constraints introduced by reinforcing bars should be considered, since they have a significant effect on rebar deformation. Most researches into time-dependent deformations in concrete seek to determine the mechanism involved in the process or to quantify the creep and shrinkage of a mix under given conditions. In both cases, these properties are studied using concrete test specimens and neglecting the effect of the steel in reinforced con-crete (HOLM and PISTRANG [8]). In this regard, it is essential to evaluate concrete creep and shrink-age both experimentally and numerically, since this allows one to as-certain if numerical modeling is able to predict the experimental re-sults by simulating the behavior of structures or structural elements.
The computational numerical analysis performed in this research is based on the finite element method (FEM), which is very useful in the analysis of structural behavior. Basically, the Finite Element Method consists of a process of discretization of a continuous me-dium with infinite degrees of freedom, in a set of discrete elements called finite elements interconnected by discrete points known as nodes (BATHE [9]). Furthermore, the finite element method is a tool widely used to simulate the behavior of reinforced concrete ele-ments (NIE et al. [10]; JENDELE and CERVENKA [11]). This article aims to contribute to the existing body of knowledge about the behavior of the properties of creep and shrinkage in reinforced concrete columns. To this end, we examine the redis-tribution of loads from concrete to reinforcement by means of ex-perimental and numerical analyses using the ACI 209 model [12] (ACI) available in the DIANA 9.3 program [13], as well as the creep and shrinkage curves obtained by calibrating the program’s visco-elastic model, using the experimental creep and shrinkage results of the test specimen and of an unreinforced concrete column. In addition, the experimental results of test specimens and prototype columns are compared with the numerical results.
2. Methodology for testing prototype columns
Nine prototypes of short reinforced concrete columns (l =14) with a cross section of 15x15cm and a height of 60 cm were creep and shrinkage tested. Centric loading, a constant transverse reinforce-ment ratio and three longitudinal reinforcement ratios of 0%, 1.4% and 2.8% were considered. Details of the reinforcement, which was made according to the Brazilian technical standard NBR6118 [14], are illustrated in Figure 1. The creep-tested prototypes were loaded at 7 days with 40% and 30% of their average compressive strength at this age. In addition to the loaded columns, non-loaded columns were also tested to determine the shrinkage deformation. Shrinkage was measured starting at 7 days, under the same curing conditions as those of
Figure 1 – Details of reinforcements
15
15
2
8N1 f 10mm(56cm)
6N2 f 6,3mm c/ 11cm(54cm)
11
,2
60
1515
60
11
,2
4N1 f 10mm(56cm)
1,4%
2
15
15
8,7
2
6N2 f 6,3mm c/ 11cm(54cm)
2
4,4
2,8%

749IBRACON Structures and Materials Journal • 2014 • vol. 7 • nº 5
L. T. KATAOKA | T. N. BITTENCOURT
the other prototypes. Along with the prototype columns, three 15 x 30 cm cylindrical specimens were cast, two for drying creep and one for drying shrinkage testing. Twelve 10 x 20 cm cylindrical specimens were also cast to determine the average compressive strength and elastic modulus at 7 and 28 days. The strength class used for experimentally testing the columns was defined as 30 MPa, and the concrete mix design is described in Table 1. The dimensions of the columns were chosen so that the ratios of volume to surface (V/S) and cross-sectional area to cross-section-al perimeter (Ac/u) would be the same as those of the cylindrical specimens, i.e., 3.75. A nomenclature was used to identify each prototype. The nomen-clature begins with a letter, which indicates the type of test (creep – F or shrinkage – R) followed by two digits representing the percent-age of load applied at 7 days (30 or 40%). This is followed by two digits that indicate the longitudinal reinforcement ratio in percent-age (0.0%, 1.4% or 2.8%). Lastly, a single digit is used to specify the number of the prototype within a group of identical columns (1 or 2). An example of the nomenclature used is given by F40-2,8-2. This is a column creep-tested at 40% of the average compressive strength at 7 days, with a longitudinal reinforcement rate of 2.8%, and it is the second in a group of identical columns.The characteristics of prototype columns under study are de-scribed in Table 2. The strains in the steel reinforcements of the prototypes were mea-sured using bonded resistance strain gauges and strains in the concrete using embedded strain gauges. All the longitudinal rein-forcements of the columns were instrumented at mid-height of the column. The concrete sensor was positioned at the center of the cross section of the column at longitudinal half-height. Casting was done according to the Brazilian NBR5738 standard [15], using a mechanical vibrator for both the prototype columns and the cylindrical specimens. One day after casting, the columns were placed in a moist cham-ber, where they remained until they were loaded (7 days). The cy-lindrical specimens were unmolded one day after casting and kept in a moist chamber until the testing age (7 days and 28 days). The prototypes were creep-tested according to NBR8224 [16] in a climatized chamber with constant temperature and relative humid-ity of 23 ± 1ºC and 60 ± 4%. The load applied to the prototypes was 30% or 40% of the average compressive strength at 7 days of age (7.9 and 10.5 MPa, respectively).
3 Numerical simulation of the prototype columns
This section describes the three-dimensional numerical simulation of the experimentally tested prototype columns, considering their creep and shrinkage properties. The creep and shrinkage curves of the ACI 209 model [12] available in the Diana 9.3 program [13] and the creep and shrinkage curves obtained by calibrating the vis-coelastic model of the program, based on experimental creep and shrinkage values of the cylindrical specimens and the unreinforced concrete columns, are used to predict these properties.
3.1 Finite element models of the materials
The concrete was modeled using 20-node isoparametric solid ele-ments. These elements are based on quadratic interpolation and Gauss integration and have three degrees of freedom per node x, y and z. The strain and stress vary linearly in one direction and quadratically in the other two directions.The reinforcing bars are modeled using 2-node discrete represen-tation. In this representation, the reinforcement is considered as a lattice element whose nodes coincide with those of the concrete finite element mesh. The reinforcement is distributed uniformly in the concrete element, and each set of reinforcing bars is replaced
Table 1 – Conventional concrete mix design
Composition Mix Characteristics3Cement (kg/m )
3Manufactured sand (kg/m )3Quartz sand (kg/m )
3Crushed stone #0 (kg/m )3Crushed stone #1 (kg/m )
3Water (kg/m )3Additive (kg/m )
w/c (kg/kg)Mix design (unit weight)
280460372157911164
1,9570.56
1:2,97:3,81;0,59
Slow hardening, with up to 36% of clinker substituted for blast furnace slagLimestone coarse aggregate residue with maximum size of 1.2 mm
Natural sand with maximum size of 2.4 mmLimestone with maximum size of 9.5 mmLimestone with maximum size of 19 mm
Local supply3Water reducing additive with 1.2g/cm density
––
Table 2 – Characteristics of the prototype columns
NomenclatureLongitudinal
reinforcement ratio (%)
Load at 7 days (MPa)
Group
F40-2,8-1F40-2,8-2F30-2,8-1F40-1,4-1F30-1,4-1F40-0,0-1R-2,8-1R-1,4-1R-0,0-1
2.82.82.81.41.40.02.81.40.0
10.510.57.9
10.57.9
10.5–––
121111111

750 IBRACON Structures and Materials Journal • 2014 • vol. 7 • nº 5
Numerical and experimental analysis of time-dependent load transfer in reinforced concrete columns
by a two-dimensional layer of equivalent thickness and area. The Diana 9.3 program [13] contains the Von Mises rupture model with the constitutive equation of the material following a perfect elas-toplastic model or elastoplastic hardening model to represent the behavior of the steel.
3.2 Creep and shrinkage models in DIANA 9.3
In Diana 9.3 [12], long-term effects such as creep can be mod-eled using the Power Law, Maxwell chain and Kelvin chain viscoelastic models. This computer program can also model long-term effects based on the Maxwell chain and Kelvin chain serial models, considering as input data a discrete creep or relaxation function (e.g., experimental curve), or using models available in the program (CEB-FIP MODEL CODE [17]; ACI 209 [12]; NEN 6720 MODEL CODE [18] and JSCE MODEL CODE [19]). The experimental creep curve is modeled using the Maxwell chain viscoelastic model, which consists of several parallel springs and
dampers in series (Figure 2), where Ex is the spring stiffness and h is the viscosity of the damper. Data on shrinkage deformations is generally entered using the dis-crete function based on experimental results and curves derived from the CEB-FIP Model Code [17], ACI 209 [12] and NEN 6720 Model Code [18] models available in Diana 9.3 [13]. The age at onset of drying is used as the input datum of the discrete functions.The prototype columns were modeled using the experimental creep and shrinkage curves and the curves obtained from the ACI model, using the Maxwell chain viscoelastic model. Although the Diana 9.3 program [13] has several creep and shrinkage models, the numerical simulations were performed using only the ACI mod-el, since this research did not include a study of the other models.
3.3 Numerical models of the prototype columns
Although the NBR6118 standard [14] specifies creep analysis only for columns with slenderness (λ) greater than 90, the property of creep in short columns was studied here because the main objec-tive was to analyze load transfer from concrete to reinforcing bars. The creep and shrinkage behavior of prototype columns was ana-lyzed for three longitudinal reinforcement ratios of 1.4%, 2.8% and 0%, respectively. A constant distributed load (P) of 10.5 and 7.9 N/mm2 was applied on the column models, in the upper area of the column, represent-ing 40% and 30% of the average compressive strength at 7 days, respectively, as can be seen in Figure 3. A Poisson coefficient of 0.2 was adopted for the concrete. The properties of the materials (concrete and reinforcing bars) for the prototype columns were determined experimentally and are pre-sented in Tables 3 and 4. A relative humidity of 60% was considered in the numerical simula-tion using the creep and shrinkage curve of the ACI model. The concrete air content and consistency adopted here were deter-mined experimentally and were equal to 3.9% and 132 mm, re-spectively. The fictitious thickness (h = 150 mm) was determined based on the formulation provided by the ACI 318 code [20]. A
Figure 2 – Maxwell's chain model (Source: Diana 9.3 handbook)
Figure 3 – Numerical models of the prototype columns (1.4, 2.8 and 0% reinforcement ratios)
P
1,4%
P
2,8% 0%
P

751IBRACON Structures and Materials Journal • 2014 • vol. 7 • nº 5
L. T. KATAOKA | T. N. BITTENCOURT
fine aggregate to total aggregate ratio of 45% was adopted. The numerical simulation of shrinkage required several additional input parameters, such as: average compressive strength at 28 days (33.3 MPa), ambient temperature (23ºC), concrete curing time (7 days), and cement consumption (280 kg/m3). The simulation of numerical models considering the experimental creep and shrinkage curve required changing an input file in Diana 9.3 [13] by adding the experimental results to the properties of con-crete. The prototypes were subjected only to compression loading in service, so cracking models were not used. The simulation of creep and shrinkage deformations was per-formed for up to 91 days of age, since this corresponds to the time during which the prototype was loaded experimentally. CARREIRA and BURG [21] and BAŽANT [22] believe that a minimum period of 91 days of creep testing is sufficient. However, since this research is still ongoing, creep results will be evaluated for a longer period later on.Figure 4 depicts the meshes of the three-dimensional structural models of the prototype columns, while Table 5 describes the number of nodes and elements of the numerical models. The concrete elements used for the meshes of the three-dimensional models are 20 quadratic nodes, defined as CHX60, and the ele-
ments of the reinforcements are lattice type, defined as L6TRU (Figures 5 and 6).
4. Results and discussion
This section discusses the results and analysis of the simulation of the numerical models and compares the experimental and nu-merical results of creep and shrinkage deformation of the proto-type columns.
Table 3 – Properties of the concrete of the prototype columns
Mechanical properties of the concrete
f (MPa)cm7
f (MPa)cm28
E (GPa)cm7
E (GPa)cm28
26.233.326.829.8
Table 4 – Properties of the reinforcing bars in the prototype columns
Physical and mechanical properties of the reinforcements
Type of reinforcement
Area 2(cm )
f y
(MPa)Es
(GPa)
LongitudinalStirrup
3.151.26
635611
217.4213.7
Figure 4 – Meshes of the prototype columns
1.4% 2.8% 0%A B C
Table 5 – Number of nodes and elementsin the numerical models
Column Nº of nodes Nº of elements
1.4%2.8%0%
413745012736
11441406500
752 IBRACON Structures and Materials Journal • 2014 • vol. 7 • nº 5
Numerical and experimental analysis of time-dependent load transfer in reinforced concrete columns
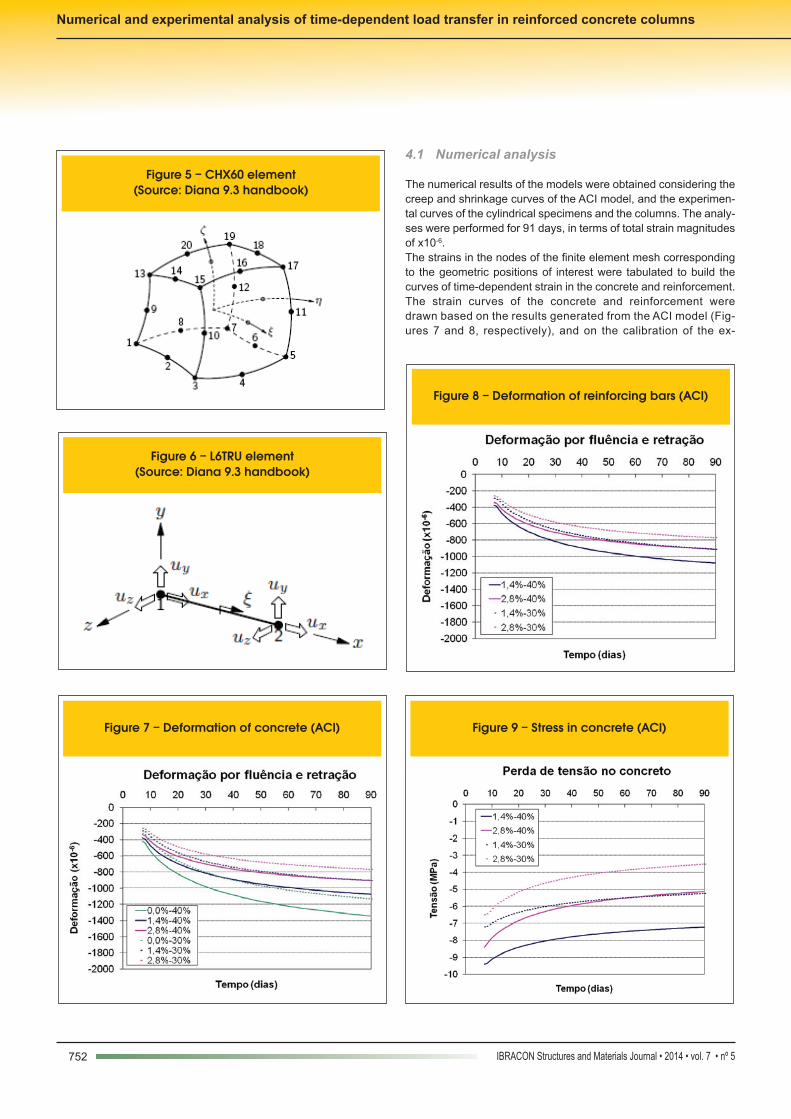
4.1 Numerical analysis
The numerical results of the models were obtained considering the creep and shrinkage curves of the ACI model, and the experimen-tal curves of the cylindrical specimens and the columns. The analy-ses were performed for 91 days, in terms of total strain magnitudes of x10-6. The strains in the nodes of the finite element mesh corresponding to the geometric positions of interest were tabulated to build the curves of time-dependent strain in the concrete and reinforcement. The strain curves of the concrete and reinforcement were drawn based on the results generated from the ACI model (Fig-ures 7 and 8, respectively), and on the calibration of the ex-
Figure 5 – CHX60 element(Source: Diana 9.3 handbook)
Figure 6 – L6TRU element (Source: Diana 9.3 handbook)
Figure 7 – Deformation of concrete (ACI)
Figure 8 – Deformation of reinforcing bars (ACI)
Figure 9 – Stress in concrete (ACI)

753IBRACON Structures and Materials Journal • 2014 • vol. 7 • nº 5
L. T. KATAOKA | T. N. BITTENCOURT
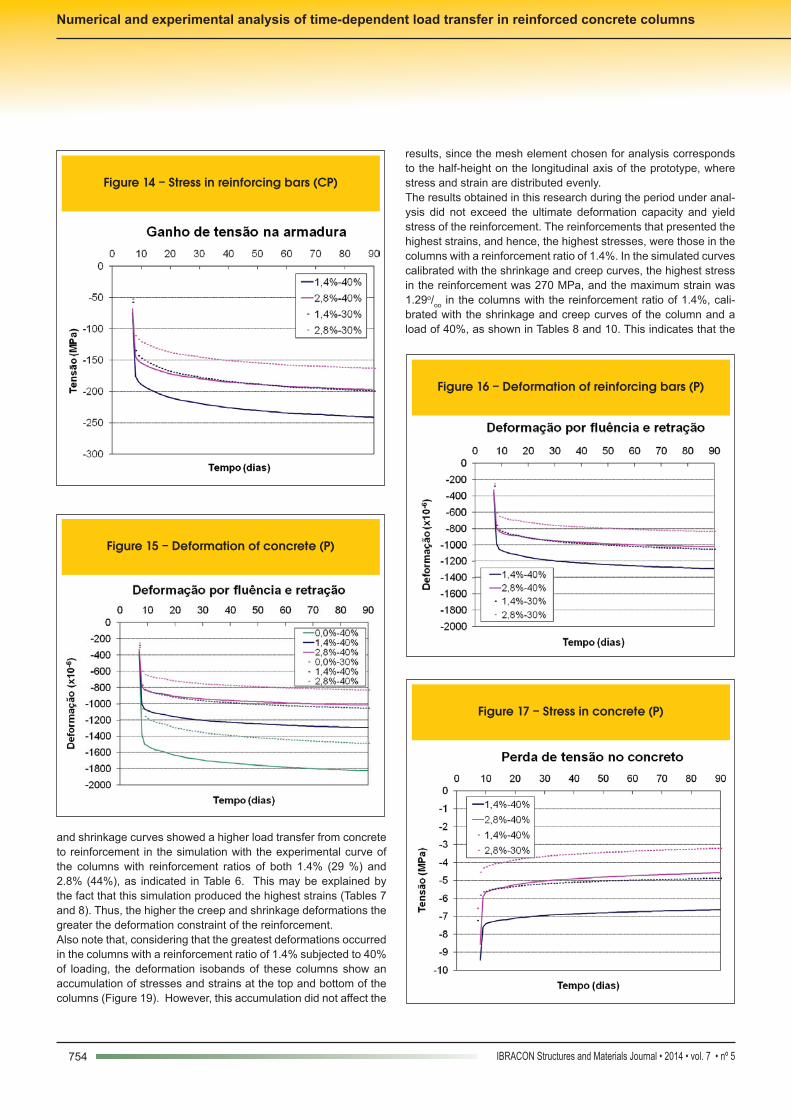
perimental creep and shrinkage curves of the cylindrical speci-mens (Figures 11 and 12, respectively) and columns (Figures 15 and 16, respectively). In addition, stress curves in the concrete and reinforcement were generated along 91 days and calibrated with the ACI model (Fig-ures 9 and 10, respectively), and with the experimental curve of the cylindrical specimens (Figures 13 and 14, respectively) and the columns (Figures 17 and 18, respectively). The nomenclature in the figure captions defines firstly the percent-age of reinforcement in the columns, followed by the percentage of the applied load. The nomenclature in each figure indicates the
creep and shrinkage curve used in the simulation: ACI (ACI), cylin-drical specimen (CP) and column (P). As expected, the unreinforced column showed higher creep and shrinkage deformation, since the strains were not constrained by a reinforcement ratio (Figures 7, 11 and 15). Considering the un-reinforced concrete column as reference, the reinforcement con-strained the deformations of concrete more significantly in the col-umn with a reinforcement ratio of 2.8% than in the column with a ratio of 1.4%, due to the higher reinforcement ratio in the former, as indicated in Table 6,The numerically simulated curves calibrated with the various creep
Figure 10 – Stress in reinforcing bars (ACI)
Figure 11 – Deformation of concrete (CP)
Figure 12 – Deformation of reinforcing bars (CP)
Figure 13 – Stress in concrete (CP)
754 IBRACON Structures and Materials Journal • 2014 • vol. 7 • nº 5
Numerical and experimental analysis of time-dependent load transfer in reinforced concrete columns
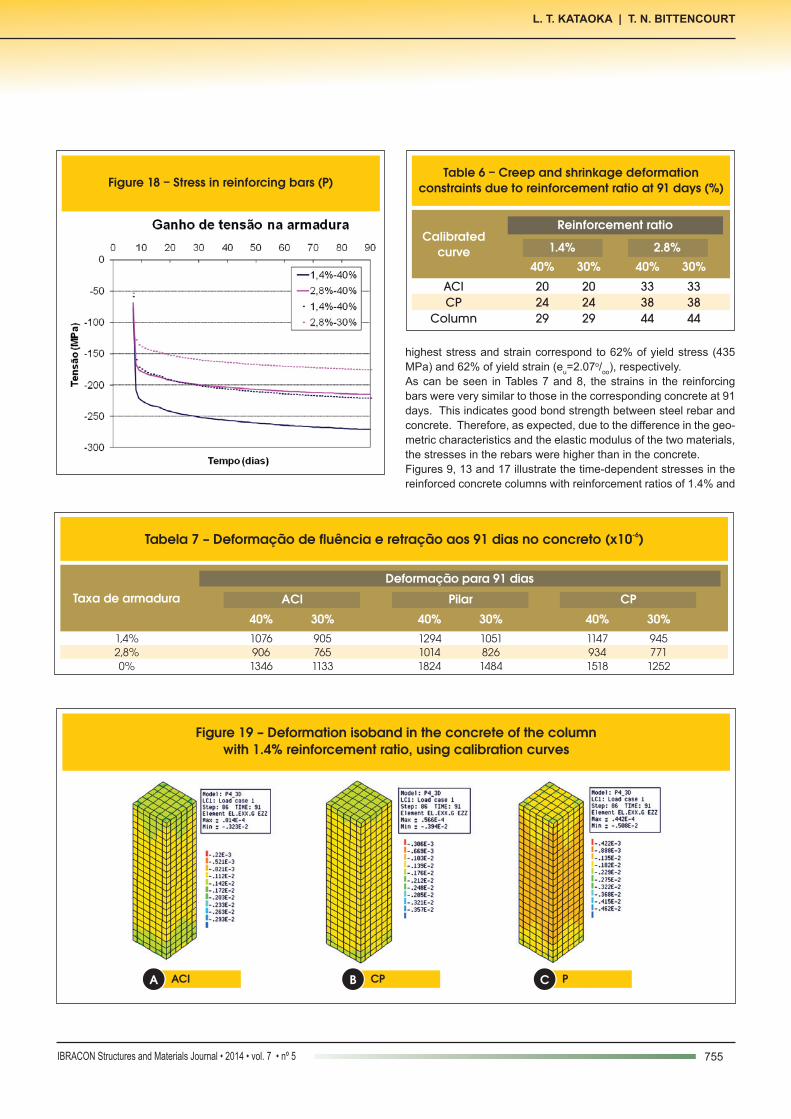
and shrinkage curves showed a higher load transfer from concrete to reinforcement in the simulation with the experimental curve of the columns with reinforcement ratios of both 1.4% (29 %) and 2.8% (44%), as indicated in Table 6. This may be explained by the fact that this simulation produced the highest strains (Tables 7 and 8). Thus, the higher the creep and shrinkage deformations the greater the deformation constraint of the reinforcement. Also note that, considering that the greatest deformations occurred in the columns with a reinforcement ratio of 1.4% subjected to 40% of loading, the deformation isobands of these columns show an accumulation of stresses and strains at the top and bottom of the columns (Figure 19). However, this accumulation did not affect the
results, since the mesh element chosen for analysis corresponds to the half-height on the longitudinal axis of the prototype, where stress and strain are distributed evenly. The results obtained in this research during the period under anal-ysis did not exceed the ultimate deformation capacity and yield stress of the reinforcement. The reinforcements that presented the highest strains, and hence, the highest stresses, were those in the columns with a reinforcement ratio of 1.4%. In the simulated curves calibrated with the shrinkage and creep curves, the highest stress in the reinforcement was 270 MPa, and the maximum strain was 1.29o/oo in the columns with the reinforcement ratio of 1.4%, cali-brated with the shrinkage and creep curves of the column and a load of 40%, as shown in Tables 8 and 10. This indicates that the
Figure 14 – Stress in reinforcing bars (CP)
Figure 15 – Deformation of concrete (P)
Figure 16 – Deformation of reinforcing bars (P)
Figure 17 – Stress in concrete (P)
755IBRACON Structures and Materials Journal • 2014 • vol. 7 • nº 5
L. T. KATAOKA | T. N. BITTENCOURT
highest stress and strain correspond to 62% of yield stress (435 MPa) and 62% of yield strain (eu=2.07o/oo), respectively. As can be seen in Tables 7 and 8, the strains in the reinforcing bars were very similar to those in the corresponding concrete at 91 days. This indicates good bond strength between steel rebar and concrete. Therefore, as expected, due to the difference in the geo-metric characteristics and the elastic modulus of the two materials, the stresses in the rebars were higher than in the concrete. Figures 9, 13 and 17 illustrate the time-dependent stresses in the reinforced concrete columns with reinforcement ratios of 1.4% and
Figure 18 – Stress in reinforcing bars (P)
Figure 19 – Deformation isoband in the concrete of the column with 1.4% reinforcement ratio, using calibration curves
ACI CP PA B C
Table 6 – Creep and shrinkage deformation constraints due to reinforcement ratio at 91 days (%)
Reinforcement ratioCalibrated
curve
ACICP
Column
1.4% 2.8%40% 40%30% 30%
202429
333844
202429
333844
-6Tabela 7 – Deformação de fluência e retração aos 91 dias no concreto (x10 )
Taxa de armadura
Deformação para 91 dias
1,4%2,8%0%
ACI Pilar CP
40% 40% 40%30% 30% 30%10769061346
129410141824
11479341518
9057651133
10518261484
9457711252
756 IBRACON Structures and Materials Journal • 2014 • vol. 7 • nº 5
Numerical and experimental analysis of time-dependent load transfer in reinforced concrete columns
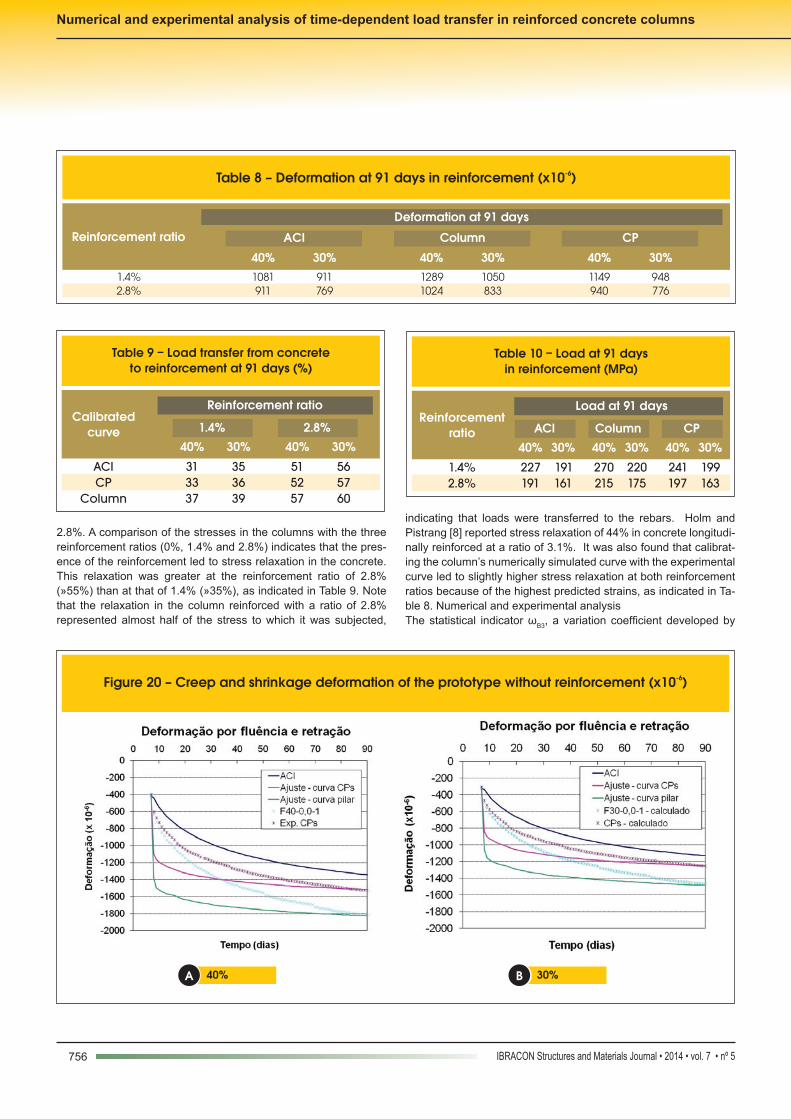
2.8%. A comparison of the stresses in the columns with the three reinforcement ratios (0%, 1.4% and 2.8%) indicates that the pres-ence of the reinforcement led to stress relaxation in the concrete. This relaxation was greater at the reinforcement ratio of 2.8% (»55%) than at that of 1.4% (»35%), as indicated in Table 9. Note that the relaxation in the column reinforced with a ratio of 2.8% represented almost half of the stress to which it was subjected,
indicating that loads were transferred to the rebars. Holm and Pistrang [8] reported stress relaxation of 44% in concrete longitudi-nally reinforced at a ratio of 3.1%. It was also found that calibrat-ing the column’s numerically simulated curve with the experimental curve led to slightly higher stress relaxation at both reinforcement ratios because of the highest predicted strains, as indicated in Ta-ble 8. Numerical and experimental analysisThe statistical indicator ωB3, a variation coefficient developed by
-6Table 8 – Deformation at 91 days in reinforcement (x10 )
Reinforcement ratio
Deformation at 91 days
1.4%2.8%
ACI Column CP
40% 40% 40%30% 30% 30%1081911
12891024
1149940
911769
1050833
948776
Table 9 – Load transfer from concrete to reinforcement at 91 days (%)
Reinforcement ratioCalibrated
curve
ACICP
Column
1.4% 2.8%40% 40%30% 30%
313337
515257
353639
565760
Table 10 – Load at 91 days in reinforcement (MPa)
Load at 91 daysReinforcement
ratio
1.4%2.8%
ACI Column CP40% 40% 40%30% 30% 30%
227191
270215
241197
191161
220175
199163
-6Figure 20 – Creep and shrinkage deformation of the prototype without reinforcement (x10 )
40%A 30%B
757IBRACON Structures and Materials Journal • 2014 • vol. 7 • nº 5
L. T. KATAOKA | T. N. BITTENCOURT
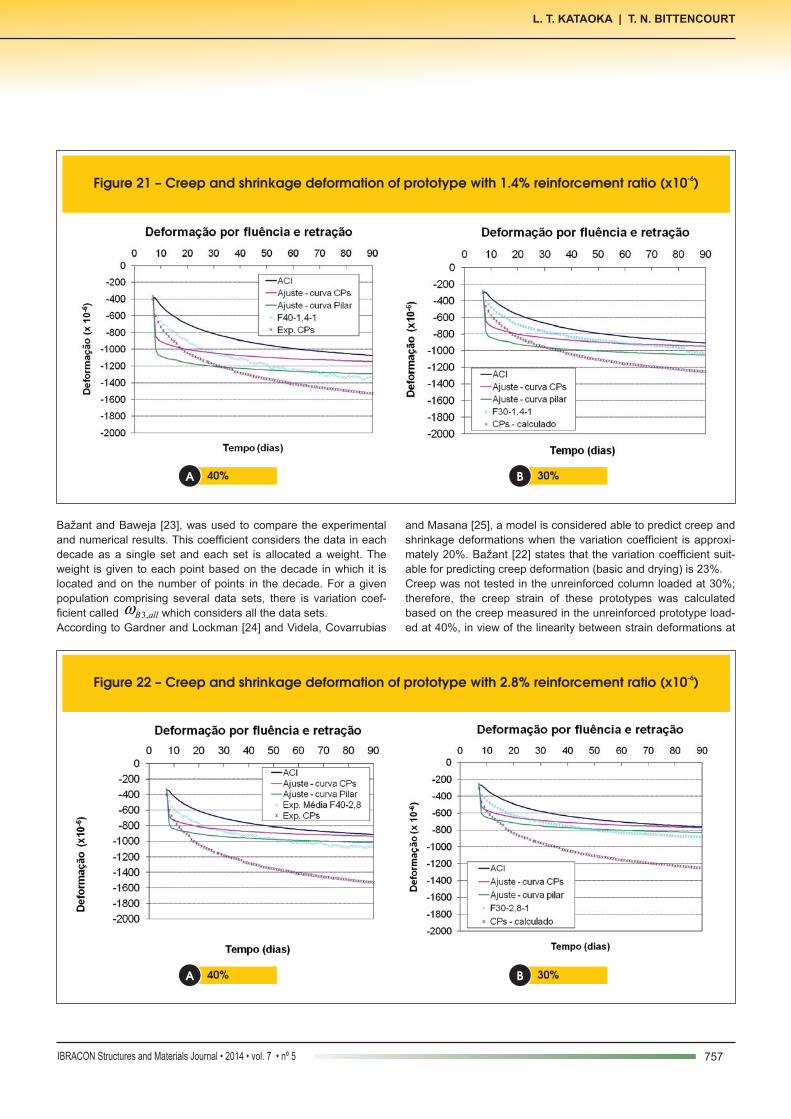
Bažant and Baweja [23], was used to compare the experimental and numerical results. This coefficient considers the data in each decade as a single set and each set is allocated a weight. The weight is given to each point based on the decade in which it is located and on the number of points in the decade. For a given population comprising several data sets, there is variation coef-ficient called allB ,3ω which considers all the data sets. According to Gardner and Lockman [24] and Videla, Covarrubias
and Masana [25], a model is considered able to predict creep and shrinkage deformations when the variation coefficient is approxi-mately 20%. Bažant [22] states that the variation coefficient suit-able for predicting creep deformation (basic and drying) is 23%.Creep was not tested in the unreinforced column loaded at 30%; therefore, the creep strain of these prototypes was calculated based on the creep measured in the unreinforced prototype load-ed at 40%, in view of the linearity between strain deformations at
-6Figure 21 – Creep and shrinkage deformation of prototype with 1.4% reinforcement ratio (x10 )
40%A 30%B
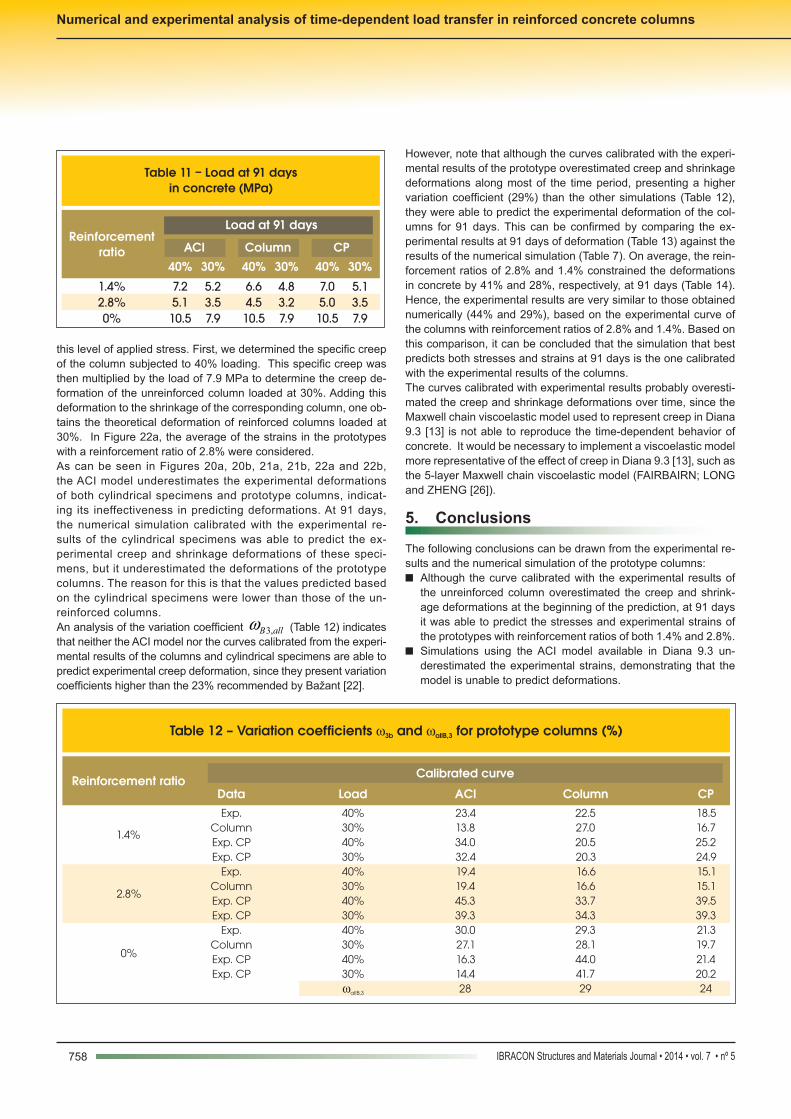
-6Figure 22 – Creep and shrinkage deformation of prototype with 2.8% reinforcement ratio (x10 )
40%A 30%B
758 IBRACON Structures and Materials Journal • 2014 • vol. 7 • nº 5
Numerical and experimental analysis of time-dependent load transfer in reinforced concrete columns
this level of applied stress. First, we determined the specific creep of the column subjected to 40% loading. This specific creep was then multiplied by the load of 7.9 MPa to determine the creep de-formation of the unreinforced column loaded at 30%. Adding this deformation to the shrinkage of the corresponding column, one ob-tains the theoretical deformation of reinforced columns loaded at 30%. In Figure 22a, the average of the strains in the prototypes with a reinforcement ratio of 2.8% were considered.As can be seen in Figures 20a, 20b, 21a, 21b, 22a and 22b, the ACI model underestimates the experimental deformations of both cylindrical specimens and prototype columns, indicat-ing its ineffectiveness in predicting deformations. At 91 days, the numerical simulation calibrated with the experimental re-sults of the cylindrical specimens was able to predict the ex-perimental creep and shrinkage deformations of these speci-mens, but it underestimated the deformations of the prototype columns. The reason for this is that the values predicted based on the cylindrical specimens were lower than those of the un-reinforced columns.An analysis of the variation coefficient allB ,3ω (Table 12) indicates that neither the ACI model nor the curves calibrated from the experi-mental results of the columns and cylindrical specimens are able to predict experimental creep deformation, since they present variation coefficients higher than the 23% recommended by Bažant [22].
Table 11 – Load at 91 daysin concrete (MPa)
Load at 91 daysReinforcement
ratio
1.4%2.8%0%
ACI Column CP40% 40% 40%30% 30% 30%
7.25.110.5
6.64.510.5
7.05.010.5
5.23.57.9
4.83.27.9
5.13.57.9
Table 12 – Variation coefficients w and w for prototype columns (%)3b allB,3
Reinforcement ratioCalibrated curve
Data Load ACI Column CP
1.4%
2.8%
0%
Exp. ColumnExp. CPExp. CP
Exp. ColumnExp. CPExp. CP
Exp. ColumnExp. CPExp. CP
40%30%40%30%40%30%40%30%40%30%40%30%wallB,3
23.413.834.032.419.419.445.339.330.027.116.314.428
22.527.020.520.316.616.633.734.329.328.144.041.729
18.516.725.224.915.115.139.539.321.319.721.420.224
However, note that although the curves calibrated with the experi-mental results of the prototype overestimated creep and shrinkage deformations along most of the time period, presenting a higher variation coefficient (29%) than the other simulations (Table 12), they were able to predict the experimental deformation of the col-umns for 91 days. This can be confirmed by comparing the ex-perimental results at 91 days of deformation (Table 13) against the results of the numerical simulation (Table 7). On average, the rein-forcement ratios of 2.8% and 1.4% constrained the deformations in concrete by 41% and 28%, respectively, at 91 days (Table 14). Hence, the experimental results are very similar to those obtained numerically (44% and 29%), based on the experimental curve of the columns with reinforcement ratios of 2.8% and 1.4%. Based on this comparison, it can be concluded that the simulation that best predicts both stresses and strains at 91 days is the one calibrated with the experimental results of the columns.The curves calibrated with experimental results probably overesti-mated the creep and shrinkage deformations over time, since the Maxwell chain viscoelastic model used to represent creep in Diana 9.3 [13] is not able to reproduce the time-dependent behavior of concrete. It would be necessary to implement a viscoelastic model more representative of the effect of creep in Diana 9.3 [13], such as the 5-layer Maxwell chain viscoelastic model (FAIRBAIRN; LONG and ZHENG [26]).
5. Conclusions
The following conclusions can be drawn from the experimental re-sults and the numerical simulation of the prototype columns:n Although the curve calibrated with the experimental results of
the unreinforced column overestimated the creep and shrink-age deformations at the beginning of the prediction, at 91 days it was able to predict the stresses and experimental strains of the prototypes with reinforcement ratios of both 1.4% and 2.8%.
n Simulations using the ACI model available in Diana 9.3 un-derestimated the experimental strains, demonstrating that the model is unable to predict deformations.
759IBRACON Structures and Materials Journal • 2014 • vol. 7 • nº 5
L. T. KATAOKA | T. N. BITTENCOURT
n Simulations calibrated with the experimental curve of the cy-lindrical specimens were not able to predict the strains in the prototype columns, particularly in the columns subjected to 40% loading. Because the simulations under 30% loads were very similar, calibration using the curve of the cylindrical specimens also led to results close to the experimental ones.
n The program proved to be a promising tool for predicting time-dependent strain, although it was not able to reproduce the time-dependent behavior of concrete. The curves calibrated with experimental results probably overestimated creep and shrinkage deformations, because the Maxwell chain viscoelas-tic model used here did not represent the creep of concrete in the Diana 9.3 program. It would be necessary to implement a more representative and effective viscoelastic model of the ef-fect of creep in Diana 9.3.
6. Acknowledgments
The authors thank the Brazilian research funding agency FAPESP (São Paulo Research Foundation) for funding the project, and Engemix for providing the materials, laboratory infrastructure and trained staff for this research.
7. References
[01] AL-MANASSEER, A., LAM, J. P. Statistical evaluation of shrinkage and creep models. ACI Materials Journal, May-June, 2005; p. 170-176.
[02] ALMEIDA, L. C. Identificação de parâmetros estruturais com emprego de análise inversa, Campinas, 2006. Tese (douto-rado) – Faculdade de Engenharia Civil, Arquitetura e Urban-ismo da Universidade Estadual de Campinas, 192 p.
[03] RÜSCH, H.; JUNGWIRTH, D.; HILSDORF, H. K. Creep and shrinkage – their effect on the behavior of concrete struc-tures. New York: Springer-Verlag, 1983.
[04] NEVILLE, A. M. Propriedades do concreto, São Paulo: Pini, 1997.
[05] MAUCH, S. Effect of creep and shrinkage on the capacity of concrete columns. In: Symposium on Reinforced Concrete Columns 61st annual convention, 1965, San Francisco, Cali-fornia, pp. 299-324.
[06] CASTRO, J.T.P.; VIEIRA, R.D.; SOUSA, R. A.; MEGGIO-LARO, M. A.; FREIRE, J.L.F. Time-dependent Residual Stresses in Reinforced Concrete Columns. In: Proceedings of the XI International Congress on Experimental and Ap-plied Mechanics, Orlando, USA: Bethlen, 2008.
[07] TAKEUTI, A. R. Comportamento resistente imediato e ao longo do tempo de pilares reforçados por meio de encamisa-mento com concreto de alto desempenho, São Carlos, 2003, Tese (doutorado) - Escola de Engenharia de São Carlos da Universidade de São Paulo, 277 p.
[08] HOLM, T. A; PISTRANG, J. Time-dependent load transfer in reinforced lightweight concrete columns. Journal of the American Concrete Institute, v. 63, nº11, November, 1966.
[09] BATHE, K.J. Finite Element Procedures. Prentice Hall, Inc., New Jersey, 2006.
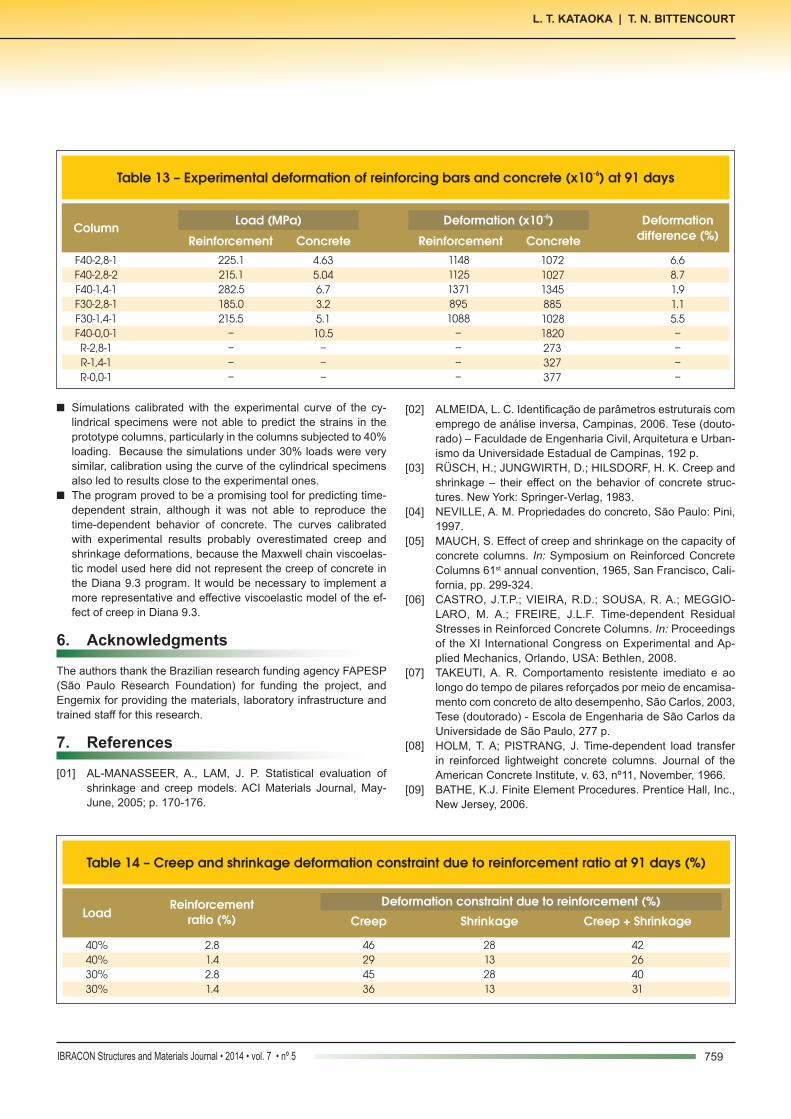
-6Table 13 – Experimental deformation of reinforcing bars and concrete (x10 ) at 91 days
ColumnLoad (MPa) -6Deformation (x10 ) Deformation
difference (%)Reinforcement ReinforcementConcrete ConcreteF40-2,8-1F40-2,8-2F40-1,4-1F30-2,8-1F30-1,4-1F40-0,0-1R-2,8-1R-1,4-1R-0,0-1
225.1215.1282.5185.0215.5––––
1148112513718951088––––
4.635.046.73.25.110.5–––
10721027134588510281820273327377
6.68.71.91.15.5––––
Table 14 – Creep and shrinkage deformation constraint due to reinforcement ratio at 91 days (%)
LoadReinforcement
ratio (%)Deformation constraint due to reinforcement (%)
40%40%30%30%
2.81.42.81.4
Creep Shrinkage Creep + Shrinkage
46294536
28132813
42264031
760 IBRACON Structures and Materials Journal • 2014 • vol. 7 • nº 5
Numerical and experimental analysis of time-dependent load transfer in reinforced concrete columns
[10] NIE J., FAN J.; CAI C. Stiffness and deflection of steel-con-crete composite beams under negative bending. Journal of Structural Engineering ASCE 2004; p.1842-51.
[11] JENDELE L.; CERVENKA J. Finite element of reinforcement with bond. Computer Structural, 2006, 84; p. 1780-91.
[12] AMERICAN CONCRETE INSTITUTE. ACI209-82. Predic-tion of creep, shrinkage, and temperature effects in concrete structures, 1982.
[13] WITTE, F.C. DIANA User’s Manual. Release 8.1, TNO DI-ANA BV, 2ed, Teach, 2004.
[14] ASSOCIAÇÃO BRASILEIRA DE NORMAS TÉCNICAS. Projeto de estruturas de concreto - NBR6118. Rio de Ja-neiro, 2004.
[15] ASSOCIAÇÃO BRASILEIRA DE NORMAS TÉCNICAS. Moldagem e cura de corpos de prova de concreto, cilíndri-cos ou prismáticos – NBR5738. Rio de Janeiro, 2003.
[16] ASSOCIAÇÃO BRASILEIRA DE NORMAS TÉCNICAS. De-terminação da fluência – NBR8224. Rio de Janeiro, 1983.
[17] COMITÉ EURO-INTERNACIONAL DU BÉTON. CEB-FIP Model Code, 1990.
[18] NEDERLANDS NORMALISATIE-INSTITUUT. TGB 1990 Regulations for Concrete - Structural Requirements and Cal-culation Methods. Tech. Rep. NEN 6720, 1995.
[19] JAPAN SOCIETY OF CIVIL ENGINEERS. Japan Concrete Specification - JSCE, 1999.
[20] AMERICAN CONCRETE INSTITUTE. ACI318-05: Building code requirements for structural concrete, 2005.
[21] CARREIRA, J. D.; BURG, R. G. Testing for Concrete Creep and Shrinkage. In: The Adam Neville Symposium: Creep And Shrinkage Of Concrete - Structural Design Effects, Michigan, USA: Farmington Hills, 2000, p.381-420.
[22] BAŽANT, Z. P., Prediction of concrete creep and shrinkage: past, present and future. Nuclear Engineering and Design, 2001, p. 27-38.
[23] BAŽANT, Z.P.; BAWEJA, S. Creep and shrinkage prediction model for analysis and design of concrete structures (Model B3). In: Adam Neville Symposium: Creep And Shrinkage Of Concrete - Structural and Design Effects, ACI Special Pub-lication SP194, Michigan, USA: Farmington Hills, 2000, p.1-73.
[24] GARDNER, N. J.; LOCKMAN, M. J. Design provisions for Drying Shrinkage and creep for normal-strength concrete. ACI Materials Journal, n.98, 2001, p. 159-167.
[25] VIDELA, C. C.; COVARRUBIAS, J. P.; MASANA, C. Updat-ing concrete drying-shrinkage prediction models for local materials. ACI Materials Journal, n. 101, May-June, 2004, p. 187-198.
[26] FAIRBAIRN, E. M. R.; LONGO, H. I.; ZHENG, R. Formu-lação diferencial do problema da relaxação do concreto - estudo teórico experimental. In: Jornadas Sul-Americanas de Engenharia Estrutural, 24, Porto Alegre, v.2, 1987m p. 103-117.