Embed Size (px)
Citation preview

NUMERICAL EVALUATION FOR THE KEY DESIGN PARAMETERS THAT CAN CONTROL THE SEISMIC PERFORMANCE OF HIGHWAY BRIDGE
PIER-SHALLOW FOUNDATION SYSTEMS
Masahiro Shirato1, Tetsuya Kouno2, and Shoichi Nakatani3 Abstract
Although no harmful damage to highway bridge shallow foundations such as settlement or inclination has been observed even in strong earthquakes in Japan, our understanding of the actual behavior of shallow foundations during strong earthquakes is not sufficient to account for what design criteria and kinematic parameters are important to control the seismic performance of shallow foundations. Therefore, in this paper, a parametric calculation is conducted to estimate the permanent displacement of shallow foundations after earthquakes using a new macro element that has been developed by CAESAR, PWRI. We have figured out that the permanent displacement is likely to be a function of the static safety factor and the slenderness of pier-footing system.
Introduction
A two-level seismic design method is employed in the Japanese Specifications for Highway Bridges (Japan Road Association 2002). Level 1 earthquake corresponds to high-probability ground motions of small to medium magnitudes, which has been traditionally considered in the Japanese Specifications for Highway Bridges. Its peak Acceleration Response Spectrum (ARS) amplitudes are approximately 0.2 G to 0.3 G. Level 2 earthquake corresponds to rare ground motions of large magnitudes such as the 1995 Hyogo-ken Nanbu earthquake (Kobe earthquake) and the 1923 Kanto earthquake. Nevertheless, the stability check of shallow foundations is conducted only for the normal and Level 1 earthquake design situations, while deep foundations are checked by the Ductility Design method even for the Level 2 earthquake design situation in addition to the stability check for the normal and Level 1 earthquake design situations. This is because recent case histories have shown that shallow foundations that satisfy the conventional design prescriptions should have a sufficient safety margin even against strong earthquakes such as the 1995 Hyogo-ken Nanbu (Kobe) earthquake.
However, our understanding of the actual behavior of shallow foundations during
strong earthquakes is not sufficient. Experimental evidence has shown that, even though the factor of safety in terms of bearing capacity reaches unity several times during seismic excitations, failure does not necessarily occur (Shirato et al. 2008a). Rather, experimental
1 Senior Researcher, Bridges and Structures Research Group, Center for Advanced Engineering Structural Assessment and Research, Public Works Research Institute 2 Researcher, ditto. 3 Chief Researcher for Management System and Substructures, ditto.

results indicate that the accumulation of permanent displacements during earthquakes should be a primary concern for seismic design, because it will be associated to the recovery of the bridge service after the earthquake.
Accordingly, we will attempt to figure out how much individual current design
criteria contribute to controlling the seismic performance of shallow foundations, i.e. controlling the accumulation of permanent footing displacements during strong earthquakes. We conduct parametric dynamic computations on the behavior of superstructure-pier-shallow foundation systems subjected to strong earthquakes. We scrutinize the change in the permanent displacement of footing after earthquakes with decreasing the footing size while other structural components are not changed.
Key design parameters
The major norms stipulated in the Japanese Specifications for Highway Bridges (Japan Road Association 2002) for the normal and Level 1 earthquake design situations are summarized below. Check 1. Verify that the underlying soil property is sturdy Check 2. Verify, for the normal design situation, that the vertical soil resistance stress, q,
acting on the footing base is limited, so to avoid the excessive permanent settlement and the occurrence of uneven settlement (or tilting) of footing under persistent vertical loads. This means that:
q ≤ qa
where the allowable maximum values, qa, are given for classified soil categories and based on the database of the yield soil resistance stresses obtained in previous plate loading tests. Settlement limitations for the serviceability limit state in some design codes can be an alternative to this check.
Check 3. Verify the safety margin against the ultimate vertical bearing capacity for both
normal and Level 1 earthquake design situations. Check 4. Verify the safety margin against the ultimate sliding resistance for both design
situations.
Check 5. Verify the eccentricity limit of the resultant vertical force, e = M / V, i.e.,
e < B / 6 for the normal design situation, meaning no partial uplift occurs, e < B / 2 for the Level 1 earthquake design situation, meaning that no more
than one half of the footing width should be separated from the

underlying soil
where e is the eccentricity of the resultant vertical force, V, calculated from the base center of the footing, M is the overturning moment, and B is the footing width in the rotation plane.
Then, we will generalize these criteria into the following parameters:
Parameter 1 Regarding the normal design situation, we consider a static safety margin, Vdead / Vm, as a representative of any settlement criteria, where Vdead is the vertical dead load and Vm is the bearing capacity for the concentric vertical loading.
Parameter 2 V / VU for the Level 1 earthquake design situation, where V is the resultant
vertical load and VU is the ultimate vertical bearing capacity that considers the effect of the eccentricity and inclination.
Parameter 3 H / HU for the Level 1 earthquake design situation, where H is the resultant
horizontal load, HU = μV is the ultimate horizontal resistance for the cohesionless underlying soil, and μ is the friction coefficient.
Parameter 4 A slenderness ratio of hG / B, which is an alternative but more representative
parameter to account for load eccentricity, e, where hG is the height of the gravity center of the superstructure-pier-footing system and B is the footing width. For example, the values e and e / (B / 2) equals kh × hG and 2kh × (hG / B), respectively, where kh is the horizontal seismic coefficient.
Elasto-plastic-uplift macro element
To estimate the state of a shallow foundation after a strong earthquake, not only the ultimate bearing capacity but also plastic flow of the underlying soil have to be considered. Also, the overturning moment arising from the inertial force of the superstructure can induce a partial separation (uplift) of the footing from the underlying soil. Accordingly, to overcome these modeling difficulties in practice, CAESAR (Center for Advanced Engineering Structural Assessment and Research), PWRI (Public Works Research Institute), Tsukuba, Japan, has developed a macro element that models the elasto-plastic-uplift behavior of a shallow foundation. The macro element can also account for the coupling behavior of the settlement, translation, and rotation of the shallow foundation.
As shown in Figure 1, the macro element models the footing-underlying soil
interaction as a unique element in structural modeling. The macro element describes the coupled relationship between an incremental load set F& = (V& , H& , M& )T transmitted from the supported structure to the base center of the footing and the corresponding incremental

displacement set x& = ( s& ,u& , θ& )T at the base center of the footing.
}]{[}{ FDx && = (1)
where [D] is the 3 × 3 compliance matrix, i.e. the inverse matrix of the element stiffness matrix, and the superscript T stands for transposition. The loads and displacements shown in Figure 1 are in the positive directions. One of the advantages of the use of macro element is that the dimension of the stiffness matrix is very small, 3 × 3, so that macro elements will not become a large burden in the overall structural model.
The details of the present macro element can be seen in Shirato et al. (2008b) and
its FORTRAN subroutine source code is included in a PWRI report (Nakatani et al. 2008). Although more sophisticated constitutive models of macro element also have been examined by, for example, di Prisco et al. (2003), and Cremer et al. (2002), we can take advantage of the fact that the present macro element can approximate the permanent displacements in a large-scale shake table and cyclic loading experiments with the same order of the experimental results (Shirato et al. 2008b, Nakatani et al. 2008).
The macro element theory was originally established by Nova and Montrasio (1991) to describe the evolution of the plastic flow of irreversible displacement for monotonic loading within the context of work-hardening plasticity. However, this is not sufficient to express the dynamic soil-structure interaction, because the partial uplift of the footing also will make the nonlinear but reversible behavior. Accordingly, the nonlinear reversible displacement component is superimposed on the plastic component in a typical way of the elasto-plastic theory. Therefore, the total displacement increment, }{x& , is decomposed into the reversible displacement part, }{ elupx& , and the irreversible part, }{ plx& .
}{}{}{ plup-el xxx &&& += , }]{[}{ up-elup-el FDx && = , }]{[}{ plpl FDx && = (2) where ][ up-elD is the elastic compliance considering the influence of the partial uplift and
][ plD is the plastic compliance. This study employs the Nova-Montrasio model for the irreversible displacement
part and a non-associated flow rule and an isotropic hardening are considered. The yield locus, f, and the plastic potential locus, g, are defined in the V-H-M / B space as follows:
f = h2 + m2 − ξ2(1 − ξ / ρc)2ζ = 0, g = λ2h2 + χ2m2 − ξ2(1 − ξ / ρg)2ζ = 0 (3) where h = H /(μVm), m = M / (ψBVm), ξ = V / Vm, Vm is the bearing capacity in terms of centered vertical loading. ρc is the parameter that specifies the instantaneous size of the yield locus. μ, ψ, ζ, λ and χ are the parameters that specify the shapes of the yield and

plastic potential locus in the V-H-M / B space. The hardening function is given as follows:
( )mcmc VxRV /exp1/ 0−−=ρ (4) where R0 is the initial gradient of the V-vpl curve for the concentric vertical loading. xc is the geometric mean of plastic components of s, u, and θ, and it is defined by the following equation:
{ } 5.02pl2pl2pl )()()( θγ+α+= Busx MMc (5) where αM and γM are the non-dimensional parameters. When ρc evolves and finally reaches 1, the yield surface coincides with the bearing capacity surface, fcr.
fcr = h2 + m2 − ξ2(1 − ξ)2ζ = 0 (6)
The elastic compliance, [Del-up], is comprised of the diagonal part of the inverses of typical elastic vertical, translational and rocking springs, KV, KH, and Kθ, respectively, and the non-diagonal part that accounts for the uplift-induced nonlinear moment-rotation and moment-vertical displacement (uplift) relationships, up
13D and up33D :
⎪⎭
⎪⎬
⎫
⎪⎩
⎪⎨
⎧
⎥⎥⎥
⎦
⎤
⎢⎢⎢
⎣
⎡
+=
⎪⎭
⎪⎬
⎫
⎪⎩
⎪⎨
⎧
θ MHV
DKK
DKus
R
H
V
&
&
&
&
&
&
up33
up13
up-el
up-el
up-el
/1000/10
0/1 (7)
The typical moment-rotation and moment-vertical displacement relationships are shown in Figure 2. In Figure 2, because of the dead loads, the initial elastic settlement exists and the uplift-induced rotation and vertical displacement will not be induced until the moment reaches a threshold value, ±Mα. The backbone curves of M-θ and M-s relationships are proportional to those calculated with a Beam-on-Winkler Foundation model, considering a prescribed dead load and the partial uplift of the footing from the underlying soil. Note that the Winkler spring constant for compression is given to make the initial resultant rotation rigidity of footing identical to the spring constant KR in Eq. (7). Then the moment values are reduced to make the ultimate moment, VB / 2, consistent with the moment bearing capacity obtained from Eq. (6). See the details in Shirato et al. (2008b) and Nakatani et al. (2008). The hysteresis rules are a peak and origin oriented rule with a function of both positive and negative maximum moments, based on our experimental observation (Shirato et al. 2008a).
Finally, the element incremental stiffness equation is derived as follows:

( ) }{][][}{ 1plupel xDDF && −− += (8) The modeling of a pier-footing-soil system
As shown in Figure 1, the mass and rotation inertia of the superstructure are modeled with a lumped mass. The pier is assumed to respond linearly and is modeled with Bernoulli-Euler beam elements. The P-Delta effect is considered with a geometric stiffness matrix of the beam-column theory, in which we approximate that the axial force in the geometric matrix will not change from the initial state during a numerical simulation. An element lumped mass matrix is also assigned to each pier beam element. The footing is also modeled with a lumped mass, taking the mass and rotation inertia into account.
The soil-footing interaction is modeled with the macro element. Elastic spring
constants are calculated using a phase velocity of the underlying soil. As for the plastic component, the important parameters are the bearing capacity when the shallow foundation is subjected to concentric vertical loading, Vm, and the hardening parameter, R0, in Eq. (4). The hardening parameter, R0, is assumed as a function of Vm / B:
R0 = 100 × Vm / B (9)
where the units of R0, Vm and B are kN/m, kN, and m, respectively. Eq. (9) is estimated based on two concentric loading experiments of a strip footing model on medium dense sand and dense sand. In all calculations below in this paper, footings are assumed to be placed on cohesionless soil. However, future research will be devoted to calibrate the hardening parameter, R0, for a wider set of soil conditions, such as cohesive soil, cohesionless soil, soft rock, hard rock etc. Based on the authors' experience fitting an exponential function with load-settlement curves of many plate loading tests, the hardening parameter, R0, should also be a function of soil classification. Other parameter values are selected following the typical values that have been suggested by Nova and Montrasio (1991), in which the values used in this study are the same as used in Shirato et al. (2008b).
When the footing is embedded, the mass of the overburden soil is included into the mass of the footing so that the overburden soil resistance to the rotation of footing can be considered. In addition, the fact that we incorporate the overburden soil weight into the estimation of the size of the bearing capacity surface, Vm, increases the sliding resistance of footing. However, the vertical and horizontal side resistances of the footing are disregarded. These assumptions are based on an experimental result of a pier-shallow foundation model in which the footing was embedded and the top of the pier was subjected to cyclic horizontal loading (Fukui et al. 2007).
The Newmark-β scheme is used for the integration with regard to time. The
damping matrix is set to be proportional to the elastic stiffness. 5% of the dashpot

coefficient is taken into account for the beam elements. For the macro element, a 10% ratio damping is considered for the elastic springs, KV, KH, and KR, which is usually considered in design practice (Japan Road Association, 2002). Once a large partial uplift of footing occurs, the rocking motion is likely to be prominent and the rocking rigidity and damping are likely to drastically change with changing the effective footing area. Accordingly, in each calculation case, a trial calculation is rehearsed prior to the final calculation, and the equivalent secant rocking spring, K'R, that corresponds to the largest rotation angle is obtained. Then, in the final calculation, the damping constant CR in the damping matrix is replaced with, C'R:
RRRR CKKC ×′=′ (10)
taking advantage of a theory for simple single degree-of-freedom systems for the sake of simplicity. The idea for using this simplification is that we can approximate the damping considering the uplift effect without a cumbersome convergence process in terms of K'R and the corresponding rocking-related predominant vibration period. Proto-type substructures with shallow foundations and their variations for the parametric calculation
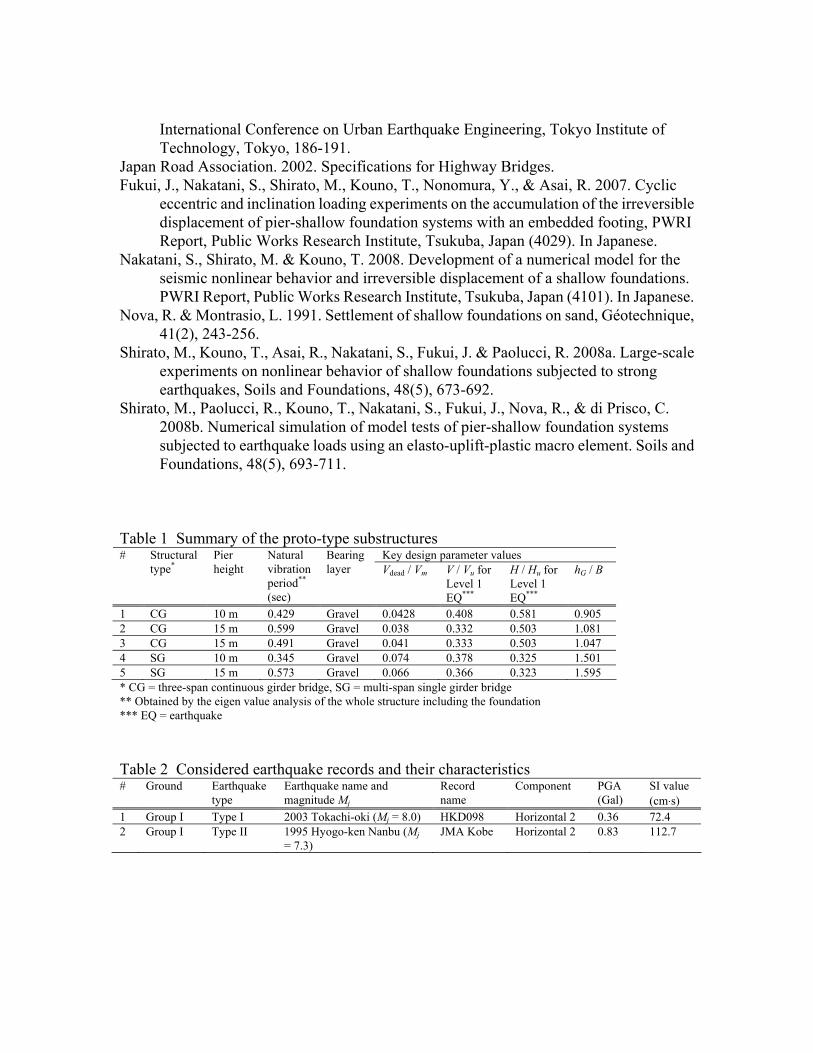
As summarized in Table 1, five simple proto-type substructures are selected from existing design results in Japan. Three-span continuous girder bridges with a fixed and three expansion bearings and two-span simple support bridges with a pier and abutments are chosen. For each bridge, one of the piers is chosen to calculate. As for the three-span continuous girder bridges, the piers with a fixed bearing are chosen to calculate. All piers examined in this study are single bents with heights of either 15 m or 10 m. All shallow foundations are on stiff and cohesionless ground that corresponds to Group I seismic ground condition, in which Group I indicates stiff sites with Tg < 0.2 s, where Tg is the natural period of the ground. In the calculation below, only the excitation of the longitudinal direction is considered and the material parameters are given as used in each original design report.
In addition to these proto-type substructures, we will also set the substructures that
are varied from the proto-type substructures. The length and width of footing are reduced step by step while other parts are not changed at all, so that the reduced-size footings do not meet the design criteria. In total, 20 substructures are examined. Input earthquake motions
In this study, only the horizontal component is applied to the macro element and a Type I earthquake and a Type II earthquake are chosen as summarized in Table 2. Their acceleration time histories and ARS curves are shown in Figure 3, in which the ARS curves are compared to the design ARS curves stipulated in the Japanese Specifications for

Highway Bridges. The Japanese Specifications for Highway Bridges defines Type I and II earthquakes as follows. Type I earthquake is a representative of interplate-type earthquakes, relatively having a much longer duration with larger numbers of cycles but smaller acceleration amplitudes. Type II earthquake is a representative of inland-strike-type earthquakes, relatively having a shorter duration but much larger acceleration amplitudes.
It is worth noting that the natural frequencies of all examined substructures are in
the range of 0.35 sec to 0.6 sec, taking the foundation stiffness into account. For this range, the ARS curves of both earthquake waves keep their peak levels as shown in Figure 3. Numerical results
Figure 4 shows a typical response of the proto-type structures. In Figure 4, the response of the proto-type structure #1 during the Type I earthquake is shown, in which ag is the time histories of the horizontal acceleration of the ground (or base acceleration), atop and utop are the horizontal acceleration and displacement at the top, respectively, u, θ, and s are the horizontal displacement, rotation, and vertical displacement of the base center of the footing, respectively, and settlement is positive and downward. As seen in the observed vertical displacement time history of the footing, the vertical settlement also vibrates up and down with the permanent settlement accumulating. The permanent settlement is of the order of 0.22% of the footing width, B. The acceleration at the top, atop, is not magnified so much compared to the base acceleration, ag, because of the nonlinearity in the moment-rotation relationship stemming from the partial uplift of the footing. The horizontal displacement at the superstructure is approximated by θL, where L is the height of the gravity center of the superstructure from the footing base. In fact, the footing rotation is the predominant displacement mode in all calculation results in this paper. Hereafter, as shown in Figure 4, the absolute displacements at the end of the calculation are picked up as the residual displacements.
Figure 5 shows the relationship between the permanent rotation angles of footing,
θr, and the values of the generalized design parameters: the static safety margin, Vdead / Vm, the slenderness parameter, hG / B, the bearing capacity safety margin for the Level I earthquake design situation, V / VU, and the sliding safety margin for the Level 1 earthquake design situation, H / HU. The results are classified depending on the earthquake type (Type I or II). In some cases, VU becomes zero even for the Level 1 earthquake design situation because the eccentricity of the vertical load is too large to remain within the reduced footing width. Figure 5 shows that the permanent rotation angle is likely to be a function of Vdead / Vm and hG / B as indicated with lines in the figure, not V / VU or H / HU of the Level I earthquake design situation. Figure 6 shows the relationships between the permanent horizontal displacement, ur, and the generalized design parameters, in which ur is normalized with the footing width, B. Probably because the values of ur / B are so small, it is difficult to see a clear relationship between ur / B and the generalized design parameter
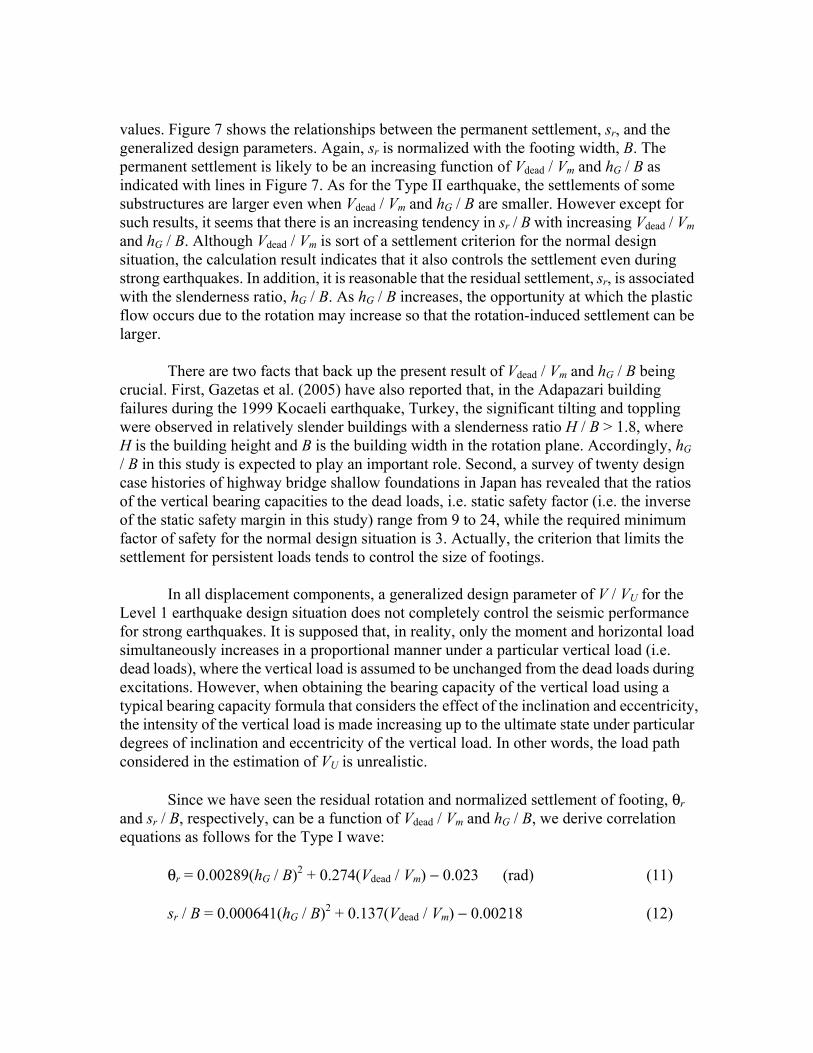
values. Figure 7 shows the relationships between the permanent settlement, sr, and the generalized design parameters. Again, sr is normalized with the footing width, B. The permanent settlement is likely to be an increasing function of Vdead / Vm and hG / B as indicated with lines in Figure 7. As for the Type II earthquake, the settlements of some substructures are larger even when Vdead / Vm and hG / B are smaller. However except for such results, it seems that there is an increasing tendency in sr / B with increasing Vdead / Vm and hG / B. Although Vdead / Vm is sort of a settlement criterion for the normal design situation, the calculation result indicates that it also controls the settlement even during strong earthquakes. In addition, it is reasonable that the residual settlement, sr, is associated with the slenderness ratio, hG / B. As hG / B increases, the opportunity at which the plastic flow occurs due to the rotation may increase so that the rotation-induced settlement can be larger.
There are two facts that back up the present result of Vdead / Vm and hG / B being
crucial. First, Gazetas et al. (2005) have also reported that, in the Adapazari building failures during the 1999 Kocaeli earthquake, Turkey, the significant tilting and toppling were observed in relatively slender buildings with a slenderness ratio H / B > 1.8, where H is the building height and B is the building width in the rotation plane. Accordingly, hG / B in this study is expected to play an important role. Second, a survey of twenty design case histories of highway bridge shallow foundations in Japan has revealed that the ratios of the vertical bearing capacities to the dead loads, i.e. static safety factor (i.e. the inverse of the static safety margin in this study) range from 9 to 24, while the required minimum factor of safety for the normal design situation is 3. Actually, the criterion that limits the settlement for persistent loads tends to control the size of footings.
In all displacement components, a generalized design parameter of V / VU for the
Level 1 earthquake design situation does not completely control the seismic performance for strong earthquakes. It is supposed that, in reality, only the moment and horizontal load simultaneously increases in a proportional manner under a particular vertical load (i.e. dead loads), where the vertical load is assumed to be unchanged from the dead loads during excitations. However, when obtaining the bearing capacity of the vertical load using a typical bearing capacity formula that considers the effect of the inclination and eccentricity, the intensity of the vertical load is made increasing up to the ultimate state under particular degrees of inclination and eccentricity of the vertical load. In other words, the load path considered in the estimation of VU is unrealistic.
Since we have seen the residual rotation and normalized settlement of footing, θr and sr / B, respectively, can be a function of Vdead / Vm and hG / B, we derive correlation equations as follows for the Type I wave:
θr = 0.00289(hG / B)2 + 0.274(Vdead / Vm) − 0.023 (rad) (11) sr / B = 0.000641(hG / B)2 + 0.137(Vdead / Vm) − 0.00218 (12)

Figure 8 compares the permanent rotation and settlement obtained by the dynamic analysis using the macro element and calculated by the correlation equations of (11) and (12). The point is that the comparison indicates that there is a high possibility that further study will formulate some simple correlation equations to predict the permanent displacement as a function of static safety margin, slenderness parameter, earthquake types, natural frequency etc for wider conditions of earthquake types and structural characteristics. Concluding remarks
Numbers of parametric calculations are conducted to estimate the permanent displacement of shallow foundations using a new macro element that has been developed by CAESAR, PWRI. The main results are summarized in the following points.
1) This study has proposed that the current design criteria for the normal design situation
and Level 1 earthquake design situation also control the seismic performance of shallow foundations even for strong earthquakes. Especially, the static safety factor, i.e. the settlement control criteria for the normal design situation, and a kinematic parameter, hG / B, i.e. the safety margin against overturning for the Level 1 earthquake design situation, are attributed to preventing shallow foundations from toppling even for strong earthquakes.
2) The calculation result indicates that the value of V / VU may not be a relevant design parameter. The possible theory is that the load path when estimating VU that considers the effects of inclination and eccentricity is unlikely to occur in reality during earthquakes.
3) The calculation results in this paper strongly indicate that design equations to estimate the permanent displacements of a shallow foundation after a design strong earthquake can be formulated as functions of Vdead / Vm and hG / B.
References
Cremer, C. & Pecker, A. 2002. Cyclic macro-element for soil-structure interaction:
material and geometrical non-linearities. International Journal for Numerical and Analytical methods in Geomechanics, 25, 1257-1284.
di Prisco, C., Nova, R., & Sibilia, A. 2003. Shallow footing under cyclic loading: experimental behaviour and constitutive modelling, Geotechnical Analysis of Seismic Vulnerability of Monuments and Historical Sites (Eds. Maugeri & Nova), Pàtron Editole: Bologna, 99-121.
Gazetas G. 1991. Foundation Engineering Handbook (second edition, ed. Fang, H.Y.), Chapter 15. NY: Van Nostrand Reinhold.
Gazetas G., Anastasopoulos, I., & Gerolymos, N. 2005. Overturning of buildings in Adapazari, during the 1999 Kocaeli Earthquake, Proceedings of the Second
International Conference on Urban Earthquake Engineering, Tokyo Institute of Technology, Tokyo, 186-191.
Japan Road Association. 2002. Specifications for Highway Bridges. Fukui, J., Nakatani, S., Shirato, M., Kouno, T., Nonomura, Y., & Asai, R. 2007. Cyclic
eccentric and inclination loading experiments on the accumulation of the irreversible displacement of pier-shallow foundation systems with an embedded footing, PWRI Report, Public Works Research Institute, Tsukuba, Japan (4029). In Japanese.
Nakatani, S., Shirato, M. & Kouno, T. 2008. Development of a numerical model for the seismic nonlinear behavior and irreversible displacement of a shallow foundations. PWRI Report, Public Works Research Institute, Tsukuba, Japan (4101). In Japanese.
Nova, R. & Montrasio, L. 1991. Settlement of shallow foundations on sand, Géotechnique, 41(2), 243-256.
Shirato, M., Kouno, T., Asai, R., Nakatani, S., Fukui, J. & Paolucci, R. 2008a. Large-scale experiments on nonlinear behavior of shallow foundations subjected to strong earthquakes, Soils and Foundations, 48(5), 673-692.
Shirato, M., Paolucci, R., Kouno, T., Nakatani, S., Fukui, J., Nova, R., & di Prisco, C. 2008b. Numerical simulation of model tests of pier-shallow foundation systems subjected to earthquake loads using an elasto-uplift-plastic macro element. Soils and Foundations, 48(5), 693-711.
Table 1 Summary of the proto-type substructures
Key design parameter values # Structural type*
Pier height
Natural vibration period** (sec)
Bearing layer Vdead / Vm V / Vu for
Level 1 EQ***
H / Hu for Level 1 EQ***
hG / B
1 CG 10 m 0.429 Gravel 0.0428 0.408 0.581 0.905 2 CG 15 m 0.599 Gravel 0.038 0.332 0.503 1.081 3 CG 15 m 0.491 Gravel 0.041 0.333 0.503 1.047 4 SG 10 m 0.345 Gravel 0.074 0.378 0.325 1.501 5 SG 15 m 0.573 Gravel 0.066 0.366 0.323 1.595 * CG = three-span continuous girder bridge, SG = multi-span single girder bridge ** Obtained by the eigen value analysis of the whole structure including the foundation *** EQ = earthquake Table 2 Considered earthquake records and their characteristics # Ground Earthquake
type Earthquake name and magnitude Mj
Record name
Component PGA (Gal)
SI value (cm⋅s)
1 Group I Type I 2003 Tokachi-oki (Mj = 8.0) HKD098 Horizontal 2 0.36 72.4 2 Group I Type II 1995 Hyogo-ken Nanbu (Mj
= 7.3) JMA Kobe Horizontal 2 0.83 112.7

Figure 1 Schematic diagrams of the numerical model and the sign convention of macro-element
M
θ el-up
Mα
−Mα
sel-up−KVV
MMα−Mα
Figure 2 Typical moment-rotation and moment-settlement behavior due to the partial uplift of footing
0.1 0.2 1 20.10.2
12
Period (sec)
AR
S (G
) h=0.05
Specification
0.1 0.2 1 2
0.10.2
12
Period (sec)
AR
S (G
) h=0.05
Specification
0 10 20 30 40 50 60 70 80 90 100–4
0
4
Acce
lera
tion
time (sec)
(m/s
2 )
0 5 10 15 20 25 30 35
–8
0
8
Acce
lera
tion
time (sec)
(m/s
2 )
Type I earthquake (2003 Tokachi-oki, HKD098) Type II earthquake (1995 Hyogo-ken Nanbu,
JMA-Kobe)
Figure 3 Time histories and ARS curves of the considered earthquake records

0 20 40 60 80 100–4
0
4a g
(m/s
2 )
time (sec) 0 20 40 60 80 100
0.02
0
–0.02
time (sec)
s (m
)
sr
(a) Horizontal acceleration at the ground surface, ag (d) Settlement of the footing, s
0 20 40 60 80 100–4
0
4
a top
(m/s
2 )
time (sec) 0 20 40 60 80 100
–0.01
0
u (m
)
time (sec)
ur
(b) Horizontal acceleration of the superstructure, atop (e) Horizontal displacement of the footing, u
0 20 40 60 80 100
–0.1–0.05
00.05
u top
& θ
L (m
)
time (sec)
θ L
utop
0 20 40 60 80 100
–0.008
0θ
(rad
)
time (sec)
θr
(c) Total horizontal displacements of the superstructure, (f) Rotation of the footing, θ
utop & its footing rotation component, θL
Figure 4 Time histories of base acceleration, ag, horizontal acceleration of the superstructure, atop, total and footing-rotation-induced horizontal displacements of the superstructure, utop and θL, respectively, and settlement, sliding, and rotation of the footing, s, u, and θ, respectively: Proto-type structure #1.
0 0.05 0.1 0.150
0.02
0.04
0
0.01Type II
Type I
Vdead / Vm
θ r (r
ad)
0 1 2 3 40
0.02
0.04
0
0.01Type II
Type I
hG / B
θ r (r
ad)
0 0.2 0.4 0.6
0
0.02
0.04
0
0.01Type II
Type I
H / HU
θ r (r
ad)
0 1 2 3 4 5 6 70
0.02
0.04
0
0.01
0.02Type II
Type I
V / VU
θ r (r
ad)
V / VU = ∞
∞
Figure 5 Relationship between the permanent rotation angles of footing, θr, and the generalized design parameters (Filled circle = Type I earthquake, Open circle = Type II earthquake)

0 0.05 0.1 0.150
0.002
0.0040
0.001
0.002Type II
Type I
Vdead / Vm
u r /
B
0 1 2 3 40
0.002
0.0040
0.001
0.002Type II
Type I
hG / Bu r
/ B
0 0.2 0.4 0.60
0.002
0.0040
0.001
0.002Type II
Type I
H / HU
u r /
B
0 1 2 3 4 5 6 70
0.002
0.0040
0.001
0.002Type II
Type I
V / VU
u r /
B
V / VU = ∞
∞
Figure 6 Relationship between the permanent horizontal displacement of footing, ur, and the generalized design parameters (Filled circle = Type I earthquake, Open circle = Type II earthquake)
0 0.05 0.1 0.150
0.010.020.03
0
0.01
0.02Type II
Type I
Vdead / Vm
s r /
B
0 1 2 3 40
0.010.020.03
0
0.01
0.02Type II
Type I
hG / B
s r /
B
0 0.2 0.4 0.60
0.010.020.03
0
0.01
0.02Type II
Type I
H / HU
s r /
B
0 1 2 3 4 5 6 70
0.010.020.03
0
0.01
0.02Type II
Type I
V / VUs r
/ B
V / VU = ∞
∞
Figure 7 Relationship between the permanent settlement of footing, sr, and the generalized design parameters (Filled circle = Type I earthquake, Open circle = Type II earthquake).
0 0.05
0
0.05
Cor
rela
tion
eq. (
rad)
Macro elment (rad)
R = 0.80
0 0.01 0.02 0.03
0
0.01
0.02
0.03
Cor
rela
tion
eq.
Macro element
R = 0.89
(a) Permanent rotation, θr (rad) (b) Normalized Permanent settlement, sr / B
Figure 8 Comparison of the permanent rotation angle and settlement obtained by the dynamic calculation using the macro element and the correlation equations (R = correlation factor)