Embed Size (px)
Citation preview

7th
European LS-DYNA Conference
© 2009 Copyright by DYNAmore GmbH
Numerical Investigations to Determine Sources for the Scatter of the
BioRID Dummy
S. Stahlschmidt*, A. Hirth**
*DYNAmore GmbH, Stuttgart, Germany
**Daimler AG, Sindelfingen, Germany
Abstract: The BioRID v2.5 model is in a very fine validation state until now. In some new tests for further validation of the model, one can observe a very strong scatter in some major signals of the tests. Some of these signals are used to calculate injury criteria which are used to determine the quality of a seat in rear crash scenarios in consumer tests. This paper describes the new validation test setup and gives an overview about the latest validation state of the BioRID model. Furthermore, the problem of scatter in the tests is shown and possibilities where this scatter may come from have been studied. The main focus is on the parameters of the BioRID model which have an influence on the neck load cell signals. Keywords: BioRID, Dummy, Whiplash, Robustness, Oscillation
7th
European LS-DYNA Conference
© 2009 Copyright by DYNAmore GmbH
1 Introduction
Until the release v2.0 of the BioRID the whole model has been validated by using a simplified seat of the University of Chalmers [1]. But the possibilities of validation with this seat are limited because of very high oscillations and peak values in some signals of the BioRID. Because of the limitations for validation work, the FAT group decided to use additional tests for further validation of the whole model. The tests are performed in a sports car seat and not in a normal vehicle seat. The idea is to minimize the influence of a very complex vehicle seat and to use a very simple sports car seat which consists only of a few components which are easy to model, thus needing less validation work. In use of these new tests the BioRID v2.5 was built and also validated in the sports car seat. Moreover a large scatter was observed in the new tests of the two different BioRID dummies in the upper and lower neck signal. Because the signals are used for major injury criteria, the working group decided to determine the reasons for this scatter. Therefore the simulation model should be used to try out the influence of different parameters in the BioRID model. The paper describes the new test setup which is used to validate the BioRID v2.5 model and shows the performance of the model. Additionally, the problem of the scatter in the tests is described as well as the different parameters which are used to determine the reasons of this scatter.
2 Test setup for hardware tests
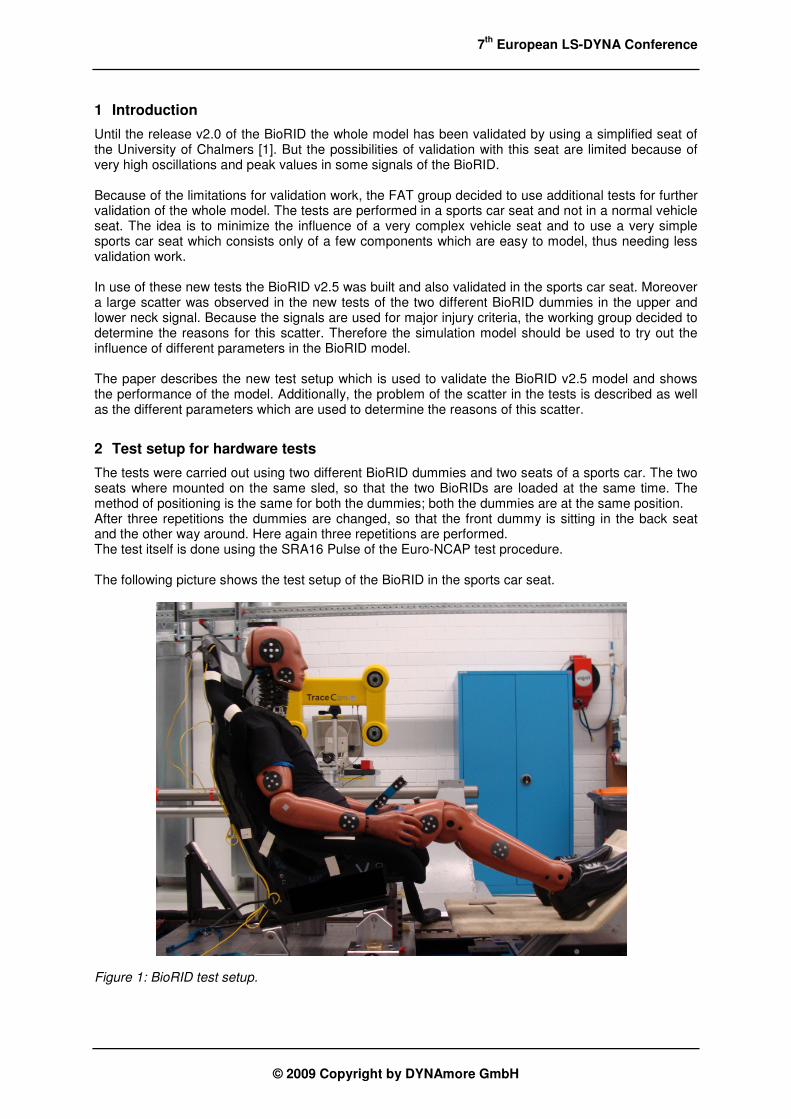
The tests were carried out using two different BioRID dummies and two seats of a sports car. The two seats where mounted on the same sled, so that the two BioRIDs are loaded at the same time. The method of positioning is the same for both the dummies; both the dummies are at the same position. After three repetitions the dummies are changed, so that the front dummy is sitting in the back seat and the other way around. Here again three repetitions are performed. The test itself is done using the SRA16 Pulse of the Euro-NCAP test procedure. The following picture shows the test setup of the BioRID in the sports car seat. Figure 1: BioRID test setup.

7th
European LS-DYNA Conference
© 2009 Copyright by DYNAmore GmbH
3 Positioning of the Dummy in the seat
SAE-HRMD Manikin model: In the first step, the SAE-HRMD Manikin is used to check the static conditions of the seat model. The model of the SAE Manikin falls under gravity load into the seat. The simulation is stopped when the equilibrium is reached and the SAE-Manikin is no longer moving. The following figure shows a cut through the end position of the manikin in the seat model. Figure 2: SAE-HRMD Manikin in the sports car seat.
The end position of the Manikin in the seat position is very close to the physical position of the manikin. The H-Point and the torso angle are very close to the test. Thus the static conditions of the seat model are good enough to do a whiplash simulation. BioRID model: After the static conditions are checked, the positioning simulation of the BioRID is also done under gravity load. The BioRID model, which is fully deformable, falls into the seat. The pelvis angle is rotated in the first 300ms to the required value and at the mid- simulation time the boundary conditions on the pelvis are released, so that the model can reach an equilibrium in the seat. The pelvis angle fits the angles measured in the test quite well. Figure 3 and Figure 4 show the position of the BioRID model in the seat. Figure 3: Position of BioRID model v2.5.

7th
European LS-DYNA Conference
© 2009 Copyright by DYNAmore GmbH
Figure 4: Head and neck position; cut through the sagittal plane. After the positioning simulation, the OC plate is corrected to an angle of zero degree. The markers in Figure 3 and Figure 4 show measured points from the test. Here we also can see that the back set fits the test quite well.
4 Results of the simulation model and correlation to the tests
A pulse of the test data is used as the load on the sled. An acceleration signal of the sled is used as the load pulse. Two accelerometers are present at the back rest to determine the motion of the back rest. The following figures show the performance of the model in the seat. The blue and grey lines are the test results of the first dummy (H1) and the second dummy (H2) respectively. All test results are shown for both dummies in each seat. The simulation results are represented by the red lines. Figure 5: Sled acceleration [g] and Velocity [km/h] vs. Time [ms]
test BioRID H1 test BioRID H2 simulation

7th
European LS-DYNA Conference
© 2009 Copyright by DYNAmore GmbH
Figure 6: Local x-accelerations [g] vs. Time [ms]; Upper left head; Lower left T1; Upper right T8 and Lower right pelvis accelerometer. Figure 7: Local z-accelerations [g] vs. Time [ms]; Upper left head; Lower left T1; Upper right T8 and Lower right pelvis accelerometer.
test BioRID H1 test BioRID H2 simulation
test BioRID H1 test BioRID H2 simulation

7th
European LS-DYNA Conference
© 2009 Copyright by DYNAmore GmbH
Figure 8: Neck load cell output vs. Time [ms]; Upper line: Upper neck x-force [kN], z-force [kN] and y-moment [Nm]; Lower line: Lower neck x-force [kN], z-force [kN] and y-moment [Nm. Figure 9: Rotations [degree] vs. Time [ms]; Left head; Middle T1; Right pelvis. The simulation model fits the tests quite well. Only in some signals the peak values are not exactly captured. For example, the peak value of the lower neck z-force is over predicted and the simulation gives a higher value than all test data. But exactly this signal also has a very high scatter in the tests between the two dummies. For the complete performance of the BioRID v2.5 model please use [3].
test BioRID H1 test BioRID H2 simulation
test BioRID H1 test BioRID H2 simulation

7th
European LS-DYNA Conference
© 2009 Copyright by DYNAmore GmbH
5 Description of the scatter in the test results
As we have seen in the chapter above, the performance of the simulation model is very good. Only some signals do not fit the test very well. These are the signals that show a very strong scatter in the test as shown in the Figure 10 below. The Figure shows only the test results of the upper and lower neck load cell. The blue lines are the results of dummy 1 (H1) and the red lines are the results of dummy 2 (H2). Figure 10: Results of upper and lower neck load cell of all tests. It is visible that there is no influence of the seat, because each dummy is tested in each seat, but the results of each single dummy are repeatable. The upper and lower neck x-forces are very close together. No scatter is observed. Also the upper neck z-force and the lower neck y-moment show only very small differences. The strongest difference that can be observed is for the lower neck z-force. In the time window of 80ms to 100 ms we have differences of about 200 N between the two dummies. In the same time window the peak values of the H2 dummy in the upper neck y-moment are smaller than the values of the H1 dummy. These two differences can have different reasons or it is possible that these signals are correlated. To find out the reasons for the scatter, the simulation model is used and the influence of different parameters is observed.
test BioRID H1 test BioRID H2
7th
European LS-DYNA Conference
© 2009 Copyright by DYNAmore GmbH
6 Parameters which influence the scatter in the BioRID Dummy
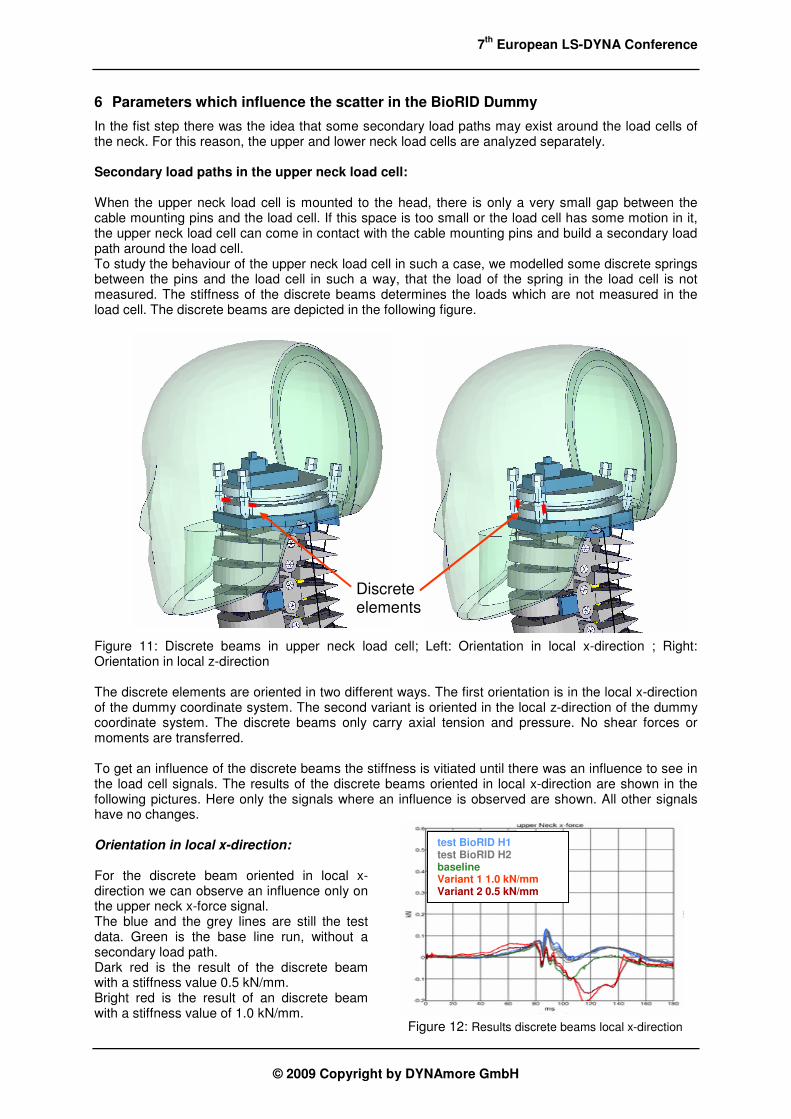
In the fist step there was the idea that some secondary load paths may exist around the load cells of the neck. For this reason, the upper and lower neck load cells are analyzed separately. Secondary load paths in the upper neck load cell: When the upper neck load cell is mounted to the head, there is only a very small gap between the cable mounting pins and the load cell. If this space is too small or the load cell has some motion in it, the upper neck load cell can come in contact with the cable mounting pins and build a secondary load path around the load cell. To study the behaviour of the upper neck load cell in such a case, we modelled some discrete springs between the pins and the load cell in such a way, that the load of the spring in the load cell is not measured. The stiffness of the discrete beams determines the loads which are not measured in the load cell. The discrete beams are depicted in the following figure. Figure 11: Discrete beams in upper neck load cell; Left: Orientation in local x-direction ; Right: Orientation in local z-direction The discrete elements are oriented in two different ways. The first orientation is in the local x-direction of the dummy coordinate system. The second variant is oriented in the local z-direction of the dummy coordinate system. The discrete beams only carry axial tension and pressure. No shear forces or moments are transferred. To get an influence of the discrete beams the stiffness is vitiated until there was an influence to see in the load cell signals. The results of the discrete beams oriented in local x-direction are shown in the following pictures. Here only the signals where an influence is observed are shown. All other signals have no changes. Orientation in local x-direction:
For the discrete beam oriented in local x-direction we can observe an influence only on the upper neck x-force signal. The blue and the grey lines are still the test data. Green is the base line run, without a secondary load path. Dark red is the result of the discrete beam with a stiffness value 0.5 kN/mm. Bright red is the result of an discrete beam with a stiffness value of 1.0 kN/mm.
Discrete elements
test BioRID H1 test BioRID H2 baseline Variant 1 1.0 kN/mm Variant 2 0.5 kN/mm
Figure 12: Results discrete beams local x-direction

7th
European LS-DYNA Conference
© 2009 Copyright by DYNAmore GmbH
Orientation in local z-direction:
The discrete beam oriented in the local z-direction is modelled in the same way as the first one. The stiffness values are also the same. The results of the different beams are shown in the following figure. The colouring schema is also the same. Figure 13: Results of discrete beam local z-direction A secondary load path in the local z-direction shows an effect only on the upper neck z-force and the y-moment. For this kind of load path the correlation to the test is lost in a time window which is different to the time window of the test where the scatter occurs. The curves change shape at about 60 ms but the test data shows a scatter at about 90ms. Conclusion:
The scatter of the upper neck load cell y-moment does not seem to be caused by secondary load paths. The shape of the curves changes at different points in time like the test data. It is not possible to generate results which are similar to the scatter of the curves in the test. Secondary load paths in the lower neck load cell: The same tests are done for the lower neck load cell. The geometry of the T1 vertebra with mounted rubber bumpers clearly shows possibilities of secondary load paths around the load cell. Figure 14: Cut through T1 vertebra (lower neck load cell)
test BioRID H1 test BioRID H2 baseline Variant 1 1.0 kN/mm Variant 2 0.5 kN/mm
upper neck x-force upper neck z-force upper neck y-moment
forward bumper of spine
Rear bumper of spine
T1 filling material
vertebrae stopper
Possible contact areas for secondary load paths

7th
European LS-DYNA Conference
© 2009 Copyright by DYNAmore GmbH
In Figure 14 the described contact faces are marked in green. The forces can go through the rubber bumpers in the silicon filling material of T1 directly around the load cell measurement. To check the influence of these load paths, discrete elements similar to those in the upper neck load cell are modelled in the T1 load cell. The beams also have different stiffness values of 4 kN/mm and 8 kN/mm. They are oriented in the local z-direction of the T1 load cell so that they influence only the z-force and the y-moment of the load cell. The beams are depicted in Figure 15. Figure 15: T1 load cell and discrete beams for secondary load path In the T1 load cell only the influence of discrete beams oriented in local z-direction is checked. This is done because the scatter in the test is also only in the local z-direction. The results of Figure 16 show the influence on the lower neck z-force and the lower neck y-moment. No change is observed in all the other signals. The blue and the grey lines are still the test data. Green is the base line run, without a secondary load path. Bright red is the result of a discrete beam with a stiffness value of 4.0 kN/mm. Dark red is the result of the discrete beam with a stiffness value of 8.0 kN/mm. The lower neck z-force is lowered by the discrete beams. The peak value for a stiffer discrete beam moves downwards and goes closer to the test data. But if we look at the lower neck moment, the peak value is also decreased in the simulations. For the scatter in the test we have to search for parameters which only have an influence on the z-force and not on the y-moment. Conclusion:
A secondary load path in the T1 load cell seems to be coupled in the signals z-force and y-moment, so that we can assess that the scatter in the test data comes not from this secondary load path.
Discrete elements
test BioRID H1 test BioRID H2 baseline Variant 1 4.0 kN/mm Variant 2 8.0 kN/mm
lower neck z-force
lower neck y-moment
Figure 16: Results discrete beams local z-direction inT1 load cell

7th
European LS-DYNA Conference
© 2009 Copyright by DYNAmore GmbH
Friction values in the muscle substitute tubes: As the analysis of the secondary load paths gave no reasons for the scatter in the tests, the main focus was on components in the model, which are not exactly modelled like the physical components. One of these components is the muscle substitute system. The functionality of the model seems to be similar to the physical dummy, but an influence of friction in this area is neglected. Figure 17 shows the differences of the physical component and the current model.
Figure 17: Muscle substitute system; comparison of physical and FE-model component In the physical dummy, the cable runs into the tube, through the spring to an adapter plate. The adapter plate is used to pre-stress the spring on pressure. If the cable moves in the tube the adapter plate also has to move in the tube to load or unload the spring. However the simulation model works in a different (simplified) way. The cable here also runs into the tube. But the adapter plate is completely missing. The cable is directly connected to a spring which works opposite to the spring in the physical dummy. The spring in the simulation model is pre-stressed on tension and there is no adapter plate to move when the cable moves. The suspicion here is that something in this unit works in a different way for the different Dummies in the test. One major issue in many Dummies is the behavior based on friction [2]. So friction or similar effects are at the moment neglected in the simulation model, but this can be one reason for scatter in tests. Thus we have modeled some friction influence into the muscle substitute unit. Therefore the last cable element is used to define a friction value between the cable element and the tubes (see friction area in Figure 17). Here the friction force is constant for the whole simulation. The target was not to model the friction exactly like in the physical dummy; it was only a try to find out the influence on the results of the dummy. The definition of the friction force has nearly no influence on most of the signals in the model. Thus only the upper and lower neck z-force and y- moment are shown in the following diagrams. The influence of friction on other signals is very small. The results of two different values of friction force are depicted in Figure 18.
cable and spring guide, moves with spring deformation
steel cable
springs
physical dummy FE - dummy
7th
European LS-DYNA Conference
© 2009 Copyright by DYNAmore GmbH
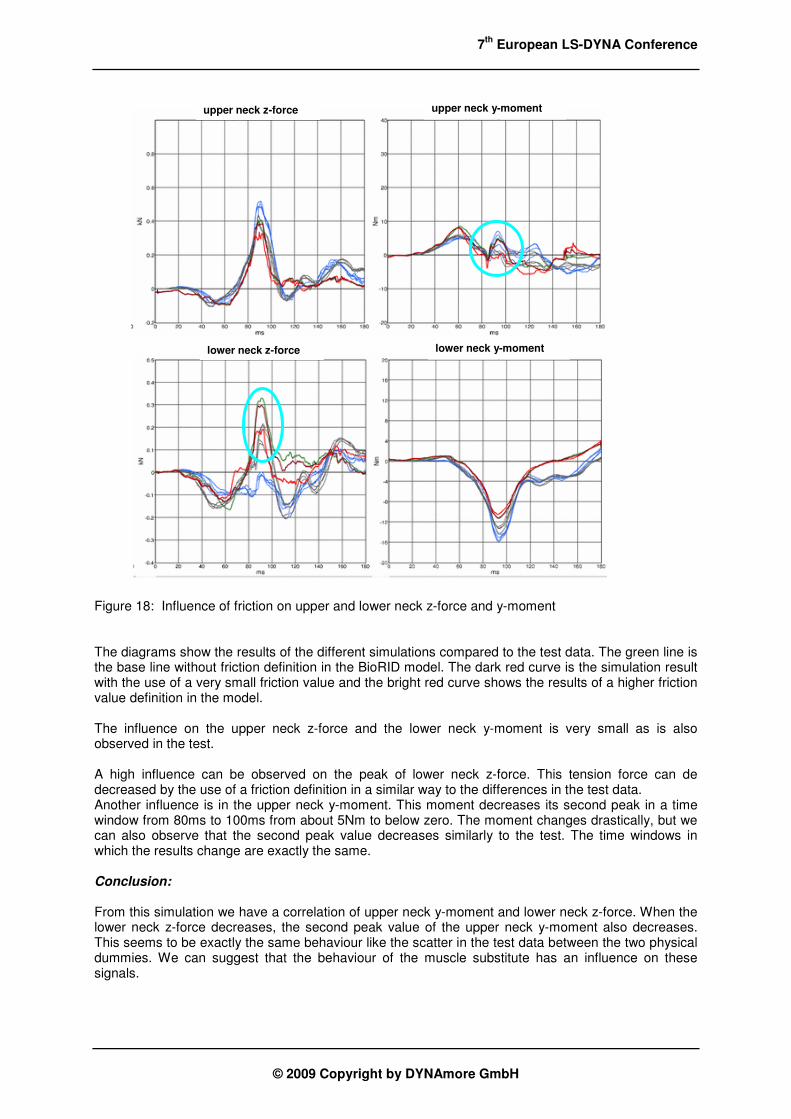
Figure 18: Influence of friction on upper and lower neck z-force and y-moment The diagrams show the results of the different simulations compared to the test data. The green line is the base line without friction definition in the BioRID model. The dark red curve is the simulation result with the use of a very small friction value and the bright red curve shows the results of a higher friction value definition in the model. The influence on the upper neck z-force and the lower neck y-moment is very small as is also observed in the test. A high influence can be observed on the peak of lower neck z-force. This tension force can de decreased by the use of a friction definition in a similar way to the differences in the test data. Another influence is in the upper neck y-moment. This moment decreases its second peak in a time window from 80ms to 100ms from about 5Nm to below zero. The moment changes drastically, but we can also observe that the second peak value decreases similarly to the test. The time windows in which the results change are exactly the same. Conclusion:
From this simulation we have a correlation of upper neck y-moment and lower neck z-force. When the lower neck z-force decreases, the second peak value of the upper neck y-moment also decreases. This seems to be exactly the same behaviour like the scatter in the test data between the two physical dummies. We can suggest that the behaviour of the muscle substitute has an influence on these signals.
lower neck z-force lower neck y-moment
upper neck z-force upper neck y-moment

7th
European LS-DYNA Conference
© 2009 Copyright by DYNAmore GmbH
7 Summary
The latest release of the BioRID model (v2.5) is available since end of 2008. This model shows a very good validation level in the component and seat tests [3]. The new tests in the sports car seat are used to validate the whole model in a simple seat. In these new tests, a very strong scatter is observed in some neck signals. We tried to understand the reason for this scatter by studying different parameters in simulations. The investigations are done for different ideas where the scatter came from. The result by defining secondary load paths in the neck load cells show clearly, that the scatter can not come from these. The shape of the curves can be influenced but the changes are in different time windows and the behaviour does not resemble the problem in the tests. The modelling of friction in the muscle substitute unit showed a very similar influence on the load cell signals, like in the tests. This area of the BioRID can be one reason for large scatter in the load cell signals. At this point in time the parameters have been studied in a very simplified way, and the conclusion of these simulations are an idea where the problem can come from and in which components of the BioRID a problem may possibly exist. For a more detailed analysis of this problem more tests with the use of more different BioRID dummies are necessary. This has been planned and also realized by the PDB (Partnership for Dummy Technology and Biomechanics) [4]. This working group invested a great deal of effort in this problem. The evaluation of the results is still in progress and the first official results shall be presented on the 21st Enhanced Safety of Vehicle Conference from June 15-18, 2009 in Stuttgart, Germany. Furthermore the FAT working group plans to discuss this issue in further detail with Denton to find out how this problem can be solved.
8 Literature
[1] S. Stahlschmidt, B. Keding, U. Franz, Peter Schuster, A. Hirth: “BioRID II Dummy Model
Development -- Influence of Parameters in Validation and Consumer Tests”, International LS-DYNA Users Conference, Detroit, 2006
[2] S. Stahlschmidt, U. Franz, A. Hirth: "Considerations on Detailing Dummy Models Adequately ",
LS-DYNA Forum, Frankenthal, 2007 [3] “FAT LS-DNYA BioRID II User’s Manual (2008)”, Version 2.5, DYNAmore GmbH, Stuttgart,
Germany. [4] Alexander Gromer, Sebastian Stahlschmidt, Peter Schuster: “WorldSID Dummy Model
Development in Cooperation with German Automotive Industry” , International LS-DYNA Users Conference, Detroit, 2008