Embed Size (px)
Citation preview

General rights Copyright and moral rights for the publications made accessible in the public portal are retained by the authors and/or other copyright owners and it is a condition of accessing publications that users recognise and abide by the legal requirements associated with these rights.
Users may download and print one copy of any publication from the public portal for the purpose of private study or research.
You may not further distribute the material or use it for any profit-making activity or commercial gain
You may freely distribute the URL identifying the publication in the public portal If you believe that this document breaches copyright please contact us providing details, and we will remove access to the work immediately and investigate your claim.
Downloaded from orbit.dtu.dk on: Apr 11, 2020
Numerical Model based Reliability Estimation of Selective Laser Melting Process
Mohanty, Sankhya; Hattel, Jesper Henri
Published in:Physics Procedia
Link to article, DOI:10.1016/j.phpro.2014.08.135
Publication date:2014
Document VersionPublisher's PDF, also known as Version of record
Link back to DTU Orbit
Citation (APA):Mohanty, S., & Hattel, J. H. (2014). Numerical Model based Reliability Estimation of Selective Laser MeltingProcess. Physics Procedia, 56, 379-389. https://doi.org/10.1016/j.phpro.2014.08.135

Physics Procedia 56 ( 2014 ) 379 – 389
Available online at www.sciencedirect.com
1875-3892 © 2014 Published by Elsevier B.V. This is an open access article under the CC BY-NC-ND license (http://creativecommons.org/licenses/by-nc-nd/3.0/).Peer-review under responsibility of the Bayerisches Laserzentrum GmbHdoi: 10.1016/j.phpro.2014.08.135
ScienceDirect
8th International Conference on Photonic Technologies LANE 2014
Numerical model based reliability estimation of selective laser melting process
Sankhya Mohantya,*, Jesper H. Hattela
aDepartment of Mechanical Engineering, Technical University of Denmark(DTU), Lyngby, 2800 Denmark
Abstract
Selective laser melting is developing into a standard manufacturing technology with applications in various sectors. However, the process is still far from being at par with conventional processes such as welding and casting, the primary reason of which is the unreliability of the process. While various numerical modelling and experimental studies are being carried out to better understand and control the process, there is still a lack of research into establishing the reliability of the process. In this paper, a combined modelling-experimental approach is introduced to establish the reliability of the selective laser melting process. A validated 3D finite-volume alternating-direction-implicit numerical technique is used to model the selective laser melting process, and is calibrated against results from single track formation experiments. Correlation coefficients are determined for process input parameters such as laser power, speed, beam profile, etc. Subsequently, uncertainties in the processing parameters are utilized to predict a range for the various outputs, using a Monte Carlo method based uncertainty analysis methodology, and the reliability of the process is established. © 2014 The Authors. Published by Elsevier B.V. Selection and blind-review under responsibility of the Bayerisches Laserzentrum GmbH.
Keywords: Selective laser melting; numerical modelling; uncertainty analysis
* Corresponding author. Tel.: +45-45254735 .
E-mail address: [email protected]
© 2014 Published by Elsevier B.V. This is an open access article under the CC BY-NC-ND license (http://creativecommons.org/licenses/by-nc-nd/3.0/).Peer-review under responsibility of the Bayerisches Laserzentrum GmbH

380 Sankhya Mohanty and Jesper H. Hattel / Physics Procedia 56 ( 2014 ) 379 – 389
1. Introduction
Selective laser melting(SLM) is an additive manufacturing process. It involves building a 3D object layer-by layer by selectively melting areas in a powder layer, based on the sliced CAD geometry of the object. This allows the manufacturing of products with complex designs including internal features. The process is known to have nearly 130 influential parameters (Rehme & Emmelmann, 2005), and thus still remains a challenge to control. Thus several experimental and modelling studies on single melt track formation during SLM have been performed to better understand the various involved phenomena, and remain a topic of active research. In recent years, research in this field has adopted a parametric approach to the problem. Parametric optimization studies (Sun et al 2013) as well as those involving factor analysis (Yadroitsev et al 2010) and process reliability (Zaeh & Krauss 2013) have been performed. However, there is still a necessity to properly characterize the reliability of the process.
In this paper, we introduce a 3D-FV-ADI method to solve the governing thermal equations of SLM in a fast, yet accurate manner. The model is then used for establishing the reliability of single track formation by SLM through parameter estimation and uncertainty analysis.
2. Numerical model of selective laser melting
2.1. Governing equations
In selective laser melting, the localised heating of the powder bed by the laser beam results in a heat transfer in the material dominated by conductive heat transfer. In such a case, the spatial and temporal distribution of temperature is governed by the heat conduction equation, which can be expressed as:
2
2
2
2
2
2
dyTk
dyTk
dxTk
tTC zzyyxxp
(1)
where T is the temperature, t is the time, (x, y, z) are the spatial co-ordinates, kxx, kyy and kzz are the thermal
conductivities, ρ is the density, Cp is the specific heat and Ф is the heat source term. The selective laser melting process is usually carried out in a chemically inert gaseous environment. The thermal interaction at the boundaries between the material and the surroundings can be represented as
)()( 44ambamb TTTThTk
(2)
where h is the heat transfer coefficient, Tamb is the temperature of the gaseous environment, ε is the emissivity of
the material and is the Stefan-Boltzman constant. While the above equations holds true in general, appropriate values of the physical quantities (e.g. thermal conductivities, specific heat, etc.) must be used to get an accurate and realistic output.
2.1.1. Powder bed properties The thermal properties of standard materials, based on experimental measurements, are typically available in
literature. However, the values often correspond to bulk material properties, and cannot be directly applied to powder beds, which are characterized by discrete spatial distribution of materials. The typical approach is to substitute the discrete powder bed by a continuum of material possessing equivalent material properties. In this regard, Sih and Barlow (1995, 2004) have proposed successively improving predictive models for emissivity and thermal conductivity of powder beds. Shapiro et al (2004) considered the powder bed as a network of thermal resistances connected at the contact points and via the gaseous medium, and proposed a theoretical model accounting for the size-dependence of the conductivity. Gusarov and Kovalev (2009) have further developed the concept of the powder bed as a network of discrete thermal resistances and have proposed a dependency of effective
Sankhya Mohanty and Jesper H. Hattel / Physics Procedia 56 ( 2014 ) 379 – 389 381
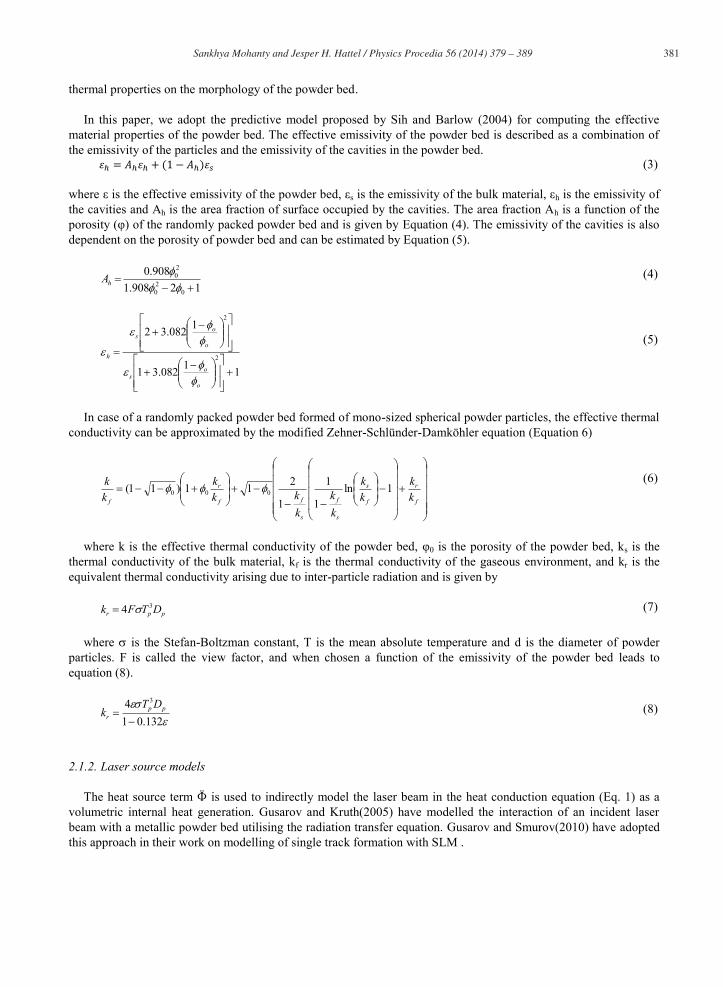
thermal properties on the morphology of the powder bed. In this paper, we adopt the predictive model proposed by Sih and Barlow (2004) for computing the effective
material properties of the powder bed. The effective emissivity of the powder bed is described as a combination of the emissivity of the particles and the emissivity of the cavities in the powder bed.
(3)
where ε is the effective emissivity of the powder bed, εs is the emissivity of the bulk material, εh is the emissivity of the cavities and Ah is the area fraction of surface occupied by the cavities. The area fraction Ah is a function of the porosity (φ) of the randomly packed powder bed and is given by Equation (4). The emissivity of the cavities is also dependent on the porosity of powder bed and can be estimated by Equation (5).
12908.1908.0
020
20
hA
(4)
11082.31
1082.32
2
2
o
os
o
os
h
(5)
In case of a randomly packed powder bed formed of mono-sized spherical powder particles, the effective thermal
conductivity can be approximated by the modified Zehner-Schlünder-Damköhler equation (Equation 6)
f
r
f
s
s
f
s
ff
r
f kk
kk
kk
kkk
kkk 1ln
1
1
1
211)11( 000
(6)
where k is the effective thermal conductivity of the powder bed, φ0 is the porosity of the powder bed, ks is the
thermal conductivity of the bulk material, kf is the thermal conductivity of the gaseous environment, and kr is the equivalent thermal conductivity arising due to inter-particle radiation and is given by
ppr DTFk 34
(7)
where is the Stefan-Boltzman constant, T is the mean absolute temperature and d is the diameter of powder particles. F is called the view factor, and when chosen a function of the emissivity of the powder bed leads to equation (8).
132.014 3
ppr
DTk (8)
2.1.2. Laser source models The heat source term Ф is used to indirectly model the laser beam in the heat conduction equation (Eq. 1) as a
volumetric internal heat generation. Gusarov and Kruth(2005) have modelled the interaction of an incident laser beam with a metallic powder bed utilising the radiation transfer equation. Gusarov and Smurov(2010) have adopted this approach in their work on modelling of single track formation with SLM .
382 Sankhya Mohanty and Jesper H. Hattel / Physics Procedia 56 ( 2014 ) 379 – 389
The irradiance of a simple laser beam with a Gaussian distribution profile is defined by Equation (9), where P is
the power of the laser beam, ω0 is the beam 1/e2 radius and is the absorptivity of the laser beam in the material. For a laser beam moving on the powder bed with a velocity (vx,vy), the thermal flux is thus computed using equation (10), where qs is the thermal flux, (x0,y0) is the initial location of the laser beam and t is the time.
20
22 ))()((2
20
)2(),(oo yyxx
o ePyxI (9)
dxdydtePyxqtvyytvxx
os
yoxo20
22 ))()((2
20
)2(),( (10)
An assumption of absorption of the laser beam in the powder bed, based upon the phenomena of multiple
diffusive reflections on the powder particles, is used to convert the thermal flux into an equivalent volumetric heat source given by Equation (11-12). The depth of penetration of the laser beam is assumed to be dependent on the average number of reflections encountered by the laser beam and the absorptance of the material.
nR2 (11)
aaAdiffusive
e 2131
43 ,
2/12
31
321a (12)
where n is the number of particles per unit volume, is the albedo, is the extinction coefficient and Adiffusive is
the effective absorptance of the powder bed
2.2. Model description
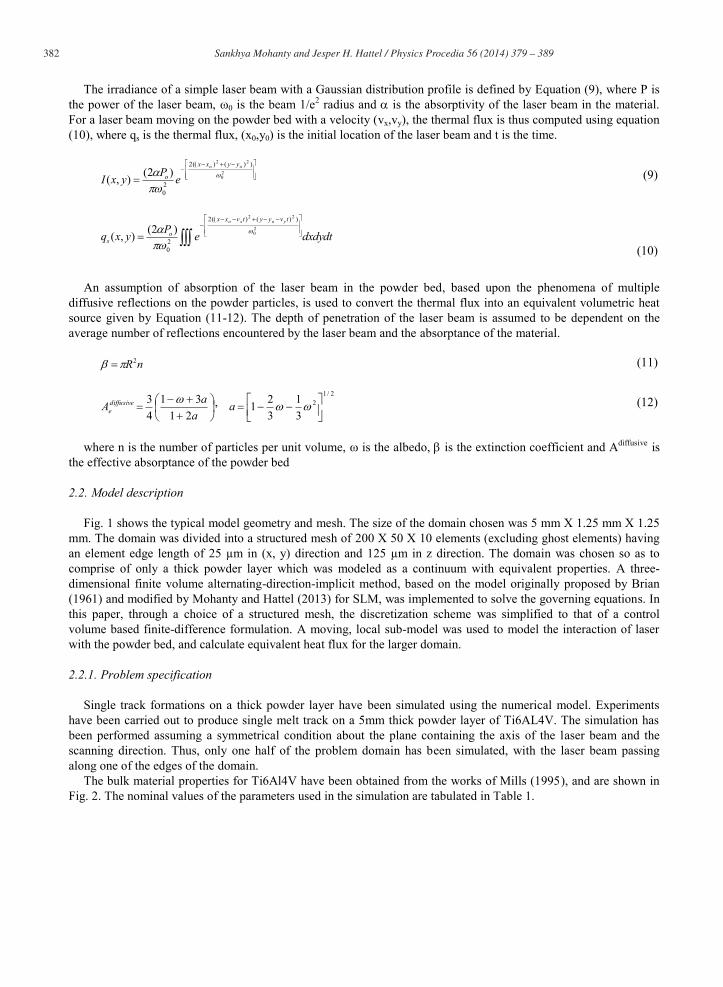
Fig. 1 shows the typical model geometry and mesh. The size of the domain chosen was 5 mm X 1.25 mm X 1.25 mm. The domain was divided into a structured mesh of 200 X 50 X 10 elements (excluding ghost elements) having an element edge length of 25 μm in (x, y) direction and 125 μm in z direction. The domain was chosen so as to comprise of only a thick powder layer which was modeled as a continuum with equivalent properties. A three-dimensional finite volume alternating-direction-implicit method, based on the model originally proposed by Brian (1961) and modified by Mohanty and Hattel (2013) for SLM, was implemented to solve the governing equations. In this paper, through a choice of a structured mesh, the discretization scheme was simplified to that of a control volume based finite-difference formulation. A moving, local sub-model was used to model the interaction of laser with the powder bed, and calculate equivalent heat flux for the larger domain.
2.2.1. Problem specification Single track formations on a thick powder layer have been simulated using the numerical model. Experiments
have been carried out to produce single melt track on a 5mm thick powder layer of Ti6AL4V. The simulation has been performed assuming a symmetrical condition about the plane containing the axis of the laser beam and the scanning direction. Thus, only one half of the problem domain has been simulated, with the laser beam passing along one of the edges of the domain.
The bulk material properties for Ti6Al4V have been obtained from the works of Mills (1995), and are shown in Fig. 2. The nominal values of the parameters used in the simulation are tabulated in Table 1.
Sankhya Mohanty and Jesper H. Hattel / Physics Procedia 56 ( 2014 ) 379 – 389 383
2.2.2. Typical results A typical output of interest from the simulation of the single melt track formation is the temperature distribution
in the domain (Fig. 3(a)). However, transient temperature fields are difficult to validate experimentally and thus the primary output of such simulation is the width and depth of the melt track. Accordingly, the temperature history of each element has been observed and based on the maximal temperature in the simulated processing time, elements have been categorized as molten or powder zones. Fig. 3(b) shows the molten and powder zones in the simulated domain at the same time.
Reliability of a process can be established by characterizing the effect of small uncertainties in inputs on the desired output of the process. The subject has been studied extensively for statistical systems and its usage in combination with complex physical models is also increasing. For a better understanding of the concepts discussed in this paper, one might refer to Saltelli et al (2005)
Fig. 1. Problem domain for simulations with a structured mesh.
Fig. 2. Non-linear bulk material properties of Ti6Al4V.

384 Sankhya Mohanty and Jesper H. Hattel / Physics Procedia 56 ( 2014 ) 379 – 389
3. Reliability estimation via uncertainty calibration
3.1. Model calibration
Single melt tracks created with SLM are used to calibrate the model. While most of the parameters used during the process have some degree of uncertainty associated with them, the nominal values are particularly uncertain for five parameters, namely FWHM of the laser beam, the porosity of powder bed, the average powder diameter, the chamber/environment temperature and the albedo of the powder particles. The FWHM of laser beams have been known to vary during the processing due to thermal effects on the optical components of the selective laser melting (Rehme et al 2009). The typical powders used in SLM are characterized by a normal distribution with respect to the powder diameter. Additionally, the powder particles do not necessarily possess the same optical properties (albedo, extinction coefficients, etc.) as those reported in literature for bulk materials. The porosity is also significantly uncertain as no proper morphology/packing can be attributed to the powder bed. Typically the building chamber is kept at an elevated temperature during SLM process (as this has been found to have beneficial effects with regards to the mechanical properties and residual stress states of the manufactured products) through a combination of substrate heating and gas flow. However, SLM machines usually record the substrate temperature, and the actual average chamber temperature is unknown. Thus, parameter estimation was carried out using the least-mean-square errors of the predicted width of melt track with respect to the experimentally obtained tracks. The results have been tabulated in Table 1.
3.2. Projection of uncertainty by linear error propagation
Maximum likelihood estimation (MLE) is a preliminary investigation technique for characterizing the uncertainty in the estimated parameters. The primary output from the procedure would be a covariance matrix of estimators, which shows the quality of parameter estimation with respect to the output. For the MLE procedure, the set of uncertain parameters was expanded to include beam power and scan speed. A small perturbation (±5%) was
(a)
(b)
Fig. 3. (a) Temperature distribution in the domain; (b) Molten and powder zones in the domain [1-powder, 2-molten].
Sankhya Mohanty and Jesper H. Hattel / Physics Procedia 56 ( 2014 ) 379 – 389 385
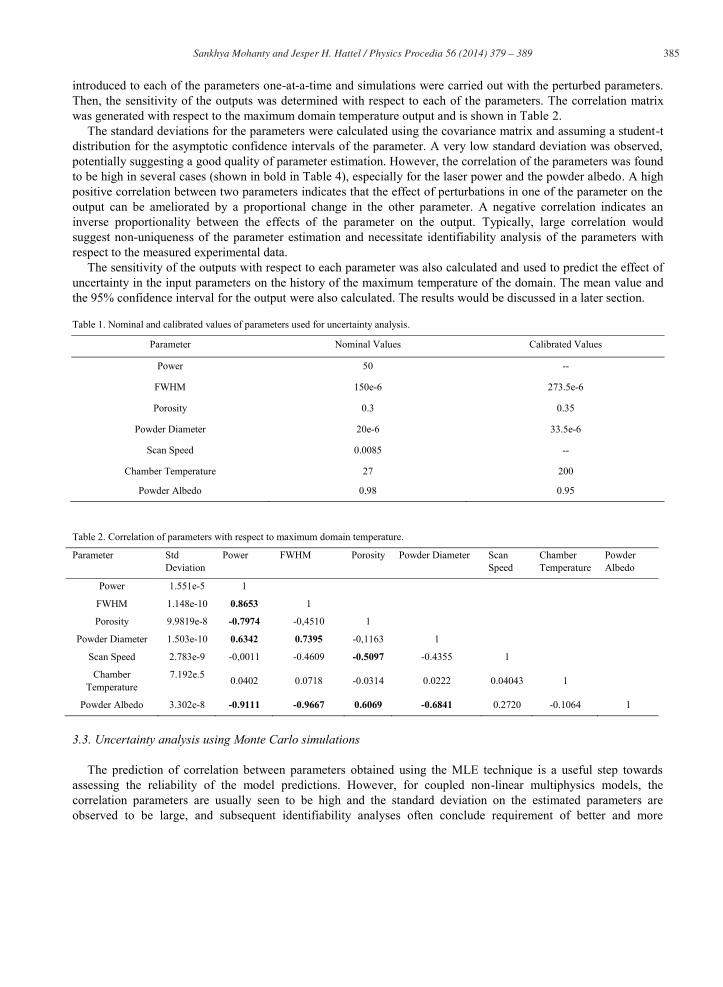
introduced to each of the parameters one-at-a-time and simulations were carried out with the perturbed parameters. Then, the sensitivity of the outputs was determined with respect to each of the parameters. The correlation matrix was generated with respect to the maximum domain temperature output and is shown in Table 2.
The standard deviations for the parameters were calculated using the covariance matrix and assuming a student-t distribution for the asymptotic confidence intervals of the parameter. A very low standard deviation was observed, potentially suggesting a good quality of parameter estimation. However, the correlation of the parameters was found to be high in several cases (shown in bold in Table 4), especially for the laser power and the powder albedo. A high positive correlation between two parameters indicates that the effect of perturbations in one of the parameter on the output can be ameliorated by a proportional change in the other parameter. A negative correlation indicates an inverse proportionality between the effects of the parameter on the output. Typically, large correlation would suggest non-uniqueness of the parameter estimation and necessitate identifiability analysis of the parameters with respect to the measured experimental data.
The sensitivity of the outputs with respect to each parameter was also calculated and used to predict the effect of uncertainty in the input parameters on the history of the maximum temperature of the domain. The mean value and the 95% confidence interval for the output were also calculated. The results would be discussed in a later section.
Table 1. Nominal and calibrated values of parameters used for uncertainty analysis.
Parameter Nominal Values Calibrated Values
Power 50 --
FWHM 150e-6 273.5e-6
Porosity 0.3 0.35
Powder Diameter 20e-6 33.5e-6
Scan Speed 0.0085 --
Chamber Temperature 27 200
Powder Albedo 0.98 0.95
Table 2. Correlation of parameters with respect to maximum domain temperature.
Parameter Std Deviation
Power FWHM Porosity Powder Diameter Scan Speed
Chamber Temperature
Powder Albedo
Power 1.551e-5 1
FWHM 1.148e-10 0.8653 1
Porosity 9.9819e-8 -0.7974 -0,4510 1
Powder Diameter 1.503e-10 0.6342 0.7395 -0,1163 1
Scan Speed 2.783e-9 -0,0011 -0.4609 -0.5097 -0.4355 1
Chamber Temperature
7.192e.5 0.0402 0.0718 -0.0314 0.0222 0.04043 1
Powder Albedo 3.302e-8 -0.9111 -0.9667 0.6069 -0.6841 0.2720 -0.1064 1
3.3. Uncertainty analysis using Monte Carlo simulations
The prediction of correlation between parameters obtained using the MLE technique is a useful step towards assessing the reliability of the model predictions. However, for coupled non-linear multiphysics models, the correlation parameters are usually seen to be high and the standard deviation on the estimated parameters are observed to be large, and subsequent identifiability analyses often conclude requirement of better and more
386 Sankhya Mohanty and Jesper H. Hattel / Physics Procedia 56 ( 2014 ) 379 – 389
numerous experimental results. Thus, Bayesian inference based methods of uncertainty analysis become unsuitable for application in such cases.
However, Monte Carlo simulation based uncertainty analysis techniques do not have an extensive requirement for experimental data. The Monte Carlo based methods can be used with an expert value of parameter uncertainty around the nominal values, both supplied by the user based on experience. The accuracy of the predictions and the confidence intervals, however, are dependent on the manner of choosing perturbed parameter values for simulations, and thus any prior knowledge of the correlation between parameters lead to better results. In order to analyze the uncertainty using Monte Carlo methods, the following procedure is used:
Step 1: Input uncertainty Nominal values of parameters are combined with an appropriate expert value of uncertainty (based on experience and knowledge about the process) to generate ranges for each parameter. For the present uncertainty analysis, an expert uncertainty of 5% is assumed on the beam power, the FWHM and the albedo of the powder particles. The porosity of the powder bed and the average powder diameter are set to have an uncertainty of 10% while the scan speed is assumed to have 0.1% uncertainty.
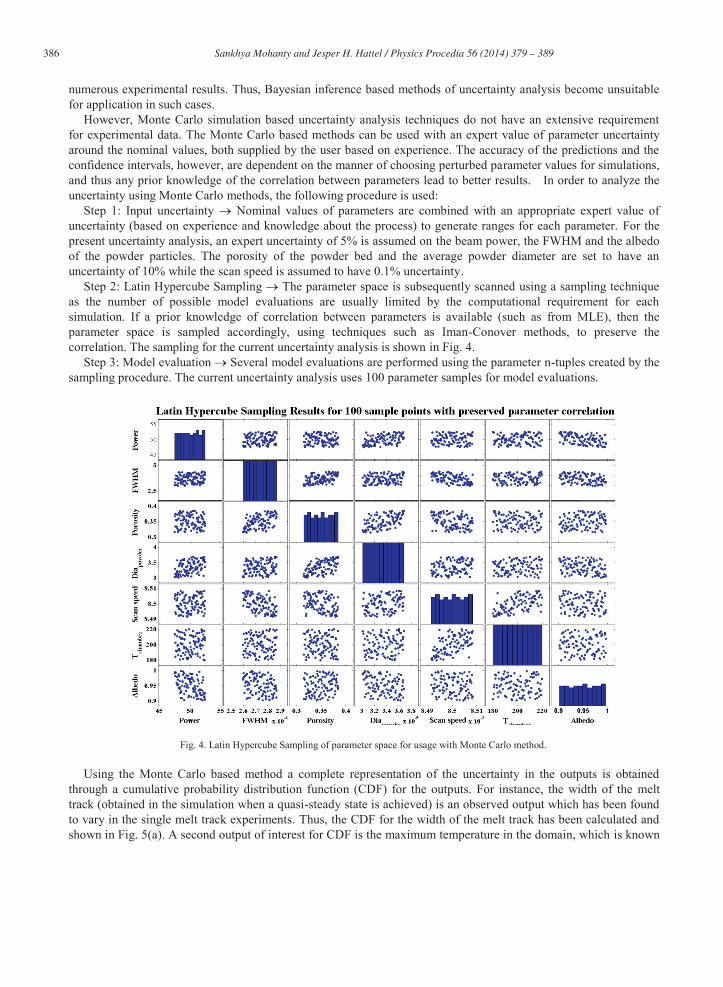
Step 2: Latin Hypercube Sampling The parameter space is subsequently scanned using a sampling technique as the number of possible model evaluations are usually limited by the computational requirement for each simulation. If a prior knowledge of correlation between parameters is available (such as from MLE), then the parameter space is sampled accordingly, using techniques such as Iman-Conover methods, to preserve the correlation. The sampling for the current uncertainty analysis is shown in Fig. 4.
Step 3: Model evaluation Several model evaluations are performed using the parameter n-tuples created by the sampling procedure. The current uncertainty analysis uses 100 parameter samples for model evaluations.
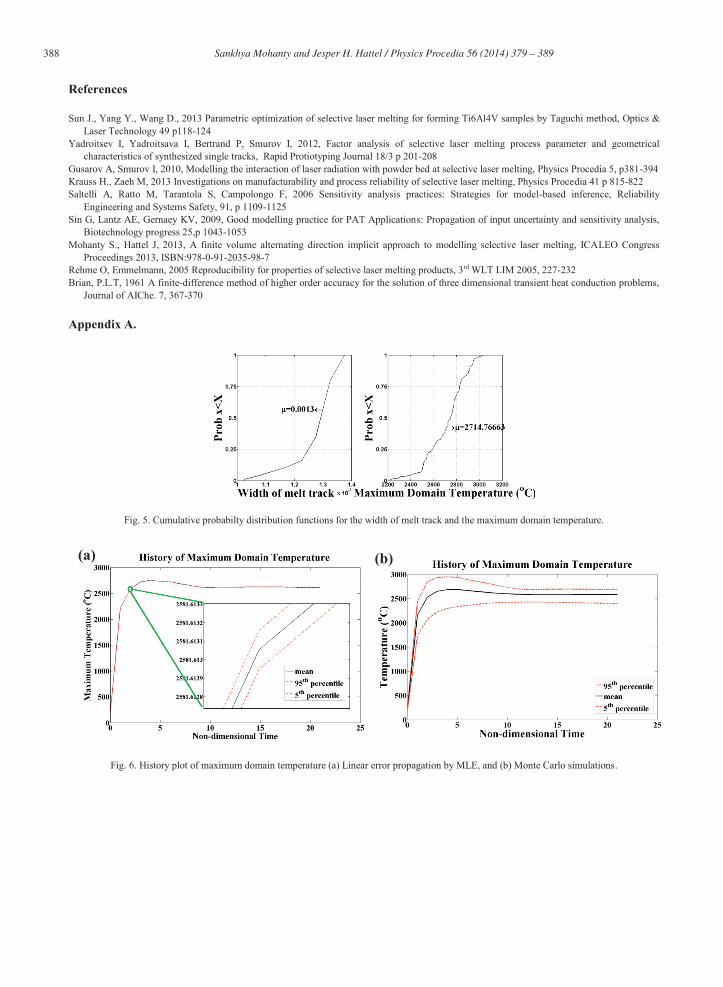
Using the Monte Carlo based method a complete representation of the uncertainty in the outputs is obtained through a cumulative probability distribution function (CDF) for the outputs. For instance, the width of the melt track (obtained in the simulation when a quasi-steady state is achieved) is an observed output which has been found to vary in the single melt track experiments. Thus, the CDF for the width of the melt track has been calculated and shown in Fig. 5(a). A second output of interest for CDF is the maximum temperature in the domain, which is known
Fig. 4. Latin Hypercube Sampling of parameter space for usage with Monte Carlo method.

Sankhya Mohanty and Jesper H. Hattel / Physics Procedia 56 ( 2014 ) 379 – 389 387
to be a driving factor for several phenomena such as ‘balling’ and large localized deformations. The CDF for the maximum temperature in the domain is shown in Fig. 5(b).
The width of the melt track is found to vary between 1.025mm and 1.375 mm, with a mean value of 1.3mm, for the small values of expert uncertainty assigned to the input parameters. The ~27% relative range of the width of the melt track is significant, especially when considering application involving production of thin walls which still remains a challenge today for SLM. Similarly, the maximum domain temperature also has a relative range of ~27%, varying between 2220C and 3034C with a mean value of 2714.76C.
To better understand the large range for the maximum domain temperature, its history is tracked and plotted in Fig. 6(b). As different scan speeds would result in a different time for achieving the same movement of laser, comparing the curves would become difficult. Instead, a non-dimensional time is introduced for plotting history of outputs which is a ratio of the actual time to the time taken to traverse a fixed distance on the domain (equal to the element edge length along the path direction of laser beam). A similar history plot for the maximum domain temperature was made using the results from the MLE calculations, also shown in Fig. 6(a). It can be seen that the MLE method predicts a significantly lower value of uncertainty, and thereby a smaller confidence interval than the Monte Carlo method. While it is tempting to reject the results from the Monte Carlo simulations as they do not match the MLE predictions, the reverse is more accurate as the predictive behavior of the MLE method has been known to suffer when a high correlation exists between the estimated parameters. Thus, MLE, when applicable, is only used as a first step towards assessing the uncertainty. The history plot for the maximum domain temperature shows a large 95% confidence interval, thereby explaining the CDF curve in Fig. 5.
Temperature history is also plotted for nine different locations in the domain, as shown in Fig. 7. Similar to the maximum domain temperature case, the 95% confidence interval is also marked for the nine temperature history plots. It can be observed that the confidence interval is wider in the region with temperature increase corresponding to the laser beam approaching the location, and decreases once the laser beam moves away. This suggests a greater effect of uncertainty in the laser-related parameters (power, beam radius, albedo) on the outputs than of the parameters such as powder diameter, porosity, etc.
4. Conclusions
A 3D FV-ADI based numerical model is used to simulate the single melt track formation in SLM. The model parameters are calibrated using experimental results of single melt tracks made using Ti6Al4V powder. The numerical model is used for a reliability estimation of the process. A maximum likelihood estimation is performed and parameter correlations are obtained with respect to different output criteria. The correlation knowledge is used during sampling of the parameter space with the Latin Hypercube Sampling technique. The generated parameter sample sets are used for Monte Carlo simulations. Cumulative probability distribution functions were obtained for the value of outputs such as width of melt track and the maximum domain temperature. Additionally, confidence intervals were calculated for different outputs, and small perturbations/uncertainty in input parameters were seen to have significant effect on the prediction of certain outputs. The effect of laser related parameters were also observed to be greater than the other parameters.
The current study has only considered a small subset of parameters from the nearly 130 recognized influential factors/inputs. Even with a smaller subset, a need for conducting an identifiability and sensitivity analysis was recognized (via the large correlation between parameters), and this would be the subsequent direction of the research.
Acknowledgements
The authors acknowledge the financial support provided by the F.MAT consortium and the Danish Technical Institute for providing experimental expertise.
388 Sankhya Mohanty and Jesper H. Hattel / Physics Procedia 56 ( 2014 ) 379 – 389
References
Sun J., Yang Y., Wang D., 2013 Parametric optimization of selective laser melting for forming Ti6Al4V samples by Taguchi method, Optics & Laser Technology 49 p118-124
Yadroitsev I, Yadroitsava I, Bertrand P, Smurov I, 2012, Factor analysis of selective laser melting process parameter and geometrical characteristics of synthesized single tracks, Rapid Protiotyping Journal 18/3 p 201-208
Gusarov A, Smurov I, 2010, Modelling the interaction of laser radiation with powder bed at selective laser melting, Physics Procedia 5, p381-394 Krauss H., Zaeh M, 2013 Investigations on manufacturability and process reliability of selective laser melting, Physics Procedia 41 p 815-822 Saltelli A, Ratto M, Tarantola S, Campolongo F, 2006 Sensitivity analysis practices: Strategies for model-based inference, Reliability
Engineering and Systems Safety, 91, p 1109-1125 Sin G, Lantz AE, Gernaey KV, 2009, Good modelling practice for PAT Applications: Propagation of input uncertainty and sensitivity analysis,
Biotechnology progress 25,p 1043-1053 Mohanty S., Hattel J, 2013, A finite volume alternating direction implicit approach to modelling selective laser melting, ICALEO Congress
Proceedings 2013, ISBN:978-0-91-2035-98-7 Rehme O, Emmelmann, 2005 Reproducibility for properties of selective laser melting products, 3rd WLT LIM 2005, 227-232 Brian, P.L.T, 1961 A finite-difference method of higher order accuracy for the solution of three dimensional transient heat conduction problems,
Journal of AIChe. 7, 367-370
Appendix A.
Fig. 5. Cumulative probabilty distribution functions for the width of melt track and the maximum domain temperature.
Fig. 6. History plot of maximum domain temperature (a) Linear error propagation by MLE, and (b) Monte Carlo simulations.
(a) (b)

Sankhya Mohanty and Jesper H. Hattel / Physics Procedia 56 ( 2014 ) 379 – 389 389
Fig. 7. History plots for different locations in the domain (along with 95% confidence intervals).


![University of Birmingham Selective laser melting of AlSi10Mg alloy: Process … · 2018. 11. 29. · laser fabrication (DLF), and selective laser melting (SLM) [5, 6]. Aerospace manufacturers](https://img.pdfslide.net/doc/110x75/606f2d4d983f986eb3388e9a/university-of-birmingham-selective-laser-melting-of-alsi10mg-alloy-process-2018.jpg)


![A Study on the Use of Kilohertz Acoustic Energy for ... · methods like Selective Laser Melting (SLM), Electron Beam Melting (EMB) and Laser Engineered Net Shaping (LENS) [3]. All](https://img.pdfslide.net/doc/110x75/5b945e0209d3f2012e8d233f/a-study-on-the-use-of-kilohertz-acoustic-energy-for-methods-like-selective.jpg)