Embed Size (px)
Citation preview
Acta Geodyn. Geomater., Vol. 9, No. 3 (167), 379–388, 2012
NUMERICAL MODELLING OF ROCK MASS DEFORMATION IN SUBLEVEL CAVING MINING SYSTEM
.Jan BLACHOWSKI 1)* and Steinar ELLEFMO 2)
1) Institute of Mining Engineering, Wroclaw University of Technology, pl. Teatralny 2, 50-051 Wroclaw, Poland 2) Department of Geology and Mineral Resources Engineering, Norwegian University of Science and Technology,
Sem Sælands veg 1, NO-7491 Trondheim, Norway; [email protected], *Corresponding author‘s e-mail: [email protected] (Received March 2012, accepted June 2012) ABSTRACT Combination of numerical models of deformations and repeated geodetic measurement results provide reliable information onthe state of the rock mass in a mining area and support planning and control of the mining operation. The paper describes theconcept of integrated monitoring and analysis of rock mass deformation in the Kvannevann iron ore mine (Norway) usingsub-level caving (SLC) method. Geodetic control network developed for periodic measurements of surface subsidence and a source of geometrical data for numerical modelling of deformations using finite element method (FEM) has beencharacterised. Focus is given to the results of initial numerical analyses with FEM of rock mass deformations due to SLC mining. The results of the modelling provided information on possible extent of deformation zones on the mining ground surface once mining with new method commences. KEYWORDS: rock mass deformation, sub-level caving, numerical modelling, monitoring, Kvannevann mine
determine subsidence independently of geodetic measurements.
In this paper the measures undertaken to monitor effects of underground mining of an iron-ore deposit with sub-level caving system (SLC) on the surrounding rock mass in a mine in Northern Norway have been described. These include, the implementation of a geodetic monitoring network that will in the future provide geometrical data (displacements of controlled points) and numerical models of expected rock mass deformations carried out with FEM.
The aim of the research project is to provide reliable data on the character of rock mass deformations throughout the period of mining operation with sub-level caving. The research methodology consists of the following steps: deterministic modelling of the expected deformation, design and installation of the monitoring scheme, measurements, geometrical analysis of measurement results, integrated analysis and physical interpretation as proposed by Szostak-Chrzanowski and Chrza-nowski (2010). This work describes the results of initial numerical deformation models with FEM, as well as the configuration of the geodetic network set up in the Kvannevann mine and is a follow-up of the paper (Blachowski et al., 2011).
1. INTRODUCTION
Information on rock mass deformation in an area of underground mining can be obtained by means of combined repeated geodetic observations and modelling of expected deformations with numerical techniques. Knowledge of the expected and the observed deformations of rock mass are important for reliable monitoring of the influence of mining activity on the surrounding rock mass. This will render it possible to minimize its effects on the surface (e.g. possible damage to infrastructure) and ensure safety of the mining operation.
Combination of the results of numerical modelling e.g. with Finite Element Method (FEM) and geodetic measurements can be used to improve deformation models developed for successive stages of mining activity and various methods of mining. For example the Szostak-Chrzanowski and Chrzanowski (2010) propose a methodology of integrated analysis, in which the results of geometrical analysis are used as an input into the enhancement of the deterministic model through back analysis. In his doctoral thesis (Milczarek, 2011) used numerical modeling for the assessment of surface deformations in parts of a former coal basin in combination with results of repeated levelling results. Villegas et al. (2008) and others use numerical modelling with the aim to

J. Blachowski and S. Ellefmo
380
surface. The rock mass consists of: mica schists, calcareous garnet-mica schists and limestones with thin layers of amphibolites and quartzities. The rock shows distinct foliation due to at least three tectonic folding cycles (Ellefmo, 2005).
Surface mining of the deposit ended in the year 1999. There are 3 old open pits left in the area. These are: the West-, the Erik- and the Kvannevann pit. After 1999 mining continued with sub-level stoping under the Kvannevann pit whose floor lies on average at 400 meter above sea level. The ore body was divided into 16 stopes approx. 30 m wide, 100 m high and from 50 to 70 m long with vertical pillars left between them to support the hanging-wall. There are 2 production levels at elevations 320 m and 250 m respectively. The upper production level is separated from the surface (bottom of the Kvannevann pit) by a crown pillar approx. 30 m thick. To continue mining
2. DESCRIPTION OF THE MINING AREA AND MINING OPERATION
The Kvannevann mine is located in the Ørtfjell mining area approximately 27 km northeast of the town of Mo i Rana (Northern Norway) and 50 km to the south of the Arctic Circle. The mine is operated by the Rana Gruber AS mining company. The study area, situated on the south facing slope of the Dunderlandsdalen Valley, is marked with a black box in Figure 1. The topography of the mining grounds has been described in detail by (Blachowski et al., 2011). The iron-ore deposit has the form of an acute arch roughly parallel to the slope of the mountain. Its south arm, which is being exploited under the former open pit (see below) is inclined at approx. 80-85 degrees towards north, over 1200 m long and between 30 to 100 m wide. The bottom of the deposit is believed to be between 1500 m and 2000 m below
Fig. 1 Location of the study area – the Kvannevann iron oxide mine in Norway.

NUMERICAL MODELLING OF ROCK MASS DEFORMATION … .
381
Fig. 2 Visualisation of the present and planned underground workings.
successively, in a way described earlier, and as the crushed ore is removed, the caved material from above and the hanging wall follows into the cave. The height of waste rock increases with each sublevel. As a consequence hanging-wall and to a lesser extent foot-wall deformation is an anticipated effect as the rock is expected to fracture and collapse following the cave (Smith, 2003).
The carving in of the wall has to occur in a controlled and sufficient manner. Air blasts threatening the safety of mining operation may be the result if uncontrolled caving is achieved.
In the case of the Kvannevann mine all the vertical pillars and the crown pillar have to be removed in order to proceed with sublevel caving and the loose rock material produced from this operation is to form a protective cushion against the above described situation.
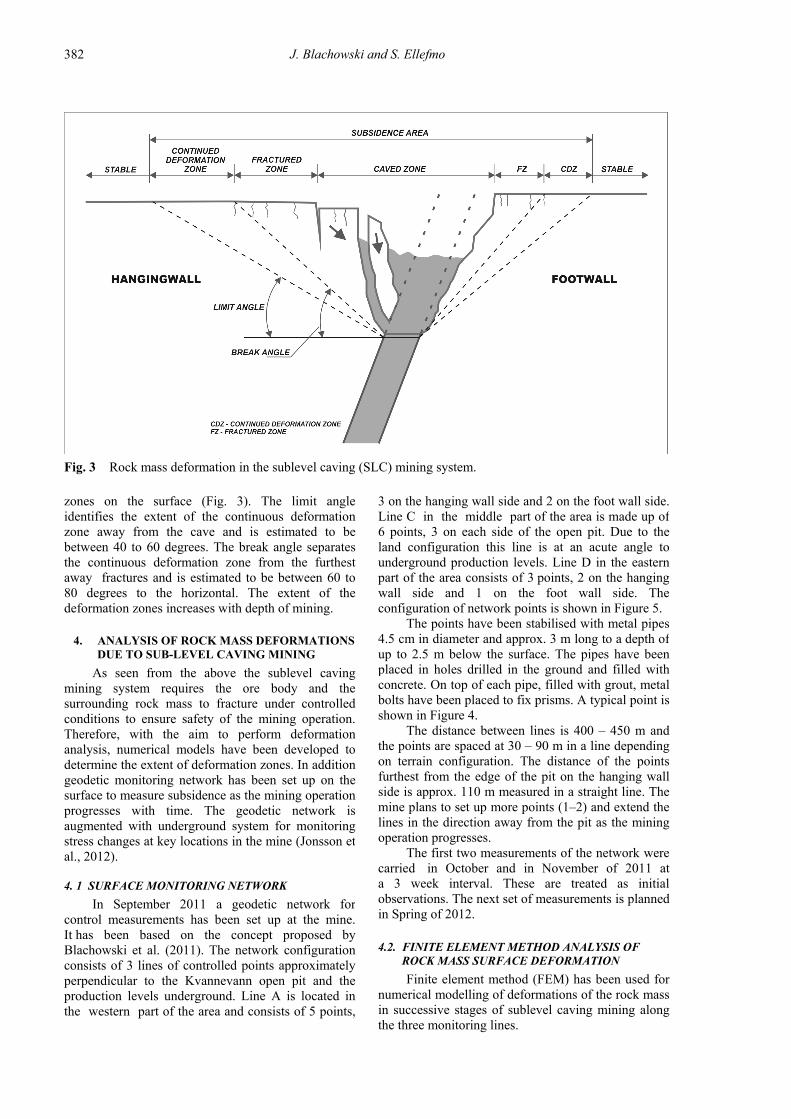
Deformations that develop around the mine are shown in Figure 3. In the deformation area, three zones, parallel to the mined deposit, can be identified. These are:
the caved zone, which occurs almost vertically above the production level,
the fracture zone consisting of fractures that develop in the rock mass as it moves towards the caved zone, and
the continuous deformation zone, which is the area where surface deformations can be measured.
According to (Lupo, 1997) the extent of these zones can be expressed as angles between the horizontal and lines joining boundaries between these
of the deposit development of a new production level and introduction of the sub level caving (SLC) mining system has started. The bottom of the third production level is set at 123 m above sea level. The distance from level 250 is divided into 4 sublevels at 221, 186, 155 and 123 m. In the new level, iron-ore will be mined following the northward dip of the deposit (approx. 80-85 degrees) from W towards E in each sublevel starting with level 221. Drifts perpendicular to the sublevel drift spaced at approx. 20 m and approx. 30 m high will be drilled from the footwall towards the hanging wall and used to blast the ore. In the next sublevel, 186 the drifts will be made in the same way, but they will be positioned between those in the sublevel above. Blastholes will be drilled in a fan pattern at regular intervals, approx. 2.6 m along the crosscuts. It is planned that 5 fans will be blasted at one time beginning at the hanging wall on the uppermost sublevel. The crushed ore will be passed to the underground crusher via ore passes and then to the ore silo surface with a conveyor belt system for storage before it is trammed down to the processing plant. The geometry of the existing and planned underground workings is shown in Figure 2. It also shows the existing part of the crown pillar in the eastern part of the mine (dark grey block) and its part blasted together with 5 pillars (light grey blocks) in October 2011 during preparatory works for the new mining system.
3. DEFORMATIONS IN SUBLEVEL CAVING
MINING SYSTEM
The sublevel caving mining system is used for steep, continuous mineral deposits. The ore is blasted
J. Blachowski and S. Ellefmo
382
Fig. 3 Rock mass deformation in the sublevel caving (SLC) mining system.
3 on the hanging wall side and 2 on the foot wall side. Line C in the middle part of the area is made up of 6 points, 3 on each side of the open pit. Due to the land configuration this line is at an acute angle to underground production levels. Line D in the eastern part of the area consists of 3 points, 2 on the hanging wall side and 1 on the foot wall side. The configuration of network points is shown in Figure 5.
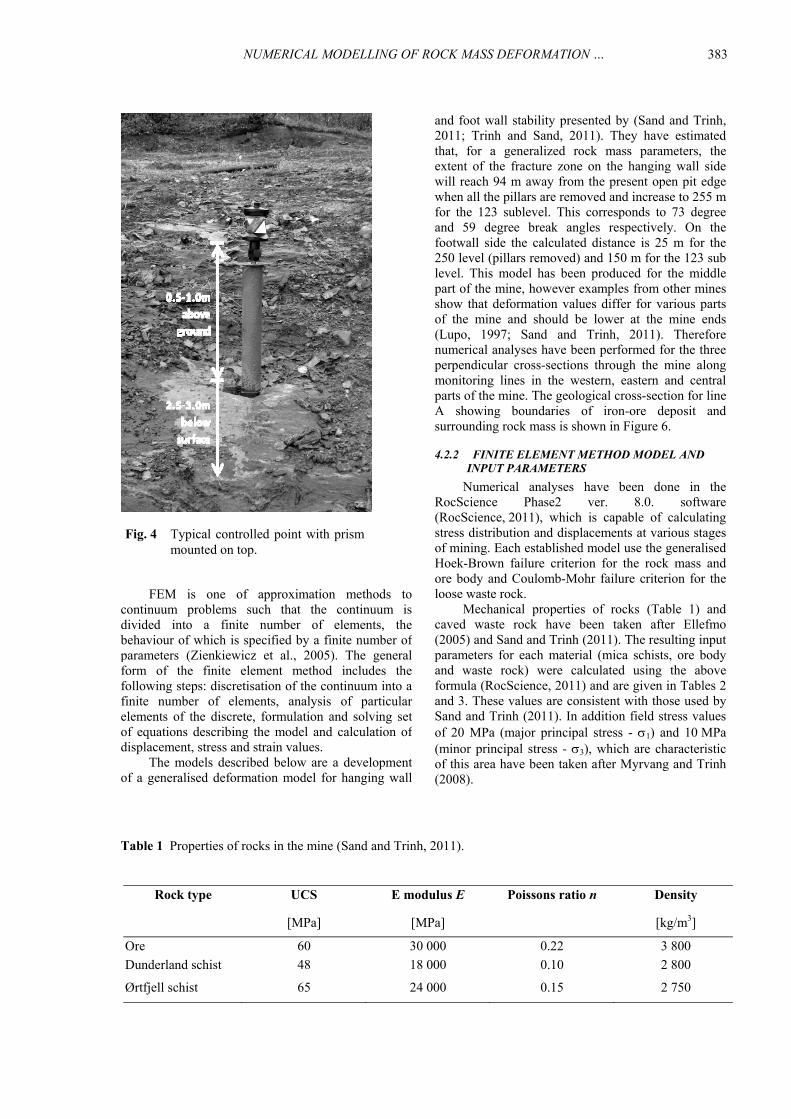
The points have been stabilised with metal pipes 4.5 cm in diameter and approx. 3 m long to a depth of up to 2.5 m below the surface. The pipes have been placed in holes drilled in the ground and filled with concrete. On top of each pipe, filled with grout, metal bolts have been placed to fix prisms. A typical point is shown in Figure 4.
The distance between lines is 400 – 450 m and the points are spaced at 30 – 90 m in a line depending on terrain configuration. The distance of the points furthest from the edge of the pit on the hanging wall side is approx. 110 m measured in a straight line. The mine plans to set up more points (1–2) and extend the lines in the direction away from the pit as the mining operation progresses.
The first two measurements of the network were carried in October and in November of 2011 at a 3 week interval. These are treated as initial observations. The next set of measurements is planned in Spring of 2012.
4.2. FINITE ELEMENT METHOD ANALYSIS OF
ROCK MASS SURFACE DEFORMATION
Finite element method (FEM) has been used for numerical modelling of deformations of the rock mass in successive stages of sublevel caving mining along the three monitoring lines.
zones on the surface (Fig. 3). The limit angle identifies the extent of the continuous deformation zone away from the cave and is estimated to be between 40 to 60 degrees. The break angle separates the continuous deformation zone from the furthest away fractures and is estimated to be between 60 to 80 degrees to the horizontal. The extent of the deformation zones increases with depth of mining.
4. ANALYSIS OF ROCK MASS DEFORMATIONS
DUE TO SUB-LEVEL CAVING MINING
As seen from the above the sublevel caving mining system requires the ore body and the surrounding rock mass to fracture under controlled conditions to ensure safety of the mining operation. Therefore, with the aim to perform deformation analysis, numerical models have been developed to determine the extent of deformation zones. In addition geodetic monitoring network has been set up on the surface to measure subsidence as the mining operation progresses with time. The geodetic network is augmented with underground system for monitoring stress changes at key locations in the mine (Jonsson et al., 2012).
4. 1 SURFACE MONITORING NETWORK
In September 2011 a geodetic network for control measurements has been set up at the mine. It has been based on the concept proposed by Blachowski et al. (2011). The network configuration consists of 3 lines of controlled points approximately perpendicular to the Kvannevann open pit and the production levels underground. Line A is located in the western part of the area and consists of 5 points,
NUMERICAL MODELLING OF ROCK MASS DEFORMATION … .
383
Fig. 4 Typical controlled point with prism mounted on top.
and foot wall stability presented by (Sand and Trinh, 2011; Trinh and Sand, 2011). They have estimated that, for a generalized rock mass parameters, the extent of the fracture zone on the hanging wall side will reach 94 m away from the present open pit edge when all the pillars are removed and increase to 255 m for the 123 sublevel. This corresponds to 73 degree and 59 degree break angles respectively. On the footwall side the calculated distance is 25 m for the 250 level (pillars removed) and 150 m for the 123 sub level. This model has been produced for the middle part of the mine, however examples from other mines show that deformation values differ for various parts of the mine and should be lower at the mine ends (Lupo, 1997; Sand and Trinh, 2011). Therefore numerical analyses have been performed for the three perpendicular cross-sections through the mine along monitoring lines in the western, eastern and central parts of the mine. The geological cross-section for line A showing boundaries of iron-ore deposit and surrounding rock mass is shown in Figure 6.
4.2.2 FINITE ELEMENT METHOD MODEL AND
INPUT PARAMETERS
Numerical analyses have been done in the RocScience Phase2 ver. 8.0. software (RocScience, 2011), which is capable of calculating stress distribution and displacements at various stages of mining. Each established model use the generalised Hoek-Brown failure criterion for the rock mass and ore body and Coulomb-Mohr failure criterion for the loose waste rock.
Mechanical properties of rocks (Table 1) and caved waste rock have been taken after Ellefmo (2005) and Sand and Trinh (2011). The resulting input parameters for each material (mica schists, ore body and waste rock) were calculated using the above formula (RocScience, 2011) and are given in Tables 2 and 3. These values are consistent with those used by Sand and Trinh (2011). In addition field stress values of 20 MPa (major principal stress - 1) and 10 MPa (minor principal stress - 3), which are characteristic of this area have been taken after Myrvang and Trinh (2008).
FEM is one of approximation methods to continuum problems such that the continuum is divided into a finite number of elements, the behaviour of which is specified by a finite number of parameters (Zienkiewicz et al., 2005). The general form of the finite element method includes the following steps: discretisation of the continuum into a finite number of elements, analysis of particular elements of the discrete, formulation and solving set of equations describing the model and calculation of displacement, stress and strain values.
The models described below are a development of a generalised deformation model for hanging wall
Table 1 Properties of rocks in the mine (Sand and Trinh, 2011).
Rock type UCS E modulus E Density
[MPa] [MPa]
Poissons ratio n
[kg/m3]
Ore 60 30 000 0.22 3 800
Dunderland schist 48 18 000 0.10 2 800
Ørtfjell schist 65 24 000 0.15 2 750

J. Blachowski and S. Ellefmo
384
Table 2 Selected input ore body and rock mass parameters.
Parameter Unit Ore body Mica schist
Unit weight MN/m3 0.032 0.032
Poissons ratio n 0.250 0.200
Young modulus [MPa] 25 000.000 20 000.000
UCS [MPa] 60.000 80.000
GSI [MPa] 70.000 60.000
Disturbance factor 0.200 0.200
Max. principal stress [MPa] 15.000 15.000
Min. principal stress [MPa] 10.000 10.000
Table 3 Selected input waste rock parameters.
Parameter Unit Waste rock
Unit weight MN/m3 0.02
Poissons ratio n 0.25
Young modulus [MPa] 250.00
Friction angle [deg] 20.00
Cohesion [MPa] 0.00
In situ stress condition [MPa] Body weight only
assigning material parameters for successive stages of the model, (5) performing calculations and (6) interpretation and visualisation of results.
Stress and displacement calculations have been done in stages representing progress of mine development in time. In the initial state the vertical and crown pillars exist and then the phases are as follows:
phase 1 – vertical and crown pillars removed, top of the mine at 280 m above sea level with top of waste rock at 350 m above sea level,
phase 2 –SLC mining of consecutive blocks at sublevel 221 with top of waste rock at 320 m above sea level,
phase 3 – SLC mining of consecutive blocks at sublevel 187 with top of waste rock at 280 m above sea level,
phase 4 – SLC mining of consecutive blocks at sublevel 153 m with top of waste rock at 260 m above sea level,
phase 5 – SLC mining of consecutive blocks at sublevel 123 m with top of waste rock at 230 m above sea level.
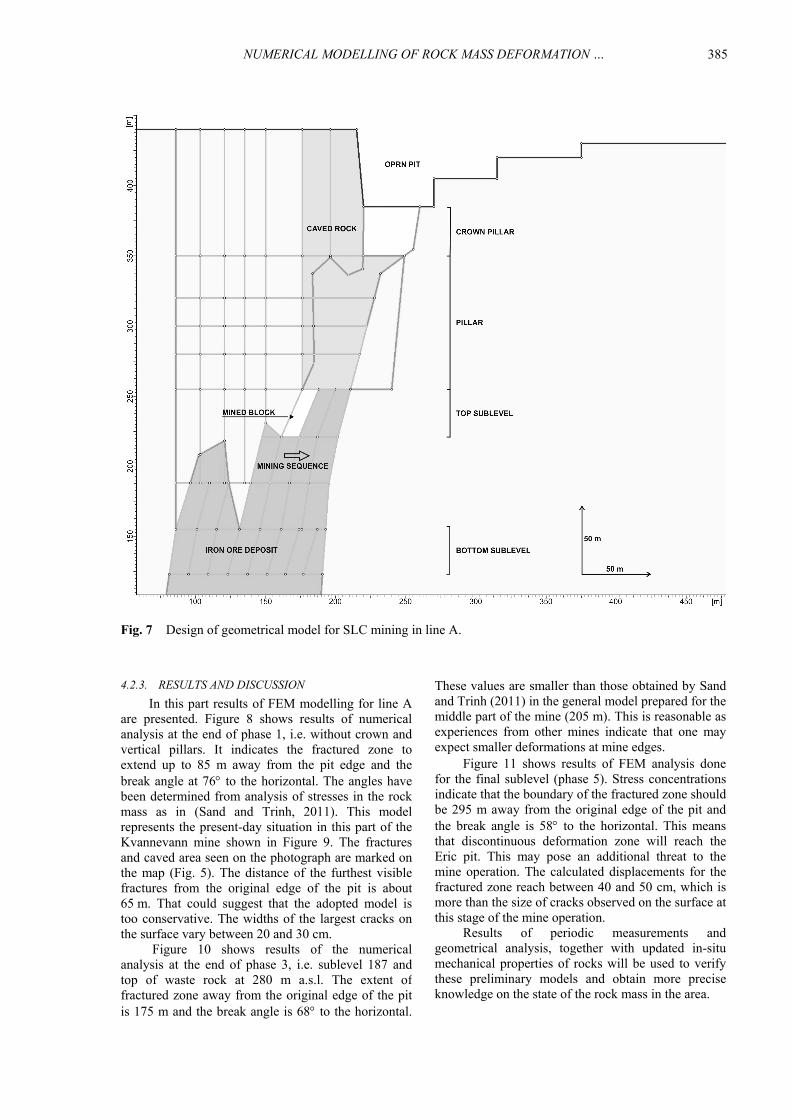
The following assumptions have also been made, (1) the deposit is excavated in 15x30m blocks starting from its northern part and moving towards south (Fig. 7), (2) rock mass above the excavation is caved (loose rock) and its boundary is vertical.
Fig. 6 Cross-section through the orebody along line A.
The modelling procedure consisted of the following steps: (1) constructing a geometrical model basing on geological cross-sections and mine plans, (2) discretizing the model, (3) defining the boundary conditions and field stresses, (4) defining and
NUMERICAL MODELLING OF ROCK MASS DEFORMATION … .
385
Fig. 7 Design of geometrical model for SLC mining in line A.
These values are smaller than those obtained by Sand and Trinh (2011) in the general model prepared for the middle part of the mine (205 m). This is reasonable as experiences from other mines indicate that one may expect smaller deformations at mine edges.
Figure 11 shows results of FEM analysis done for the final sublevel (phase 5). Stress concentrations indicate that the boundary of the fractured zone should be 295 m away from the original edge of the pit and the break angle is 58 to the horizontal. This means that discontinuous deformation zone will reach the Eric pit. This may pose an additional threat to the mine operation. The calculated displacements for the fractured zone reach between 40 and 50 cm, which is more than the size of cracks observed on the surface at this stage of the mine operation.
Results of periodic measurements and geometrical analysis, together with updated in-situ mechanical properties of rocks will be used to verify these preliminary models and obtain more precise knowledge on the state of the rock mass in the area.
4.2.3. RESULTS AND DISCUSSION
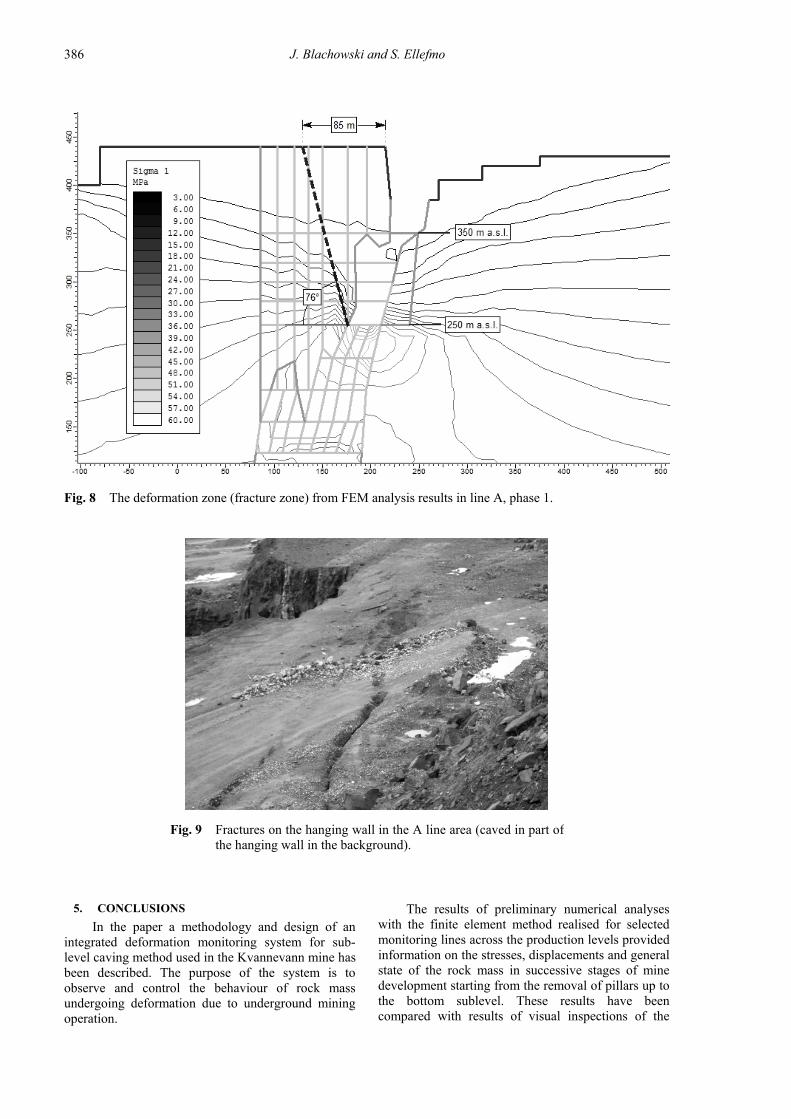
In this part results of FEM modelling for line A are presented. Figure 8 shows results of numerical analysis at the end of phase 1, i.e. without crown and vertical pillars. It indicates the fractured zone to extend up to 85 m away from the pit edge and the break angle at 76 to the horizontal. The angles have been determined from analysis of stresses in the rock mass as in (Sand and Trinh, 2011). This model represents the present-day situation in this part of the Kvannevann mine shown in Figure 9. The fractures and caved area seen on the photograph are marked on the map (Fig. 5). The distance of the furthest visible fractures from the original edge of the pit is about 65 m. That could suggest that the adopted model is too conservative. The widths of the largest cracks on the surface vary between 20 and 30 cm.
Figure 10 shows results of the numerical analysis at the end of phase 3, i.e. sublevel 187 and top of waste rock at 280 m a.s.l. The extent of fractured zone away from the original edge of the pit is 175 m and the break angle is 68 to the horizontal.
J. Blachowski and S. Ellefmo
386
Fig. 8 The deformation zone (fracture zone) from FEM analysis results in line A, phase 1.
Fig. 9 Fractures on the hanging wall in the A line area (caved in part of the hanging wall in the background).
The results of preliminary numerical analyses with the finite element method realised for selected monitoring lines across the production levels provided information on the stresses, displacements and general state of the rock mass in successive stages of mine development starting from the removal of pillars up to the bottom sublevel. These results have been compared with results of visual inspections of the
5. CONCLUSIONS
In the paper a methodology and design of an integrated deformation monitoring system for sub-level caving method used in the Kvannevann mine has been described. The purpose of the system is to observe and control the behaviour of rock mass undergoing deformation due to underground mining operation.

NUMERICAL MODELLING OF ROCK MASS DEFORMATION … .
387
Fig. 10 The deformation zone (fracture zone) from FEM analysis results in line A, phase 3.
Fig. 11 The deformation zone (fracture zone) from FEM analysis results in line A, phase 5.

J. Blachowski and S. Ellefmo
388
Milczarek, W.: 2011, Analysis of rock mass surface changes due to completed mining in a selected part of the Walbrzych Coal basin, Doctoral Thesis, Wroclaw University of Technology.
Myrvang, A. and Trinh Quoc, N.: 2008, Rana Gruber pillars excavation - horizontal model, SINTEF, Trondheim.
RocScience Inc.: 2011, Phase2 Finite Element Analysis for Excavations and Slopes version 8.0 Documentation, http://www.rocscience.com/downloads/phase2/webhelp/phase2.htm.
Sand, N.S. and Trinh, Q.N.: 2011, Rana Gruber rock mechanics challenges connection with the establishment of a new main level and the transition to new mining method, Proceeds. 45th US Rock Mechanics / Geomechanics Symposium, AMRA 11–233.
Smith, M. (Ed): 2003, Mining in steep orebodies, In: Underground mining methods, First Edition, Atlas Copco, 23–28.
Szostak-Chrzanowski, A. and Chrzanowski, A.: 2010,Introduction to modelling of rock strata deformation, CCGE, University of New Brunswick, Fredericton, Canada.
Trinh, Q.N. and Sand, N.S.: 2011, Stability study for the footwall at Rana Gruber, Norway, Proceeds. 45th US Rock Mechanics / Geomechanics Symposium, ARMA 11–108.
Villegas, T., Nordlund, E. and Dahnér-Lindqvist, Ch.: 2008,Hangingwall surface subsidence at the Kiirunavaara Mine, Engineering Geology, 121, Issues 1–2, 18–27;
Zienkiewicz, O.C., Taylor, R.L. and Zhu, J.Z.: 2005, The Finite Element Method: Its basis and fundamentals, 6th Edition, Butterworth-Heinemann.
hanging wall surface and the results of an available general numerical model of deformations.
These results, together with implementation of the geodetic measurement network, constitute the first stage of integrated system for monitoring deformations of rock mass implemented in the Kvannevann mine. The SLC mining operation is planned for many years (mining of the first sublevel will take several years). Results of periodic geodetic measurements, together with updated mechanical properties of rock, will be used to enhance numerical analyses and will provide knowledge on the behaviour of rock mass characterised by large horizontal stresses undergoing mining.
ACKNOWLEDGMENTS
The project has been realised within research grant no. FSS/2011/V/D3/W/0073 Analysis and assessment of mining grounds surface deformations with the support granted by Iceland, Liechtenstein and Norway by means of co-financing from the European Economic Area Financial Mechanism and the Norwegian Financial Mechanism as part of the Scholarship and Training Fund.
The authors would like to thank the Rana Gruber AS employees: Anders Bergvik, Børre Nøst, and Susanne Sand, as well as SINTEF scientist Nghia Quoc Trinh for their assistance.
REFERENCES
Blachowski, J., Ellefmo, S. and Ludvigsen, E.: 2011,Monitoring system for observations of rock mass deformations caused by sublevel caving mining system, Acta Geodyn. Geomater., 8, No. 3 (163), 335–344.
Ellefmo, S.: 2005, A probabilistic approach to the value chain of underground iron ore mining, Doctoral Thesis, Norwegian University of Science and Technology, Dept. of Geology and Mineral Resources Eng., Trondheim.
Henry, E., Mayer, C. and Rott, H.: 2004, Mapping mining-induced subsidence from space in a hard rock mine: example of SAR interferometry application at Kiruna mine, CIM Bulletin, 97, No. 1083.
Jonsson, K., Trinh, N. Q. and Ellefmo, S.: 2012, Monitoring at Rana Grubers Kvannevann Mine, Proceedings of the Eurock 2012 International Symposium Stockholm 28-30 May 2012.
Lupo, J.F.: 1997, Progressive failure of hanging wall and footwall Kiirunavaaara mine, Sweden, Int. J. Rock Mech. & Sci. 34:3-4, paper No. 184.