Embed Size (px)
Citation preview
Numerical Security Assessment in Underground Transport Spaces in Case of Fire 45
Revue « Nature & Technologie ». A- Sciences fondamentales et Engineering, n°12/ janvier 2015. Pages 45 à 59
Numerical Security Assessment in Case of Fire in Underground Transport Spaces
Bouzid Benkoussas,*a Amor Bouhdjar,b Olivier Vauquelinc
aEcole Nationale Polytechnique, 10 Rue des frères Oudek, El Harrach, BP 182, 16200, Alger, Algéria bCDER, B.P 62 Route de l’Observatoire Bouzaréah, Alger, Algéria
cAix-Marseille Université/Laboratoire IUSTI/ UMR CNRS 7343, 5 rue E. Fermi, 13453 Marseille, France
*Corresponding author: Bouzid Benkoussas; Tel: +213 774 29 08 13 E-mail : [email protected] ; [email protected]
Abstract
In case of fire in a subway station and if the fire smoke extraction is not handled properly, passengers may be trapped and thus would be in a life-threatening situation. The most immediate threat is not direct exposure to fire, but the smoke inhalation. The smoke contains hot air and toxic gases. The increasing rate of use of subway stations could lead to an increase in the frequency of serious fires, thus subway station designers and operators must consider all fire aspects, smoke propagation, and ventilation strategies within their facilities. In this paper, heat transfer through the spread of smoke in the event of a fire in a subway station is examined. It concerns the identification of ventilation strategies in the station so as to provide security for passengers and rescuers, based on numerical simulations using the FDS software. Smoke control strategies by traps located at the ceiling associated with different tunnel ventilation were investigated. The results show that the safest strategies are mainly those with air flow rate blown into the station from the tunnels less than the flow rate extracted by the traps. The least safe scenarios are those where the ventilation through the tunnels is accomplished with flow rate greater than the one extracted by the traps. Keywords : Smoke ; propagation ; subway station ; strategy ; ventilation ; simulation
1. Introduction
With the rapid growth of cities and consequently a rapid
increase in population, subway has become a major public
transportation. It is an effective way to solve traffic
problems. Algeria, and particularly the capital Algiers has
put into operation its first commercial Metro line in 2011.
During subway construction, there is a substantial
problem that is how to prevent and deal with subway fire
effectively. Fires are major risks in underground spaces.
They have claimed lives of several passengers throughout
the world. Subway station is prone to fire due to its
structural characteristic of confined space where ventilation
depends mostly on mechanical systems. Thick Smoke
produced by a fire reduces visibility and creates dangerous
situations to the users and the fire fighters, hindering
prompt emergency evacuation.
It has been recently shown that an optimized ventilation
system for fire safety in underground stations may not
necessary be associated with a strong ventilation flow.
Under strong ventilation, the hot smoke front tends to mix
with surrounding fresh air flow induced through openings
and exit doors, thus endangering the users [1]. Forced
ventilation will affect different types and sizes of fire loads
in different ways. It will bring with it a plentiful supply of
oxygen which might tend to increase the severity of the
blaze, but it might also have a cooling effect which may
Nature & Technology
Soumis le : 20 janvier 2014 Forme révisée acceptée le : 08 Juillet 2014 Email de l’auteur correspondant : [email protected]
Numerical Security Assessment in Underground Transport Spaces in Case of Fire
Revue « Nature & Technologie ». A- Sciences fondamentales et Engineering, n°12/ janvier 2015. Pages 45 à 59
46
tend to reduce the severity of the phenomenon. It may also
cause fire to spread across at a significantly faster or slower
rate. It may even put the fire out entirely. The relative
importance of each of these factors has not been adequately
investigated [2]. Therefore, a well-designed emergency
ventilation system can save many people’s lives and
belongings.
The Prediction of smoke movement in buildings and
underground stations and the design of smoke control
systems are essential to lead to safe strategy evacuation in
case of fire. To be able to design a control strategy, an
expert in fire safety needs to establish several parameters
that describe the dynamic of the smoke movement and its
impact on the occupants. To predict the movement of
smoke, fire safety engineers rely on modelling tools, such
as simple empirical models or complex CFD models
depending on the objective of the study. CFD programs are
capable of simulating a wide variety of problems related to
fluids [3-4]. Moreover, in recent years, several
mathematical models have been used to quantify
parameters of smoke in confined and semi-confined spaces.
The effects of phenomena, such as stack effect which
occurs during the exploitation of transport network were
examined [5]. Smoke extraction by roof vent in a tunnel
was numerically simulated, using CFX program and
compared with experimental results [6]. Willemann and
Sanchez, [7] discussed some of the computational modeling
techniques and analysis carried out to design a tunnel
ventilation fan plant for the New York City subway in
order to improve the safety level in the system. The study
showed how computer modeling techniques and analysis
helped the design of tunnel ventilation fan plants.
Shahcheraghi et al., [8] investigated the effect of fan
starting time on the performance of a subway station
emergency ventilation system. The method included a time
dependent fire growth within a transient computational
fluid dynamic simulation of a train fire in the subway
station.
Andersson et al., [9] investigated the single exit
underground station of Zinkensdamm in Sweden in order to
improve the evacuation in case of fire on the platform. A
smoke spreading in case of fire in a train on the platform
was visualized with the help of the CFX 4.3 program.
Kang, [10] provided models for smoke propagation and
investigated the natural and forced ventilation through
tunnels in case of fire in a subway station. Deficiency in
determining the visibility through their approach was
reported. Rie et al., [11] evaluated experimentally and
numerically the effectiveness of smoke management
systems by fans whose role is to ensure a sustainable
environment for the evacuation of users. Park et al., [12]
carried out a numerical analysis with the FDS [13] software
to examine the ventilation characteristics and the
movement of smoke in line 4 of the Suyou station in Korea.
They reported that a large extraction of smoke increases the
escape time and the level of fire safety. The effect of
platform screen doors (PSD) and ventilation on the safety
of occupants of the Seoul subway system has been
discussed through simulations with the FDS software by
Roh et al., [14]. Their conclusion reveals that when PSD
technology is used, passengers will have more time to
escape.
Despite all these studies, smoke and fire are always the
worst enemies of man in underground stations. More
studies are needed, especially in the aim to bring the
underground stations security to standards of new
technological advances. A preliminary study on the subject
was initiated. The results were quite satisfactory [15].
The purpose of the present study is to assess the level of
security in a typical subway station using FDS software for
more selected scenarios. The analysis of temperature and
velocity fields in the station is accomplished in order to
determine the most critical fire scenarios.
Numerical Security Assessment in Underground Transport Spaces in Case of Fire 47
Revue « Nature & Technologie ». A- Sciences fondamentales et Engineering, n°12/ janvier 2015. Pages 45 à 59
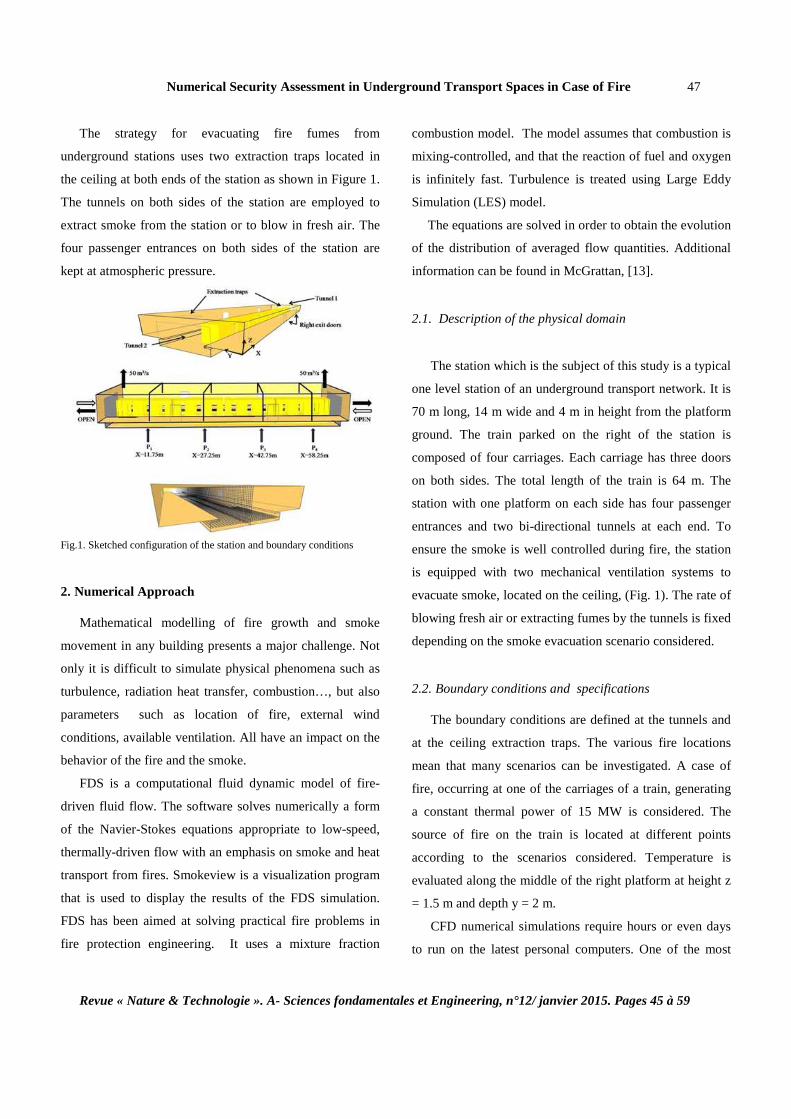
The strategy for evacuating fire fumes from
underground stations uses two extraction traps located in
the ceiling at both ends of the station as shown in Figure 1.
The tunnels on both sides of the station are employed to
extract smoke from the station or to blow in fresh air. The
four passenger entrances on both sides of the station are
kept at atmospheric pressure.
Fig.1. Sketched configuration of the station and boundary conditions
2. Numerical Approach
Mathematical modelling of fire growth and smoke
movement in any building presents a major challenge. Not
only it is difficult to simulate physical phenomena such as
turbulence, radiation heat transfer, combustion…, but also
parameters such as location of fire, external wind
conditions, available ventilation. All have an impact on the
behavior of the fire and the smoke.
FDS is a computational fluid dynamic model of fire-
driven fluid flow. The software solves numerically a form
of the Navier-Stokes equations appropriate to low-speed,
thermally-driven flow with an emphasis on smoke and heat
transport from fires. Smokeview is a visualization program
that is used to display the results of the FDS simulation.
FDS has been aimed at solving practical fire problems in
fire protection engineering. It uses a mixture fraction
combustion model. The model assumes that combustion is
mixing-controlled, and that the reaction of fuel and oxygen
is infinitely fast. Turbulence is treated using Large Eddy
Simulation (LES) model.
The equations are solved in order to obtain the evolution
of the distribution of averaged flow quantities. Additional
information can be found in McGrattan, [13].
2.1. Description of the physical domain
The station which is the subject of this study is a typical
one level station of an underground transport network. It is
70 m long, 14 m wide and 4 m in height from the platform
ground. The train parked on the right of the station is
composed of four carriages. Each carriage has three doors
on both sides. The total length of the train is 64 m. The
station with one platform on each side has four passenger
entrances and two bi-directional tunnels at each end. To
ensure the smoke is well controlled during fire, the station
is equipped with two mechanical ventilation systems to
evacuate smoke, located on the ceiling, (Fig. 1). The rate of
blowing fresh air or extracting fumes by the tunnels is fixed
depending on the smoke evacuation scenario considered.
2.2. Boundary conditions and specifications
The boundary conditions are defined at the tunnels and
at the ceiling extraction traps. The various fire locations
mean that many scenarios can be investigated. A case of
fire, occurring at one of the carriages of a train, generating
a constant thermal power of 15 MW is considered. The
source of fire on the train is located at different points
according to the scenarios considered. Temperature is
evaluated along the middle of the right platform at height z
= 1.5 m and depth y = 2 m.
CFD numerical simulations require hours or even days
to run on the latest personal computers. One of the most
Numerical Security Assessment in Underground Transport Spaces in Case of Fire
Revue « Nature & Technologie ». A- Sciences fondamentales et Engineering, n°12/ janvier 2015. Pages 45 à 59
48
significant factors influencing the computation time is the
size of the computational grid specified. It is important to
determine an appropriate grid size for a given
computational domain.
FDS simulations for selected grid sizes were performed
to highlight the effect of grid size on the estimations of the
temperature. Obtained temperature distributions were
compared. In the vicinity and the centerline of the fire the
temperature is higher when the grid sizes are fine. The
choice of the grid resolution is important for the prediction
of the temperature in the fire area.
To validate the chosen grid size with respect to the fire
area, the plume centerline temperature is determined using
a well established Heskestad’s empirical correlation [16]
and compared to FDS predicted temperatures. The
Heskestad correlation provides an estimation that is closer
to that obtained for the adopted grid size of 0.25m x 0.25m
x 0.25m.
The physical domain is then divided into three sub-
zones, meshed equally in the three directions Figure1. The
first zone, represented by the volume of the two platforms
has 250,880 cells. The second zone, represented by the
volume of the train space, has 6,720 cells, and the last zone,
the railways has 42,000 cells. The total number of meshes
is 299,600. The numerical simulation was carried out for
the whole domain. Simulation was performed up to 300s.
This is the time required to evacuate passengers safely [17].
When a mechanical smoke control is engaged, a 50 m3/s
flow rate is prescribed at each trap at the ceiling. On the
solid walls, a non-slip condition, constant temperature
(taken equal to 20 °C) and zero smoke flux are assumed.
Because the train is parked, no pulsating air movement is
considered. More data are given in Table 1.
Table 1 Boundary conditions
Size (m x m) Boundary conditions
Traps 2 x 2.5 Const. output flow rate (Q=50 m3/s)
Pass.Entr. 3 x 2.5 OPEN 1
Tunnels 7.5 x 4.5 Extracting and blowing flow rates ² 1 OPEN means that there is no condition imposed. Velocity,
temperature and pressure are those of the domain. 2 Flow rates calculated at velocity of 1, 1.5, 2, and 3 m/s.
The main objective in smoke control system analysis is
the assessment of the ability of the emergency ventilation
system to provide safe zones in the event of fire. For a
tenable environment within short periods, the air
temperature below minimum height of 1.5 m should not
exceed 40°C. NFPA 130 [17] requires less than four-
minute for platform evacuation time period and six-minute
time period for all passengers to reach safe point.
For this aim, we used in this investigation two criteria,
the area 1.5 m above the platform should be clear of smoke
and its temperature should not exceed 40°C.
To assess the smoke propagation in the station, we
simulated four scenarios. The fresh air flow rate that can be
blown in or the smoke which can be extracted out from
each tunnel is taken equal to 0, 33.375, 50, and 100 m3/s,
respectively, while the extraction from the traps is
maintained constant at 50 m3/s per trap. These correspond
to four emergency ventilation cases: (1) no ventilation
through tunnels (NVT); (2) total ventilation through tunnels
is less than that from the traps (LVT); (3) total ventilation
through tunnels is equal to that from the traps (MVT); (4)
total ventilation through tunnels is higher than that from the
traps (HVT). The ventilation imposed on tunnels can be
either extraction of smoke or blowing of fresh air.
2.3. Scenarios and nomenclature
In order to better enhance the advantages of one
ventilation strategy over another, and because of the large
Numerical Security Assessment in Underground Transport Spaces in Case of Fire 49
Revue « Nature & Technologie ». A- Sciences fondamentales et Engineering, n°12/ janvier 2015. Pages 45 à 59
number of cases simulated, we only introduce the most
representative cases. These are obtained for four main
strategies: 1) No Ventilation (NVT), 2) Low Ventilation
(LVT), 3) Moderate Ventilation (MVT), and 4) High
Ventilation (HVT).
To identify the safest fire scenarios for passengers, we
classify the results of the simulations with respect to the
average temperature measured at the transverse planes P1,
P2, P3 and P4, over a time of 300s. In order to make easier
the pinpointing of cases, we have established the following
nomenclature: each case is named case ABC, where A
represents the location of the fire in the train (A=1 means
the fire is on the surface of the carriage, A=2 means the fire
is at the tires), B represents the carriage on fire (B=1 means
the fire is located in the first carriage, B=2 means the fire is
located in the second carriage), C represents the ventilation
strategy engaged in tunnels (C=0 means no ventilation
through tunnels, C=1 means the air flow is blown in
through the two tunnels, C=2 means the air flow is blown
in through the left tunnel and smoke is extracted out
through the right tunnel, C=3 means the air flow is blown
in through the right tunnel and smoke is extracted out
through the left tunnel, C=4 means smoke is extracted out
through the two tunnels).
3. Results and Discussion
For the design of a ventilation system, for which the
worst case situation will be that of the fully developed fire,
steady simulations are performed.
Steady state regime varies according to the strategy
conditions applied. For scenarios in which the fire is the
primary source of energy, after the gas temperatures within
the computational domain reach a nearly steady state,
imposed constant heat release rate HRR should
approximately be equal to the convective heat rates, as
radiative rate is neglected. This is merely a check of the
global energy balance. For the selected scenarios, this heat
balance occurs at approximately 100s depending on the
conditions imposed. Beyond this time, smoke behavior and
gas temperature vary very slightly. The predicted results of
the temperature field and smoke propagation for 300s are
summarized for the four ventilation strategies.
3.1. Strategy 1: No ventilation (NVT)
Table 2 shows the average temperature obtained in the
middle of the right platform at 1.5 m height for four cases
investigated. The condition imposed on tunnels is (OPEN)
(i.e. no charge is specified).
Table 2 Average temperature for the strategy without ventilation by tunnels
Case Average temperature of the right platform at depth
y=2m and height h = 1.5 m (° C)
ABC P1 P2 P3 P4 110 27.0 20.7 22.0 21.4 120 21.9 32.7 28.6 21.3 210 50.8 24.9 27.2 22.4 220 29.8 41.1 41.9 22.1
In these four cases, extraction of air and smoke is made
only through traps at the ceiling with a 100 m3/s total flow
rate. The conservation of momentum in the station involves
an extra air flow through tunnels and passenger openings,
with average velocities over the range 0.5 and 1 m/s on
tunnels while it is between 1 and 1.5 m/s on passenger
openings. It can be observed from table 2 that cases 210
and 220 represent a moderate risk for passengers, because
the temperature of the smoke exceeds just slightly the
critical temperature of 40 °C. The air induced through
passenger doors, like the location of the fire at the tires
(presence of more organic material), contributes to the
strengthening of the fire which results in an increase of
temperature.
The heat generated by a fire increases the ambient air
temperature. As a result, it expands and increases in
volume. It is generally assumed that in most fires, the
Numerical Security Assessment in Underground Transport Spaces in Case of Fire
Revue « Nature & Technologie ». A- Sciences fondamentales et Engineering, n°12/ janvier 2015. Pages 45 à 59
50
volume of hot gases should at least triple compared to the
initial volume. This significant increase causes the
expulsion of other gases present at onset of the fire. This
trend continues so long as the increase of temperature is
maintained. The phenomenon of thermal expansion
explains partly the rapid spread of smoke, as well as the
lowering of the smoke layer in the station. This is followed
by a rise of the medium temperature which exceeds the
reference temperature of 40 °C. It is worth noting that,
although we imposed a smoke extraction trough traps on
the ceiling with a total output of 100 m3/ s, the reference
smoke temperature was exceeded (case 210 - P1) and (case
220 – P2 and P3).
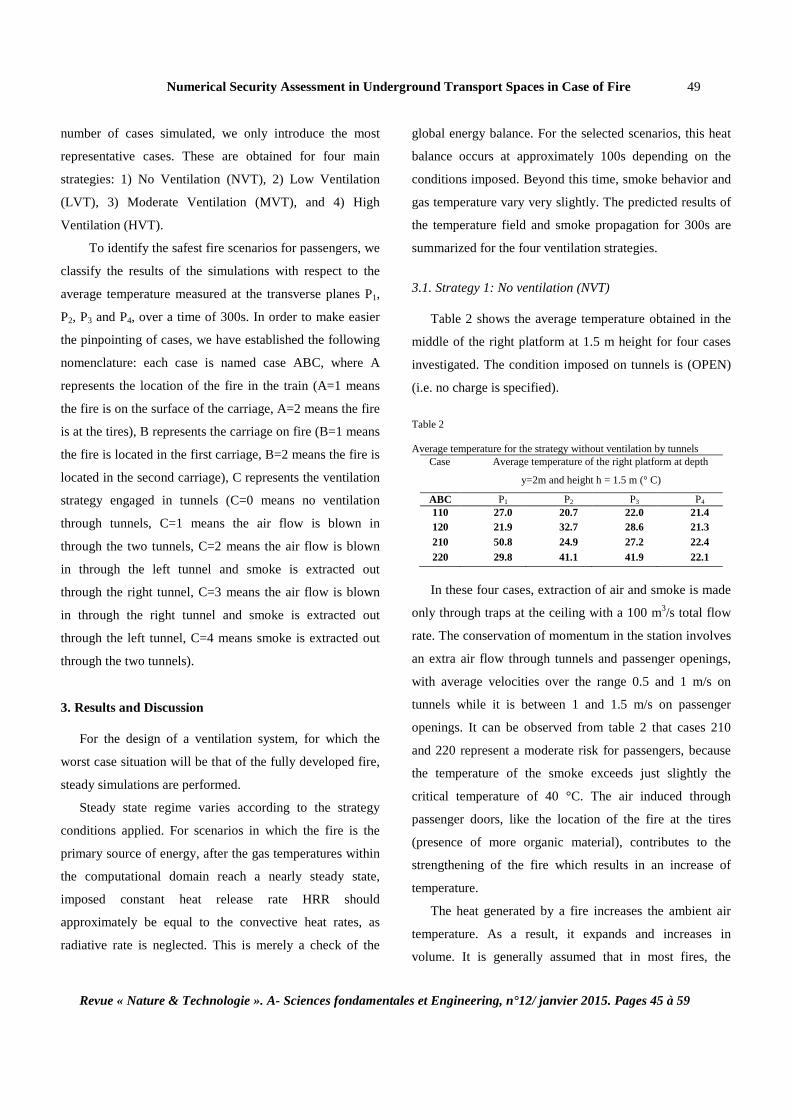
Figure 2 illustrates smoke temperature fields after 200 s
in steady state regime for cases 110 and 220. We remark
that, there is no smoke stratification at the first carriage for
case 110, and also at the 2nd and the 3rd carriage for case
220. This can be explained by the fact that, there is an
important buoyancy force and a call of fresh air through
passenger entrances. Smoke temperature fluctuations are
more marked at P1 for case 110 and at P2 for case 220.
Fig. 2. Temperature field at cross-sections P1, P2, P3 and P4
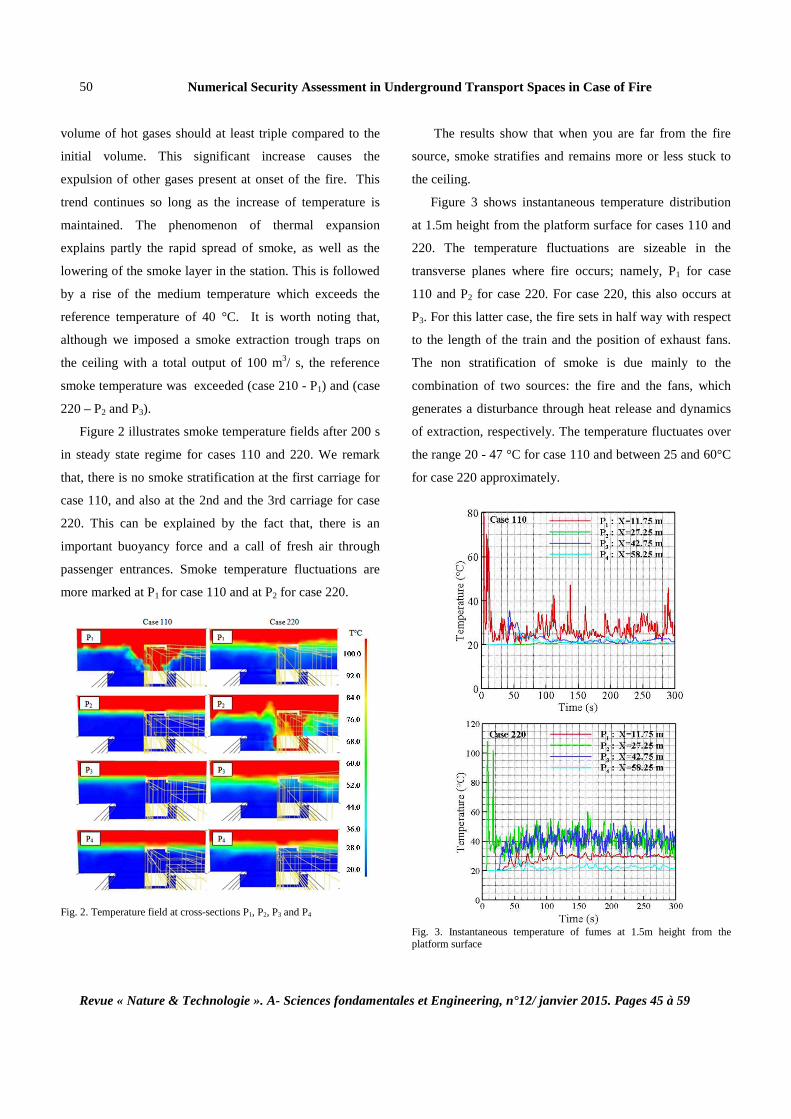
The results show that when you are far from the fire
source, smoke stratifies and remains more or less stuck to
the ceiling.
Figure 3 shows instantaneous temperature distribution
at 1.5m height from the platform surface for cases 110 and
220. The temperature fluctuations are sizeable in the
transverse planes where fire occurs; namely, P1 for case
110 and P2 for case 220. For case 220, this also occurs at
P3. For this latter case, the fire sets in half way with respect
to the length of the train and the position of exhaust fans.
The non stratification of smoke is due mainly to the
combination of two sources: the fire and the fans, which
generates a disturbance through heat release and dynamics
of extraction, respectively. The temperature fluctuates over
the range 20 - 47 °C for case 110 and between 25 and 60°C
for case 220 approximately.
Fig. 3. Instantaneous temperature of fumes at 1.5m height from the platform surface
Numerical Security Assessment in Underground Transport Spaces in Case of Fire 51
Revue « Nature & Technologie ». A- Sciences fondamentales et Engineering, n°12/ janvier 2015. Pages 45 à 59
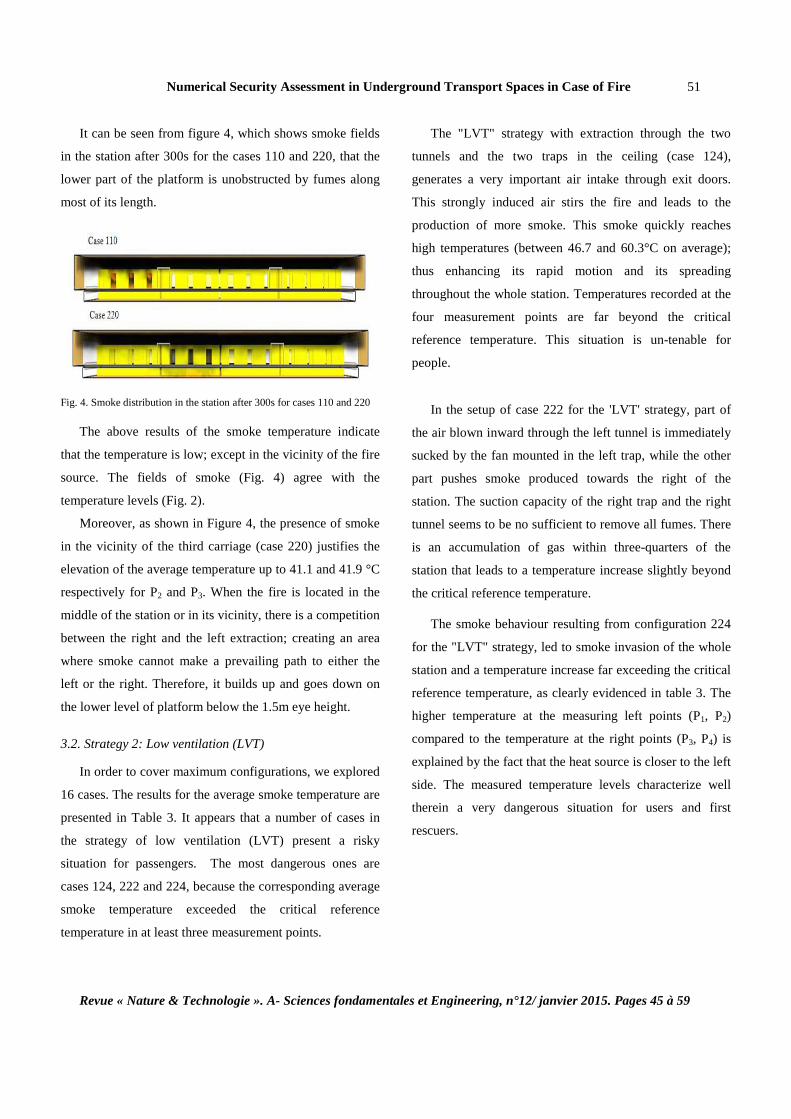
It can be seen from figure 4, which shows smoke fields
in the station after 300s for the cases 110 and 220, that the
lower part of the platform is unobstructed by fumes along
most of its length.
Fig. 4. Smoke distribution in the station after 300s for cases 110 and 220
The above results of the smoke temperature indicate
that the temperature is low; except in the vicinity of the fire
source. The fields of smoke (Fig. 4) agree with the
temperature levels (Fig. 2).
Moreover, as shown in Figure 4, the presence of smoke
in the vicinity of the third carriage (case 220) justifies the
elevation of the average temperature up to 41.1 and 41.9 °C
respectively for P2 and P3. When the fire is located in the
middle of the station or in its vicinity, there is a competition
between the right and the left extraction; creating an area
where smoke cannot make a prevailing path to either the
left or the right. Therefore, it builds up and goes down on
the lower level of platform below the 1.5m eye height.
3.2. Strategy 2: Low ventilation (LVT)
In order to cover maximum configurations, we explored
16 cases. The results for the average smoke temperature are
presented in Table 3. It appears that a number of cases in
the strategy of low ventilation (LVT) present a risky
situation for passengers. The most dangerous ones are
cases 124, 222 and 224, because the corresponding average
smoke temperature exceeded the critical reference
temperature in at least three measurement points.
The "LVT" strategy with extraction through the two
tunnels and the two traps in the ceiling (case 124),
generates a very important air intake through exit doors.
This strongly induced air stirs the fire and leads to the
production of more smoke. This smoke quickly reaches
high temperatures (between 46.7 and 60.3°C on average);
thus enhancing its rapid motion and its spreading
throughout the whole station. Temperatures recorded at the
four measurement points are far beyond the critical
reference temperature. This situation is un-tenable for
people.
In the setup of case 222 for the 'LVT' strategy, part of
the air blown inward through the left tunnel is immediately
sucked by the fan mounted in the left trap, while the other
part pushes smoke produced towards the right of the
station. The suction capacity of the right trap and the right
tunnel seems to be no sufficient to remove all fumes. There
is an accumulation of gas within three-quarters of the
station that leads to a temperature increase slightly beyond
the critical reference temperature.
The smoke behaviour resulting from configuration 224
for the "LVT" strategy, led to smoke invasion of the whole
station and a temperature increase far exceeding the critical
reference temperature, as clearly evidenced in table 3. The
higher temperature at the measuring left points (P1, P2)
compared to the temperature at the right points (P3, P4) is
explained by the fact that the heat source is closer to the left
side. The measured temperature levels characterize well
therein a very dangerous situation for users and first
rescuers.
Numerical Security Assessment in Underground Transport Spaces in Case of Fire
Revue « Nature & Technologie ». A- Sciences fondamentales et Engineering, n°12/ janvier 2015. Pages 45 à 59
52
Table 3 Average smoke temperature for the “low ventilation by the tunnels strategy (LVT)
The scenarios where the fire occurs either on the
platform surface of the train or on the tires, in the first
carriage, generate temperature distribution almost identical
regardless of the ventilation adopted. The average
temperature at the cross-section P1 is greater than the
reference temperature; except for case 111. The smoke
temperature reached 80 °C for the ventilation strategy “C =
4”. The “C = 4” ventilation strategy means an extraction
rate of the air-smoke quite important. In this strategy, the
smoke is sucked through the tunnels as well as the traps. To
this end, air is sucked through the exit doors, following a
depression created within the station. The velocity of the
sucked air can reach 5m/s. In addition to its involvement in
the stirring up of the fire, this air flow disrupts the smoke
layers. The accumulated toxic gas comes down to lower
levels and encumbers the passenger area; thus creating a
dangerous situation for users. Note that this situation is
focused only at the first wagon on the left of the station.
As it can be remarked, case 111 generates levels of
temperature below the critical reference temperature at all
cross-sections (fig. 5 and 6). The air flow rate driven
inwardly through each tunnel is less than that drawn out
through each trap. The fire on the platform of the first
carriage produces smoke that is immediately drawn out by
the fan of the left trap. Blowing air inwardly by the left
tunnel helps containment of fumes and promotes aspiration
through the left trap. The contribution of air flow through
the tunnel on the right partially maintains pressure on the
fumes that can spread to the right of the station. In
addition, part of this air is drawn out through the right trap
located near the right tunnel. This mechanism of suction
and pressure of the LVT strategy can be recommended.
Fig. 5. Temperature field in cross-sections P1, P2, P3 and P4 for case 111
Fig. 6. Instantaneous temperature at 1.5m from platform surface
Case Average temperature of the right platform at depth y=2m
and height h = 1.5 m (° C)
ABC P1 x=11.75m
m
P2 x=27.25m
P3 x=42.75m
P4 x=58.25m
111 27.7 20.9 21.8 20.7 112 47.9 26.6 22.5 30.5 113 66.5 25.3 32.5 20.4 114 82.1 25.2 27.3 31.1 121 21.6 28.1 22.5 20.8 122 21.7 38.6 31.9 43.0 123 42.3 32.5 42.0 20.3 124 58.2 59.9 60.3 46.7 211 52.0 23.9 27.9 21.1 212 58.6 32.3 24.9 36.0 213 42.1 23.7 28.3 22.5 214 63.1 24.9 22.7 21.9 221 26.9 37.1 37.5 22.2 222 28.6 43.9 45.5 48.9 223 60.3 35.1 52.8 20.7 224 49.5 79.1 69.3 46.6
Numerical Security Assessment in Underground Transport Spaces in Case of Fire 53
Revue « Nature & Technologie ». A- Sciences fondamentales et Engineering, n°12/ janvier 2015. Pages 45 à 59
Fig. 7. Smoke fields for 300s of duration for case 111 For the case 121, the same flow behaviour seems to
happen; the only difference is that the highest temperature
recorded is in the vicinity of the carriage on fire (27.7 °C
for case 111 and 28.1°C for case 121). For case 221, the
fire is located almost in the middle of the station and on the
tires. The extraction path, from the source location to the
traps in ceiling, is longer. The movement of the fumes is
slowed down by that of the air arriving from the tunnels in
the opposite direction. This air causes their accumulation
and consequently their temperature increases. The rise of
the gas temperature remains below the critical reference
temperature; this is due mainly to the strategy "LVT"
adopted. The mixing of air with fumes keeps low the
temperature.
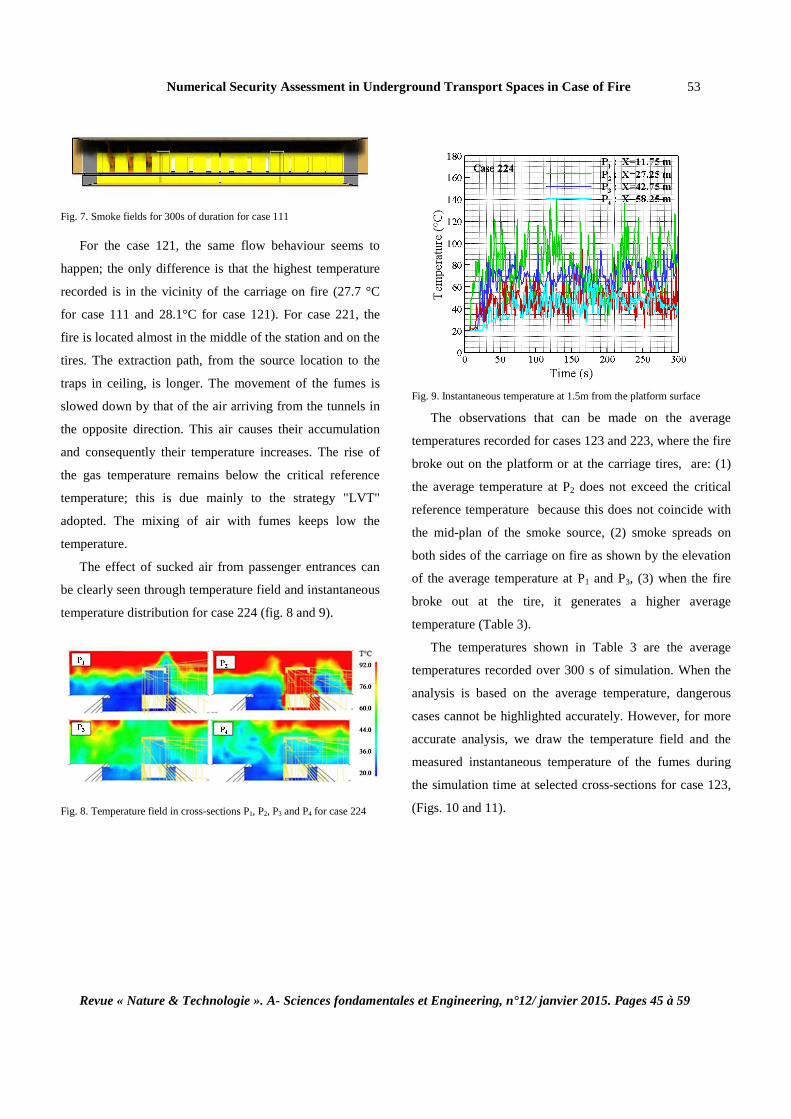
The effect of sucked air from passenger entrances can
be clearly seen through temperature field and instantaneous
temperature distribution for case 224 (fig. 8 and 9).
Fig. 8. Temperature field in cross-sections P1, P2, P3 and P4 for case 224
Fig. 9. Instantaneous temperature at 1.5m from the platform surface
The observations that can be made on the average
temperatures recorded for cases 123 and 223, where the fire
broke out on the platform or at the carriage tires, are: (1)
the average temperature at P2 does not exceed the critical
reference temperature because this does not coincide with
the mid-plan of the smoke source, (2) smoke spreads on
both sides of the carriage on fire as shown by the elevation
of the average temperature at P1 and P3, (3) when the fire
broke out at the tire, it generates a higher average
temperature (Table 3).
The temperatures shown in Table 3 are the average
temperatures recorded over 300 s of simulation. When the
analysis is based on the average temperature, dangerous
cases cannot be highlighted accurately. However, for more
accurate analysis, we draw the temperature field and the
measured instantaneous temperature of the fumes during
the simulation time at selected cross-sections for case 123,
(Figs. 10 and 11).
Numerical Security Assessment in Underground Transport Spaces in Case of Fire
Revue « Nature & Technologie ». A- Sciences fondamentales et Engineering, n°12/ janvier 2015. Pages 45 à 59
54
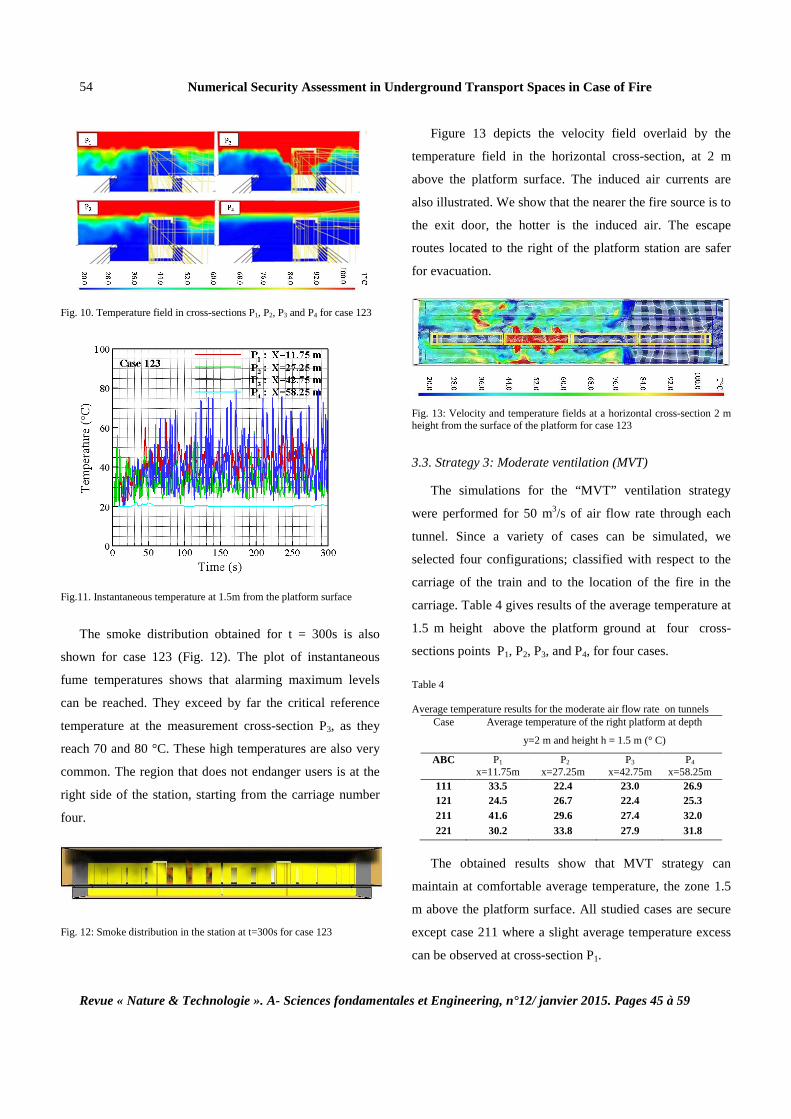
Fig. 10. Temperature field in cross-sections P1, P2, P3 and P4 for case 123
Fig.11. Instantaneous temperature at 1.5m from the platform surface
The smoke distribution obtained for t = 300s is also
shown for case 123 (Fig. 12). The plot of instantaneous
fume temperatures shows that alarming maximum levels
can be reached. They exceed by far the critical reference
temperature at the measurement cross-section P3, as they
reach 70 and 80 °C. These high temperatures are also very
common. The region that does not endanger users is at the
right side of the station, starting from the carriage number
four.
Fig. 12: Smoke distribution in the station at t=300s for case 123
Figure 13 depicts the velocity field overlaid by the
temperature field in the horizontal cross-section, at 2 m
above the platform surface. The induced air currents are
also illustrated. We show that the nearer the fire source is to
the exit door, the hotter is the induced air. The escape
routes located to the right of the platform station are safer
for evacuation.
Fig. 13: Velocity and temperature fields at a horizontal cross-section 2 m height from the surface of the platform for case 123 3.3. Strategy 3: Moderate ventilation (MVT)
The simulations for the “MVT” ventilation strategy
were performed for 50 m3/s of air flow rate through each
tunnel. Since a variety of cases can be simulated, we
selected four configurations; classified with respect to the
carriage of the train and to the location of the fire in the
carriage. Table 4 gives results of the average temperature at
1.5 m height above the platform ground at four cross-
sections points P1, P2, P3, and P4, for four cases.
Table 4 Average temperature results for the moderate air flow rate on tunnels
Case Average temperature of the right platform at depth
y=2 m and height h = 1.5 m (° C)
ABC P1 x=11.75m
P2 x=27.25m
P3 x=42.75m
P4 x=58.25m
111 33.5 22.4 23.0 26.9 121 24.5 26.7 22.4 25.3 211 41.6 29.6 27.4 32.0 221 30.2 33.8 27.9 31.8
The obtained results show that MVT strategy can
maintain at comfortable average temperature, the zone 1.5
m above the platform surface. All studied cases are secure
except case 211 where a slight average temperature excess
can be observed at cross-section P1.
Numerical Security Assessment in Underground Transport Spaces in Case of Fire 55
Revue « Nature & Technologie ». A- Sciences fondamentales et Engineering, n°12/ janvier 2015. Pages 45 à 59
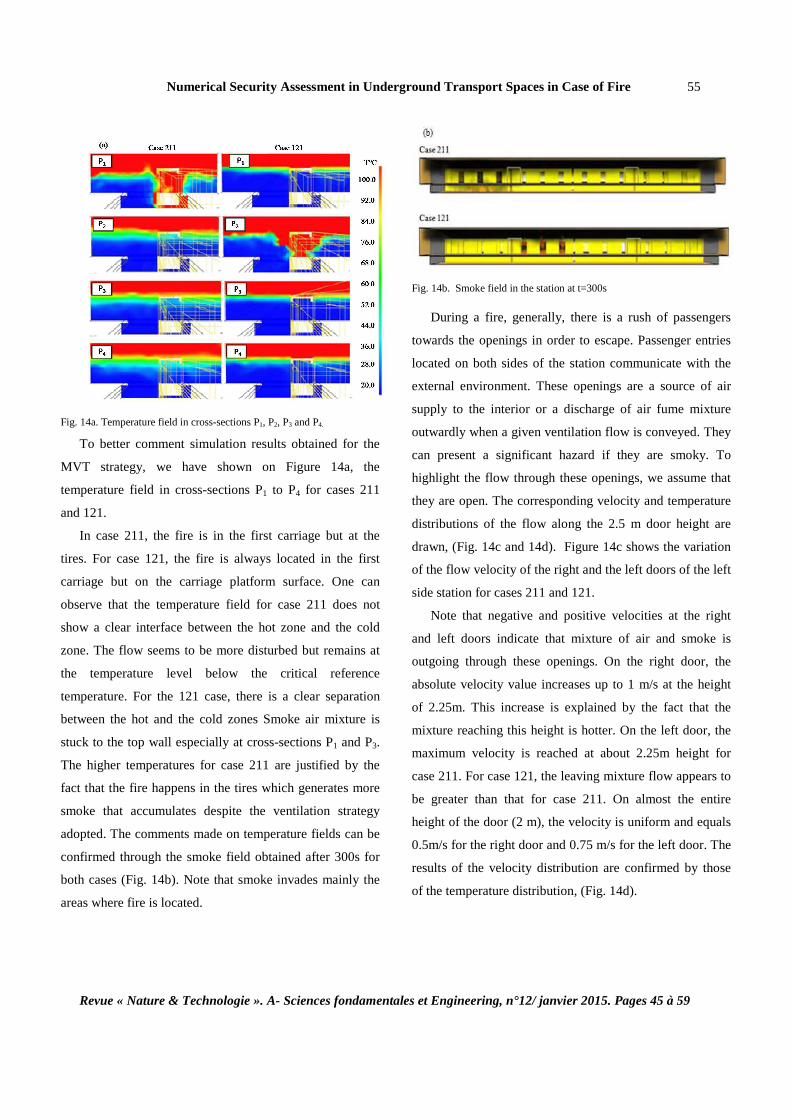
Fig. 14a. Temperature field in cross-sections P1, P2, P3 and P4.
To better comment simulation results obtained for the
MVT strategy, we have shown on Figure 14a, the
temperature field in cross-sections P1 to P4 for cases 211
and 121.
In case 211, the fire is in the first carriage but at the
tires. For case 121, the fire is always located in the first
carriage but on the carriage platform surface. One can
observe that the temperature field for case 211 does not
show a clear interface between the hot zone and the cold
zone. The flow seems to be more disturbed but remains at
the temperature level below the critical reference
temperature. For the 121 case, there is a clear separation
between the hot and the cold zones Smoke air mixture is
stuck to the top wall especially at cross-sections P1 and P3.
The higher temperatures for case 211 are justified by the
fact that the fire happens in the tires which generates more
smoke that accumulates despite the ventilation strategy
adopted. The comments made on temperature fields can be
confirmed through the smoke field obtained after 300s for
both cases (Fig. 14b). Note that smoke invades mainly the
areas where fire is located.
Fig. 14b. Smoke field in the station at t=300s
During a fire, generally, there is a rush of passengers
towards the openings in order to escape. Passenger entries
located on both sides of the station communicate with the
external environment. These openings are a source of air
supply to the interior or a discharge of air fume mixture
outwardly when a given ventilation flow is conveyed. They
can present a significant hazard if they are smoky. To
highlight the flow through these openings, we assume that
they are open. The corresponding velocity and temperature
distributions of the flow along the 2.5 m door height are
drawn, (Fig. 14c and 14d). Figure 14c shows the variation
of the flow velocity of the right and the left doors of the left
side station for cases 211 and 121.
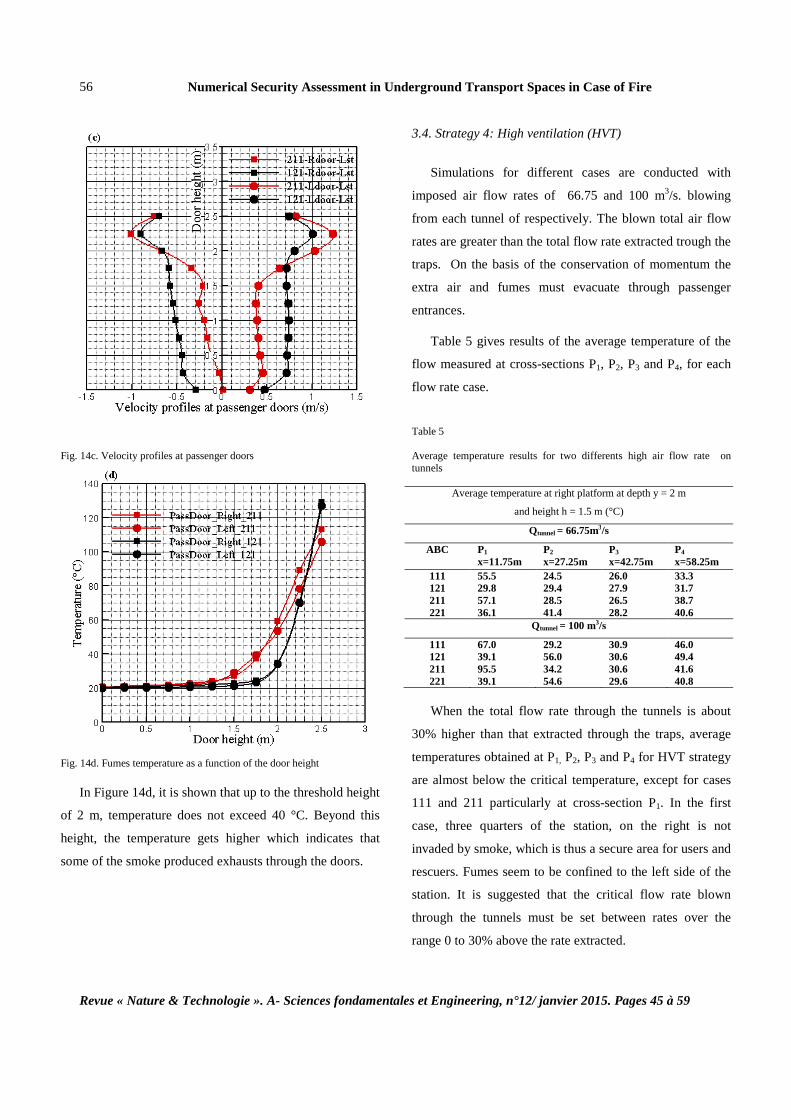
Note that negative and positive velocities at the right
and left doors indicate that mixture of air and smoke is
outgoing through these openings. On the right door, the
absolute velocity value increases up to 1 m/s at the height
of 2.25m. This increase is explained by the fact that the
mixture reaching this height is hotter. On the left door, the
maximum velocity is reached at about 2.25m height for
case 211. For case 121, the leaving mixture flow appears to
be greater than that for case 211. On almost the entire
height of the door (2 m), the velocity is uniform and equals
0.5m/s for the right door and 0.75 m/s for the left door. The
results of the velocity distribution are confirmed by those
of the temperature distribution, (Fig. 14d).
Numerical Security Assessment in Underground Transport Spaces in Case of Fire
Revue « Nature & Technologie ». A- Sciences fondamentales et Engineering, n°12/ janvier 2015. Pages 45 à 59
56
Fig. 14c. Velocity profiles at passenger doors
Fig. 14d. Fumes temperature as a function of the door height
In Figure 14d, it is shown that up to the threshold height
of 2 m, temperature does not exceed 40 °C. Beyond this
height, the temperature gets higher which indicates that
some of the smoke produced exhausts through the doors.
3.4. Strategy 4: High ventilation (HVT)
Simulations for different cases are conducted with
imposed air flow rates of 66.75 and 100 m3/s. blowing
from each tunnel of respectively. The blown total air flow
rates are greater than the total flow rate extracted trough the
traps. On the basis of the conservation of momentum the
extra air and fumes must evacuate through passenger
entrances.
Table 5 gives results of the average temperature of the
flow measured at cross-sections P1, P2, P3 and P4, for each
flow rate case.
Table 5 Average temperature results for two differents high air flow rate on tunnels
Average temperature at right platform at depth y = 2 m
and height h = 1.5 m (°C)
Qtunnel = 66.75m3/s
ABC P1 x=11.75m
P2 x=27.25m
P3 x=42.75m
P4 x=58.25m
111 55.5 24.5 26.0 33.3 121 29.8 29.4 27.9 31.7 211 57.1 28.5 26.5 38.7 221 36.1 41.4 28.2 40.6
Qtunnel = 100 m3/s
111 67.0 29.2 30.9 46.0 121 39.1 56.0 30.6 49.4 211 95.5 34.2 30.6 41.6 221 39.1 54.6 29.6 40.8 When the total flow rate through the tunnels is about
30% higher than that extracted through the traps, average
temperatures obtained at P1, P2, P3 and P4 for HVT strategy
are almost below the critical temperature, except for cases
111 and 211 particularly at cross-section P1. In the first
case, three quarters of the station, on the right is not
invaded by smoke, which is thus a secure area for users and
rescuers. Fumes seem to be confined to the left side of the
station. It is suggested that the critical flow rate blown
through the tunnels must be set between rates over the
range 0 to 30% above the rate extracted.
Numerical Security Assessment in Underground Transport Spaces in Case of Fire 57
Revue « Nature & Technologie ». A- Sciences fondamentales et Engineering, n°12/ janvier 2015. Pages 45 à 59
When the flow rate is doubled, the averaged
temperatures are well above the critical reference
temperature, which involves unbearable situations.
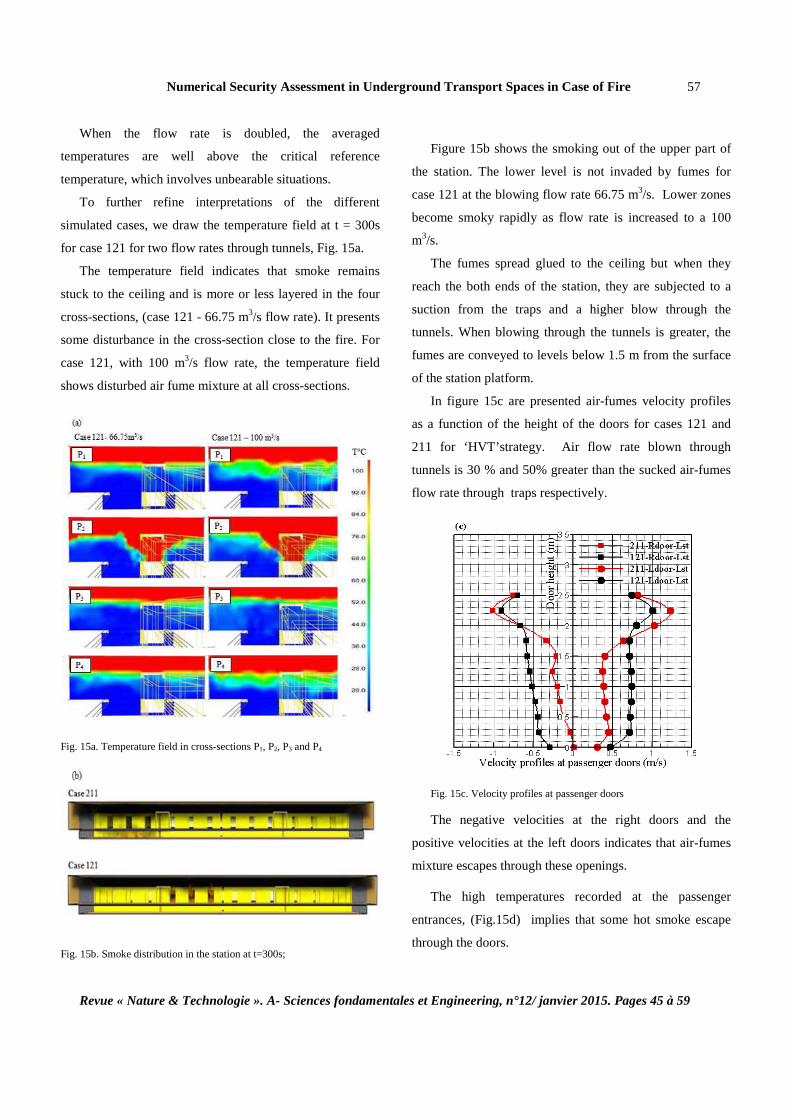
To further refine interpretations of the different
simulated cases, we draw the temperature field at t = 300s
for case 121 for two flow rates through tunnels, Fig. 15a.
The temperature field indicates that smoke remains
stuck to the ceiling and is more or less layered in the four
cross-sections, (case 121 - 66.75 m3/s flow rate). It presents
some disturbance in the cross-section close to the fire. For
case 121, with 100 m3/s flow rate, the temperature field
shows disturbed air fume mixture at all cross-sections.
Fig. 15a. Temperature field in cross-sections P1, P2, P3 and P4
Fig. 15b. Smoke distribution in the station at t=300s;
Figure 15b shows the smoking out of the upper part of
the station. The lower level is not invaded by fumes for
case 121 at the blowing flow rate 66.75 m3/s. Lower zones
become smoky rapidly as flow rate is increased to a 100
m3/s.
The fumes spread glued to the ceiling but when they
reach the both ends of the station, they are subjected to a
suction from the traps and a higher blow through the
tunnels. When blowing through the tunnels is greater, the
fumes are conveyed to levels below 1.5 m from the surface
of the station platform.
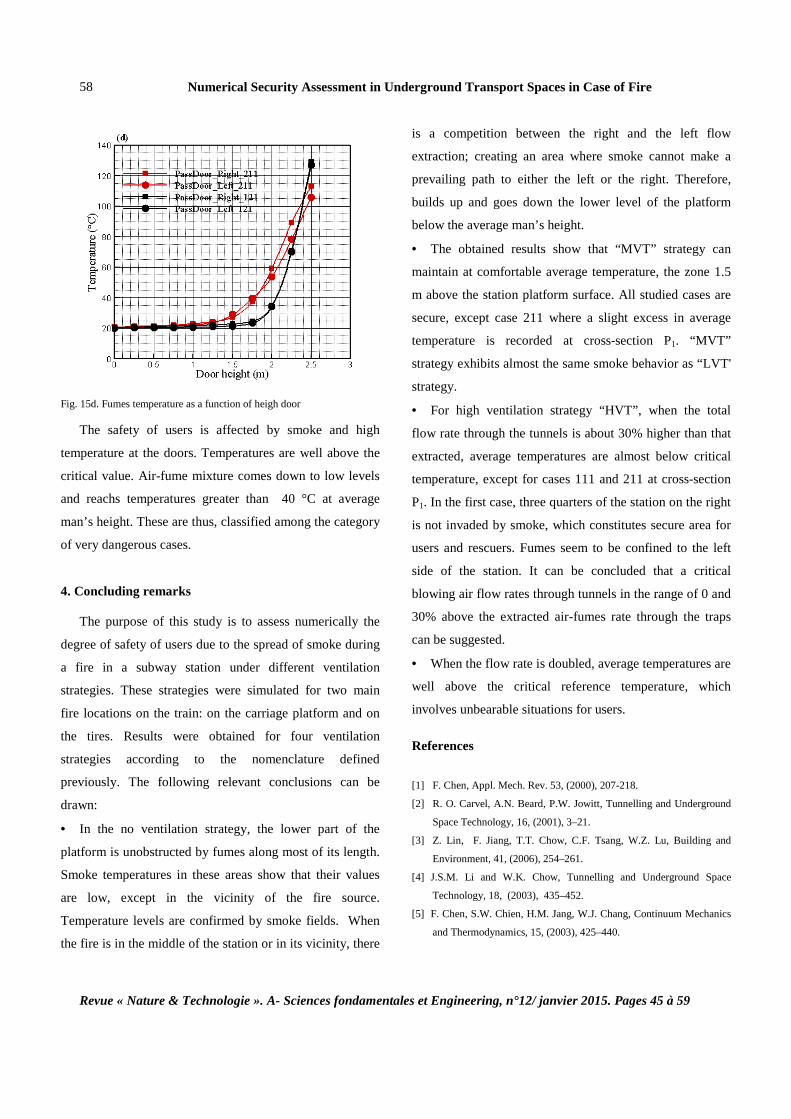
In figure 15c are presented air-fumes velocity profiles
as a function of the height of the doors for cases 121 and
211 for ‘HVT’strategy. Air flow rate blown through
tunnels is 30 % and 50% greater than the sucked air-fumes
flow rate through traps respectively.
Fig. 15c. Velocity profiles at passenger doors
The negative velocities at the right doors and the
positive velocities at the left doors indicates that air-fumes
mixture escapes through these openings.
The high temperatures recorded at the passenger
entrances, (Fig.15d) implies that some hot smoke escape
through the doors.
Numerical Security Assessment in Underground Transport Spaces in Case of Fire
Revue « Nature & Technologie ». A- Sciences fondamentales et Engineering, n°12/ janvier 2015. Pages 45 à 59
58
Fig. 15d. Fumes temperature as a function of heigh door
The safety of users is affected by smoke and high
temperature at the doors. Temperatures are well above the
critical value. Air-fume mixture comes down to low levels
and reachs temperatures greater than 40 °C at average
man’s height. These are thus, classified among the category
of very dangerous cases.
4. Concluding remarks
The purpose of this study is to assess numerically the
degree of safety of users due to the spread of smoke during
a fire in a subway station under different ventilation
strategies. These strategies were simulated for two main
fire locations on the train: on the carriage platform and on
the tires. Results were obtained for four ventilation
strategies according to the nomenclature defined
previously. The following relevant conclusions can be
drawn:
• In the no ventilation strategy, the lower part of the
platform is unobstructed by fumes along most of its length.
Smoke temperatures in these areas show that their values
are low, except in the vicinity of the fire source.
Temperature levels are confirmed by smoke fields. When
the fire is in the middle of the station or in its vicinity, there
is a competition between the right and the left flow
extraction; creating an area where smoke cannot make a
prevailing path to either the left or the right. Therefore,
builds up and goes down the lower level of the platform
below the average man’s height.
• The obtained results show that “MVT” strategy can
maintain at comfortable average temperature, the zone 1.5
m above the station platform surface. All studied cases are
secure, except case 211 where a slight excess in average
temperature is recorded at cross-section P1. “MVT”
strategy exhibits almost the same smoke behavior as “LVT'
strategy.
• For high ventilation strategy “HVT”, when the total
flow rate through the tunnels is about 30% higher than that
extracted, average temperatures are almost below critical
temperature, except for cases 111 and 211 at cross-section
P1. In the first case, three quarters of the station on the right
is not invaded by smoke, which constitutes secure area for
users and rescuers. Fumes seem to be confined to the left
side of the station. It can be concluded that a critical
blowing air flow rates through tunnels in the range of 0 and
30% above the extracted air-fumes rate through the traps
can be suggested.
• When the flow rate is doubled, average temperatures are
well above the critical reference temperature, which
involves unbearable situations for users.
References
[1] F. Chen, Appl. Mech. Rev. 53, (2000), 207-218.
[2] R. O. Carvel, A.N. Beard, P.W. Jowitt, Tunnelling and Underground
Space Technology, 16, (2001), 3–21.
[3] Z. Lin, F. Jiang, T.T. Chow, C.F. Tsang, W.Z. Lu, Building and
Environment, 41, (2006), 254–261.
[4] J.S.M. Li and W.K. Chow, Tunnelling and Underground Space
Technology, 18, (2003), 435–452.
[5] F. Chen, S.W. Chien, H.M. Jang, W.J. Chang, Continuum Mechanics
and Thermodynamics, 15, (2003), 425–440.
Numerical Security Assessment in Underground Transport Spaces in Case of Fire 59
Revue « Nature & Technologie ». A- Sciences fondamentales et Engineering, n°12/ janvier 2015. Pages 45 à 59
[6] B. Ribot, P. Chasse, Proc. of the first international conf. on tunnel
fires and one day seminar on escape from tunnels, Lyon, France,
(1999), 169–179.
[7] D. Willemann, J.G. Sanchez, Proc. of the ASME/IEEE, Joint Railraod
Conference, (2002), 73-80.
[8] N. Shahcheraghi, D. McKinney, P. Miclea, Tunnel Fires 4th
International Conference, 2-4, (2002).
[9] M. Andersson, B. Hedskog, H. Nyman, Tunnel Fires 4th International
Conference, 2-4, (2002).
[10] K. Kang, Fire Safety Journal, 42, (2007), 218–231.
[11] D.H. Rie, M.W. Hwang, S.J. S.W. KimYoon, J.W. Ko, H.Y. Kim,
Tunnelling and Underground Space Technology. 21, (2006), 300–
301.
[12] W.H. Park, D.H. Kim, H.C. Chang, Tunnelling and Underground
Space Technology, 21, (2006), 304.
[13] K. McGrattan,. Fire Dynamics Simulator (Version 4), Technical
Reference Guide, (2006), National Institute of Standard Technology.
[14] J. S. Roh, S.R. Hong, H.P. Won, J.J. Yong, Tunnelling and
Underground Space Technology. 24, (2009), 447-453.
[15] M. Hadj Nacer, B. Benkoussas, A. Bouhdjar, O. Vauquelin, Ph.
Bournot, ‘Etude Numérique de la Propagation des Fumées et du
Désenfumage dans une Station de Métro en cas d’un Incendie’
Congres Algérien de Mécanique (CAM), 23-26/11, Biskra, Algérie,
(2009).
[16] G. Heskestad, ‘Fire Plumes’, SFPE Handbook of Fire Protection
Engineering, 2nd National Fire Protection Association, Quincy, MA,
1995.
[17] NFPA 130-Standard for Fixed Guide way Transit System, National
Fire Protection Association. Edition (2010).


![Underground Operating Licence · underground spaces used or occupied at the date of this Licence in connection with the winning, working or getting of Coal from the Specified Seam[s]](https://img.pdfslide.net/doc/110x75/6032311eeaba514f1c72e6b2/underground-operating-licence-underground-spaces-used-or-occupied-at-the-date-of.jpg)