Embed Size (px)
Citation preview
Department of Applied Mechanics CHALMERS UNIVERSITY OF TECHNOLOGY Gothenburg, Sweden 2017
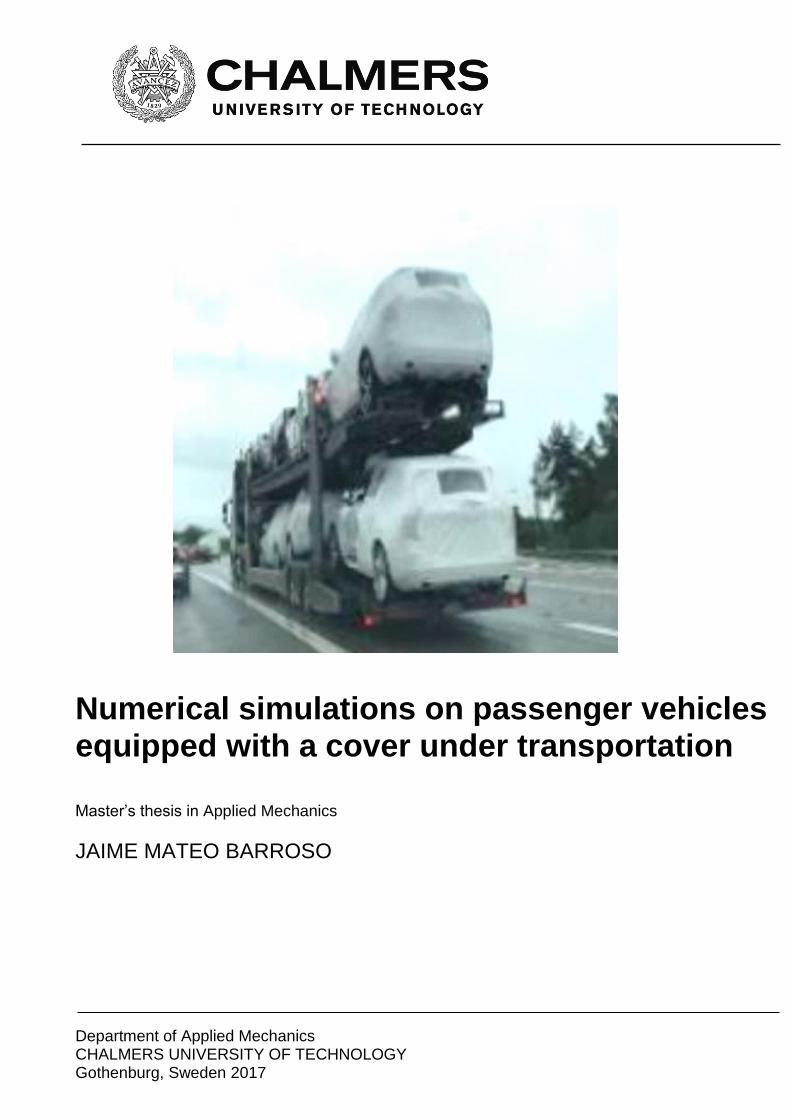
Numerical simulations on passenger vehicles equipped with a cover under transportation Master’s thesis in Applied Mechanics
JAIME MATEO BARROSO

MASTER’S THESIS IN AUTOMOTIVE ENGINEERING
Numerical simulations on passenger vehicles equipped
with a cover under transportation
JAIME MATEO BARROSO
Department of Applied Mechanics
Division of Vehicle Engineering and Autonomous Systems
CHALMERS UNIVERSITY OF TECHNOLOGY
Göteborg, Sweden 2017
Numerical simulations on passenger vehicles equipped with a cover under
transportation
JAIME MATEO BARROSO
© JAIME MATEO BARROSO, 2017
Master’s Thesis 2017:43
ISSN 1652-8557
Department of Applied Mechanics
Division of Vehicle Engineering and Autonomous Systems
Chalmers University of Technology
SE-412 96 Göteborg
Sweden
Telephone: + 46 (0)31-772 1000
Cover:
Illustration of passenger vehicles equipped with a cover under transportation
Chalmers Reproservice
Göteborg, Sweden 2017
i
Numerical simulations on passenger vehicles equipped with a cover under transportation
Master’s thesis in Automotive Engineering
JAIME MATEO BARROSO
Department of Applied Mechanics
Division of Vehicle Engineering and Autonomous Systems
Chalmers University of Technology
Abstract
The concern of the car companies to offer an image of quality to their clients has led to
take care of every single detail. An example of this, is that newly produced cars are now
being covered during their transportation on trucks. The design of the covers involve
several wind tunnel tests for each new car model. This has high cost in time and resources.
The aim of this work is trying to develop the first step on a procedure to conduct numerical
simulations to extract the information needed to optimise the design process and reduce
the number of tests in the wind tunnel. The cover is a deformable material and its
behaviour can be compared to sails. The behaviour of sails under up-wind conditions has
been studied over the last years and some parts of its method can be applied to the current
work. The study is performed on the generic model DrivAer, which is an open source
model especifically created for aerodynamic studies. The process consists in simulating
three different cases on which a variation on the cover geometry is applied, starting from
the car model itself and applying successive modifications to generate a more realistic
model. The first simulation is thus the model itself and the results obtained are used for
the next case, in which a wrapping is applied to the car, to resemble the uneven surface
of the cover. The third case consists on generating a geometry that resembles the cover
alone, by means of morphing the original model. The last case allows to simulate two
geometries at the same time (cover and vehicle) and the flow in between. On the first two
cases only the pressure on the outer surface is obtained, whereas on the third case the
pressure is obtained on the outer and inner surfaces of the cover. The results obtained
from the wall shear stress made clear that the next step should be a structural analysis to
find the actual stress on the cover. Finding the pressure difference on the surfaces of the
cover (in the third case) is essential to perform the structural analysis and with that, predict
the deformation and stress.
Key words: DrivAer, CFD, ANSA, Star-CCM+, aeroelastic analysis, car covers.

ii
iii
Acknowledgments
I would like to thank my supervisor Lennert Sterken, for giving me the great opportunitty
of participating in the development of such new and interesting idea, showing me new
ways where engineering work can be applied, and for the support throughout the project.
I would also like to express my gratitude to my examiner and supervisor Simone Sebben,
her support and guidance through the development of the work and her advice have both
been of great importance during the whole project.
The support of Volvo Car Group in the development of the work has also been essential
with special mention to Daniel Karjalainen.
I do not finish without mentioning the support of the department Vehicle Engineering and
Autonomous Systems at Chalmers, especially to the PhD students that have helped me
throughout my work all these months.
Finally, thanks to my family and friends for their constant support and for giving me the
opportunity of sharing my success with them during these years.

iv
v
Contents
Abstract ..................................................................................................................... i
Acknowledgments .................................................................................................. iii
Contents ................................................................................................................... v
Figures .................................................................................................................... vii
1 Introduction ...................................................................................................... 1
1.1 Objective ..................................................................................................... 1
1.2 Limitations .................................................................................................. 1
1.3 Method ........................................................................................................ 1
2 Background ...................................................................................................... 2
3 Methodology ..................................................................................................... 3
3.1 Description of the cover ............................................................................. 4
3.2 The model: DrivAer.................................................................................... 5
3.3 Case 1: Baseline ......................................................................................... 7
3.3.1 Geometry preparation .......................................................................... 7
3.3.2 Volume mesh....................................................................................... 7
3.3.3 Simulation ........................................................................................... 9
3.4 Case 2: Wrapped model ............................................................................ 10
3.4.1 Geometry preparation ........................................................................ 10
3.4.2 Volume mesh..................................................................................... 13
3.5 Case 3: Morphed model ............................................................................ 14
3.5.1 Geometry preparation ........................................................................ 14
3.5.2 Volume Mesh .................................................................................... 22
4 Results ............................................................................................................. 24
4.1 Pressure ..................................................................................................... 24
4.2 Wall shear stress ....................................................................................... 29
5 Conclusions ..................................................................................................... 38
5.1 Further development ................................................................................. 39
6 References ....................................................................................................... 40
A Mesh generation: Baseline ............................................................................ 41
B Mesh generation: Morphed model ............................................................... 42
C Material specifications ................................................................................... 43

vi
vii
Figures
Figure 3.1: Example of two vehicles equipped with a cover – courtesy of VCC. .... 4
Figure 3.2: DrivAer model | Notchback. ................................................................... 5
Figure 3.3: Configurations of the DrivAer Model. ................................................... 6
Figure 3.4: Baseline model: DrivAer | Notchback | Smooth underbody. ................. 7
Figure 3.5: Standard dimensions of the density box in CFD simulations on Star-
CCM+. .............................................................................................................................. 8
Figure 3.6: Tunnel and density box in Star-CCM+. ................................................. 8
Figure 3.7: Tyre tread generated with a subtract operation in Star-CCM+. ............. 8
Figure 3.8: Volume mesh of the baseline model on y=0 plane. ............................... 9
Figure 3.9: Detail eliminated on the hood before the wrap. ................................... 10
Figure 3.10: Details eliminated on the side of the car before the wrap. ................. 11
Figure 3.11: Stagnation area with smoother wrapping parameters. ........................ 12
Figure 3.12: Different wrap applied on mirrors. ..................................................... 12
Figure 3.13: Two previous wrappings before final wrap. ....................................... 13
Figure 3.14: Case 2: Wrapped model...................................................................... 13
Figure 3.15: Morphing boxes and direction of morphing. ...................................... 15
Figure 3.16: Deformation range – 1st morphing. .................................................... 15
Figure 3.17: Split morphing boxes for second morphing. ...................................... 16
Figure 3.18: Deformation range – 2nd morphing. ................................................... 16
Figure 3.19: Final wrap (transparent black) over original mirror (grey). ............... 17
Figure 3.20: Intersection on the windshield after the subtract operation in Star-
CCM+. ............................................................................................................................ 18
Figure 3.21: Model of the cover in its initial position. ........................................... 19
Figure 3.22: Cover (transparent blue) and baseline (grey). .................................... 20
Figure 3.23: Morphing boxes to generate bubble shape on the roof. ..................... 21
Figure 3.24: Model of the cover when subjected to a flow. ................................... 22
Figure 3.25: Wrap on the model of the cover in ANSA. ........................................ 22
Figure 3.26: Mesh of the case 3.2 (cover with bubbles of air). .............................. 23
Figure 3.27: Detail of the mesh of the case 3.2 (cover with bubbles of air). .......... 23
Figure 4.1: Cp on case 1: Baseline (left) and case 2: Wrapped model (right). ........ 24
Figure 4.2: Cp on case 3: Baseline + morphed cover. ............................................. 26
Figure 4.3: Cp on case 3.2 (cover with bubbles) – detail of the wheelhouse. ......... 27
Figure 4.4: Cp on Case 1: Baseline – frontal configuration. ................................... 28
Figure 4.5: Cp on Case 1: Baseline – reverse configuration (100 km/h). ............... 28
Figure 4.6: Skin friction coefficient – Case 1: Baseline (up), Case 2: Wrapped model
(down). ............................................................................................................................ 29
Figure 4.7: Skin friction coefficient – Case 3: Baseline + morphed cover. ............ 30
Figure 4.8: Wall shear stress – vector representation. ............................................ 31
Figure 4.9: Components of the wall shear stress on the mirror. ............................. 32
Figure 4.10: Skin friction coefficient – Case 1: Baseline | different configurations.
........................................................................................................................................ 34
Figure 4.11: Wall shear stress vector on mirror – Case 1: Baseline. ...................... 35
viii
Figure 4.12: Wall shear stress vector on the body – Case 1: Baseline. .................. 36
1
1 Introduction
The interest of the car brands to focus on the customers and offer them a product of
quality that fulfills all the expectations, has led to pay attention to every detail. The image
of quality of the brand is as important as the quality itself. For these reasons, premium car
brands are now setting a cover over the newly produced vehicles. This way, the vehicles
are protected in their transportation from the factory to the dealers, preventing damage or
dirt on the materials and paint.
The covers are unique for each car model type since they have to fit perfectly the
shape of the vehicle. In the design of every new cover, several tests on the wind tunnel
are carried out, trying to simulate the conditions that the car will experience when is being
transported on a truck. After each test, modifications are implemented on the cover design
and the fixations until a successful test is accomplished (the cover has not been ripped
nor got loose). The wind tunnel tests have a high cost of time and resources (i.e. energy),
so that any measure that can lead to a reduction in the number of tests that need to be
performed, would result in a visible increase of the efficiency of the process, affecting to
the whole chain of production. In this point, the aim of this project comes up: try to reduce
the number of tests needed, by predicting some of the issues found during the tests by
means of numerical simulations.
1.1 Objective
The numerical simulations performed in this work tried to emulate the conditions
and configuration of the wind tunnel tests. Thus, the first step taken, was to establish an
efficient but robust CFD procedure that resembled the actual tests. For this purpose, the
DrivAer model [1] and different modifications of it were used.
The results obtained from the numerical simulations were compared to those
experienced in the wind tunnel tests in order to establish a correlation between them.
Special attention was paid to the areas that are usually the source of failure.
1.2 Limitations
Since this problem is relatively new for the car industry, no previous publications on
this matter could be found. The complexity of the question makes the scope of this work
to be a first step in a longer line of investigation. The main limitation is the impossibility
of simulating a material that is being deformed during the simulation by the action of a
fluid (fluid-structure interaction). Another complexity, is the effect of the clips and
fixations used in the actual vehicles, since the software cannot differentiate between a
rigid and a deformable material (all materials are considered rigids).
1.3 Method
The method followed consisted in a pre-treatment of the model in ANSA. The model
was then imported into the CFD solver Star-CCM+ to proceed with the mesh generation,
the numerical simulations and the post-processing.
2
2 Background
The study of the covers on passenger vehicles is relatively new, but some research
has been developed on numerical simulations with sails. Since there is a similarity
between the covers and the sails (deformable material) it is therefore a good idea to look
on the methods used in that field to get a deeper understanding of the problem, the line of
development followed and its limitations.
The sails are considered a membrane structure, meaning that they cannot hold
moments and perpendicular forces. When one of those are applied to the material, it
deforms until it reaches an equilibrium.
It is stated that “The sail shape determines the pressure distribution and, at the same
time, the pressure distribution on the sail stretches and flexes the sail material determining
its shape.” [2]
For that reason, an aeroelastic analysis needs to be carried out. This analysis consists
on a series of steps following an iterative process:
1. Generation of the model with an initial shape of the sail.
2. Aerodynamic analysis: a simulation is run with the previous configuration to
calculate the loads (pressure).
3. Structural analysis: the deformation (new sail-shape) and stress distribution of
the sail is obtained by applying the calculated loads.
The process is repeated until an equilibrium is reached (slight difference in
deformation and stress between one step and another).
This process implements a variation of the Vortex Lattice Method (VLM) [3]. The
Vortex Lattice Method consist on a panel method of CFD study rather than a volume
method.
The aim of this work was to develop the first part of this process, the aerodynamic
analysis. Future work should get a closer look to the methods to perform the structural
analysis.
It is important to remark that the tendency is that more and more premium car brands
are adding to the practice of covering the vehicles during the transportation. All of these
companies will have to deal with the problem presented so it is expected that more
research will be published on this matter.
3
3 Methodology
As it was mentioned before, the main purpose of this work is to develop a procedure
to carry out numerical simulations of passenger vehicles equipped with a cover. For that
reason, no special attention was paid to the CFD simulations methodology, therefore the
steps followed were the usual: geometry preparation, volume meshing, simulation and
post-processing. To achieve a resemblance between the simulations and the actual tests
the focus was on the geometry preparation and the mesh generation.
In comparison with the sails numerical simulations approach, it should be noted that
while the sails are directly exposed to the wind on both sides of them, the cover of a car
is exposed to the wind just on one of the surfaces having the other surface facing the
vehicle. Even though it is known from experience that there exists an air flow between
the cover and the car, this is not a free flow (atmospheric pressure on both sides). Another
big difference between the sails and the covers are the fixations and shape of them. The
sails have less restrictions (fixations) allowing that to have a more uniform pressure
distribution and a gradual deformation. This is not the case of the covers on which the
pressure distribution depends on the part of the vehicle considered, and the deformation
depends on the fixations implemented. For all these reasons, the method employed for
the aerodynamic analysis varies from the one used for sails.
On the process followed, first, it was needed to know the object of study, the cover
and its layout on the vehicle, and the model on which the work was going to be based on,
the DrivAer model. The model will be discussed in more detail in section 3.2.
Once all the information needed was collected, the work on the model began.
Different cases were analysed, starting from a basic shape of the model and progressing
to more realistic ones. In the beginning a baseline of the DrivAer model was selected and
the following geometries were based on it. In the second case, a wrapping was applied to
the baseline in order to make a rough surface imitating the surface of the cover. The final
case consisted of the creation of the cover as a geometry apart by morphing the baseline
model. The software used to carry out the geometry preparation is ANSA.
Following the geometry definition, the volume meshing, simulation and post-
processing were executed with the commercial software Star-CCM+. The simulation
conditions were the same for the different cases although some different operations were
needed when generating the volume mesh.
4
3.1 Description of the cover
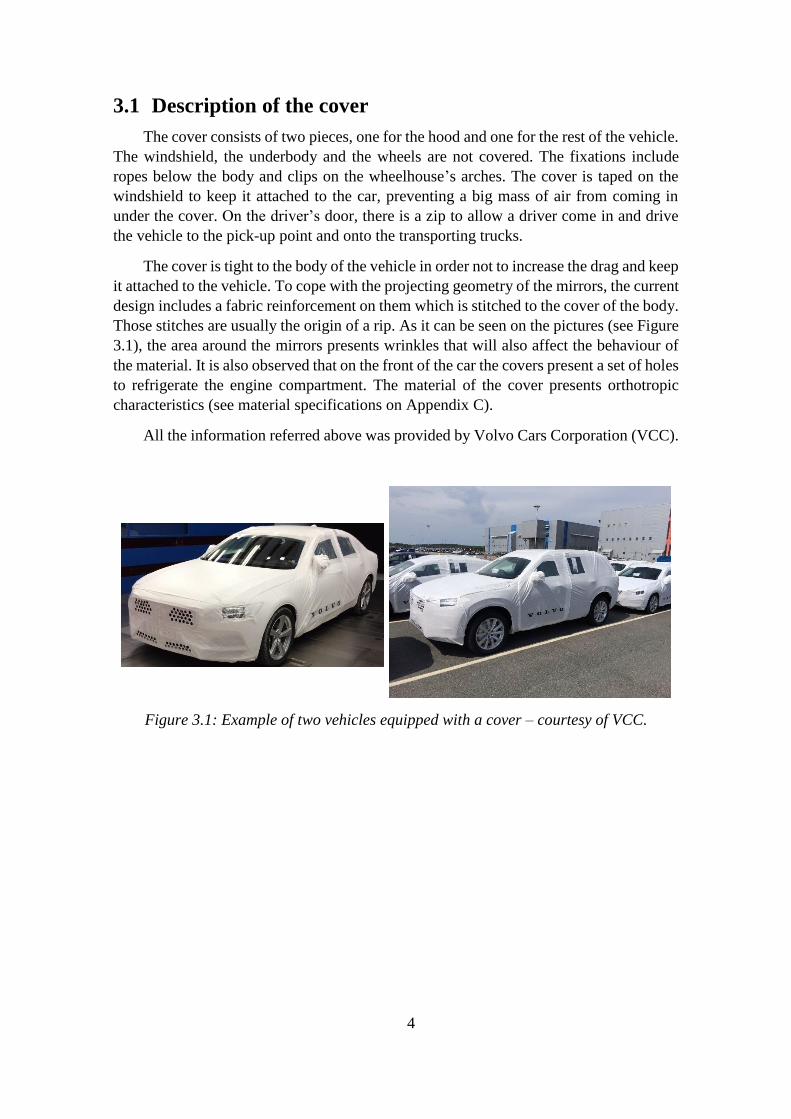
The cover consists of two pieces, one for the hood and one for the rest of the vehicle.
The windshield, the underbody and the wheels are not covered. The fixations include
ropes below the body and clips on the wheelhouse’s arches. The cover is taped on the
windshield to keep it attached to the car, preventing a big mass of air from coming in
under the cover. On the driver’s door, there is a zip to allow a driver come in and drive
the vehicle to the pick-up point and onto the transporting trucks.
The cover is tight to the body of the vehicle in order not to increase the drag and keep
it attached to the vehicle. To cope with the projecting geometry of the mirrors, the current
design includes a fabric reinforcement on them which is stitched to the cover of the body.
Those stitches are usually the origin of a rip. As it can be seen on the pictures (see Figure
3.1), the area around the mirrors presents wrinkles that will also affect the behaviour of
the material. It is also observed that on the front of the car the covers present a set of holes
to refrigerate the engine compartment. The material of the cover presents orthotropic
characteristics (see material specifications on Appendix C).
All the information referred above was provided by Volvo Cars Corporation (VCC).
Figure 3.1: Example of two vehicles equipped with a cover – courtesy of VCC.
5
3.2 The model: DrivAer
The DrivAer model was conceived as a generic model that would allow to perform
aerodynamic analysis on passenger vehicles with more detail than the oversimplified
generic models that already existed. This way, a deep understanding of the aerodynamic
phenomena could be reached without the necessity of having to appeal to the specific
vehicle models. The model was developed in the Technology University of Munich.
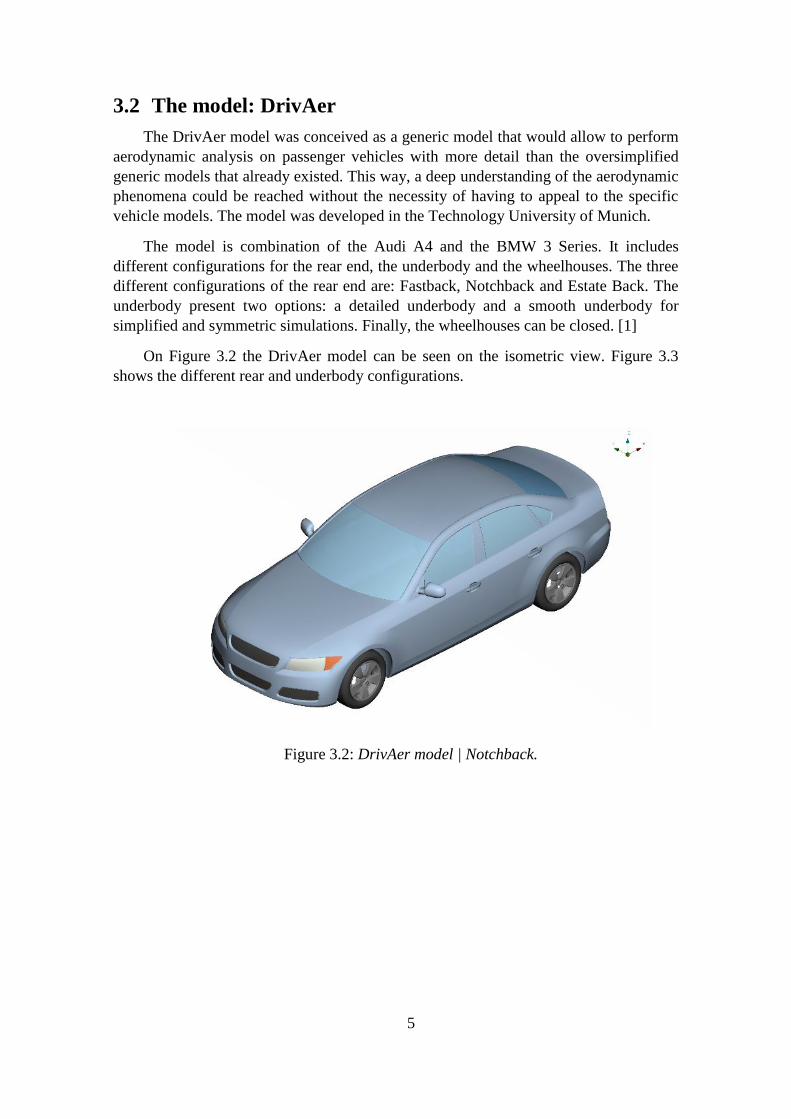
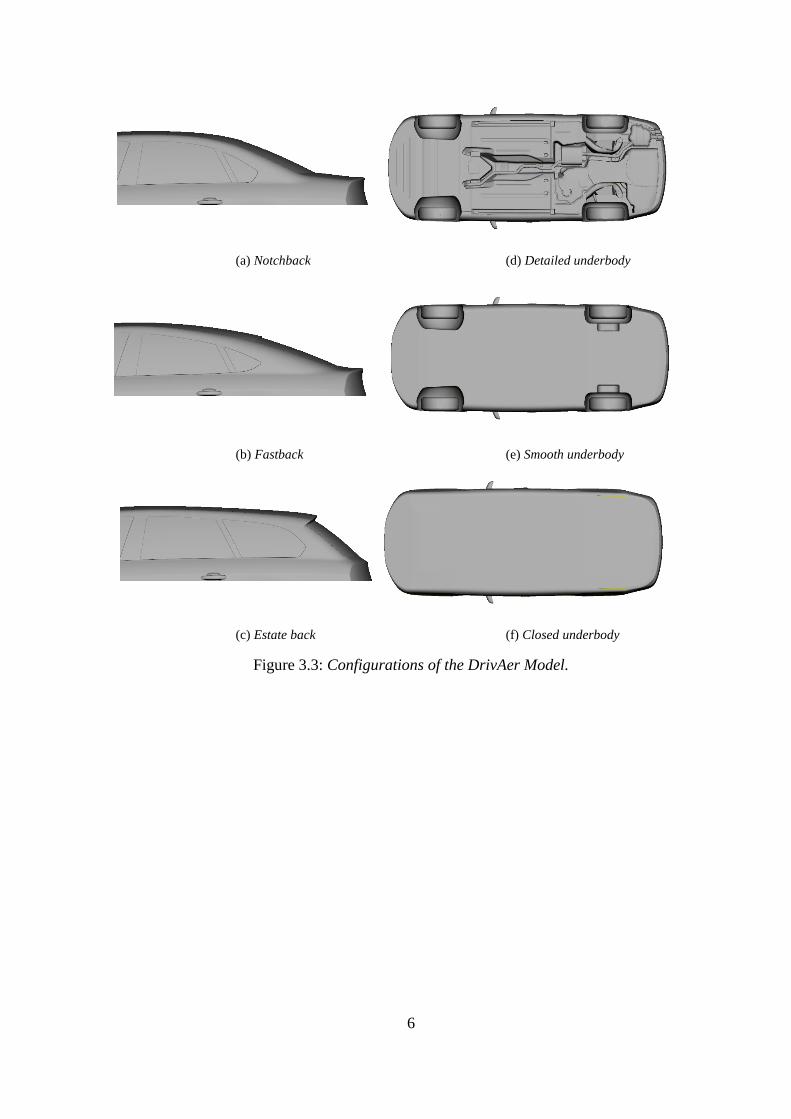
The model is combination of the Audi A4 and the BMW 3 Series. It includes
different configurations for the rear end, the underbody and the wheelhouses. The three
different configurations of the rear end are: Fastback, Notchback and Estate Back. The
underbody present two options: a detailed underbody and a smooth underbody for
simplified and symmetric simulations. Finally, the wheelhouses can be closed. [1]
On Figure 3.2 the DrivAer model can be seen on the isometric view. Figure 3.3
shows the different rear and underbody configurations.
Figure 3.2: DrivAer model | Notchback.
6
(a) Notchback (d) Detailed underbody
(b) Fastback (e) Smooth underbody
(c) Estate back (f) Closed underbody
Figure 3.3: Configurations of the DrivAer Model.
7
3.3 Case 1: Baseline
3.3.1 Geometry preparation
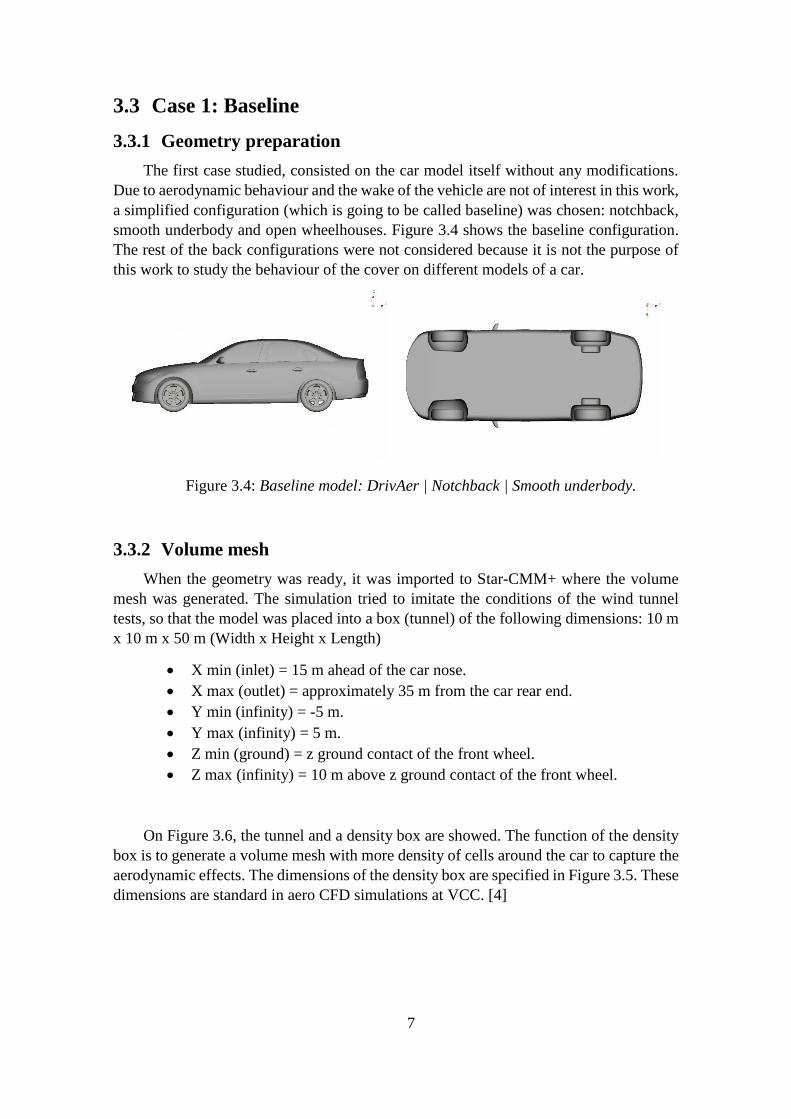
The first case studied, consisted on the car model itself without any modifications.
Due to aerodynamic behaviour and the wake of the vehicle are not of interest in this work,
a simplified configuration (which is going to be called baseline) was chosen: notchback,
smooth underbody and open wheelhouses. Figure 3.4 shows the baseline configuration.
The rest of the back configurations were not considered because it is not the purpose of
this work to study the behaviour of the cover on different models of a car.
Figure 3.4: Baseline model: DrivAer | Notchback | Smooth underbody.
3.3.2 Volume mesh
When the geometry was ready, it was imported to Star-CMM+ where the volume
mesh was generated. The simulation tried to imitate the conditions of the wind tunnel
tests, so that the model was placed into a box (tunnel) of the following dimensions: 10 m
x 10 m x 50 m (Width x Height x Length)
• X min (inlet) = 15 m ahead of the car nose.
• X max (outlet) = approximately 35 m from the car rear end.
• Y min (infinity) = -5 m.
• Y max (infinity) = 5 m.
• Z min (ground) = z ground contact of the front wheel.
• Z max (infinity) = 10 m above z ground contact of the front wheel.
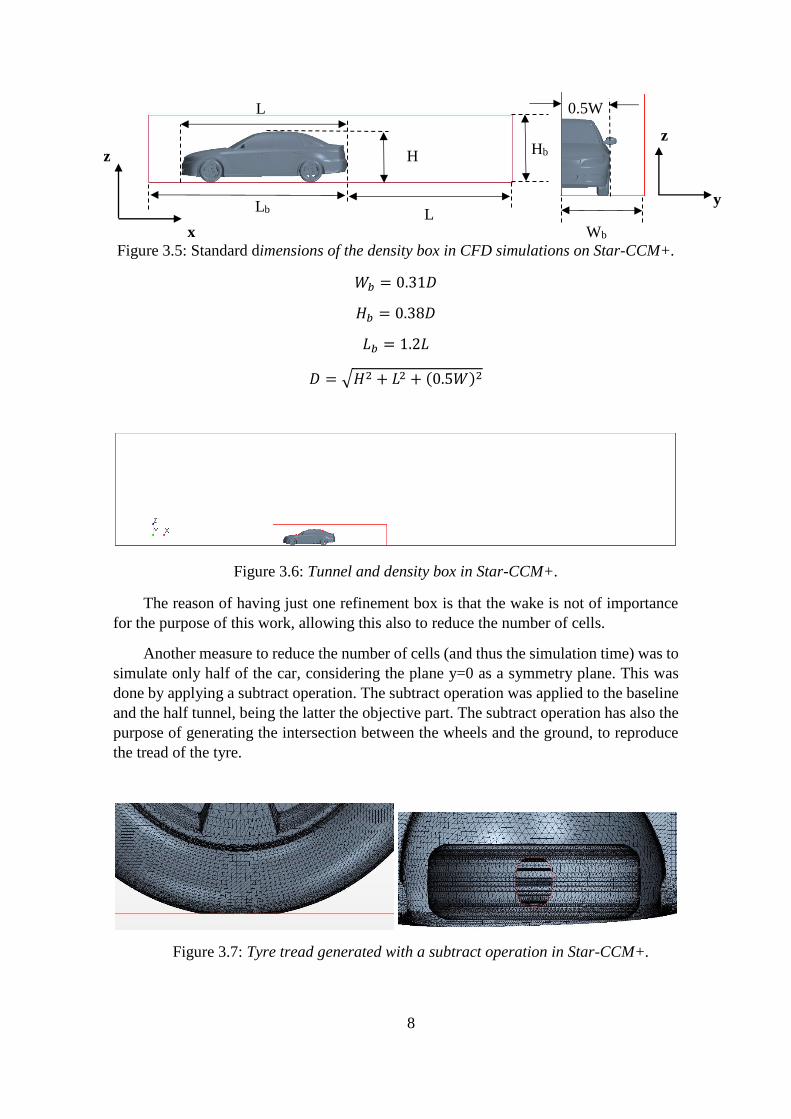
On Figure 3.6, the tunnel and a density box are showed. The function of the density
box is to generate a volume mesh with more density of cells around the car to capture the
aerodynamic effects. The dimensions of the density box are specified in Figure 3.5. These
dimensions are standard in aero CFD simulations at VCC. [4]
8
Figure 3.5: Standard dimensions of the density box in CFD simulations on Star-CCM+.
𝑊𝑏 = 0.31𝐷
𝐻𝑏 = 0.38𝐷
𝐿𝑏 = 1.2𝐿
𝐷 = √𝐻2 + 𝐿2 + (0.5𝑊)2
Figure 3.6: Tunnel and density box in Star-CCM+.
The reason of having just one refinement box is that the wake is not of importance
for the purpose of this work, allowing this also to reduce the number of cells.
Another measure to reduce the number of cells (and thus the simulation time) was to
simulate only half of the car, considering the plane y=0 as a symmetry plane. This was
done by applying a subtract operation. The subtract operation was applied to the baseline
and the half tunnel, being the latter the objective part. The subtract operation has also the
purpose of generating the intersection between the wheels and the ground, to reproduce
the tread of the tyre.
Figure 3.7: Tyre tread generated with a subtract operation in Star-CCM+.
L
x
z
Lb
L
H Hb
0.5W
Wb
z
y
9
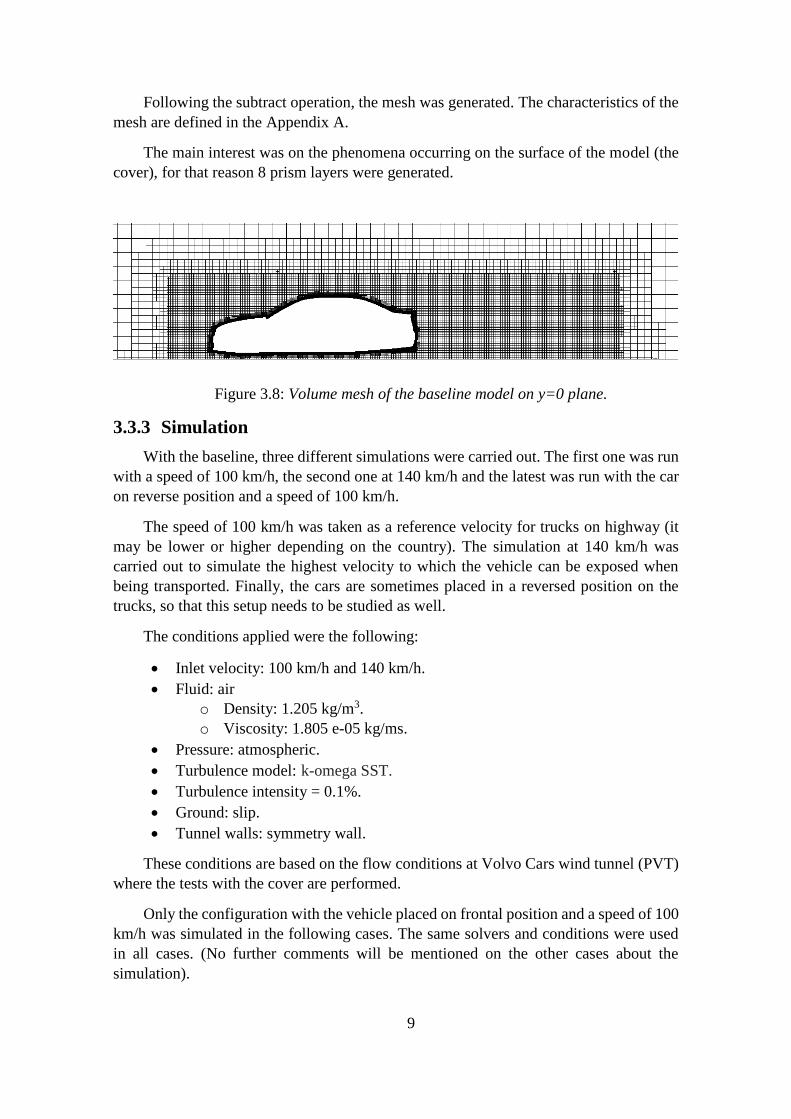
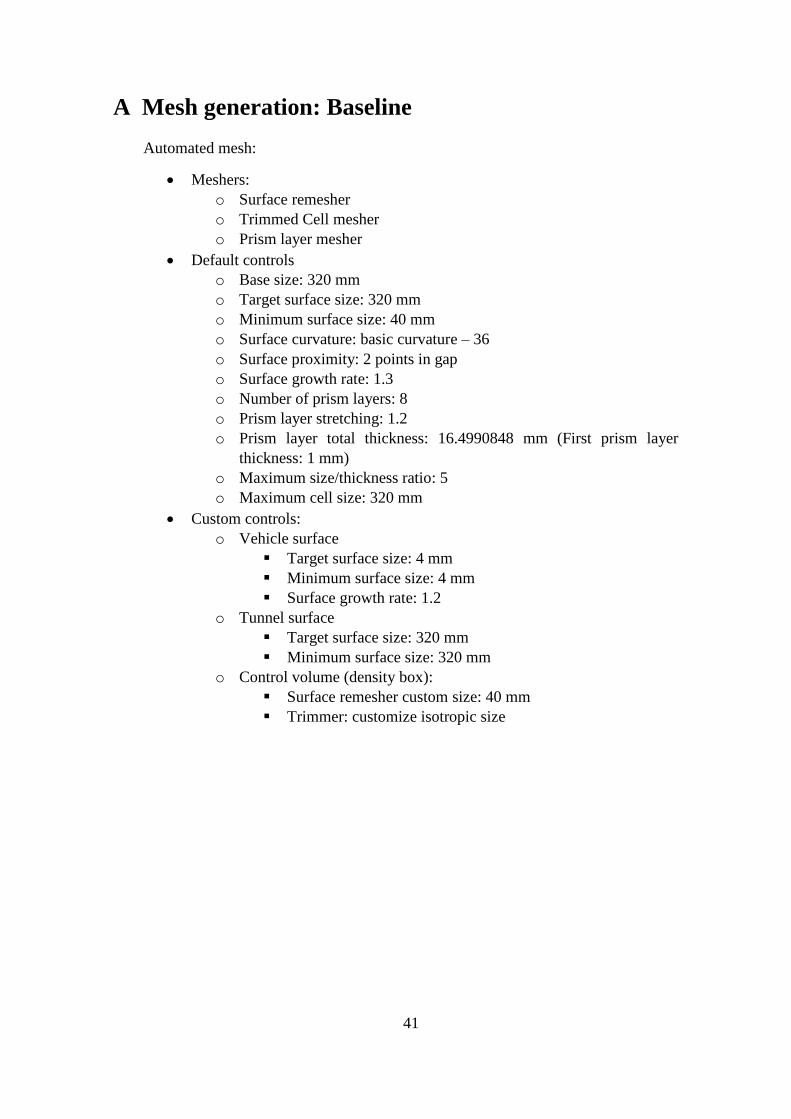
Following the subtract operation, the mesh was generated. The characteristics of the
mesh are defined in the Appendix A.
The main interest was on the phenomena occurring on the surface of the model (the
cover), for that reason 8 prism layers were generated.
Figure 3.8: Volume mesh of the baseline model on y=0 plane.
3.3.3 Simulation
With the baseline, three different simulations were carried out. The first one was run
with a speed of 100 km/h, the second one at 140 km/h and the latest was run with the car
on reverse position and a speed of 100 km/h.
The speed of 100 km/h was taken as a reference velocity for trucks on highway (it
may be lower or higher depending on the country). The simulation at 140 km/h was
carried out to simulate the highest velocity to which the vehicle can be exposed when
being transported. Finally, the cars are sometimes placed in a reversed position on the
trucks, so that this setup needs to be studied as well.
The conditions applied were the following:
• Inlet velocity: 100 km/h and 140 km/h.
• Fluid: air
o Density: 1.205 kg/m3.
o Viscosity: 1.805 e-05 kg/ms.
• Pressure: atmospheric.
• Turbulence model: k-omega SST.
• Turbulence intensity = 0.1%.
• Ground: slip.
• Tunnel walls: symmetry wall.
These conditions are based on the flow conditions at Volvo Cars wind tunnel (PVT)
where the tests with the cover are performed.
Only the configuration with the vehicle placed on frontal position and a speed of 100
km/h was simulated in the following cases. The same solvers and conditions were used
in all cases. (No further comments will be mentioned on the other cases about the
simulation).
10
3.4 Case 2: Wrapped model
3.4.1 Geometry preparation
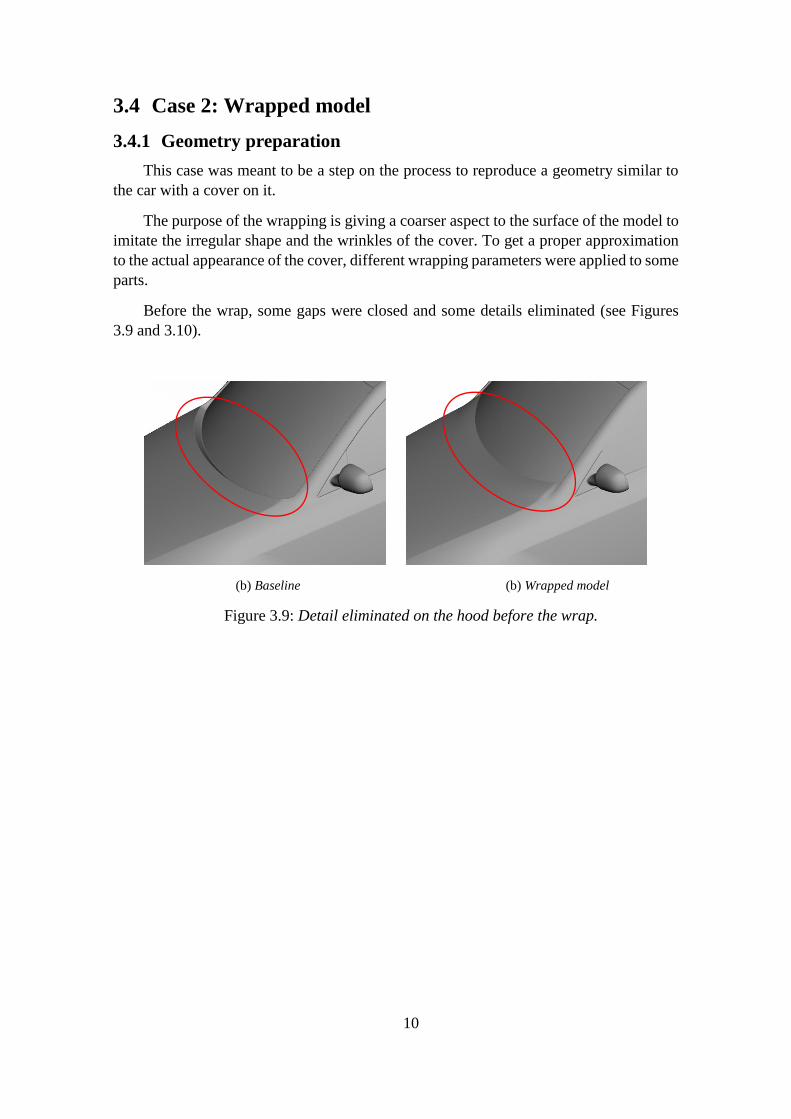
This case was meant to be a step on the process to reproduce a geometry similar to
the car with a cover on it.
The purpose of the wrapping is giving a coarser aspect to the surface of the model to
imitate the irregular shape and the wrinkles of the cover. To get a proper approximation
to the actual appearance of the cover, different wrapping parameters were applied to some
parts.
Before the wrap, some gaps were closed and some details eliminated (see Figures
3.9 and 3.10).
(b) Baseline (b) Wrapped model
Figure 3.9: Detail eliminated on the hood before the wrap.
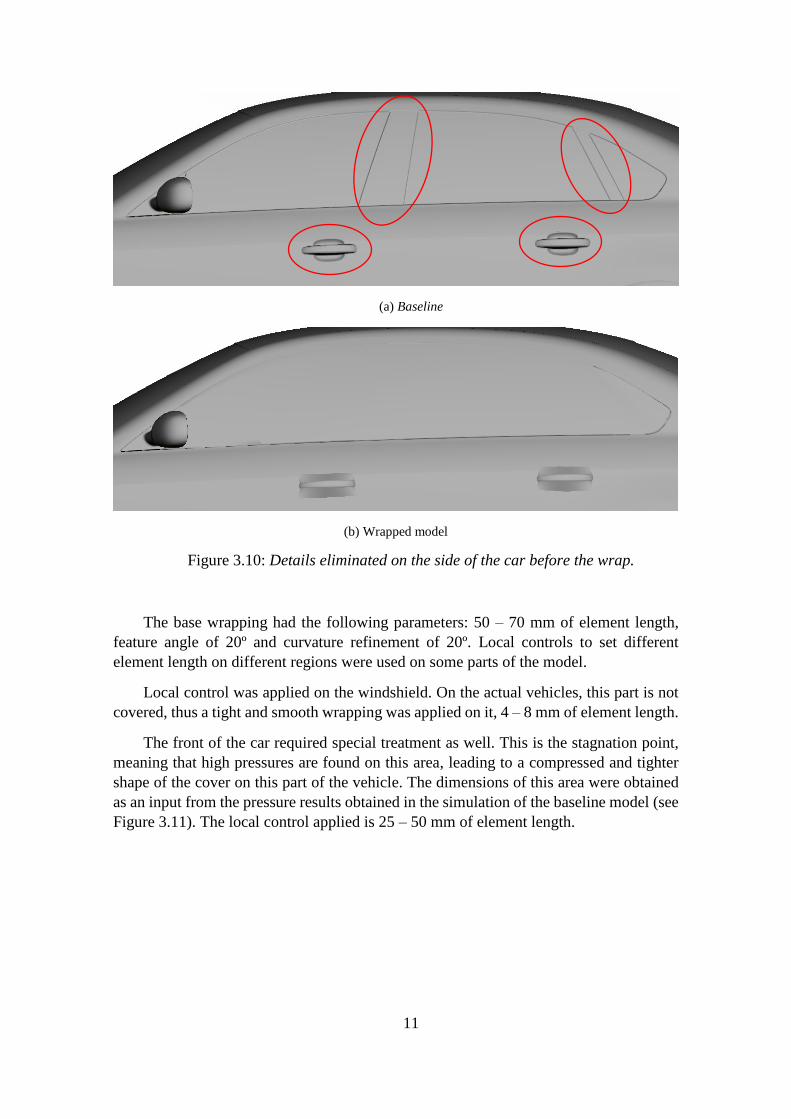
11
(a) Baseline
(b) Wrapped model
Figure 3.10: Details eliminated on the side of the car before the wrap.
The base wrapping had the following parameters: 50 – 70 mm of element length,
feature angle of 20º and curvature refinement of 20º. Local controls to set different
element length on different regions were used on some parts of the model.
Local control was applied on the windshield. On the actual vehicles, this part is not
covered, thus a tight and smooth wrapping was applied on it, 4 – 8 mm of element length.
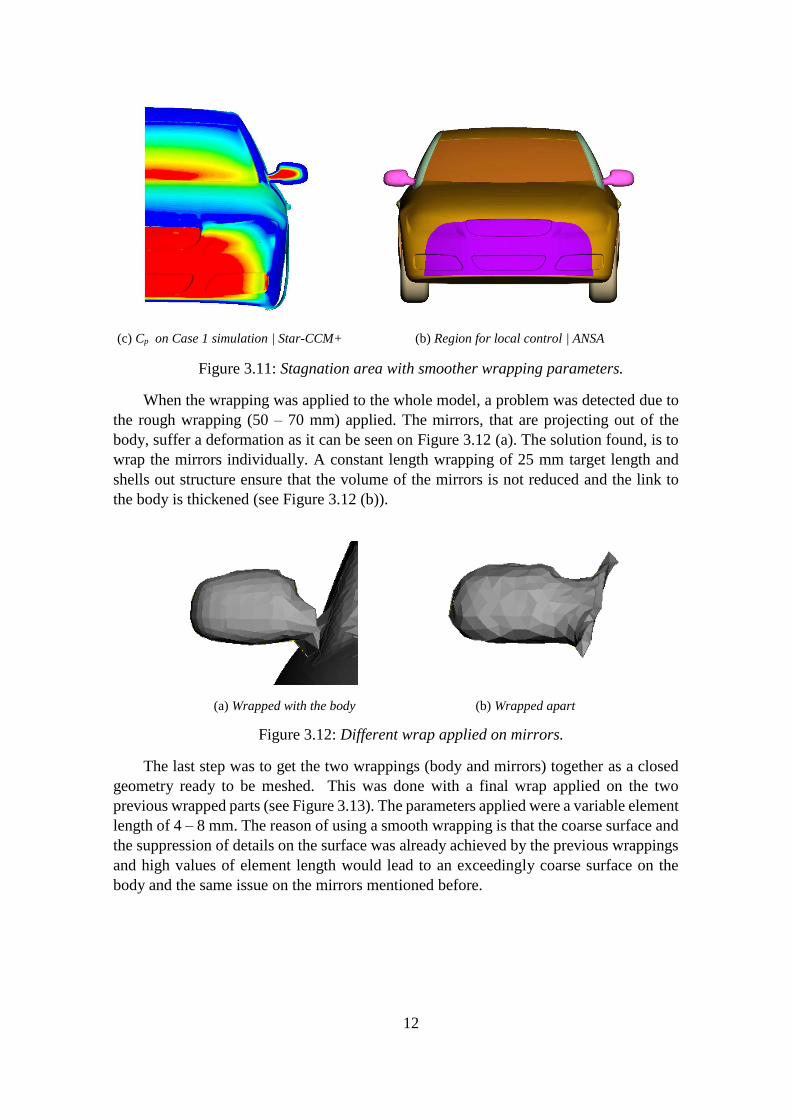
The front of the car required special treatment as well. This is the stagnation point,
meaning that high pressures are found on this area, leading to a compressed and tighter
shape of the cover on this part of the vehicle. The dimensions of this area were obtained
as an input from the pressure results obtained in the simulation of the baseline model (see
Figure 3.11). The local control applied is 25 – 50 mm of element length.
12
(c) Cp on Case 1 simulation | Star-CCM+ (b) Region for local control | ANSA
Figure 3.11: Stagnation area with smoother wrapping parameters.
When the wrapping was applied to the whole model, a problem was detected due to
the rough wrapping (50 – 70 mm) applied. The mirrors, that are projecting out of the
body, suffer a deformation as it can be seen on Figure 3.12 (a). The solution found, is to
wrap the mirrors individually. A constant length wrapping of 25 mm target length and
shells out structure ensure that the volume of the mirrors is not reduced and the link to
the body is thickened (see Figure 3.12 (b)).
(a) Wrapped with the body (b) Wrapped apart
Figure 3.12: Different wrap applied on mirrors.
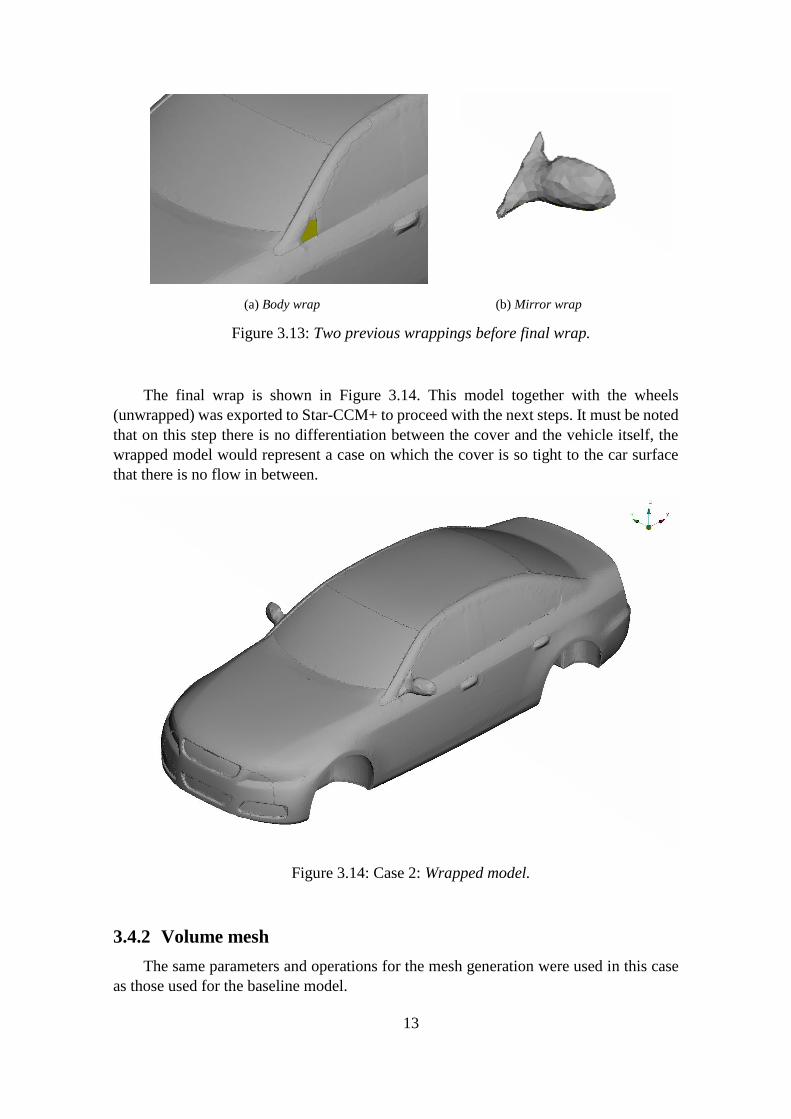
The last step was to get the two wrappings (body and mirrors) together as a closed
geometry ready to be meshed. This was done with a final wrap applied on the two
previous wrapped parts (see Figure 3.13). The parameters applied were a variable element
length of 4 – 8 mm. The reason of using a smooth wrapping is that the coarse surface and
the suppression of details on the surface was already achieved by the previous wrappings
and high values of element length would lead to an exceedingly coarse surface on the
body and the same issue on the mirrors mentioned before.
13
(a) Body wrap (b) Mirror wrap
Figure 3.13: Two previous wrappings before final wrap.
The final wrap is shown in Figure 3.14. This model together with the wheels
(unwrapped) was exported to Star-CCM+ to proceed with the next steps. It must be noted
that on this step there is no differentiation between the cover and the vehicle itself, the
wrapped model would represent a case on which the cover is so tight to the car surface
that there is no flow in between.
Figure 3.14: Case 2: Wrapped model.
3.4.2 Volume mesh
The same parameters and operations for the mesh generation were used in this case
as those used for the baseline model.
14
3.5 Case 3: Morphed model
3.5.1 Geometry preparation
The aim of this stage was to generate an independent geometry that imitates the cover
of the car. The consequent simulation included two geometries: the baseline model and
the cover over it, with the purpose of simulating air flow between them. To achieve this,
a gap long enough to generate cells and prism layers between the inner surface of the
cover and the outer surface of the baseline needed to be created. This was done by means
of the morphing tool in ANSA.
Two different shapes were implemented in this stage. The first one corresponded to
the shape of the cover when the vehicle is standing still (or initial shape) and the other
one corresponded to the shape of the cover when it is exposed to an air flow during
transportation.
Case 3.1: Initial shape
The initial shape of the cover consisted only on moving (morphing) outwards all the
surfaces of the car a distance of 1 cm. Note that outwards in this case means a
perpendicular direction to the surface. Due to the difficulty of morphing every single
surface of the vehicle along its perpendicular direction, the solution adopted was to create
groups of surfaces that were displaced in the three coordinate directions (i.e. the front-
bump, the hood, the lateral side, the roof, the back, the underbody…). Since there is no
cover on the windshield, this part was not morphed, furthermore the edges were not
displaced because the actual cover is taped there, meaning that the edge of the cover
should be in contact with the windshield of the baseline.
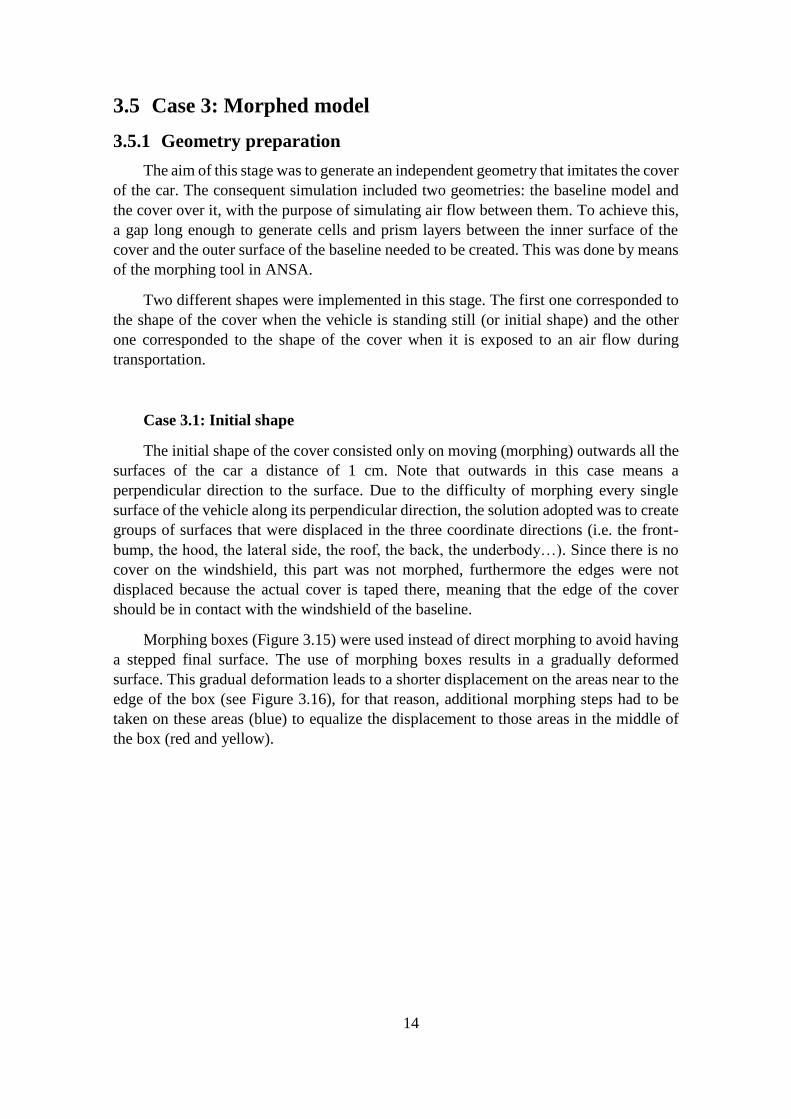
Morphing boxes (Figure 3.15) were used instead of direct morphing to avoid having
a stepped final surface. The use of morphing boxes results in a gradually deformed
surface. This gradual deformation leads to a shorter displacement on the areas near to the
edge of the box (see Figure 3.16), for that reason, additional morphing steps had to be
taken on these areas (blue) to equalize the displacement to those areas in the middle of
the box (red and yellow).
15
Figure 3.15: Morphing boxes and direction of morphing.
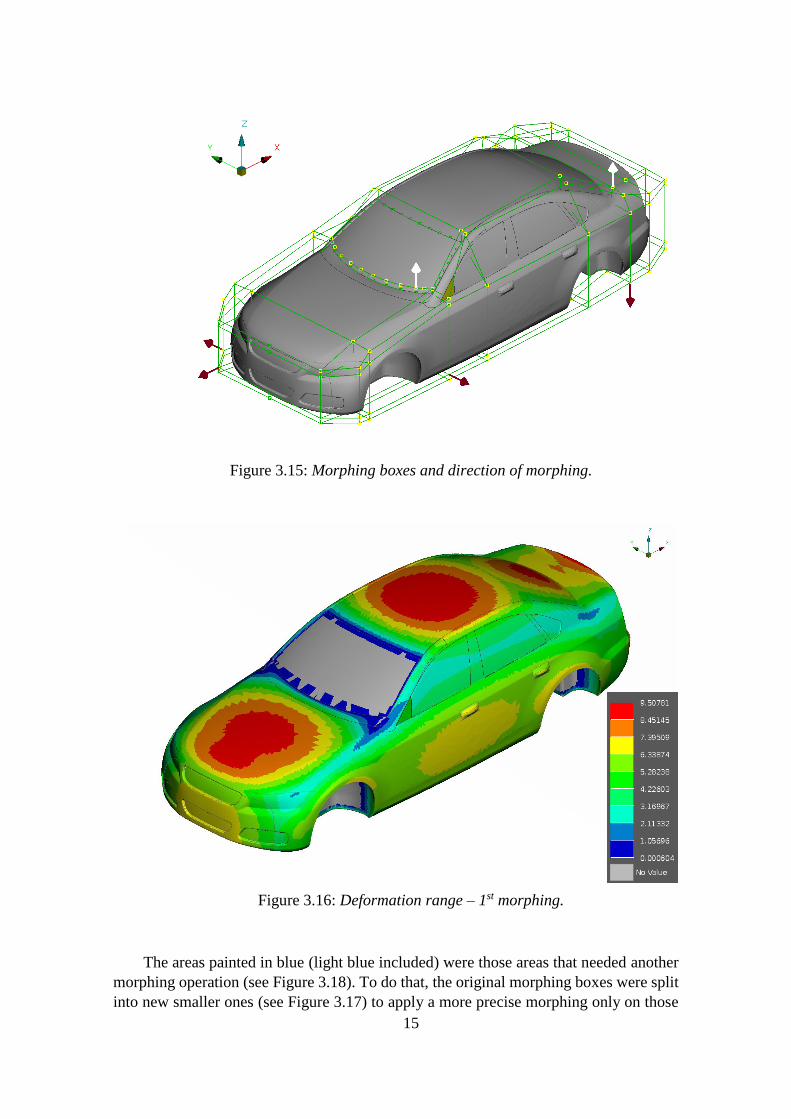
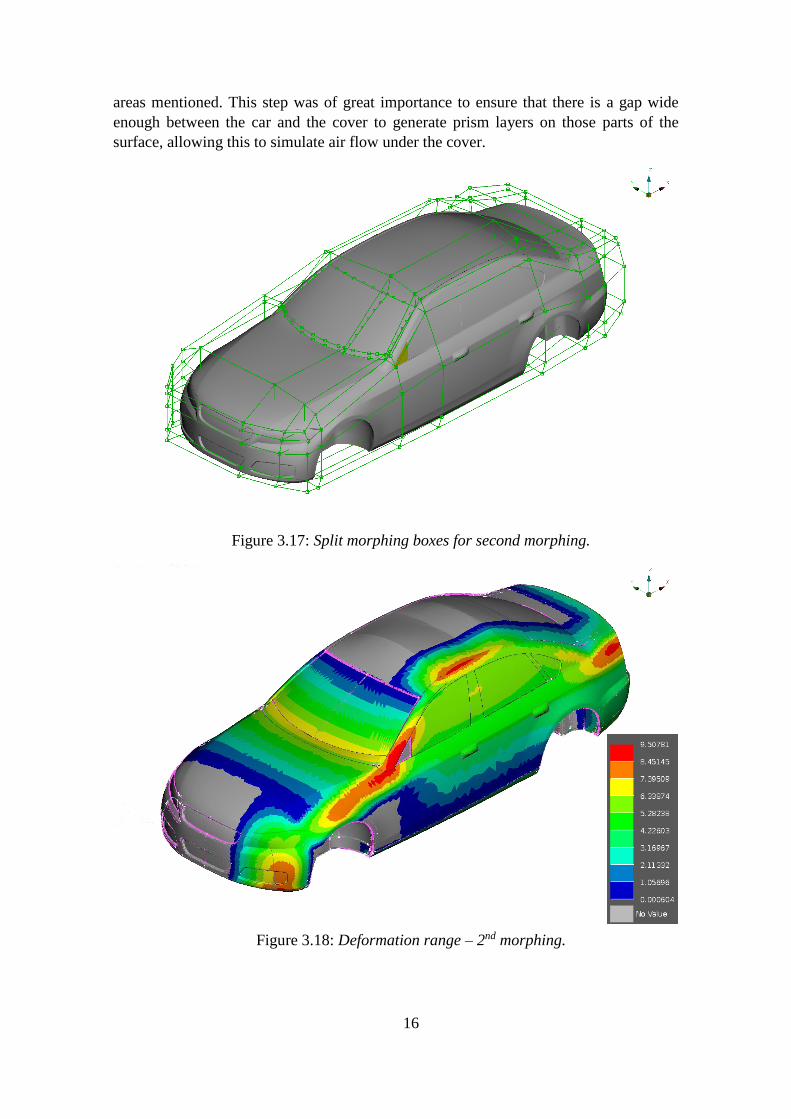
Figure 3.16: Deformation range – 1st morphing.
The areas painted in blue (light blue included) were those areas that needed another
morphing operation (see Figure 3.18). To do that, the original morphing boxes were split
into new smaller ones (see Figure 3.17) to apply a more precise morphing only on those
16
areas mentioned. This step was of great importance to ensure that there is a gap wide
enough between the car and the cover to generate prism layers on those parts of the
surface, allowing this to simulate air flow under the cover.
Figure 3.17: Split morphing boxes for second morphing.
Figure 3.18: Deformation range – 2nd morphing.
17
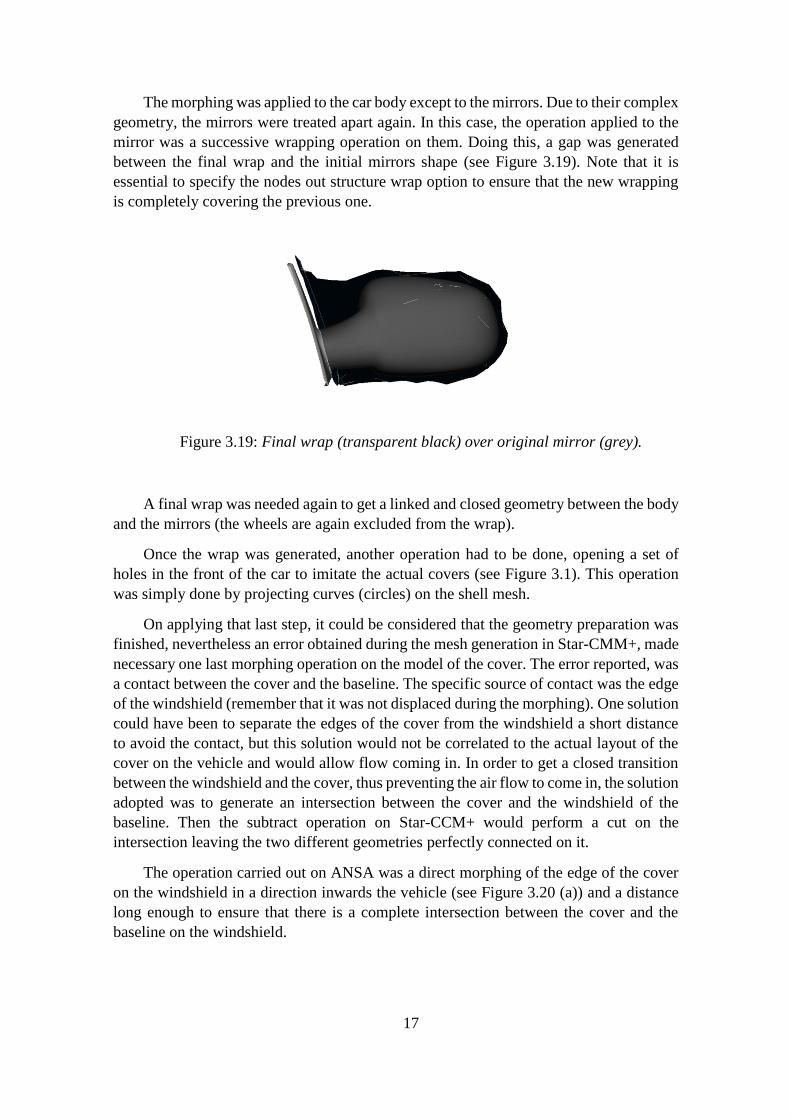
The morphing was applied to the car body except to the mirrors. Due to their complex
geometry, the mirrors were treated apart again. In this case, the operation applied to the
mirror was a successive wrapping operation on them. Doing this, a gap was generated
between the final wrap and the initial mirrors shape (see Figure 3.19). Note that it is
essential to specify the nodes out structure wrap option to ensure that the new wrapping
is completely covering the previous one.
Figure 3.19: Final wrap (transparent black) over original mirror (grey).
A final wrap was needed again to get a linked and closed geometry between the body
and the mirrors (the wheels are again excluded from the wrap).
Once the wrap was generated, another operation had to be done, opening a set of
holes in the front of the car to imitate the actual covers (see Figure 3.1). This operation
was simply done by projecting curves (circles) on the shell mesh.
On applying that last step, it could be considered that the geometry preparation was
finished, nevertheless an error obtained during the mesh generation in Star-CMM+, made
necessary one last morphing operation on the model of the cover. The error reported, was
a contact between the cover and the baseline. The specific source of contact was the edge
of the windshield (remember that it was not displaced during the morphing). One solution
could have been to separate the edges of the cover from the windshield a short distance
to avoid the contact, but this solution would not be correlated to the actual layout of the
cover on the vehicle and would allow flow coming in. In order to get a closed transition
between the windshield and the cover, thus preventing the air flow to come in, the solution
adopted was to generate an intersection between the cover and the windshield of the
baseline. Then the subtract operation on Star-CCM+ would perform a cut on the
intersection leaving the two different geometries perfectly connected on it.
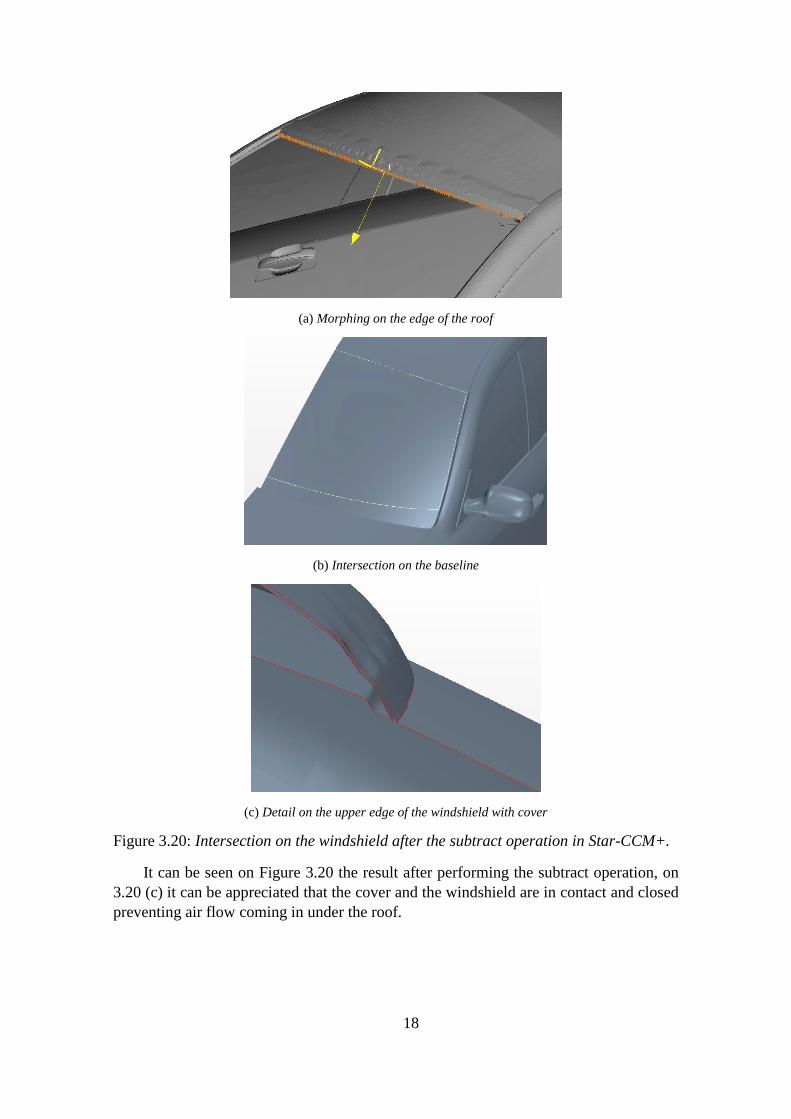
The operation carried out on ANSA was a direct morphing of the edge of the cover
on the windshield in a direction inwards the vehicle (see Figure 3.20 (a)) and a distance
long enough to ensure that there is a complete intersection between the cover and the
baseline on the windshield.
18
(a) Morphing on the edge of the roof
(b) Intersection on the baseline
(c) Detail on the upper edge of the windshield with cover
Figure 3.20: Intersection on the windshield after the subtract operation in Star-CCM+.
It can be seen on Figure 3.20 the result after performing the subtract operation, on
3.20 (c) it can be appreciated that the cover and the windshield are in contact and closed
preventing air flow coming in under the roof.
19
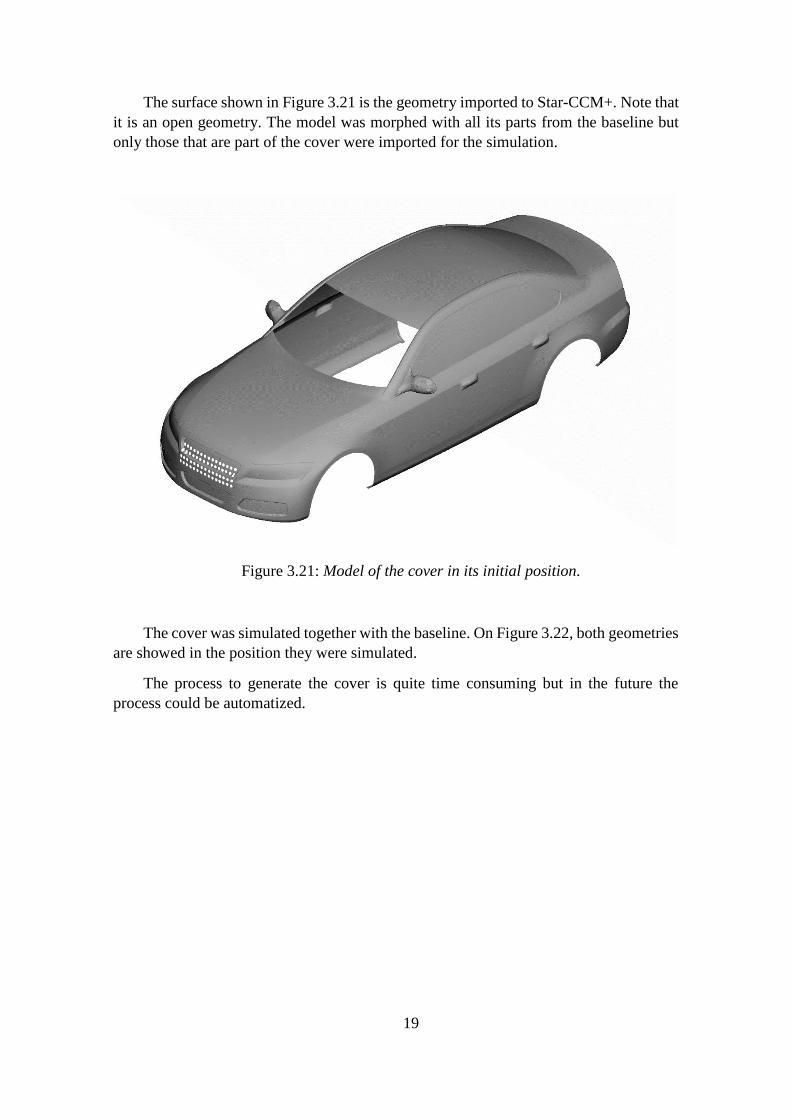
The surface shown in Figure 3.21 is the geometry imported to Star-CCM+. Note that
it is an open geometry. The model was morphed with all its parts from the baseline but
only those that are part of the cover were imported for the simulation.
Figure 3.21: Model of the cover in its initial position.
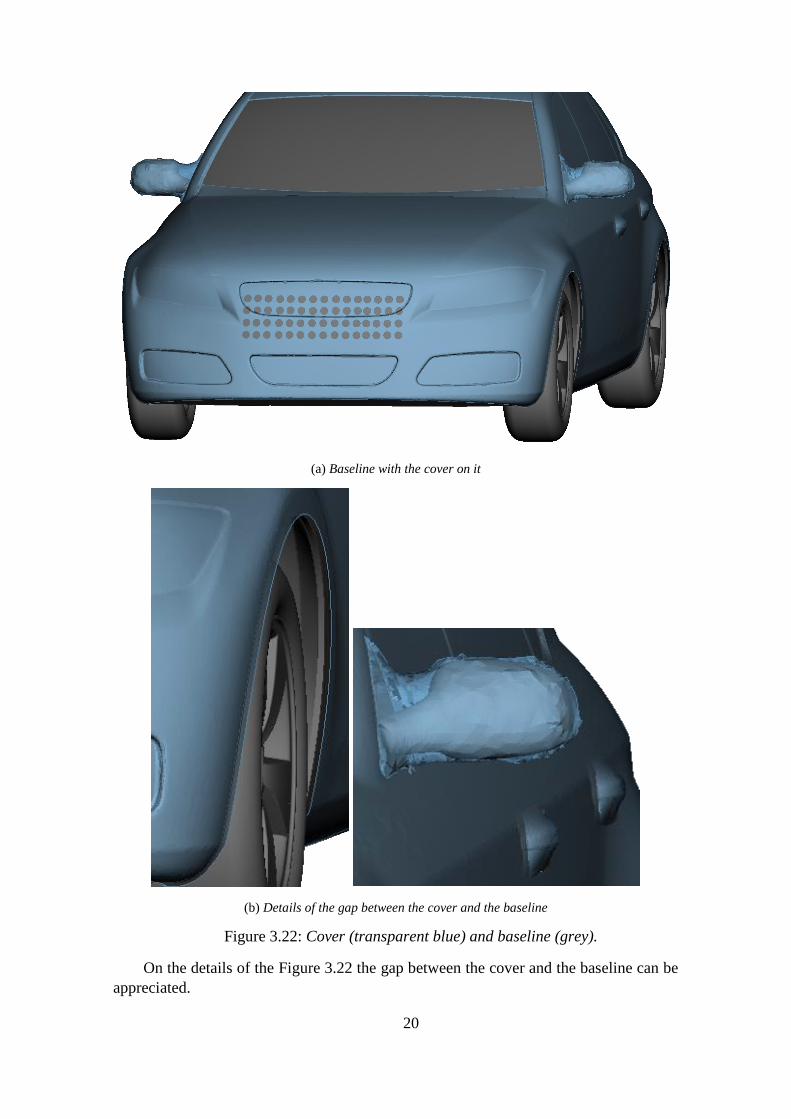
The cover was simulated together with the baseline. On Figure 3.22, both geometries
are showed in the position they were simulated.
The process to generate the cover is quite time consuming but in the future the
process could be automatized.
20
(a) Baseline with the cover on it
(b) Details of the gap between the cover and the baseline
Figure 3.22: Cover (transparent blue) and baseline (grey).
On the details of the Figure 3.22 the gap between the cover and the baseline can be
appreciated.
21
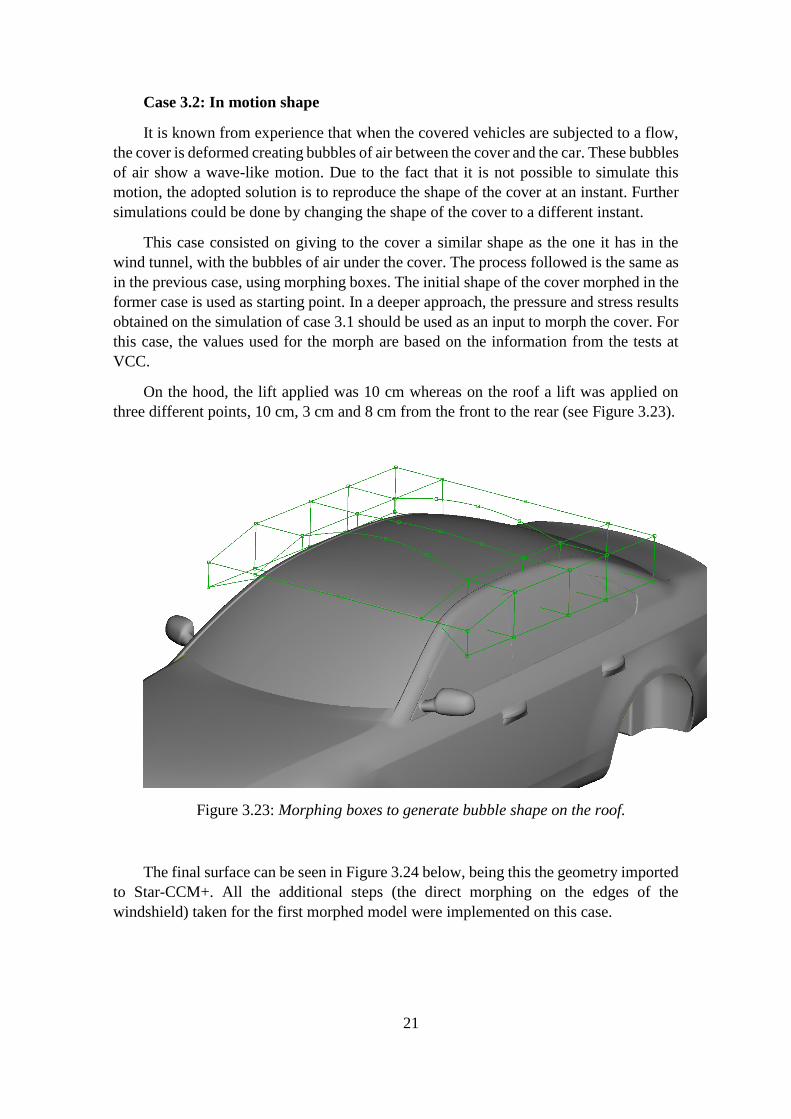
Case 3.2: In motion shape
It is known from experience that when the covered vehicles are subjected to a flow,
the cover is deformed creating bubbles of air between the cover and the car. These bubbles
of air show a wave-like motion. Due to the fact that it is not possible to simulate this
motion, the adopted solution is to reproduce the shape of the cover at an instant. Further
simulations could be done by changing the shape of the cover to a different instant.
This case consisted on giving to the cover a similar shape as the one it has in the
wind tunnel, with the bubbles of air under the cover. The process followed is the same as
in the previous case, using morphing boxes. The initial shape of the cover morphed in the
former case is used as starting point. In a deeper approach, the pressure and stress results
obtained on the simulation of case 3.1 should be used as an input to morph the cover. For
this case, the values used for the morph are based on the information from the tests at
VCC.
On the hood, the lift applied was 10 cm whereas on the roof a lift was applied on
three different points, 10 cm, 3 cm and 8 cm from the front to the rear (see Figure 3.23).
Figure 3.23: Morphing boxes to generate bubble shape on the roof.
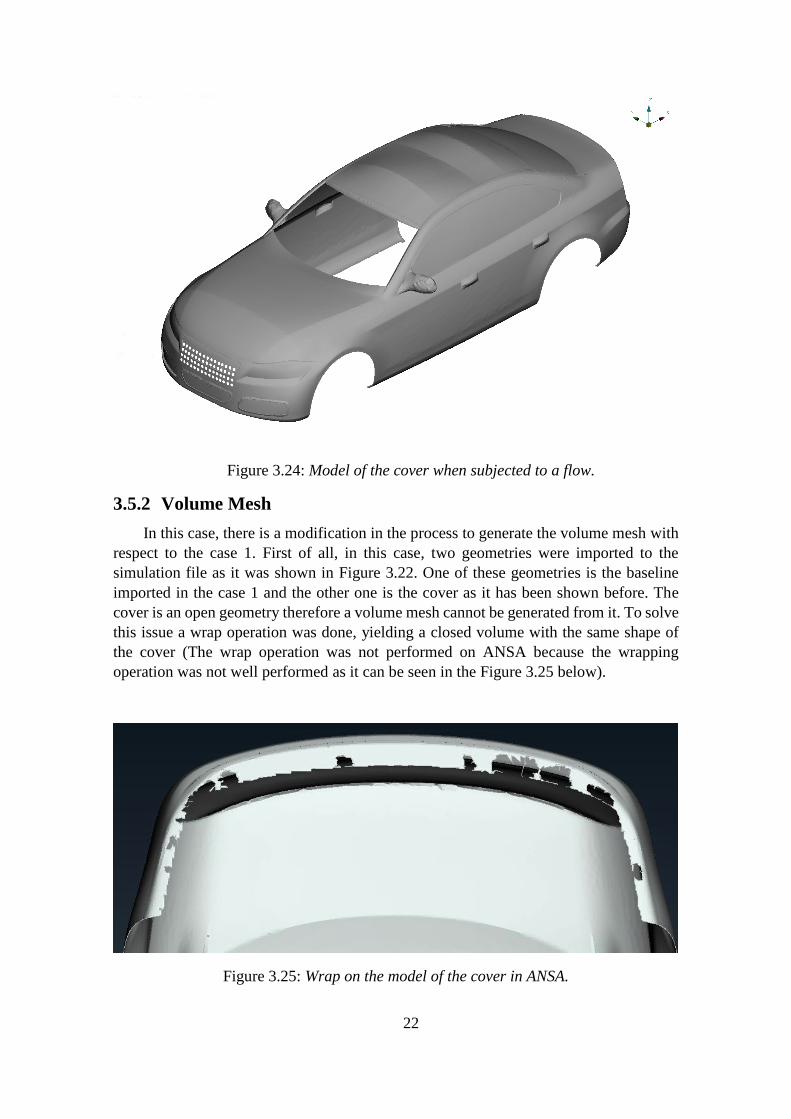
The final surface can be seen in Figure 3.24 below, being this the geometry imported
to Star-CCM+. All the additional steps (the direct morphing on the edges of the
windshield) taken for the first morphed model were implemented on this case.
22
Figure 3.24: Model of the cover when subjected to a flow.
3.5.2 Volume Mesh
In this case, there is a modification in the process to generate the volume mesh with
respect to the case 1. First of all, in this case, two geometries were imported to the
simulation file as it was shown in Figure 3.22. One of these geometries is the baseline
imported in the case 1 and the other one is the cover as it has been shown before. The
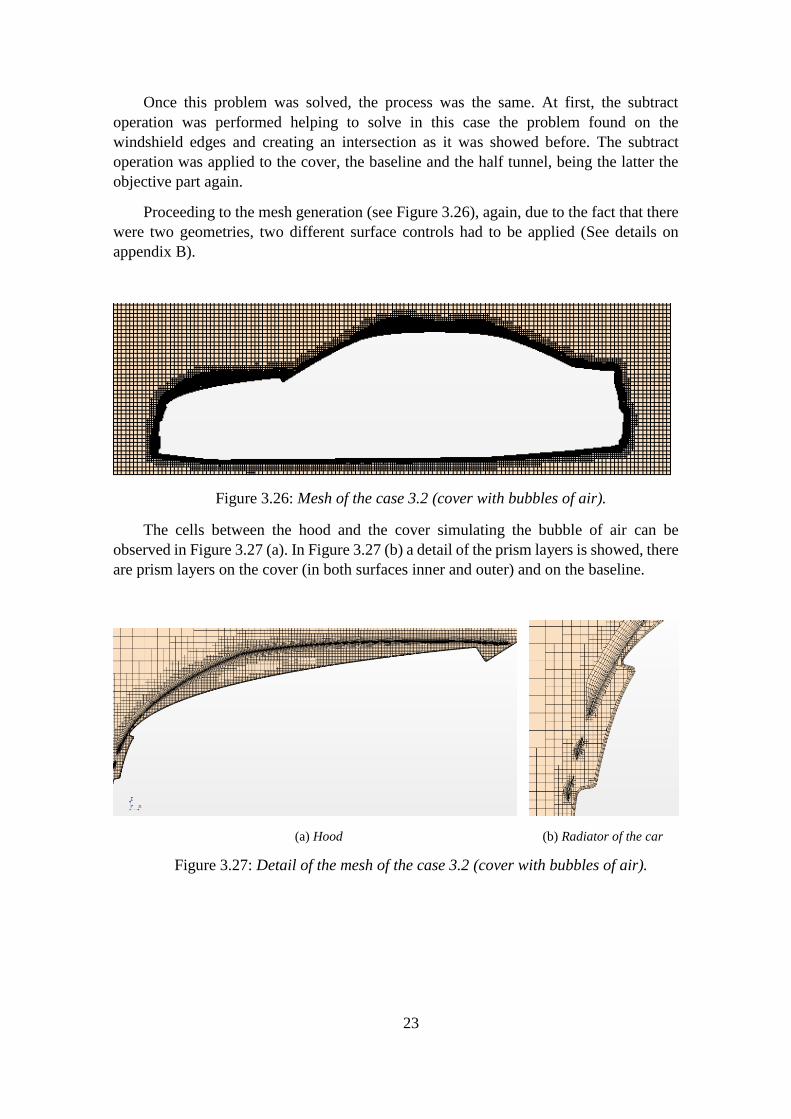
cover is an open geometry therefore a volume mesh cannot be generated from it. To solve
this issue a wrap operation was done, yielding a closed volume with the same shape of
the cover (The wrap operation was not performed on ANSA because the wrapping
operation was not well performed as it can be seen in the Figure 3.25 below).
Figure 3.25: Wrap on the model of the cover in ANSA.
23
Once this problem was solved, the process was the same. At first, the subtract
operation was performed helping to solve in this case the problem found on the
windshield edges and creating an intersection as it was showed before. The subtract
operation was applied to the cover, the baseline and the half tunnel, being the latter the
objective part again.
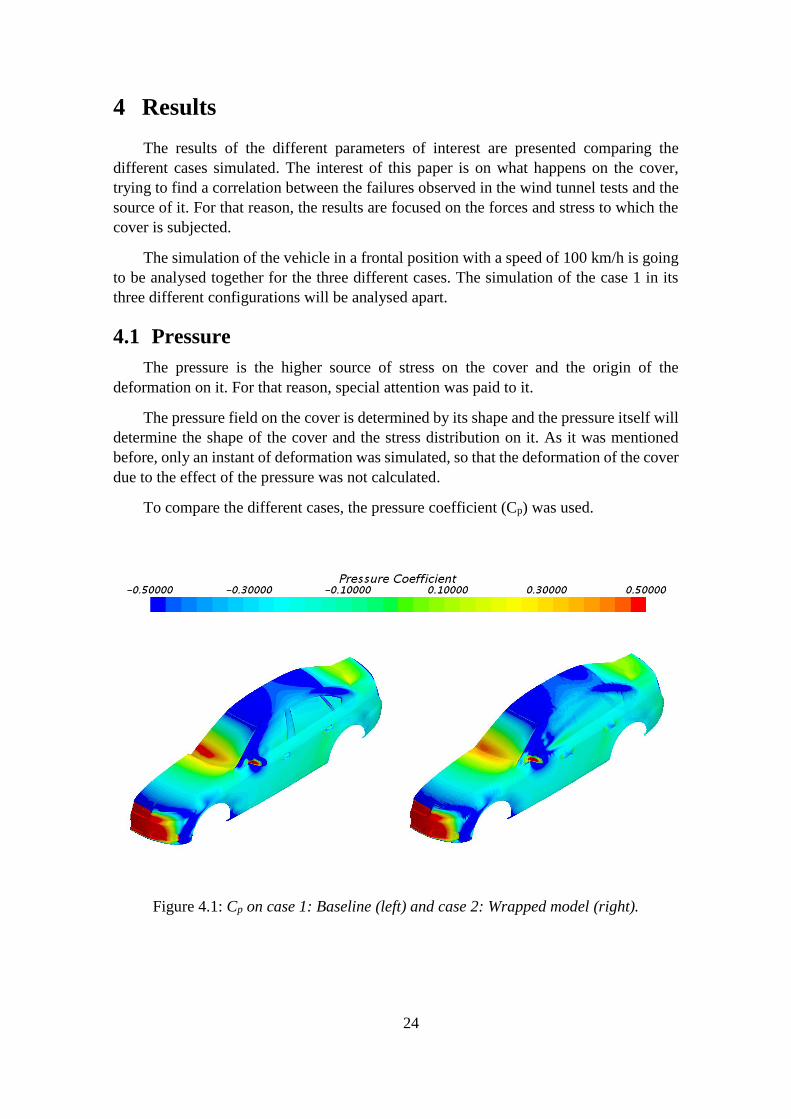
Proceeding to the mesh generation (see Figure 3.26), again, due to the fact that there
were two geometries, two different surface controls had to be applied (See details on
appendix B).
Figure 3.26: Mesh of the case 3.2 (cover with bubbles of air).
The cells between the hood and the cover simulating the bubble of air can be
observed in Figure 3.27 (a). In Figure 3.27 (b) a detail of the prism layers is showed, there
are prism layers on the cover (in both surfaces inner and outer) and on the baseline.
(a) Hood (b) Radiator of the car
Figure 3.27: Detail of the mesh of the case 3.2 (cover with bubbles of air).
24
4 Results
The results of the different parameters of interest are presented comparing the
different cases simulated. The interest of this paper is on what happens on the cover,
trying to find a correlation between the failures observed in the wind tunnel tests and the
source of it. For that reason, the results are focused on the forces and stress to which the
cover is subjected.
The simulation of the vehicle in a frontal position with a speed of 100 km/h is going
to be analysed together for the three different cases. The simulation of the case 1 in its
three different configurations will be analysed apart.
4.1 Pressure
The pressure is the higher source of stress on the cover and the origin of the
deformation on it. For that reason, special attention was paid to it.
The pressure field on the cover is determined by its shape and the pressure itself will
determine the shape of the cover and the stress distribution on it. As it was mentioned
before, only an instant of deformation was simulated, so that the deformation of the cover
due to the effect of the pressure was not calculated.
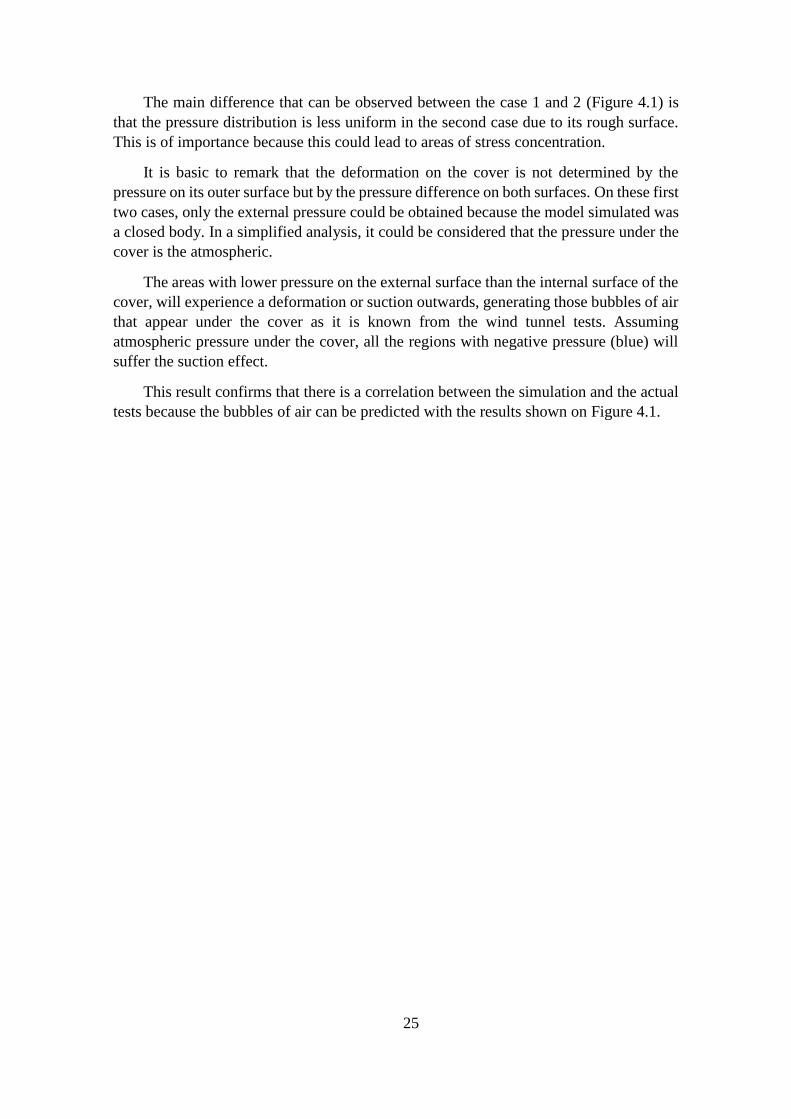
To compare the different cases, the pressure coefficient (Cp) was used.
Figure 4.1: Cp on case 1: Baseline (left) and case 2: Wrapped model (right).
25
The main difference that can be observed between the case 1 and 2 (Figure 4.1) is
that the pressure distribution is less uniform in the second case due to its rough surface.
This is of importance because this could lead to areas of stress concentration.
It is basic to remark that the deformation on the cover is not determined by the
pressure on its outer surface but by the pressure difference on both surfaces. On these first
two cases, only the external pressure could be obtained because the model simulated was
a closed body. In a simplified analysis, it could be considered that the pressure under the
cover is the atmospheric.
The areas with lower pressure on the external surface than the internal surface of the
cover, will experience a deformation or suction outwards, generating those bubbles of air
that appear under the cover as it is known from the wind tunnel tests. Assuming
atmospheric pressure under the cover, all the regions with negative pressure (blue) will
suffer the suction effect.
This result confirms that there is a correlation between the simulation and the actual
tests because the bubbles of air can be predicted with the results shown on Figure 4.1.
26
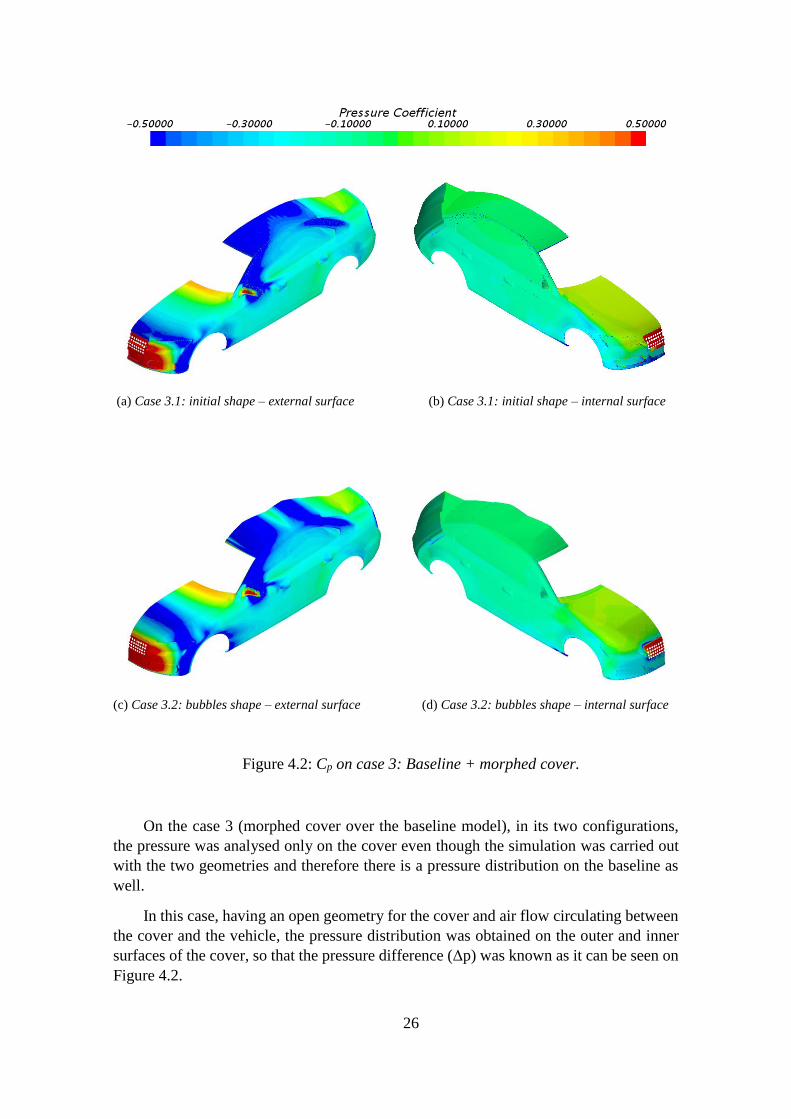
(a) Case 3.1: initial shape – external surface (b) Case 3.1: initial shape – internal surface
(c) Case 3.2: bubbles shape – external surface (d) Case 3.2: bubbles shape – internal surface
Figure 4.2: Cp on case 3: Baseline + morphed cover.
On the case 3 (morphed cover over the baseline model), in its two configurations,
the pressure was analysed only on the cover even though the simulation was carried out
with the two geometries and therefore there is a pressure distribution on the baseline as
well.
In this case, having an open geometry for the cover and air flow circulating between
the cover and the vehicle, the pressure distribution was obtained on the outer and inner
surfaces of the cover, so that the pressure difference (Δp) was known as it can be seen on
Figure 4.2.
27
As it was mentioned in the methodology section, the pressure result on the initial
shape (case 3.1), is to be used in the morphing of the bubbles shape for the case 3.2. The
case 3.1 can be seen as the instant when the vehicle changes from a standing still position
to a moving position in which it is exposed to the air resistance (or the instant when the
wind tunnel is started). This way, the evolution of the cover from the initial state to the
other can be predicted. It is a simplified way of calculating it because the vehicle does not
change from 0 to 100 km/h instantly. A more precise calculation would need an iterative
process in which the velocity was increased step by step.
Interestingly, it is observed in the case 3.2 that the negative pressure is concentrated
on the bubbles, which due to the pressure difference would lead to an increase in their
height (deformation). Another remarkable fact observed is that the pressure under the
cover is not the atmospheric, especially on the hood, where the proximity of the openings
on the front create a flow under the cover. So, the assumption on the first two cases can
be accepted as a first approach to the problem but not when a more precise solution is
aimed. It must be pointed that refrigeration flow into the vehicle is not simulated, that
would also change the results.
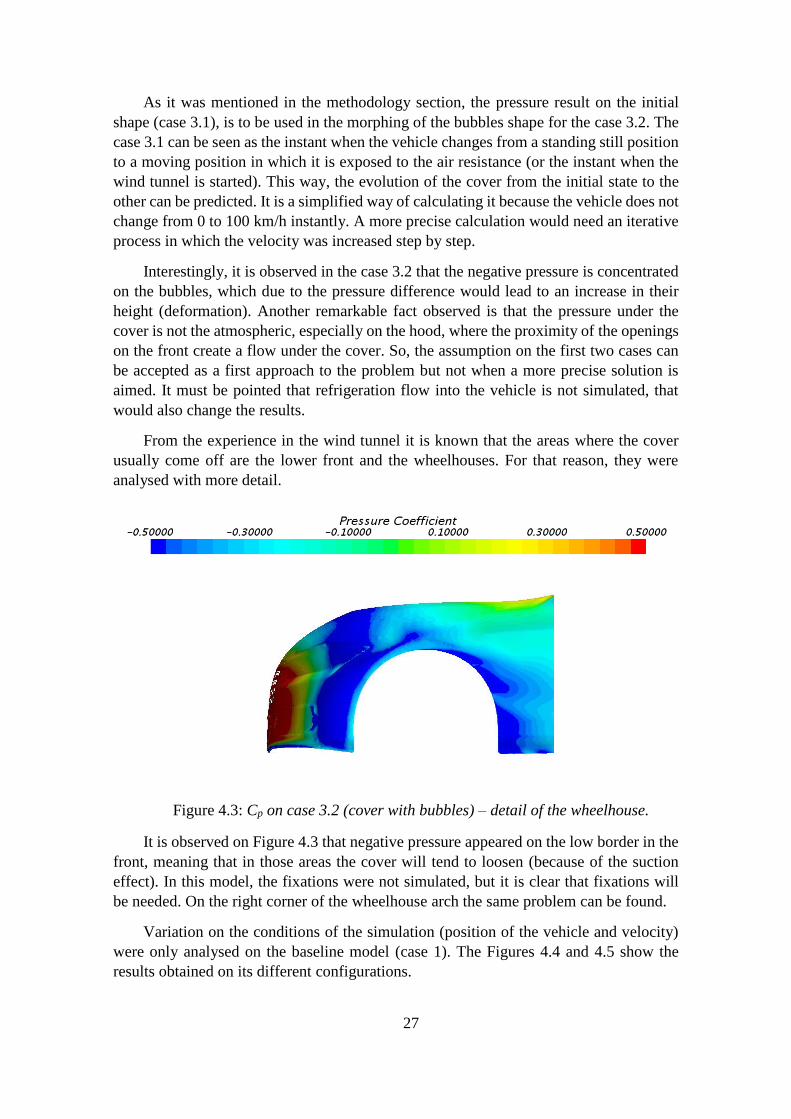
From the experience in the wind tunnel it is known that the areas where the cover
usually come off are the lower front and the wheelhouses. For that reason, they were
analysed with more detail.
Figure 4.3: Cp on case 3.2 (cover with bubbles) – detail of the wheelhouse.
It is observed on Figure 4.3 that negative pressure appeared on the low border in the
front, meaning that in those areas the cover will tend to loosen (because of the suction
effect). In this model, the fixations were not simulated, but it is clear that fixations will
be needed. On the right corner of the wheelhouse arch the same problem can be found.
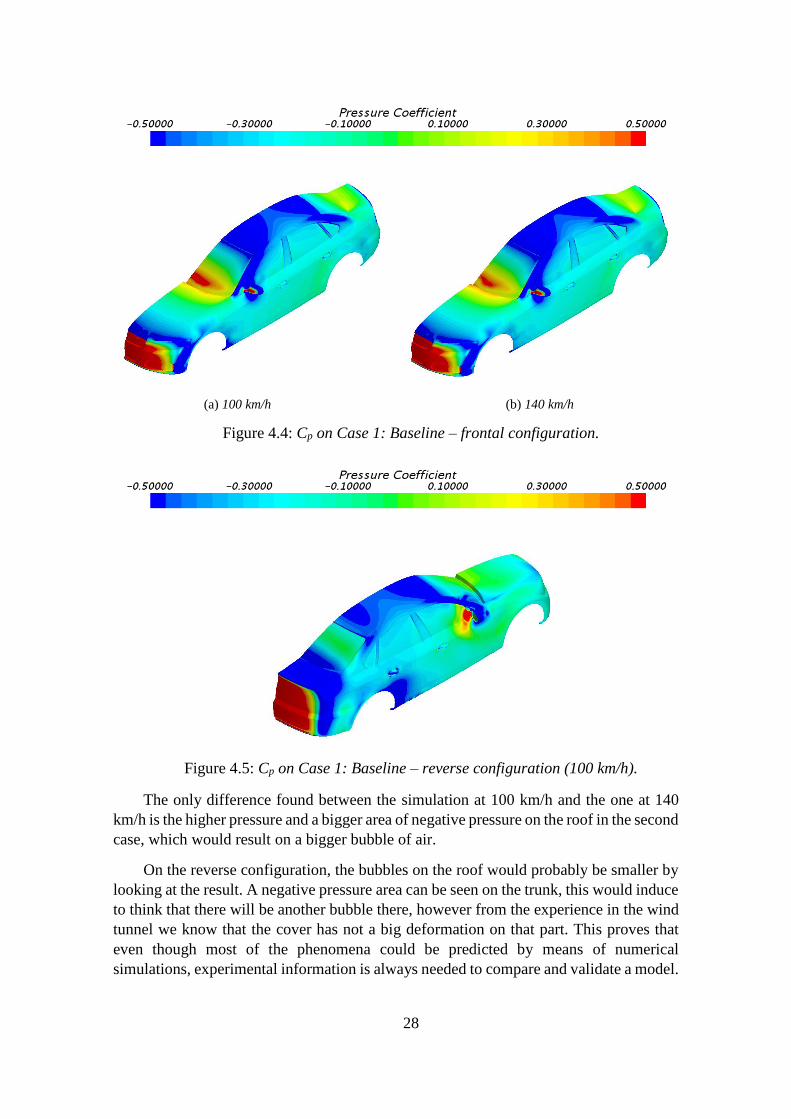
Variation on the conditions of the simulation (position of the vehicle and velocity)
were only analysed on the baseline model (case 1). The Figures 4.4 and 4.5 show the
results obtained on its different configurations.
28
(a) 100 km/h (b) 140 km/h
Figure 4.4: Cp on Case 1: Baseline – frontal configuration.
Figure 4.5: Cp on Case 1: Baseline – reverse configuration (100 km/h).
The only difference found between the simulation at 100 km/h and the one at 140
km/h is the higher pressure and a bigger area of negative pressure on the roof in the second
case, which would result on a bigger bubble of air.
On the reverse configuration, the bubbles on the roof would probably be smaller by
looking at the result. A negative pressure area can be seen on the trunk, this would induce
to think that there will be another bubble there, however from the experience in the wind
tunnel we know that the cover has not a big deformation on that part. This proves that
even though most of the phenomena could be predicted by means of numerical
simulations, experimental information is always needed to compare and validate a model.
29
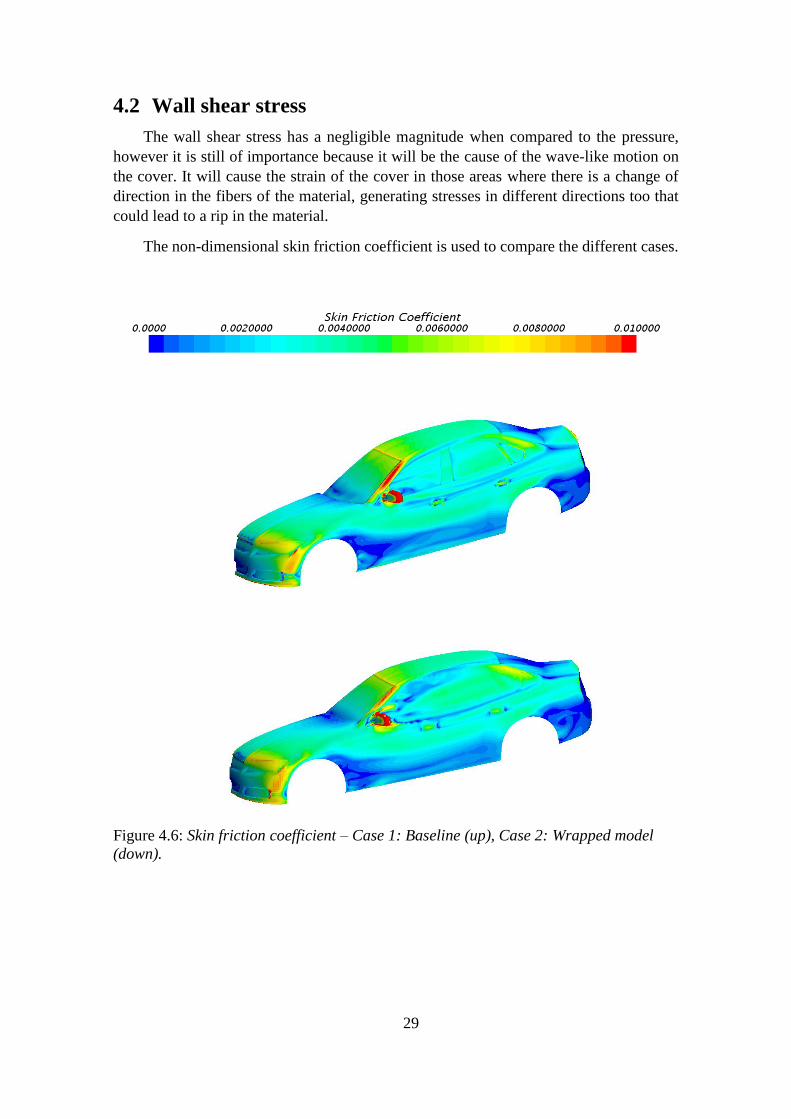
4.2 Wall shear stress
The wall shear stress has a negligible magnitude when compared to the pressure,
however it is still of importance because it will be the cause of the wave-like motion on
the cover. It will cause the strain of the cover in those areas where there is a change of
direction in the fibers of the material, generating stresses in different directions too that
could lead to a rip in the material.
The non-dimensional skin friction coefficient is used to compare the different cases.
Figure 4.6: Skin friction coefficient – Case 1: Baseline (up), Case 2: Wrapped model
(down).
30
(a) Case 3.1
(b) Case 3.2
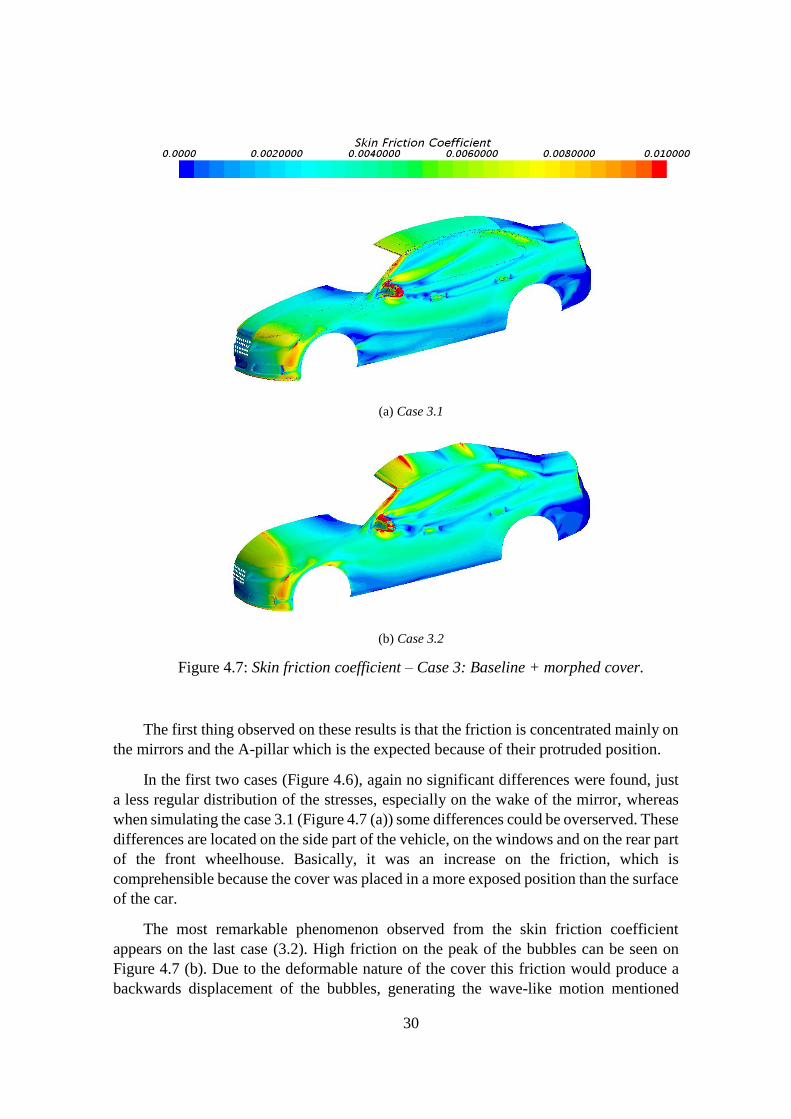
Figure 4.7: Skin friction coefficient – Case 3: Baseline + morphed cover.
The first thing observed on these results is that the friction is concentrated mainly on
the mirrors and the A-pillar which is the expected because of their protruded position.
In the first two cases (Figure 4.6), again no significant differences were found, just
a less regular distribution of the stresses, especially on the wake of the mirror, whereas
when simulating the case 3.1 (Figure 4.7 (a)) some differences could be overserved. These
differences are located on the side part of the vehicle, on the windows and on the rear part
of the front wheelhouse. Basically, it was an increase on the friction, which is
comprehensible because the cover was placed in a more exposed position than the surface
of the car.
The most remarkable phenomenon observed from the skin friction coefficient
appears on the last case (3.2). High friction on the peak of the bubbles can be seen on
Figure 4.7 (b). Due to the deformable nature of the cover this friction would produce a
backwards displacement of the bubbles, generating the wave-like motion mentioned
31
before. To calculate the new shape of the cover, it would be needed an iterative process
combining this result with the one obtained from the pressure.
Another critical point on the cover, besides the front and the wheelhouses, are the
mirrors. The wind tunnel tests result often in a rip on the part of the cover where the
mirror and the A-pillar join. For that reason, the friction was analysed not only on the
front of the car but also on the mirrors.
It must be reminded that the wall shear stress is defined by a vector so that the
direction of it, is of importance. For that reason, only looking to the skin friction
coefficient is not enough, it only represents the magnitude of the vector as a non-
dimensional number. The vector representation was analysed on the areas that its effect
might be critical either causing a rip or the cover to loosen.
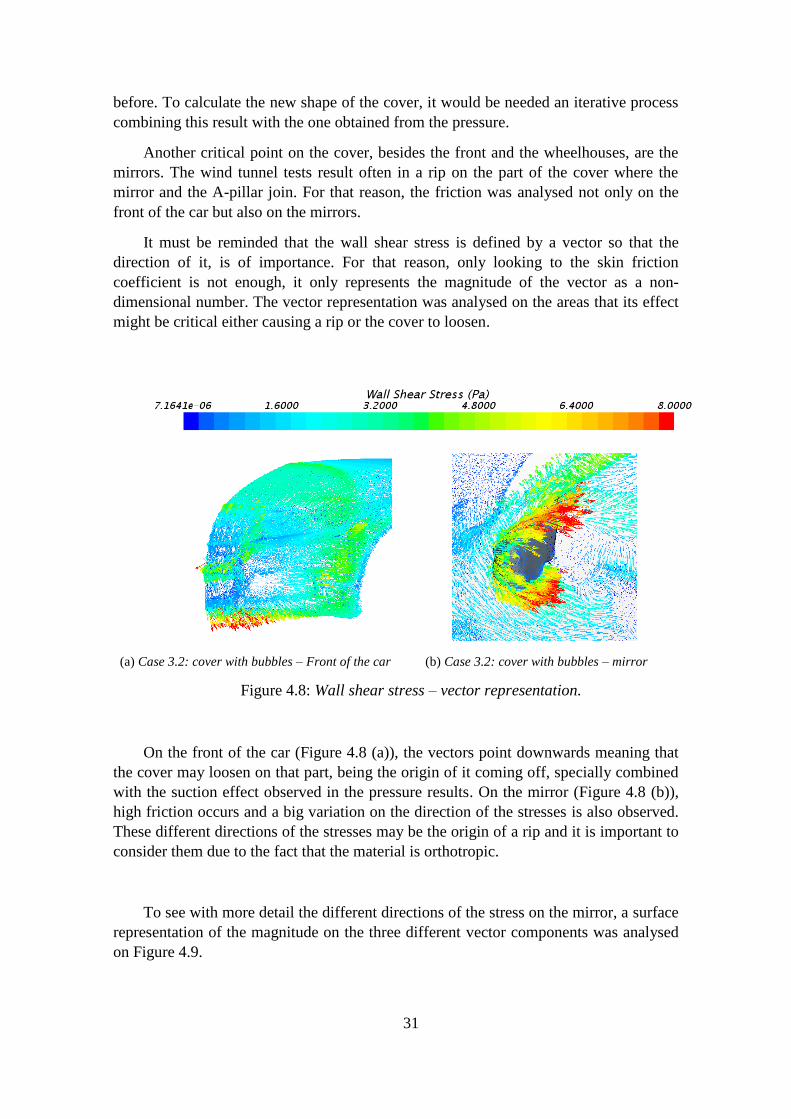
(a) Case 3.2: cover with bubbles – Front of the car (b) Case 3.2: cover with bubbles – mirror
Figure 4.8: Wall shear stress – vector representation.
On the front of the car (Figure 4.8 (a)), the vectors point downwards meaning that
the cover may loosen on that part, being the origin of it coming off, specially combined
with the suction effect observed in the pressure results. On the mirror (Figure 4.8 (b)),
high friction occurs and a big variation on the direction of the stresses is also observed.
These different directions of the stresses may be the origin of a rip and it is important to
consider them due to the fact that the material is orthotropic.
To see with more detail the different directions of the stress on the mirror, a surface
representation of the magnitude on the three different vector components was analysed
on Figure 4.9.
32
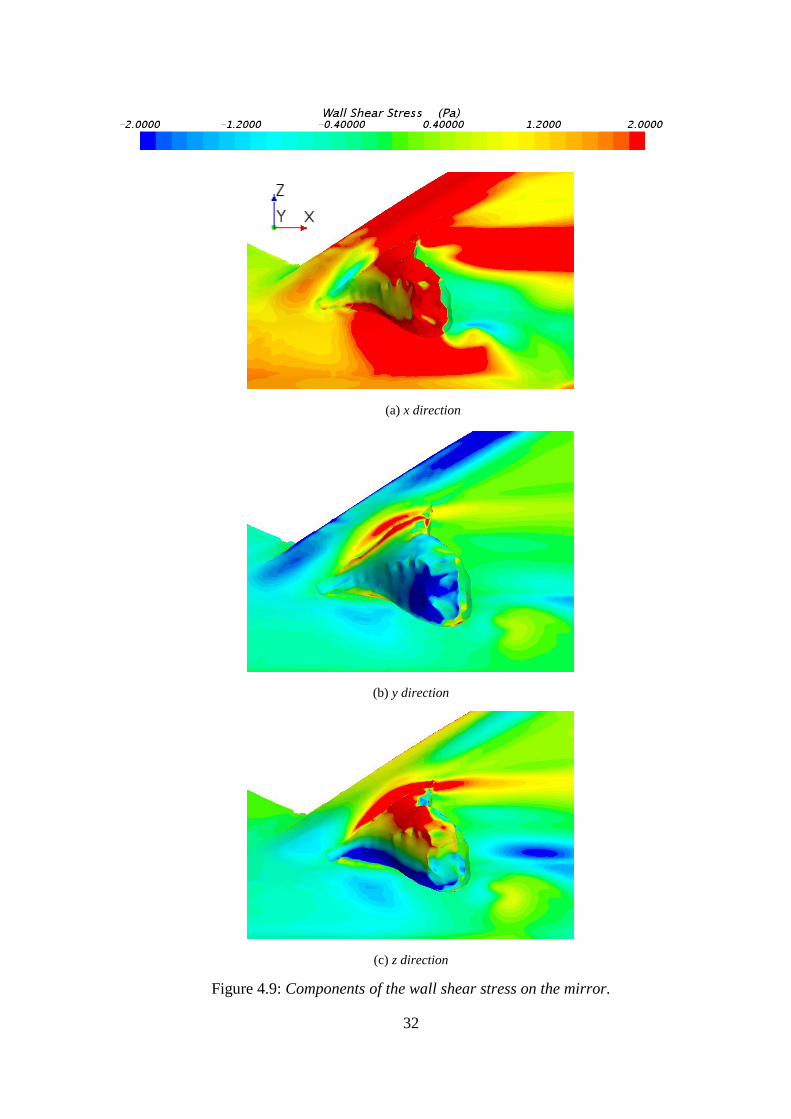
(a) x direction
(b) y direction
(c) z direction
Figure 4.9: Components of the wall shear stress on the mirror.
33
As it was expected, the highest shear stress was found on the x direction, being that
the direction of the air flow. But the most interesting fact is that stress was not only found
to be high on the x direction but also on y and z direction. The y direction is on some parts
of the cover the perpendicular direction, the same as the pressure, for that reason it is the
least important of the three components of the shear stress. However, taking a look at the
z direction, we can see high stress on the upper and lower sides of the mirror as well as
on the joint between the mirror and the A-pillar.
Focusing on that joint, it was made clear by the results that the cover will be subjected
to high stresses on two perpendicular directions (x and z) being this a potential source of
failure or rip on the cover.
Nevertheless, the magnitude of the shear stress is lower than the ultimate tensile
strength of the material (10 N/m2 << 26 x104 N/m2). That lead to a question, from
experience it is known that there are rips on the cover in this part but from the results it
cannot be asserted that. The reason is that in this simulation, the cover was considered as
a rigid body (while in reality it would suffer a deformation caused by the pressure) so the
final shape and stresses are not known from the results obtained. An iterative process, in
which a structural analysis is performed, similar to the one mentioned for sails could give
the final solution and the real stress on the cover.
34
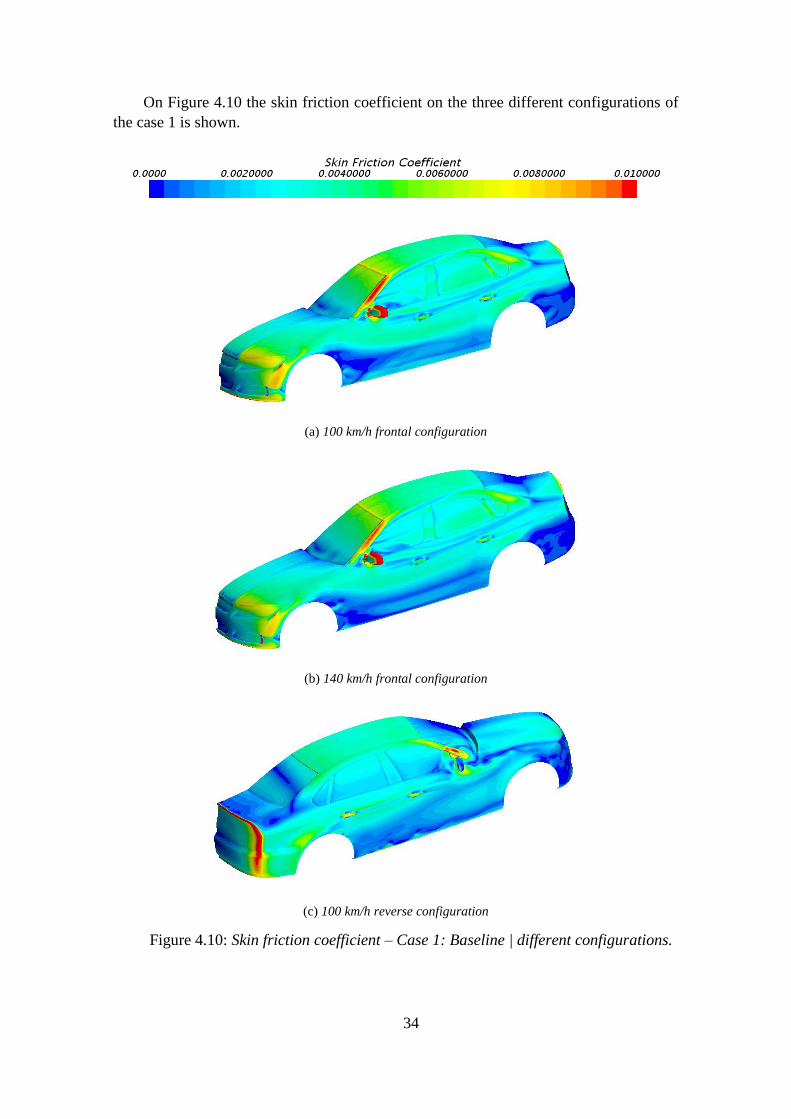
On Figure 4.10 the skin friction coefficient on the three different configurations of
the case 1 is shown.
(a) 100 km/h frontal configuration
(b) 140 km/h frontal configuration
(c) 100 km/h reverse configuration
Figure 4.10: Skin friction coefficient – Case 1: Baseline | different configurations.
35
As it can be seen in Figure 4.10 above, there is not a remarkable difference between
the simulation at 100 km/h and the one at 140 km/h. That is one of the reasons why not
further simulations were carried out at this higher speed.
On the reverse configuration, however new and interesting results can be observed.
High friction appears on the edges of the trunk and again on the joint between the A-pillar
and the mirror.
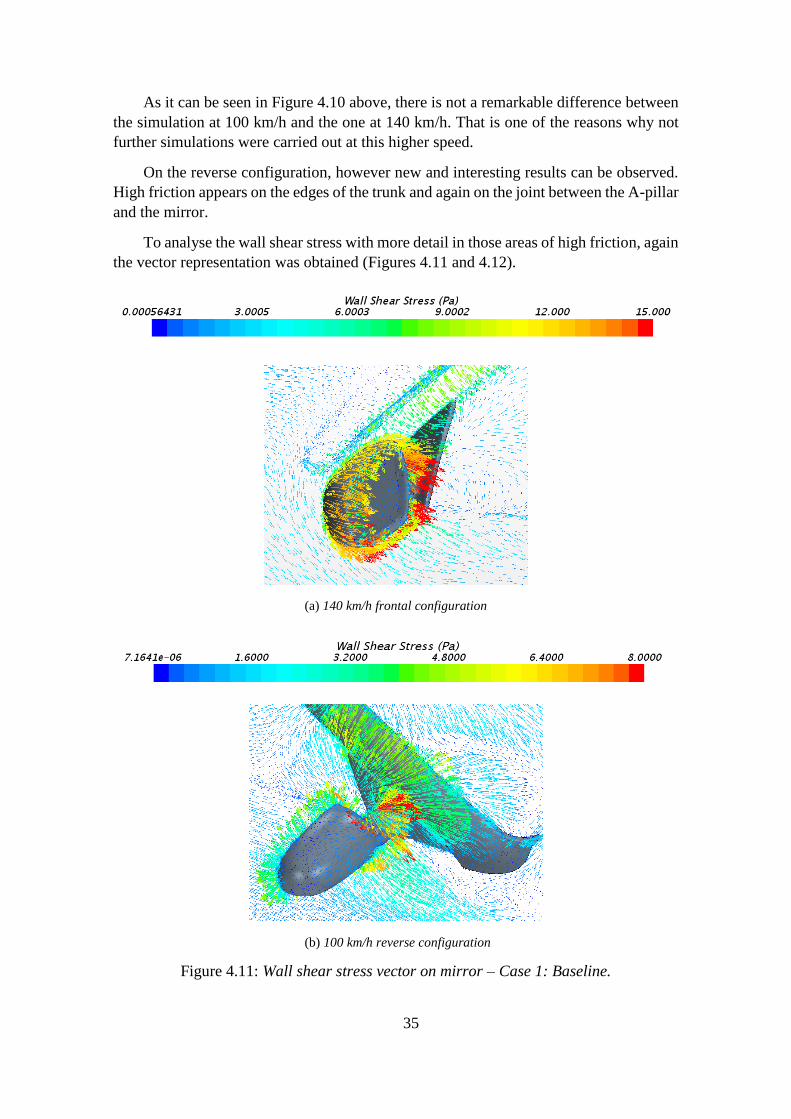
To analyse the wall shear stress with more detail in those areas of high friction, again
the vector representation was obtained (Figures 4.11 and 4.12).
(a) 140 km/h frontal configuration
(b) 100 km/h reverse configuration
Figure 4.11: Wall shear stress vector on mirror – Case 1: Baseline.
36
It can be seen on Figure 4.11 (a) that the magnitude of the shear stress is increased
with respect to the simulations at 100 km/h. It must be noted that the most extreme
situation could happen when two trucks driving in opposite direction pass by near each
other. In that situation, the turbulence would generate higher pressure and thus higher
stress on the cover.
On the Figure 4.11 (b) the reverse configuration shows the same problem on the
mirror as in frontal position, the stress is directed in different directions subjecting the
material of the cover to a strain that may cause a failure. Furthermore, it has to be
considered that in the design of the cover, both the frontal and the reverse configuration
have to be taken into account because there is only one unique design that has to stand
both configurations.
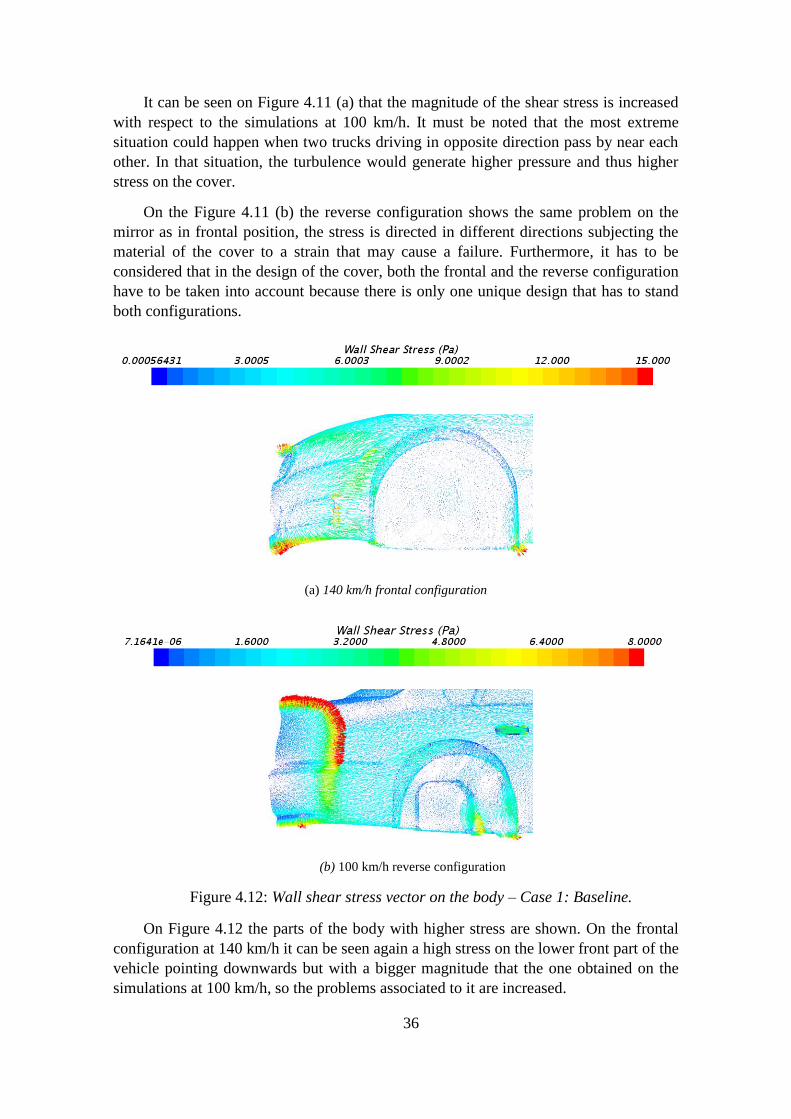
(a) 140 km/h frontal configuration
(b) 100 km/h reverse configuration
Figure 4.12: Wall shear stress vector on the body – Case 1: Baseline.
On Figure 4.12 the parts of the body with higher stress are shown. On the frontal
configuration at 140 km/h it can be seen again a high stress on the lower front part of the
vehicle pointing downwards but with a bigger magnitude that the one obtained on the
simulations at 100 km/h, so the problems associated to it are increased.
37
On the reverse configuration, the high stress is found as we noted before on the edges
of the trunk pointing with approximate 45º on the XZ plane. This, linked to the negative
pressure observed on the trunk before, reinforce the idea of having a lift on the cover over
the trunk. There is no correlation between the model and the actual behaviour of the cover
because no fixations are considered in the model. The cover is very tight on this part of
the car and that is why it does not lift creating a bubble of air.
Finally, it can be pointed out that on both configurations there is a small region on
the corner of the wheelhouse where the vectors point downwards. This could be the cause
of the cover getting loose on that part, meaning that fixations will be needed there as we
know from the experience in the wind tunnel.
38
5 Conclusions
The scope of this work was to establish a first step on a longer process to develop
a procedure to predict where potential problems may be found on the cover used to
protect vehicles under transportation. The objective is to reduce the number of wind
tunnel tests needed and optimize the design process of the cover using a numerical
procedure. In this way, the first step has been taken, developing a procedure to carry
out a simple aerodynamic analysis of a model of the vehicle equipped with a cover.
The first conclusions about this procedure can be extracted. There is a
correlation between the numerical results obtained and the phenomena experienced
on the wind tunnel tests. This correlation is an assessment of being set on a good
direction. Examples of that are the prediction of the bubbles on the hood and on the
roof. When simulating the case 3.2 (the baseline with the cover morphed with
bubbles) the wave-like motion of the cover as experienced in the actual tests was also
predicted by looking at the shear stress. It was also clear that the union between the
mirrors and the A-pillar is a conflict area, although the origin of a rip could not be
asserted yet.
From the different three cases studied it is clear that the case 3 (the baseline with
the morphed cover) gives more accurate results. The main difference is found in the
result of the pressure, obtained on both sides of the cover, which would be essential
for further study about the deformation of the cover.
The conclusions extracted from the study of the case 1 (baseline) at 140 km/h
are that the forces and stresses are higher but not significant difference can be
appreciated on the effects occurring on the cover. For that reason, it would be
interesting to study this situation once the complete procedure that includes a fluid-
structure interaction analysis is established. However, during the development of this
work, the simulation of further cases at this speed would not add any extra
information.
Finally, from the study of the case 1 (baseline) in a reversed position it was
concluded that the results obtained from this configuration to predict the different
stresses that the cover will stand, are necessary to find an optimum design of the
cover. It also made clear that validation of the model is always needed for a further
development of the process.
In spite of the match between some results and the experience from the wind
tunnel, not everything could be predicted. Limitations on the work are found on the
impossibility to calculate the real stresses on the cover. The reasons are that the action
of the fixations was not included in this first approach to the problem and the
deformation of the cover due to the effect of the pressure was neither computed (only
the aerodynamic analysis was performed).
Most of the work that has been carried out was directed to find correlations
between the model and the real experience with the aim of validating and establishing
a robust procedure that can be used in a further development of the method to predict
the possible source of failure on the wind tunnel tests. As a first attempt of studying
39
this kind of problem, the work has given a good insight and set a good basis for future
investigations.
5.1 Further development
With the results and the limitations found on doing this prediction, it should be
considered that the next step is a structural analysis, as it has been done on the sails
analysis, to obtain the actual stresses on the cover (remember that the cover was
simulated as rigid material). This would be an iterative process on which the first
step (aerodynamic analysis) has already been taken.
Another further step would be to include the effect of the fixations on the model
and the simulations, as well as a more detailed geometry including wrinkles.
With the mentioned improvements and further steps, it would be possible to
predict those areas where the fixations or the cover itself will be subjected to a stress
higher than its rupture limit and thus the design of the cover could be optimised
including just the necessary reinforcement (no waste of material) and shortening the
process followed for the design (lower number of tests). In conclusion, costs from
the material and the wind tunnel would be reduced as well as time, yielding a
measurable profit for the company.
40
6 References
[1] A. Heft, T. Indiger and N. Adams, "Introduction of a New Realistic Generic
Car Model for Aerodynamic Investigations", SAE Technical Paper 2012-01-
0168, 2012.
[2] S. Malpede and A. Baraldi, "A Fully Integrated Method For Optimising
Fiber-Membrane Sails", Proceedings of the 3rd High Performance Yacht Design
Conference, 2008.
[3] S. Pinzón, "Introduction To Vortex Lattice Theory", Ciencia y poder aéreo,
ISSN 1909-7050 / E- ISSN 2389-2468 / Volumen 10 / Enero-Diciembre de
2015/ Colombia/ Pp. 1-260, 2015.
[4] Calculation Procedure AEDCAE01. Aerodynamic Performance Assesment
of a Car Exterior With a Closed Front, Volvo Car Corporation, 2012.
41
A Mesh generation: Baseline
Automated mesh:
• Meshers:
o Surface remesher
o Trimmed Cell mesher
o Prism layer mesher
• Default controls
o Base size: 320 mm
o Target surface size: 320 mm
o Minimum surface size: 40 mm
o Surface curvature: basic curvature – 36
o Surface proximity: 2 points in gap
o Surface growth rate: 1.3
o Number of prism layers: 8
o Prism layer stretching: 1.2
o Prism layer total thickness: 16.4990848 mm (First prism layer
thickness: 1 mm)
o Maximum size/thickness ratio: 5
o Maximum cell size: 320 mm
• Custom controls:
o Vehicle surface
▪ Target surface size: 4 mm
▪ Minimum surface size: 4 mm
▪ Surface growth rate: 1.2
o Tunnel surface
▪ Target surface size: 320 mm
▪ Minimum surface size: 320 mm
o Control volume (density box):
▪ Surface remesher custom size: 40 mm
▪ Trimmer: customize isotropic size
42
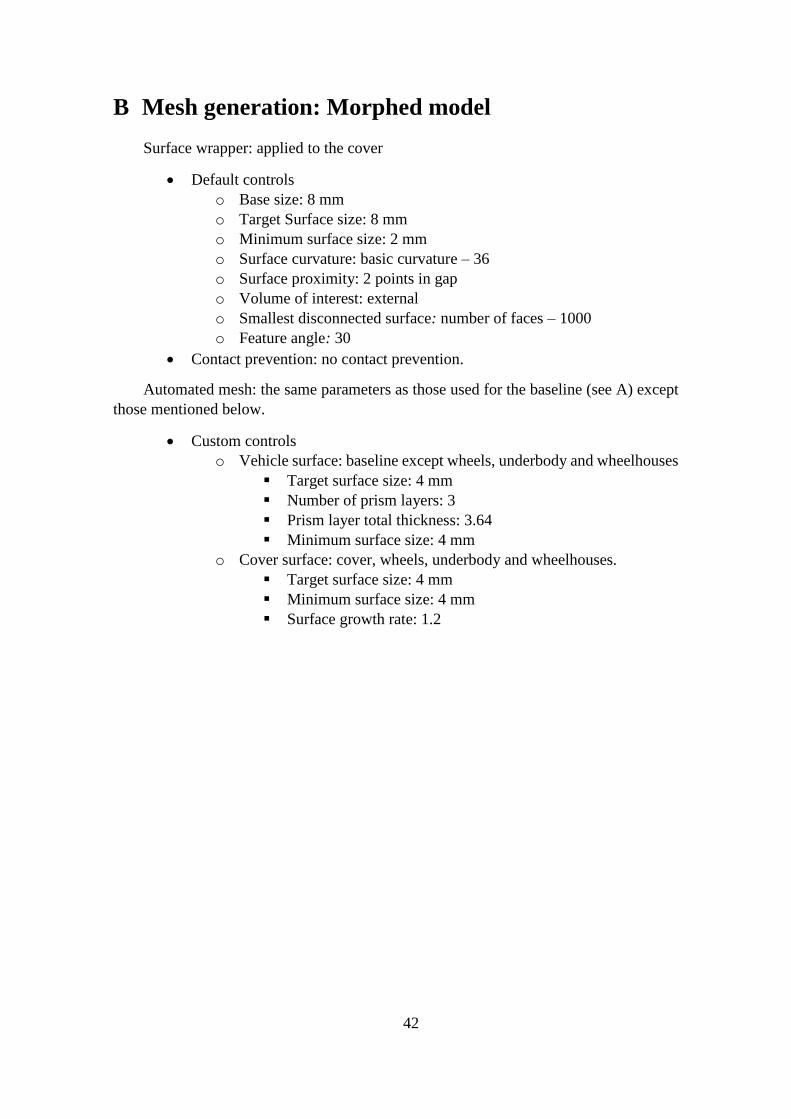
B Mesh generation: Morphed model
Surface wrapper: applied to the cover
• Default controls
o Base size: 8 mm
o Target Surface size: 8 mm
o Minimum surface size: 2 mm
o Surface curvature: basic curvature – 36
o Surface proximity: 2 points in gap
o Volume of interest: external
o Smallest disconnected surface: number of faces – 1000
o Feature angle: 30
• Contact prevention: no contact prevention.
Automated mesh: the same parameters as those used for the baseline (see A) except
those mentioned below.
• Custom controls
o Vehicle surface: baseline except wheels, underbody and wheelhouses
▪ Target surface size: 4 mm
▪ Number of prism layers: 3
▪ Prism layer total thickness: 3.64
▪ Minimum surface size: 4 mm
o Cover surface: cover, wheels, underbody and wheelhouses.
▪ Target surface size: 4 mm
▪ Minimum surface size: 4 mm
▪ Surface growth rate: 1.2
43
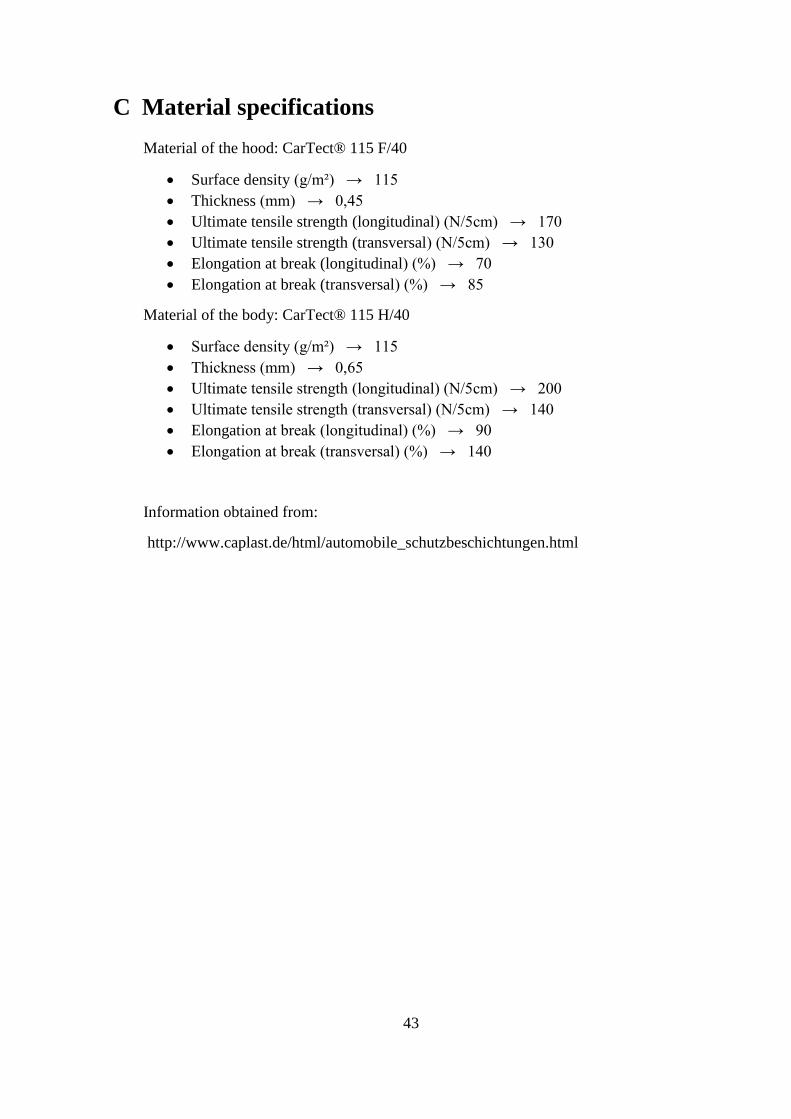
C Material specifications
Material of the hood: CarTect® 115 F/40
• Surface density (g/m²) → 115
• Thickness (mm) → 0,45
• Ultimate tensile strength (longitudinal) (N/5cm) → 170
• Ultimate tensile strength (transversal) (N/5cm) → 130
• Elongation at break (longitudinal) (%) → 70
• Elongation at break (transversal) (%) → 85
Material of the body: CarTect® 115 H/40
• Surface density (g/m²) → 115
• Thickness (mm) → 0,65
• Ultimate tensile strength (longitudinal) (N/5cm) → 200
• Ultimate tensile strength (transversal) (N/5cm) → 140
• Elongation at break (longitudinal) (%) → 90
• Elongation at break (transversal) (%) → 140
Information obtained from:
http://www.caplast.de/html/automobile_schutzbeschichtungen.html