Embed Size (px)
Citation preview
This document is downloaded from DR‑NTU (https://dr.ntu.edu.sg)Nanyang Technological University, Singapore.
Numerical studies on plasma parametermodulation of atmospheric pressure dielectricbarrier discharge via 200 kHz/13.56 MHzdual‑frequency excitation
Nie, Q. Y.; Zhang, Z. L.; Lim, Mark Jian Wei
2019
Nie, Q. Y., Zhang, Z. L., & Lim, M. J. W. (2019). Numerical studies on plasma parametermodulation of atmospheric pressure dielectric barrier discharge via 200 kHz/13.56 MHzdual‑frequency excitation. Physics of Plasmas, 26(6), 063504‑. doi:10.1063/1.5091815
https://hdl.handle.net/10356/87098
https://doi.org/10.1063/1.5091815
© 2019 The Author(s). All rights reserved. This paper was published by AIP in Physics ofPlasmas and is made available with permission of The Author(s).
Downloaded on 06 Apr 2022 06:17:48 SGT
Numerical studies on plasma parametermodulation of atmospheric pressure dielectricbarrier discharge via 200 kHz/13.56 MHzdual-frequency excitation
Cite as: Phys. Plasmas 26, 063504 (2019); doi: 10.1063/1.5091815Submitted: 5 February 2019 . Accepted: 14 May 2019 .Published Online: 6 June 2019
Q. Y. Nie,1,2 Z. L. Zhang,2,a) and J. W. M. Lim3
AFFILIATIONS1School of Electrical Engineering and Automation, Harbin Institute of Technology, Harbin 150001, China2Laboratory for Space Environment and Physical Sciences, Harbin Institute of Technology, Harbin 150001, China3Energy Research Institute at NTU, Nanyang Technological University, 637141 Singapore
a)Author to whom correspondence should be addressed: [email protected]
ABSTRACT
The performance of atmospheric pressure dielectric barrier discharge (DBD) driven by dual-frequency sources of 200 kHz/13.56MHz hasbeen investigated numerically here in a one-dimensional fluid model. By varying the ratio of dual frequency excitation amplitudes, strongnonlinear coupling in the discharge is observed, with the electron density rising significantly due to the synergistic effect governing the ioni-zation process. Moreover, it is shown that the phase shift between the dual frequencies also has an influence on the electron temperature anddensity. As to different high frequency components, the modulation of the electron temperature and density induced by the phase-shift alsovaries significantly. Those results then demonstrated the possibility of applying amplitude and/or phase modulations in a wide operationwindow to optimize the plasma parameters in dual-frequency DBDs with fixed frequencies.
Published under license by AIP Publishing. https://doi.org/10.1063/1.5091815
I. INTRODUCTION
In recent years, nonequilibrium cold atmospheric plasmas(CAPs) have been extensively investigated for various industrial appli-cations, such as materials processing,1–6 environment engineering,7
plasma chemistry;8 and other emerging fields directing plasma treat-ment on biological samples, such as plasma medicine.9–11 Differentrequirements for plasma parameters are application-specific, accord-ing to the different natures of discharge parameters and the responseof substrates to processing conditions. For materials processing in gen-eral, the goal is to pursue a high plasma density with controllable elec-tron/ion energy and process uniformity over a large area. Forbiomedical applications particularly, adjustable higher plasma densityand gas temperature are prerequisite to realize different purposes suchas inactivation, modification, and sterilization.
In comparison with various configurations in generating CAPs,dielectric barrier discharges (DBDs) have shown unique features withhigher plasma densities, lower gas temperatures, higher production rate ofreactive chemical species, and more effective restriction on discharge cur-rents to obtain stable discharges.12,13 Therefore, DBDs of different
configurations are widely studied in various aspects. In conventional DBDsystems, a sinusoidal mono-excitation source is usually adopted with aselected frequency range from kilohertz to megahertz regimes.14,15 Undera single kilohertz frequency excitation, an increased input power causes ahigher plasma density and higher concentration of reactive species.Meanwhile, nevertheless, the resulting higher gas temperature and fila-mentary discharge with significant spatial nonuniformity is inevitable,restricting its applications in some fields. While increasing the excitationfrequency to the megahertz regime, as an effective method to improve theuniformity and increase the density of the plasma, it is usually accompa-nied by a high gas temperature and a low electron/ion energy, undesirablefor certain applications. Thus, it is a great challenge to realize the indepen-dent control of plasma parameters by DBDs with the single frequencyexcitation sources. In order to solve the problem, a dual-frequency modu-lation facility has been proposed16–20 and preliminary works have indi-cated the feasibility for applications requiring precise independent controlof plasma parameters. Such DBD systems operated with additional powersupplies driven by different frequencies have attracted extensive attentionas a mainstream plasma source for various applications.
Phys. Plasmas 26, 063504 (2019); doi: 10.1063/1.5091815 26, 063504-1
Published under license by AIP Publishing
Physics of Plasmas ARTICLE scitation.org/journal/php
In previous dual-frequency DBD system studies, the ratio of thetwo frequencies is of paramount importance in achieving control overplasma parameters. By means of simulation, Rauf and Kushner21
found that at large ratios of two frequencies (xh�xl, e.g., xh/xl¼ 13.56MHz/100 kHz), the spectrum of the two discharge currentswas a superposition of the spectra from the two single-frequency sour-ces under certain conditions. On the contrary, when the two frequen-cies are comparatively different (xh/xl¼ 13.56MHz/6.78MHz), anobvious nonlinear effect was observed. This is indicated by the appear-ance of higher harmonics and sidebands in the spectrum. By means ofexperiments, Massines et al.22 found the sum and beat frequenciesaccordingly in the dual-frequency (xh/xl¼ 13.56MHz/50 kHz) DBDsystem. In our previous work involving numerical simulations,23,24 wefound a coupling sheath structure and sum/beat frequency under the con-dition of xh/xl¼ 13.56MHz/2MHz. The studies mentioned above posi-tively indicate that the dual-frequency system can effectively influence theplasma parameters based on strong nonlinear effects. However, despiteremarkable achievements of studies on the plasma parameter modulationby using appreciate frequency matching, the investigation of amplitudesand phase-shift of the dual frequency excitations on the plasma parame-ters modulation in such a complex system is still not clear.
In this paper, we report the numerical investigation of plasmaelectron temperature and electron density control in 200 kHz/13.56MHz dual-frequency DBD system by applying amplitude modu-lation. On the basis, an additional modulation of the above key plasmaparameters caused by phase-shift effect is explored. The investigationpredicts a possible route to realize the plasma parameters modulationwith a large operation window in the dual-frequency DBD systemwith fixed frequencies. In Sec. II, the simulation model is described.Then the results and associated analysis are presented in Sec. III, par-ticularly with regard to the nonlinear coupling effect. The paper is con-cluded in Sec. IV with summary.
II. MODEL DESCRIPTIONA. Model equations
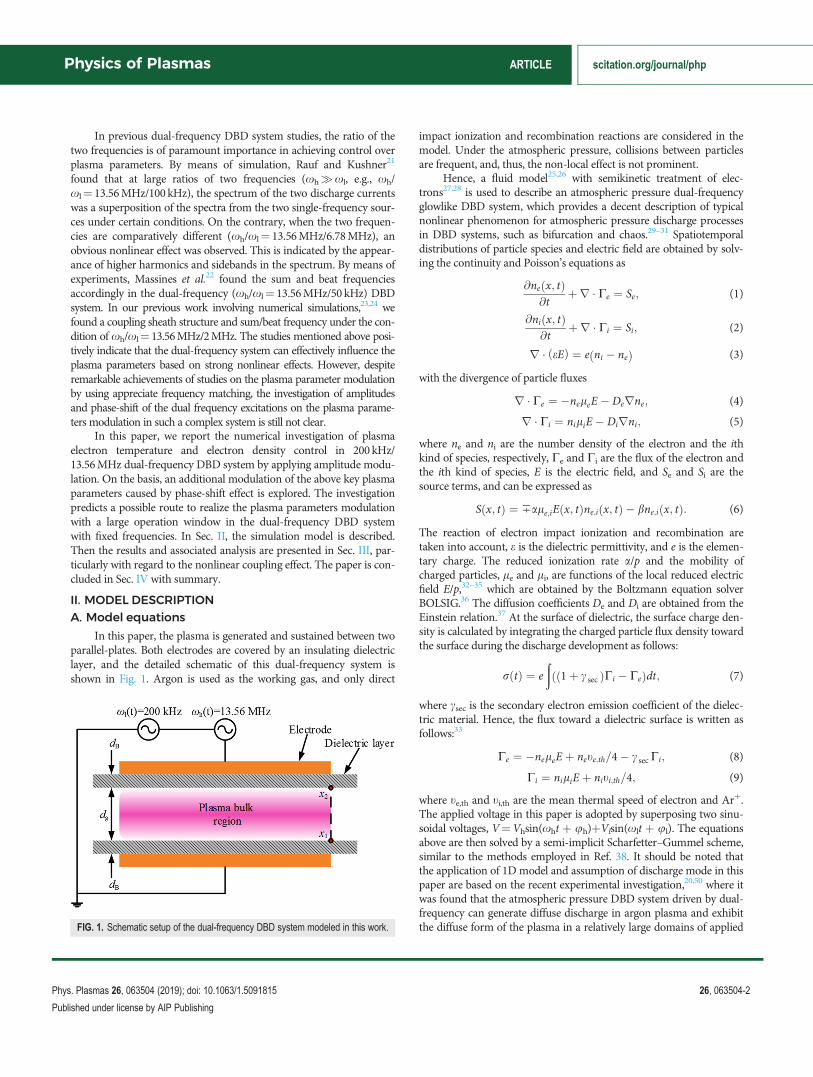
In this paper, the plasma is generated and sustained between twoparallel-plates. Both electrodes are covered by an insulating dielectriclayer, and the detailed schematic of this dual-frequency system isshown in Fig. 1. Argon is used as the working gas, and only direct
impact ionization and recombination reactions are considered in themodel. Under the atmospheric pressure, collisions between particlesare frequent, and, thus, the non-local effect is not prominent.
Hence, a fluid model25,26 with semikinetic treatment of elec-trons27,28 is used to describe an atmospheric pressure dual-frequencyglowlike DBD system, which provides a decent description of typicalnonlinear phenomenon for atmospheric pressure discharge processesin DBD systems, such as bifurcation and chaos.29–31 Spatiotemporaldistributions of particle species and electric field are obtained by solv-ing the continuity and Poisson’s equations as
@ne x; tð Þ@t
þr � Ce ¼ Se; (1)
@ni x; tð Þ@t
þr � Ci ¼ Si; (2)
r � eEð Þ ¼ e ni � neð Þ (3)
with the divergence of particle fluxes
r � Ce ¼ �neleE � Derne; (4)
r � Ci ¼ niliE � Dirni; (5)
where ne and ni are the number density of the electron and the ithkind of species, respectively, Ce and Ci are the flux of the electron andthe ith kind of species, E is the electric field, and Se and Si are thesource terms, and can be expressed as
S x; tð Þ ¼ 7ale;iE x; tð Þne;i x; tð Þ � bne;i x; tð Þ: (6)
The reaction of electron impact ionization and recombination aretaken into account, e is the dielectric permittivity, and e is the elemen-tary charge. The reduced ionization rate a/p and the mobility ofcharged particles, le and li, are functions of the local reduced electricfield E/p,32–35 which are obtained by the Boltzmann equation solverBOLSIG.36 The diffusion coefficients De and Di are obtained from theEinstein relation.37 At the surface of dielectric, the surface charge den-sity is calculated by integrating the charged particle flux density towardthe surface during the discharge development as follows:
rðtÞ ¼ eð
1þ c secð ÞCi � Ceð Þdt; (7)
where csec is the secondary electron emission coefficient of the dielec-tric material. Hence, the flux toward a dielectric surface is written asfollows:33
Ce ¼ �neleE þ nete;th=4� c secCi; (8)
Ci ¼ niliE þ niti;th=4; (9)
where te,th and ti,th are the mean thermal speed of electron and Arþ.The applied voltage in this paper is adopted by superposing two sinu-soidal voltages, V¼Vhsin(xht þ uh)þVlsin(xlt þ ul). The equationsabove are then solved by a semi-implicit Scharfetter–Gummel scheme,similar to the methods employed in Ref. 38. It should be noted thatthe application of 1D model and assumption of discharge mode in thispaper are based on the recent experimental investigation,20,50 where itwas found that the atmospheric pressure DBD system driven by dual-frequency can generate diffuse discharge in argon plasma and exhibitthe diffuse form of the plasma in a relatively large domains of appliedFIG. 1. Schematic setup of the dual-frequency DBD system modeled in this work.
Physics of Plasmas ARTICLE scitation.org/journal/php
Phys. Plasmas 26, 063504 (2019); doi: 10.1063/1.5091815 26, 063504-2
Published under license by AIP Publishing
parameters. Therefore, in such a situation, the 1D model can be aproper approximation to describe the discharge characteristics andelectron dynamic behavior.51
B. Species and reactions
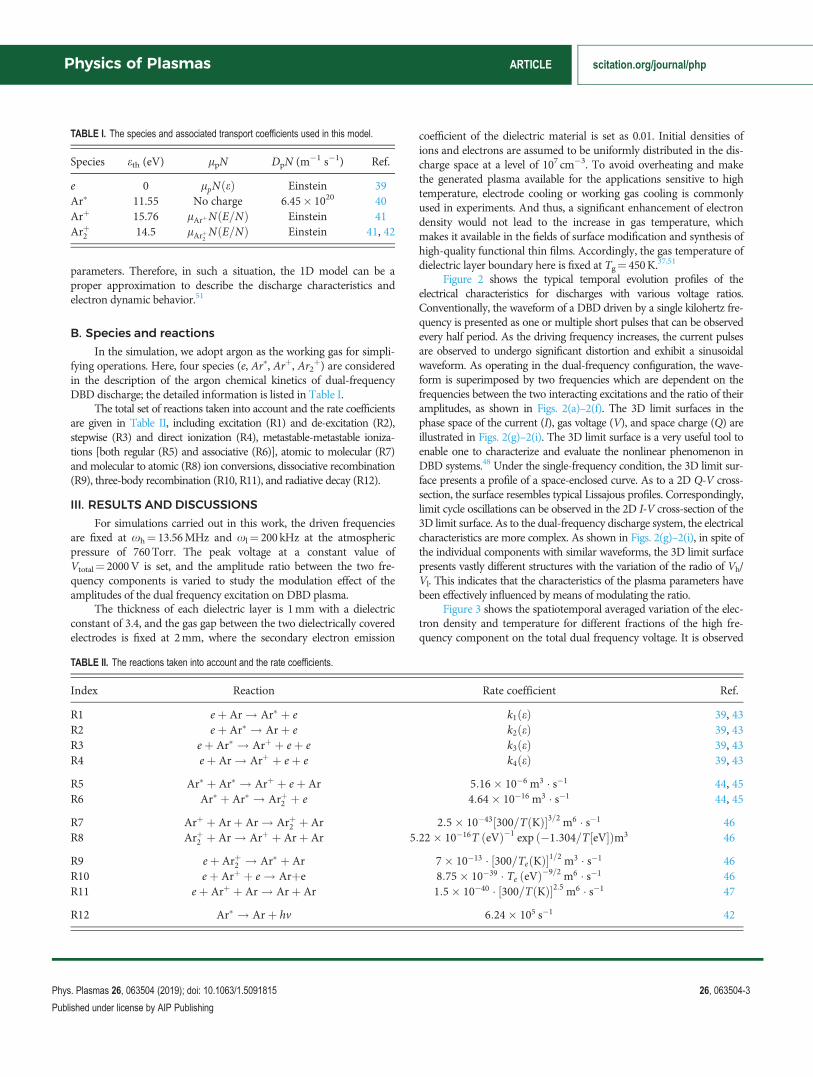
In the simulation, we adopt argon as the working gas for simpli-fying operations. Here, four species (e, Ar�, Arþ, Ar2
þ) are consideredin the description of the argon chemical kinetics of dual-frequencyDBD discharge; the detailed information is listed in Table I.
The total set of reactions taken into account and the rate coefficientsare given in Table II, including excitation (R1) and de-excitation (R2),stepwise (R3) and direct ionization (R4), metastable-metastable ioniza-tions [both regular (R5) and associative (R6)], atomic to molecular (R7)and molecular to atomic (R8) ion conversions, dissociative recombination(R9), three-body recombination (R10, R11), and radiative decay (R12).
III. RESULTS AND DISCUSSIONS
For simulations carried out in this work, the driven frequenciesare fixed at xh¼ 13.56MHz and xl¼ 200 kHz at the atmosphericpressure of 760Torr. The peak voltage at a constant value ofVtotal¼ 2000V is set, and the amplitude ratio between the two fre-quency components is varied to study the modulation effect of theamplitudes of the dual frequency excitation on DBD plasma.
The thickness of each dielectric layer is 1mm with a dielectricconstant of 3.4, and the gas gap between the two dielectrically coveredelectrodes is fixed at 2mm, where the secondary electron emission
coefficient of the dielectric material is set as 0.01. Initial densities ofions and electrons are assumed to be uniformly distributed in the dis-charge space at a level of 107 cm�3. To avoid overheating and makethe generated plasma available for the applications sensitive to hightemperature, electrode cooling or working gas cooling is commonlyused in experiments. And thus, a significant enhancement of electrondensity would not lead to the increase in gas temperature, whichmakes it available in the fields of surface modification and synthesis ofhigh-quality functional thin films. Accordingly, the gas temperature ofdielectric layer boundary here is fixed at Tg¼ 450K.37,51
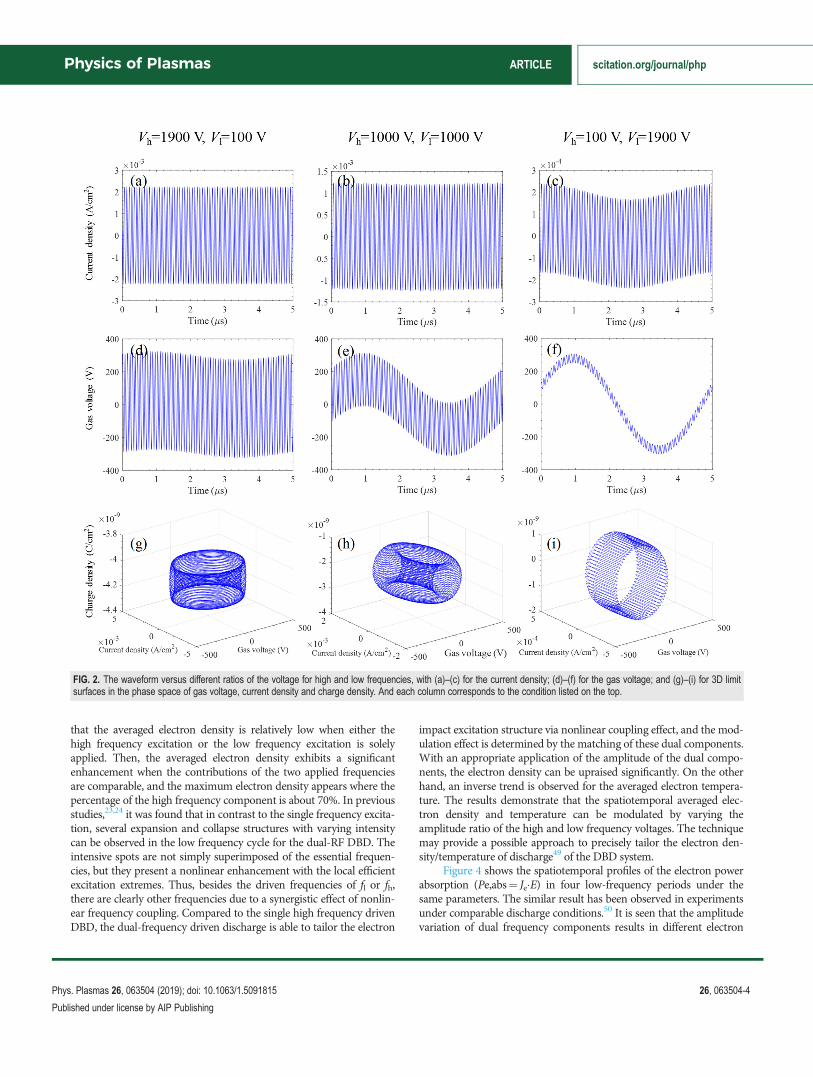
Figure 2 shows the typical temporal evolution profiles of theelectrical characteristics for discharges with various voltage ratios.Conventionally, the waveform of a DBD driven by a single kilohertz fre-quency is presented as one or multiple short pulses that can be observedevery half period. As the driving frequency increases, the current pulsesare observed to undergo significant distortion and exhibit a sinusoidalwaveform. As operating in the dual-frequency configuration, the wave-form is superimposed by two frequencies which are dependent on thefrequencies between the two interacting excitations and the ratio of theiramplitudes, as shown in Figs. 2(a)–2(f). The 3D limit surfaces in thephase space of the current (I), gas voltage (V), and space charge (Q) areillustrated in Figs. 2(g)–2(i). The 3D limit surface is a very useful tool toenable one to characterize and evaluate the nonlinear phenomenon inDBD systems.48 Under the single-frequency condition, the 3D limit sur-face presents a profile of a space-enclosed curve. As to a 2D Q-V cross-section, the surface resembles typical Lissajous profiles. Correspondingly,limit cycle oscillations can be observed in the 2D I-V cross-section of the3D limit surface. As to the dual-frequency discharge system, the electricalcharacteristics are more complex. As shown in Figs. 2(g)–2(i), in spite ofthe individual components with similar waveforms, the 3D limit surfacepresents vastly different structures with the variation of the radio of Vh/Vl. This indicates that the characteristics of the plasma parameters havebeen effectively influenced by means of modulating the ratio.
Figure 3 shows the spatiotemporal averaged variation of the elec-tron density and temperature for different fractions of the high fre-quency component on the total dual frequency voltage. It is observed
TABLE I. The species and associated transport coefficients used in this model.
Species eth (eV) lpN DpN (m�1 s�1) Ref.
e 0 lpNðeÞ Einstein 39Ar� 11.55 No charge 6.45� 1020 40Arþ 15.76 lArþNðE=NÞ Einstein 41Arþ2 14.5 lArþ2
NðE=NÞ Einstein 41, 42
TABLE II. The reactions taken into account and the rate coefficients.
Index Reaction Rate coefficient Ref.
R1 eþ Ar! Ar� þ e k1ðeÞ 39, 43R2 eþ Ar� ! Arþ e k2ðeÞ 39, 43R3 eþ Ar� ! Arþ þ eþ e k3ðeÞ 39, 43R4 eþ Ar! Arþ þ eþ e k4ðeÞ 39, 43
R5 Ar� þ Ar� ! Arþ þ eþ Ar 5:16� 10�6 m3 � s�1 44, 45R6 Ar� þ Ar� ! Arþ2 þ e 4:64� 10�16 m3 � s�1 44, 45
R7 Arþ þ Arþ Ar! Arþ2 þ Ar 2:5� 10�43½300=TðKÞ�3=2 m6 � s�1 46R8 Arþ2 þ Ar! Arþ þ Arþ Ar 5:22� 10�16T ðeVÞ�1 exp ð�1:304=T½eV�Þm3 46
R9 eþ Arþ2 ! Ar� þ Ar 7� 10�13 � ½300=TeðKÞ�1=2 m3 � s�1 46R10 eþ Arþ þ e! Arþe 8:75� 10�39 � Te ðeVÞ�9=2 m6 � s�1 46R11 eþ Arþ þ Ar! Arþ Ar 1:5� 10�40 � ½300=TðKÞ�2:5 m6 � s�1 47
R12 Ar� ! Arþ hv 6:24� 105 s�1 42
Physics of Plasmas ARTICLE scitation.org/journal/php
Phys. Plasmas 26, 063504 (2019); doi: 10.1063/1.5091815 26, 063504-3
Published under license by AIP Publishing
that the averaged electron density is relatively low when either thehigh frequency excitation or the low frequency excitation is solelyapplied. Then, the averaged electron density exhibits a significantenhancement when the contributions of the two applied frequenciesare comparable, and the maximum electron density appears where thepercentage of the high frequency component is about 70%. In previousstudies,23,24 it was found that in contrast to the single frequency excita-tion, several expansion and collapse structures with varying intensitycan be observed in the low frequency cycle for the dual-RF DBD. Theintensive spots are not simply superimposed of the essential frequen-cies, but they present a nonlinear enhancement with the local efficientexcitation extremes. Thus, besides the driven frequencies of fl or fh,there are clearly other frequencies due to a synergistic effect of nonlin-ear frequency coupling. Compared to the single high frequency drivenDBD, the dual-frequency driven discharge is able to tailor the electron
impact excitation structure via nonlinear coupling effect, and the mod-ulation effect is determined by the matching of these dual components.With an appropriate application of the amplitude of the dual compo-nents, the electron density can be upraised significantly. On the otherhand, an inverse trend is observed for the averaged electron tempera-ture. The results demonstrate that the spatiotemporal averaged elec-tron density and temperature can be modulated by varying theamplitude ratio of the high and low frequency voltages. The techniquemay provide a possible approach to precisely tailor the electron den-sity/temperature of discharge49 of the DBD system.
Figure 4 shows the spatiotemporal profiles of the electron powerabsorption (Pe,abs¼ Je�E) in four low-frequency periods under thesame parameters. The similar result has been observed in experimentsunder comparable discharge conditions.50 It is seen that the amplitudevariation of dual frequency components results in different electron
FIG. 2. The waveform versus different ratios of the voltage for high and low frequencies, with (a)–(c) for the current density; (d)–(f) for the gas voltage; and (g)–(i) for 3D limitsurfaces in the phase space of gas voltage, current density and charge density. And each column corresponds to the condition listed on the top.
Physics of Plasmas ARTICLE scitation.org/journal/php
Phys. Plasmas 26, 063504 (2019); doi: 10.1063/1.5091815 26, 063504-4
Published under license by AIP Publishing
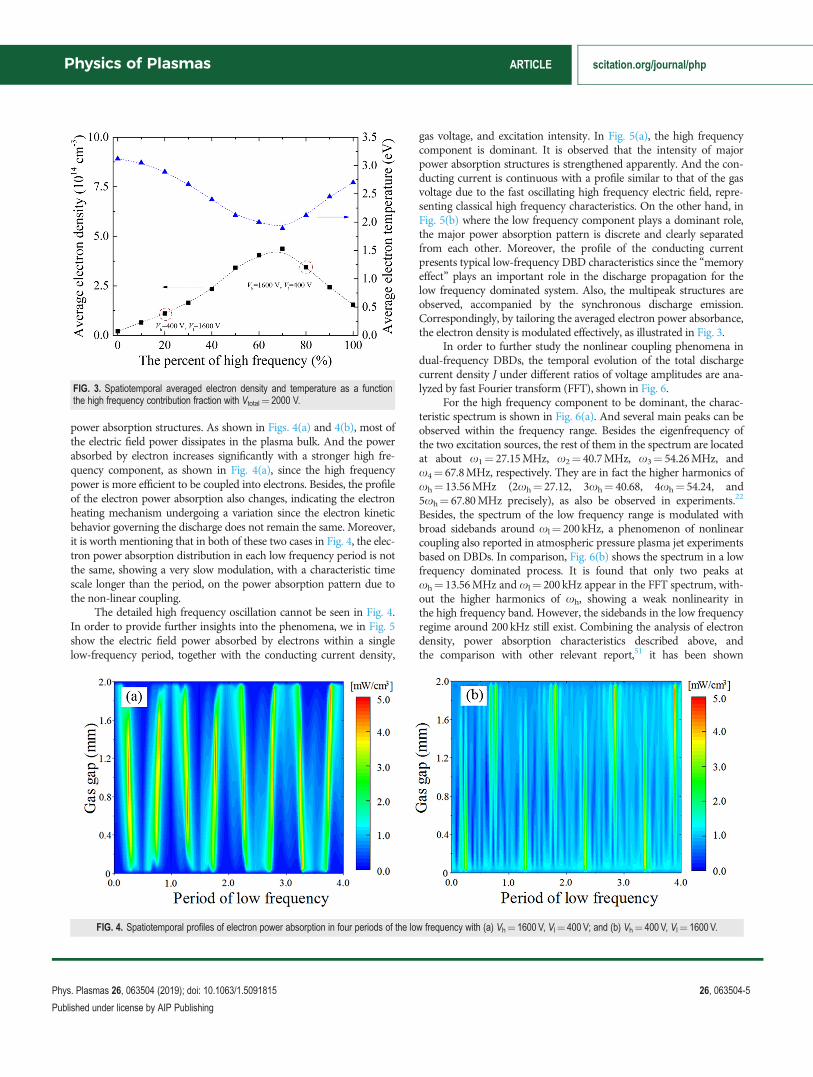
power absorption structures. As shown in Figs. 4(a) and 4(b), most ofthe electric field power dissipates in the plasma bulk. And the powerabsorbed by electron increases significantly with a stronger high fre-quency component, as shown in Fig. 4(a), since the high frequencypower is more efficient to be coupled into electrons. Besides, the profileof the electron power absorption also changes, indicating the electronheating mechanism undergoing a variation since the electron kineticbehavior governing the discharge does not remain the same. Moreover,it is worth mentioning that in both of these two cases in Fig. 4, the elec-tron power absorption distribution in each low frequency period is notthe same, showing a very slow modulation, with a characteristic timescale longer than the period, on the power absorption pattern due tothe non-linear coupling.
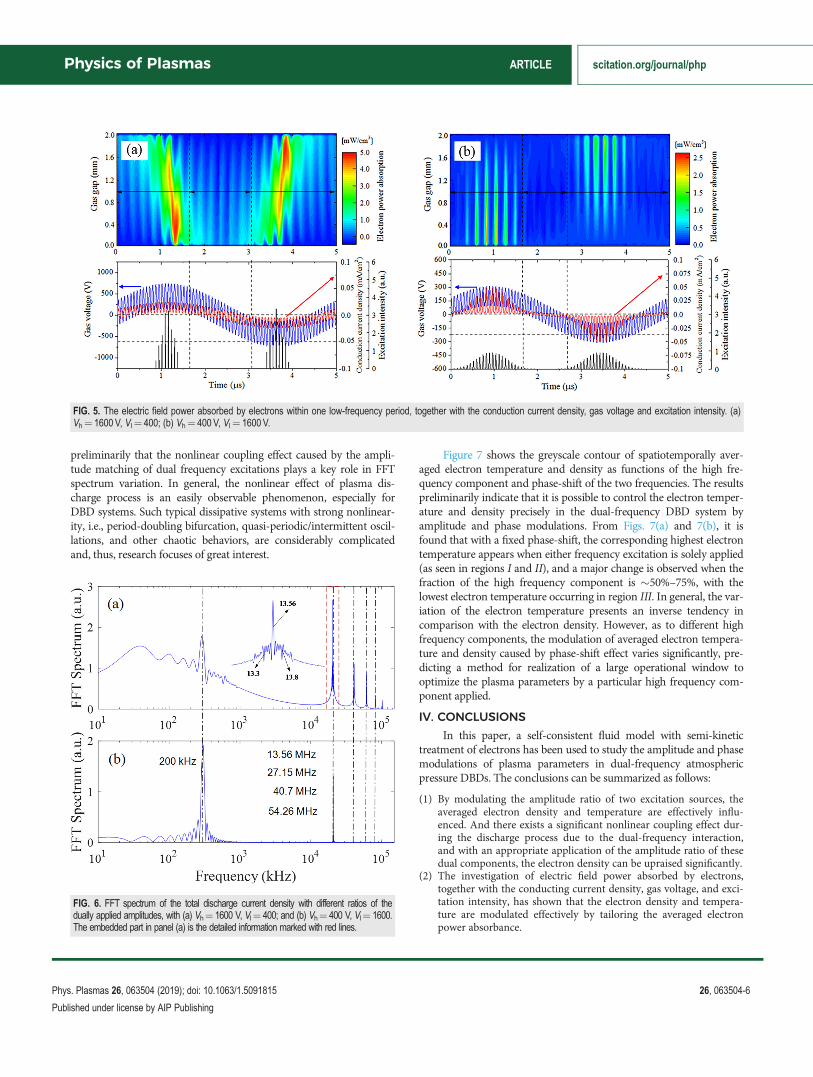
The detailed high frequency oscillation cannot be seen in Fig. 4.In order to provide further insights into the phenomena, we in Fig. 5show the electric field power absorbed by electrons within a singlelow-frequency period, together with the conducting current density,
gas voltage, and excitation intensity. In Fig. 5(a), the high frequencycomponent is dominant. It is observed that the intensity of majorpower absorption structures is strengthened apparently. And the con-ducting current is continuous with a profile similar to that of the gasvoltage due to the fast oscillating high frequency electric field, repre-senting classical high frequency characteristics. On the other hand, inFig. 5(b) where the low frequency component plays a dominant role,the major power absorption pattern is discrete and clearly separatedfrom each other. Moreover, the profile of the conducting currentpresents typical low-frequency DBD characteristics since the “memoryeffect” plays an important role in the discharge propagation for thelow frequency dominated system. Also, the multipeak structures areobserved, accompanied by the synchronous discharge emission.Correspondingly, by tailoring the averaged electron power absorbance,the electron density is modulated effectively, as illustrated in Fig. 3.
In order to further study the nonlinear coupling phenomena indual-frequency DBDs, the temporal evolution of the total dischargecurrent density J under different ratios of voltage amplitudes are ana-lyzed by fast Fourier transform (FFT), shown in Fig. 6.
For the high frequency component to be dominant, the charac-teristic spectrum is shown in Fig. 6(a). And several main peaks can beobserved within the frequency range. Besides the eigenfrequency ofthe two excitation sources, the rest of them in the spectrum are locatedat about x1¼ 27.15MHz, x2¼ 40.7MHz, x3¼ 54.26MHz, andx4¼ 67.8MHz, respectively. They are in fact the higher harmonics ofxh¼ 13.56MHz (2xh¼ 27.12, 3xh¼ 40.68, 4xh¼ 54.24, and5xh¼ 67.80MHz precisely), as also be observed in experiments.22
Besides, the spectrum of the low frequency range is modulated withbroad sidebands around xl¼ 200 kHz, a phenomenon of nonlinearcoupling also reported in atmospheric pressure plasma jet experimentsbased on DBDs. In comparison, Fig. 6(b) shows the spectrum in a lowfrequency dominated process. It is found that only two peaks atxh¼ 13.56MHz and xl¼ 200 kHz appear in the FFT spectrum, with-out the higher harmonics of xh, showing a weak nonlinearity inthe high frequency band. However, the sidebands in the low frequencyregime around 200 kHz still exist. Combining the analysis of electrondensity, power absorption characteristics described above, andthe comparison with other relevant report,51 it has been shown
FIG. 3. Spatiotemporal averaged electron density and temperature as a functionthe high frequency contribution fraction with Vtotal¼ 2000 V.
FIG. 4. Spatiotemporal profiles of electron power absorption in four periods of the low frequency with (a) Vh¼ 1600 V, Vl¼ 400 V; and (b) Vh¼ 400 V, Vl¼ 1600 V.
Physics of Plasmas ARTICLE scitation.org/journal/php
Phys. Plasmas 26, 063504 (2019); doi: 10.1063/1.5091815 26, 063504-5
Published under license by AIP Publishing
preliminarily that the nonlinear coupling effect caused by the ampli-tude matching of dual frequency excitations plays a key role in FFTspectrum variation. In general, the nonlinear effect of plasma dis-charge process is an easily observable phenomenon, especially forDBD systems. Such typical dissipative systems with strong nonlinear-ity, i.e., period-doubling bifurcation, quasi-periodic/intermittent oscil-lations, and other chaotic behaviors, are considerably complicatedand, thus, research focuses of great interest.
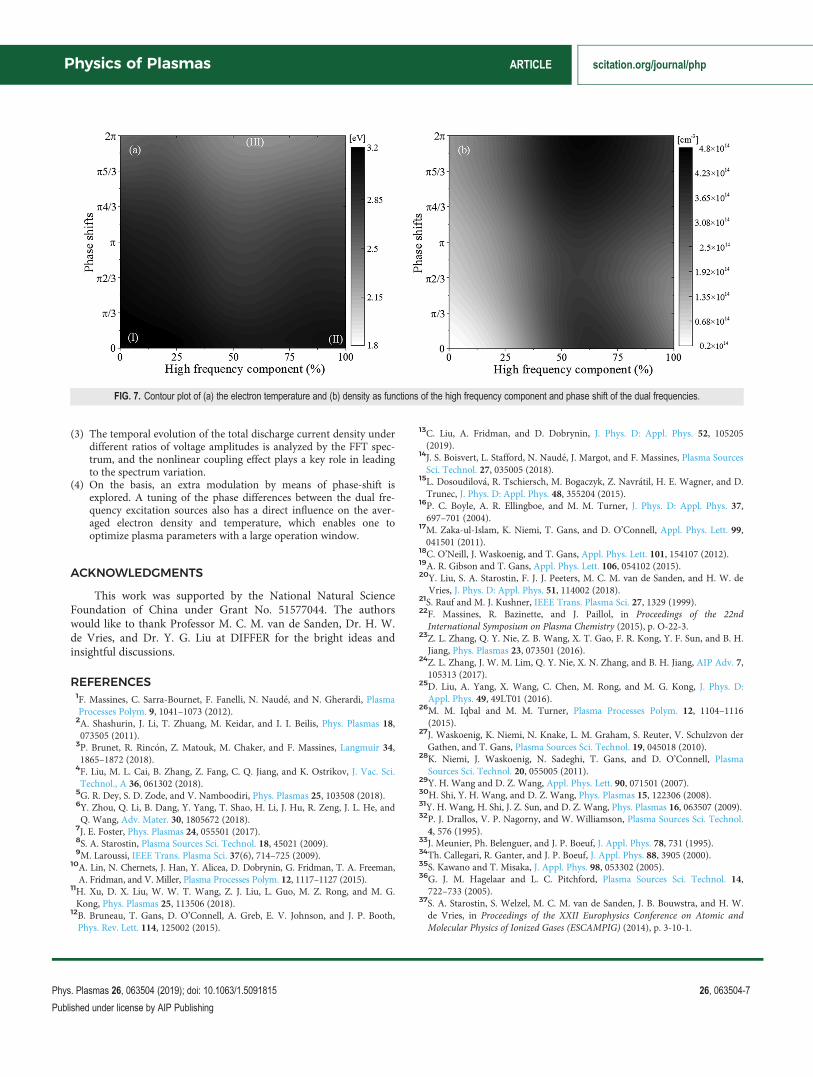
Figure 7 shows the greyscale contour of spatiotemporally aver-aged electron temperature and density as functions of the high fre-quency component and phase-shift of the two frequencies. The resultspreliminarily indicate that it is possible to control the electron temper-ature and density precisely in the dual-frequency DBD system byamplitude and phase modulations. From Figs. 7(a) and 7(b), it isfound that with a fixed phase-shift, the corresponding highest electrontemperature appears when either frequency excitation is solely applied(as seen in regions I and II), and a major change is observed when thefraction of the high frequency component is �50%–75%, with thelowest electron temperature occurring in region III. In general, the var-iation of the electron temperature presents an inverse tendency incomparison with the electron density. However, as to different highfrequency components, the modulation of averaged electron tempera-ture and density caused by phase-shift effect varies significantly, pre-dicting a method for realization of a large operational window tooptimize the plasma parameters by a particular high frequency com-ponent applied.
IV. CONCLUSIONS
In this paper, a self-consistent fluid model with semi-kinetictreatment of electrons has been used to study the amplitude and phasemodulations of plasma parameters in dual-frequency atmosphericpressure DBDs. The conclusions can be summarized as follows:
(1) By modulating the amplitude ratio of two excitation sources, theaveraged electron density and temperature are effectively influ-enced. And there exists a significant nonlinear coupling effect dur-ing the discharge process due to the dual-frequency interaction,and with an appropriate application of the amplitude ratio of thesedual components, the electron density can be upraised significantly.
(2) The investigation of electric field power absorbed by electrons,together with the conducting current density, gas voltage, and exci-tation intensity, has shown that the electron density and tempera-ture are modulated effectively by tailoring the averaged electronpower absorbance.
FIG. 5. The electric field power absorbed by electrons within one low-frequency period, together with the conduction current density, gas voltage and excitation intensity. (a)Vh¼ 1600 V, Vl¼ 400; (b) Vh¼ 400 V, Vl¼ 1600 V.
FIG. 6. FFT spectrum of the total discharge current density with different ratios of thedually applied amplitudes, with (a) Vh¼ 1600 V, Vl¼ 400; and (b) Vh¼ 400 V, Vl¼ 1600.The embedded part in panel (a) is the detailed information marked with red lines.
Physics of Plasmas ARTICLE scitation.org/journal/php
Phys. Plasmas 26, 063504 (2019); doi: 10.1063/1.5091815 26, 063504-6
Published under license by AIP Publishing
(3) The temporal evolution of the total discharge current density underdifferent ratios of voltage amplitudes is analyzed by the FFT spec-trum, and the nonlinear coupling effect plays a key role in leadingto the spectrum variation.
(4) On the basis, an extra modulation by means of phase-shift isexplored. A tuning of the phase differences between the dual fre-quency excitation sources also has a direct influence on the aver-aged electron density and temperature, which enables one tooptimize plasma parameters with a large operation window.
ACKNOWLEDGMENTS
This work was supported by the National Natural ScienceFoundation of China under Grant No. 51577044. The authorswould like to thank Professor M. C. M. van de Sanden, Dr. H. W.de Vries, and Dr. Y. G. Liu at DIFFER for the bright ideas andinsightful discussions.
REFERENCES1F. Massines, C. Sarra-Bournet, F. Fanelli, N. Naud�e, and N. Gherardi, PlasmaProcesses Polym. 9, 1041–1073 (2012).
2A. Shashurin, J. Li, T. Zhuang, M. Keidar, and I. I. Beilis, Phys. Plasmas 18,073505 (2011).
3P. Brunet, R. Rinc�on, Z. Matouk, M. Chaker, and F. Massines, Langmuir 34,1865–1872 (2018).
4F. Liu, M. L. Cai, B. Zhang, Z. Fang, C. Q. Jiang, and K. Ostrikov, J. Vac. Sci.Technol., A 36, 061302 (2018).
5G. R. Dey, S. D. Zode, and V. Namboodiri, Phys. Plasmas 25, 103508 (2018).6Y. Zhou, Q. Li, B. Dang, Y. Yang, T. Shao, H. Li, J. Hu, R. Zeng, J. L. He, andQ. Wang, Adv. Mater. 30, 1805672 (2018).
7J. E. Foster, Phys. Plasmas 24, 055501 (2017).8S. A. Starostin, Plasma Sources Sci. Technol. 18, 45021 (2009).9M. Laroussi, IEEE Trans. Plasma Sci. 37(6), 714–725 (2009).
10A. Lin, N. Chernets, J. Han, Y. Alicea, D. Dobrynin, G. Fridman, T. A. Freeman,A. Fridman, and V. Miller, Plasma Processes Polym. 12, 1117–1127 (2015).
11H. Xu, D. X. Liu, W. W. T. Wang, Z. J. Liu, L. Guo, M. Z. Rong, and M. G.Kong, Phys. Plasmas 25, 113506 (2018).
12B. Bruneau, T. Gans, D. O’Connell, A. Greb, E. V. Johnson, and J. P. Booth,Phys. Rev. Lett. 114, 125002 (2015).
13C. Liu, A. Fridman, and D. Dobrynin, J. Phys. D: Appl. Phys. 52, 105205(2019).
14J. S. Boisvert, L. Stafford, N. Naud�e, J. Margot, and F. Massines, Plasma SourcesSci. Technol. 27, 035005 (2018).
15L. Dosoudilov�a, R. Tschiersch, M. Bogaczyk, Z. Navr�atil, H. E. Wagner, and D.Trunec, J. Phys. D: Appl. Phys. 48, 355204 (2015).
16P. C. Boyle, A. R. Ellingboe, and M. M. Turner, J. Phys. D: Appl. Phys. 37,697–701 (2004).
17M. Zaka-ul-Islam, K. Niemi, T. Gans, and D. O’Connell, Appl. Phys. Lett. 99,041501 (2011).
18C. O’Neill, J. Waskoenig, and T. Gans, Appl. Phys. Lett. 101, 154107 (2012).19A. R. Gibson and T. Gans, Appl. Phys. Lett. 106, 054102 (2015).20Y. Liu, S. A. Starostin, F. J. J. Peeters, M. C. M. van de Sanden, and H. W. deVries, J. Phys. D: Appl. Phys. 51, 114002 (2018).
21S. Rauf and M. J. Kushner, IEEE Trans. Plasma Sci. 27, 1329 (1999).22F. Massines, R. Bazinette, and J. Paillol, in Proceedings of the 22ndInternational Symposium on Plasma Chemistry (2015), p. O-22-3.
23Z. L. Zhang, Q. Y. Nie, Z. B. Wang, X. T. Gao, F. R. Kong, Y. F. Sun, and B. H.Jiang, Phys. Plasmas 23, 073501 (2016).
24Z. L. Zhang, J. W. M. Lim, Q. Y. Nie, X. N. Zhang, and B. H. Jiang, AIP Adv. 7,105313 (2017).
25D. Liu, A. Yang, X. Wang, C. Chen, M. Rong, and M. G. Kong, J. Phys. D:Appl. Phys. 49, 49LT01 (2016).
26M. M. Iqbal and M. M. Turner, Plasma Processes Polym. 12, 1104–1116(2015).
27J. Waskoenig, K. Niemi, N. Knake, L. M. Graham, S. Reuter, V. Schulzvon derGathen, and T. Gans, Plasma Sources Sci. Technol. 19, 045018 (2010).
28K. Niemi, J. Waskoenig, N. Sadeghi, T. Gans, and D. O’Connell, PlasmaSources Sci. Technol. 20, 055005 (2011).
29Y. H. Wang and D. Z. Wang, Appl. Phys. Lett. 90, 071501 (2007).30H. Shi, Y. H. Wang, and D. Z. Wang, Phys. Plasmas 15, 122306 (2008).31Y. H. Wang, H. Shi, J. Z. Sun, and D. Z. Wang, Phys. Plasmas 16, 063507 (2009).32P. J. Drallos, V. P. Nagorny, and W. Williamson, Plasma Sources Sci. Technol.4, 576 (1995).
33J. Meunier, Ph. Belenguer, and J. P. Boeuf, J. Appl. Phys. 78, 731 (1995).34Th. Callegari, R. Ganter, and J. P. Boeuf, J. Appl. Phys. 88, 3905 (2000).35S. Kawano and T. Misaka, J. Appl. Phys. 98, 053302 (2005).36G. J. M. Hagelaar and L. C. Pitchford, Plasma Sources Sci. Technol. 14,722–733 (2005).
37S. A. Starostin, S. Welzel, M. C. M. van de Sanden, J. B. Bouwstra, and H. W.de Vries, in Proceedings of the XXII Europhysics Conference on Atomic andMolecular Physics of Ionized Gases (ESCAMPIG) (2014), p. 3-10-1.
FIG. 7. Contour plot of (a) the electron temperature and (b) density as functions of the high frequency component and phase shift of the dual frequencies.
Physics of Plasmas ARTICLE scitation.org/journal/php
Phys. Plasmas 26, 063504 (2019); doi: 10.1063/1.5091815 26, 063504-7
Published under license by AIP Publishing
38J. P. Boeuf, Phys. Rev. A 36(6), 2782–2792 (1987).39See https://fr.lxcat.net/data/set_type.php for select data type & click next.40J. F. J. Janssen, “Equilibrium and transport in molecular plasmas,” Ph.D. thesis(Plasmas Technische Universiteit Eindhoven, 2016).
41H. W. Ellis, R. Y. Pai, E. W. McDaniel, E. A. Mason, and L. A. Viehland, At.Data Nucl. Data Tables 17, 177–210 (1976).
42J. Greg�orio, P. Leprince, C. Boisse-Laporte, and L. L. Alves, Plasma Sources Sci.Technol. 21(21), 015013 (2012).
43M. M. Becker, T. Hoder, R. Brandenburg, and D. Loffhagen, J. Phys. D: Appl.Phys. 46, 355203 (2013).
44A. Bogaerts, R. Gijbels, and I. Introduction, J. Appl. Phys. 86, 4124–4133 (1999).45A. Bultel, B. van Ootegem, A. Bourdon, and P. Vervisch, Phys. Rev. E 65,046406 (2002).
46A. Sobota, F. Manders, E. M. Van Veldhuizen, and M. Haverlag, IEEE Trans.Plasma Sci. 38, 2289–2299 (2010).
47S. R. Sun, S. Kolev, H. X. Wang, and A. Bogaerts, Plasma Sources Sci. Technol.26(1), 015003 (2017).
48Y. H. Wang, Y. T. Zhang, D. Z. Wang, and M. G. Kong, Appl. Phys. Lett.90(7), 374 (2007).
49M. Moravej, X. Yang, and R. F. Hicks, Plasma Sources Sci. Technol. 15,204–210 (2006).
50Y. Liu, F. J. J. Peeters, S. A. Starostin, M. C. M. van de Sanden, and H. W. deVries, Plasma Sources Sci. Technol. 27, 01LT01 (2018).
51Y. Liu, K. van’t Veer, F. J. J. Peeters, D. B. Mihailova, J. van Dijk, S. A. Starostin,M. C. M. van de Sanden, and H. W. de Vries, Plasma Sources Sci. Technol. 27,105016 (2018).
Physics of Plasmas ARTICLE scitation.org/journal/php
Phys. Plasmas 26, 063504 (2019); doi: 10.1063/1.5091815 26, 063504-8
Published under license by AIP Publishing