Embed Size (px)
Citation preview
Numerical Studies on Submerged Arc Welding Process
Degala Ventaka Kiran and Suck-Joo Na
Journal of Welding and Joining(Vol. 32, No. 4)
2014. 4

This is an Open-Access article distributed under the terms of the Creative Commons Attribution Non-Commercial License(http://creativecommons.org/licenses/by-nc/3.0) which permits unrestricted non-commercial use, distribution, and reproduction in any medium, provided the original work is properly cited.
Journal of Welding and Joining, Vol.32 No.4(2014) pp1-9
http://dx.doi.org/10.5781/JWJ.2014.32.4.1
1
Numerical Studies on Submerged Arc Welding Process
Degala Ventaka Kiran* and Suck-Joo Na*,†
*Department of Mechanical Engineering, KAIST, Daejeon 305-701, Korea
†Corresponding author : [email protected](Received June 9, 2014 ; Accepted August 4, 2014)
Abstract A quantitative understanding on the effect of the welding conditions on weld joint dimensions and weld thermal cycle is difficult through experimental studies alone. The experimental realization of temperature distribution in the weld pool is proved to be extremely difficult due to the small size of welds, high peak temperature and steep temperature gradients in weld pool. This review deals with the heat transfer and fluid flow analysis to understand the parametric influence of a single wire submerged arc welding (SAW) and multi-wire SAW processes on the weld bead dimensions, temperature and fluid flow distribution in the weldment.
Key Words : Submerged arc welding process, Heat transfer and fluid flow analysis, Tandem submerged arc welding process.
ISSN 1225-6153
Online ISSN 2287-8955
(a) (b) X
Z
y O
2σ
qm
qm· e -1/2
q(r)
q
Fig. 1 (a) Gaussian distributed surface heat source
(b) position of the moving heat source after
time t (s)2)
1. Introduction
Numerical modeling of heat transfer and fluid
flow phenomenon has been successfully used
for the estimation of peak temperature and
thermal cycle in fusion welding processes1). In
many cases, the computed thermal cycles are
used to predict the final microstructure and
mechanical properties of the weld. The typical
nature of the submerged arc welding (SAW) process
makes it difficult to measure peak temperature
and thermal cycles in the weld experimentally.
In particular, the two wire submerged arc
welding (SAW-T) process provides a greater
difficulty due to the application of two welding
arcs and its associated numerous parameters,
and use of greater amount of fluxes.
In this paper, a comprehensive literature review
on the numerical modeling of the SAW and
SAW-T processes to understand the influence of
process parameters on the weld bead dimensions,
temperature distribution in the weldment are
presented.
2. Theoretical modeling
2.1. Heat transfer analysis
Pathak et al.2) proposed a finite element based
conduction heat transfer model to analyze single
wire SAW process. A Gaussian distributed surface
heat source is used to simulate the heat transfer
from the welding arc [Fig. 1]. The Gaussian
distributed surface heat source is given by the
eq. (1).
⎟⎟⎠
⎞⎜⎜⎝
⎛
σ
+−
πσ
η= 2
22
2 2)yx(exp
2VI)r(q
(1)
Review Paper

D.V.Kiran and S.J.Na
340 Journal of Welding and Joining, Vol. 32, No. 4, 2014
2
Welding
dire
ction
Gaussian heat inputfrom the welding arc
Activated elements
Deactivated elements
Deposited elements
Welding
direc
tion
Fig. 2 (a) Schematic representation of the Gaussian
distributed heat source and the element
deactivation and activation methodology3), (b)
double ellipsoidal volumetric heat source5)
where the terms η, V, I and σ refer to the process
efficiency, welding voltage and current, and the
effective arc radius. Around 68% of the arc
energy is distributed over the area covered
with in 2σ. Based on some numerical results
and the corresponding comparison with the
experimental results it was proposed that the
effective arc radius (σ) was 2.1 times that of
the measured half bead width. However the filler
metal deposition was not modeled effectively.
Mahapatra et al.3) reported a similar model using
“element deactivation and activation” approach
to account for the addition of filler materials.
Fig. 2(a) depict the modeling of the filler mate-
rial deposition using this approach. The elements
defining the weld pool region were divided into
sets such that these elements remain deactivated
initially. These deactivated elements were assigned
with very low values of thermal conductivity so
that these elements would have little impact
on the heat transfer calculations. At every
step, a selected set of the deactivated elements
was activated, which involved reassigning of
original material properties to these elements,
as the heat source moved along the weld
interface. The computed and measured weld
pool shapes and the thermal cycles in HAZ
were reported to be in fair agreement. Biswas
et al.4) followed a similar approach in modeling
double-sided fillet welding using single wire
SAW process.
The conduction heat transfer based weld pool
simulation often fails to account for the convective
transport of heat inside the pool, which can be
significant, in particular, for a large weld pool
generated in SAW process. Goldak et al. 5)
introduced a double-ellipsoidal volumetric heat
source model to numerically account for the
heat transport inside the weld pool in a conduc-
tion based heat transfer analysis. The double-
ellipsoid heat source was obtained as a com-
bination of two ellipsoids - one in the front
and the other at the rear with reference to the
center of the welding arc [Fig. 2 (b)]. The
power density distributions in the front and at
the rear of the double-ellipsoidal heat sources
are given as5)
⎟⎟⎟
⎠
⎞
⎜⎜⎜
⎝
⎛−−−
ππη
= 2
2
2
2
21
2
1
1
cz3
by3
ax3exp
c b a P f 36Q
(2)
⎟⎟⎟
⎠
⎞
⎜⎜⎜
⎝
⎛−−−
ππη
= 2
2
2
2
22
2
2
2
cz3
by3
ax3exp
c b a P f 36Q
(3)
where the terms a1, b, and c refer to the semi
major axis, minor axis and depth of the front
semi-ellipsoid, respectively, and that of the
rear semi-ellipsoid is denoted as a2, b, and c.
The fractions f1 and f2 are used to consider the
asymmetry in the magnitude of heat energy
density in the front and at the rear part of the
heat sources. The values of f1 and f2 are
suggested as 0.6 and 1.4, respectively, in open
literatures5-8). However, it is very difficult to
decide the appropriate dimensions of the double-
ellipsoidal heat source. Very often these were
defined based on the experimentally measured
weld bead macrographs.
Sharma et al.9) estimated the dimensions of

Numerical Studies on Submerged Arc Welding Process
大韓熔接․接合學 誌 第32卷 第4號, 2014年 8月 341
3
Activated elements
Deactivated elements
Deposited elements
M3
M2
M1
Fig. 3 Solution domain for SAW-T process numerical
modeling10)
the double-ellipsoidal heat source of twin arc
SAW process by numerical experiments and its
validation with the measured weld bead
dimensions. The author assumed that the close
proximity of the two arcs leads to a single arc.
Kiran et al.10) presented a 3D conduction heat
transfer model of the SAW-T process. The
leading and trailing wires are connected to
DCEP and variable polarity AC power sources.
The model considers two individual volumetric
heat sources to account for heat input from the
leading and the trailing arcs. The power density
distributions of the leading and trailing double-
ellipsoidal heat sources are presented by a
generic expression as10)
⎟⎟⎠
⎞⎜⎜⎝
⎛−−−
ππ= 2
i
2
2i
2
2i
2
iii
iii c
z3by3
ax3exp
c b a P f 36Q
(4)
where the subscript i refers to either leading (i
≡ LE) or trailing (i ≡ TR) arc or heat source.
The power from the leading arc to the work
piece (PLE) is computed as
LELELE IVP αη= (5)
where η is the process efficiency and α is the
fraction of the available arc energy supplied to
the work piece in direct current electrode positive
(DCEP) mode. The effective current (ITR) and
power (PTR) of the trailing arc to the workpiece
are estimated respectively as
⎥⎦
⎤⎢⎣
⎡
++
=−+
−−++
; )tt(
)tI()tI(I
TRTR
TRTRTRTRTR
(6)
⎥⎦
⎤⎢⎣
⎡
+β+γ
η=−+
−−++
)tt()tI()tI(
VPTRTR
TRTRTRTRTRTR
(7)
In eq. (7), γ and β refer to the fractional arc
energy supplied to workpiece in the positive
and negative current pulses, respectively. The
values of both α [in eq. (5)] and γ [in eq. (7)]
are taken as 0.7511,12). The value of β [in eq.
(7)] is taken as 0.6511,12).
Fig. 3 schematically presents the solution domain,
volumetric heat sources and the electrode wire
metal deposition in weld pool considered by
discrete addition of new elements. A symmetrical
analysis is carried out considering the weld
interface along the middle of the V-groove as
the symmetry plane. In Fig. 3, M1, M2 and
M3 correspond to electrode material already
deposited in a previous time step, yet to be
deposited (i.e. deactivated elements) and deposited
in the current time step (i.e. newly activated
elements), respectively. Thus, elements designated
as M1 and M3 are assigned with the thermo
physical properties of work piece material. The
M2 set of elements are assigned with very low
values of thermal conductivity to mimic atmosphere
(thermally insulator). A new set of elements
(M3) are activated at the liquidus temperature
in the beginning of each time step. The time
stepping and the activation scheme of new
elements are synchronized in a manner such
that, two separate sets of new elements (M3)
will be activated in each time step to account
for the depositions from the lead and the trial
wires.
A methodology was proposed to estimate the
dimensions of volumetric heat sources based on
weld joint geometry and process parameters as
given by the eqs. (8) and (9).
5.0
LEALp
smLELELE U
]L)TT(C[ tP
d23ba
⎥⎥⎦
⎤
⎢⎢⎣
⎡⎟⎟⎠
⎞⎜⎜⎝
⎛+
+−ρη
π==
(8)
5.0
TRALp
smTR
LETRTR U
]L)TT(C[ tP
)hd(23ba
⎥⎥⎦
⎤
⎢⎢⎣
⎡⎟⎟⎠
⎞⎜⎜⎝
⎛+
+−ρη
−π==
(9)
D.V.Kiran and S.J.Na
342 Journal of Welding and Joining, Vol. 32, No. 4, 2014
4
727
(a)
(b)
867
1200
1472
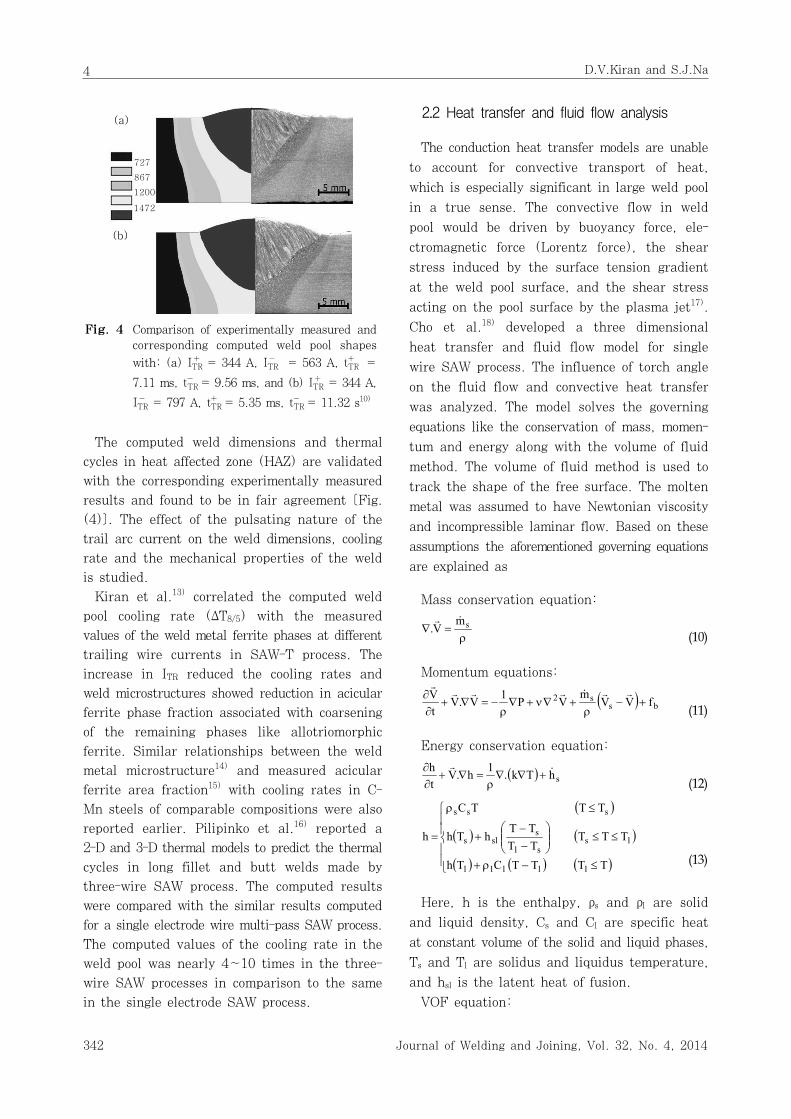
Fig. 4 Comparison of experimentally measured and
corresponding computed weld pool shapes
with: (a) ITR = 344 A, ITR = 563 A, tTR =
7.11 ms, tTR = 9.56 ms, and (b) ITR = 344 A,
ITR = 797 A, tTR = 5.35 ms, tTR = 11.32 s10)
The computed weld dimensions and thermal
cycles in heat affected zone (HAZ) are validated
with the corresponding experimentally measured
results and found to be in fair agreement [Fig.
(4)]. The effect of the pulsating nature of the
trail arc current on the weld dimensions, cooling
rate and the mechanical properties of the weld
is studied.
Kiran et al.13) correlated the computed weld
pool cooling rate (ΔT8/5) with the measured
values of the weld metal ferrite phases at different
trailing wire currents in SAW-T process. The
increase in ITR reduced the cooling rates and
weld microstructures showed reduction in acicular
ferrite phase fraction associated with coarsening
of the remaining phases like allotriomorphic
ferrite. Similar relationships between the weld
metal microstructure14) and measured acicular
ferrite area fraction15) with cooling rates in C-
Mn steels of comparable compositions were also
reported earlier. Pilipinko et al.16) reported a
2-D and 3-D thermal models to predict the thermal
cycles in long fillet and butt welds made by
three-wire SAW process. The computed results
were compared with the similar results computed
for a single electrode wire multi-pass SAW process.
The computed values of the cooling rate in the
weld pool was nearly 4~10 times in the three-
wire SAW processes in comparison to the same
in the single electrode SAW process.
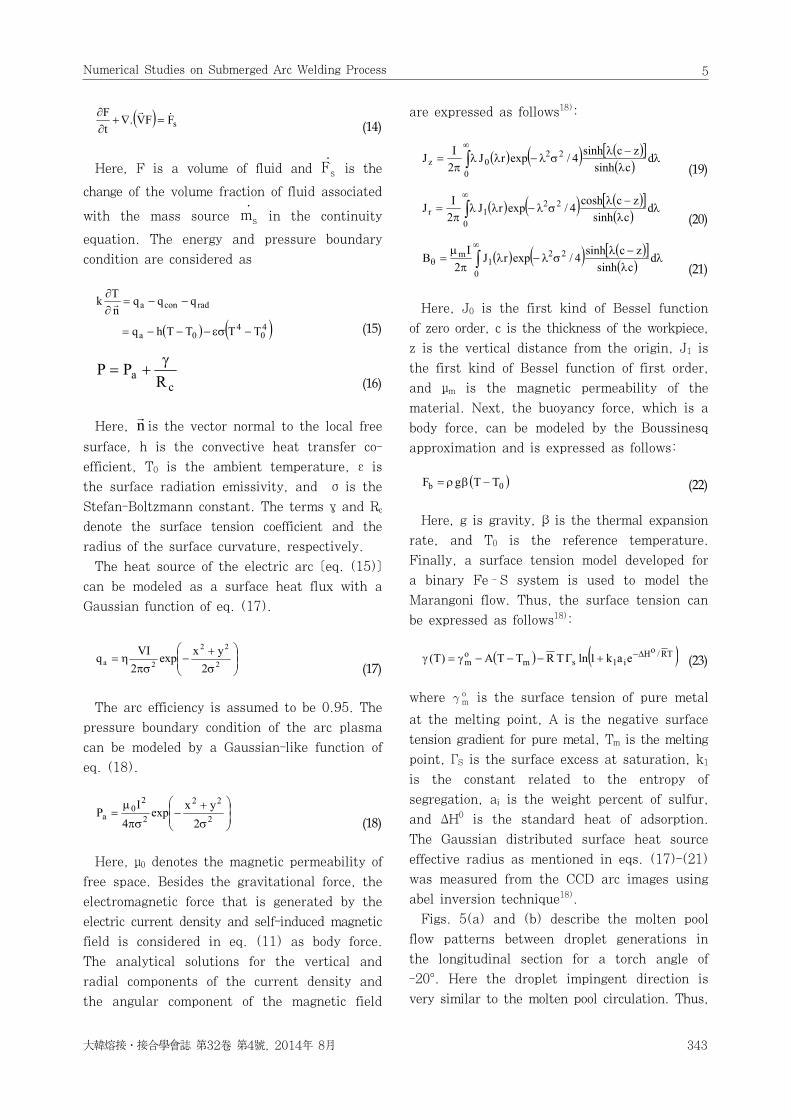
2.2 Heat transfer and fluid flow analysis
The conduction heat transfer models are unable
to account for convective transport of heat,
which is especially significant in large weld pool
in a true sense. The convective flow in weld
pool would be driven by buoyancy force, ele-
ctromagnetic force (Lorentz force), the shear
stress induced by the surface tension gradient
at the weld pool surface, and the shear stress
acting on the pool surface by the plasma jet17).
Cho et al.18) developed a three dimensional
heat transfer and fluid flow model for single
wire SAW process. The influence of torch angle
on the fluid flow and convective heat transfer
was analyzed. The model solves the governing
equations like the conservation of mass, momen-
tum and energy along with the volume of fluid
method. The volume of fluid method is used to
track the shape of the free surface. The molten
metal was assumed to have Newtonian viscosity
and incompressible laminar flow. Based on these
assumptions the aforementioned governing equations
are explained as
Mass conservation equation:
ρ
=∇ smV.
(10)
Momentum equations:
( ) bs
s2 fVVm
VP1V.VtV
+−ρ
+∇ν+∇ρ
−=∇+∂∂
(11)
Energy conservation equation:
( ) shTk.1h.V
th
+∇∇ρ
=∇+∂∂
(12)
( )
( ) ( )
( ) ( ) ( )⎪⎪⎩
⎪⎪
⎨
⎧
≤−ρ+
≤≤⎟⎟⎠
⎞⎜⎜⎝
⎛−−
+
≤ρ
=
TTTTCTh
TTTTTTT
hTh
TTTC
h
lllll
lssl
ssls
sss
(13)
Here, h is the enthalpy, ρs and ρl are solid
and liquid density, Cs and Cl are specific heat
at constant volume of the solid and liquid phases,
Ts and Tl are solidus and liquidus temperature,
and hsl is the latent heat of fusion.
VOF equation:
Numerical Studies on Submerged Arc Welding Process
大韓熔接․接合學 誌 第32卷 第4號, 2014年 8月 343
5
( ) sFFV.tF
=∇+∂∂
(14)
Here, F is a volume of fluid and Fs is the
change of the volume fraction of fluid associated
with the mass source ms in the continuity
equation. The energy and pressure boundary
condition are considered as
( ) ( )4
04
0a
radcona
TTTThq
qqqnTk
−εσ−−−=
−−=∂∂
(15)
c
a RPP γ
+=(16)
Here, n is the vector normal to the local free
surface, h is the convective heat transfer co-
efficient, T0 is the ambient temperature, ε is
the surface radiation emissivity, and σ is the
Stefan-Boltzmann constant. The terms γ and Rc
denote the surface tension coefficient and the
radius of the surface curvature, respectively.
The heat source of the electric arc [eq. (15)]
can be modeled as a surface heat flux with a
Gaussian function of eq. (17).
⎟⎟⎠
⎞⎜⎜⎝
⎛
σ+
−πσ
η= 2
22
2a 2yxexp
2VIq
(17)
The arc efficiency is assumed to be 0.95. The
pressure boundary condition of the arc plasma
can be modeled by a Gaussian-like function of
eq. (18).
⎟⎟⎠
⎞⎜⎜⎝
⎛
σ
+−
πσ
μ= 2
22
2
20
a2
yxexp4
IP
(18)
Here, μ0 denotes the magnetic permeability of
free space. Besides the gravitational force, the
electromagnetic force that is generated by the
electric current density and self-induced magnetic
field is considered in eq. (11) as body force.
The analytical solutions for the vertical and
radial components of the current density and
the angular component of the magnetic field
are expressed as follows18):
( ) ( ) ( )[ ]( ) d
csinhzcsinh4/exprJ
2IJ 22
00z λ
λ−λ
σλ−λλπ
= ∫∞
(19)
( ) ( ) ( )[ ]
( ) dcsinh
zccosh4/exprJ2IJ 22
01r λ
λ−λ
σλ−λλπ
= ∫∞
(20)
( ) ( ) ( )[ ]
( ) dcsinh
zcsinh4/exprJ2
IB 22
01
m λλ−λ
σλ−λπ
μ= ∫
∞
θ(21)
Here, J0 is the first kind of Bessel function
of zero order, c is the thickness of the workpiece,
z is the vertical distance from the origin, J1 is
the first kind of Bessel function of first order,
and μm is the magnetic permeability of the
material. Next, the buoyancy force, which is a
body force, can be modeled by the Boussinesq
approximation and is expressed as follows:
( )0b TTgF −βρ= (22)
Here, g is gravity, β is the thermal expansion
rate, and T0 is the reference temperature.
Finally, a surface tension model developed for
a binary Fe–S system is used to model the
Marangoni flow. Thus, the surface tension can
be expressed as follows18):
( ) ( )TR/oHi1sm
om eak1lnTRTTA)T( Δ−+Γ−−−γ=γ (23)
where mo is the surface tension of pure metal
at the melting point, A is the negative surface
tension gradient for pure metal, Tm is the melting
point, ΓS is the surface excess at saturation, k1
is the constant related to the entropy of
segregation, ai is the weight percent of sulfur,
and ΔH0 is the standard heat of adsorption.
The Gaussian distributed surface heat source
effective radius as mentioned in eqs. (17)-(21)
was measured from the CCD arc images using
abel inversion technique18).
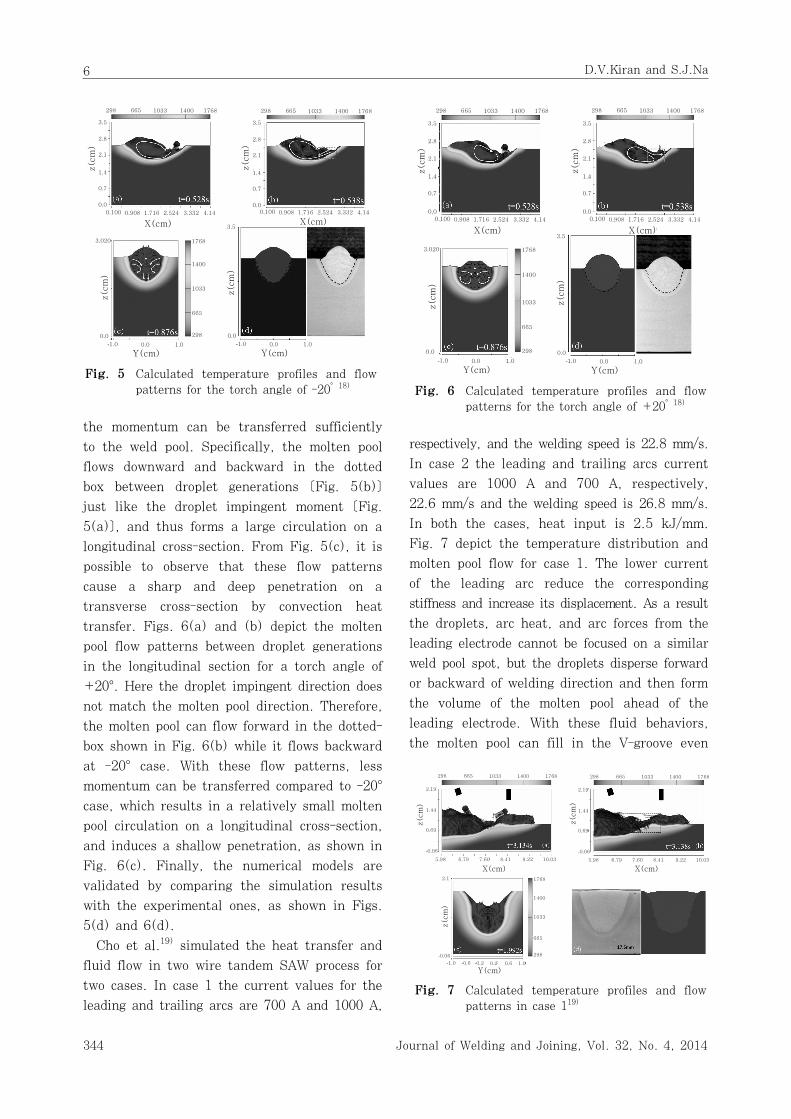
Figs. 5(a) and (b) describe the molten pool
flow patterns between droplet generations in
the longitudinal section for a torch angle of
-20°. Here the droplet impingent direction is
very similar to the molten pool circulation. Thus,
D.V.Kiran and S.J.Na
344 Journal of Welding and Joining, Vol. 32, No. 4, 2014
6
X(cm)
298 665 1033 1400 1768
3.5
2.8
2.1
1.4
0.7
0.0
z(cm
)
0.100 0.908 1.716 2.524 3.332 4.14
298 665 1033 1400 1768
3.5
2.8
2.1
1.4
0.7
0.0
z(cm
)
X(cm)0.100 0.908 1.716 2.524 3.332 4.14
3.020
3.5
0.0
-1.0 0.0 1.0
Y(cm)
z(cm
)
1768
1400
1033
665
298 0.0
-1.0 0.0 1.0
Y(cm)
z(cm
)
Fig. 5 Calculated temperature profiles and flow
patterns for the torch angle of -20° 18)
298 665 1033 1400 1768 298 665 1033 1400 1768
X(cm)
3.5
2.8
2.1
1.4
0.7
0.0
z(cm
)
0.100 0.908 1.716 2.524 3.332 4.14
X(cm)
3.5
2.8
2.1
1.4
0.7
0.0
z(cm
)
0.100 0.908 1.716 2.524 3.332 4.14
3.020
0.0
-1.0 0.0 1.0
Y(cm)
z(cm
)
1768
1400
1033
665
298
3.5
0.0
-1.0 0.0 1.0
Y(cm)
z(cm
)
Fig. 6 Calculated temperature profiles and flow
patterns for the torch angle of +20° 18)
298 665 1033 1400 1768 298 665 1033 1400 1768
2.19
1.44
0.69
-0.06
2.19
1.44
0.69
-0.06
5.98 6.79 7.60 8.41 9.22 10.03 5.98 6.79 7.60 8.41 9.22 10.03
X(cm) X(cm)
z(cm
)
z(cm
)
2.1
-0.06
1768
1400
1033
665
298
-1.0 -0.6 -0.2 0.2 0.6 1.0
Y(cm)
z(cm
)
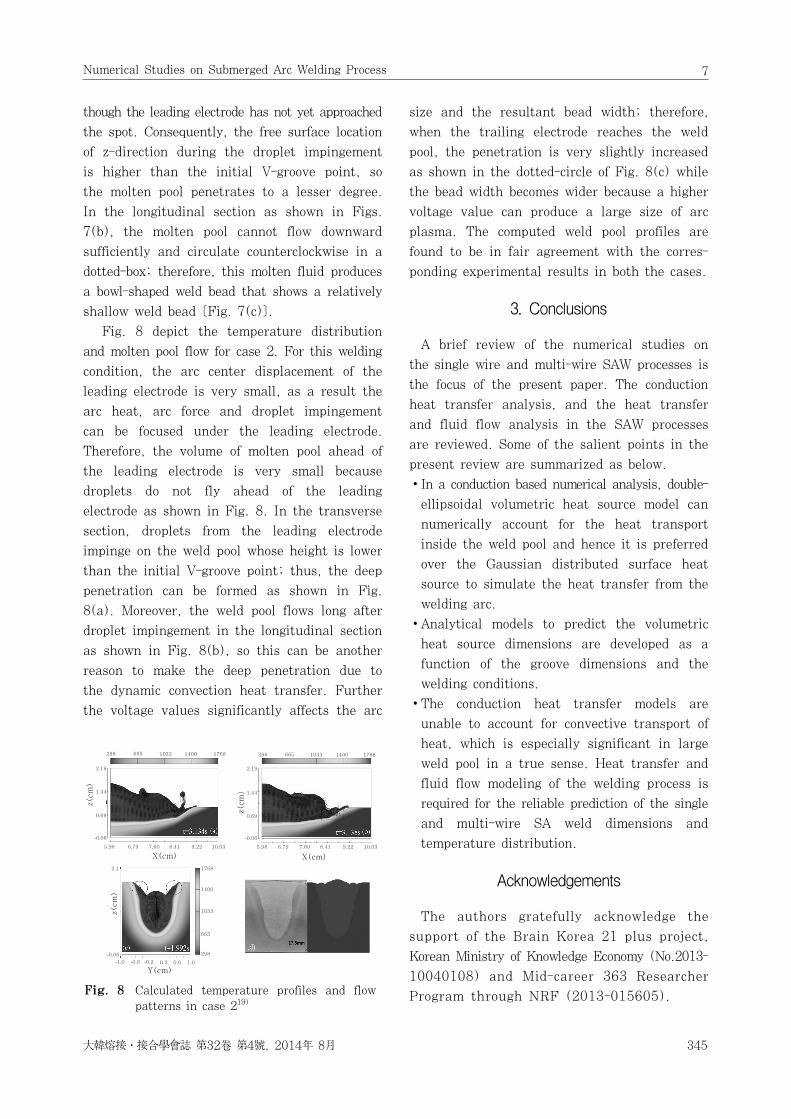
Fig. 7 Calculated temperature profiles and flow
patterns in case 119)
the momentum can be transferred sufficiently
to the weld pool. Specifically, the molten pool
flows downward and backward in the dotted
box between droplet generations [Fig. 5(b)]
just like the droplet impingent moment [Fig.
5(a)], and thus forms a large circulation on a
longitudinal cross-section. From Fig. 5(c), it is
possible to observe that these flow patterns
cause a sharp and deep penetration on a
transverse cross-section by convection heat
transfer. Figs. 6(a) and (b) depict the molten
pool flow patterns between droplet generations
in the longitudinal section for a torch angle of
+20°. Here the droplet impingent direction does
not match the molten pool direction. Therefore,
the molten pool can flow forward in the dotted-
box shown in Fig. 6(b) while it flows backward
at -20° case. With these flow patterns, less
momentum can be transferred compared to -20°
case, which results in a relatively small molten
pool circulation on a longitudinal cross-section,
and induces a shallow penetration, as shown in
Fig. 6(c). Finally, the numerical models are
validated by comparing the simulation results
with the experimental ones, as shown in Figs.
5(d) and 6(d).
Cho et al.19) simulated the heat transfer and
fluid flow in two wire tandem SAW process for
two cases. In case 1 the current values for the
leading and trailing arcs are 700 A and 1000 A,
respectively, and the welding speed is 22.8 mm/s.
In case 2 the leading and trailing arcs current
values are 1000 A and 700 A, respectively,
22.6 mm/s and the welding speed is 26.8 mm/s.
In both the cases, heat input is 2.5 kJ/mm.
Fig. 7 depict the temperature distribution and
molten pool flow for case 1. The lower current
of the leading arc reduce the corresponding
stiffness and increase its displacement. As a result
the droplets, arc heat, and arc forces from the
leading electrode cannot be focused on a similar
weld pool spot, but the droplets disperse forward
or backward of welding direction and then form
the volume of the molten pool ahead of the
leading electrode. With these fluid behaviors,
the molten pool can fill in the V-groove even
Numerical Studies on Submerged Arc Welding Process
大韓熔接․接合學 誌 第32卷 第4號, 2014年 8月 345
7
298 665 1033 1400 1768 298 665 1033 1400 1768
2.19
1.44
0.69
-0.06
2.19
1.44
0.69
-0.06
5.98 6.79 7.60 8.41 9.22 10.03 5.98 6.79 7.60 8.41 9.22 10.03
X(cm) X(cm)
z(cm
)
z(cm
)
2.1
-0.06
1768
1400
1033
665
298
-1.0 -0.6 -0.2 0.2 0.6 1.0
Y(cm)
z(cm
)
Fig. 8 Calculated temperature profiles and flow
patterns in case 219)
though the leading electrode has not yet approached
the spot. Consequently, the free surface location
of z-direction during the droplet impingement
is higher than the initial V-groove point, so
the molten pool penetrates to a lesser degree.
In the longitudinal section as shown in Figs.
7(b), the molten pool cannot flow downward
sufficiently and circulate counterclockwise in a
dotted-box; therefore, this molten fluid produces
a bowl-shaped weld bead that shows a relatively
shallow weld bead [Fig. 7(c)].
Fig. 8 depict the temperature distribution
and molten pool flow for case 2. For this welding
condition, the arc center displacement of the
leading electrode is very small, as a result the
arc heat, arc force and droplet impingement
can be focused under the leading electrode.
Therefore, the volume of molten pool ahead of
the leading electrode is very small because
droplets do not fly ahead of the leading
electrode as shown in Fig. 8. In the transverse
section, droplets from the leading electrode
impinge on the weld pool whose height is lower
than the initial V-groove point; thus, the deep
penetration can be formed as shown in Fig.
8(a). Moreover, the weld pool flows long after
droplet impingement in the longitudinal section
as shown in Fig. 8(b), so this can be another
reason to make the deep penetration due to
the dynamic convection heat transfer. Further
the voltage values significantly affects the arc
size and the resultant bead width; therefore,
when the trailing electrode reaches the weld
pool, the penetration is very slightly increased
as shown in the dotted-circle of Fig. 8(c) while
the bead width becomes wider because a higher
voltage value can produce a large size of arc
plasma. The computed weld pool profiles are
found to be in fair agreement with the corres-
ponding experimental results in both the cases.
3. Conclusions
A brief review of the numerical studies on
the single wire and multi-wire SAW processes is
the focus of the present paper. The conduction
heat transfer analysis, and the heat transfer
and fluid flow analysis in the SAW processes
are reviewed. Some of the salient points in the
present review are summarized as below.
∙In a conduction based numerical analysis, double-
ellipsoidal volumetric heat source model can
numerically account for the heat transport
inside the weld pool and hence it is preferred
over the Gaussian distributed surface heat
source to simulate the heat transfer from the
welding arc.
∙Analytical models to predict the volumetric
heat source dimensions are developed as a
function of the groove dimensions and the
welding conditions.
∙The conduction heat transfer models are
unable to account for convective transport of
heat, which is especially significant in large
weld pool in a true sense. Heat transfer and
fluid flow modeling of the welding process is
required for the reliable prediction of the single
and multi-wire SA weld dimensions and
temperature distribution.
Acknowledgements
The authors gratefully acknowledge the
support of the Brain Korea 21 plus project,
Korean Ministry of Knowledge Economy (No.2013-
10040108) and Mid-career 363 Researcher
Program through NRF (2013-015605).

D.V.Kiran and S.J.Na
346 Journal of Welding and Joining, Vol. 32, No. 4, 2014
8
References
1. S. A. David and T. DebRoy : Current issues and problems
in welding science, Science, 257-5096 (1992), 497-502
2. A. K. Pathak and G. L. Datta : Three-dimensional
finite element analysis to predict the different zones
of microstructure in submerged arc welding, proceedings
of the institution of mechanical engineers, 218-3
(2004), 269-280
3. M. M. Mahapatra, G. L. Datta, B. Pradhan and N.
R. Mandal : Three-dimensional finite element analysis
to predict the effects of SAW process parameters on
temperature distribution and angular distortion in
single-pass butt joints with top and bottom rein-
forcements, International journal of pressure vessels
and piping, 83-7 (2006), 721-729
4. P. Biswas, M. M. Mahapatra and N. R. Mandal :
Numerical and experimental study on prediction of
thermal history and residual deformation of double-
sided fillet welding, Proceedings of the Institution of
Mechanical Engineers: Part B Journal of Engineering
Manufacture, 224-1 (2010), 125-134
5. J. Goldak, A. Chakravarti and M. Bibby : A new finite
element model for welding heat source, Metallurgical
Transactions B, 15-2 (1984), 299-305
6. D. Gery, H. Long and P. Maropoulos : Effect of welding
speed, energy input and heat source distribution on
temperature variations in butt welding, Journal of Materials
Processing Technology, 167-8 (2005), 393-401
7. E. A. Bonifaz : Finite element analysis of heat flow
in single pass arc welding, Welding Journal, 79-5 (2005),
121s-125s
8. T. W. Eagar and N. S. Tsai : Temperature fields
produced by traveling distributed heat sources, Welding
Journal, 62-12 (1983), 346s-355s
9. A. Sharma, A. K. Chaudhary, N. Arora and B. K.
Mishra : Estimation of heat source model parameters
for twin wire submerged arc welding, International
Journal of Advanced Manufacturing Technology, 45
(2009), 1096-1103
10. D. V. Kiran, B. Basu, A. K .Shah, S. Mishra and
A. De : Three dimensional heat transfer analysis of
two wire tandem submerged arc welding, ISIJ
International, 515 (2011), 793-798
11. W. G. Essers and R.Walter : Heat transfer and
penetration mechanisms with GMA and plasma-
GMA welding, Welding Journal, 60-2 (1981), 37s-42s
12. J. F. Lancaster : The physics of welding, Pergamon
Press, New York, NY, 1984
13. D. V. Kiran, B. Basu, A. K. Shah, S. Mishra and
A. De : Probing influence of welding current on
weld quality in two wire tandem submerged arc
welding of HSLA steel, Science and Technology of
Welding and Joining, 15-2 (2010), 111-116
14. Y. Yang : The effect of submerged arc welding
parameters on the properties of pressure vessel and
wind turbine tower steels, M.S thesis, University of
Saskatchewan, Saskatoon, 2008
15. G. M. Reddy and P. K. Ghosh : The influence of
electrode polarity and welding current on mechanical
properties of submerged arc weld (SAW) in C-Mn
steels, Indian Welding Journal, 26-3 (1993), 1-4
16. A. Pilipenko : Computer simulation of residual
stress and distortion of thick plates in multielectrode
submerged arc welding their mitigation techniques,
Ph.D. thesis, Nowegian University of Science and
Technology, Norway, 2001
17. S. Kou : Welding metallurgy, A Wiley-Interscience
publication, New Jersey, 2003
18. D. W. Cho, W. H. Song, M. H. Cho and S. J. Na :
Analysis of submerged arc welding process by
three-dimensional computational fluid dynamics
simulation, Journal of Materials Processing Technology,
213-12 (2013), 2278-2291
19. D. W. Cho, D. V. Kiran and S. J. Na : Molten
pool behavior in the tandem submerged arc welding
process, Journal of Materials Processing Technology,
214-11 (2014), 2233-2247
Degala Ventaka Kiran received the
B.E. degree in mechanical engineering
from Andhra University, Visakhapatnam,
India, in 2005, M.Tech degree in me-
chanical and industrial engineering
from IIT Roorkee, Roorkee, India in
2007 and the Ph.D. degree in mechanical
engineering from IIT Bombay, Mumbai, India in 2012.
He is a Post doctoral researcher with the Advanced
Laser, Plasma and Hybrid Applications Lab, Korea
Advanced Institute of Science and Technology, Daejeon,
Korea. His current research interests include Weldig
Science and Technology, numerical analysis of heat
transfer and fluid flow, residual stress and defor-
mation in fusion welding processes, experimental stress
analysis, and statistical modeling and optimization.
Suck-Joo Na graduated from Seoul
National University for B.Sc. and Korea
Advanced Institute of Science and
Technology for M.Sc. in Mechanical
Engineering, and has got his Dr.-Ing.
degree from the Welding and Joining
Institute of TU Braunschweig, Germany.
Professor Na is working at KAIST, Korea for more
than 30 years, educating and researching in the
analysis, optimization and automation of welding
processes and laser materials processing. Professor
Na is one of the leading scientists in the field of
process simulation of arc and laser beam welding,
most notably of laser hybrid welding, in which he
links his expertise of arc physics and multiple
reflections in the keyhole with that of weld pool
dynamics during arc and laser welding. He has
published 236 research papers in SCI and Korean

Numerical Studies on Submerged Arc Welding Process
大韓熔接․接合學 誌 第32卷 第4號, 2014年 8月 347
9
domestic journals, and presented more than 230
papers at international and domestic conferences.
Professor Na has been awarded various prizes from
Korean Welding and Joining Society (KWJS), American
Welding Society (AWS) such as excellent scientific
research award, best paper award and Charles H.
Jennings Memorial Award. He was elected as the fellow
of AWS in 2005, as the member of the National
Academy of Engineering of Korea in 2007 and as the
fellow of the Korean Academy of Science and Tech-
nology in 2008. Recently he was selected as the FiDiPro
Professor to establish a digital welding research group
at VTT in Finland from 2014 to 2016.
After serving as a member of the board of directors
of KWJS, Professor Na was the president of KWJS
from 2007 to 2008, a member of Technical Manage-
ment Board of IIW from 2010 to 2012 and is now
serving as the president of Asian Welding Federation.