Embed Size (px)
Citation preview

Ocean Engineering 163 (2018) 583–598
Contents lists available at ScienceDirect
Ocean Engineering
journal homepage: www.elsevier.com/locate/oceaneng
Numerical study of hydrodynamic coefficients of multiple heave plates bylarge eddy simulations with volume of fluid method
Shining Zhang a,*, Takeshi Ishihara b
a Climate Change & Environment Research Division, Economy & Technology Research Institute, Global Energy Interconnection Development and Cooperation Organization,100031, Beijing, Chinab Department of Civil Engineering, School of Engineering, The University of Tokyo, 7-3-1 Hongo, Bunkyo-ku, 113-8656, Tokyo, Japan
A R T I C L E I N F O
Keywords:Multiple heave platesLarge eddy simulationVolume of fluid methodFlow patternFormulas of hydrodynamic coefficients
* Corresponding author.E-mail address: [email protected] (S. Zh
https://doi.org/10.1016/j.oceaneng.2018.03.060Received 14 November 2016; Received in revised f
0029-8018/© 2018 Elsevier Ltd. All rights reserved
A B S T R A C T
Hydrodynamic coefficients of multiple heave plates are studied for offshore structures to reduce heave responsesin oscillating flows. Large eddy simulations with volume of fluid method are performed to predict the hydro-dynamic force on a forced oscillated model with multiple heave plates. Predicted added mass and drag coefficientsare validated by a water tank test. Then, flow pattern around the multiple heave plates is investigated to clarifythe mechanism of hydrodynamic forces on each plate, and a systematic study on the effects of geometric pa-rameters, such as spacing ratio, diameter ratio and aspect ratio on the hydrodynamics of octagonal heave plate areconducted. Finally, formulas of added mass and drag coefficients for a single and double heave plates with cir-cular, octagonal and square cross-sections are proposed to cover a wide range of application of the heave plate.
1. Introduction
Floating offshore wind turbine (FOWT) is a promising innovation.The world's first full-scale 2.3MW spar FOWT in Hywind project wasinstalled in Norway by Statoil Hydro in 2009 (Hywind Demo), and thesecond prototype was the 2MW semi-submersible FOWT in WindFloatproject deployed in Portugal by Principle Power in 2011 (WindFloat). InJapan, a 2MW spar FOWT in GOTO-FOWT project was built off the coastof Kabashima in 2013 (GOTO FOWT). In addition, another 2MWsemi-submersible FOWT and a 7MWV-shape semi-submersible FOWT inFukushima FORWARD project were completed off the coast of Fukush-ima in 2013 and 2015, respectively (Fukushima FORWARD). In thesemi-submersible and advanced spar FOWTs, heave plates are commonlyused to reduce heave motions and to shift heave resonance periods out ofthe first-order wave energy range (Lopez-Pavon and Souto-Iglesias, 2015,Fukushima FORWARD). Some new concepts of floating platform havebeen adopted. A substation and a 5MW FOWT constructed in FukushimaFORWARD project (Fukushima FORWARD) adopt an advanced sparconsisting of multiple heave plates. The hydrodynamic characteristics ofmultiple heave plates is one of the key factors for the structural design ofplatforms.
Morison's equation and potential theory are widely used to predicthydrodynamic loads on the platform of FOWT (Phuc and Ishihara, 2007;
ang).
orm 12 February 2018; Accepted
.
Waris and Ishihara, 2012; Jonkman, 2007; Browning et al., 2014; Kvit-tem et al., 2012). The hydrodynamic coefficients, namely added massand drag coefficients of heave plates (hereinafter referred to as Ca and Cd,respectively) have to be determined to evaluate hydrodynamic loads onthem. The hydrodynamic coefficients of the heave plates can be attainedby means of water tank tests (Lopez-Pavon and Souto-Iglesias, 2015; Liet al., 2013), numerical simulations (Lopez-Pavon and Souto-Iglesias,2015; Tao and Thiagarajan, 2003a, 2003b; Tao et al., 2004, 2007; Taoand Cai, 2004; Garrido-Mendoza et al., 2015; Yang et al., 2014), andempirical formulas (Tao et al., 2007; Tao and Cai, 2004; Philip et al.,2013).
Water tank tests have been carried out intensively to study the hy-drodynamic coefficients of circular single heave plate (Lopez-Pavon andSouto-Iglesias, 2015; Tao and Dray, 2008), and square single heave plate(Prislin, Blevins, Halkyard, 1998, Li et al., 2013; An and Faltinsen, 2013;Prislin, Blevins, Halkyard, 1998; Wadhwa and Thiagarajan, 2009). Hy-drodynamic coefficients of circular and square single heave plates werecompared between each other in the study by Lopez-Pavon andSouto-Iglesias (2015). They pointed out that both Ca and Cd of the squareheave plate are smaller than those of the circular heave plate. They alsoconfirmed that there is a relatively weak dependence of oscillating fre-quencies, and a large dependence with Keulegan-Carpenter (KC) number,as well documented in references (Li et al., 2013; An and Faltinsen,
21 March 2018

S. Zhang, T. Ishihara Ocean Engineering 163 (2018) 583–598
2013). Wadhwa et al. (Wadhwa and Thiagarajan, 2009; Wadhwa et al.,2010) investigated the hydrodynamic coefficients of a heave plate nearthe free surface. As the submergence of the heave plate decreases, thefree surface is expected to be disturbed. It was observed that both Ca andCd continuously increase as the distance to the free surface increases. Liet al. (2013) studied the influence of plates spacing on the hydrodynamiccoefficients. It was found that the hydrodynamic coefficients decrease asspacing decreases.
A number of numerical studies on the hydrodynamic characteristicsof heave plate have been conducted. Tao and Cai (2004) investigatedinfluences of heave plate diameter and KC number on hydrodynamiccoefficients by finite difference method. Predicted damping ratio agreedwell with the measured ones in both low and high KC regimes. Tao andThiagarajan, 2003a, 2003b presented three vortex shedding modes foroscillating heave plate and proposed a quantitative method of identifyingthe vortex shedding flow regimes. Lopez-Pavon and Souto-Iglesias(2015) performed a numerical analysis of the hydrodynamic perfor-mance of heave plate by a finite volume method with Shear StressTransport (SST) turbulent model. The accuracy of the computations wasfound reasonable for a plain plate, while some errors were found for areinforced plate. Holmes et al. (2001) examined the hydrodynamic co-efficients of a square heave plate by a finite element method with LESturbulent model. It was observed that the predicted force by Morison'sequation with determined hydrodynamic coefficients matched well withthe measured force, even in random wave conditions. Tao et al. (2007)investigated spacing effects on the hydrodynamics of double circularheave plates, and provided a recommendation for the arrangement ofadjacent heave plate. However, in these studies, hydrodynamic co-efficients of the double heave plates were not validated by water tanktests, andmechanism of hydrodynamic force onmultiple heave plates hasnot been clarified yet.
Formulas are beneficial for optimizing the design of offshore struc-tures with heave plates. The added mass of a pure circular heave platealong its axis approximately equals to the mass of a sphere of waterenclosing the heave plate (Sarpkaya, 2010). Tao and Cai (2004) proposeda formula for added mass of a circular heave plate attached by a column.A formula for double circular heave plates by considering the effect ofspacing ratio is firstly proposed by Tao et al. (2007), and the predictedadded mass coefficient matches well with that obtained from the nu-merical simulation at low KC number. Philip (Philip et al., 2013) putforward a simplified formula for added mass of a vertical cylinder withmultiple heave plates. However, the formula is only suitable fornon-interacting plates, which indicates the effect of heave plate spacing isnot considered. All the proposed formulas are limited to circular heaveplates, and influence of KC number is not taken into account. In contrastto the formulas of Ca, the formula of Cd is seldom studied. Tao andThiagarajan (2003a) identified the coefficients in the formulas of Cd
proposed by Graham (1980) for each defined vortex shedding flowregime, but it might be inappropriate to propose the piecewise formula ofCd since there are no clear watersheds to distinguish the vortex sheddingregimes. Therefore, a formula of Cd covering those wide ranges of vortexshedding regime is preferred. Formulas of both Ca and Cd are also ex-pected to cover various cross-sections of heave plates, such as circular,octagonal and square heave plate, and geometric parameters, such asaspect ratio, diameter ratio, and spacing ratio.
In this paper, section 2 describes governing equations and volume offluid method, grid arrangement, boundary conditions, cases of simula-tions, and provides the validation of numerical results by a water tanktest. Section 3 clarifies the mechanism of hydrodynamic forces on mul-tiple heave plate, and investigates the effect of geometrical parameters,such as spacing ratio, diameter ratio, and aspect ratio. In Section 4, for-mulas of Ca and Cd for a single and double heave plates are proposed, andthe accuracy of hydrodynamic coefficients predicted by proposed for-mulas is validated by published data in literature and present numericalsimulations. The conclusions are summarized in Section 5.
584
2. Numerical model and validation
In this section, numerical model of a floater with multiple heaveplates is introduced, which is a 1/100 down-scaled Froude model of asubstation (Yoshimoto, 2016) employed in Fukushima FORWARD proj-ect. The floater contains three hulls, which are connected by one cylin-drical column. The fully submerged middle and lower hull have thefunction of heave plate in reducing heave motion. The overview of thefloater and its dimensions are shown in Fig. 1. The center line of theupper hull is located at still water level (SWL). All the hulls are octagonalcross-sectional plate. The detailed dimension of the model is specified inTable 1.
The governing equation and VOF method is given in section 2.1. Thecomputational domain and grid arrangement are described in section2.2. Section 2.3 presents the numerical schemes and boundary condi-tions. Cases conducted in this study are shown in section 2.4. The defi-nition of the hydrodynamic coefficients is provided in section 2.5. Thedescription of water tank test and validation of numerical results aregiven in section 2.6 and 2.7, respectively.
2.1. Governing equation
Large-eddy simulation (LES) is adopted and the Boussinesq hypoth-esis is employed, and the standard Smagorinsky-Lilly model is used tocalculate the subgrid-scale (SGS) stresses. The governing equations inCartesian coordinates are expressed in the form of tensor as Eq. (1) andEq. (2).
∂~ui
∂xi¼ 0 (1)
ρ ∂~ui
∂t þ ρ ∂~ui~uj
∂xj¼ -
∂~p∂xi
þ ∂∂xj
�μ�∂~ui
∂xjþ ∂~uj
∂xi
��-∂τij∂xj
(2)
where, ~ui and ~p are filtered mean velocity and filtered pressure, respec-tively. μ is dynamic viscosity, ρ is the density of fluid. τij ¼ ρðguiuj-~ui~ujÞ isSGS (subgrid-scale) stress resulting from the filtering operations, and ismodeled by Eq. (3) as follows:
τij¼ -2μt~Sij þ13τiiδij (3)
In which, μt is subgrid-scale turbulent viscosity, and ~Sij is the rate-of–strain tensor for the resolved scale defined by Eq. (4):
~Sij ¼ 12
�∂~ui
∂xjþ ∂~uj
∂xi
�(4)
Smagorinsky-Lilly model is used to calculate the subgrid-scale tur-bulent viscosity, μt defined as Eq. (5)
μt ¼ ρL2S��~S�� ¼ ρL2S
ffiffiffiffiffiffiffiffiffiffiffiffiffi2~Sij~Sij
q(5)
where, LS is the mixing length for subgrid-scales, defined as Eq. (6)
LS¼ min�κδ;CsV1=3 (6)
In which, κ is the von Karman constant, 0.42, Cs is Smagorinskyconstant is set as 0.032 following the suggestion in the reference (Okaand Ishihara, 2009), δ is the distance to the closest wall and V is thevolume of a computational cell.
The volume of fluid (VOF) model is used in this study to model air andwater. Volume fraction of water will be solved to capture the interfacebetween air and water. Continuity equation for the volume fraction ofwater, αw , reads:

Fig. 1. Overview of the model and its dimension. Units (mm).
Table 1Specifications of the scaled model geometry as shown in Fig. 1 (model scale1:100).
Items Symbol Dimension (mm)
Model draft h 500Column diameter Dc 50Upper hull depth hp 30Upper hull circumcircle diameter Dp 200Upper hull thickness tp 60Middle hull (Hp-1) depth hHp-1 210Middle hull (Hp-1) circumcircle diameter DHp-1 334Middle hull (Hp-1) thickness tHp-1 50Lower hull (Hp-2) depth hHp-2 500Lower hull (Hp-2) circumcircle diameter DHp-2 334Lower hull (Hp-2) thickness tHp-2 65
Note: Depth is measured from lower surface of the hull to the still water level.
S. Zhang, T. Ishihara Ocean Engineering 163 (2018) 583–598
1ρ
∂∂t ðαwρwÞ þ rðαwρw v!wÞ ¼ 0 (7)
w
� �where, ρw is water density.
2.2. Computational domain and grid arrangement
Quality of grid plays a crucial role in the accuracy of numerical re-sults. Grid independences are studied in section 2.7 to choose a reason-able grid system for following computations. The whole computationaldomain and grid around the model are displayed in Fig. 2. The compu-tational domain is divided into two subdomains with respect to thesimulated phases. The lower subdomain is used to simulate the phase ofwater and bottom of the subdomain is 3.1 h away from the still waterlevel (SWL), where h is the draft of the model. The upper subdomain isutilized to consider the phase of air and top of the subdomain is 0.6 habove the SWL. In order to mitigate the reflecting flow from theboundary, side walls are located sufficiently far away from the model.The distance between the model and inlet and outlet is 40 Dc and 52 Dc,respectively, Dc is the diameter of the center column. The grid is refinedat the locations where substantial flow separations are expected and nearSWL to capture the shape of free surface as shown in Fig. 2 (b).
In this study, several configurations of multiple heave plates aresimulated as described in section 2.4. The total cell number in thecomputational domain differs in the simulated models. The grid number
585
ranges from 4.5 million to 4.9 million among those simulated models.Grid parameters near the model are described in Table 2.
2.3. Numerical schemes and boundary conditions
A finite volume method is employed for present time-dependent nu-merical simulations. A second order central difference scheme is used forthe convective and viscous term. A first order implicit scheme isemployed for the unsteady terms in the momentum equation as shown inEq. (2), while an explicit approach is adopted for temporal discretizationin the volume fraction equation as shown in Eq. (7). The courant numberis 0.25, which means the time step for VOF simulation will be chosen tobe one-fourth of the minimum transit time for any cell near the interface.A pressure-based segregated algorithm is used to solve the non-linear andcoupled governing equations. A Pressure-Implicit with Splitting of Op-erators (PISO) algorithm is chosen to decrease the iterations for thepressure-velocity coupling solutions. Table 3 summarizes the numericalschemes used in this study. The governing equations are solved by asoftware ANSYS Fluent. The time step convergence and grid dependencyare checked as mentioned by Oka and Ishihara (2009) and Stern et al.(2001).
Forced oscillation tests are carried out in the numerical simulations toevaluate the hydrodynamic coefficients, and dynamic mesh with layeringmesh update method is utilized to simulate the movement of the model.The top of air phase and the bottom of water phase are treated as sta-tionary boundaries while the model is oscillated up and down. Both splitfactor (as) and collapse factor (ac) for the cells near the boundaries are0.4 with respect to the first cell height (h1) at moving boundaries. Thelayer of cells adjacent to the moving boundary is split or merged withlayer of cells next to it based on the height of cells. The cell heights areallowed to increase until h > ð1þ asÞh1, and the cell heights can becompressed until h > ach1. The governing equations are solved based onnewly determined cell coordinate.
Boundary conditions are summarized in Table 4. No-slip wall condi-tion is adopted for the surface of model. Symmetry conditions is utilizedfor both the top of air phase, the bottom of water phase and the sidewells, which indicates the shear stress at the boundary is zero. Outflowboundary condition (zero gradient of velocity) is applied to the inlet andoutlet as the water tank test. In the LES model, the wall shear stress isobtained from the laminar stress-strain relationship when the centroid ofwall adjacent cell is in the laminar sublayer with the height of yþ¼ 11.25as shown in Fluent Theory Guide (Fluent Theory Guide, 2012). If the

Fig. 2. Computational domain and grid around the model.
Table 2Description of grid parameters near the model.
Parameters Value
First layer in the radial direction (mm) 0.257First layer in the vertical direction (mm) 0.6Expanding factor 1.0–1.2Grid number (million) 4.5–4.9
Table 3Summary of numerical schemes.
Items Scheme
Turbulence model Smagorinsky-Lilly (Cs ¼ 0.032)Spatial discretization method Second order central difference schemeTime discretization method for momentumequation
First order implicit scheme
Time discretization method for volumefraction equation
Explicit scheme
Pressure-velocity coupling Pressure-Implicit with Splitting ofOperators (PISO)
Courant number 0.25Dynamic mesh Layering
S. Zhang, T. Ishihara Ocean Engineering 163 (2018) 583–598
mesh is too coarse to resolve the laminar sublayer, it is assumed that thecentroid of the wall adjacent cell falls within the logarithmic region of theboundary layer, and the law-of-the-wall is employed.
2.4. Simulation cases
The model shown in Fig. 1 is firstly studied by vertically forcedoscillation test. The model is vertically forced to oscillate sinusoidally asin Eq. (8).
xðtÞ ¼ a sinðωtÞ (8)
where, xðtÞ is the time-varying displacement in the vertical direction inthis study, a is the oscillating amplitude, ω is the oscillating angularfrequency (¼ 2π=T ), and T is the oscillating period.
In the numerical simulations for the model shown in Fig. 1, theoscillating amplitude is 0.02m, and oscillating periods vary from 0.8 s to2.1 s. The tested cases for the multiple heave plates are listed in Table 5.The KC number and frequency number, β , shown in Table 5 are definedas follows:
KC ¼ Vmax
DHpf¼ ωa
DHpf¼ 2πa
DHp(9)
β ¼ ReKC
¼ VmaxDHpν
VmaxDHpf
¼ D2Hpfν
(10)
where, Vmax is the maximum oscillating velocity, a is the oscillatingamplitude, DHp is the circumcircle diameter of the heave plate, f is theoscillating frequency and ν is the kinematic viscosity of water.
In this study, the effect of spacing between Hp-1 and Hp-2 (see Fig. 1)on hydrodynamic coefficients is also investigated. Moreover, influencesof the diameter ratio (DHp=Dc) and the aspect ratio (tHp=DHp) on thehydrodynamic coefficients are studied as well. Several configurations ofthe model are simulated in terms of different spacing, diameter ratios andaspect ratios as specified in Table 6, Table 7 and Table 8, respectively.The spacing between Hp-1 and Hp-2 changes from 0.020m to 0.225m,while the spacing between upper hull and Hp-1 remain unchanged asshown in Table 6. As a result, the model draft varies from 0.295m to0.5 m. The diameter and thickness of heave plates are kept as a constant.Consequently, the spacing ratio of heave plates in present numericalsimulations ranges from 0.060 to 0.674. In Table 7, the thickness and
586
circumcircle diameters of octagonal Hp-1 and Hp-2 remain unchanged,while the diameter of column changes from 0.042m to 0.167m. There-fore, the diameter ratio of heave plates ranges from 2.0 to 8.0. Only asingle heave plate is used to study the effect of aspect ratio on hydro-dynamic coefficients. In Table 8, the thickness of the heave plate changesfrom 0.00334m to 0.0668m, corresponding to the aspect ratio rangingfrom 0.010 to 0.200. The oscillating parameters used in this study arespecified in Table 9.
2.5. Definition of hydrodynamic coefficients
The time series of predicted hydrodynamic force, FHðtÞ , is obtainedby subtracting the buoyancy force, Fb , and hydrostatic force, FKðtÞ, fromthe total predicted force, FðtÞ, which is obtained from the surface pres-sure and shear on the model.
FHðtÞ ¼ FðtÞ-Fb-FKðtÞ (11)
where,
Fb ¼ ρwg8 (12)
FKðtÞ ¼ -KR xðtÞ (13)
ρw is the water density, g is the gravitational acceleration, 8 is the dis-placed volume by the model at its mean position, KR is the hydrostaticstiffness and KR ¼ ρwgAw, Aw is the water plane area, and xðtÞ is thetime-varying displacement of the model.
The hydrodynamic force, FHðtÞ, can be expressed in the form ofMorison's equation as follows:
FHðtÞ ¼ �CaMat €xðtÞ � 0:5CdρwAj _xðtÞj _xðtÞ
¼ 13CaρwD3
Hp-1aω2sinðωtÞ
�12CdρwA ðaωÞ2jcosðωtÞjcosðωtÞ
(14)

Table 4Summary of boundary conditions.
Items Boundary conditions
Model walls No-slip wallTop of air phase SymmetryBottom of water phase SymmetrySide walls SymmetryInlet and Outlet Outflow (zero gradient of velocity)
Table 5List of cases in the forced oscillation test.
Period (s) Amp. (m) KC β
0.8 0.02 0.38 1390281.1 0.02 0.38 1011111.3 0.02 0.38 855561.7 0.02 0.38 654252.1 0.02 0.38 52963
S. Zhang, T. Ishihara Ocean Engineering 163 (2018) 583–598
where Ca is the added mass coefficient, Cd is the drag coefficient,Mat¼ ð1=3ρwD3
Hp-1Þ is the theoretical added mass of the heave plate asdefined in reference (Sarpkaya, 2010), DHp-1 is the circumcircle diameterof the heave plate Hp-1, and A ¼ ð1=4πD2
Hp-1Þ is the characteristic area ofthe heave plate, _XðtÞ and €XðtÞ are the velocity and acceleration of themodel motion, respectively.
As shown in the reference (Sarpkaya, 2010), Fourier averages of Ca
and Cd are obtained as follows:
Ca ¼
Z T
0FHðtÞsinðωtÞdt
13ρwD3
Hp-1aω2Z T
0sin2ðωtÞdt
¼ 3πωaρwD3
Hp-1
Z T
0FHðtÞsinðωtÞdt
(15)
Cd ¼ �
Z T
0FHðtÞcosðωtÞdt
12ρwAðωaÞ2
Z T
0jcosðωtÞjcosðωtÞcos2ðωtÞdt
¼ � 34ρwAωa2
Z T
0FHðtÞcosðωtÞdt
(16)
The Parameters of the model are described in Table 10.
2.6. Water tank test
A water tank test was carried out in this study to validate the pre-dicted Ca and Cd by the numerical simulations. Dimensions of the watertank are 100m length, 5m width, and 2.65m depth. The water depth setup in this experiment is 2.0m. Overview of the tested model is shown inFig. 3. The detailed dimensions of the multiple heave plates are described
Table 6Specifications of the configurations in different spacing ratios (The values only show
Items Case 1
Columns diameter (mm) Dc 0.050Upper hull circumcircle diameter (mm) Dp 0.200Hp-1 (Hp-2) circumcircle diameter (mm) DHp-1 , DHp-2 0.334Diameter ratio DHp-1=Dc 6.680Hp-1 aspect ratio tHp-1=DHp-1 0.150Hp-2 aspect ratio tHp-2=DHp-2 0.195Spacing between Hp-1 and Hp-2 (mm) L 0.020Model draft h 0.295Spacing ratio L=DHp-1 0.060
587
in Table 1. The cases conducted in the water tank test are listed inTable 5.
The time series of measured hydrodynamic force, FHðtÞ, is obtained bysubtracting the buoyancy force, Fb, inertia force, FIðtÞ, and hydrostaticforce, FKðtÞ, from the measured total force, FðtÞ.
FHðtÞ ¼ FðtÞ-Fb-FIðtÞ-FKðtÞ (17)
where,
FIðtÞ ¼ -M €XðtÞ (18)
M is the model mass including the mass of attachment used to connectthe force balance and the model, €XðtÞ is the acceleration of the modelmotion, Fb and FKðtÞ are evaluated by Eq. (12) and Eq. (13), respectively.
The parameters of the model are listed in Table 10. When the hy-drodynamic force is obtained according to Eq. (17), the Ca and Cd areidentified by Eqs. (15) and (16), respectively. In order to mitigate theunstable result owing to measurement uncertainties, ten periods ofmeasured data are used in the data analysis.
2.7. Validation of numerical results
In this section, time history of predicted and measured hydrodynamicforces is presented in a non-dimensional form as follows:
CFðt�Þ ¼ FHðtÞ12ρwAðωaÞ2
; t� ¼ tT
(19)
where, FHðtÞ is the predicted or measured hydrodynamic forces accord-ing to Eq. (11) and Eq. (17), A is the characteristic area of the heave plate,and t� is the non-dimensional time.
The predicted and measured time history of non-dimensional hy-drodynamic force is illustrated in Fig. 4. The inertia contribution fromforce balance was excluded when analyzing the experimental data andthe experimental data is filtered with cut-off frequency to remove noisein signal. Eight-period data from time zero was removed from experi-mental data to reach stable time series of hydrodynamic force. Conse-quently, the predicted hydrodynamic force matches well with themeasurement in terms of phase and the error of predicted amplitude is�1.3%. Time series of the predicted hydrodynamic force becomes stableafter the initial first period. In order to prevent the effect from the initialunstable solution on the accuracy of hydrodynamic coefficients, thesimulated data from the third period to the fifth period are chosen in thedata analysis, and the averaged coefficients are used in this paper.
The predicted and measured Ca and Cd in the case of an oscillatingperiod of 1.3 s are presented in Fig. 5 for the purpose of grid and time stepindependence study. It is found from Fig. 5(a) that coarse grid bringsabout overestimation of hydrodynamic coefficients, especially in theprediction of Cd, which implies that the fine grids around the corners ofthe heave plates are required to accurately simulate the flow separation.The results obtained from the finest grid match well with those obtainedfrom the experiment. Numerical results show a weak dependence on thetime step as shown in Fig. 5(b). It should be noted that the large time step
n in Case1 are used for all cases).
Case 2 Case 3 Case 4 Case 5 Case 6
0.040 0.075 0.125 0.175 0.2250.315 0.350 0.400 0.450 0.5000.120 0.224 0.374 0.524 0.674

Table 7Specifications of the configurations in different diameter ratios (The values only shown in Case 1 are used for all cases).
Items Case 1 Case 2 Case 3 Case 4 Case 5 Case 6 Case 7
Columns diameter (m) Dc 0.167 0.095 0.084 0.067 0.056 0.050 0.042Upper hull circumcircle diameter(m) Dp 0.200Hp-1 (Hp-2) circumcircle diameter(m) DHp-1 , DHp-2 0.334Hp-1 aspect ratio tHp-1=DHp-1 0.150Hp-2 aspect ratio tHp-2=DHp-2 0.195Diameter ratio DHp-1=Dc 2.0 3.5 4.0 5.0 5.96 6.68 8.0Spacing between Hp-1 and Hp-2 (m) L 0.225Spacing ratio L=DHp-1 0.674
Table 8Specifications of the configurations in different aspect ratios (The values only shown in Case1 are used for all cases).
Items Case 1 Case 2 Case 3 Case 4 Case 5
Columns diameter (m) Dc 0.050Hp-2 circumcircle diameter(m) DHp-2 0.334Hp-2 thickness (m) tHp-2 0.00334 0.01002 0.0167 0.0334 0.0668Aspect ratio tHp-2=DHp-2 0.010 0.030 0.050 0.100 0.200
Table 9Description of the oscillation parameters used in the numerical simulations.
Items Symbol Value
Oscillating amplitude (m) a 0.02Oscillating period (s) T 0.8KC number KC 0.38Frequency parameter β 139028
Table 10Description of parameters of the model as shown in Fig. 1.
Parameters Symbol Value
Characteristic area (m2) A 0.0789Displaced volume (m3) 8 0.01062Water density (kg/m3) ρw 1000Hydrostatic stiffness (N/m) KR 277.4
Fig. 3. Overview of the tested model in the water tank test.
S. Zhang, T. Ishihara Ocean Engineering 163 (2018) 583–598
will cause large courant number, which significantly impacts theconvergence of numerical iterations. Therefore, a sufficiently small timestep is required in VOF method to simulate the unsteady flow. Conse-quently, the finest grid and a time step of 0.001 s are used in followingnumerical simulations.
Fig. 6 shows predicted and measured Ca and Cd for different oscil-lating periods. Ca exhibits negligible oscillating periods dependence. It isalso found that Ca is less than 2.0 even though one additional surfacepiercing plate is expected to provide some added mass. The reason isprimarily due to the fact that the shape of present heave plates isoctagonal cross-section, which provides smaller added mass comparedwith the circular plate along with the presence of center columnsdepriving contribution to added mass approaching theoretical value.Predicted and measured Cd are also found almost independent of oscil-lating period as shown in Fig. 6(b).
As a conclusion from this section, predicted hydrodynamic co-efficients for the multiple heave plates shows favorable agreement withthose obtained from the water tank test, and the Ca is almost independentof frequency parameter, β, while Cd shows weak dependence on fre-quency parameter, β.
3. Mechanism of hydrodynamic force and effect of geometricparameters
In this section, mechanism of hydrodynamic force on the multipleheave plates are clarified, and the effects of geometrical parameters, such
588

Fig. 4. Comparison of the predicted and measured hydrodynamicforce coefficient.
S. Zhang, T. Ishihara Ocean Engineering 163 (2018) 583–598
as spacing ratio, diameter ratio and aspect ratio on hydrodynamic co-efficients are then discussed. The numerical results are also used inSection 4 to provide database for deriving formulas of hydrodynamiccoefficients. The proposed formulas can be used in design of offshorestructures with heave plates.
3.1. Mechanism of hydrodynamic force
According to the predicted hydrodynamic force on each heave plate,i.e. Hp-1 and Hp-2 as shown in Fig. 1, the Ca and Cd of each heave plateare evaluated by Eq. (15) and Eq. (16), respectively. The hydrodynamicforce used to evaluate the Ca and Cd of each plate, FH;Hp-iðtÞ, are obtainedby following expression:
FH;Hp-iðtÞ ¼ ρwght;Hp-iAt;Hp-i � ρwghb;Hp-iAb;Hp-iþ ρwg
�Ab;Hp-i � At;Hp-i
xðtÞ þ FHp-iðtÞ (20)
where, FHp-iðtÞ refers to the calculated total force which includes theeffect of hydrostatic pressure, hb;Hp-i and ht;Hp-i represent the depth oflower and upper surface of the heave plate Hp-i from the still water level,respectively; Ab;Hp-i and At;Hp-i are the characteristic area of lower andupper surface of heave plate Hp-i, respectively; xðtÞ is the time-varyingdisplacement as given in Eq. (8).
Fig. 7 shows the predicted Ca and Cd of Hp-1 and Hp-2 varying withoscillating periods. It is found from Fig. 7 (a) that Ca of Hp-2 is slightlylarger than that Hp-1, which is because mass of an ellipsoid of waterenclosing the Hp-2 is larger than that of Hp-1 due to absence of centercolumn below Hp-2. Cd of Hp-1 is larger than that of Hp-2, especially in
Fig. 5. Effect of grid and time step refinements on the
589
low oscillating periods as shown in Fig. 7 (b), which is because that thethinner plate, the larger Cd. The significant nonlinearity of oscillatingflow in higher oscillating frequency makes the differences between Hp-1and Hp-2 more remarkable. One additional simulation is carried out toinvestigate the effect of upper hull on the hydrodynamic coefficient ofHp-1. As seen from Fig. 7, Ca of Hp-1 is close to Ca of Hp-2 when upperhull is absent.
The dynamic pressure will be used to explain the force acting on eachheave plate, and is made a non-dimensional form as follows:
Cp ¼ p-ρwgh12ρwðωaÞ2
(21)
where, p is the pressure in the flow field, which contains hydrodynamicpressure and hydrostatic pressure, h is the depth of the computationalcell from the still water level.
The time history of non-dimensional hydrodynamic force on eachheave plate is shown in Fig. 8. Fig. 9(b) shows the correspondinginstantaneous dynamic pressure distribution around the multiple heaveplates in one oscillating period. At time t¼ 0, due to the previousaccelerating ascent, the upper surface of Hp-1 acts as the like stagnation,and is experiencing a positive dynamic pressure at this moment. Inaddition, the dynamic pressure around the lower surface of Hp-1 isalmost zero at this moment. Therefore, the resultant hydrodynamic forceacting on Hp-1 is negative as shown in Fig. 8. From this moment, themodel starts to decelerate. The upward moving flow caused by previousascending model keeps moving upward at time 0, and velocity of themoving model is smaller than that of moving flow around it. Then, theupper surface of Hp-1 starts to locate in the wake of moving flow. As aresult, the upper surface of Hp-1 is subjected to negative dynamic pres-sure while the lower surface is experiencing positive dynamic pressure attime t¼ 2/8 T. The substantial magnitude of dynamic pressure at thismoment leads to the maximal positive hydrodynamic force within theoscillating period (see Fig. 8). The coming distribution of dynamicpressure at time t¼ 4/8 T and t¼ 6/8 T are very similar to those at t¼ 0and T¼ 2/8 T, whereas the sign of dynamic pressure is reverse. Similarphenomena and conclusions can also be found for the Hp-2. The dynamicpressures around Hp-1 and Hp-2 at time t¼ 2/8 T are almost same, butthe central column does not pierce the plate Hp-2, being absent from thelower surface. As a result, the maximum hydrodynamic force on Hp-2 isslightly larger than that of Hp-1 as shown in Fig. 8, which leads to a largerCa for Hp-2 as shown in Fig. 7(a).
3.2. Effect of spacing ratio and diameter ratio
The cases listed in Tables 6 and 7 are conducted to systematicallystudy the effect of spacing ratio (rL¼ L=DHp1) and diameter ratio(Rd ¼ DHp-1=Dc), respectively. Fig. 9(a) and (b) show the dynamic pres-sure distribution for two representative spacing ratios, i.e. rL ¼ 0.06 andrL ¼ 0.674. The variation of Ca and Cd with different spacing ratios is
accuracy of predicted hydrodynamic coefficients.
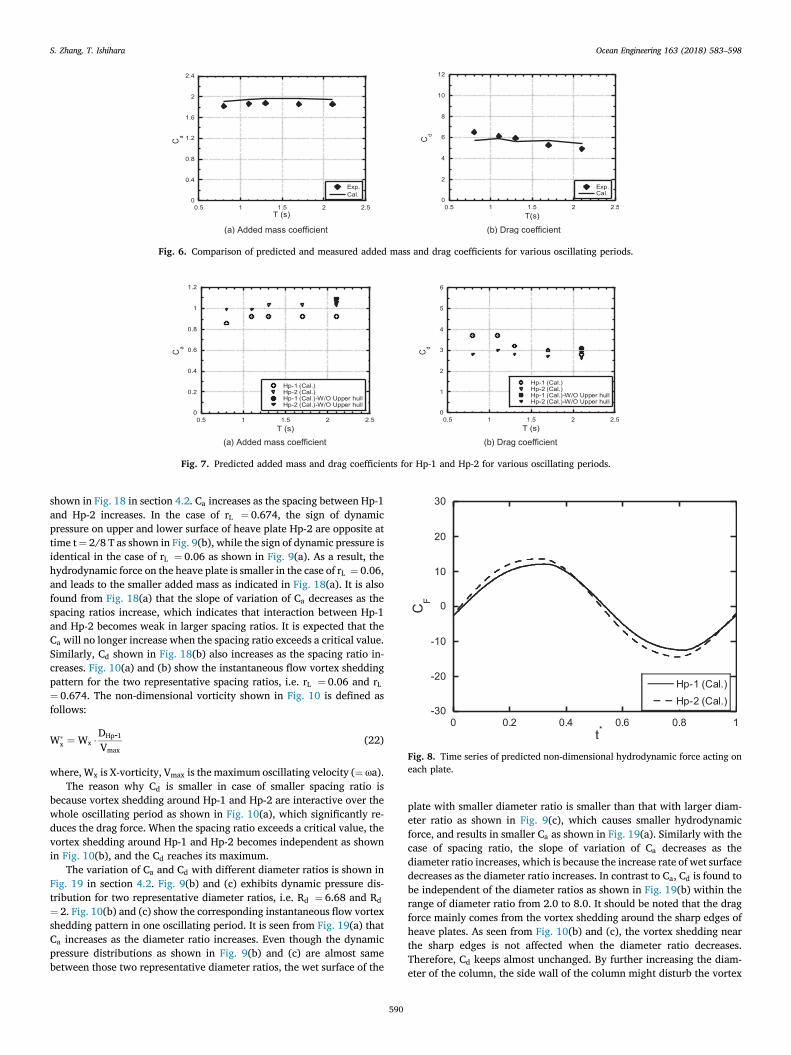
Fig. 6. Comparison of predicted and measured added mass and drag coefficients for various oscillating periods.
Fig. 7. Predicted added mass and drag coefficients for Hp-1 and Hp-2 for various oscillating periods.
Fig. 8. Time series of predicted non-dimensional hydrodynamic force acting oneach plate.
S. Zhang, T. Ishihara Ocean Engineering 163 (2018) 583–598
shown in Fig. 18 in section 4.2. Ca increases as the spacing between Hp-1and Hp-2 increases. In the case of rL ¼ 0.674, the sign of dynamicpressure on upper and lower surface of heave plate Hp-2 are opposite attime t¼ 2/8 T as shown in Fig. 9(b), while the sign of dynamic pressure isidentical in the case of rL ¼ 0.06 as shown in Fig. 9(a). As a result, thehydrodynamic force on the heave plate is smaller in the case of rL ¼ 0.06,and leads to the smaller added mass as indicated in Fig. 18(a). It is alsofound from Fig. 18(a) that the slope of variation of Ca decreases as thespacing ratios increase, which indicates that interaction between Hp-1and Hp-2 becomes weak in larger spacing ratios. It is expected that theCa will no longer increase when the spacing ratio exceeds a critical value.Similarly, Cd shown in Fig. 18(b) also increases as the spacing ratio in-creases. Fig. 10(a) and (b) show the instantaneous flow vortex sheddingpattern for the two representative spacing ratios, i.e. rL ¼ 0.06 and rL¼ 0.674. The non-dimensional vorticity shown in Fig. 10 is defined asfollows:
W�x ¼ Wx �DHp-1
Vmax(22)
where, Wx is X-vorticity, Vmax is the maximum oscillating velocity (¼ ωa).The reason why Cd is smaller in case of smaller spacing ratio is
because vortex shedding around Hp-1 and Hp-2 are interactive over thewhole oscillating period as shown in Fig. 10(a), which significantly re-duces the drag force. When the spacing ratio exceeds a critical value, thevortex shedding around Hp-1 and Hp-2 becomes independent as shownin Fig. 10(b), and the Cd reaches its maximum.
The variation of Ca and Cd with different diameter ratios is shown inFig. 19 in section 4.2. Fig. 9(b) and (c) exhibits dynamic pressure dis-tribution for two representative diameter ratios, i.e. Rd ¼ 6.68 and Rd
¼ 2. Fig. 10(b) and (c) show the corresponding instantaneous flow vortexshedding pattern in one oscillating period. It is seen from Fig. 19(a) thatCa increases as the diameter ratio increases. Even though the dynamicpressure distributions as shown in Fig. 9(b) and (c) are almost samebetween those two representative diameter ratios, the wet surface of the
590
plate with smaller diameter ratio is smaller than that with larger diam-eter ratio as shown in Fig. 9(c), which causes smaller hydrodynamicforce, and results in smaller Ca as shown in Fig. 19(a). Similarly with thecase of spacing ratio, the slope of variation of Ca decreases as thediameter ratio increases, which is because the increase rate of wet surfacedecreases as the diameter ratio increases. In contrast to Ca, Cd is found tobe independent of the diameter ratios as shown in Fig. 19(b) within therange of diameter ratio from 2.0 to 8.0. It should be noted that the dragforce mainly comes from the vortex shedding around the sharp edges ofheave plates. As seen from Fig. 10(b) and (c), the vortex shedding nearthe sharp edges is not affected when the diameter ratio decreases.Therefore, Cd keeps almost unchanged. By further increasing the diam-eter of the column, the side wall of the column might disturb the vortex

Fig. 9. Distribution of non-dimensional dynamic pressure around the multiple heave plates in one oscillating period.
S. Zhang, T. Ishihara Ocean Engineering 163 (2018) 583–598
shedding around the heave plate, probably resulting in smaller Cd.However, such smaller diameter ratio is rarely used in the application ofheave plate.
According to Figs. 18(b) and 19(b), Cd provided by the double heaveplates is less than 7.0, which is even smaller than that of a single heaveplate predicted or measured in the literature (Lopez-Pavon andSouto-Iglesias, 2015; Li et al., 2013). The reason is primarily owing to thefact that the aspect ratio of the heave plates used in this study is signif-icantly larger than those in the references.
591
3.3. Effect of aspect ratio
The cases listed in Table 8 are conducted to systematically study theeffect of aspect ratio (rt ¼ tHp=DHp) on hydrodynamic coefficients. Thethickness of the octagonal single heave plate is varied from 3.34mm to66.8mm, corresponding to the aspect ratio ranging from 0.01 to 0.2. Thedraft of the heave plate is identical to the depth of Hp-2 shown in Fig. 1.The numerically identified Ca and Cd varying with the aspect ratios areshown in Fig. 12 in section 4.1. It is found that Ca is independent of theaspect ratio because the change of the thickness has no influence on the

Fig. 10. Instantaneous flow vortex shedding pattern around the multiple heave plates in one oscillating period.
S. Zhang, T. Ishihara Ocean Engineering 163 (2018) 583–598
change in characteristic area of upper and lower surface of the heaveplate, and has no remarkable impact on the dynamic pressure distribu-tion. In contrast to the Ca, Cd is strongly dependent of the aspect ratio asshown in Fig. 12(b). It is found that Cd decreases as the aspect ratio in-creases. Variations of the thickness generate distinct vortex sheddingpatterns, which have been reported in the references (Tao and Thiagar-ajan, 2003a, 2003b). Fig. 11 shows the instantaneous vortex sheddingaround the heave plate with two representative aspect ratios at time t¼ 0when the heave plate is moving upward from its mean position. The
592
unidirectional vortex shedding happens in the case of small aspect ratioas shown in Fig. 11(a), while the interactive vortex shedding is observedunder the condition of large aspect ratio in Fig. 11(b). It is the emerginginteraction of vortex shedding from the upper and lower surface of heaveplate that leads to the decreased Cd. As the aspect ratio further increases,independent vortex shedding pattern will happen as studied by Tao andThiagarajan (2003a).
The aspect ratio of the Hp-1 and Hp-2 shown in Fig. 1 is 0.15 and0.20, respectively. Therefore, Cd is expected smaller than those predicted

Fig. 11. Instantaneous flow vortex pattern around the single heave plate with two different aspect ratios at oscillating time t¼ 0.
S. Zhang, T. Ishihara Ocean Engineering 163 (2018) 583–598
and measured in the literature (Lopez-Pavon and Souto-Iglesias, 2015; Liet al., 2013, WindFloat), where the aspect ratio is around 0.005–0.01. Ingeneral, the heave plate mainly has two functions. One is used to reducethe heave motion. In this sense, the heave plate should be designed asthin as possible to reach sufficiently large Cd, such as the application inWindFloat (WindFloat). The other is used to stabilize the structure bylowering the center of gravity. In this respect, the heave plate would bedesigned with a certain thickness to allow for pouring the ballast water.The present multiple heave plates aim to achieve the mentioned twofunctions at same time. The usage of double heave plates makes Cd
reaches almost 7.0, which significantly increases the damping in theheave direction.
As a conclusion from this section, change of aspect ratio only in-fluences the Cd. Change of the spacing ratio between multiple heaveplates affects both Ca and Cd, while the variation of diameter ratio onlyaffects Ca. Formulas of Ca and Cd according to those sensitive geometricalparameters will be established in next section.
4. Formulas of hydrodynamic coefficients
In this section, the formula of Ca and Cd are proposed consideringvarious geometric parameters and KC number. First, the formulas for asingle heave plate with various cross-sections are improved and validatedagainst published data in the literature and present numerical simula-tions. Then, the formulas for each plate in the double heave plates
Fig. 12. Comparison of numerical identified and formula predicted added mass and d
593
considering the spacing and diameter ratio are proposed and validated bythe numerical simulations.
4.1. Added mass and drag coefficient for a single heave plate
Theoretical added mass of a heave plate without an attached columnequals to the mass of an ellipsoid of water enclosing the heave plate(Sarpkaya, 2010). The ellipsoid is separated into two half ellipsoids by afinite distance (thickness of the heave plate). When one column is appliedon the top of heave plate, the volume taken by the column is excluded torepresent the effective added mass. Consequently, formula of Ca for asingle circular heave plate with a column is firstly proposed by Tao et al.(2007) and rewritten as follows:
Ca¼ 1-14
"3r2d
ffiffiffiffiffiffiffiffiffi1-r2d
qþ�1-
ffiffiffiffiffiffiffiffiffi1-r2d
q �2�2þ
ffiffiffiffiffiffiffiffiffi1-r2d
q �#(23)
where, rd ¼ Dc=DHp, which is the reciprocal of diameter ratio Rd.The proposed formula by Tao et al. (2007) is suitable for the case with
very low KC number. As mentioned in the references (Lopez-Pavon andSouto-Iglesias, 2015; Tao et al., 2004, 2007; Tao and Cai, 2004) that Ca
increases as KC number increases. Therefore, a correction factor, k1 ,associated with KC number should be considered in the formula. Inaddition, it is found from the literature (Li et al., 2013; Tao et al., 2004;Tao and Dray, 2008) that Ca is strongly dependent on heave plate
rag coefficients for the single octagonal heave plate with different aspect ratios.

S. Zhang, T. Ishihara Ocean Engineering 163 (2018) 583–598
cross-sections, such as circular and rectangular heave plate. Thus, a shapecorrection factor, k2 , which represents the change of cross-section isneeded when applying the formula for the heave plate other than circularones. In this study, an integrated correction factor, k , expressed by themultiplication of k1 and k2 is used to take into account the effect of bothKC number and shape correction factor. The correction factor, k , is usedto modify the diameter of the ellipsoid representing the added mass. Alinear function of KC number is adopted for k1 in this study. In the shapecorrection factor, k2 , there is no reduction for the diameter of circularheave plate, while the equivalent diameter is reduced to its 95% for anoctagonal heave plate, and is reduced to its 75% for a square heave plate.They are purely empirical values based on the fitting of Ca for anoctagonal heave plate and a square heave plate. It should be noted thatthe diameter is reduced with respect to the circumcircle diameter of thecross-section. As a result, formula of Ca for a single heave plate attachedwith a column is improved as follows:
Ca ¼ k3 � 14
�3r2d
ffiffiffiffiffiffiffiffiffiffiffiffiffiffiffik2 � r2d
q
þ�k�
ffiffiffiffiffiffiffiffiffiffiffiffiffiffiffik2 � r2d
q �2�2kþ
ffiffiffiffiffiffiffiffiffiffiffiffiffiffiffik2 � r2d
q �# (24)
k ¼ k1 � k2 (25)
k1¼ 1þ 0:2 KC (26)
k2 ¼( 1:00; Circular heave plate
0:95; Octagonal heave plate0:75; Square heave plate
(27)
where, rd ¼ Dc=DHp, which is the reciprocal of diameter ratio Rd, k rep-resents the correction factor which is a function of KC number and heaveplate cross-section, and KC refers to the KC number.
As mentioned in section 3.3 and previous studies, Cd is dependent ofaspect ratio, rt, and KC number. According to the proposed formula(Cd¼ AðKCÞn) by Graham (1980), Tao and Thiagarajan (2003a) identi-fied the coefficients (A and n) for three typical vortex shedding regimes.Whereas, Cd actually varies with the aspect ratio, rt, even in one specificdefined vortex shedding regime. In other words, the coefficient A in theformula should be a function of aspect ratio rather than a constant. In thisstudy, by fixing the KC number as unit one, the coefficient A as a functionof aspect ratio, rt, is evaluated based on the data of Cd versus aspect ratio,rt, in the study by Tao and Thiagarajan (2003a). Then, the coefficient n isevaluated. The evaluation of coefficient n for square heave plate followsthe abovementioned procedure according to the data in the study by Liet al. (2013). In this study, a new formula of Cd is proposed to representthe effect of both aspect ratio and KC number for a single heave plate andis improved as below:
Cd¼ minn1:7r-1=3:7t ðKCÞ-1=k3 ;12
o(28)
k3 ¼( 2:5; Circular heave plate
2:5; Octagonal heave plate3:0; Square heave plate
(29)
where, rtð¼ tHp=DHpÞ is the aspect ratio of heave plate, tHp is the thicknessof heave plate, and DHp is the (circumcircle) diameter of heave plate, k3 isa shape correction factor for different heave plate cross-sections, theupper bound of Cd is limited to 12 for sake of the possible infinite valueby the formula. This upper limit is proposed based on the measured Cd inthe reference (Lopez-Pavon and Souto-Iglesias, 2015) in which Cd issmaller than 12 in the condition with a very small thickness ratio of0.005.
Fig. 12 shows a comparison of numerical identified and formulapredicted Ca and Cd of a single octagonal heave plate with different
594
aspect ratios. With consideration of the shape factor k2 ¼ 0.95, predictedCa from the present formula matches well with that obtained from thenumerical simulation as shown in Fig. 12(a). As can be found fromFig. 12(b), aspect ratio dependence of Cd is also represented well by thepresent formula, especially for smaller aspect ratios where the unidi-rectional vortex shedding occurs as discussed in section 3.3. The pro-posed formula overestimates the drag coefficient in the transition regimein which complex interactive vortex shedding is expected. Asapproaching independent vortex shedding pattern, the accuracy of pro-posed formula for Cd improves as shown in Fig. 12(b).
Fig. 13 (a) and (b) show formulas predicted and measured Ca of acircular heave plate with an attached column, and a square heave plate,respectively. The proposed formulas are capable of predicting Ca pre-cisely with a proper intercept and slope with variation in KC number forboth circular plate with center column and square plate without columnas seen from Fig. 13 (a) and (b).
Comparisons of formula predicted and measured Cd for the heaveplate with circular and square cross-sections are presented in Fig. 14. It isfound that the proposed formula shows a good prediction of Cd varyingwith KC number. In addition, the variation of Cd with aspect ratios is alsowell represented by the proposed formula as shown in Fig. 14(b).
Therefore, the proposed formulas of Ca and Cd for a single heave platecovers the application of different cross-sections and KC number, andshow a good agreement with the measurement and present numericalresults.
4.2. Added mass and drag coefficient for double heave plates
The double heave plates could provide much more added mass anddamping than that of a single heave plate. The spacing (L) between theadjacent double heave plates is one key parameter in the determinationof hydrodynamic coefficients. If the spacing between the two heaveplates reduces to zero, the double heave plates actually act as a singleheave plate. In this case, Eq. (24) and Eq. (28) can be used for evaluationof Ca and Cd, respectively. On the other hand, when the spacing exceeds acritical value, Ca and Cd will be independent of the spacing ratio. In otherwords, each heave plate will act as a fully separated plate. When thespacing is between zero and the critical value, a flow interaction betweenthe double heave plates occurs, and the hydrodynamic coefficients willbe dependent on the spacing ratio in this range. Therefore, the effect ofspacing on the change of Ca and Cd for each heave plate should beconsidered.
The Hp-2 in Fig. 1 is attached by only one column, the formula of Ca isexactly the same as that for the single heave plate if the spacing exceeds acritical value. When the interaction between double heave plate occurs,the formula of Ca is derived by mathematically subtracting the inter-section part of the two ellipsoids above Hp-2. The formula of Ca for Hp-2is expressed as follows:
Ca;Hp-2 ¼
8>>>>>>>>>><>>>>>>>>>>:
k3 � 132
�12πr2drL þ ð2k� πrLÞ2
ð4kþ πrLÞ�; rL � 2k=π
k3 �14
"3r2d
ffiffiffiffiffiffiffiffiffiffiffiffiffiffiffik2 � r2d
qþ
�k�
ffiffiffiffiffiffiffiffiffiffiffiffiffiffiffik2 � r2d
q �2
�2kþ
ffiffiffiffiffiffiffiffiffiffiffiffiffiffiffik2 � r2d
q i; rL> 2k=π
(30)
where, rd ¼ Dc=DHp, rL¼ L=DHp, and k refers to the correction factor andis given in Eq. (25).
The Hp-1 in Fig. 1 is attached by two columns at both upper and lowersurfaces. Therefore, the volume taken by those two columns should beexcluded. In addition, the spacing effect on the lower surface of Hp-1should be considered. It is assumed that the upper surface of Hp-1 issufficiently far away from the still water level. The formula of Ca for Hp-1is expressed as follows:

Fig. 13. Comparison of formula predicted and measured added mass coefficients for the single heave plates with different cross sections and KC number.
Fig. 14. Comparison of formula predicted and measured drag coefficients for the single heave plate with different cross sections, KC number, and aspect ratios.
S. Zhang, T. Ishihara Ocean Engineering 163 (2018) 583–598
8>>>>k3 �14
3r2d
ffiffiffiffiffiffiffiffiffiffiffiffiffiffik2� r2d
qþ
�k�
ffiffiffiffiffiffiffiffiffiffiffiffiffiffik2� r2d
q �2�2kþ
ffiffiffiffiffiffiffiffiffiffiffiffiffiffik2� r2d
q �
Ca;Hp-1 ¼
>>>>>>>>><>>>>>>>>>>>>>:
" #
� 132
�12πr2drL þ ð2k�πrLÞ2ð4kþ πrLÞ
�; rL �2k=π
k3 �12
"3r2d
ffiffiffiffiffiffiffiffiffiffiffiffiffiffik2� r2d
qþ�k�
ffiffiffiffiffiffiffiffiffiffiffiffiffiffik2� r2d
q �2
�2kþ
ffiffiffiffiffiffiffiffiffiffiffiffiffiffik2� r2d
q i; rL> 2k=π
(31)
As mentioned in section 3.2, Cd mainly comes from the vortex shed-ding around the sharp edges of heave plate. Thus, Cd of the heave platedoes not depend on the number of attached columns. In addition, it isassumed that Cd linearly decreases as spacing ratio decreases. Formula ofCd for each heave plate is given as follows:
Cd;Hp-i ¼8<:
minn1:7r�1=3:7
t;Hp-i ðKCÞ�1=k3 � 1:85k2
þ1:45rL; 12g; rL � 2k2=πmin
n1:7r�1=3:7
t;Hp-i ðKCÞ�1=k3 ;12o; rL> 2k2=π
(32)
where, rt;Hp-i refers to the aspect ratio of each heave plate, i.e. Hp-1 or Hp-2; k2 and k3 refer to the shape correction factors defined in Eq. (27) andEq. (29). The coefficient with respect to the spacing ratio and the shapecorrection factor are identified according to the numerically predicted Cd
in this study.Fig. 15 shows the numerically identified and formulas predicted Ca
and Cd for each heave plate with different spacing ratios. As shown inFig. 15(a), variation of Ca with the spacing ratios is represented well bythe present formula for Hp-2. Predicted Ca for Hp-1 is slightly smallerthan that of Hp-2, and it is overestimated compared with the numericalidentified Ca, which is due to the effect of the upper hull above Hp-1 asshown in Fig. 1. It is found that variation of Cd with the spacing ratio and
595
effect of the aspect ratio are favorably represented by the present formulaas shown in Fig. 15(b).
Fig. 16 presents numerically identified and formulas predicted Ca andCd for each heave plate with various diameter ratios. The present formulashows a good performance for the prediction of Ca varying with thediameter ratios, especially for Hp-2. In the case of smaller diameter ratio,the gap of Ca between Hp-1 and Hp-2 is larger compared with that in thelarger diameter ratio, which is due to the influence of the number of theattached column. The formula predicted Ca for Hp-1 is also over-estimated, which is due to the effect of the upper hull above Hp-1 asshown in Fig. 1. In contrast to the Ca, formula predicted Cd is indepen-dent of diameter ratio, and agrees reasonably well with numerical resultsin this study.
The proposed formulas of Ca and Cd for each plate simultaneouslyconsider the effects of spacing ratio, diameter ratio, aspect ratio, and KCnumber and show favorable agreement with the numerical simulations.
In order to evaluate Ca and Cd of double heave plates as a whole, theformulas for each heave plate can be simply summed up. As a result,integral Ca of double heave plates is obtained according to Eq. (30) andEq. (31) as follows:
Ca ¼
8>>>>>>>>>>>>><>>>>>>>>>>>>>:
2k3 � 14
"3r2d
ffiffiffiffiffiffiffiffiffiffiffiffiffiffiffik2 � r2d
qþ
�k�
ffiffiffiffiffiffiffiffiffiffiffiffiffiffiffik2 � r2d
q �2�2kþ
ffiffiffiffiffiffiffiffiffiffiffiffiffiffiffik2 � r2d
q �#
� 116
�12πr2drL þ ð2k� πrLÞ2ð4kþ πrLÞ
�; rL � 2k=π
2k3 � 34
"3r2d
ffiffiffiffiffiffiffiffiffiffiffiffiffiffiffik2 � r2d
qþ�k�
ffiffiffiffiffiffiffiffiffiffiffiffiffiffiffik2 � r2d
q �2
�2kþ
ffiffiffiffiffiffiffiffiffiffiffik2-r2d
q ��; rL> 2k=π
(33)
where, rd ¼ Dc=DHp, rL¼ L=DHp, and k refers to the correction factor and

Fig. 15. Comparison of numerically identified and formulas predicted added mass and drag coefficients for each fully submerged plate with different spacing ratios.
Fig. 16. Comparison of numerically identified and formulas predicted added mass and drag coefficients for each fully submerged plate with different diameter ratios.
Fig. 17. Comparison of numerically identified and formulas predicted addedmass coefficient as a function of spacing ratio for the double heave plates withcircular cross-section studied by Tao et al. (Tao et al., 2007).
S. Zhang, T. Ishihara Ocean Engineering 163 (2018) 583–598
is given in Eq. (25).Similarly, formula for Cd of double heave plates is obtained as fol-
lows:
Cd ¼
8>>>><>>>>:min
n1:7
�r�1=3:7t;Hp-1 þ r�1=3:7
t;Hp-2 ðKCÞ�1=k3
�3:7k2 þ 2:9rL; 24g; rL � 2k2=πmin
n1:7
�r�1=3:7t;Hp-1 þ r�1=3:7
t;Hp-2 ðKCÞ�1=k3 ; 24g;
rL> 2k2=π
(34)
where, rt;Hp-1 and rt;Hp-2 represent the aspect ratio of heave plate Hp-1and Hp-2, respectively; k2 and k3 refer to the shape correction factorsdefined in Eq. (27) and Eq. (29), respectively.
Fig. 17 shows numerically identified Ca of a double circular heaveplates with different spacing ratios studied by Tao et al. (2007). Ca pre-dicted according to the formula proposed by Tao et al. and from presentformula are shown in the figure as well. It is found that Ca is stronglydependent of conducted KC number. Comparing with previous formula,the proposed formula successfully captures the trend of Ca varying withKC number. The differences between Ca predicted by the proposed for-mula and the numerical simulations in smaller or larger spacing ratiomight be owing to the limitation of the formula in the application for thesmall diameter ratio. The diameter ratio of the model in the literature(Tao et al., 2007) is only 1.31, and the local flow induced by flow sep-aration and vortex shedding might be significantly impacted by the sidewall of attached column.
Fig. 18 and Fig. 19 show Ca and Cd of the octagonal double heaveplates varying with spacing ratios and diameter ratios, respectively. Theoverestimation of Ca for Hp-1 by proposed formula leads to the over-prediction shown in Fig. 18(a). The proposed formulas in this study aresuitable for the heave plates which are sufficiently far away from the stillwater level. The formula of Cd for double heave plates shows a goodaccuracy even though proposed formula show some differences in esti-mation of Cd for each heave plate.
596
In the application of multi-plates containing more than two heaveplates, the integral Ca and Cd can be evaluated according to thearrangement of the heave plates and proposed formulas for each heaveplate in this study.
5. Conclusions
In this study, hydrodynamic coefficients of multiple heave plates areinvestigated by numerical simulations and water tank tests. The con-clusions are summarized as follows:

Fig. 18. Comparison of numerically identified and formulas predicted added mass and drag coefficients for double octagonal heave plates with differentspacing ratios.
Fig. 19. Comparison of numerically identified and formulas predicted added mass and drag coefficients for double octagonal heave plates with different diam-eter ratios.
S. Zhang, T. Ishihara Ocean Engineering 163 (2018) 583–598
1. Added mass and drag coefficients of multiple heave plates predictedby large eddy simulations with volume of fluid method show a goodagreement with the experimental data by the water tank test. Gridand time step dependencies are investigated. Fine grid and small timestep are required to accurately simulate the unsteady flow separationaround the sharp edges of the heave plates, which affect the accuracyof predicted drag coefficient.
2. Effects of spacing ratio and diameter ratio of the multiple heave platesare systematically studied by large eddy simulations. The added masscoefficient, Ca, increases as the spacing ratio increases till a criticalvalue of spacing ratio and also increases as the diameter ratio in-creases. The drag coefficient, Cd, increases as the spacing ratio in-creases and is independent of the diameter ratio. For a single heaveplate, Ca is independent of the aspect ratio, but Cd decreases rapidly asthe aspect ratio increases and it approaches a constant value when theaspect ratio exceeds a critical value.
3. Shape correction factors are proposed in the formulas of Ca and Cd fora single plate and double heave plates. The formulas for a single heaveplate with different cross-sections are validated by the data in theliterature and the numerical simulations. In addition, formulas of Ca
and Cd for each heave plate in the double heaves are also proposedand validated by the numerical simulations in this study.
Acknowledgement
This research is carried out as a part of the Fukushima floatingoffshore wind farm demonstration project funded by the Ministry ofEconomy, Trade and Industry (gs:_501100003050). The authors wish toexpress their deepest gratitude to the concerned parties for theirassistance during this study.
597
References
An, S., Faltinsen, O.M., 2013. An experimental and numerical study of heave added massand damping of horizontally submerged and perforated rectangular plates. J. FluidsStruct. 39, 87–101.
Browning, J., Jonkman, J., Robertson, A., Goupee, A., 2014. Calibration and validation ofa spar-type floating offshore wind turbine model using the FAST dynamic simulationtool. In: Journal of Physics: Conference Series. IOP Publishing.
Fluent Theory Guide, 2012. Ansys Inc., Canonsburg, PA.Fukushima FORWARD: http://www.fukushima-forward.jp/english/index.html.Garrido-Mendoza, C.A., Thiagarajan, K.P., Souto-Iglesias, A., Colagrossi, A., Bouscasse, B.,
2015. Computation of flow features and hydrodynamic coefficients around heaveplates oscillating near a seabed. J. Fluids Struct. 59, 406–431.
GOTO FOWT:http://goto-fowt.go.jp/english/.Graham, J., 1980. The forces on sharp-edged cylinders in oscillatory flow at low
Keulegan–Carpenter numbers. J. Fluid Mech. 97 (02), 331–346.Holmes, S., Bhat, S., Beynet, P., Sablok, A., Prislin, I., 2001. Heave plate design with
computational fluid dynamics. J. Offshore Mech. Arct. Eng. 123 (1), 22–28.Hywind Demo: http://innovate.statoil.com/challenges/hywind/Pages/default.aspx.Jonkman, J.M., 2007. Dynamics Modeling and Loads Analysis of an Offshore Floating
Wind Turbine. ProQuest.Kvittem, M.I., Bachynski, E.E., Moan, T., 2012. Effects of hydrodynamic modelling in fully
coupled simulations of a semi-submersible wind turbine. Energy Procedia 24,351–362.
Li, J., Liu, S., Zhao, M., Teng, B., 2013. Experimental investigation of the hydrodynamiccharacteristics of heave plates using forced oscillation. Ocean. Eng. 66, 82–91.
Lopez-Pavon, C., Souto-Iglesias, A., 2015. Hydrodynamic coefficients and pressure loadson heave plates for semis-submersible floating offshore wind turbines: a comparativeanalysis using large scale models. Renew. Energy 81, 864–881.
Oka, S., Ishihara, T., 2009. Numerical study of aerodynamic characteristics of a squareprism in a uniform flow. J. Wind Eng. Industrial Aerodynamics 97 (11), 548–559.
Philip, N.T., Nallayarasu, S., Bhattacharyya, S., 2013. Experimental investigation and CFDsimulation of heave damping effects due to circular plates attached to spar hull. ShipsOffshore Struct. 1–17.
Phuc, P.V., Ishihara, T., 2007. A Study on the Dynamic Response of a Semi-submersibleFloating Offshore Wind Turbine System Part 2. numerical simulation. ICWE12,Cairns, Australia, pp. 959–966.
Prislin, I., Blevins, R.D., Halkyard, J.E., 1998. Viscous Damping and Added Mass of aSquare Plate. OMAE98–316., Lisbon, Portugal.

S. Zhang, T. Ishihara Ocean Engineering 163 (2018) 583–598
Sarpkaya, T., 2010. Wave Forces on Offshore Structures. Cambridge University Press.Stern, F., Wilson, R.V., Coleman, H.W., Paterson, E.G., 2001. Comprehensive approach to
verification and validation of CFD simulations - Part 1: methodology and procedures.Trans. ASME 123, 793–802.
Tao, L., Cai, S., 2004. Heave motion suppression of a Spar with a heave plate. Ocean. Eng.31 (5), 669–692.
Tao, L., Dray, D., 2008. Hydrodynamic performance of solid and porous heave plates.Ocean. Eng. 35 (10), 1006–1014.
Tao, L., Thiagarajan, K., 2003. Low KC flow regimes of oscillating sharp edges. II.Hydrodynamic forces. Appl. ocean Res. 25 (2), 53–62.
Tao, L., Thiagarajan, K., 2003. Low KC flow regimes of oscillating sharp edges I. Vortexshedding observation. Appl. ocean Res. 25 (1), 21–35.
Tao, L., Lim, K.Y., Thiagarajan, K., 2004. Heave response of classic spar with variablegeometry. J. Offshore Mech. Arct. Eng. 126 (1), 90–95.
Tao, L., Molin, B., Scolan, Y.-M., Thiagarajan, K., 2007. Spacing effects on hydrodynamicsof heave plates on offshore structures. J. Fluids Struct. 23 (8), 1119–1136.
598
Wadhwa, H., Thiagarajan, K.P., 2009. Experimental assessment of hydrodynamiccoefficients of disks oscillating near a free surface. In: ASME 2009 28th InternationalConference on Ocean, Offshore and Arctic Engineering. American Society ofMechanical Engineers.
Wadhwa, H., Krishnamoorthy, B., Thiagarajan, K.P., 2010. Variation of heave added massand damping near seabed. In: ASME 2010 29th International Conference on Ocean,Offshore and Arctic Engineering. American Society of Mechanical Engineers.
Waris, M.B., Ishihara, T., 2012. Dynamic response analysis of floating offshore windturbine with different types of heave plates and mooring systems by using a fullynonlinear model. Coupled Syst. Mech. 1 (3), 247–268.
WindFloat:http://windfloatpacific.com/.Yang, J., Tian, X., Li, X., 2014. Hydrodynamic characteristics of an oscillating circular
disk under steady in-plane current conditions. Ocean. Eng. 75, 53–63.Yoshimoto, H., 2016. The Validation of the Motion Performance of the Advanced Spar
Type Floater. WWEC15, Tokyo, Japan.