Embed Size (px)
Citation preview
Icarus 226 (2013) 67–76
Contents lists available at SciVerse ScienceDirect
Icarus
journal homepage: www.elsevier .com/locate / icarus
Numerically simulating impact disruptions of cohesive glass beadagglomerates using the soft-sphere discrete element method
0019-1035/$ - see front matter � 2013 Elsevier Inc. All rights reserved.http://dx.doi.org/10.1016/j.icarus.2013.05.007
⇑ Corresponding author at: Department of Astronomy Computer and SpaceSciences Building, Stadium Drive, University of Maryland, College Park MD 20742-2421, United States. Fax: +1 301 314 9067.
E-mail address: [email protected] (S.R. Schwartz).
Stephen R. Schwartz a,b,⇑, Patrick Michel b, Derek C. Richardson a
a Department of Astronomy, University of Maryland, College Park, MD 20740-2421, United Statesb Lagrange Laboratory, University of Nice Sophia Antipolis, CNRS, Observatoire de la Côte d’Azur, B.P. 4229, 06304 Nice Cedex 4, France
a r t i c l e i n f o a b s t r a c t
Article history:Received 1 December 2012Revised 7 May 2013Accepted 7 May 2013Available online 18 May 2013
Keywords:Asteroids, SurfacesCollisional physicsGeological processesRegoliths
We present our implementation of cohesion in the parallel N-body code pkdgrav in order to model smallbodies that are not fully monolithic but that have at least some degree of cohesion. Small bodies of ourSolar System show a great diversity in shapes, sizes and morphologies. However, we do not have directinformation on their internal structure. The response of small bodies to various kinds of processes, suchas impacts, depends on their internal properties in a way that is not yet well understood. It is thereforeimportant to model the different kinds of structures that can represent a small body, and to study theirinfluence on the way a body responds to the different processes undergone during its lifetime. Here, wepresent a preliminary study to serve as validation of our implementation of cohesive forces into pkdgrav.This study consists of comparing low-speed laboratory impact experiments on sintered glass beadagglomerates from a previously published work against our numerical simulations, which replicate thoseimpact conditions. The experimental targets are numerically modeled as agglomerates of soft spheresbound together by spring-like forces that mimic their cohesion. First we check that the strength proper-ties of the numerical target are identical to the real ones by successfully modeling numerically the Bra-zilian disk test, a standard experimental test to measure the tensile strength of various kinds of materials.We then reproduce in simulation two experiments that were performed using different impact condi-tions. The numerical results show that the outcome is very sensitive to the exact location of the impactpoint, as observed in experiments, and we find, in each case, satisfying agreement with experimental out-comes. This gives us confidence that we can apply our model in future studies to low-speed collisionsbetween aggregates, as occurred during the early phases of our Solar System’s history, and investigatea wide range of parameter space (e.g., material properties such as cohesion) as well as target shapesand/or sizes of individual spherical components, and the influence of the initial target rotation. Also infuture studies will also apply our model to other processes such as rotational fragmentation of cohesiveaggregates resulting from YORP spin-up.
� 2013 Elsevier Inc. All rights reserved.
1. Introduction
In this paper, we present the implementation of cohesion into anumerical model aimed at the study of the dynamics of granularmaterials that comprise the surfaces and, in some cases, the interi-ors of small Solar System bodies. For validation, we simulate im-pact experiments into small targets of sintered spherical glassbead agglomerates.
Space mission images of small bodies have shown a great diver-sity of shapes, sizes, and morphologies. Moreover, the bulk densi-ties that have been measured for some of these small bodiessuggest that their internal structure contains some degree of
porosity, as the values are systematically smaller than the bulkdensities of meteoritic analogues (Consolmagno et al., 2008). Forinstance, the NEAR-Shoemaker spacecraft performed a fly-by ofthe Asteroid (253) Mathilde in 1997, which allowed the determina-tion of the bulk density of this C-type asteroid (Yeomans et al.,1997). Its value is about 1.35 g/cm3, which suggests a porosity frac-tion up to 40% when compared to the bulk density of carbonaceouschondrites. Both observational and numerical works suggest that alarge fraction of small bodies, possibly down to a few hundreds ofmeters in size, consist of rubble piles, whose strength is dominatedby self-gravity (e.g., Benz and Asphaug, 1999). However, such grav-itational aggregates may also contain some cohesion, with thesmaller components of the small-body population likely domi-nated by cohesion, since these typically spin too fast to be ableto retain their shape if gravity alone were the only source ofstrength (Holsapple, 2007).
68 S.R. Schwartz et al. / Icarus 226 (2013) 67–76
Our knowledge of the internal makeup of small bodies is still verypoor; the response of small bodies to various kinds of influences—processes such as impacts or shaking—depends on their surfaceand/or internal properties in a way that is not yet well understood.In turn, such processes can then modify this makeup. Since we donot have precise knowledge of either, it is important to create modelsthat can represent small bodies in order that we are able to study theinfluence of different properties on the way a body may respond tothe different processes it undergoes during its lifetime. We recentlyadapted the parallel N-body code PKDGRAV to the modeling of the evo-lution of the granular materials that may comprise the surface andthe inside of small bodies (see Richardson et al., 2011; Schwartzet al., 2012). In particular, bodies that are not fully monolithic, but in-stead have at least some degree of cohesion, may be represented asgravitational aggregates composed of solid blocks linked together bygravity and/or cohesive forces. Perrine et al. (2011) have added theability to rigidly stick hard-sphere particles together in PKDGRAV,without the ability to bend or flex these bonds. In the newly adaptedversion of PKDGRAV presented in this paper, agglomerates of softspheres bound together by spring-like forces that mimic their cohe-sion can be used to represent these bodies. In the study we presenthere, we use this newly adapted version of the code to representmaterial constructed in a real-world, Earth-based laboratory, andnumerically calculate how this material reacts to the stresses of pro-jectile impact and of confining pressure. Our results are then com-pared to the laboratory results. Our intention is not to particularlyadd to the interpretation of those results, but rather to demonstratethat we can reproduce them adequately as a first step toward devel-oping a multi-purpose numerical tool.
A number of codes have already been developed in the generalfield of cohesive granular systems. For instance, Richefeu et al.(2009) used a 3-D discrete element method (DEM) with sphericalparticles enriched by a capillary force law to model the overallcohesion of wet granular materials. Also using a discrete elementapproach, Delenne et al. (2009) introduced a local cohesion lawthat accounts for the transition from capillary to cemented bond-ing in granular materials partially saturated with an aqueous solu-tion. Then, Radjaï et al. (2010) treated the solid binding matrixfilling (fully or partially) the interstitial space in a cohesive granu-lar media by using a Lattice Element Method, which was basedupon a lattice-type discretization of the particles and material ma-trix. More generally, different approaches are used to model gran-ular materials. One approach is to treat the material as acontinuum by averaging the physics across many particles. In thecase of solid-like granular behavior, the continuum approach usu-ally treats the material as elastic or elasto-plastic and models itwith the finite element method or a mesh-free method (e.g., Elas-kar et al., 2000; see also Holsapple (2004), Holsapple and Michel(2008), and Sharma et al. (2009) for use of analytical and contin-uum approaches in modeling asteroid shapes). However, thehomogenization of granular-scale physics is not necessarily appro-priate for capturing the discrete nature of the particles and theforces between them and between them and their wall-boundaries(Wada et al., 2006). Therefore, limits of such homogenization mustbe considered carefully before attempting to use a continuum ap-proach. Discrete element numerical coding, on the other hand, istypically carried out by way of a hard-sphere or soft-sphere ap-proach (termed the Hard- and Soft-Sphere Discrete Element Meth-od, referred to as HSDEM and SSDEM, respectively, hereafter). Inparticular, SSDEM is commonly used in the study of granular mate-rials, and has often been applied to industrial problems (Cleary andSawley, 2002; Kosinski and Hoffmann, 2009; also see Radjaï andDubois (2011) for a comprehensive overview). However, in com-parison with the continuum approach, DEM is not well-suited tothe treatment of supersonic motion, particle fragmentation, orphase-changing material. Within the appropriate regimes, which
are vast, only very recently has it started to be applied to the realmof planetary science. Granular physics codes are now developed oradapted specifically for planetary applications by various groups(e.g., Wada et al., 2006; Sánchez and Scheeres, 2011; Tancrediet al., 2012) using various integration schemes and implementa-tions of the types of friction between grains. Other codes using acontinuum approach (e.g., SPH hydroxides) have also been devel-oped to investigate, for instance, collisions between porous aggre-gates (Sirono, 2004). The advantages and deficiencies betweenthese codes and ours cannot be easily assessed, however the spe-cifics of our newly adapted version of pkdgrav is that it uses asophisticated tree-code to compute in parallel contact forces be-tween particles along with self-gravity. In addition, a set of fric-tional forces, including static, dynamic, twisting, and rollingfrictions has been introduced, all of which were not necessarilyimplemented or used in some of these mentioned codes.
In the following validation test of our numerical approach, wecompare low-speed, laboratory impact experiments on glass beadagglomerates against simulations using the same impact condi-tions on numerical models of those targets. The impact experi-ments were performed in Japan at the Kobe University, the mainresults of which have been published by Machii and Nakamura(2011). In Section 2 we briefly present the experiments and theoutcomes that we will consider in this paper for comparison withsimulations. Section 3 briefly describes the numerical code PKDGRAV
and its adaptation to address granular material physics and cohe-sion (see Schwartz et al. (2012) for details). Comparison betweenexperiments and simulations are then presented in Section 4. Con-clusions and perspectives are provided in Section 5.
2. Impact experiments
Machii and Nakamura (2011) performed their impact experi-ments on sintered glass bead agglomerates using a gas gun in KobeUniversity in Japan. Impact speeds ranged between 40 and 280 m/sand the sintered agglomerates used as targets contained �40%porosity. Two kinds of targets were manufactured to differ in theirbulk strength; the difference between the groups comes from thesintering times in the oven (8 h and 20 h). The size ratio of thebeads to each target was 0.19, with the average bead size measur-ing �5 mm in diameter. The experiments showed that the energydensity required to catastrophically break the agglomerate is muchless than that required for previously investigated sintered glassbead targets with the same porosity (e.g., Setoh et al., 2010). How-ever, the sizes of the beads that comprised those targets and thesize ratio of the beads to the targets were both 100 times smallerthan the agglomerates used by Machii and Nakamura (2011). Theauthors suggest that this weaker strength is probably due to themuch smaller number of cohesive links (necks) that a stress wavemust travel through in this study, which minimizes the energy dis-sipation at the necks (this theory will be investigated and quanti-fied in a future numerical study). Also, the fact that the particlesare larger and less numerous enables them to move more freelyand thus to be broken more easily. Catastrophic disruption of anagglomerate was shown to occur when the projectile kinetic en-ergy was a few times the total energy needed to break all of thenecks of the agglomerate. The distribution of fragment size andnumber was shown to be extremely dependent upon the impactpoint of the target.
3. Numerical method
3.1. The N-body code PKDGRAV: hard- and soft-sphereimplementations
To model the targets and the impact experiment, we use the N-body code PKDGRAV, a parallel gravity code originally designed for
ρ0
ρ0
s
1
ρδ
z εz
particle
neighbor
effss
2
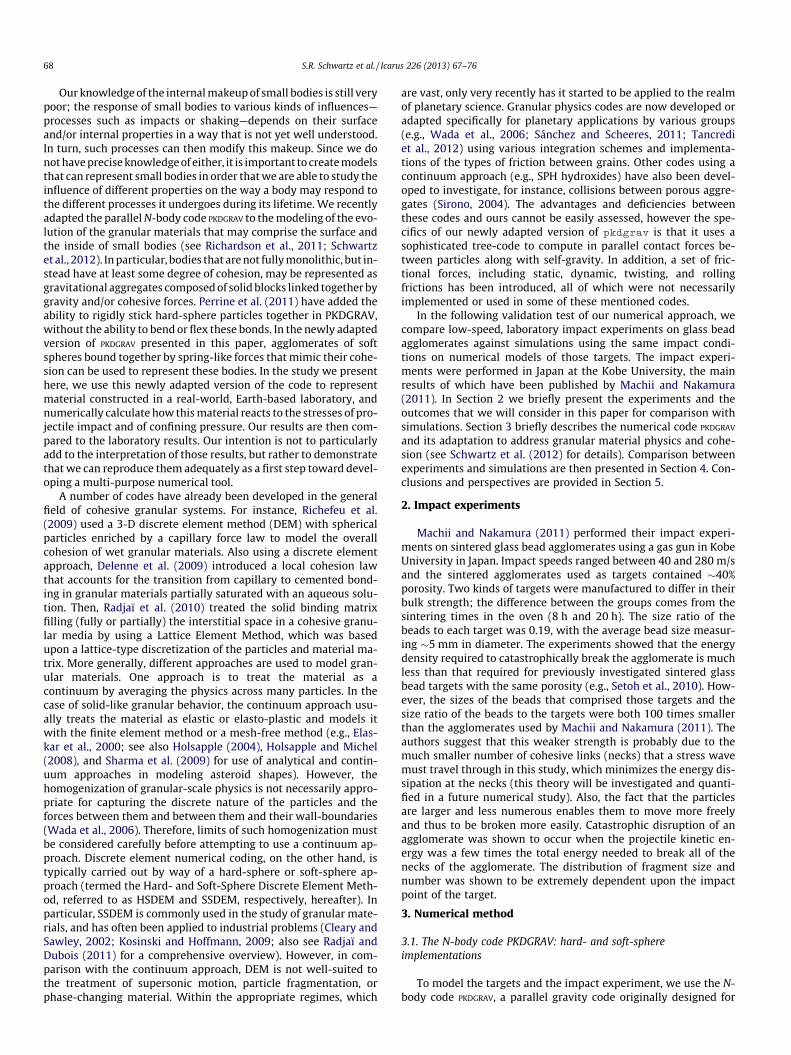
Fig. 1. A (spherical) particle in overlap with one of its neighbors. Both the particleand its neighbor feel an attractive force due to their cohesive bond and a repulsiveSSDEM force (gravity is not considered in this figure). The shaded circle gives therelative position of the neighbor such that d is zero, and thus these two forcescancel; therefore, the net force acting on the two particles is zero when q0 describesthe separation between their COMs, where d is the fractional deviation of q from q0.The dotted circle gives the relative position of the neighbor when the strain, �, iszero, and thus the cohesive ‘‘spring’’ that forms the bond between the particles is atrest, which occurs at a separation of z. Here q gives the ‘‘current’’ separationbetween the particle and its neighbor, the latter inscribed by a dashed circle; thus inthis case, they feel a net attractive force since q > q0, which means that the cohesiveforce exceeds the SSDEM repulsive force. Here s1 and s2 are the radii of the particleand its neighbor, respectively, and seff we take to be the effective radius betweenthem. When q = s1 + s2 = 2seff,� = �max.
S.R. Schwartz et al. / Icarus 226 (2013) 67–76 69
collisionless cosmology simulations (Stadel, 2001) and adapted forcollisional Solar System applications (Richardson et al., 2000,2009).
The original version of PKDGRAV only considered hard-sphere par-ticles (HSDEM). In HSDEM, collisions are analytically predicted andtreated as instantaneous, using coefficients of restitution to ac-count for normal and tangential energy dissipation. The inclusionof walls of various geometries (boundaries) provides for the possi-ble interaction of grains with experimental set-ups or small-bodysurfaces (see Richardson et al. (2011) for more details).
Recently, a Soft-Sphere Discrete Element Method was intro-duced in PKDGRAV (Schwartz et al., 2012), based initially on the workof Cundall and Strack (1979). In this case, collisions between spher-ical particles are not predicted in advance, and are not instanta-neous. Instead, collisions are simulated by allowing particles tooverlap with each other; to first order, this represents the slightsurface deformation that occurs during the contact between realparticles. When an overlap occurs, the various types of contactforces (e.g., static, dynamic, sliding, rolling frictions) are treated,and collisions are integrated through their full duration rather thananalytically predicted in advance of the collision. This is particu-larly important in dense granular regimes and/or when collisiondurations (stress wave propagation speeds) are non-negligible.The reader is referred to Schwartz et al. (2012) for more detailson the implementation of SSDEM in PKDGRAV and for a short reviewof other approaches to model these systems of granular materials.
3.2. Adding cohesion in PKDGRAV
In order to account for the potential presence of cohesion be-tween grains within a granular medium such as regolith on thesurfaces of solid celestial bodies, we have implemented a cohesiveforce into PKDGRAV. This added cohesive force acts between bondedparticles’ centers of mass (COMs) as a restoring force that opposesdistention of the bond. Here we call the particle and the neighborto which it is bound, particle 1 and particle 2, respectively.
A single bond is defined by an equilibrium separation z(�, t) (azero-strain-length) between the two particles’ COMs, and a maxi-mum strain �maxð _�Þ beyond which the bond has no effect, wherethe strain �(t) � [q/z] � 1. We define q � r2 � r1 as the relative po-sition between the particle and neighbor COMs, and so q � jqj isthe scalar distance between the COMs (thus, when q = z(�, t), thelength of the ‘‘spring’’ at rest, the strain, �, vanishes). These vari-ables are shown schematically as part of Fig. 1 (additional param-eters that appear in the figure are introduced later in this section).
While �ðtÞ < �maxð _�Þ, a particle feels a cohesive force dependentupon the current strain �(t), the current strain-rate_�ðtÞ � un=zð�; tÞ, and the effective area of interaction Aeff, whereu � v2 � v1 is the relative velocity between the particle and theneighbor to which it is bound, un is the normal component of thisrelative velocity.
We define the default behavior, which treats �maxð _�Þ as a con-stant ½�maxð _�Þ ! �max�, independent of the strain-rate, z as a con-stant independent of the effect of persistent strain [z(�, t) ? z],and the force on the particle due to its attached neighbor as a linearcombination of a strain (elastic) component and a strain-rate (plas-tic) component. We also require that cohesive bonds are to be bro-ken once � exceeds �max. We also take in default Aeff � ps2
eff , andseff � (s1 + s2)/2, the mean radius of the particle and its neighbor.If we consider particles as effectively representing a continuumdeformable agglomerate, this is an appropriate choice for the effec-tive area of interaction, Aeff, especially for spheres of similar size.Although not the only option, this choice can also be justified forthe area of interaction in the case of this study, when the spheresare treated as discrete particles and not a continuum (seeSection 3.3).
In this default configuration, from the time at which the bond isformed, up until the time at which � exceeds �max, the force on aparticle due to its cohesive bond (it may have multiple bonds),assuming implicit dependencies on t of the strain and the strain-rate, is given as
F1;coh ¼ Y�Aeff n̂þ cz _�; ð1Þ
where n̂ � q=jqj is a unit vector that gives the direction from theparticle’s center to the neighbor’s center, Y is an elastic Young’smodulus, and c is a viscous damping term with the value for criticaldamping given as ccrit �
ffiffiffiffiffiffiffiffiffiffiffiffiffiffiffiffiffiffiffiffiffi4lYAeff=z
p, with l being the reduced mass
of the two-particle system. Repulsive forces related to the cohesivebonds (for � < 0) can be switched on or off; we leave it off by default(this is not to be confused with the normal component of theSSDEM force, which always active). Newton’s Third Law gives theforce felt by the neighbor due to the cohesion with the particle as
F2;coh ¼ �Y�Aeff n̂� cz _�: ð2Þ
This treatment is equivalent to a Hooke’s force law for springs witha speed-dependent damping term. Using the default implementa-tion, as we do in this study, gives four parameters that define acohesive bond: z, Y, �max, and c. Also supported however, are morecomplicated force dependencies such as van der Waals force laws, astrain- and time-dependent zero-strain-length (creep), and cohe-sive strain limits that are dependent on strain rates. Although forthe sake of this study, and for both simplicity and computationalefficiency, we deliberately only approximate the actual cohesionphysics using a simple model that nonetheless appears to capturethe important experimental outcomes for our application.
In order to allow for more realistic (non-idealized) behavior ofcohesive agglomerates, each cohesive element (particle–particlebond) has its own values for z, Y, and �max, where the distributionof strength (Y) and maximum strain (�max) are typically fit by a
70 S.R. Schwartz et al. / Icarus 226 (2013) 67–76
gaussian distribution around specified mean values (hYi andh�maxi).
Note also that these cohesive forces are central forces, and thusenergy and momentum are conserved (although c > 0 saps energyfrom the system). Forces are only applied along the line that con-nects the two particles’ centers, thus there is no coupling withangular or tangential degrees of freedom.
3.3. SSDEM and cohesion
When the separation between the COMs of two bound particlesis both greater than the sum of their radii, i.e., q > s1 + s2, and great-er than z (with 0 < � < �max), they feel a restoring force along theline that connects their two centers. However, in order to accountfor the existence of a physical neck that joins two sintered particlestogether (even if the atomic diffusion involved in the formation ofthe neck is not modeled explicitly), we must also consider couplingof translational and rotational degrees of freedom. This couplingwould need also apply to the case of particles that feel mutualattraction through surface-surface interactions by way of van derWaals forces. However, this study does not model this type ofcohesion, which requires a different prescription than the one usedhere. We describe in the following our strategy to couple transla-tional and rotational degrees of freedom involving particles boundtogether with a physical neck that exists between them.
3.3.1. Building cohesive agglomeratesSetting z < 2seff implies that cohesive equilibrium occurs while
particles are penetrating each others’ surfaces. If we imagine a set-up of two mutually bound particles in isolation with zero-strain-length less than the sum of their radii, in HSDEM this amounts tothe two particles pushing up against each other with some com-pressive force, but without ever penetrating (inter-particle pene-tration is not allowed in HSDEM). In SSDEM, this results in theparticles penetrating each other with SSDEM repulsive forces com-ing into balance with cohesive forces and any force that may existbetween the particles (e.g., gravity). In such a case, the particles’translational and rotational degrees of freedom are coupled. Fur-thermore, it means that particles are subject to the full robusttreatment of SSDEM contact forces (Schwartz et al., 2012) togetherwith cohesion. Including both elastic and plastic components, thenet normal force on a particle as a result of its interaction withits neighbor, due to both cohesion and the SSDEM normal forceis given as
F1 ¼ Y�Aeff n̂þ cz _�� knxn̂þ Cnun; ð3Þ
where kn is the SSDEM normal elastic coefficient given in units ofkg/s2, Cn is the SSDEM normal plastic coefficient given in kg/s (therealso exist tangential analogues, kt and Ct, respectively), and x is theamount of interparticle penetration as defined in Schwartz et al.(2012).
A number of studies have developed methodologies to allow forthe representation of non-spherical shapes using ensembles ofspherical particles (e.g., Gotteland et al., 2009; Azéma et al.,2012). Our approach also allows us to build up arbitrarily shapedobjects consisting of spheres in various states of overlap with eachother. The spheres need not be of uniform size or mass, and canhave differing strength parameters, which provides us the freedomto simulate complex combinations of cohesive agglomerates withexplicitly defined internal strength distributions. In this study,we use this approach to simulate individual particles bound to-gether. Similarly, we have the ability to use a nearly identical ap-proach for the simulation of a continuum solid, with each‘‘particle’’ effectively acting as a tracer representing a section ofthe material.
In order to create the models for an object comprised of individ-ual particles bound together, we must define, along with theSSDEM parameters, the COM position, the mass, and the radiusfor each particle of which it is comprised. Next, to account forcohesion within the object, we use pkdgrav’s tree code and per-form, for each particle, a search for other particles with which itis in overlap. For each of these overlaps, we assign a uniqueYoung’s modulus Y based upon our specification, and then solvefor z such that the cohesive restoring force in Eq. (2) just cancelsthe SSDEM repulsive force when the object is at rest and in a stateof internal equilibrium. We define q0 for a pair of overlapping par-ticles to be the separation between their centers when the netforce between them is zero for the simulation at equilibrium atthe start of the simulation (this is not to be confused with z, theseparation between their centers when the cohesive force iszero—typically q0 will be greater than z). The overlap value,x = s1 + s2 � q0, gives:
z ¼ q0YAeff
knðs1 þ s2 � q0Þ þ YAeff: ð4Þ
Combining Eqs. (3) and (4), and defining d � [q/q0] � 1, for anunbroken bond where z 6 q 6 2seff, the force felt by a particle dueto its interaction with its neighbor (ignoring gravity) reduces to:
F1 ¼ d½2knseff þ YAeff �n̂þ ðcþ CnÞun: ð5Þ
The fixed point at q = q0 (when d = 0) can be seen in Eq. (5); whenq > q0, the elastic force on the particle pushes it toward its neigh-bor, and when q < q0, the elastic force on the particle pushes it awayfrom its neighbor, showing that the fixed point is stable (the dia-gram in Fig. 1 describes these lengths and dimensionless variables).Each particle that comprises these simulated cohesive objectsexhibits this stable equilibrium with each of its neighbors (see Vi-deo 1). By default we set �max ¼ 2seff
z � 1, breaking the bond betweena pair of particles when they physically separate; this sets the ten-sile strength. The shear strength of the bond we set to be the staticfrictional force limit, such that the bond breaks when the tangentialstress exceeds the product of the coefficient of static friction and thenormal force (see Schwartz et al. (2012) for an outline of our treat-ment of static friction in SSDEM).
In this study, we use the default definition of Aeff as the meancross-section of particles in contact. In reality, the contact area be-tween sintered particles is smaller than the mean particle cross-section, especially for weakly sintered particles. However, to avoidunnecessary complexity, we keep Aeff constant so that we are ableto control how the cohesion force depends on the strain, which inthis study is taken to be linear. In principle, we could use othermethods to set a constant Aeff, but as we will see in Section 4.1, thischoice allows us to be consistent with the experimentally mea-sured mean force that is required to break these bonds, which holdthe agglomerates together.
When a bond is broken between a particle and its neighbor dueto tangential stress, any future contacts between them are gov-erned by standard SSDEM without cohesion. When a bond is bro-ken due to shear stress, we must consider the consequence oflosing the cohesive force while particles are still in overlap. With-out special treatment, the SSDEM repulsive force would cause theparticles to accelerate away from each other, which is not realisticbehavior. Once their bond is broken, for the sake of future colli-sions, our approach is to allow particle pairs with broken bondsto see each other as spheres with contact radii equal to the distancefrom their respective centers to the contact point at the time oftangential failure of their bond. Under the assumption that colli-sions between formerly bound particles are likely to occur in sim-ilar orientations, this may be a fair approximation to make. For ourpurposes in this study, where re-colliding particles are not com-
S.R. Schwartz et al. / Icarus 226 (2013) 67–76 71
mon or important to the outcome, this approximation shouldsuffice.
4. Comparison between experiments and simulations
4.1. Numerical representation of the target
Our first task in this study is to use the above methodology tobuild a numerical representation of the target that is geometricallyand mechanically as close as possible to the one used in experi-ments. The sizes of the real glass beads are large enough, and theirshapes spherical enough, such that each bead can be representedby one spherical particle. The beads have been sintered, and thebonds between them measured. They are numerically modeledwith cohesive strengths that correspond to the experimentallymeasured bonds.
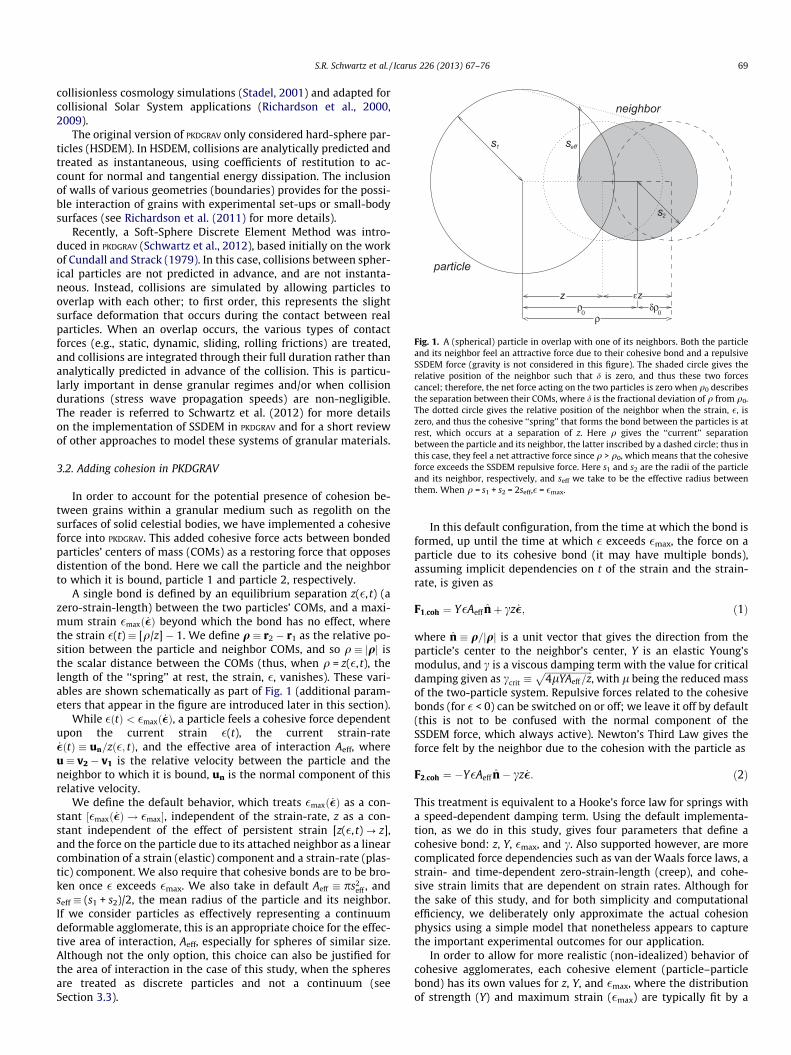
Each 90-bead target was arranged in three layers of 30 beads,with the top and bottom layers arranged in the same, particularpattern. To construct the target, we start with its bottom layer(see Fig. 2): we first distribute the 16 particles that comprise theoutside perimeter of this layer and then fill the inside with theremaining 14 particles. These 30 particles are placed on a horizon-tal plane, which is a boundary condition implemented in ournumerical code (see Richardson et al., 2011). Indeed, such a bound-ary condition is necessary to maintain the configuration of thoseparticles, when other ones will be distributed on top of them or in-
Fig. 2. Numerical construction of a modeled target. Top: first step in the modeling of theBottom: modeling of the second layer over the bottom one. The process is repeated in a sThe left panel shows a top view while the right panel shows a side view. (Particle colorininterpretation of the references to color in this figure legend, the reader is referred to th
side them. Then, we distribute 16 particles on the outside perime-ter of a second layer over the bottom one. We then attach elastic‘‘springs’’ to all these 46 particles and then drop 14 particles insideto finish the second layer. Then, we model another horizontal planeslowly moving down onto those layers, in order to push particlesinto place. Once done, we remove this plane and add a third layerof 30 particles on the top of the two bottom layers in a similar wayas previous layers. We numerically compute the motion of thosethree layers composed of 90 particles in total under uniform grav-ity to make them settle. Then we stop the simulations and makeparticles overlap with their neighbors by decreasing the distancebetween the centers of the particles by 10%, which means thatthe values for q0 vary between bonds, but are typically 1.8seff, orjust under 4.5 mm.
The last step is to add cohesion to simulate the sintered parti-cles. Each bond is characterized by a Young’s modulus and a stresslimit (equivalent to a tensile strength). The cohesive force betweenthe glass beads of real targets is not perfectly identical for allbonds. In fact, quite a large variation exists between the strengthsof the experimental bonds (see Fig. 4 in Machii and Nakamura(2011)). Given that some bonds in the real agglomerate are rela-tively quite weak and some relatively strong, it is important to rep-resent this in our numerical model as it has a significant effect onhow the sintered agglomerate breaks apart. Since there is no obvi-ous way to determine the actual distribution of the bond strengthsfrom the real target, in the modeled target, we arbitrarily distribute
bottom particle layer placed on a horizontal plane. Middle: completed bottom layer.imilar way for the rest of the target (see Fig. 3 for an image of the complete target).g/shading is used to distinguish the different phases in the fabrication process.) (Fore web version of this article.)
72 S.R. Schwartz et al. / Icarus 226 (2013) 67–76
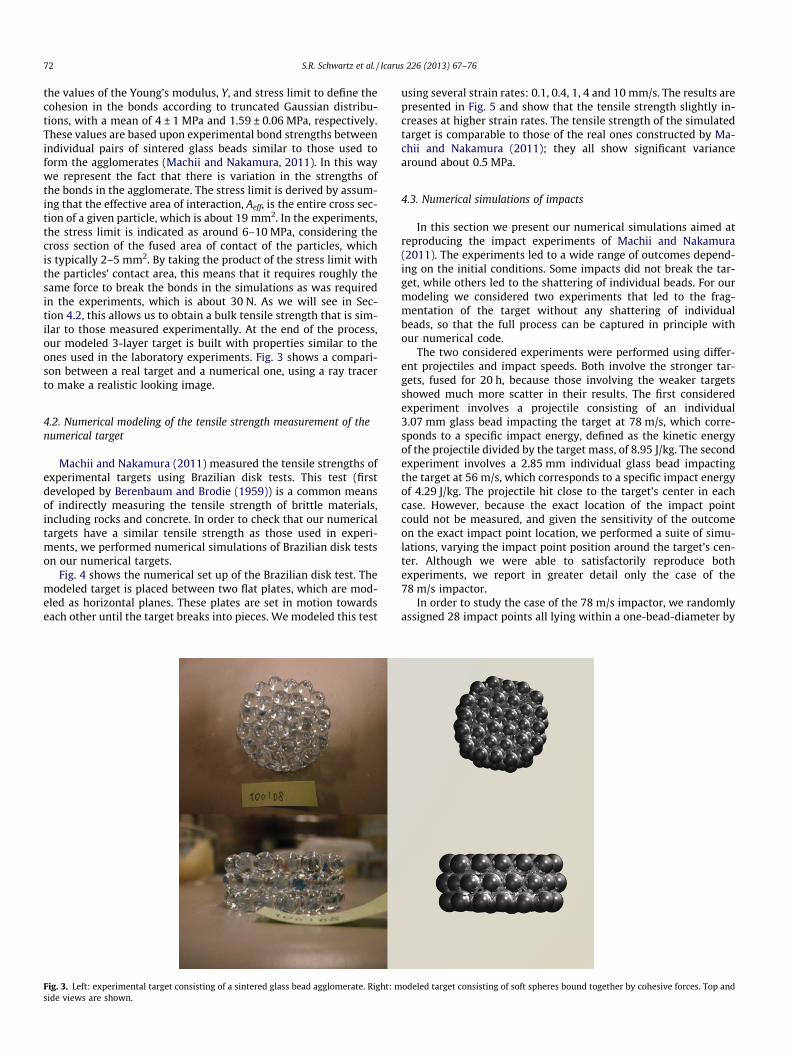
the values of the Young’s modulus, Y, and stress limit to define thecohesion in the bonds according to truncated Gaussian distribu-tions, with a mean of 4 ± 1 MPa and 1.59 ± 0.06 MPa, respectively.These values are based upon experimental bond strengths betweenindividual pairs of sintered glass beads similar to those used toform the agglomerates (Machii and Nakamura, 2011). In this waywe represent the fact that there is variation in the strengths ofthe bonds in the agglomerate. The stress limit is derived by assum-ing that the effective area of interaction, Aeff, is the entire cross sec-tion of a given particle, which is about 19 mm2. In the experiments,the stress limit is indicated as around 6–10 MPa, considering thecross section of the fused area of contact of the particles, whichis typically 2–5 mm2. By taking the product of the stress limit withthe particles’ contact area, this means that it requires roughly thesame force to break the bonds in the simulations as was requiredin the experiments, which is about 30 N. As we will see in Sec-tion 4.2, this allows us to obtain a bulk tensile strength that is sim-ilar to those measured experimentally. At the end of the process,our modeled 3-layer target is built with properties similar to theones used in the laboratory experiments. Fig. 3 shows a compari-son between a real target and a numerical one, using a ray tracerto make a realistic looking image.
4.2. Numerical modeling of the tensile strength measurement of thenumerical target
Machii and Nakamura (2011) measured the tensile strengths ofexperimental targets using Brazilian disk tests. This test (firstdeveloped by Berenbaum and Brodie (1959)) is a common meansof indirectly measuring the tensile strength of brittle materials,including rocks and concrete. In order to check that our numericaltargets have a similar tensile strength as those used in experi-ments, we performed numerical simulations of Brazilian disk testson our numerical targets.
Fig. 4 shows the numerical set up of the Brazilian disk test. Themodeled target is placed between two flat plates, which are mod-eled as horizontal planes. These plates are set in motion towardseach other until the target breaks into pieces. We modeled this test
Fig. 3. Left: experimental target consisting of a sintered glass bead agglomerate. Right: mside views are shown.
using several strain rates: 0.1, 0.4, 1, 4 and 10 mm/s. The results arepresented in Fig. 5 and show that the tensile strength slightly in-creases at higher strain rates. The tensile strength of the simulatedtarget is comparable to those of the real ones constructed by Ma-chii and Nakamura (2011); they all show significant variancearound about 0.5 MPa.
4.3. Numerical simulations of impacts
In this section we present our numerical simulations aimed atreproducing the impact experiments of Machii and Nakamura(2011). The experiments led to a wide range of outcomes depend-ing on the initial conditions. Some impacts did not break the tar-get, while others led to the shattering of individual beads. For ourmodeling we considered two experiments that led to the frag-mentation of the target without any shattering of individualbeads, so that the full process can be captured in principle withour numerical code.
The two considered experiments were performed using differ-ent projectiles and impact speeds. Both involve the stronger tar-gets, fused for 20 h, because those involving the weaker targetsshowed much more scatter in their results. The first consideredexperiment involves a projectile consisting of an individual3.07 mm glass bead impacting the target at 78 m/s, which corre-sponds to a specific impact energy, defined as the kinetic energyof the projectile divided by the target mass, of 8.95 J/kg. The secondexperiment involves a 2.85 mm individual glass bead impactingthe target at 56 m/s, which corresponds to a specific impact energyof 4.29 J/kg. The projectile hit close to the target’s center in eachcase. However, because the exact location of the impact pointcould not be measured, and given the sensitivity of the outcomeon the exact impact point location, we performed a suite of simu-lations, varying the impact point position around the target’s cen-ter. Although we were able to satisfactorily reproduce bothexperiments, we report in greater detail only the case of the78 m/s impactor.
In order to study the case of the 78 m/s impactor, we randomlyassigned 28 impact points all lying within a one-bead-diameter by
odeled target consisting of soft spheres bound together by cohesive forces. Top and
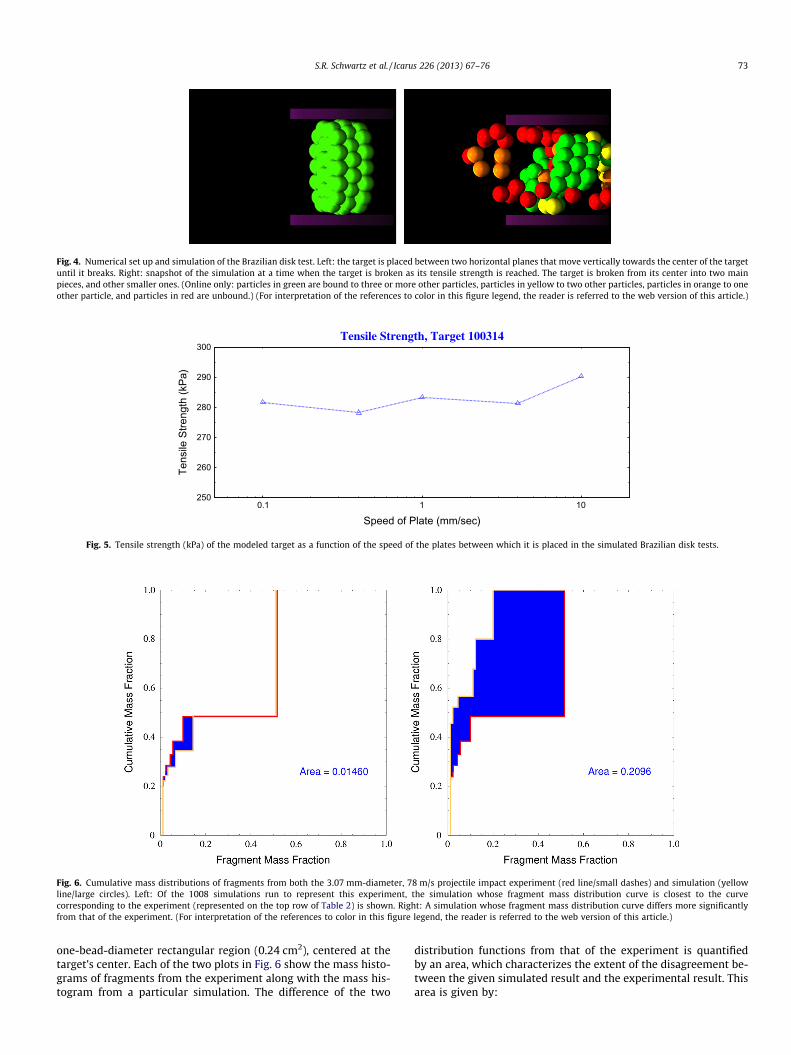
Fig. 4. Numerical set up and simulation of the Brazilian disk test. Left: the target is placed between two horizontal planes that move vertically towards the center of the targetuntil it breaks. Right: snapshot of the simulation at a time when the target is broken as its tensile strength is reached. The target is broken from its center into two mainpieces, and other smaller ones. (Online only: particles in green are bound to three or more other particles, particles in yellow to two other particles, particles in orange to oneother particle, and particles in red are unbound.) (For interpretation of the references to color in this figure legend, the reader is referred to the web version of this article.)
250
260
270
280
290
300
0.1 1 10
Tens
ile S
treng
th (k
Pa)
Speed of Plate (mm/sec)
Tensile Strength, Target 100314
Fig. 5. Tensile strength (kPa) of the modeled target as a function of the speed of the plates between which it is placed in the simulated Brazilian disk tests.
Fig. 6. Cumulative mass distributions of fragments from both the 3.07 mm-diameter, 78 m/s projectile impact experiment (red line/small dashes) and simulation (yellowline/large circles). Left: Of the 1008 simulations run to represent this experiment, the simulation whose fragment mass distribution curve is closest to the curvecorresponding to the experiment (represented on the top row of Table 2) is shown. Right: A simulation whose fragment mass distribution curve differs more significantlyfrom that of the experiment. (For interpretation of the references to color in this figure legend, the reader is referred to the web version of this article.)
S.R. Schwartz et al. / Icarus 226 (2013) 67–76 73
one-bead-diameter rectangular region (0.24 cm2), centered at thetarget’s center. Each of the two plots in Fig. 6 show the mass histo-grams of fragments from the experiment along with the mass his-togram from a particular simulation. The difference of the two
distribution functions from that of the experiment is quantifiedby an area, which characterizes the extent of the disagreement be-tween the given simulated result and the experimental result. Thisarea is given by:
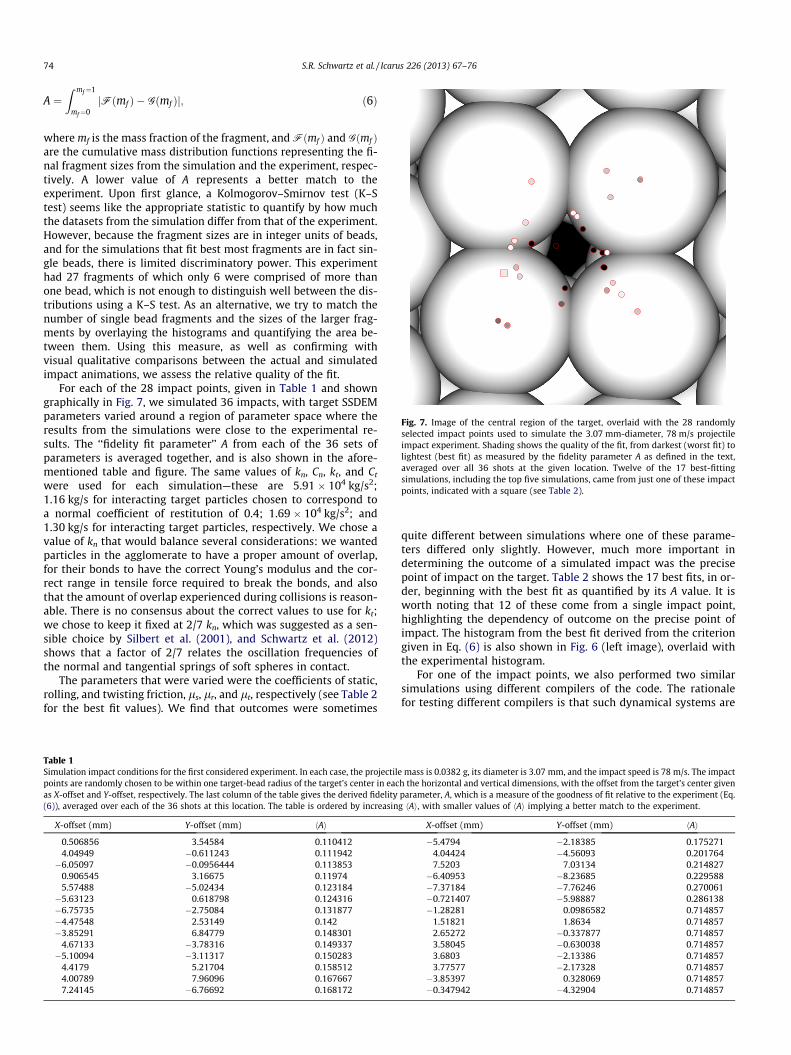
Fig. 7. Image of the central region of the target, overlaid with the 28 randomlyselected impact points used to simulate the 3.07 mm-diameter, 78 m/s projectileimpact experiment. Shading shows the quality of the fit, from darkest (worst fit) tolightest (best fit) as measured by the fidelity parameter A as defined in the text,averaged over all 36 shots at the given location. Twelve of the 17 best-fittingsimulations, including the top five simulations, came from just one of these impactpoints, indicated with a square (see Table 2).
74 S.R. Schwartz et al. / Icarus 226 (2013) 67–76
A ¼Z mf¼1
mf¼0jFðmf Þ � Gðmf Þj; ð6Þ
where mf is the mass fraction of the fragment, and Fðmf Þ and Gðmf Þare the cumulative mass distribution functions representing the fi-nal fragment sizes from the simulation and the experiment, respec-tively. A lower value of A represents a better match to theexperiment. Upon first glance, a Kolmogorov–Smirnov test (K–Stest) seems like the appropriate statistic to quantify by how muchthe datasets from the simulation differ from that of the experiment.However, because the fragment sizes are in integer units of beads,and for the simulations that fit best most fragments are in fact sin-gle beads, there is limited discriminatory power. This experimenthad 27 fragments of which only 6 were comprised of more thanone bead, which is not enough to distinguish well between the dis-tributions using a K–S test. As an alternative, we try to match thenumber of single bead fragments and the sizes of the larger frag-ments by overlaying the histograms and quantifying the area be-tween them. Using this measure, as well as confirming withvisual qualitative comparisons between the actual and simulatedimpact animations, we assess the relative quality of the fit.
For each of the 28 impact points, given in Table 1 and showngraphically in Fig. 7, we simulated 36 impacts, with target SSDEMparameters varied around a region of parameter space where theresults from the simulations were close to the experimental re-sults. The ‘‘fidelity fit parameter’’ A from each of the 36 sets ofparameters is averaged together, and is also shown in the afore-mentioned table and figure. The same values of kn, Cn, kt, and Ct
were used for each simulation—these are 5.91 � 104 kg/s2;1.16 kg/s for interacting target particles chosen to correspond toa normal coefficient of restitution of 0.4; 1.69 � 104 kg/s2; and1.30 kg/s for interacting target particles, respectively. We chose avalue of kn that would balance several considerations: we wantedparticles in the agglomerate to have a proper amount of overlap,for their bonds to have the correct Young’s modulus and the cor-rect range in tensile force required to break the bonds, and alsothat the amount of overlap experienced during collisions is reason-able. There is no consensus about the correct values to use for kt;we chose to keep it fixed at 2/7 kn, which was suggested as a sen-sible choice by Silbert et al. (2001), and Schwartz et al. (2012)shows that a factor of 2/7 relates the oscillation frequencies ofthe normal and tangential springs of soft spheres in contact.
The parameters that were varied were the coefficients of static,rolling, and twisting friction, ls, lr, and lt, respectively (see Table 2for the best fit values). We find that outcomes were sometimes
Table 1Simulation impact conditions for the first considered experiment. In each case, the projectilepoints are randomly chosen to be within one target-bead radius of the target’s center in eacas X-offset and Y-offset, respectively. The last column of the table gives the derived fidelity(6)), averaged over each of the 36 shots at this location. The table is ordered by increasin
X-offset (mm) Y-offset (mm) hAi
0.506856 3.54584 0.1104124.04949 �0.611243 0.111942�6.05097 �0.0956444 0.113853
0.906545 3.16675 0.119745.57488 �5.02434 0.123184�5.63123 0.618798 0.124316�6.75735 �2.75084 0.131877�4.47548 2.53149 0.142�3.85291 6.84779 0.148301
4.67133 �3.78316 0.149337�5.10094 �3.11317 0.150283
4.4179 5.21704 0.1585124.00789 7.96096 0.1676677.24145 �6.76692 0.168172
quite different between simulations where one of these parame-ters differed only slightly. However, much more important indetermining the outcome of a simulated impact was the precisepoint of impact on the target. Table 2 shows the 17 best fits, in or-der, beginning with the best fit as quantified by its A value. It isworth noting that 12 of these come from a single impact point,highlighting the dependency of outcome on the precise point ofimpact. The histogram from the best fit derived from the criteriongiven in Eq. (6) is also shown in Fig. 6 (left image), overlaid withthe experimental histogram.
For one of the impact points, we also performed two similarsimulations using different compilers of the code. The rationalefor testing different compilers is that such dynamical systems are
mass is 0.0382 g, its diameter is 3.07 mm, and the impact speed is 78 m/s. The impacth the horizontal and vertical dimensions, with the offset from the target’s center givenparameter, A, which is a measure of the goodness of fit relative to the experiment (Eq.g hAi, with smaller values of hAi implying a better match to the experiment.
X-offset (mm) Y-offset (mm) hAi
�5.4794 �2.18385 0.1752714.04424 �4.56093 0.2017647.5203 7.03134 0.214827�6.40953 �8.23685 0.229588�7.37184 �7.76246 0.270061�0.721407 �5.98887 0.286138�1.28281 0.0986582 0.714857
1.51821 1.8634 0.7148572.65272 �0.337877 0.7148573.58045 �0.630038 0.7148573.6803 �2.13386 0.7148573.77577 �2.17328 0.714857�3.85397 0.328069 0.714857�0.347942 �4.32904 0.714857
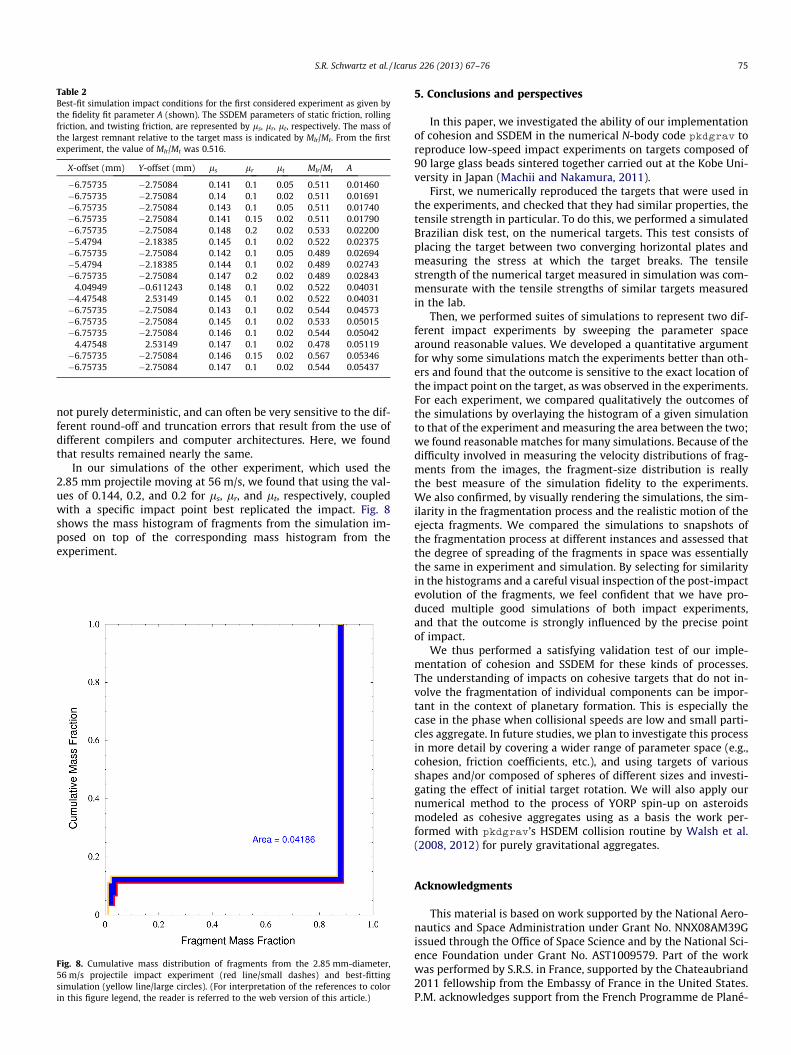
Table 2Best-fit simulation impact conditions for the first considered experiment as given bythe fidelity fit parameter A (shown). The SSDEM parameters of static friction, rollingfriction, and twisting friction, are represented by ls, lr, lt, respectively. The mass ofthe largest remnant relative to the target mass is indicated by Mlr/Mt. From the firstexperiment, the value of Mlr/Mt was 0.516.
X-offset (mm) Y-offset (mm) ls lr lt Mlr/Mt A
�6.75735 �2.75084 0.141 0.1 0.05 0.511 0.01460�6.75735 �2.75084 0.14 0.1 0.02 0.511 0.01691�6.75735 �2.75084 0.143 0.1 0.05 0.511 0.01740�6.75735 �2.75084 0.141 0.15 0.02 0.511 0.01790�6.75735 �2.75084 0.148 0.2 0.02 0.533 0.02200�5.4794 �2.18385 0.145 0.1 0.02 0.522 0.02375�6.75735 �2.75084 0.142 0.1 0.05 0.489 0.02694�5.4794 �2.18385 0.144 0.1 0.02 0.489 0.02743�6.75735 �2.75084 0.147 0.2 0.02 0.489 0.02843
4.04949 �0.611243 0.148 0.1 0.02 0.522 0.04031�4.47548 2.53149 0.145 0.1 0.02 0.522 0.04031�6.75735 �2.75084 0.143 0.1 0.02 0.544 0.04573�6.75735 �2.75084 0.145 0.1 0.02 0.533 0.05015�6.75735 �2.75084 0.146 0.1 0.02 0.544 0.05042
4.47548 2.53149 0.147 0.1 0.02 0.478 0.05119�6.75735 �2.75084 0.146 0.15 0.02 0.567 0.05346�6.75735 �2.75084 0.147 0.1 0.02 0.544 0.05437
S.R. Schwartz et al. / Icarus 226 (2013) 67–76 75
not purely deterministic, and can often be very sensitive to the dif-ferent round-off and truncation errors that result from the use ofdifferent compilers and computer architectures. Here, we foundthat results remained nearly the same.
In our simulations of the other experiment, which used the2.85 mm projectile moving at 56 m/s, we found that using the val-ues of 0.144, 0.2, and 0.2 for ls, lr, and lt, respectively, coupledwith a specific impact point best replicated the impact. Fig. 8shows the mass histogram of fragments from the simulation im-posed on top of the corresponding mass histogram from theexperiment.
Fig. 8. Cumulative mass distribution of fragments from the 2.85 mm-diameter,56 m/s projectile impact experiment (red line/small dashes) and best-fittingsimulation (yellow line/large circles). (For interpretation of the references to colorin this figure legend, the reader is referred to the web version of this article.)
5. Conclusions and perspectives
In this paper, we investigated the ability of our implementationof cohesion and SSDEM in the numerical N-body code pkdgrav toreproduce low-speed impact experiments on targets composed of90 large glass beads sintered together carried out at the Kobe Uni-versity in Japan (Machii and Nakamura, 2011).
First, we numerically reproduced the targets that were used inthe experiments, and checked that they had similar properties, thetensile strength in particular. To do this, we performed a simulatedBrazilian disk test, on the numerical targets. This test consists ofplacing the target between two converging horizontal plates andmeasuring the stress at which the target breaks. The tensilestrength of the numerical target measured in simulation was com-mensurate with the tensile strengths of similar targets measuredin the lab.
Then, we performed suites of simulations to represent two dif-ferent impact experiments by sweeping the parameter spacearound reasonable values. We developed a quantitative argumentfor why some simulations match the experiments better than oth-ers and found that the outcome is sensitive to the exact location ofthe impact point on the target, as was observed in the experiments.For each experiment, we compared qualitatively the outcomes ofthe simulations by overlaying the histogram of a given simulationto that of the experiment and measuring the area between the two;we found reasonable matches for many simulations. Because of thedifficulty involved in measuring the velocity distributions of frag-ments from the images, the fragment-size distribution is reallythe best measure of the simulation fidelity to the experiments.We also confirmed, by visually rendering the simulations, the sim-ilarity in the fragmentation process and the realistic motion of theejecta fragments. We compared the simulations to snapshots ofthe fragmentation process at different instances and assessed thatthe degree of spreading of the fragments in space was essentiallythe same in experiment and simulation. By selecting for similarityin the histograms and a careful visual inspection of the post-impactevolution of the fragments, we feel confident that we have pro-duced multiple good simulations of both impact experiments,and that the outcome is strongly influenced by the precise pointof impact.
We thus performed a satisfying validation test of our imple-mentation of cohesion and SSDEM for these kinds of processes.The understanding of impacts on cohesive targets that do not in-volve the fragmentation of individual components can be impor-tant in the context of planetary formation. This is especially thecase in the phase when collisional speeds are low and small parti-cles aggregate. In future studies, we plan to investigate this processin more detail by covering a wider range of parameter space (e.g.,cohesion, friction coefficients, etc.), and using targets of variousshapes and/or composed of spheres of different sizes and investi-gating the effect of initial target rotation. We will also apply ournumerical method to the process of YORP spin-up on asteroidsmodeled as cohesive aggregates using as a basis the work per-formed with pkdgrav’s HSDEM collision routine by Walsh et al.(2008, 2012) for purely gravitational aggregates.
Acknowledgments
This material is based on work supported by the National Aero-nautics and Space Administration under Grant No. NNX08AM39Gissued through the Office of Space Science and by the National Sci-ence Foundation under Grant No. AST1009579. Part of the workwas performed by S.R.S. in France, supported by the Chateaubriand2011 fellowship from the Embassy of France in the United States.P.M. acknowledges support from the French Programme de Plané-
76 S.R. Schwartz et al. / Icarus 226 (2013) 67–76
tologie. This study was performed as part of the International Teamcollaboration number 202 sponsored by the International SpaceScience Institute (ISSI) in Bern, Switzerland. Most simulations wereperformed on the yorp cluster administered by the Center for The-ory and Computation of the Department of Astronomy at the Uni-versity of Maryland in College Park.
Appendix A. Supplementary material
Supplementary data associated with this article can be found, inthe online version, at http://dx.doi.org/10.1016/j.icarus.2013.05.007.
References
Azéma, E., Estrada, N., Radjaï, F., 2012. Nonlinear effects of particle shape angularityin sheared granular media. Phys. Rev. E. 86, 041301-1–041301-15.
Benz, W., Asphaug, E., 1999. Catastrophic disruptions revisited. Icarus. 142, 5–20.Berenbaum, R., Brodie, I., 1959. Measurement of the tensile strength of brittle
materials. Br. J. Appl. Phys. 10 (6), 281–287.Cleary, P.W., Sawley, M.L., 2002. DEM modelling of industrial granular flows: 3D
case studies and the effect of particle shape on hopper discharge. Appl. Math.Model. 26, 89–111.
Consolmagno, G.J., Britt, D.T., Mackeb, R.J., 2008. The significance of meteoritedensity and porosity. Chemie der Erde – Geochemistry 68, 1.
Cundall, P.A., Strack, O.D.L., 1979. A discrete numerical model for granularassemblies. Geotechnique 29, 47–65.
Delenne, J.-Y., Soulié, F., El Youssoufi, M.S., Radjaï, F., 2009. A numerical model fortransition from liquid to solid bonding in cohesive granular media. AIP Conf.Proc. 1145, 893–896.
Elaskar, S.A., Godoy, L.A., Gray, D.D., Stiles, J.M., 2000. A viscoplastic approach tomodel the flow of granular solids. Int. J. Solids Struct. 37, 2185–2214.
Gotteland, P., Villard, P., Salot, C., 2009. Using nonconvex discrete elements topredict experimental behaviour of granular materials. AIP Conf. Proc. 1145,361–364.
Holsapple, K.A., 2004. Equilibrium figures of spinning bodies with self-gravity.Icarus 172, 272–303.
Holsapple, K.A., 2007. Spin limits of Solar System bodies: From the small fast-rotators to 2003 EL61. Icarus 187, 500–509.
Holsapple, K.A., Michel, P., 2008. Tidal disruptions. II. A continuum theory for solidbodies with strength, with applications to the Solar System. Icarus 193, 283–301.
Kosinski, P., Hoffmann, A.C., 2009. Extension of the hard-sphere particle–wallcollision model to account for particle deposition. Phys. Rev. E. 79, 061302-1–061302-11.
Machii, N., Nakamura, A.M., 2011. Experimental study on static and impact strengthof sintered agglomerates. Icarus 211, 885–893.
Perrine, R.P., Richardson, D.C., Scheeres, D.J., 2011. A numerical model of cohesion inplanetary rings. Icarus 212 (2), 719–735.
Radjaï, F., Dubois, F., 2011. Discrete-Element Modeling of Granular Materials. Wiley-Iste, Berlin, 425pp. ISBN 978-1-84821-260-2.
Radjaï, F. et al., 2010. Force transmission in cohesive granular media. AIP Conf. Proc.1227, 240–259.
Richardson, D.C., Quinn, T., Stadel, J., Lake, G., 2000. Direct large-scale N-bodysimulations of planetesimal dynamics. Icarus 143, 45–59.
Richardson, D.C., Michel, P., Walsh, K.J., Flynn, K.W., 2009. Numerical simulations ofasteroids modeled as gravitational aggregates. Planet. Space Sci. 57, 183–192.
Richardson, D.C., Walsh, K.J., Murdoch, N., Michel, P., 2011. Numerical simulationsof granular dynamics: I. Hard-sphere discrete element method and tests. Icarus212, 427–437.
Richefeu, V., Radjaï, F., El Youssoufi, M.S., 2009. Shear strength and stressdistribution in wet granular media. AIP Conf. Proc. 1145, 919–922.
Sánchez, P., Scheeres, D.J., 2011. Simulating asteroid rubble piles with a self-gravitating soft-sphere distinct element method model. Astrophys. J. 727 (120),14 pp.
Schwartz, S.R., Richardson, D.C., Michel, P., 2012. An implementation of the soft-sphere discrete element method in a high-performance parallel gravity tree-code. Granul. Matter 14, 363–380.
Setoh, M., Nakamura, A.M., Michel, P., Hiraoka, K., Yamashita, Y., Hasegawa, S.,Onose, N., Okudaira, K., 2010. High- and low-velocity impact experiments onporous sintered glass bead targets of different compressive strengths: Outcomesensitivity and scaling. Icarus 205, 702–711.
Sharma, I., Jenkins, J.T., Burns, J.A., 2009. Dynamical passage to approximateequilibrium shapes for spinning, gravitating rubble asteroids. Icarus 200, 304–322.
Silbert, L.E., Ertas, D., Grest, G.S., Halsey, T.C., Levine, D., Plimpton, S.J., 2001.Granular flow down an inclined plane: Bagnold scaling and rheology. Phys. Rev.E. 64, 051302-1–051302-14.
Sirono, S., 2004. Conditions for collisional growth of a grain aggregate. Icarus 167,431–452.
Stadel, J., 2001. Cosmological N-Body Simulations and Their Analysis. Thesis,University of Washington, Seattle. 126pp.
Tancredi, G., Maciel, A., Heredia, L., Richeri, P., Nesmachnow, S., 2012. Granularphysics in low-gravity environments using discrete element method. Mon. Not.R. Astron. Soc. 420, 3368–3380.
Wada, K., Senshu, H., Matsui, T., 2006. Numerical simulation of impact cratering ongranular material. Icarus 180, 528–545.
Walsh, K.J., Richardson, D.C., Michel, P., 2008. Rotational breakup as the origin ofsmall binary asteroids. Nature 454, 188–191.
Walsh, K.J., Richardson, D.C., Michel, P., 2012. Spin-up of rubble-pile asteroids:Disruption, satellite formation, and equilibrium shapes. Icarus 220, 514–529.
Yeomans, D.K. et al., 1997. Estimating the mass of Asteroid 253 Mathilde fromtracking data during the NEAR flyby. Science 278, 2106–2109.

![Welcome []Title Technology Disruptions Author Oracle Corporation Subject Technology Disruptions Keywords Technolgy Disruptions, Mobile Internet Access, Public Cloud, Consumer Technology,](https://img.pdfslide.net/doc/110x75/5f6684cb020da61543073133/welcome-title-technology-disruptions-author-oracle-corporation-subject-technology.jpg)