Embed Size (px)
Citation preview

Revision 4 - December 2014
USNRC STANDARD REVIEW PLAN
This Standard Review Plan (SRP,) NUREG-0800, has been prepared to establish criteria that the U.S. Nuclear Regulatory Commission (NRC) staff responsible for the review of applications to construct and operate nuclear power plants intends to use in evaluating whether an applicant/licensee meets the NRC regulations. The SRP is not a substitute for the NRC regulations, and compliance with it is not required. However, an applicant is required to identify differences between the design features, analytical techniques, and procedural measures proposed for its facility and the SRP acceptance criteria and evaluate how the proposed alternatives to the SRP acceptance criteria provide an acceptable method of complying with the NRC regulations. The SRP sections are numbered in accordance with corresponding sections in Regulatory Guide (RG) 1.70, “Standard Format and Content of Safety Analysis Reports for Nuclear Power Plants (LWR Edition).” Not all sections of RG 1.70 have a corresponding review plan section. The SRP sections applicable to a combined license application for a new light-water reactor (LWR) are based on RG 1.206, “Combined License Applications for Nuclear Power Plants (LWR Edition).” These documents are made available to the public as part of the NRC policy to inform the nuclear industry and the general public of regulatory procedures and policies. Individual sections of NUREG-0800 will be revised periodically, as appropriate, to accommodate comments and to reflect new information and experience. Comments may be submitted electronically by email to [email protected]. Requests for single copies of SRP sections (which may be reproduced) should be made to the U.S. Nuclear Regulatory Commission, Washington, DC 20555, Attention: Reproduction and Distribution Services Section, by fax to (301) 415-2289 or by email to [email protected]. Electronic copies of this section are available through the NRC's public Web site at http://www.nrc.gov/reading-rm/doc-collections/nuregs/staff/sr0800/ , or in the NRC Agencywide Documents Access and Management System (ADAMS), at http://www.nrc.gov/reading-rm/adams.html, under ADAMS Accession No. ML14198A460.
NUREG-0800
U.S. NUCLEAR REGULATORY COMMISSION
STANDARD REVIEW PLAN
3.7.1 SEISMIC DESIGN PARAMETERS REVIEW RESPONSIBILITIES Primary - Organization responsible for seismic and structural analysis reviews Secondary - Organization responsible for review of seismic ground motion development I. AREAS OF REVIEW The specific areas of review are as follows: 1. Design Ground Motion. For the seismic design of nuclear power plants, it is customary
to specify earthquake design ground motions that are exerted on the plant structures and used in soil-structure interaction (SSI) analyses. The design ground motion, also known as the seismic input motion or control motion, is based on the seismicity and geologic conditions at the site and expressed in such a manner that it can be applied to the dynamic analysis of structures, systems, and components (SSCs).
Two levels of design ground motions are considered: 1) operating basis earthquake (OBE) and 2) safe shutdown earthquake (SSE). The three spatial components of the

3.7.1-2 Revision 4 – December 2014
design ground motions (two horizontal and one vertical) are reviewed. The design ground motions for the OBE and SSE should be consistent with the description of the free-field ground motions at the site provided in NUREG-0800, Standard Review Plan (SRP) Section 2.5.2, “Vibratory Ground Motion,” which includes the variation in and distribution of ground motions in the free field, sources and directions of the motion, propagation and transmission of seismic waves, and other site response characteristics. The seismic free-field ground motions can be developed based on Regulatory Guides (RGs) 1.60, “Design Response Spectra for Seismic Design of Nuclear Power Plants,” or RG 1.208, “A Performance-Based Approach to Define the Site-Specific Earthquake Ground Motion,” and are reviewed under SRP Section 2.5.2. These RGs provide procedures that are acceptable to the staff for defining the design response spectra in the free-field for use in developing the OBE and SSE design ground motion needed for the design of nuclear power plant SSCs. A. Design Response Spectra. For a standard plant design, the design response
spectra can be developed based on smooth-shaped broadband spectra consistent with the site conditions postulated for the standard design. For a non-standard plant (e.g., combined license (COL) application referencing only an early site permit (ESP), a COL application not referencing a design certification (DC) and ESP, a construction permit (CP) application, or an operating license (OL) application), the design response spectra are typically developed from the site-specific ground motion response spectra (GMRS).
The GMRS reviewed under SRP Section 2.5.2 are site-specific horizontal and vertical free-field GMRS determined at the ground surface or at the free-field outcrop of the uppermost in-situ competent material using performance-based procedures in accordance with RG 1.208. The performance-based site-specific GMRS transferred to the foundation level in the free-field is referred to as the foundation input response spectra (FIRS). Therefore, the FIRS meet the same performance requisite as the GMRS. Both the GMRS and the FIRS are defined as free-field outcrop1 response spectra. The FIRS is the starting point for conducting an SSI analysis and for making a one-to-one comparison of the seismic design capacity of the standard design and the site-specific seismic demand for a site. The FIRS for the vertical direction is obtained with the vertical to horizontal (V/H) ratios appropriate for the site. GMRS are those derived from the global understanding of the site soil layers above the rock condition as determined from the site exploration activities, and therefore, are unique to a particular site. Competent material is generally considered to be in-situ material having a minimum shear wave velocity of 1,000 feet/second (fps). If non-competent material is present, any excavation and/or backfilling should not alter the development or location of the GMRS. The development of the FIRS should use
1 Outcrop Elevation - An outcrop assumption implies that the outcrop surface is a free surface on which the stresses (normal and shear) are equal to zero, leading to a complete reflection of the incident wave. However, in reality, there may be layers of soil above the assumed outcrop elevation. In these situations, the GMRS or FIRS is computed at depth in a soil profile that includes the effect of the soil layers above on the properties of soil layers below.

3.7.1-3 Revision 4 – December 2014
the site profiles including the effect of backfill. The remaining soft soil or backfill material should be considered in the SSI or other analyses. Further information on the development of the GMRS and FIRS is provided In Interim Staff Guidance (ISG), DC/COL-ISG-01, “Seismic Issues Associated With High Frequency Ground Motion in Design Certification and Combined License Applications,” and DC/COL-ISG-17, “Ensuring Hazard-Consistent Seismic Input for Site Response and Soil Structure Interaction Analyses.” In addition to the FIRS, free-field performance-based surface response spectra (PBSRS) should be developed using the soil column corresponding to the building for which the performance-based FIRS are also generated. The properties of the soil column are used to generate 60 or more randomized sets of properties similar to those used in the probabilistic seismic hazard analysis (PSHA) process as described in SRP Section 2.5.2. The resulting spectra described above are the PBSRS for the horizontal direction. The PBSRS for the vertical direction can be obtained with the appropriate V/H ratios used to develop the FIRS. The PBSRS are used to verify and ensure that the soil columns to be used in a deterministic SSI analysis produce surface response spectra which meet the performance requisite by enveloping the corresponding PBSRS. Additional guidance on demonstrating the adequacy of the soil columns is provided in SRP Section 3.7.2 II.4, “Soil-Structure Interaction,” by the FIRS and PBSRS are associated with subsurface conditions localized to a specific building. In addition, Title 10 of the Code of Federal Regulations (10 CFR) Part 50, “Domestic Licensing of Production and Utilization Facilities,” Appendix S, “Earthquake Engineering Criteria for Nuclear Power Plants,” is applicable to applications for a DC or COL pursuant to 10 CFR Part 52, “Licenses, Certifications, and Approvals for Nuclear Power Plants,” or a CP or OL pursuant to 10 CFR Part 50 submitted on or after January 10, 1997. Applications subject to this appendix must:
• Demonstrate that the SSE ground motion in the horizontal direction in the
free-field at the FIRS must be an appropriate response spectrum with peak ground acceleration (PGA) of at least 0.1g.
• Design SSCs to the OBE and SSE loadings. If the OBE is set at one-
third or less of the SSE, an explicit analysis or design is not required. If the OBE is set at a value greater than one-third of the SSE, an analysis and design must be performed for the OBE to demonstrate that the applicable stress, strain, and deformation limits of the SSCs are satisfied.
The seismic input motions to the SSI analyses can typically be placed at the free ground surface or at the foundation level using the guidance in this SRP Section 3.7.1, “Seismic Design Parameters,” as supplemented by DC/COL-ISG-017. The design response spectra for the OBE and SSE are reviewed. The design response spectra, in general, are relatively smooth plots not exhibiting random peaks and valleys. The use of smooth spectra is preferred in the design and is

3.7.1-4 Revision 4 – December 2014
needed for generic site seismic hazard evaluation, as in the design of a standard plant. The use of unsmoothed design response spectra to develop the input ground motions (design time histories) are reviewed on a case-by-case basis. A review is also made of the approach used to demonstrate that the horizontal component of the SSE ground motion in the free-field at the foundation level of seismic Category I structures is an appropriate response spectrum with a PGA of at least 0.1 g, as required by Appendix S to 10 CFR Part 50.
B. Design Time Histories. Acceleration time histories for computing the response of
seismic Category I SSCs are reviewed. The extent to which these time histories are compatible with the design response spectra is reviewed.
When an appropriate recorded or specified time history is not available as input ground motion for seismic system analysis, the three spatial components of artificial time histories may be generated from the design response spectra for the purpose of carrying out a time history analysis of the SSCs. In demonstrating the statistical independence of the three components of ground motion, the correlation coefficients between the time histories are reviewed. The response spectra obtained from such artificial time histories of ground motion should generally envelop the design response spectra. The procedures used to generate response spectra from the artificial time histories and the comparisons of these response spectra with the design response spectra are reviewed.
In addition to the comparison of the response spectra derived from the ground motion time histories with the design response spectra, the frequency intervals at which the spectral values are calculated are also reviewed.
When time history analyses are performed, either of the following options may be considered. In either case, the time histories may be real or artificial. Option 1: Single Set of Time Histories. The justification for the use of the single set of time histories is reviewed. The approach used to demonstrate that the response spectra generated from the time histories envelop the design response spectra are reviewed. Depending on the approach used, the application of the requirements to match a target power spectral density (PSD) function compatible with the design response spectra may also be reviewed.
Option 2: Multiple Sets of Time Histories. In lieu of the use of a single time history, multiple artificial or real ground motion time histories may be used for the seismic analyses and design of the SSCs. The parameters describing the time histories and the number of time histories are reviewed. The approach used to demonstrate the adequacy of the set of multiple time histories, in terms of the enveloping criteria and having sufficient power over the frequency range of interest, is reviewed.
In some instances, a nonlinear analysis of the SSCs may be appropriate (e.g., stability analysis and evaluation of existing structures). Multiple time

3.7.1-5 Revision 4 – December 2014
history analyses using artificial or real earthquake time histories may be used when such analyses are proposed. The adequacy of time histories used for the nonlinear analyses is reviewed.
2. Percentage of Critical Damping Values. The percentage of critical damping values used
for the seismic analysis of seismic Category I SSCs is reviewed for both the OBE and the SSE. Critical damping is the amount of damping that would completely eliminate free vibration and is an important measure of the damping capacity of a structure.
Vibrating SSCs have energy losses that depend on numerous factors, such as material characteristics, stress levels, and geometric configurations. This dissipation of energy, or damping effect, occurs because a part of the excitation input is transformed into heat, sound waves, and other energy forms. The response of a system to dynamic loads is a function of the amount and type of damping inherent in the system. Knowledge of appropriate values to represent this characteristic is essential for obtaining realistic results in any dynamic analysis.
In practical seismic analysis, which usually employs linear methods of analysis, damping is also used to account for many nonlinear effects such as changes in boundary conditions, joint slippage, concrete cracking, gaps, and other effects that tend to alter response amplitudes. In real structures, it is often impossible to separate “true” material damping from system damping, which is the measure of the energy dissipation, from the nonlinear effects. Overall structural damping used in design is normally determined by observing experimentally the total response of the structure.
Damping values assigned to members of seismic Category I SSCs, including material damping and system damping, are reviewed. When applicable, the basis for any damping values that differ from those given in RG 1.61, “Damping Values for Seismic Design of Nuclear Power Plants,” is reviewed.
3. Supporting Media for Seismic Category I Structures. The description of the supporting
media for each seismic Category I structure is reviewed, including foundation embedment depth, depth of soil over bedrock, soil layering characteristics, highest groundwater elevation, dimensions of the structural foundation, total structural height, topographical conditions of the sites, and soil properties (including strain-dependent properties) and their assumed variability to permit evaluation of the applicability of continuum, finite-element or lumped-spring approaches for SSI analysis.
4. Review Considerations for DC and COL Applications. For a DC application, the
postulated seismic design response spectra are reviewed. The input or control location for the postulated seismic design response spectra is also reviewed. The postulated seismic design response spectra will become the certified seismic design response spectra (CSDRS) when the design is certified by the Commission under 10 CFR Part 52.
For a COL application referencing a certified design, the demonstration that the CSDRS,
when transferred to the foundation level, envelops the site-specific FIRS is reviewed.

3.7.1-6 Revision 4 – December 2014
5. Inspections, Tests, Analyses, and Acceptance Criteria (ITAAC). For DC and COL
reviews, the staff evaluates the applicant's proposed ITAAC associated with the SSCs (if any are identified related to this SRP section) in accordance with SRP Section 14.3, “Inspections, Tests, Analyses, and Acceptance Criteria.” The staff recognizes that the review of ITAAC cannot be completed until after the rest of this portion of the application has been reviewed against acceptance criteria contained in this SRP section. Furthermore, the staff reviews the ITAAC to ensure that all SSCs in this area of review are identified and addressed as appropriate in accordance with SRP Section 14.3.
6. COL Action Items and Certification Requirements and Restrictions. For a DC
application, the review also addresses COL action items, requirements, and restrictions (e.g., interface requirements and site parameters).
For a COL application referencing a DC or ESP, a COL applicant must address COL action items (referred to as COL license information in certain DCs) included in the referenced DC or ESP. Additionally, a COL applicant must address requirements and restrictions (e.g., interface requirements, site parameters, and permit conditions) included in the referenced DC or ESP.
COL action items related to seismic design parameters include soil layering assumptions used in the certified design, range of soil parameters considered, and shear wave velocity values.
Review Interfaces The reviewer should consider other SRP sections which interface with this SRP section as appropriate in the safety evaluation to ensure the technical consistency of the reviews across SRP sections. The SRP sections interfacing with this SRP section are described as follows: 1. Review of geological and seismological information to establish the free-field ground
motion is performed under SRP Section 2.5.1, “Basic Geologic and Seismic Information,” through SRP Section 2.5.3, “Surface Faulting.”
2. The geotechnical parameters and methods employed in the analysis of free field soil
media and the soil properties are reviewed under SRP Section 2.5.4, “Stability of Subsurface Materials and Foundations.”
3. The seismic system analysis which utilizes the design ground motion developed in this
SRP section is reviewed under SRP Section 3.7.2. 4. The seismic subsystem analysis for some components (e.g., buried piping, tunnels, and
atmospheric tanks), which utilize the design ground motion developed in this SRP section, is reviewed under SRP Section 3.7.3, “Seismic Subsystem Analysis Review Responsibilities.”
5. For DC applications and COL applications referencing a DC, review of the site
parameters in the Design Control Document (DCD) Tier 1 and Chapter 2 of the DCD

3.7.1-7 Revision 4 – December 2014
Tier 2 submitted by the applicant is performed under SRP Section 2.0, “Site Characteristics and Site Parameters.”
6. Review of the Probabilistic Risk Assessment is performed under SRP Section 19.0,
“Probabilistic Risk Assessment And Severe Accident Evaluation For New Reactors,” in conjunction with DC/COL-ISG-020, “Interim Staff Guidance on Implementation of a Probabilistic Risk Assessment-Based Seismic Margin Analysis for New Reactors,” for potential risk significance of SSCs and the risk-based susceptibility of risk significant SSCs to failure due to seismic hazards.
The results of the reviews for the OBE and the SSE site-specific free-field ground motion, soil properties, etc., are used as an integral part of the seismic analysis review of seismic Category I SSCs. II. ACCEPTANCE CRITERIA Requirements Acceptance criteria are based on meeting the relevant requirements of the following Commission regulations: 1. 10 CFR Part 50, Appendix A, General Design Criterion (GDC) 2, “Design Bases for
Protection against Natural Phenomena.” - The design basis shall reflect appropriate consideration of the most severe earthquakes that have been historically reported for the site and surrounding area with sufficient margin for the limited accuracy, quantity, and period of time in which historical data have been accumulated.
2. 10 CFR Part 50, Appendix S is applicable to applications for a DC or COL pursuant to
10 CFR Part 52 or a CP or OL pursuant to 10 CFR Part 50 on or after January 10, 1997. Appendix S requires that for SSE ground motions, SSCs will remain functional and within applicable stress, strain, and deformation limits. The required safety functions of SSCs must be assured during and after the vibratory ground motion through design, testing, or qualification methods. The evaluation must take into account SSI effects and the expected duration of the vibratory motion. If the OBE is set at one-third or less of the SSE, an explicit analysis or design is not required. If the OBE is set at a value greater than one-third of the SSE, an analysis and design must be performed to demonstrate that the applicable stress, strain, and deformation limits are satisfied. Appendix S also requires that the horizontal component of the SSE ground motion in the free-field at the foundation level of the structures must be an appropriate response spectrum with a PGA of at least 0.1g.
3. 10 CFR 52.47(a)(1) requires a DC applicant provide site parameters postulated for the
design and an analysis and evaluation of the design in terms of those site parameters. 4. 10 CFR 52.47(b)(1), which requires that a DC application contain the proposed ITAAC
that are necessary and sufficient to provide reasonable assurance that, if the inspections, tests, and analyses are performed and the acceptance criteria met, a facility that incorporates the DC has been constructed and will be operated in conformity with

3.7.1-8 Revision 4 – December 2014
the DC, the provisions of the Atomic Energy Act, and the Commission’s rules and regulations.
5. 10 CFR 52.79(b)(1) for a COL referencing an ESP as it relates to information sufficient
to demonstrate that the design of the facility falls within the site characteristics and design parameters specified in the ESP.
6. 10 CFR 52.79(d)(1) for a COL referencing a DC as it relates to information sufficient to
demonstrate that the characteristics of the site fall within the site parameters specified in the DC.
7. 10 CFR 52.80(a), which requires that a COL application contain the proposed
inspections, tests, and analyses, including those applicable to emergency planning, that the licensee shall perform, and the acceptance criteria that are necessary and sufficient to provide reasonable assurance that, if the inspections, tests, and analyses are performed and the acceptance criteria met, the facility has been constructed and will operate in conformity with the COL, the provisions of the Atomic Energy Act, Commission’s rules and regulations.
SRP Acceptance Criteria Specific SRP acceptance criteria acceptable to meet the relevant requirements of the Commission’s regulations identified above are as follows for the review described in this SRP section. The SRP is not a substitute for the Commission’s regulations, and compliance with it is not required. However, an applicant is required to identify differences between this SRP section and the design features, analytical techniques, and procedural measures proposed for the facility, and discussing how the proposed alternatives provide acceptable methods of complying with the regulations that underlie the SRP acceptance criteria. 1. Design Ground Motion
A. Design Response Spectra. The site-specific FIRS and PBSRS reviewed under this SRP section are determined as free-field outcrop motions at the foundation and surface level. FIRS and associated deterministic soil profiles developed using the PBSRS to meet the performance goal will establish the design basis for the site-specific SSI analysis; this design basis is developed using the guidance reviewed under SRP Section 2.5.2. For sites with soil layers near the surface that will be completely excavated (defined as excavations to distances sufficiently far from the structures to be considered infinitely far from the facility over the frequency range of interest) and replaced with compacted backfill, the FIRS and PBSRS are determined using the site profiles including the replacement backfill. The competent material is generally considered to be in-situ material having a minimum shear wave velocity of 1,000 fps. Any remaining soft soil or backfill material should be considered in the SSI.
According to Appendix S to 10 CFR Part 50, the minimum PGA for the horizontal
component of the SSE at the foundation level in the free-field should be 0.1g or higher. The response spectrum associated with this minimum PGA should be a

3.7.1-9 Revision 4 – December 2014
smooth broadband response spectrum (e.g., RG 1.60, or other appropriate shaped spectra, if justified) and is defined as outcrop response spectra at the free-field foundation level. This response spectrum anchored to 0.1g is referred to in this SRP section as the minimum required response spectrum.
i. Non-standard Plant Design. For a non-standard plant design (e.g., COL
application referencing only an ESP, or a COL application not referencing a DC and ESP), the design response spectra are developed from the site-specific GMRS or from a broadband shaped spectra similar to RG 1.60 which also envelops the site-specific GMRS. Foundation level response spectra (FIRS) consistent with the design response spectra are determined for each seismic Category I structure. These foundation level spectra are compared to the minimum required spectrum to ensure they meet the 0.1g PGA requirement in accordance with Appendix S to 10 CFR Part 50. If the foundation level spectra do not bound the minimum required response spectrum, then the design response spectra can be adjusted/modified in order to bound the minimum required spectrum. If the design response spectra are not modified, then the use of the two separate sets of spectra in the analysis and design of SSCs should be reviewed for adequacy.
ii. Certified Standard Plant Design. For a DC application, the postulated
seismic design response spectra should bound the minimum required response spectrum anchored to 0.1g (as specified in Appendix S to 10 CFR Part 50). These design response spectra are referred to as the CSDRS when the design is certified by the Commission under 10 CFR Part 52.
For a DC, a similar approach described above (under SRP 3.7.1 Subsection II.1.A.i) is used to ensure that the CSDRS envelop the minimum required spectrum at the foundation level. Foundation level response spectra consistent with the CSDRS are determined for each seismic Category I structure. These foundation level spectra are compared to the minimum required spectrum to ensure that they meet the 0.1g PGA requirement in accordance with Appendix S to 10 CFR Part 50. If the foundation level spectra do not bound the minimum required spectrum, then the CSDRS can be adjusted/modified in order to bound the minimum required spectrum. If the CSDRS are not modified, then the use of the two separate sets of spectra in the analysis and design of SSCs should be reviewed for adequacy.
For evaluation of soil liquefaction and soil/rock stability of slopes that may affect plant safety, the use of the site-specific GMRS rather than the CSDRS is reviewed on a case-by-case basis in accordance with SRP Section 2.5.4.
The free-field design response spectra (also referred to as the CSDRS for a DC) are usually developed for the 5 percent damping value. For the

3.7.1-10 Revision 4 – December 2014
case of RG 1.60 response spectra, Tables 1 and 2 of RG 1.60 provide amplification factors at four frequencies for calculating response spectra corresponding to different damping values. For the case of the free-field design response spectra that are different from RG 1.60 response spectra, procedures to calculate response spectra for different damping values other than 5 percent can utilize the latest available data/methods such as those in PEER Report 2012/01 or NUREG/CR-6728. The procedures used are reviewed by the staff on a case-by-case basis.
To be acceptable, the seismic design response spectra should be specified for three mutually orthogonal directions - two horizontal and one vertical. Current practice is to assume that the design response spectra (including maximum ground accelerations) in the two horizontal directions are the same.
B. Design Time Histories. The SSE and OBE design ground motion time histories
can be either real time histories or artificial time histories. To be acceptable, the design ground motion time histories should consist of three mutually orthogonal directions - two horizontal and one vertical. For both horizontal and vertical input motions, either a single time history or multiple time histories can be used. When time histories are used, each of the three ground motion time histories should be shown to be statistically independent from the others. Each pair of time histories are considered to be statistically independent if the absolute value of their correlation coefficient does not exceed 0.16. Simply shifting the starting time of a given time history cannot be used to establish a different time history. When the seed time histories are selected from earthquake records, the response spectra corresponding to the seed record should be similar in shape to the target spectra across the frequency range of interest to the analysis (e.g., Houston, et al., 2010) and phasing characteristics of the earthquake records should not change significantly. If the target spectra include multiple characteristic events, a single recorded earthquake time history may not able to capture the response characteristics of the target spectra. To this end, the use of multiple time histories may be appropriate in which individual time histories are developed from earthquake records fairly representing the characteristic events embodied in the target spectra. Alternatively, an artificial time history may be developed using random generation routines or through the use of multiple time history techniques. If a random time history generator technique is used to develop the seed time histories, then acceptability of the seed will be reviewed on a case-by-case basis. For generated time histories, it should be demonstrated that acceleration, velocity, and displacement are compatible and do not result in displacement’s baseline drift.
For linear structural analyses, the total duration of the ground motion time histories should be long enough such that adequate representation of the Fourier components at low frequency is included in the time history. The corresponding stationary phase strong-motion duration should be consistent with the longest duration of strong motion from the earthquakes defined in SRP Section 2.5.2 at low and high frequency and as presented in NUREG/CR-6728. The strong motion duration is defined as the time required for the Arias Intensity to rise from

3.7.1-11 Revision 4 – December 2014
5 percent to 75 percent. The uniformity of the growth of this Arias Intensity should be reviewed. The minimum acceptable strong motion duration should be six seconds. In addition to the duration for site-specific analysis, the ratios V/A and AD/V2 (A, V, D are PGA, peak ground velocity, and peak ground displacement, respectively) should be consistent with the characteristic values for the magnitude and distance of the appropriate controlling events defining the uniform hazard response spectra. These parameters should be consistent with the values determined for the low and high frequency events described in Appendix D of RG 1.208.
For nonlinear structural analysis problems, multiple sets of ground motion time histories should be used to represent the design ground motion. Each set of ground motion time histories can be selected from real recorded or artificial time histories. The amplitude of these ground motions may be scaled but the phasing of Fourier components should be maintained. The adequacy of this set of ground motions, including duration estimates, is reviewed on a case-by-case basis.
Option 1: Single Set of Time Histories. To be considered acceptable, the response spectra generated from the design time history to be used as input ground motion in the free-field should satisfy the enveloping criteria for either Approach 1 or Approach 2 below:
i. Approach 1. For Approach 1, the spectrum from the design ground
motion time history should envelop the free-field design response spectra for all damping values used in the seismic response analysis. When spectral values (e.g., spectral accelerations) are calculated from the design time history, the frequency intervals at which spectral values are determined are to be sufficiently small. Table 3.7.1-1 (below) provides an acceptable set of frequencies at which the response spectra may be calculated.
Table 3.7.1-1
Suggested Frequency Intervals for Calculation of Response Spectra
Frequency
Range (Hz)
Increment
(Hz) 0.2 - 3.0 0.10 3.0 - 3.6 0.15 3.6 - 5.0 0.20 5.0 - 8.0 0.25 8.0 - 15.0 0.50 15.0 - 18.0 1.0 18.0 - 22.0 2.0
22.0 - highest frequency of interest 3.0

3.7.1-12 Revision 4 – December 2014
Each calculated spectrum of the design time history is considered to envelop the design response spectrum when no more than five points fall below, and no more than 10 percent below, the design response spectrum.
Studies indicate that numerically generated ground acceleration histories produce PSD functions having a quite different appearance from one individual function to another, even when all these time histories are generated so as to closely envelop the same design response spectra. For example, the use of the available techniques of generating acceleration time histories that satisfy enveloping RG 1.60 spectra usually results in PSD functions that fluctuate significantly and randomly as a function of frequency. It is also recognized that the more closely one tries to envelop the specified design response spectra, the more significantly and randomly do the spectral density functions tend to fluctuate and these fluctuations may lead to unconservative results for the response of SSCs. Therefore, when a single design ground motion time history is used in the design of seismic Category I SSCs, it should satisfy criteria for both enveloping design response spectra as well as adequately matching a target PSD function compatible with the design response spectra. Therefore, in addition to the response spectra enveloping criterion, the use of a single time history should also be justified by demonstrating sufficient energy at the frequencies of interest through the generation of PSD function, which envelops the target PSD function throughout the frequency range of significance.
When RG 1.60 response spectra are used as design response spectra, the criteria for a compatible target PSD are contained in Appendix A to this SRP section. Target PSD functions other than those given in Appendix A can be used if justified. For design response spectra other than RG 1.60 response spectra, a compatible target PSD should be generated. For generation of target PSD in such cases (i.e., spectra based on NUREG/CR-6728, “Technical Basis for Revision of Regulatory Guidance on Design Ground Motions: Hazard- and Risk-consistent Ground Motion Spectra Guidelines,” October 2001 or based on other spectra), the guidelines and procedures provided in Appendix B to this SRP section can be used. These guidelines and procedures are consistent with the approach described in NUREG/CR-5347, “Recommendations for Resolution of Public Comments, Seismic Design Criteria,” dated June 1989. Alternative methods for developing target spectra PSD can be used and are reviewed on a case-by-case basis. Regardless of the approach used, the development of the target PSD and the range of frequency for the PSD check are reviewed on a case-by-case basis. The PSD criteria are included as secondary check to prevent potential deficiency of power over the frequency range of interest. It should be noted that the ground motion is still primarily defined by the

3.7.1-13 Revision 4 – December 2014
design response spectrum. The use of PSD criteria alone can yield time histories that may not envelop the design response spectrum.
ii. Approach 2. For Approach 2, the design ground motion time histories to
match or envelop the design response spectra should be developed with Steps (a) through (d) below. The general objective is to generate a modified recorded or artificial accelerogram which achieves approximately mean based fit to the target response spectrum; that is, the average ratio of the spectral acceleration calculated from the accelerogram to the target, where the ratio is calculated frequency by frequency, is only slightly greater than “1.” The aim is to achieve an accelerogram that does not have significant gaps in the Fourier amplitude spectrum, but which is not biased high with respect to the target.
(a) The time history should have a sufficiently small time increment
and sufficiently long duration. Records should have a Nyquist frequency of at least 50 Hz, (e.g., a time increment of at most 0.010 seconds) and a total duration of at least 20 seconds. If frequencies higher than 50 Hz are of interest, the time increment of the record should be suitably reduced to provide a Nyquist frequency (Nf =1/(2Δt), where Δt = time increment) above the maximum frequency of interest. The total duration of the record can be increased by zero packing to satisfy these frequency criteria.
(b) Spectral acceleration at 5 percent damping should be computed at
a minimum of 100 points per frequency decade, uniformly spaced over the log frequency scale from 0.1 Hz to 50 Hz or the Nyquist frequency. The comparison of the response spectrum obtained from the design ground motion time history with the target response spectrum should be made at each frequency computed in the frequency range of interest.
(c) The computed 5 percent damped response spectrum of the
acceleration time history should not fall more than 10 percent below the target response spectrum at any one frequency. To prevent response spectra in large frequency windows from falling below the target response spectrum, the response spectra within a frequency window of no larger than ±10% centered on the frequency should be allowed to fall below the target response spectrum. This corresponds to response spectra at no more than 9 adjacent frequency points defined in (b) above from falling below the target response spectrum.
(d) The computed 5 percent damped response spectrum of the
acceleration time history should not exceed the target response spectrum at any frequency by more than 30 percent (a factor of 1.3) in the frequency range of interest. In addition, the power

3.7.1-14 Revision 4 – December 2014
spectrum density of the accelerogram should be computed and shown to not have significant gaps in energy at any frequency over this frequency range.
If the design ground motion time history, defined in Approach 2 above, is intended to be compatible to a site-specific FIRS, it should have characteristics consistent with characteristic values for the magnitude and distance of the appropriate controlling events defined for the corresponding uniform hazard response spectrum (UHRS).
Option 2: Multiple Sets of Time Histories. As discussed in Section I.1.B and Section II.1.B of this SRP section, the use of multiple real or artificial time histories for analyses and design of SSCs is acceptable. For linear structural analyses, a minimum of four times histories should be used (NUREG/CR-5347). For nonlinear structural analyses, the number of time histories should be greater than four and the technical basis for the appropriate number of time histories are reviewed on a case-by-case basis. This review also includes the adequacy of the characteristics of the multiple time histories.
The response spectra calculated for each individual time history may not envelop the design response spectra. However, the multiple time histories are acceptable if the average calculated response spectra generated from these time histories envelop the design response spectra. An acceptable method to demonstrate the adequacy of a set of multiple time histories, in terms of enveloping criteria and having sufficient power over the frequency range of interest, is to follow the procedures described for Approach 2 presented in Subsection II.1.B.ii of this SRP. When implementing Approach 2, the criteria in paragraphs (a) and (b) of this approach should be satisfied for each of the time histories. The criteria in paragraphs (c) and (d) of this approach can be satisfied by utilizing the results for the average of the suite of multiple time histories. When calculating the response of structures (e.g., accelerations, member forces, and displacements) from linear analyses, the average value of the responses from the multiple time histories may be used. When calculating the response of structures from nonlinear analyses (e.g., seismic evaluation of as-built structures), the average value of the responses from the multiple time histories may be used if at least seven nonlinear time history analyses are performed. Otherwise, the maximum value (i.e., envelope) of the individual responses from the multiple time histories should be used. In addition, if the extent of the nonlinear response is found to be significant or if the nonlinear response due to one or several time histories is found to be substantially different from the other results, then additional time histories should be considered. If there is a particular ground motion or time history analysis that dominates the response values, it should not be replaced with another motion or analysis to reduce the responses. Also, if a ratcheting effect is noted (e.g., increasing deformation with subsequent cycling of earthquake motion), then the system characteristics should be reviewed to ensure that they have

3.7.1-15 Revision 4 – December 2014
been conservatively considered or the design should be revised to eliminate this behavior.
2. Percentage of Critical Damping Values. The specific percentage of critical damping
values used in the analyses of seismic Category I, SSCs is considered to be acceptable if they are in accordance with RG 1.61. Damping values different from those listed in RG 1.61 (e.g., higher damping values) may be used in a dynamic seismic analysis if test data are provided to support them. These damping values are reviewed and accepted by the staff on a case-by-case basis. In addition, a demonstration of the correlation between stress levels and damping values is required and reviewed to determine if the applicable regulatory position in RG 1.61 is met. If other methods for correlation of damping values with stress level are used, they should be reviewed and accepted on a case-by-case basis.
The material soil damping for foundation soils should be based upon validated values or other pertinent laboratory data, considering variation in soil properties and strains within the soil, and should include an evaluation of dissipation from pore pressure effects as well as material damping for saturated site conditions. The maximum soil damping value acceptable to the staff is 15 percent.
3. Supporting Media for Seismic Category I Structures. To be acceptable, the description
of supporting media for each seismic Category I structure should include foundation embedment depth, depth of soil over bedrock, soil layering characteristics, design groundwater elevation, dimensions of the structural foundation, total structural height, and soil properties such as shear wave velocity, shear modulus, material damping, including strain-dependent effect, as well as Poisson's ratios, and density as a function of depth. If the minimum shear wave velocity of the supporting foundation material is less than 1,000 fps, additional studies should be performed which consider the average shear wave velocity, and its degree of variability addressing potential impact of soft soil on SSI, potential settlements and design of foundation elements.
4. Review Considerations for DC and COL Applications
A. COL Application Referencing an ESP and DC
i. Site-specific FIRS and PBSRS are reviewed separately under this SRP section for adequacy. For COL application referencing an ESP and DC, the FIRS and PBSRS are included in the COL application. This review should include determination of the PBSRS at the surface and associated deterministically defined soil columns needed for determining the adequacy of the check on performance goal. The FIRS with the consistent soil columns together form the design basis that is used for the seismic analysis of the facilities.
ii. Confirm that the criterion for the minimum required response spectrum (in
accordance with SRP Subsection II.1.A.ii) has been satisfied.

3.7.1-16 Revision 4 – December 2014
iii. Confirm that COL action items contained in the DC have been met. This includes seismic design parameters such as soil layering assumptions used in the certified design, range of soil parameters, shear wave velocity values, and minimum soil bearing capacity. Technical justification for all deviations from the range of values used in the standard plant design should be provided for review.
iv. Confirm that the ESP conditions have been met or review the COL
applicant’s approach to address any deviations.
The PBSRS are generated using the soil profiles for which the performance-based FIRS are generated. The properties of the individual realizations of the soil column consist of at least 60 or more randomized soil profiles similar to those used in the PSHA process and reviewed under SRP Section 2.5.2 and as described in DC/COL-ISG-017. From this set of randomized columns, three individual soil columns are generated with individual layer properties (shear wave velocity and iterated hysteretic damping) selected at the best estimate (BE), lower bound (LB) at minus one standard deviation values, and upper bound (UB) at plus one standard deviation values. For SSI analyses, the LB and UB profiles may be modified to ensure that they satisfy the criteria of COV in velocity properties as described in SRP Section 3.7.2. These individual soil columns are to be used in deterministic site response and SSI analyses described in SRP Section 3.7.2. Free-field response spectra are then generated at the ground surface from the FIRS input at the foundation level for each of these three deterministic soil profiles. The envelope of these three spectra (BE, LB, and UB) should equal or exceed the corresponding PBSRS. If the envelope spectra do not equal or exceed the PBSRS, additional soil profiles can be developed for which SSI analyses are to be performed or, the input time histories may be modified in accordance with DC/COL-ISG-017, Section 5.2 – “Position on Site-Consistent Seismic Input and Soil Profiles Properties for the SSI Analysis.”
v. When the site-specific FIRS and the CSDRS are calculated at the same
elevation, confirm that the CSDRS envelop the FIRS as indicated in DC/COL-ISG-017 provided that the site-specific soil profile is captured within the range of profiles considered in the development of the CSDRS. For this case the standard design is acceptable for that site, assuming no other issue is identified during the review process. If the CSDRS do not envelop the site-specific FIRS, then proceed to step viii.
vi. When the site-specific FIRS and the CSDRS are determined at different
elevations, the CSDRS-consistent spectra should be calculated at the foundations of each seismic Category I structure. For each seismic Category I structure foundation, if the CSDRS-consistent spectra at the foundation level envelop the site-specific FIRS at the foundation level, the

3.7.1-17 Revision 4 – December 2014
standard design is acceptable for that site, assuming no other issue is identified during the review process. If not, then proceed to step viii.
vii. Perform an analysis of the seismic response of the facilities using the
site-specific FIRS as input and an appropriate seismic analytical technique (e.g., method that considers the effects of incoherent ground motion). When such analytical methods are utilized, the detailed technical justifications are reviewed on a case-by-case basis. Further discussion on consideration of the effects of incoherent ground motion is provided in Subsection II.4.C (under the heading Input Ground Motion, Specific Guidelines for SSI Analysis) in SRP Section 3.7.2, “Seismic System Analysis.” The in-structure responses in terms of floor response spectra, building member forces, and deformations at key locations in the structure should be obtained using seismic analysis methods in SRP Section 3.7.2 II. The key locations for calculating the in-structure responses, proposed by the licensee, should be evaluated to ensure that they are sufficient to represent the various locations throughout the building. Locations should include responses at peripheral locations to detect rocking and torsion, and should include responses to check overturning, torsional, and sliding stability of the structures. The dynamic models and analysis techniques should be sufficiently refined to be able to capture the response of the structures throughout the frequency range of interest, including the high frequency responses, typically expected in the central and eastern United States (CEUS) regions. The SSI analysis should also consider the site-specific soil variability (i.e., best estimate, lower bound estimate, and upper bound estimate of site properties) as described in Item v above.
Compare these responses at the key locations in the structure to the standard design in-structure responses. If the computed responses from the CSDRS envelop the corresponding in-structure responses from the individual deterministic soil columns, the standard design is acceptable, assuming no other issue is identified during the review process. If the responses are not enveloped, additional analyses are required to demonstrate the acceptability of the design or the design might need to be modified. If further analyses are utilized, then the analyses should consider the potentially higher responses at all locations, not only those at the key locations described above.
B. COL Application Referencing a DC. Follow the same steps described above
under A, COL Application Referencing an ESP and DC, except that step iv does not apply to this case.
C. COL Application Referencing an ESP.
i. Site-specific FIRS and PBSRS are reviewed separately under this SRP
section for adequacy. For COL application referencing an ESP, the FIRS and PBSRS are included in the COL application. This review should
3.7.1-18 Revision 4 – December 2014
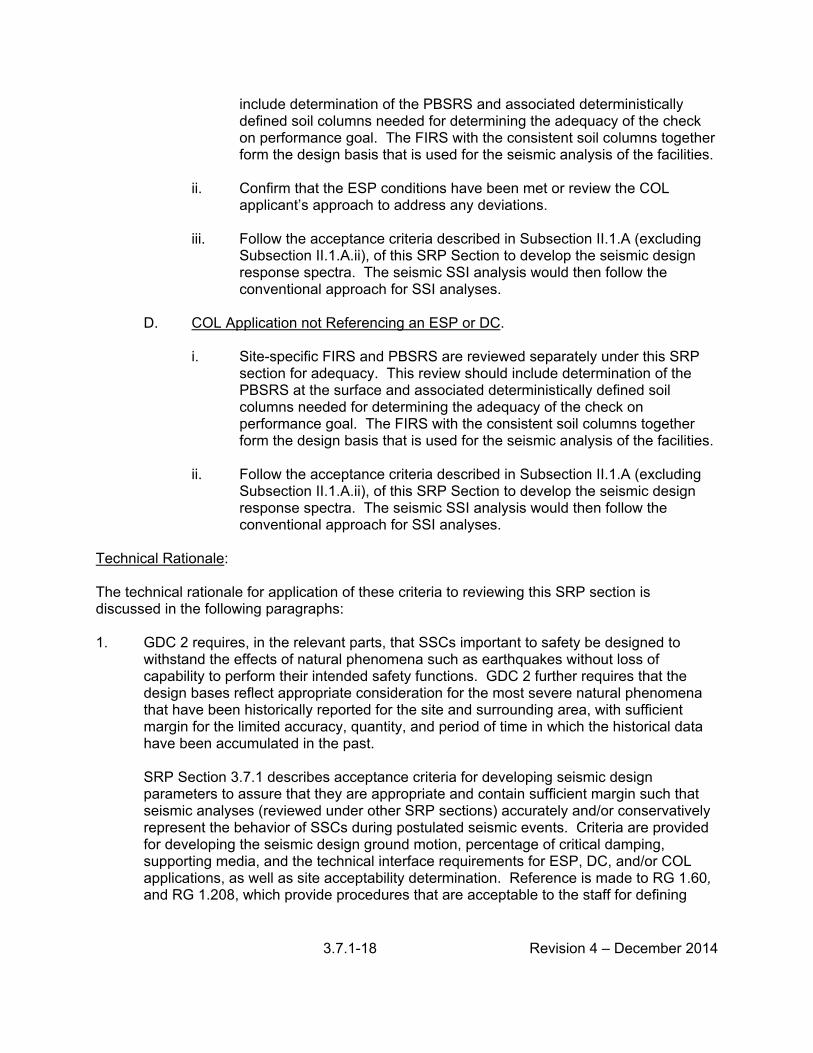
include determination of the PBSRS and associated deterministically defined soil columns needed for determining the adequacy of the check on performance goal. The FIRS with the consistent soil columns together form the design basis that is used for the seismic analysis of the facilities.
ii. Confirm that the ESP conditions have been met or review the COL
applicant’s approach to address any deviations. iii. Follow the acceptance criteria described in Subsection II.1.A (excluding
Subsection II.1.A.ii), of this SRP Section to develop the seismic design response spectra. The seismic SSI analysis would then follow the conventional approach for SSI analyses.
D. COL Application not Referencing an ESP or DC.
i. Site-specific FIRS and PBSRS are reviewed separately under this SRP
section for adequacy. This review should include determination of the PBSRS at the surface and associated deterministically defined soil columns needed for determining the adequacy of the check on performance goal. The FIRS with the consistent soil columns together form the design basis that is used for the seismic analysis of the facilities.
ii. Follow the acceptance criteria described in Subsection II.1.A (excluding
Subsection II.1.A.ii), of this SRP Section to develop the seismic design response spectra. The seismic SSI analysis would then follow the conventional approach for SSI analyses.
Technical Rationale: The technical rationale for application of these criteria to reviewing this SRP section is discussed in the following paragraphs: 1. GDC 2 requires, in the relevant parts, that SSCs important to safety be designed to
withstand the effects of natural phenomena such as earthquakes without loss of capability to perform their intended safety functions. GDC 2 further requires that the design bases reflect appropriate consideration for the most severe natural phenomena that have been historically reported for the site and surrounding area, with sufficient margin for the limited accuracy, quantity, and period of time in which the historical data have been accumulated in the past.
SRP Section 3.7.1 describes acceptance criteria for developing seismic design parameters to assure that they are appropriate and contain sufficient margin such that seismic analyses (reviewed under other SRP sections) accurately and/or conservatively represent the behavior of SSCs during postulated seismic events. Criteria are provided for developing the seismic design ground motion, percentage of critical damping, supporting media, and the technical interface requirements for ESP, DC, and/or COL applications, as well as site acceptability determination. Reference is made to RG 1.60, and RG 1.208, which provide procedures that are acceptable to the staff for defining

3.7.1-19 Revision 4 – December 2014
seismic GMRS for input into the seismic design analysis of nuclear power plants SSCs. In addition, RG 1.61 is referenced for guidance of acceptable damping values to be used in performing dynamic analyses of SSCs.
Satisfying these criteria provides assurance that seismic Category I SSCs will be adequately designed to withstand the effects of earthquakes, and thus, will be able to perform their intended safety function.
2. 10 CFR Part 50, Appendix S is applicable to applications for a DC or COL pursuant to
10 CFR Part 52 or a CP or OL pursuant to 10 CFR Part 50 on or after January 10, 1997. For SSE ground motions, 10 CFR Part 50, Appendix S requires that SSCs will remain functional and within applicable stress, strain, and deformation limits. The required safety functions of SSCs must be assured during and after the vibratory ground motion through design, testing, or qualification methods. The evaluation must take into account SSI effects and the expected duration of the vibratory motion. If the OBE is set at one-third or less of the SSE, an explicit analysis or design is not required. If the OBE is set at a value greater than one-third of the SSE, an analysis and design must be performed to demonstrate that the applicable stress, strain, and deformation limits are satisfied. Appendix S also requires that the horizontal component of the SSE ground motion in the free-field at the foundation level of the structures must be an appropriate response spectrum with a PGA of at least 0.1g.
SRP Section 3.7.1 describes acceptance criteria for developing the required design ground motion loadings consisting of the SSE and OBE (if applicable) and other seismic design parameters needed to perform an SSI analysis. This SRP section indicates that an explicit analysis for the OBE, in addition to the SSE, should be performed unless the magnitude of the OBE is set at one-third or less of the SSE. Criteria for the required characteristics of the earthquake motion are presented which include the duration of the seismic ground motion. SRP Section 3.7.1 also specifies that the horizontal free-field SSE ground motion at the foundation level should be represented by an appropriate response spectrum, such as that defined in RG 1.60, with a minimum PGA of 0.1g.The criteria presented in this SRP section provide the design ground motion loadings and seismic design parameters so that the SSI analysis can determine the response of the SSCs in terms of stresses, strains, and deformations. In addition, the use of these criteria allows the SSI analysis to calculate the floor response spectra for use in qualification of equipment.
Satisfying these criteria provides assurance that appropriate methods will be used to determine the required OBE and SSE loadings and the response of SSCs, which will ensure that they will remain functional within applicable acceptance limits.
III. REVIEW PROCEDURES These review procedures are based on the identified SRP acceptance criteria. For deviations from these acceptance criteria, the staff shall review the applicant’s evaluation of how the proposed alternatives provide an acceptable method of complying with the relevant U.S. Nuclear Regulatory Commission (NRC) requirements identified in SRP 3.7.1, Subsection II.

3.7.1-20 Revision 4 – December 2014
In accordance with 10 CFR 52.47(a)(8), 10 CFR 52.47(a)(21), and 10 CFR 52.47(a)(22), and 10 CFR 52.79(a)(17), 10 CFR 52.79(a)(20), and 10 CFR 52.79(a)(37) for DC or COL applications submitted under Part 52, the applicant is required to (1) address the proposed technical resolution of unresolved safety issues and medium- and high-priority generic safety issues which are identified in the version of NUREG-0933 current on the date up to 6 months before the docket date of the application and which are technically relevant to the design; (2) demonstrate how the operating experience insights have been incorporated into the plant design; and, (3) provide information necessary to demonstrate compliance with any technically relevant portions of the Three Mile Island requirements set forth in 10 CFR 50.34(f), except for paragraphs 10 CFR 50.34(f)(1)(xii), 10 CFR 50.34(f)(2)(ix), and 10 CFR 50.34 (f)(3)(v) for a DC application, and except for paragraphs 10 CFR 50.34(f)(1)(xii), 10 CFR 50.34 (f)(2)(ix), 10 CFR 50.34(f)(2)(xxv), and 10 CFR 50.34(f)(3)(v) for a COL application. These cross-cutting review areas should be addressed by the reviewer for each technical subsection and relevant conclusions documented in the corresponding Safety Evaluation Report (SER) section. 1. Design Ground Motion
A. Design Response Spectra. For the non-standard plant design (i.e., COL application that does not reference a DC), the design response spectra for the OBE and SSE, for all applicable damping values, are checked to ensure that the response spectra are in accordance with the acceptance criteria as given in SRP Section 3.7.1, Subsection II.1.A.i. For the DC, the CSDRS for the OBE and SSE for applicable damping values are checked to ensure that the CSDRS are in accordance with the acceptance criteria as given in SRP 3.7.1, Subsection II.1.A.ii. Any deviations from the acceptance criteria applicable to the development of the design response spectra or CSDRS that have not been adequately justified are identified, and the applicant is informed of the need for additional technical justification.
B. Design Time History. Methods of defining the design ground motion time
histories are reviewed to confirm that the acceptance criteria of Subsection II.1.B of this SRP section are met.
2. Percentage of Critical Damping Values. The specific percentage of critical damping
values for the OBE and SSE used in the analyses of seismic Category I SSCs are checked to ensure that the damping values are in accordance with the acceptance criteria as given in Subsection II.2 of this SRP section. Any differences in damping values that have not been adequately justified are identified, and the applicant is informed of the need for additional technical justification.
3. Supporting Media for Seismic Category I Structures. The description of the supporting
media is reviewed to verify that sufficient information, as specified in the acceptance criteria of Subsection II.3 of this SRP section, is included.
4. Review Considerations for DC and COL Applications. The information provided by the
applicant to address the review considerations in the SRP acceptance criteria of Subsection II.4 of this SRP section is reviewed. The review should conclude that the CSDRS envelop the site-specific FIRS for a COL application that references a DC. In
3.7.1-21 Revision 4 – December 2014
addition, the review should conclude that the applicant addressed the identified COL action items. If these acceptance criteria are not met, then the technical basis for alternative methods needs to be provided by the applicant for review and approval.
For review of a DC application, the reviewer should follow the above procedures to verify that the design, including requirements and restrictions (e.g., interface requirements and site parameters), set forth in the final safety analysis report (FSAR) satisfies the acceptance criteria. DCs have referred to the FSAR as the DCD. The reviewer should also consider the appropriateness of identified COL action items. The reviewer may identify additional COL action items; however, to ensure these COL action items are addressed during a COL application, they should be added to the DC FSAR.
For review of a COL application, the scope of the review is dependent on whether the COL applicant references a DC, an ESP or other NRC approvals (e.g., manufacturing license, site suitability report or topical report). For review of both DC and COL applications, SRP Section 14.3 should be followed for the review of ITAAC. The review of ITAAC cannot be completed until after the completion of this section.
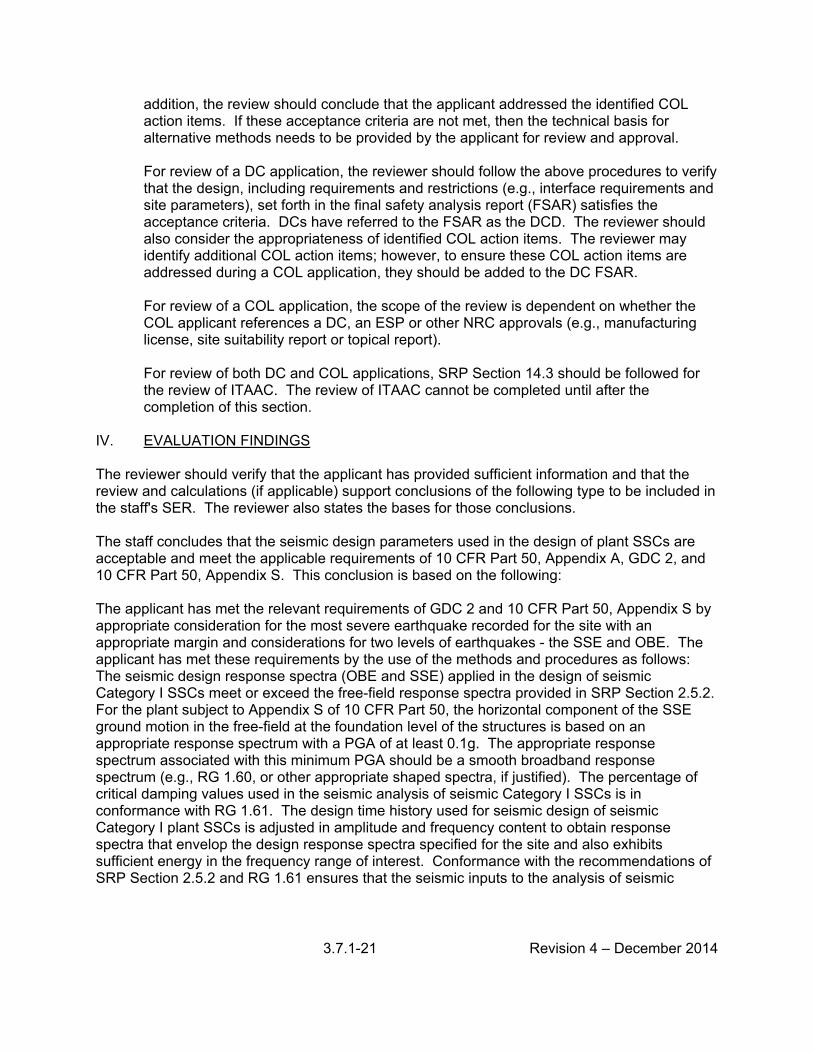
IV. EVALUATION FINDINGS The reviewer should verify that the applicant has provided sufficient information and that the review and calculations (if applicable) support conclusions of the following type to be included in the staff's SER. The reviewer also states the bases for those conclusions. The staff concludes that the seismic design parameters used in the design of plant SSCs are acceptable and meet the applicable requirements of 10 CFR Part 50, Appendix A, GDC 2, and 10 CFR Part 50, Appendix S. This conclusion is based on the following: The applicant has met the relevant requirements of GDC 2 and 10 CFR Part 50, Appendix S by appropriate consideration for the most severe earthquake recorded for the site with an appropriate margin and considerations for two levels of earthquakes - the SSE and OBE. The applicant has met these requirements by the use of the methods and procedures as follows: The seismic design response spectra (OBE and SSE) applied in the design of seismic Category I SSCs meet or exceed the free-field response spectra provided in SRP Section 2.5.2. For the plant subject to Appendix S of 10 CFR Part 50, the horizontal component of the SSE ground motion in the free-field at the foundation level of the structures is based on an appropriate response spectrum with a PGA of at least 0.1g. The appropriate response spectrum associated with this minimum PGA should be a smooth broadband response spectrum (e.g., RG 1.60, or other appropriate shaped spectra, if justified). The percentage of critical damping values used in the seismic analysis of seismic Category I SSCs is in conformance with RG 1.61. The design time history used for seismic design of seismic Category I plant SSCs is adjusted in amplitude and frequency content to obtain response spectra that envelop the design response spectra specified for the site and also exhibits sufficient energy in the frequency range of interest. Conformance with the recommendations of SRP Section 2.5.2 and RG 1.61 ensures that the seismic inputs to the analysis of seismic

3.7.1-22 Revision 4 – December 2014
Category I SSCs are adequately defined so as to form a conservative basis for the design of such SSCs to withstand seismic loadings. The CSDRS used in the certified design of seismic Category I SSCs meet the requirements of Appendix S to 10 CFR Part 50 by either: (1) demonstrating that the CSDRS meet or exceed the site-specific FIRS reviewed under this SRP Section and meet or exceed the minimum required response spectrum specified in 10 CFR Part 50, Appendix S, or (2) by showing that the design resulting from application of the CSDRS is still adequate to resist design demands resulting from the analysis conducted using the site-specific FIRS. The design response spectra used in a non-standard plant for design of seismic Category I SSCs meet the requirements of Appendix S to 10 CFR Part 50, since they meet or exceed the site-specific FIRS reviewed under this SRP Section and meet or exceed the minimum required response spectrum specified in Appendix S to 10 CFR Part 50. The design response spectra used in these seismic analyses include definition of the appropriate spectra at the foundation (FIRS). In addition, the definition of PBSRS is included to ensure that the deterministic soil profiles used for SSI analyses meet the performance goal. The FIRS together with the deterministic soil profiles form the design basis for the seismic analysis of the facilities. For DC and COL reviews, the findings should also summarize the staff’s evaluation of requirements and restrictions (e.g., interface requirements and site parameters) and COL action items relevant to this SRP section. In addition, to the extent that the review is not discussed in other SER sections, the findings should summarize the staff's evaluation of the ITAAC, including design acceptance criteria, as applicable. V. IMPLEMENTATION The staff uses this SRP section in performing safety evaluations of DC applications and license applications submitted by applicants pursuant to 10 CFR Part 50 or 10 CFR Part 52. The staff uses the method described herein to evaluate conformance with the Commission's regulations. The application shall contain an evaluation of the standard plant design against the SRP revision in effect 6 months before the docket date of the application. The application shall identify and describe all differences between this SRP section and the design features, analytical techniques, and procedural measures proposed for the facility, and discuss how the proposed alternative provides an acceptable method of complying with the regulations that underlie the SRP acceptance criteria. VI. REFERENCES 1. 10 CFR Part 50, “Domestic Licensing of Production and Utilization Facilities.”
2. 10 CFR Part 50, Appendix A, General Design Criterion 2, “Design Bases for Protection
Against Natural Phenomena.”

3.7.1-23 Revision 4 – December 2014
3. 10 CFR Part 50, Appendix S, “Earthquake Engineering Criteria for Nuclear Power Plants.”
4. 10 CFR Part 52, ““Licenses, Certifications, and Approvals for Nuclear Power Plants.” 5. Houston, T. W., Mertz, G. E., Costantino, M. C., and Costantino, C. J., “Investigation of
the Impact of Seed Record Selection on Structural Response.” Proceedings of the 2010 ASME PVP Conference, Division K, Paper 25919, Bellevue Washington, July 18-22, 2010.
6. ISG-01, DC/COL-ISG-01, “Seismic Issues Associated with High Frequency Ground
Motion in Design Certification and Combined License Applications.” 7. ISG-017, DC/COL-ISG-17, “Ensuring Hazard-Consistent Seismic Input for Site
Response and Soil Structure Interaction Analyses.’
8. ISG-020, DC/COL-ISG-020, “Seismic Margin Analysis for New Reactors Based on Probabilistic Risk Assessment.”
9. NUREG-0933, “Resolution of Generic Safety Issues,” December 2011.
10. NUREG/CR-5347, “Recommendations for Resolution of Public Comments, Seismic Design Criteria,” June 1989.
11. NUREG/CR-6728, “Technical Basis for Revision of Regulatory Guidance on Design
Ground Motions: Hazard- and Risk-consistent Ground Motion Spectra Guidelines,” October 2001.
12. PEER Report 2012/01, “Spectral Damping Scaling Factors for Shallow Crustal Earthquakes in Active Tectonic Regions,” Pacific Earthquake Engineering Research Center Headquarters at the University of California, Berkeley, July 2012.
13. RG 1.60, “Design Response Spectra for Seismic Design of Nuclear Power Plants.”
14. RG 1.61, “Damping Values for Seismic Design of Nuclear Power Plants.”
15. RG 1.70, “Standard Format and Content of Safety Analysis Reports for Nuclear Power Plants.”
16. RG 1.206, “Combined License Applications for Nuclear Power Plants (LWR Edition).”
17. RG 1.208, “A Performance-Based Approach to Define the Site-Specific Earthquake
Ground Motion.”

3.7.1-24 Revision 4 – December 2014
PAPERWORK REDUCTION ACT STATEMENT
The information collections contained in the Standard Review Plan are covered by the requirements of 10 CFR Part 50 and 10 CFR Part 52, and were approved by the Office of Management and Budget, approval number 3150-0011 and 3150-0151.
PUBLIC PROTECTION NOTIFICATION The NRC may not conduct or sponsor, and a person is not required to respond to, a request for information or an information collection requirement unless the requesting document displays a currently valid OMB control number.

3.7.1-25 Revision 4 – December 2014
APPENDIX A TO SRP SECTION 3.7.1
GUIDANCE ON MINIMUM POWER SPECTRAL DENSITY FOR RG 1.60 DESIGN SPECTRA For a RG 1.60 horizontal response spectrum anchored to 1.0 g, the following guidance for developing minimum PSD can be used. For other peak accelerations, this PSD should be scaled by the square of the peak acceleration. The one-sided PSD is related to the Fourier amplitude | | of the time history by the equation
= | |
...........................................................(1)
In which is the strong motion duration over which is evaluated; represents the circular frequency (in rad/s) and is defined as: 2 , where is the natural frequency (in Hz). The duration represents the duration of near maximum and nearly stationary power of an acceleration time history record. Additional guidance on estimation of for artificial time history or actual earthquake time history is provided in Appendix B of NUREG/CR-5347. The average one-sided PSD defined by Equation (1) should exceed 80 percent of the target PSD as defined by Equation (2) for between 0.3 Hz and 24 Hz.
Less than 2.5 Hz
= 0.419 m 2/sec 3 /2.5 Hz .
2.5 Hz to 9.0 Hz
= 0.419 m 2/sec 3 2.5 Hz/ . ..................................................................(2)
9.0 Hz to 16.0 Hz
= 418 cm 2/sec 3 9.0 Hz/
Greater than 16 Hz
= 74.2 cm 2/sec 3 16.0 Hz/
At any frequency (where, /2 ), the average PSD is computed over a frequency band width of ±20%, centered on the frequency (e.g., 4 Hz to 6 Hz band width for = 5 Hz).

3.7.1-26 Revision 4 – December 2014
The power above 24 Hz for the target PSD is so low as to be inconsequential so that checks above 24 Hz are unnecessary; however, note that the response spectrum calculations are performed beyond 24 Hz as governed by RG 1.60 definitions. Similarly, power below 0.3 Hz has no influence on stiff nuclear plant facilities, so that checks below 0.3 Hz are unnecessary. This minimum check is set at 80 percent of the target PSD so as to be sufficiently high to prevent a deficiency of power over any broad frequency band, but not so high that it introduces additional conservatism over that already embodied in the RG 1.60 response spectrum. REFERENCES 1. NUREG/CR-3509, “Power Spectral Density Functions Compatible with NRC Regulatory
Guide 1.60 Response Spectra,” June 1988.
2. NUREG/CR-5347, “Recommendations for Resolution of Public Comments on USI A--0, Seismic Design Criteria,” June 1989.
3. RG 1.60, “Design Response Spectra for Seismic Design of Nuclear Power Plants.”

3.7.1-27 Revision 4 – December 2014
APPENDIX B TO SRP SECTION 3.7.1
GUIDANCE ON MINIMUM POWER SPECTRAL DENSITY FOR NUREG/CR-6728 BASED DESIGN SPECTRA OR OTHER SPECTRA
While Appendix A to SRP Section 3.7.1 provides guidance on the minimum PSD for a RG 1.60 horizontal response spectrum, this appendix presents guidance on developing minimum PSD for a response spectrum with a shape consistent with the magnitude and distance bins in NUREG/CR-6728, as well as guidance for other spectral shapes. The one-sided PSD for an acceleration time history , is related to its Fourier amplitude | | by the following equation:
2| |2 (1)
In which is the strong motion duration over which is evaluated; represents the circular frequency (in rad/s) and is defined as: 2 , where is the natural frequency (in Hz). The duration represents the duration of near maximum and nearly stationary power of an acceleration time history record. Additional guidance on estimating for artificial time history or actual earthquake time history is provided in Appendix B of NUREG/CR-5347. Fourier amplitude | | in Equation (1) (also for Appendix A) is defined at each circular frequency as:
| | Δ (2)
where, is the strong motion portion of the acceleration time history (after proper tapering at both ends), Δ , 0, 1, … 1, and 0, 1, … /2. For /2 1, represents the negative frequencies and does not appear in the one-sided PSD calculation. At any frequency (where, /2 ), the average one-sided PSD is computed over a frequency band width of ±20%, centered on the frequency (e.g., 4 Hz to 6 Hz band width for = 5 Hz). In NUREG/CR-6728, the horizontal design response spectra (RS) for rock site conditions appropriate for the Central and Eastern United States (CEUS) are defined as a function of the earthquake moment magnitude M and the fault distance R (in km) by the following equation:
ln cosh exp exp / (3)

3.7.1-28 Revision 4 – December 2014
where SA and PGA represent the spectral amplitude and peak ground acceleration, respectively, and the parameters C1 through C9 are defined as (for the single corner frequency model):
0.88657 exp 10.411 2.5099 7.4408 1.5220 0.088588 0.0073069 ln 0.12639 1 0.34965 0.31162 0.0019646 3.7841 0.89019 0.39806 0.058832
Similarly, the horizontal design spectra for rock site conditions appropriate for the Western Unites States (WUS) are defined as a function of the earthquake moment magnitude M and the fault distance R (in km) by the following equation:
ln cosh exp (4)
where the parameters C1 through C6 are defined as:
1.8197 0.30163 0.47498 0.034356 0.0057204ln 1 12.650 2.4796 0.14732 0.034605 ln 0.040762 1 0.25746 0.29784 0.010723 0.0000133
For each magnitude-distance bin in the NUREG/CR-6728 database, a bin representative design response spectrum is defined in this appendix by Equations (3) or (4) with the moment magnitude M and fault distance R equal to the midpoint bin values. For example, for bin M6-7 D010-050, the midpoint bin values are M=6.5 and R=30 km. For a NUREG/CR-6728 bin representative horizontal response spectrum as defined above and anchored to 1.0 g, the following guidance on developing minimum PSD can be used in conjunction with the target PSD tabulated in Tables 1 and 2 of Appendix B. For other peak accelerations, the target PSD in Tables 1 and 2 of Appendix B should be scaled by the square of the peak acceleration. For response spectrum shapes different from the NUREG/CR-6728 bin representative shapes (and different from RG 1.60 horizontal design spectra), the target PSD may be developed based on the guidance in Section B.2 of this appendix and are reviewed and accepted by the NRC staff on a case-by-case basis.

3.7.1-29 Revision 4 – December 2014
The averaged one-sided PSD defined by Equation (1) should exceed 70 percent of the target PSD in Tables 1 and 2 or developed using the guidelines described in this appendix. When the target PSD in Tables 1 and 2 are used, linear interpolation of the data should be performed in the log-log scale to determine PSD values for frequencies other than the tabulated frequencies. The minimum check is set at 70 percent of the target PSD so as to be sufficiently high to prevent a deficiency of power over any broad frequency band, but not so high that it introduces additional conservatism over that already embodied in the specified design response spectrum. The use of 70 percent in Appendix B is comparable to the effect of the 80 percent criterion in Appendix A, because the response spectra compatible with the target PSD in Tables 1 and 2 of Appendix B match more closely to the design response spectra (Equations (3) and (4)) than do the response spectra compatible with the target PSD in Appendix A, which were generally lower than the design response spectra based on RG 1.60. In general, power below 0.3 Hz has no influence on stiff nuclear plant structures, so that checks below 0.3 Hz are unnecessary. The upper bound frequency (cutoff frequency) should be consistent with the design response spectrum.

3.7.1-30 Revision 4 – December 2014
Table 1 – Horizontal Target PSD for CEUS Rock Sites (×10-3 m2/s3)
Frequency (Hz)
M 5-6 M 6-7 M 7+
0-50 km
50-100 km
0-10 km
10-50 km
50-100 km
100-200 km
0-10 km
10-50 km
50-100 km
100-200km
0.12 0.001 0.66 1.14 0.95 1.93 4.77 9.26 7.68 18.95
0.15 0.014 0.021 1.01 1.65 1.73 2.73 7.39 12.34 12.94 24.05
0.19 0.077 0.10 1.61 2.49 3.48 4.01 10.92 15.88 20.41 31.26
0.24 0.23 0.30 2.83 4.34 4.95 5.97 15.76 20.80 31.58 39.95
0.30 0.48 0.58 4.80 6.58 8.42 8.76 19.55 27.10 33.57 41.39
0.37 0.86 1.04 7.01 8.03 11.57 11.57 27.83 34.55 47.16 54.62
0.46 1.48 1.67 9.86 12.14 15.58 14.74 34.72 47.01 56.42 63.05
0.58 2.73 2.88 14.14 15.56 19.05 20.05 46.53 55.40 62.90 69.53
0.72 3.46 4.18 18.84 20.60 24.20 25.99 48.63 61.05 68.64 81.44
0.90 5.65 6.14 22.49 25.98 27.78 31.93 56.20 68.92 74.30 87.68
1.13 8.25 8.78 28.77 31.14 36.31 38.49 59.64 71.64 81.34 85.52
1.41 10.34 13.10 31.40 35.99 40.41 43.09 62.46 75.11 76.48 84.61
1.76 13.87 15.10 34.29 38.25 43.02 50.25 62.29 71.23 78.79 89.74
2.20 15.35 18.68 34.05 41.26 42.64 50.49 58.66 67.58 75.49 82.68
2.75 18.36 20.72 35.25 40.12 45.65 51.56 55.01 60.20 68.46 77.70
3.44 19.76 23.38 33.45 38.60 43.92 49.74 50.80 55.17 64.06 71.89
4.29 21.36 24.50 31.64 36.26 40.24 47.31 44.20 49.06 54.53 62.36
5.37 22.70 26.64 33.04 35.67 39.27 45.30 38.67 43.75 50.93 55.75
6.71 23.91 27.31 29.46 33.57 37.70 42.29 36.44 42.00 43.49 49.83
8.39 25.21 27.57 29.42 31.91 35.50 37.93 35.37 36.33 38.28 43.08
10.49 25.74 28.15 28.81 30.87 32.70 35.26 31.31 33.74 35.08 37.34
13.11 25.59 26.75 27.31 28.04 29.55 29.96 28.85 29.18 29.06 30.57
16.38 23.82 24.73 25.18 24.77 25.65 25.70 24.67 25.02 25.59 26.81
20.48 21.15 21.26 21.10 20.95 21.81 20.97 21.30 21.16 20.88 20.59
25.60 17.31 17.57 17.73 17.50 17.52 16.82 17.62 17.13 16.71 16.50
32.00 14.55 13.97 14.06 14.17 13.59 13.72 13.48 13.10 13.37 13.20
40.00 11.32 11.43 11.36 10.71 10.60 10.83 10.47 10.82 10.23 10.57
50.00 8.13 8.05 7.98 7.98 7.54 7.64 7.47 7.34 7.43 7.08
62.50 4.59 4.61 4.50 4.06 4.35 3.99 4.10 4.00 4.01 3.77
78.13 1.46 1.39 1.28 1.34 1.26 1.11 0.98 1.04 0.92 0.83
97.66 0.25 0.28 0.22 0.069 0.14 0.13 0.14 0.088 0.090 0.048

3.7.1-31 Revision 4 – December 2014
Table 2 - Horizontal Target PSD for Western US Rock Sites (×10-3 m2/s3)
Frequency (Hz)
M 5-6 M 6-7 M 7+
0-50 km
50-100 km
0-10 km
10-50 km
50-100 km
100-200 km
0-10 km
10-50 km
50-100 km
100-200 km
0.12 0.011 0.036 1.62 2.60 7.03 13.91 10.39 27.21 41.16 84.42
0.15 0.091 0.29 2.98 5.32 10.26 18.82 15.42 34.46 57.15 113.14
0.19 0.52 0.97 5.02 9.12 15.13 27.98 24.62 42.32 80.09 142.53
0.24 1.26 2.08 10.32 15.13 24.05 40.44 36.80 65.03 108.97 178.48
0.30 2.73 4.03 18.05 21.31 36.89 61.09 51.89 88.08 142.38 202.52
0.37 4.45 6.67 24.34 35.26 55.35 73.73 66.45 108.84 172.28 238.08
0.46 7.30 10.17 36.53 49.28 69.60 90.03 88.85 130.01 190.94 269.65
0.58 12.75 16.86 45.61 63.48 83.75 116.47 121.27 156.99 224.31 296.91
0.72 18.93 24.71 63.85 82.15 102.17 130.81 134.19 182.10 254.66 367.93
0.90 28.68 36.36 77.89 105.84 126.30 156.03 168.53 221.88 294.40 343.14
1.13 39.34 48.86 100.63 127.33 149.64 188.77 185.48 261.31 283.18 348.70
1.41 59.43 65.96 122.18 148.15 164.28 204.65 198.30 248.06 290.78 349.42
1.76 75.52 83.58 137.06 171.39 180.50 222.19 225.85 258.78 293.88 346.20
2.20 92.43 102.53 158.13 188.43 193.80 219.11 219.67 261.12 278.94 307.60
2.75 105.40 113.84 158.75 183.68 192.08 199.43 210.84 219.22 248.01 254.38
3.44 115.92 118.97 146.51 155.31 166.61 177.36 181.93 180.92 196.89 200.95
4.29 111.71 118.38 130.04 131.13 138.05 138.47 133.54 139.00 135.38 148.16
5.37 89.70 93.98 95.28 96.46 96.80 97.77 92.25 89.51 93.30 87.18
6.71 69.26 69.94 67.56 65.69 62.30 63.24 57.72 57.31 55.97 51.61
8.39 46.51 45.71 40.22 39.74 39.06 37.26 33.71 30.94 30.31 27.09
10.49 29.62 27.60 23.38 21.57 21.21 19.78 17.89 16.00 15.18 13.39
13.11 15.77 15.40 12.18 11.30 10.62 10.00 8.64 8.07 6.90 6.08
16.38 8.45 8.02 6.39 5.69 5.11 4.91 4.51 3.86 3.13 2.57
20.48 4.37 4.30 3.16 2.82 2.54 2.32 1.90 1.65 1.09 0.94
25.60 2.39 2.21 1.63 1.44 1.27 1.10 0.96 0.67 0.45 0.40
32.00 1.37 1.25 0.90 0.76 0.66 0.56 0.54 0.39 0.23 0.20
40.00 0.85 0.80 0.57 0.47 0.41 0.33 0.33 0.24 0.16 0.12
50.00 0.60 0.56 0.37 0.36 0.30 0.24 0.25 0.19 0.11 0.090
62.50 0.51 0.48 0.32 0.31 0.24 0.20 0.23 0.16 0.10 0.078
78.13 0.50 0.46 0.32 0.29 0.24 0.20 0.23 0.16 0.10 0.077
97.66 0.50 0.46 0.32 0.29 0.24 0.20 0.23 0.16 0.10 0.077

3.7.1-32 Revision 4 – December 2014
B.1 Development of Target PSD for Bin Representative Response Spectra (RS) To develop each target PSD in Tables 1 and 2 for the NUREG/CR-6728 bin representative design response spectra (RSrep), as defined by Equations (2) and (3), an iterative frequency-by-frequency scaling approach was applied. The initial PSD value was taken as the bin average PSD for the NUREG/CR-6728 time history database (Tables 3 through 6 of Appendix B show the bin average PSD and Tables 7 through 10 show the bin average RS). Ten iterations were found to be adequate to produce a target PSD compatible with the bin representative RSrep. The iterative process consists of the following four steps: (1) Generate M number of synthetic time histories from the current PSD function, where M
took a value of 10, 20, … 100 for iteration 1, 2, …10, respectively. To generate synthetic time histories from a PSD function, (a) Fourier spectra were constructed by utilizing random phase angles and Fourier magnitudes computed following Equation (1), and (b) time histories were then generated through inverse FFT. The synthetic time histories were assumed to have 4096 data points and a time step of 0.005 s. Since the synthetic time histories are stationary at this point (the envelope function is applied in step (2) below), the entire duration of 20.48 s was used to generate the Fourier spectrum using Equation (1). The PSD function was linearly interpolated in the log-log scale to fill all frequency points for the Fourier coefficients. This method produces the same acceleration time histories as the method in Appendix B of NUREG/CR-5347.
(2) Apply a trapezoidal envelope function to the synthetic time histories (rise time = 1.4 s,
strong motion duration = 10.24 s, and decay time = 7.0 s), which is Function B in Appendix B of NUREG/CR-5347.
(3) Calculate the 5 percent damped absolute acceleration response spectra for the synthetic
time histories and obtain the arithmetic average RSavg. (4) Multiply the PSD frequency-by-frequency by (RSrep/RSavg)
2, and use this adjusted PSD in the next iteration.
Convergence on the bin representative RSrep can be quickly achieved in the dominant frequency range of interest to structural response. However, in some cases, at the very low and/or very high frequencies, successive iterations could lead to increase or decrease of the PSD values without noticeable improvement to the RSrep match. This behavior may be due to the inadmissibility of the bin representative RSrep; they were developed by statistically fitting to the bin average RS shapes and may not necessarily be physical at these extreme frequencies. Therefore, in those cases, the PSD values at a few very low frequencies (close to 0.1 Hz) or very high frequencies (close to 100 Hz) were manually adjusted. The tabulated target PSD’s in Tables 1 and 2 are values after the manual adjustment. The converged target PSD’s were smoothed using cubic splines at the frequency points as shown in the first column of Tables 1 and 2, and the tabulated target PSD’s represent the smoothed PSD’s.

3.7.1-33 Revision 4 – December 2014
B.2 Development of Target PSD for Other Response Spectral Shapes For a design response spectrum different from the NUREG/CR-6728 bin representative RSrep, the iterative frequency-by-frequency scaling procedure described in Section B.1 can still be applied to generate the target PSD for a given design RS. The development of the target PSD in these cases is reviewed and accepted on a case-by-case basis. It is noted that a proper choice of the initial PSD can accelerate the convergence process; for this purpose, it is recommended to use the following guidance to select the initial PSD: (1) For a NUREG/CR-6728 design RS other than the bin representative RS (i.e., the
moment magnitude and the fault distance take values other than bin midpoint values), the corresponding target PSD in Table 1 or 2 can be used;
(2) For a RS enveloping several NUREG/CR-6728 bin representative RS, the envelope of
the corresponding target PSD (with proper scaling using PGA) can be used; (3) For other RS (e.g., the vertical NUREG/CR-6728 RS or site specific RS not developed
as the envelope of bin representative RS), an initial PSD can be determined by enveloping several tabulated target PSD, provided the envelope of the corresponding RS can reasonably resemble the subject RS. Note that the initial PSD does not need to be very close to the target PSD obtained after convergence; a proper initial PSD only speeds up the convergence process.

3.7.1-34 Revision 4 – December 2014
Table 3 – Horizontal Bin Average PSD for CEUS Rock Sites (×10-3 m2/s3)
Frequency (Hz)
M 5-6 M 6-7 M 7+
0-50 km
50-100 km
0-10 km
10-50 km
50-100 km
100-200 km
0-10 km
10-50 km
50-100 km
100-200km
0.12 0.29 0.004 1.27 0.14 0.028 0.36 4.83 2.03 0.92 1.48
0.15 0.35 0.006 1.65 0.22 0.043 0.52 8.68 3.01 1.45 2.47
0.19 0.40 0.008 2.49 0.41 0.072 0.79 14.17 4.66 2.63 4.52
0.24 0.50 0.017 3.46 0.74 0.12 1.31 17.82 6.75 3.67 7.68
0.30 0.62 0.029 4.09 1.35 0.24 2.20 21.57 7.40 5.92 11.62
0.37 0.89 0.054 4.70 2.53 0.51 3.21 23.61 8.35 7.23 16.43
0.46 1.40 0.093 6.56 3.91 1.09 5.77 25.27 12.73 7.70 28.68
0.58 2.41 0.22 10.82 6.00 2.32 10.34 33.00 16.93 10.92 35.96
0.72 3.69 0.56 13.72 7.80 3.62 13.08 33.46 16.48 12.26 38.11
0.90 4.50 1.29 18.26 9.55 5.97 15.25 32.46 13.25 13.25 31.62
1.13 6.26 2.65 28.08 8.82 11.26 18.52 32.59 12.93 16.67 28.52
1.41 8.76 4.24 33.83 13.28 23.17 26.99 36.67 16.74 21.29 32.03
1.76 12.19 6.26 36.53 15.26 31.78 32.41 31.64 19.74 21.59 26.13
2.20 21.20 7.29 31.06 14.20 34.01 36.00 21.37 19.26 17.54 19.43
2.75 29.74 10.00 29.40 13.96 34.43 39.38 19.84 22.38 16.93 18.29
3.44 30.01 16.15 26.15 13.25 33.45 40.01 19.39 18.93 20.76 15.21
4.29 29.10 27.35 20.38 15.14 35.84 39.67 16.07 17.00 21.31 12.34
5.37 40.68 32.84 22.11 18.01 36.88 39.59 15.09 19.32 19.75 11.66
6.71 33.51 30.88 18.84 19.99 30.37 30.64 15.47 17.82 17.93 12.40
8.39 21.72 29.09 13.12 16.40 20.76 21.98 12.88 13.82 15.25 10.39
10.49 14.81 26.09 10.81 13.12 13.26 15.69 12.04 9.20 11.33 8.19
13.11 12.39 23.69 10.66 12.30 10.17 11.86 12.33 8.38 9.25 8.16
16.38 13.89 19.49 9.00 11.42 9.84 10.78 10.72 8.74 9.06 8.03
20.48 12.54 13.94 6.42 9.55 8.87 9.14 8.54 7.59 7.34 6.30
25.60 10.02 6.58 4.23 7.70 7.62 6.68 5.83 5.46 5.37 4.80
32.00 8.99 3.35 2.98 6.55 7.34 5.50 3.85 4.51 4.64 4.26
40.00 6.73 0.83 1.94 4.79 6.31 4.38 2.11 3.36 3.93 3.60
50.00 3.40 0.31 0.71 2.30 3.26 2.15 0.76 1.71 2.26 2.17
62.50 0.89 0.16 0.13 0.71 1.27 0.75 0.13 0.58 0.83 0.85
78.13 0.15 0.056 0.018 0.18 0.46 0.22 0.015 0.19 0.27 0.27
97.66 0.018 0.003 0.010 0.14 0.11 0.001 0.059 0.10 0.073

3.7.1-35 Revision 4 – December 2014
Table 4 – Horizontal Bin Average PSD for CEUS Soil Sites (×10-3 m2/s3)
Frequency
(Hz)
M 5-6 M 6-7 M 7+
0-50 km
50-100 km
0-10 km
10-50 km
50-100 km
100-200 km
0-10 km
10-50 km
50-100 km
100-200km
0.12 0.47 0.13 24.10 0.67 0.29 0.14 58.13 13.24 5.25 1.81
0.15 0.54 0.13 35.59 0.83 0.38 0.20 100.59 19.46 11.33 3.56
0.19 0.71 0.14 54.41 1.18 0.60 0.33 141.53 29.34 19.02 8.45
0.24 0.92 0.15 73.83 1.35 0.79 0.46 158.47 43.37 20.78 16.11
0.30 1.18 0.21 102.74 2.33 1.93 0.93 162.91 62.81 27.14 21.01
0.37 1.55 0.41 141.32 4.42 4.39 2.30 199.00 73.94 45.49 26.95
0.46 2.36 0.69 160.64 6.61 7.17 4.59 212.60 93.40 72.00 40.24
0.58 3.78 1.27 154.05 12.01 9.02 8.07 232.39 156.39 122.74 50.52
0.72 5.90 2.02 194.19 19.30 15.65 14.61 240.37 199.06 172.60 72.00
0.90 11.52 3.59 224.78 29.42 32.33 25.36 262.77 229.19 202.97 115.59
1.13 25.22 8.45 230.37 54.30 56.38 52.08 289.45 301.99 236.88 141.11
1.41 50.68 16.91 235.67 78.67 86.12 90.95 251.90 294.83 263.90 130.16
1.76 69.50 25.01 208.75 95.70 108.51 106.53 190.52 224.94 181.17 98.69
2.20 64.34 47.78 176.61 120.63 128.96 88.67 159.27 180.68 112.75 66.46
2.75 80.20 87.75 146.97 127.13 104.08 91.40 112.55 136.87 85.14 59.53
3.44 85.23 100.35 133.79 111.14 66.98 76.28 82.69 98.84 59.91 52.06
4.29 88.84 90.26 108.70 108.46 60.86 62.10 54.84 70.98 46.58 46.95
5.37 94.64 75.60 64.96 91.93 50.91 50.02 31.48 37.41 29.46 39.14
6.71 80.44 55.30 40.88 58.96 31.71 31.58 19.35 20.66 19.82 24.41
8.39 62.11 45.04 23.32 37.86 20.80 22.30 10.09 13.67 13.76 15.47
10.49 42.54 34.02 10.37 21.82 14.91 15.43 4.43 7.67 9.58 10.45
13.11 21.76 19.01 5.11 10.62 9.72 10.08 1.95 4.18 6.19 6.68
16.38 10.65 10.55 2.77 5.42 6.06 6.81 0.83 2.27 3.75 4.18
20.48 5.16 5.74 1.29 2.80 3.45 4.06 0.30 1.22 2.22 2.29
25.60 2.37 2.65 0.54 1.26 2.06 2.11 0.082 0.62 1.17 1.14
32.00 0.85 1.11 0.24 0.66 1.13 1.08 0.017 0.33 0.59 0.54
40.00 0.24 0.44 0.082 0.40 0.62 0.54 0.003 0.19 0.34 0.27
50.00 0.057 0.16 0.026 0.21 0.35 0.25 0.001 0.11 0.21 0.14
62.50 0.015 0.061 0.009 0.12 0.21 0.12 0.060 0.13 0.066
78.13 0.004 0.026 0.004 0.072 0.14 0.062 0.035 0.093 0.035
97.66 0.001 0.009 0.002 0.022 0.068 0.069 0.016 0.068 0.030

3.7.1-36 Revision 4 – December 2014
Table 5 - Horizontal Bin Average PSD for Western US Rock Sites (×10-3 m2/s3)
Frequency (Hz)
M 5-6 M 6-7 M 7+
0-50 km
50-100 km
0-10 km
10-50 km
50-100 km
100-200 km
0-10 km
10-50 km
50-100 km
100-200km
0.12 5.34 0.26 19.26 4.63 0.88 4.36 49.94 19.56 15.75 23.74
0.15 5.77 0.31 19.82 5.99 1.10 5.79 62.82 23.14 18.14 40.83
0.19 6.24 0.40 23.58 8.53 1.74 8.92 77.30 25.72 23.07 73.14
0.24 6.94 0.52 30.66 9.85 2.67 14.72 93.18 26.34 32.28 114.01
0.30 9.33 0.77 35.89 12.92 4.16 21.56 101.53 23.92 44.49 166.64
0.37 12.36 1.15 38.59 16.39 6.24 28.11 108.57 24.87 49.62 193.93
0.46 14.75 1.68 50.12 22.50 8.19 41.47 107.82 35.08 46.02 262.41
0.58 18.36 2.53 77.44 37.27 14.69 65.87 151.07 47.35 63.48 322.30
0.72 28.92 5.11 103.27 56.46 26.96 90.64 190.71 58.33 82.73 378.85
0.90 42.77 12.01 134.78 83.37 48.25 120.30 227.50 70.85 99.80 364.34
1.13 55.94 24.79 217.25 99.21 88.43 149.73 264.19 85.99 141.88 351.00
1.41 65.72 40.02 261.26 137.27 141.15 163.39 266.24 98.44 143.41 291.86
1.76 96.91 54.34 254.95 159.16 195.11 188.23 239.18 112.96 135.72 211.43
2.20 147.57 52.94 222.22 149.38 227.58 202.77 181.65 123.33 122.11 157.62
2.75 207.46 81.55 197.55 141.96 227.39 211.92 141.92 127.26 115.58 121.42
3.44 243.51 105.39 156.80 114.99 202.70 192.41 105.93 105.38 132.19 87.53
4.29 181.17 126.56 92.89 96.90 182.66 143.36 60.19 73.92 110.17 49.56
5.37 170.63 118.07 66.59 75.89 134.19 103.07 34.22 60.05 70.02 23.99
6.71 103.04 68.41 40.06 48.89 66.64 45.20 22.61 35.71 35.41 10.28
8.39 42.20 38.44 19.66 24.16 26.27 16.37 12.66 19.41 18.16 3.52
10.49 18.77 19.78 9.31 10.48 9.11 6.40 5.59 7.74 7.88 1.03
13.11 7.48 8.08 4.05 4.02 2.33 1.93 2.67 3.30 3.16 0.37
16.38 2.51 2.86 1.57 1.26 0.56 0.45 1.11 1.28 0.88 0.11
20.48 0.69 0.82 0.49 0.38 0.13 0.12 0.37 0.51 0.45 0.030
25.60 0.17 0.18 0.048 0.10 0.038 0.024 0.069 0.046 0.011 0.007
32.00 0.035 0.044 0.011 0.021 0.010 0.005 0.018 0.016 0.002 0.002
40.00 0.006 0.009 0.003 0.005 0.005 0.002 0.004 0.006 0.001
50.00 0.001 0.002 0.001 0.001
62.50
78.13
97.66

3.7.1-37 Revision 4 – December 2014
Table 6 - Horizontal Bin Average PSD for Western US Soil Sites (×10-3 m2/s3)
Frequency (Hz)
M 5-6 M 6-7 M 7+
0-50 km
50-100 km
0-10 km
10-50 km
50-100 km
100-200 km
0-10 km
10-50 km
50-100 km
100-200km
0.12 3.46 0.97 63.25 3.65 2.77 2.32 167.95 62.09 32.99 27.11
0.15 4.02 1.01 81.58 5.35 3.33 3.05 220.35 77.75 50.64 35.44
0.19 4.89 1.33 113.06 8.24 4.35 5.04 240.35 92.37 78.28 63.40
0.24 5.55 1.86 149.47 9.66 5.48 8.17 244.32 121.75 82.10 98.24
0.30 7.82 2.50 210.85 10.82 12.53 13.70 263.47 153.14 85.99 141.16
0.37 11.03 3.21 257.74 15.43 25.78 22.68 319.90 164.73 165.22 179.40
0.46 14.80 4.81 276.50 20.41 39.23 39.54 346.60 193.37 270.84 236.50
0.58 20.90 12.09 243.59 36.13 51.51 62.45 323.45 284.68 407.42 300.99
0.72 28.38 21.28 269.68 56.53 74.68 101.32 324.60 323.25 463.50 340.78
0.90 49.73 27.48 309.37 70.16 116.62 148.45 340.55 384.31 489.71 444.15
1.13 89.82 46.84 311.57 100.26 185.88 220.90 334.61 460.99 489.05 422.95
1.41 147.65 88.19 323.60 137.83 218.18 292.94 294.47 413.49 426.22 287.97
1.76 188.00 132.11 281.45 181.46 247.19 317.76 240.99 315.90 284.80 205.64
2.20 177.54 212.95 230.91 221.95 293.99 237.48 198.79 257.99 179.55 136.21
2.75 187.23 292.94 206.71 222.37 202.90 177.13 137.35 205.42 118.53 95.09
3.44 178.03 266.10 171.91 188.12 110.60 133.29 92.05 132.37 70.22 69.62
4.29 158.85 165.70 121.19 153.58 74.01 78.80 56.27 76.39 37.14 46.76
5.37 135.92 105.08 69.94 105.78 44.38 42.18 28.77 41.37 16.19 26.27
6.71 98.09 60.78 40.88 62.23 19.37 18.72 15.99 21.01 7.37 10.76
8.39 58.51 32.31 21.44 30.97 7.60 7.44 7.69 10.76 2.86 3.23
10.49 29.26 13.13 7.97 13.93 2.52 2.41 3.26 4.80 0.95 0.98
13.11 11.95 3.50 3.05 4.76 0.73 0.79 1.41 2.06 0.26 0.22
16.38 3.62 0.75 1.09 1.38 0.22 0.20 0.56 0.67 0.050 0.059
20.48 0.89 0.17 0.36 0.41 0.076 0.047 0.20 0.20 0.012 0.019
25.60 0.18 0.026 0.073 0.054 0.029 0.010 0.027 0.030 0.002 0.005
32.00 0.052 0.005 0.017 0.015 0.010 0.002 0.007 0.007 32.99 0.002
40.00 0.010 0.001 0.004 0.006 0.005 0.001 0.002 0.003 50.64 0.001
50.00 0.002 0.001 0.001 0.001
62.50
78.13
97.66

3.7.1-38 Revision 4 – December 2014
Table 7 – Horizontal Bin Average RS for CEUS Rock Sites (g)
Frequency (Hz)
M 5-6 M 6-7 M 7+
0-50 km
50-100 km
0-10 km
10-50 km
50-100 km
100-200 km
0-10 km
10-50 km
50-100 km
100-200km
0.12 0.002 0.002 0.006 0.007 0.005 0.012 0.026 0.035 0.040 0.042
0.15 0.004 0.003 0.010 0.011 0.009 0.021 0.044 0.058 0.059 0.066
0.19 0.005 0.004 0.017 0.018 0.014 0.032 0.074 0.078 0.092 0.11
0.24 0.008 0.007 0.030 0.030 0.024 0.050 0.12 0.10 0.12 0.16
0.30 0.013 0.010 0.047 0.044 0.036 0.073 0.16 0.14 0.14 0.23
0.37 0.019 0.015 0.065 0.067 0.053 0.10 0.21 0.16 0.18 0.28
0.46 0.029 0.024 0.090 0.10 0.075 0.14 0.24 0.21 0.22 0.42
0.58 0.046 0.037 0.15 0.14 0.12 0.20 0.33 0.27 0.27 0.52
0.72 0.073 0.060 0.21 0.21 0.17 0.25 0.42 0.32 0.34 0.62
0.90 0.11 0.10 0.28 0.27 0.25 0.34 0.49 0.37 0.39 0.67
1.13 0.16 0.16 0.39 0.30 0.36 0.42 0.59 0.43 0.49 0.75
1.41 0.26 0.24 0.52 0.41 0.56 0.59 0.67 0.52 0.63 0.91
1.76 0.37 0.33 0.63 0.50 0.78 0.78 0.74 0.66 0.73 0.92
2.20 0.52 0.43 0.72 0.60 0.88 0.88 0.75 0.78 0.74 0.90
2.75 0.73 0.61 0.82 0.69 1.07 1.11 0.83 1.04 0.91 1.05
3.44 0.93 0.85 0.88 0.79 1.23 1.28 0.99 1.13 1.09 1.02
4.29 1.05 1.28 0.92 1.02 1.48 1.43 1.05 1.24 1.27 1.10
5.37 1.40 1.61 1.16 1.22 1.69 1.74 1.12 1.48 1.44 1.13
6.71 1.52 1.73 1.25 1.51 1.70 1.68 1.32 1.56 1.54 1.24
8.39 1.50 1.98 1.29 1.59 1.66 1.67 1.38 1.71 1.62 1.28
10.49 1.58 2.20 1.38 1.67 1.55 1.63 1.57 1.60 1.71 1.35
13.11 1.54 2.26 1.64 1.81 1.56 1.69 1.92 1.73 1.77 1.59
16.38 1.82 2.32 1.79 2.09 1.75 1.80 2.08 1.94 1.97 1.75
20.48 1.94 2.19 1.84 2.10 1.88 1.91 2.26 2.00 1.99 1.87
25.60 1.97 1.98 1.85 2.14 1.97 1.99 2.20 2.02 2.06 1.89
32.00 2.09 1.81 1.92 2.15 2.12 2.07 2.28 2.17 2.12 1.99
40.00 2.16 1.65 1.82 2.07 2.14 2.06 2.11 2.22 2.12 2.00
50.00 1.94 1.52 1.56 1.90 1.94 1.93 1.78 1.99 1.80 1.68
62.50 1.59 1.36 1.30 1.47 1.50 1.48 1.38 1.58 1.41 1.39
78.13 1.26 1.19 1.16 1.22 1.25 1.24 1.19 1.21 1.21 1.18
97.66 1.10 1.10 1.07 1.09 1.13 1.12 1.08 1.12 1.11 1.09

3.7.1-39 Revision 4 – December 2014
Table 8 – Horizontal Bin Average RS for CEUS Soil Sites (g)
Frequency (Hz)
M 5-6 M 6-7 M 7+
0-50 km
50-100 km
0-10 km
10-50 km
50-100 km
100-200 km
0-10 km
10-50 km
50-100 km
100-200km
0.12 0.004 0.003 0.027 0.010 0.009 0.011 0.11 0.077 0.063 0.041
0.15 0.005 0.004 0.046 0.016 0.015 0.016 0.17 0.13 0.10 0.065
0.19 0.008 0.006 0.079 0.025 0.025 0.025 0.24 0.20 0.16 0.11
0.24 0.011 0.009 0.14 0.040 0.041 0.041 0.32 0.29 0.19 0.18
0.30 0.017 0.014 0.22 0.059 0.064 0.061 0.42 0.39 0.24 0.25
0.37 0.028 0.021 0.32 0.094 0.12 0.094 0.54 0.50 0.38 0.35
0.46 0.044 0.035 0.43 0.14 0.17 0.15 0.66 0.57 0.59 0.44
0.58 0.072 0.064 0.53 0.20 0.25 0.24 0.85 0.77 0.84 0.61
0.72 0.12 0.10 0.72 0.29 0.36 0.35 1.08 1.02 1.15 0.82
0.90 0.19 0.15 0.93 0.42 0.52 0.54 1.33 1.26 1.42 1.13
1.13 0.33 0.25 1.19 0.59 0.76 0.74 1.60 1.61 1.71 1.36
1.41 0.56 0.42 1.41 0.88 0.98 1.12 1.79 1.91 2.06 1.56
1.76 0.72 0.58 1.54 1.06 1.28 1.39 1.86 2.02 2.02 1.58
2.20 0.89 0.86 1.66 1.39 1.71 1.49 1.97 2.05 1.91 1.47
2.75 1.13 1.29 1.83 1.70 1.91 1.82 2.03 2.13 1.92 1.65
3.44 1.36 1.71 2.04 1.84 1.76 1.94 2.09 2.22 1.86 1.79
4.29 1.71 1.89 2.18 2.20 2.01 2.00 2.13 2.20 1.94 1.94
5.37 2.02 2.12 2.06 2.31 2.07 2.14 2.00 1.93 1.77 1.93
6.71 2.18 2.12 1.99 2.26 1.95 2.08 1.81 1.85 1.75 1.74
8.39 2.39 2.21 1.88 2.27 1.84 1.95 1.65 1.70 1.66 1.64
10.49 2.28 2.29 1.64 2.12 1.77 1.99 1.48 1.59 1.61 1.55
13.11 2.13 2.08 1.50 1.77 1.67 1.82 1.37 1.46 1.51 1.49
16.38 1.87 1.88 1.41 1.57 1.65 1.74 1.28 1.42 1.46 1.48
20.48 1.65 1.84 1.30 1.45 1.49 1.62 1.22 1.30 1.36 1.38
25.60 1.48 1.60 1.24 1.31 1.40 1.53 1.18 1.25 1.34 1.35
32.00 1.33 1.45 1.20 1.23 1.28 1.40 1.14 1.18 1.28 1.24
40.00 1.23 1.32 1.15 1.20 1.23 1.33 1.10 1.17 1.22 1.20
50.00 1.18 1.22 1.14 1.16 1.18 1.26 1.08 1.13 1.15 1.18
62.50 1.12 1.15 1.09 1.14 1.12 1.21 1.05 1.08 1.11 1.13
78.13 1.07 1.10 1.06 1.07 1.10 1.13 1.03 1.06 1.07 1.07
97.66 1.05 1.06 1.04 1.06 1.10 1.11 1.01 1.04 1.08 1.10

3.7.1-40 Revision 4 – December 2014
Table 9 - Horizontal Bin Average RS for Western US Rock Sites (g)
Frequency (Hz)
M 5-6 M 6-7 M 7+
0-50 km
50-100 km
0-10 km
10-50 km
50-100 km
100-200 km
0-10 km
10-50 km
50-100 km
100-200km
0.12 0.005 0.005 0.015 0.015 0.012 0.036 0.060 0.066 0.11 0.12
0.15 0.007 0.007 0.025 0.024 0.020 0.060 0.095 0.10 0.14 0.18
0.19 0.011 0.012 0.041 0.038 0.033 0.093 0.15 0.11 0.20 0.27
0.24 0.017 0.018 0.070 0.063 0.054 0.14 0.23 0.14 0.25 0.39
0.30 0.026 0.027 0.11 0.093 0.080 0.20 0.32 0.19 0.30 0.54
0.37 0.039 0.039 0.15 0.14 0.12 0.26 0.39 0.21 0.36 0.66
0.46 0.059 0.061 0.21 0.20 0.16 0.34 0.46 0.29 0.43 0.94
0.58 0.10 0.10 0.34 0.30 0.25 0.48 0.65 0.40 0.55 1.20
0.72 0.15 0.15 0.53 0.44 0.36 0.62 0.88 0.53 0.73 1.49
0.90 0.24 0.25 0.73 0.64 0.56 0.87 1.12 0.69 0.86 1.68
1.13 0.38 0.43 1.01 0.82 0.86 1.08 1.45 0.88 1.14 1.92
1.41 0.55 0.59 1.29 1.08 1.19 1.36 1.63 1.06 1.36 2.11
1.76 0.79 0.81 1.47 1.36 1.57 1.71 1.74 1.33 1.53 2.01
2.20 1.17 0.93 1.83 1.56 1.91 1.99 1.91 1.70 1.64 2.06
2.75 1.54 1.34 1.98 1.72 2.19 2.36 1.96 2.04 1.92 2.16
3.44 2.02 1.77 2.02 1.91 2.51 2.63 2.13 2.22 2.33 2.14
4.29 2.09 2.19 1.91 2.11 2.76 2.67 1.94 2.25 2.49 2.01
5.37 2.52 2.62 1.98 2.18 2.78 2.74 1.80 2.39 2.39 1.78
6.71 2.37 2.38 1.94 2.14 2.36 2.20 1.82 2.22 2.14 1.60
8.39 2.06 2.23 1.76 1.92 1.95 1.83 1.69 2.09 1.94 1.38
10.49 1.89 2.03 1.62 1.73 1.61 1.53 1.59 1.72 1.75 1.23
13.11 1.60 1.78 1.54 1.52 1.36 1.31 1.51 1.52 1.50 1.21
16.38 1.45 1.58 1.39 1.33 1.23 1.17 1.38 1.37 1.33 1.11
20.48 1.31 1.41 1.26 1.20 1.13 1.10 1.30 1.22 1.17 1.06
25.60 1.16 1.28 1.14 1.13 1.09 1.05 1.18 1.11 1.10 1.03
32.00 1.10 1.18 1.10 1.07 1.07 1.03 1.13 1.08 1.06 1.03
40.00 1.06 1.09 1.06 1.05 1.05 1.02 1.08 1.06 1.05 1.02
50.00 1.04 1.04 1.03 1.03 1.02 1.01 1.03 1.03 1.02 1.01
62.50 1.02 1.02 1.02 1.02 1.01 1.01 1.02 1.02 1.02 1.01
78.13 1.01 1.01 1.02 1.01 1.01 1.00 1.01 1.01 1.01 1.00
97.66 1.01 1.01 1.01 1.01 1.01 1.01 1.00 1.01 1.01 1.00

3.7.1-41 Revision 4 – December 2014
Table 10 - Horizontal Bin Average RS for Western US Soil Sites (g)
Frequency (Hz)
M 5-6 M 6-7 M 7+
0-50 km
50-100 km
0-10 km
10-50 km
50-100 km
100-200 km
0-10 km
10-50 km
50-100 km
100-200km
0.12 0.006 0.005 0.044 0.018 0.020 0.027 0.15 0.13 0.12 0.10
0.15 0.009 0.007 0.072 0.030 0.034 0.046 0.22 0.20 0.18 0.16
0.19 0.013 0.011 0.12 0.045 0.056 0.072 0.31 0.27 0.28 0.24
0.24 0.021 0.018 0.20 0.072 0.094 0.11 0.40 0.39 0.32 0.40
0.30 0.033 0.031 0.30 0.11 0.14 0.16 0.51 0.51 0.41 0.53
0.37 0.057 0.051 0.43 0.16 0.25 0.24 0.65 0.65 0.61 0.70
0.46 0.092 0.086 0.55 0.22 0.35 0.35 0.81 0.72 0.91 0.86
0.58 0.14 0.16 0.67 0.33 0.50 0.54 0.98 0.96 1.26 1.14
0.72 0.23 0.26 0.88 0.45 0.67 0.74 1.21 1.21 1.56 1.44
0.90 0.34 0.35 1.10 0.60 0.90 1.07 1.46 1.49 1.87 1.86
1.13 0.53 0.55 1.35 0.82 1.25 1.35 1.70 1.89 2.18 2.11
1.41 0.84 0.83 1.60 1.09 1.47 1.81 1.90 2.08 2.39 2.14
1.76 1.10 1.17 1.82 1.41 1.84 2.16 2.04 2.29 2.35 2.16
2.20 1.39 1.61 1.88 1.78 2.44 2.26 2.13 2.31 2.24 1.97
2.75 1.64 2.18 2.10 2.12 2.41 2.39 2.16 2.41 2.11 2.02
3.44 1.89 2.53 2.23 2.31 2.21 2.43 2.13 2.37 2.01 2.07
4.29 2.15 2.43 2.34 2.51 2.28 2.21 2.11 2.20 1.89 2.02
5.37 2.35 2.44 2.18 2.47 2.17 2.12 1.95 1.98 1.60 1.86
6.71 2.39 2.25 2.06 2.35 1.89 1.83 1.75 1.77 1.51 1.54
8.39 2.35 2.02 1.85 2.15 1.59 1.58 1.58 1.60 1.35 1.32
10.49 2.04 1.81 1.60 1.92 1.42 1.39 1.41 1.43 1.23 1.17
13.11 1.81 1.52 1.40 1.54 1.25 1.22 1.30 1.29 1.14 1.09
16.38 1.50 1.27 1.30 1.33 1.14 1.13 1.22 1.21 1.07 1.05
20.48 1.30 1.17 1.19 1.19 1.07 1.07 1.16 1.11 1.03 1.03
25.60 1.19 1.08 1.12 1.08 1.06 1.05 1.09 1.06 1.02 1.01
32.00 1.12 1.04 1.09 1.05 1.03 1.03 1.06 1.03 1.01 1.01
40.00 1.07 1.03 1.05 1.04 1.02 1.01 1.03 1.03 1.01 1.01
50.00 1.03 1.02 1.03 1.02 1.01 1.01 1.01 1.01 1.00 1.01
62.50 1.02 1.01 1.01 1.02 1.01 1.01 1.01 1.01 1.01 1.01
78.13 1.01 1.00 1.01 1.01 1.01 1.00 1.00 1.00 1.00 1.00
97.66 1.01 1.00 1.00 1.01 1.01 1.01 1.00 1.00 1.00 1.01

3.7.1-42 Revision 4 – December 2014
REFERENCES 1. NUREG/CR-6728, “Technical Basis for Revision of Regulatory Guidance on Design
Ground Motions: Hazard- and Risk-consistent Ground Motion Spectra Guidelines,” October 2001.
2. NUREG/CR-5347, “Recommendations for Resolution of Public Comments on USI A-40,
Seismic Design Criteria,” June 1989. 3. NUREG/CR-3509, “Power Spectral Density Functions Compatible with NRC Regulatory
Guide 1.60 Response Spectra,” June 1988. 4. RG 1.60, Revision 1, “Design Response Spectra for Seismic Design of Nuclear Power
Plants,” 1971. 5. Wirsching, Paez, Ortiz, “Random Vibrations: Theory and Practice,” John Wiley and
Sons, Inc., 1995. 6. Mario Paz, “Structural Dynamics: Theory and Computation” Van Nostrand Reinhold
Company, 3nd Edition, 1989. 7. Trifunic, M. D. and Brady A. G, “A Study on the Duration of Strong. Earthquake
Ground Motion,” Bulletin, Seismological Society of America, Volume. 65, Number 3, Page 581-626, June 1975.

3.7.1-43 Revision 4 – December 2014
SRP Section 3.7.1 Description of Changes
Section 3.7.1 “Seismic Design Parameters”
This SRP section affirms the technical accuracy and adequacy of the guidance previously provided in Revision 3, dated March 2007 of this SRP. See Agencywide Documents Access and Management System (ADAMS) Accession No. ML070640306. I. AREAS OF REVIEW 1. Revised the designation of the primary review responsibility to be the organization
responsible for structural reviews. 2. Deleted reference to Regulatory Guide 1.165 because it was withdrawn. 3. Added text to reference additional interim staff guidance provided in ISG-01, ISG-017,
and ISG-020. II. ACCEPTANCE CRITERIA 1. Added text to reference additional interim staff guidance in ISG-01 and ISG-017. 2. Enhanced guidance in SRP Section 3.7.1 II.1.B related to design time histories. The
technical rationale for this change is as follows. When the seed recorded time history is selected based on a reasonable comparison of the spectral shape of the seed with the target design spectra, then it would facilitate and ensure that a good spectral matching can be achieved. This occurs because the magnitude of the seed record could be increased without the need for making significant adjustments at each frequency. This approach avoids increasing the input at certain frequencies too much which could lead to significant overprediction of the response at certain frequencies and cause underprediction at adjacent frequencies.
3. Enhanced guidance in SRP Section 3.7.1 II.1.B ii, Option 1 - single set of time histories, Approach 2) Item (d). The technical rationale for this change is as follows. The first criterion in Item (d) of the SRP ensures there is no significant over-prediction of the response spectrum of the ground motion time history. The second criterion ensures that there will not be a significant energy gap at any frequency over the frequency range of interest. Both criteria should be satisfied to ensure that overestimation of the spectral matching at certain frequencies would not cause significant deficiencies in energy at other frequencies.
4. Enhanced guidance in SRP Section 3.7.1 II.1.B, Option 2 - multiple sets of time
histories. The technical rationale for this change is as follows.

3.7.1-44 Revision 4 – December 2014
In view of the complexities of performing nonlinear time history analyses, it is difficult to identify a specific number of time history input motions that should be used. To do so would require additional research that should include performing many nonlinear time history analyses on various structures and components. However, there is some guidance in other standards on selection of the number of earthquake motions and how to select the responses from the multiple nonlinear time history analyses. For seismic analysis and design of buildings, Section 1618 of the 2003 International Building Code (IBC) identifies that dynamic analysis including nonlinear time history analysis shall be performed in accordance with the requirements of the ASCE 7 Standard Section 16.2.4 of ASCE/SEI 7-05 indicates that: “If at least seven ground motions are analyzed, the design values of member forces, QE, member inelastic deformations, Ψ, and story drift, Δ, are permitted to be taken as the average of the QEi, Ψi, and Δi values determined from the analyses. If fewer than seven ground motions are analyzed, the design member forces, QE, design member inelastic deformations, Ψ, and the design story drift, Δ, shall be taken as the maximum value of the QEi, Ψi, and Δi values determined from the analyses.” The Commentary to IBC 2003 indicates that the code’s earthquake load requirements are based on ASCE 7 and the National Earthquake Hazards Reduction Program’s (NEHRP) Recommended Provisions for the Development of Seismic Regulations for New Buildings (FEMA 368). This FEMA Standard has been superseded by the 2009 edition of FEMA P-750, entitled NEHRP Recommended Seismic Provisions for New Buildings and Other Structures. The Commentary to FEMA P-750 discusses the number of ground motions to be used in a nonlinear time history analysis and the use of the average values or maximum values of deformations in a similar manner to the ASCE 7 Standard. In addition, the Commentary to FEMA P-750 indicates that “…It is very important to note, however, that assessment of deformations in this manner should not be done without careful inspection of the story displacement histories of each analysis. It is possible that the maximum displacement or drift may be completely dominated by the response from one ground motion, and such dominance, when due to ratcheting (increasing deformations in one direction resulting in a high residual deformation), may be a sign of imminent dynamic instability. Where these kinds of dynamic instabilities are present, the analyst should attempt to determine the system characteristics that produce such effects. The ground motion that produces dynamic instability should not be replaced with one that does not.”
5. Deleted reference to Regulatory Guide 1.165 because it was withdrawn. 6. Revised Appendix B to provide detailed guidance for determining target PSD’s for
NUREG/CR-6728 based spectra or other spectra. 7. Deleted Appendix C and inserted in SRP Subsection 3.7.1 II.1.A.ii, acceptance criteria
for determining response spectra for different damping values other than 5 percent, when the free-field design response spectra are not based on RG 1.60 response spectra and are not based on spectra consistent with the magnitude and distance bin shapes in NUREG/CR-6728.

3.7.1-45 Revision 4 – December 2014
VI. REFERENCES 1. Deleted reference to Regulatory Guide 1.165 because it was withdrawn. 2. Added reference to Houston et al. (2010). 3. Added reference to Interim Staff Guidance 01 (DC/COL-ISG-01). 4. Added reference to Interim Staff Guidance 17 (DC/COL-ISG-17). 5. Added reference to Interim Staff Guidance 17 (DC/COL-ISG-020). 6. Deleted reference to 10 CFR Part 100. 7. Added reference to NUREG/CR-5347. 8. Added reference to PEER Report 2012/01.