Embed Size (px)
Citation preview
NURSE PRACTITIONERS,PHYSICIAN ASSISTANTS AND
CERTIFIED NURSE MIDWIVES
IN CALIFORNIA
A Report by theOffice of Statewide Health Planning and Development
and theCenter for California Health Workforce Studies
at theUniversity of California, San Francisco
Spring 2000
Gray DavisGovernor
State of California
Grantland JohnsonSecretary
Health and Human Services Agency
David Werdegar, MD, MPHDirector
Office of Statewide Health Planning and Development
Office of Statewide Health Planning and Development
Priscilla Gonzalez-Leiva, RNDeputy Director, Primary Care Resources Division
Ed Mendoza, MPHAssistant Director, Special Initiatives and Program Evaluation
Megan FloridaProject Coordinator
UCSF Center for California Workforce Studies
Kevin Grumbach, MDCenter Director
Janet Coffman, MPPCenter Manager
Elizabeth Mertz, MAResearch Associate
Emily RosenoffResearch Assistant
Advisors
Linda Ennis, MS, CNMDirector, UCSF/SFGH CNM Educational ProgramUniversity of California, San Francisco
Virginia Fowkes, FNP, MHSDirector, Primary Care Associate ProgramStanford University
Catherine Gilliss, DNSc, RN, FAANDean, School of NursingYale University
Sally Rankin, RN, PhD, FNPAssociate Professor and Director, Family Nurse Practitioner ProgramUniversity of California, San Francisco
Chapters
Executive Summary ............................................................................................................ 1Preface ................................................................................................................................ 5I. Introduction ............................................................................................................. 7II. Methods................................................................................................................... 9III. NP/PA/CNM Employment Patterns ...................................................................... 11
A. Labor Force ParticipationB. Principle Professional ActivityC. Hours Worked in Patient Care and Non-Patient Care ActivitiesD. Major Practice Specialty GroupingE. Primary Practice Location by Type of SiteF. Practitioners Caring for Underserved PopulationsG. Rural vs. Urban Location
IV. NP/PA/CNM Demographics ................................................................................. 17A. Current Age DistributionB. Age at GraduationC. SexD. Race/Ethnicity
V. Characteristics of NP/PA/CNM Patients............................................................... 21A. Race/EthnicityB. Fluency in EnglishC. Uninsured and Medi-Cal Patients
VI. NP/PA/CNM Educational Pipeline ....................................................................... 25A. Location of Educational ProgramB. Year of GraduationC. Percent of NPs Educated in Major Specialty Groupings
VII. CNMs .................................................................................................................... 27A. Reasons For Not Practicing as a CNMB. Type of Services Provided by CNMsC. Type of CNM Educational Program Completed
VIII. Conclusions and Recommendations ..................................................................... 29
AppendixA. Cover Letter............................................................................................... 33B. Survey Instrument....................................................................................... 34
Table of Contents
Figure Page Number
II.A Response Rates ......................................................................................... 10II.B Respondents in California ......................................................................... 10
III.A.1 Number of Survey Respondents ............................................................... 11III.A.2 Labor Force Participation.......................................................................... 11III.B Principal Professional Activity ................................................................. 12III.C.1 Total Hours Worked Per Week .................................................................. 13III.C.2 Mean Hours Worked Per Week ................................................................. 13III.D.1 Major Specialty Grouping ......................................................................... 14III.D.2 Major Specialty ......................................................................................... 14III.E Primary Practice Site ................................................................................. 15III.F.1 Practitioners Working in Underserved Geographic Areas ........................ 16III.F.2 Practitioners Practicing in Underserved Settings ...................................... 16III.G Rural vs. Urban Location .......................................................................... 16
IV.A.1 Mean Age of California Practitioners ....................................................... 17IV.A.2 Age Distribution of Practitioners .............................................................. 17IV.B Distribution of Age at Graduation from Educational Program ................. 18IV.C Sex of Active California Practitioners ...................................................... 18IV.D Race/Ethnicity of Active Practitioners ...................................................... 19
V.A Estimates of Patients’ Race/Ethnicity ....................................................... 21V.B Estimates of Patients Not Fluent in English ............................................. 22V.C.1 Estimates of Uninsured Patients ............................................................... 23V.C.2 Estimates of Patients Receiving Medi-Cal ............................................... 23V.C.3 Estimates of Uninsured and Medi-Cal Patients ........................................ 24
VI.A Location and Type of Educational Program Completed ........................... 25VI.B Distribution of Year of Graduation ........................................................... 25VI.C NP Specialty Education ............................................................................ 26
VII.A.1 Labor Force Participation of California CNMs ........................................ 27VII.A.2 Reasons for Not Practicing as a CNM ...................................................... 27VII.B Types of Services Provided by CNMs ...................................................... 28VII.C.1 Type of CNM Educational Program Completed ....................................... 28
List of Figures
Acknowledgments
This project could not have been completed without the generous financial support of twobureaus within the US Health Resources and Services Administration (HRSA): the Bureau ofPrimary Health Care (BPHC) and the Bureau of Health Professions (BHPr). BPHC supportedthe survey design, survey administration, data collection and preparation of the report (GrantU68CS00161). Tom Uridel, former Primary Care Branch Chief at HRSA’s Region IX Office andJeri Thornburgh, Director of the Division of Shortage Designation, were instrumental insecuring BPHC resources. Through its National Center for Health Workforce Information andAnalysis, BHPr provided supplemental resources to the UCSF Center for California HealthWorkforce Studies to cover some costs associated with survey design and report preparation(Grant 5 U76 MB 10001-02) . In addition, Linda Ennis, Director of the UCSF/SFGH NurseMidwifery Program; Virginia Fowkes, Director of the Stanford Primary Care AssociateProgram; Catherine Gilliss, former Chair of the UCSF Department of Family Health CareNursing (now Dean, Yale University, School of Nursing); and Sally Rankin, Associate Professorand Director of the UCSF Family Nurse Practitioner Program, gave generously of their time andexpertise. Their input enriched both the survey and the report.
This work was supported by the US Bureau of the Health Professions, HRSA, National Center forHealth Workforce Information and Analysis, (Grant 5 U76 MB 10001-02) and the Department ofHealth and Human Services, HRSA, US Bureau of Primary Health Care (Grant U68CS00161).
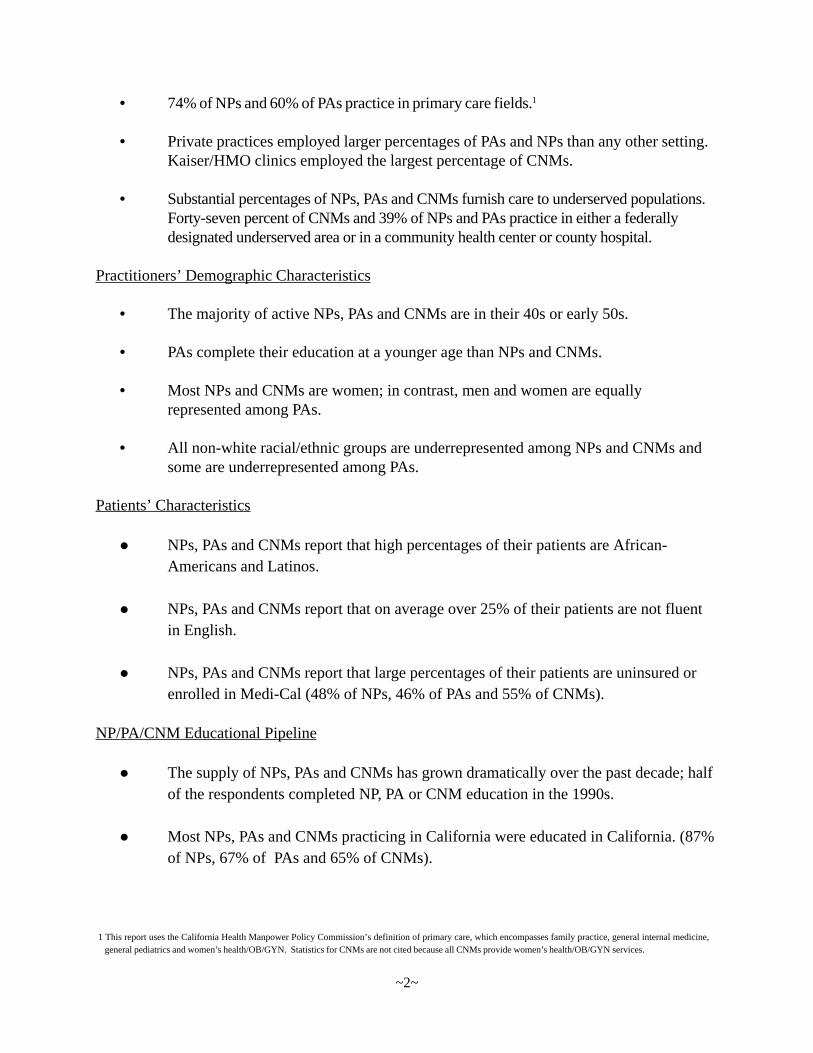
Executive Summary
Nurse practitioners (NPs), physician assistants (PAs) and certified nurse midwives
(CNMs) play growing roles in the health care workforce. Experts recommended in the mid-
1990s that their numbers be increased to address concerns about an inadequate supply and
maldistribution of primary care practitioners. In response, educators have dramatically increased
the numbers of students educated in these professions. Efforts are underway in many states to
expand the scope of practice and enhance the reimbursement of these practitioners. Despite
these developments, relatively little is known about the profile of the workforce in these three
professions in California.
This report documents the contributions of these three professions to California’s health
care workforce. Findings presented in this report are based on the results of a survey mailed to all
NPs, PAs and CNMs licensed to practice in California. The survey was administered by the
California Office of Statewide Health Planning and Development (OSHPD) in 1998. OSHPD
conducted this survey because existing sources of data were inadequate to answer many impor-
tant questions about these professionals and to make comparisons across the three professions.
The survey questions encompassed a variety of topics including education, labor force participa-
tion, specialty, and location and type of practice site, as well as the demographic characteristics
of these professionals and their patients. Response rates for each of the three professions (66%
for NPs, 57% for PAs, and 70% for CNMs) were sufficient to provide a broad overview of these
professions at the state level.
This report was made possible through extensive collaboration among OSHPD, the
UCSF Center for California Health Workforce Studies and representatives of each of the three
professions surveyed. Funding was provided by two branches of the US Health Resources and
Services Administration: the Bureau of Primary Health Care and the Bureau of Health Profes-
sions.
The survey’s major findings are summarized below:
Labor Force Participation and Employment Patterns
• Most NPs, PAs and CNMs are practicing in their fields (80% of NPs, 93% of PAs, 80%
of CNMs).
• Most NPs, PAs and CNMs are primarily engaged in providing patient care.
~1~
• 74% of NPs and 60% of PAs practice in primary care fields.1
• Private practices employed larger percentages of PAs and NPs than any other setting.Kaiser/HMO clinics employed the largest percentage of CNMs.
• Substantial percentages of NPs, PAs and CNMs furnish care to underserved populations.Forty-seven percent of CNMs and 39% of NPs and PAs practice in either a federallydesignated underserved area or in a community health center or county hospital.
Practitioners’ Demographic Characteristics
• The majority of active NPs, PAs and CNMs are in their 40s or early 50s.
• PAs complete their education at a younger age than NPs and CNMs.
• Most NPs and CNMs are women; in contrast, men and women are equallyrepresented among PAs.
• All non-white racial/ethnic groups are underrepresented among NPs and CNMs andsome are underrepresented among PAs.
Patients’ Characteristics
l NPs, PAs and CNMs report that high percentages of their patients are African-Americans and Latinos.
l NPs, PAs and CNMs report that on average over 25% of their patients are not fluentin English.
l NPs, PAs and CNMs report that large percentages of their patients are uninsured orenrolled in Medi-Cal (48% of NPs, 46% of PAs and 55% of CNMs).
NP/PA/CNM Educational Pipeline
l The supply of NPs, PAs and CNMs has grown dramatically over the past decade; halfof the respondents completed NP, PA or CNM education in the 1990s.
l Most NPs, PAs and CNMs practicing in California were educated in California. (87%of NPs, 67% of PAs and 65% of CNMs).
1 This report uses the California Health Manpower Policy Commission’s definition of primary care, which encompasses family practice, general internal medicine,general pediatrics and women’s health/OB/GYN. Statistics for CNMs are not cited because all CNMs provide women’s health/OB/GYN services.
~2~
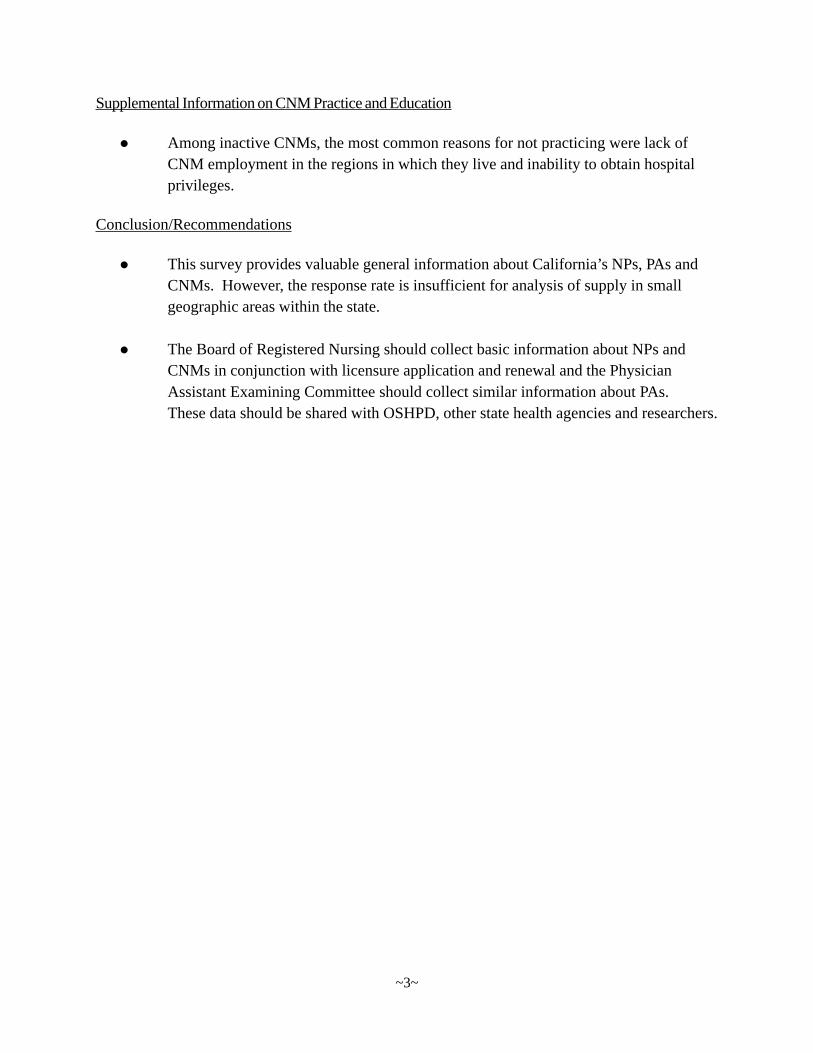
Supplemental Information on CNM Practice and Education
l Among inactive CNMs, the most common reasons for not practicing were lack ofCNM employment in the regions in which they live and inability to obtain hospitalprivileges.
Conclusion/Recommendations
l This survey provides valuable general information about California’s NPs, PAs andCNMs. However, the response rate is insufficient for analysis of supply in smallgeographic areas within the state.
l The Board of Registered Nursing should collect basic information about NPs andCNMs in conjunction with licensure application and renewal and the PhysicianAssistant Examining Committee should collect similar information about PAs.These data should be shared with OSHPD, other state health agencies and researchers.
~3~
Preface
This report is the result of extensive collaboration among several organizations with
strong interests in increasing knowledge about nurse practitioners (NPs), physician assistants
(PAs) and certified nurse midwives (CNMs) in California.
The survey from which this report is derived was conducted by the California Office of
Statewide Health Planning and Development (OSHPD), the state agency charged with addressing
health workforce concerns. Several of OSHPD’s programs involve NPs, PAs and CNMs. For
example, the Song-Brown Program Family Physician Training Program2 provides funding for
family physician, family NP and PA education programs. The National Health Service Corps/
State Loan Repayment Program (NHSC/SLRP) repays student loans of primary care physicians,
CNMs, NPs, PAs and dentists in exchange for service in communities designated as Health
Professions Shortage Areas (HPSAs).
Over the years, OSHPD and other organizations have collected data on California’s NPs,
PAs and CNMs. A statewide survey of all PAs licensed in California was conducted in 19882
and a similar survey of NPs was completed in 1995.3 Professional associations have also
periodically collected data on PAs and CNMs.4,5 NPs and CNMs were included in national and
statewide sample surveys of all registered nurses.6,7 In addition, some of California’s NP, PA and
CNM education programs periodically collect data on their graduates.
Although these previous surveys have provided useful information, they have also had
important limitations. The questions on surveys of individual professions often were not
sufficiently similar to permit comparisons across professions. The numbers of NPs and CNMs in
many nursing surveys were too small to yield reliable estimates. Surveys conducted by
professional associations and individual educational programs could not be generalized to
professions as a whole.
Department of Family Health Care Nursing, June 1995.
2 California Health and Safety Code, Section 128225 (c).
3 Fowkes, VK: A Profile of California’s Physicians Assistants (Correspondence). West J Med 1990, 153:328-329.
4 Gilliss CL. The 1995 California NP Data Base Project – A Report to the California Office of Statewide Health Planning and Development. San Francisco: UCSF
5 American Academy of Physician Assistants. Physician Assistant Statistics and Trends, 1991-1998. Alexandria, VA: American Academy of Physician Assistants, 1999.
6 Paine LL. Characteristics of Nurse-Midwife Patients and Visits, 1991. American Journal of Public Health. 1999;89(6):906-909.
7 Barnes C, Sutherland S. Survey of Registered Nurses in California 1997. Sacramento, CA: California Board of Registered Nursing, February 1999.
8 Moses E. The Registered Nurse Population, March 1996. Rockville, MD: US Department of Health and Human Services, 1997.
~5~
A proposed change in federal policy led OSHPD to endeavor to produce a more accurate and
comprehensive source of data on NPs, PAs and CNMs. Following several years of deliberations, the
US Bureau of Primary Health Care (BPHC) issued proposed revisions in the regulations used to
designate primary care Health Professions Shortage Areas (HPSAs) in September 1998.9 One of the
proposed revisions called for the inclusion of NPs, PAs and CNMs when enumerating a community’s
supply of primary care providers, a key variable used to determine whether a community is eligible for
designation as a HPSA. (Under current regulations only primary care physicians are included.)
Recognizing that existing data sources were inadequate, OSHPD concluded that a new survey was
needed. During the summer and fall of 1997, OSHPD staff worked with staff from the UCSF Center
for California Health Workforce Studies and three NP, PA and CNM educators who served on
OSHPD’s NP/PA Advisory Committee to develop a brief survey instrument to be mailed to all
individuals in these three professions who were licensed to practice in California. OSHPD administered
the survey between June 1998 and August 1998. Data entry was completed by Sacramento State
University through a contract with OSHPD. OSHPD staff then used the data to assess the impact of the
proposed change in the HPSA designation regulations.10 After this analysis was completed, OSHPD
contracted with the UCSF Center for California Health Workforce Studies to conduct a comprehensive
analysis of the survey data and produce this report.
10 Note: The proposed HPSA designation regulations covered many changes in addition to the proposal concerning NP, PA and CNMs. For reference see PriscillaGonzalez-Levia’s letter to Libby Merrill, December 30, 1998. Copies of the letter are available from Priscilla Gonzalez-Levia, at the Office of Statewide HealthPlanning and Development, Primary Care Resources and Community Development Division. 1600 9th Street, Room 440, Sacramento, CA 95814.
~6~
9 For further information see Federal Register, September 1, 1998;63(169):46538-46555.
Chapter I
Introduction
Nurse practitioners (NPs), physician assistants (PAs) and certified nurse midwives
(CNMs), play growing roles in the health care workforce. Each of these professions was estab-
lished in response to concerns about access to primary care, particularly in impoverished rural
and inner city communities. Although there are many similarities among these three types of
professionals, there are important differences in their education. Today most NPs and CNMs are
educated at the graduate level and most students are registered nurses.11 A large percentage of
NPs are educated in family nurse practitioner programs which prepare students to provide a wide
range of primary care services to people of all ages. Other NP students specialize in specific
areas within primary care such as pediatrics. CNM education focuses on women’s health/
OB/GYN. PAs receive a broad education in the clinical and basic sciences, psycho-social/behavioral
health, and health promotion. PA education programs admit students with a wide variety of prior
education and professional experience, and educate students at multiple levels (e.g. certificate,
bachelor’s, master’s). To assure standardization of preparation for practice all PAs must pass a
single national certification examination.12
During the mid-1990s, perceptions of a shortage of primary care physicians prompted
renewed interest in these professionals to augment the primary care workforce. Experts called for
doubling the numbers of NPs, PAs and CNMs in the United States.13
California policymakers responded by substantially increasing funding for grants to NP
and PA education under the Song-Brown Family Physician Training Act, administered by the
Office of Statewide Health Planning and Development (OSHPD), Primary Care Resources and
Community Development Division.14 This effort and others have led to dramatic growth in the
numbers of NPs, PAs and CNMs.15 In addition, efforts are afoot in many states to expand the
scope of practice and enhance the reimbursement of these health professionals.16
11 Gilliss CL. Mundinger MO. “How is the Role of the Advanced Practice Nurse Changing?” in E O’Neil and J Coffman, eds. Strategies for the Future of Nursing.CM Dower, JE Miller, EH O’Neil and the Task force on Midwifery. Charting a Course for the 21st Century: The Future of Midwifery. San Francisco: PewHealth Professions and the UCSF Center for the Health Professions, April 1999.
A few NP and CNM education programs offer tracks for students with degrees in non-nursing fields in which these students complete educational requirements forlicensure as both RNs and NPs or CNMs.12 The Physician Assistant Task Force on the Impact of Managed Care. Charting a Course for the 21st Century. San Francisco: Pew Health Professions Commission and
UCSF Center for the Health Professions, 1998.13 See, for example, The Pew Health Professions Commission. Nurse Practitioners: Doubling the Graduates by the Year 2000. San Francisco: The Pew Health
Professions Commission, April 1994.14 California Health and Safety Code, Section 128225(c).15 Cooper RA, Laud P, Dietrich CL. Current and projected workforce of nonphysician clinicians. Journal of the American Medical Association. 1998;280(9):788-794.16 Cooper RA, Henderson T, Dietrich CL. Roles of nonphysician clinicians as autonomous providers of patient care. Journal of the American Medical Association.
1998;280(9):795-802.
~7~
These developments raise important questions about California’s NPs, PAs and CNMs. Are
most of them practicing in their respective fields? In what settings are they practicing? What types of
services do they furnish? To what extent do they provide care to underserved populations? What are
their demographic characteristics? Where are they educated? This report addresses these and other
important questions about California’s NPs, PAs and CNMs. The goal of this report is not to compare
these three professions, but rather to document the contributions of these professions to California’s
health care workforce.
Findings presented in this report are derived from a survey of NPs, PAs and CNMs
licensed to practice in California. The survey was administered by OSHPD in 1998 and funded
by the US Health Resources and Services Administration.
This report provides an overview of California’s NPs, PAs and CNMs. Numerous tables
and graphs are included to enable readers to locate information easily. Chapter II summarizes the
survey methodology. Findings from the survey are presented in Chapters III through VII.
Employment patterns are discussed in Chapter III. Chapter IV describes NPs’, PAs’ and CNMs’
demographic characteristics. Select characteristics of the patients of NPs, PAs and CNMs are
presented in Chapter V. The educational pipelines for the three professions are described in
Chapter VI. Chapter VII contains supplemental information about CNMs. The final chapter of
the report presents conclusions and recommendations.
~8~
Chapter II
Methods
The data presented in this report are from a survey which identified all certified nurse
midwives (CNMs), nurse practitioners (NPs) and physician assistants (PAs) holding active
California licenses in 1998. The survey was mailed in June 1998. A second mailing was sent to
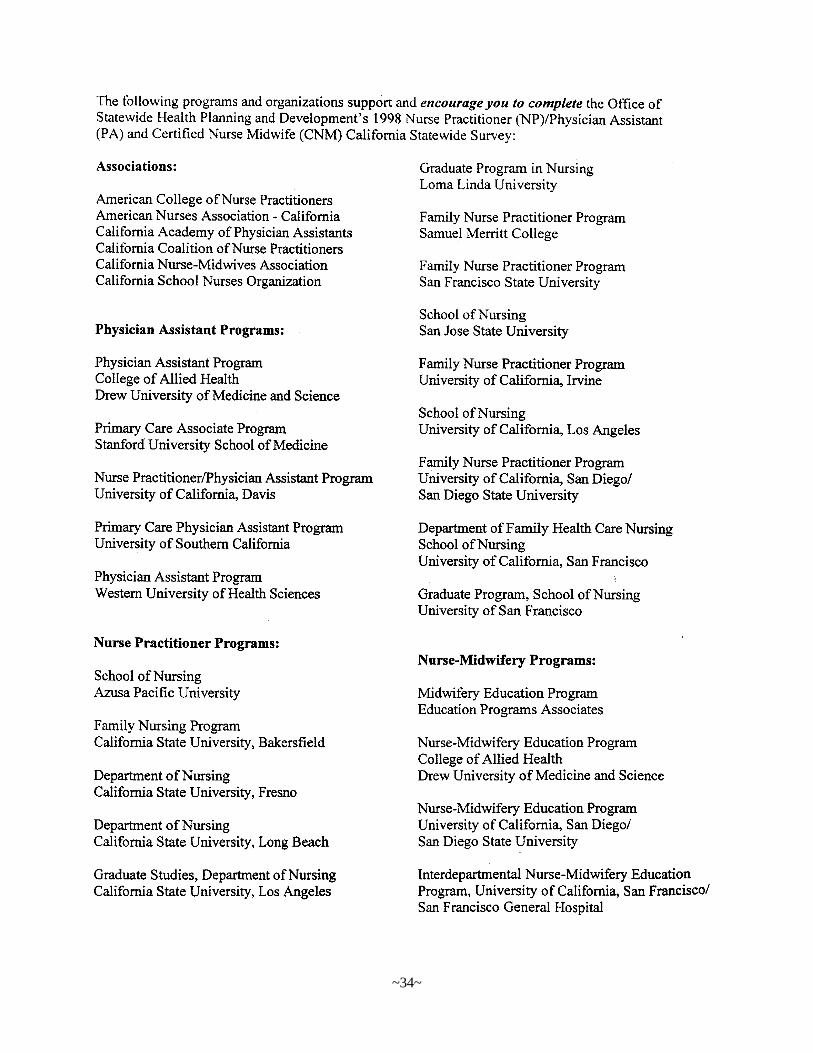
nonresponders in August 1998. Survey forms were mailed along with copies of a cover letter that
described the purpose of the survey and listed endorsements from CMN, NP and PA educational
programs and professional associations.
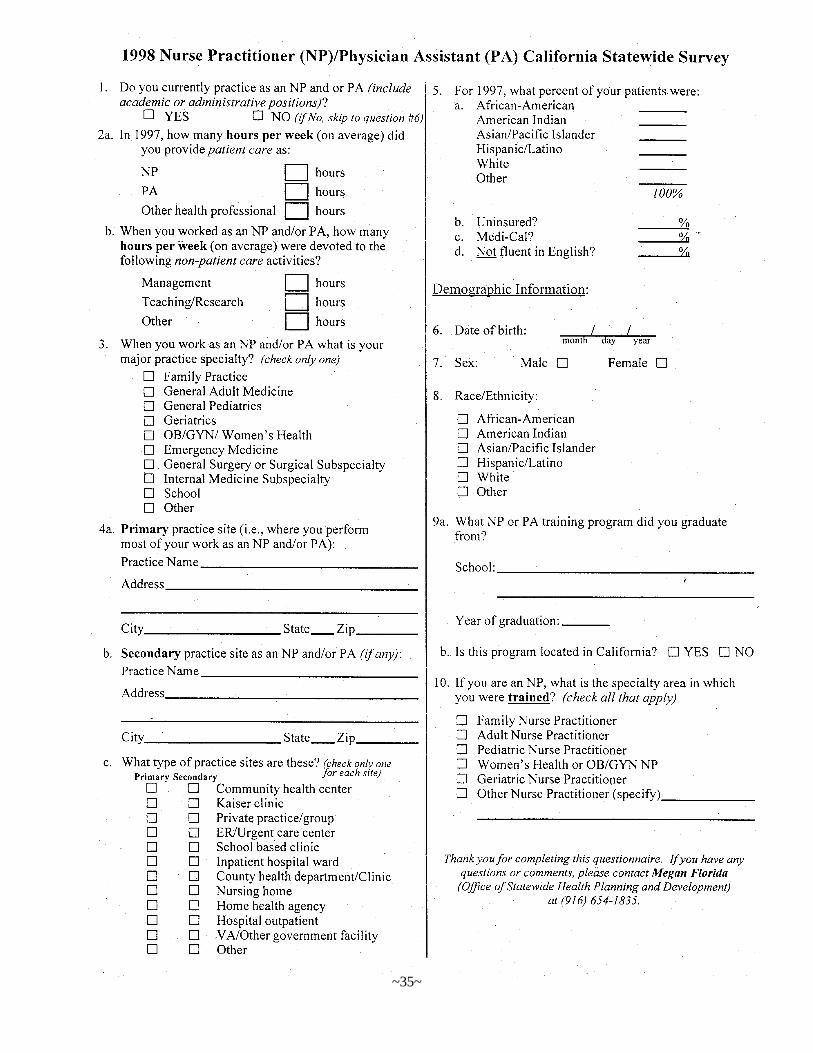
The questionnaires were developed by a team composed of staff from OSHPD and the
UC-San Francisco Center for California Health Workforce Studies, as well as representatives
from each of the three professions. The questionnaires contained questions regarding the charac-
teristics of NPs, PAs and CNMs and their patients. The topics included:
• workforce participation;
• specialty;
• location and type of practice site;
• location and type of education;
• demographic characteristics; and
• estimates of patients’ demographic characteristics and health care coverage,
including percentages of patients who are uninsured or on Medi-Cal.
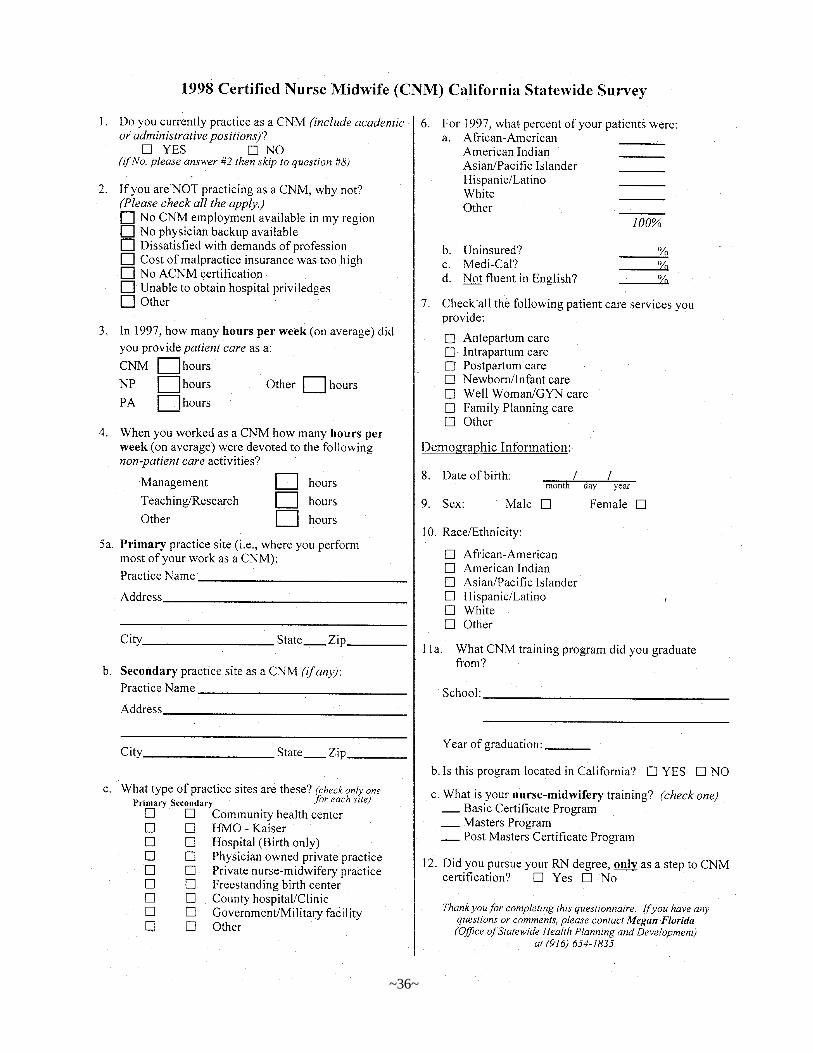
The questionnaire for CNMs included several additional questions concerning the range of services
CNMs provide, their types of educational preparation and, for those currently not practicing as CNMs,
their reasons for not doing so. Copies of the survey instruments appear in Appendix A.
The following table displays response rates for each profession. Response rates varied across
the three professions, ranging from a high of 70 percent for CNMs to a low of 57 percent for PAs.
~9~

The vast majority of respondents are located in California. As the following table
illustrates, 99 percent of CNMs and NPs and 95 percent of PAs who responded practice and/or
live in California.
The remaining chapters of this report summarize findings for respondents practicing or living in
California. The report focuses primarily on professionals practicing in California because its main
purpose is to describe the contribution of NPs, PAs and CNMs to the delivery of health services in
California. All respondents who indicated that they were professionally active and reported a practice
address in California are classified as “active” regardless of their home address. This definition of
“active” included a small number of professionals who practice in California but live in neighboring
states. Respondents who live in California but are not practicing are classified as “inactive”.
~10~
renoititcarPesruN tnatsissAnaicisyhP esruNdeifitreCefiwdiM LATOT
rebmuNfotnecreP
latoTrebmuN
fotnecrePlatoT
rebmuNfotnecreP
latoTrebmuN
fotnecrePlatoT
syevruSdeliaM
143,7 %001 839,2 %001 958 %001 831,11 %001
stnednopseR 568,4 %66 966,1 %75 106 %07 531,7 %46
Table II.A
Table II.B
renoititcarPesruN tnatsissAnaicisyhP esruNdeifitreCefiwdiM LATOT
rebmuNfotnecreP
latoTrebmuN
fotnecrePlatoT
rebmuNfotnecreP
latoTrebmuN
fotnecrePlatoT
latoTstnednopseR
568,4 %001 966,1 %001 106 %001 531,7 %001
stnednopseRgnicitcarP
gniviLro/dnaainrofilaCni
428,4 %99 975,1 %59 595 %99 899,6 %89
Chapter IIINP/PA/CNM Employment Patterns
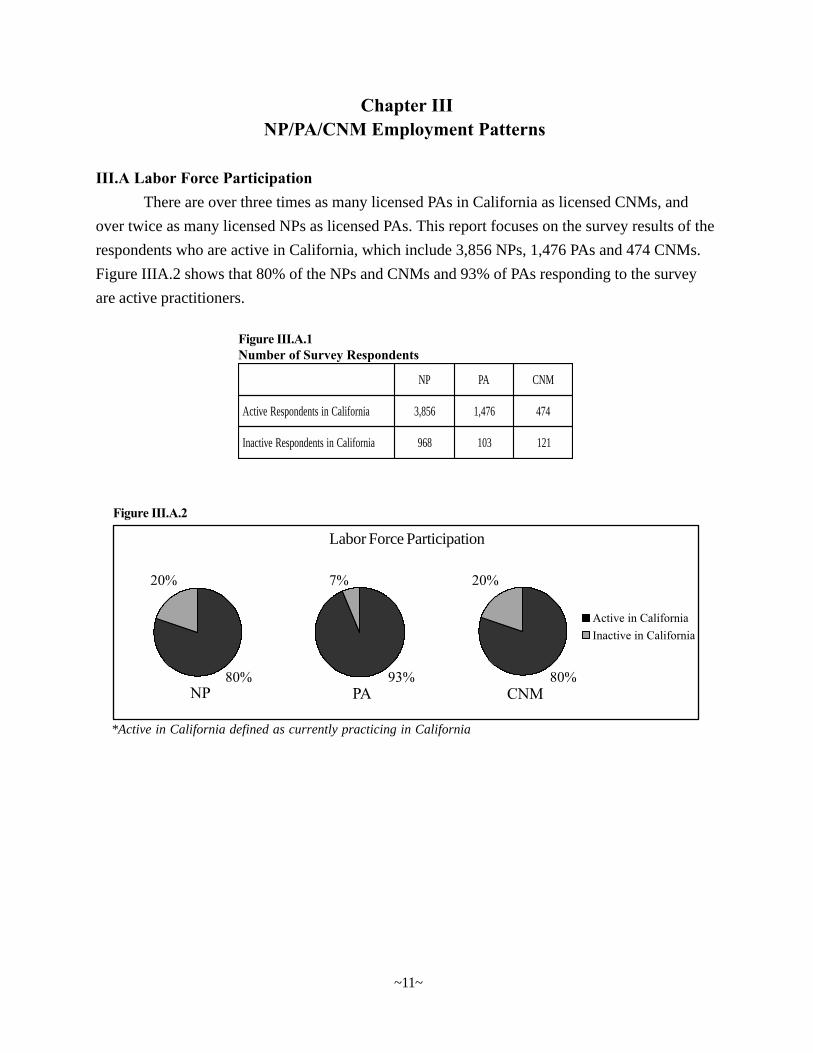
III.A Labor Force ParticipationThere are over three times as many licensed PAs in California as licensed CNMs, and
over twice as many licensed NPs as licensed PAs. This report focuses on the survey results of the
respondents who are active in California, which include 3,856 NPs, 1,476 PAs and 474 CNMs.
Figure IIIA.2 shows that 80% of the NPs and CNMs and 93% of PAs responding to the survey
are active practitioners.
PN AP MNC
ainrofilaCnistnednopseRevitcA 658,3 674,1 474
ainrofilaCnistnednopseRevitcanI 869 301 121
Figure III.A.1Number of Survey Respondents
~11~
Figure III.A.2
Labor Force Participation
*Active in California defined as currently practicing in California
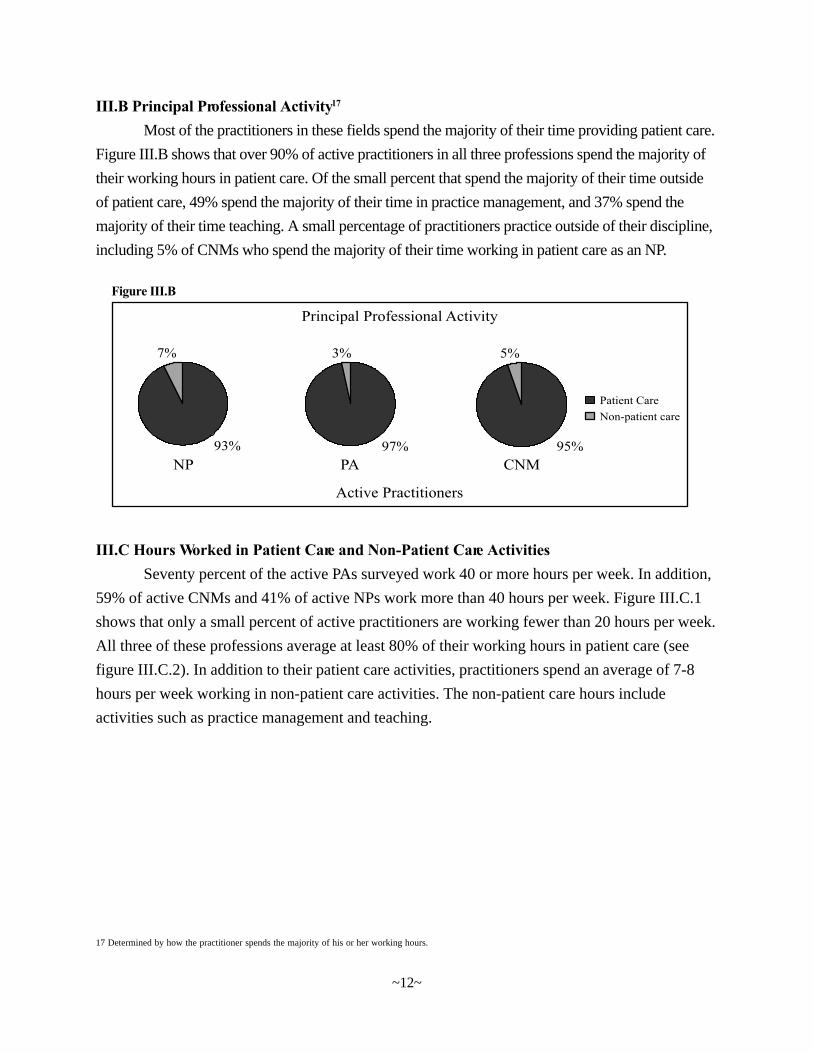
III.B Principal Professional Activity17
Most of the practitioners in these fields spend the majority of their time providing patient care.
Figure III.B shows that over 90% of active practitioners in all three professions spend the majority of
their working hours in patient care. Of the small percent that spend the majority of their time outside
of patient care, 49% spend the majority of their time in practice management, and 37% spend the
majority of their time teaching. A small percentage of practitioners practice outside of their discipline,
including 5% of CNMs who spend the majority of their time working in patient care as an NP.
III.C Hours Worked in Patient Care and Non-Patient Care ActivitiesSeventy percent of the active PAs surveyed work 40 or more hours per week. In addition,
59% of active CNMs and 41% of active NPs work more than 40 hours per week. Figure III.C.1
shows that only a small percent of active practitioners are working fewer than 20 hours per week.
All three of these professions average at least 80% of their working hours in patient care (see
figure III.C.2). In addition to their patient care activities, practitioners spend an average of 7-8
hours per week working in non-patient care activities. The non-patient care hours include
activities such as practice management and teaching.
17 Determined by how the practitioner spends the majority of his or her working hours.
~12~
Figure III.B
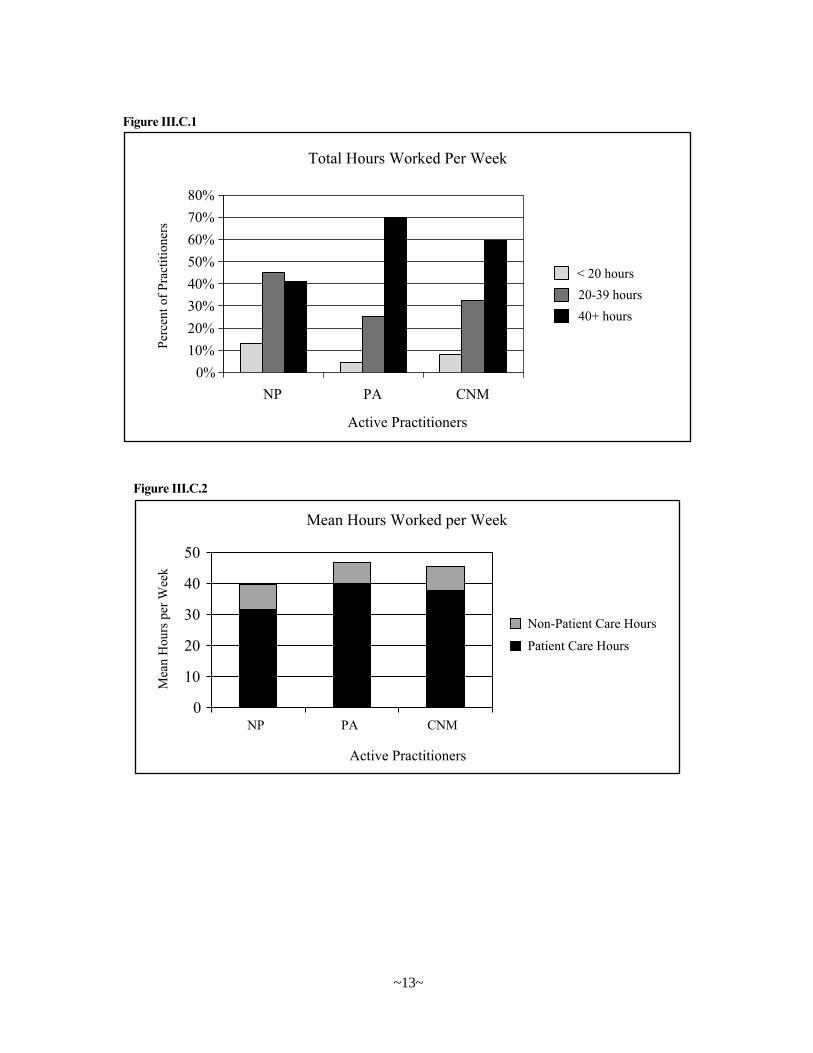
Figure III.C.1
Figure III.C.2
~13~
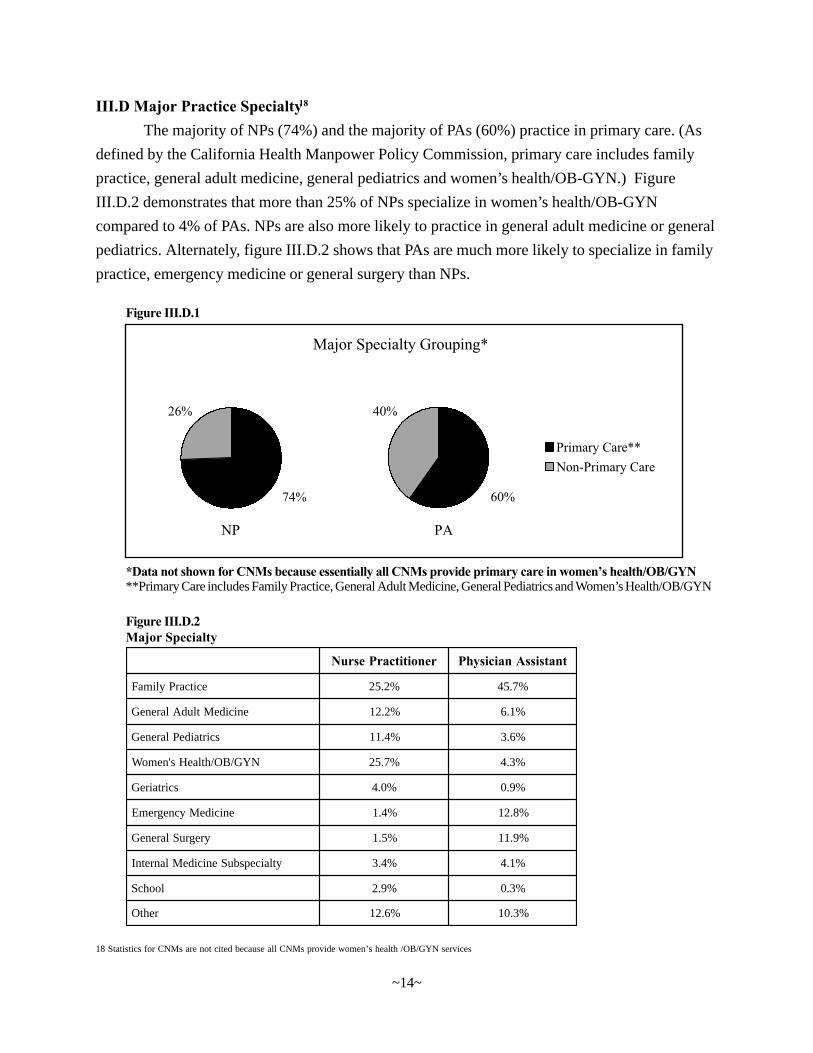
III.D Major Practice Specialty18
The majority of NPs (74%) and the majority of PAs (60%) practice in primary care. (As
defined by the California Health Manpower Policy Commission, primary care includes family
practice, general adult medicine, general pediatrics and women’s health/OB-GYN.) Figure
III.D.2 demonstrates that more than 25% of NPs specialize in women’s health/OB-GYN
compared to 4% of PAs. NPs are also more likely to practice in general adult medicine or general
pediatrics. Alternately, figure III.D.2 shows that PAs are much more likely to specialize in family
practice, emergency medicine or general surgery than NPs.
Figure III.D.1
*Data not shown for CNMs because essentially all CNMs provide primary care in women’s health/OB/GYN**Primary Care includes Family Practice, General Adult Medicine, General Pediatrics and Women’s Health/OB/GYN
18 Statistics for CNMs are not cited because all CNMs provide women’s health /OB/GYN services
renoititcarPesruN tnatsissAnaicisyhP
ecitcarPylimaF %2.52 %7.54
enicideMtludAlareneG %2.21 %1.6
scirtaidePlareneG %4.11 %6.3
NYG/BO/htlaeHs'nemoW %7.52 %3.4
scirtaireG %0.4 %9.0
enicideMycnegremE %4.1 %8.21
yregruSlareneG %5.1 %9.11
ytlaicepsbuSenicideMlanretnI %4.3 %1.4
loohcS %9.2 %3.0
rehtO %6.21 %3.01
Figure III.D.2Major Specialty
~14~
III.E Primary Practice SitePrivate practices employed larger percentages of NPs (26.4%) and PAs (39.8%) than any
other type of practice site. Kaiser/HMO clinics (22.5%) and private practices (20.9%) employed
the largest percentages of CNMs. Twenty-four percent of NPs listed a secondary practice site
compared to 6% of PAs and only 5% of CNMs. Of NPs listing a secondary site location, 30%
listed a private practice and 20% listed a community health center or a county health facility.
III.F Practitioners Caring for Underserved PopulationsSignificant proportions of NPs, PAs and CNMs practice in federally designated
underserved areas. There are two types of designations: Health Professions Shortage Areas
(HPSAs)19 and Medically Underserved Areas (MUAs)20. These three professions have relatively
high percentages of practitioners working in HPSAs (17% of NPs, 21% of PAs and 20% of
CNMs). In addition, a relatively large percent of work in a Medically Underserved Area (MUA):
14% of NPs, 17% of PAs and 22% of CNMs.21 (See figure III.F.1.)
Some NPs, PAs and CNMs who are not practicing in shortage areas may nevertheless
provide care to underserved populations because they work in facilities that serve underserved
populations, such as community health centers and county hospitals.
NP PA CNMPrivate practice 26.4% 39.8% 20.9%Kaiser/HMO clinic 14.4% 7.4% 22.5%ER/Urgent care center 2.5% 13.4% N/AInpatient hospital ward 3.8% 4.9% N/AHospital outpatient 7.3% 3.8% N/ASchool based clinic 5.6% 1.2% N/ACommunity health center 12.7% 12.1% 11.0%County hospital/clinic/department 7.2% 4.4% 11.5%Nursing home 1.7% 0.6% N/AVA/other government facility 4.5% 2.8% 2.6%Private nurse-midwifery practice N/A N/A 8.4%Freestanding birth center N/A N/A 3.1%Hospital (birth only) N/A N/A 9.3%Other 13.8% 9.5% 10.6%
Figure III.E
~15~
21 These results were determined by the practice address listed. If no practice address was listed then the mailing address was used to estimate practice location.Overall approximately 80% of active respondents listed a practice address.
19 An area is eligible for HPSA designation if it has less that one primary care physician per 3,500 persons. Grumbach K,Coffman J, Liu R, Mertz E. Strategies for Increasing Physician Supply in Medically Underserved Communitiesin California. Berkeley, CA: California Policy Research Center, 1999, p 4-5.20 The criteria for determining whether an area qualifies as a MUA employs a four-variable index of Medical Underservice,
including percent with incomes below poverty, population-to-primary care physician ratio, infant mortality rate and percentelderly.
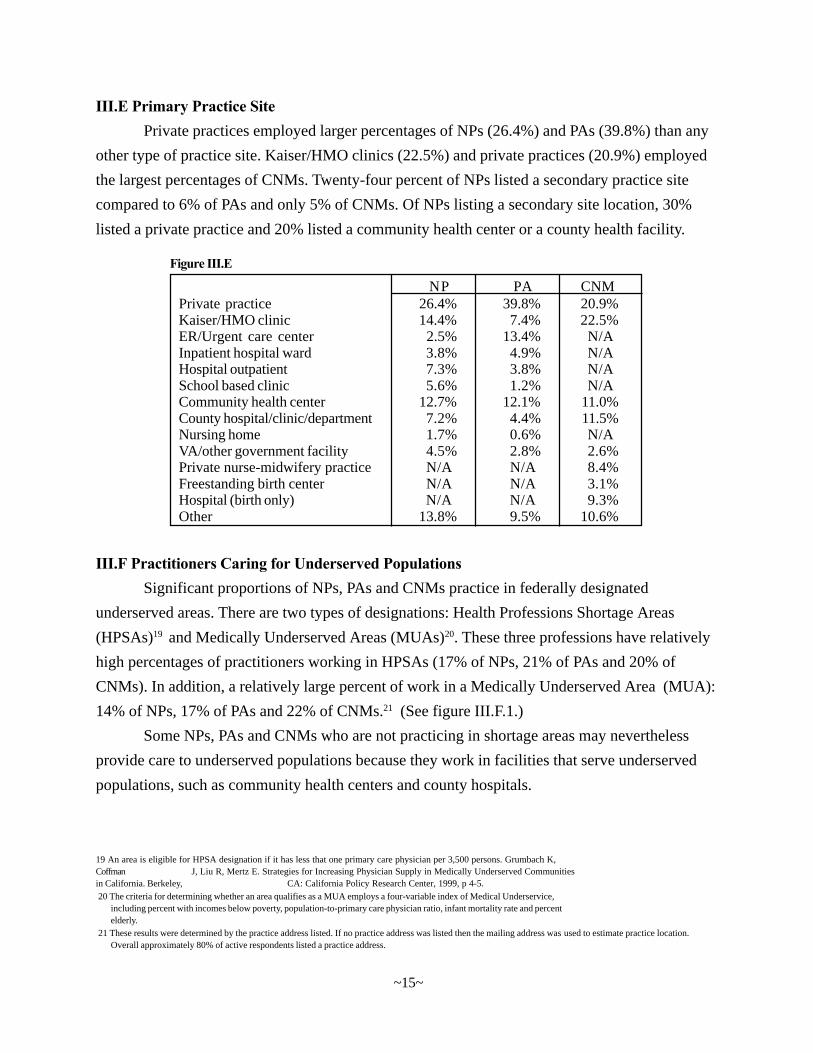
As figure III.F.2 shows, 47% of CNMs practice in underserved settings. This includes practitio-
ners working in either a HPSA,
MUA, community health center, or
county hospital. Thirty-nine percent
of NPs and PAs also practice in
underserved settings.
III.G Rural vs. Urban LocationMost practitioners surveyed are practicing in urban Medical Services Study Areas (MSSAs).22
Twelve percent of NPs and 16% of PAs and CNMs practice in rural MSSAs. These percentages are
roughly comparable to the percent of
the overall California population that
lives in rural MSSAs. MSSAs are
sub-county aggregations of census
tracts that are considered rational
service areas for health workforce
planning and for designation of areas with shortages of health professionals. An MSSA is defined as rural if the
population density is less than 250 per square mile and no significant portion of the MSSA is within a city
greater than or equal to 50,000 people.
PN AP MNC
ASPHanignikroW %9.61 %7.02 %9.91
AUMnanignikroW %6.31 %7.61 %6.12
Figure III.F.1Practitioners Working in Underserved Geographic Areas
Note: Both Urban/Rural location, and HPSA/MUA designation were determined by the practice address lised on the survey. If nopractice address was listed then the mailing address was used. Percent of Active practitioners listing a practice address:NP=80.3%, PA=81.6%,CNM=78.3%.
Figure III.F.2
* Based on MSSA designation**Source: 1996 Claritas Population Estimates and the Office of Statewide Helath Planning and Development
noitacoLecitcarP PN AP MNC noitalupoPAC
*nabrU %6.78 %0.48 %9.38 %5.68
*laruR %4.21 %0.61 %1.61 %3.31
Figure III.GPercent of Active California Practitioners (Urban vs. Rural)
22 The purpose of using Medical Service Study Areas (MSSAs) to analyze practice site location was to obtain a more accurate understanding of where practitionersare working. For instance, in California there are many large counties that have both urban and rural areas; MSSAs are smaller subsets of those counties which aremore appropriate for determining the characteristics of the communities primary care practitioners serve. MSSAs were originally designated by the California HealthManpower Policy Commission in 1976, and are reviewed every ten years. MSSAs are considered rational service areas for health professions analysis and programs.California is divided into 487 MSSAs. Rules for determining MSSAs: Census county divisions are to be used as the basic unit in forming the MSSA. Health SystemsAgency lines are to be preserved if possible, and given consideration where feasible. All communities within the MSSA are to be within twenty “constructive miles” (asdefined by the Public Utilities Commission) from the largest population center within that MSSA. (Codified by the California Health Manpower Policy Commission,March 2, 1983, revised June 11, 1997)
~16~
Chapter IVNP/PA/CNM Demographics
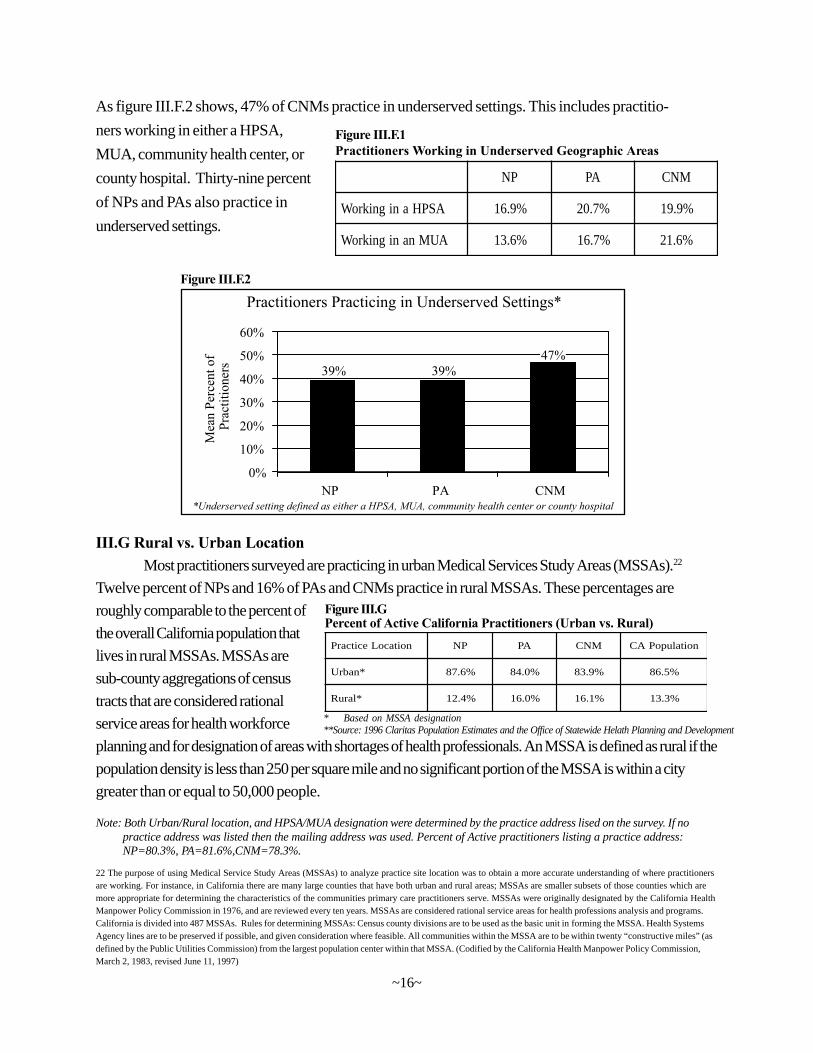
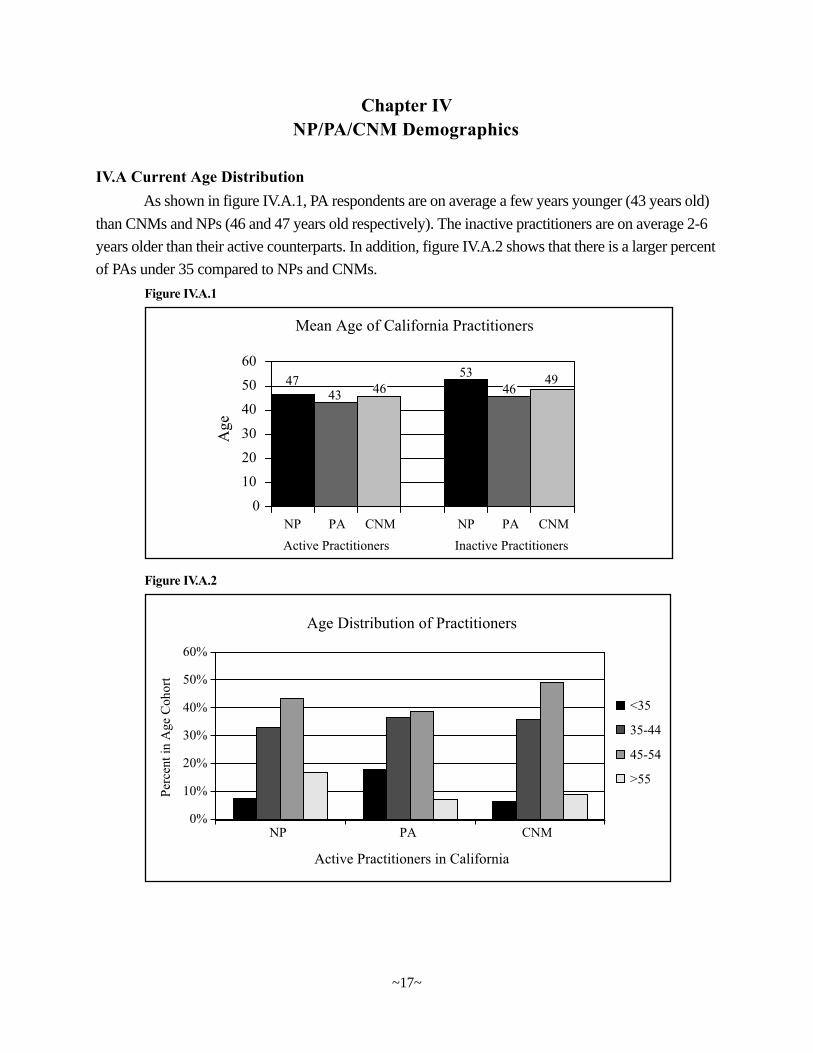
IV.A Current Age DistributionAs shown in figure IV.A.1, PA respondents are on average a few years younger (43 years old)
than CNMs and NPs (46 and 47 years old respectively). The inactive practitioners are on average 2-6
years older than their active counterparts. In addition, figure IV.A.2 shows that there is a larger percent
of PAs under 35 compared to NPs and CNMs.
Figure IV.A.1
Figure IV.A.2
~17~
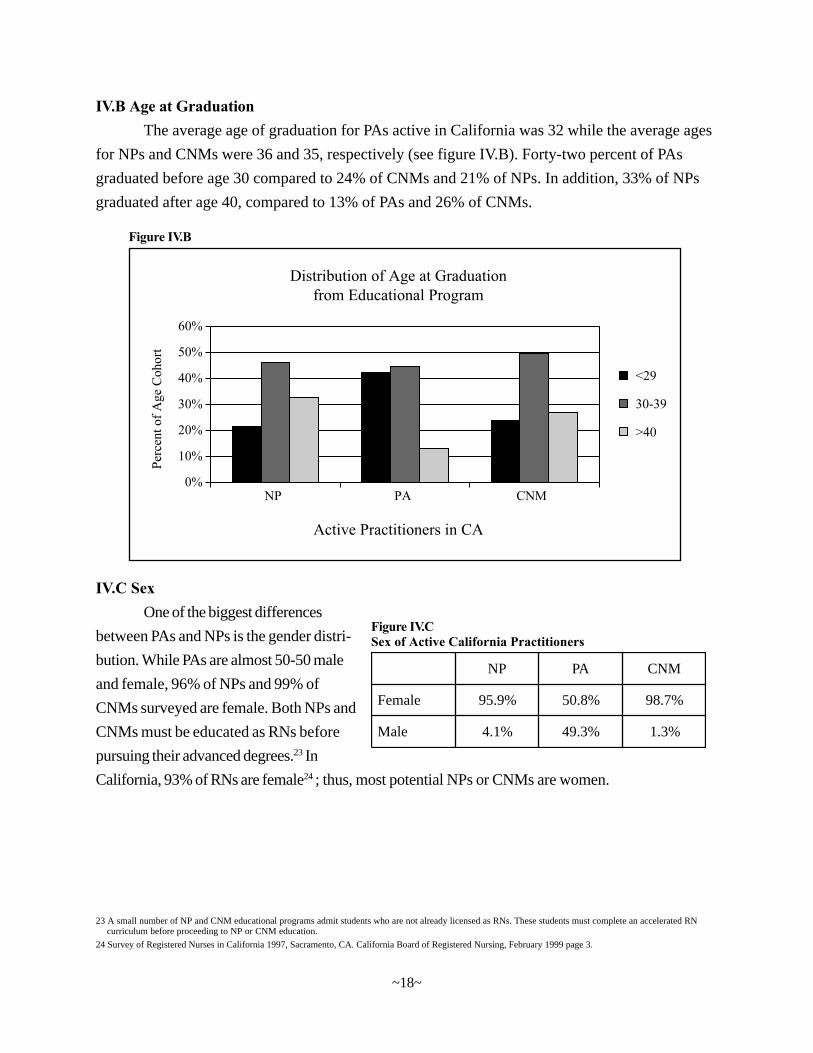
IV.B Age at GraduationThe average age of graduation for PAs active in California was 32 while the average ages
for NPs and CNMs were 36 and 35, respectively (see figure IV.B). Forty-two percent of PAs
graduated before age 30 compared to 24% of CNMs and 21% of NPs. In addition, 33% of NPs
graduated after age 40, compared to 13% of PAs and 26% of CNMs.
Figure IV.B
IV.C SexOne of the biggest differences
between PAs and NPs is the gender distri-
bution. While PAs are almost 50-50 male
and female, 96% of NPs and 99% of
CNMs surveyed are female. Both NPs and
CNMs must be educated as RNs before
pursuing their advanced degrees.23 In
California, 93% of RNs are female24; thus, most potential NPs or CNMs are women.
PN AP MNC
elameF %9.59 %8.05 %7.89
elaM %1.4 %3.94 %3.1
Figure IV.CSex of Active California Practitioners
~18~
24 Survey of Registered Nurses in California 1997, Sacramento, CA. California Board of Registered Nursing, February 1999 page 3.
curriculum before proceeding to NP or CNM education.23 A small number of NP and CNM educational programs admit students who are not already licensed as RNs. These students must complete an accelerated RN
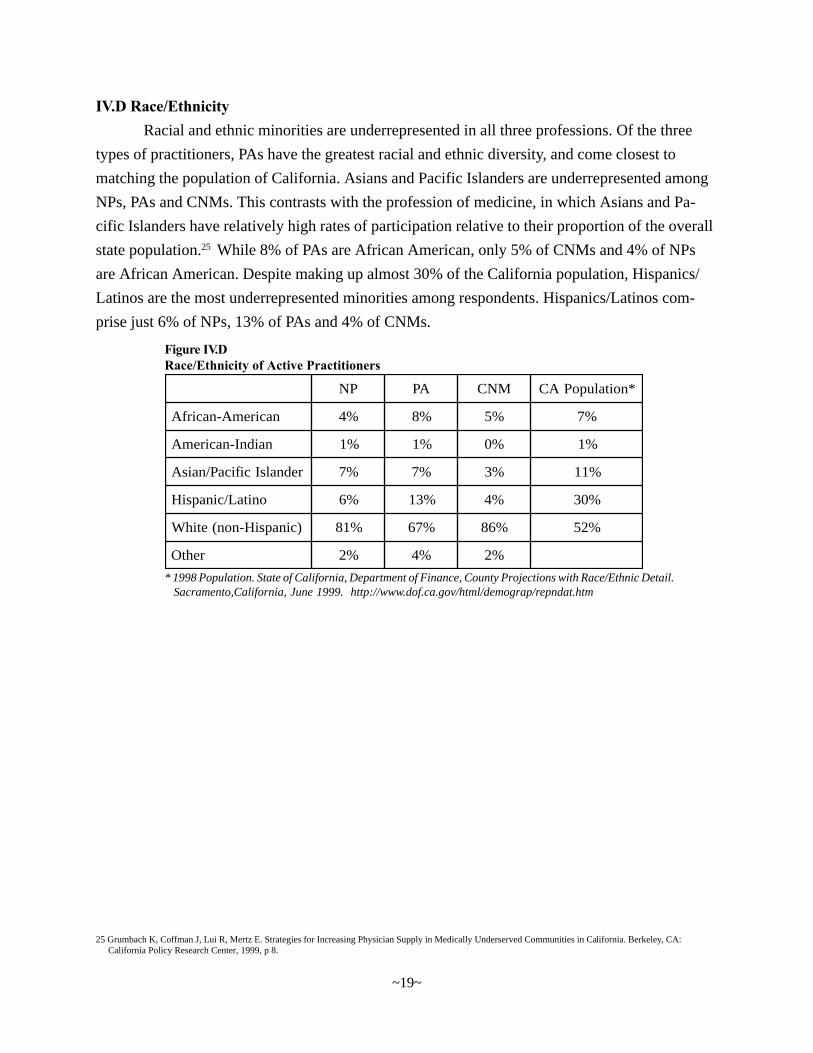
IV.D Race/EthnicityRacial and ethnic minorities are underrepresented in all three professions. Of the three
types of practitioners, PAs have the greatest racial and ethnic diversity, and come closest to
matching the population of California. Asians and Pacific Islanders are underrepresented among
NPs, PAs and CNMs. This contrasts with the profession of medicine, in which Asians and Pa-
cific Islanders have relatively high rates of participation relative to their proportion of the overall
state population.25 While 8% of PAs are African American, only 5% of CNMs and 4% of NPs
are African American. Despite making up almost 30% of the California population, Hispanics/
Latinos are the most underrepresented minorities among respondents. Hispanics/Latinos com-
prise just 6% of NPs, 13% of PAs and 4% of CNMs.
25 Grumbach K, Coffman J, Lui R, Mertz E. Strategies for Increasing Physician Supply in Medically Underserved Communities in California. Berkeley, CA: California Policy Research Center, 1999, p 8.
PN AP MNC *noitalupoPAC
naciremA-nacirfA %4 %8 %5 %7
naidnI-naciremA %1 %1 %0 %1
rednalsIcificaP/naisA %7 %7 %3 %11
onitaL/cinapsiH %6 %31 %4 %03
)cinapsiH-non(etihW %18 %76 %68 %25
rehtO %2 %4 %2
Figure IV.DRace/Ethnicity of Active Practitioners
* 1998 Population. State of California, Department of Finance, County Projections with Race/Ethnic Detail.Sacramento,California, June 1999. http://www.dof.ca.gov/html/demograp/repndat.htm
~19~
Chapter VCharacteristics of NP/P A/CNM’s Patients
Survey participants were asked to estimate percentages of patients in their practice during
1997 with respect to race/ethnicity, fluency in English and whether the patients were uninsured or
Medi-Cal beneficiaries. This chapter presents data derived from those estimates.
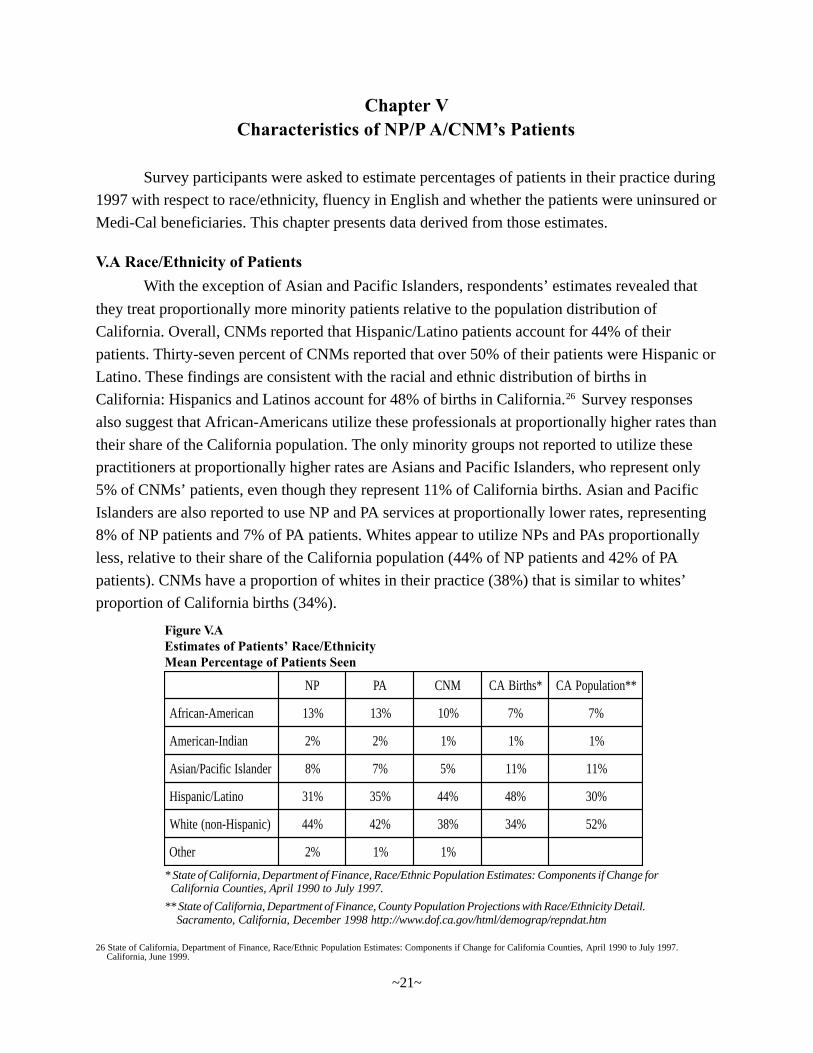
V.A Race/Ethnicity of PatientsWith the exception of Asian and Pacific Islanders, respondents’ estimates revealed that
they treat proportionally more minority patients relative to the population distribution of
California. Overall, CNMs reported that Hispanic/Latino patients account for 44% of their
patients. Thirty-seven percent of CNMs reported that over 50% of their patients were Hispanic or
Latino. These findings are consistent with the racial and ethnic distribution of births in
California: Hispanics and Latinos account for 48% of births in California.26 Survey responses
also suggest that African-Americans utilize these professionals at proportionally higher rates than
their share of the California population. The only minority groups not reported to utilize these
practitioners at proportionally higher rates are Asians and Pacific Islanders, who represent only
5% of CNMs’ patients, even though they represent 11% of California births. Asian and Pacific
Islanders are also reported to use NP and PA services at proportionally lower rates, representing
8% of NP patients and 7% of PA patients. Whites appear to utilize NPs and PAs proportionally
less, relative to their share of the California population (44% of NP patients and 42% of PA
patients). CNMs have a proportion of whites in their practice (38%) that is similar to whites’
proportion of California births (34%).
26 State of California, Department of Finance, Race/Ethnic Population Estimates: Components if Change for California Counties, April 1990 to July 1997.California, June 1999.
PN AP MNC *shtriBAC **noitalupoPAC
naciremA-nacirfA %31 %31 %01 %7 %7
naidnI-naciremA %2 %2 %1 %1 %1
rednalsIcificaP/naisA %8 %7 %5 %11 %11
onitaL/cinapsiH %13 %53 %44 %84 %03
)cinapsiH-non(etihW %44 %24 %83 %43 %25
rehtO %2 %1 %1
Figure V.AEstimates of Patients’ Race/EthnicityMean Percentage of Patients Seen
* State of California, Department of Finance, Race/Ethnic Population Estimates: Components if Change forCalifornia Counties, April 1990 to July 1997.
** State of California, Department of Finance, County Population Projections with Race/Ethnicity Detail.Sacramento, California, December 1998 http://www.dof.ca.gov/html/demograp/repndat.htm
~21~
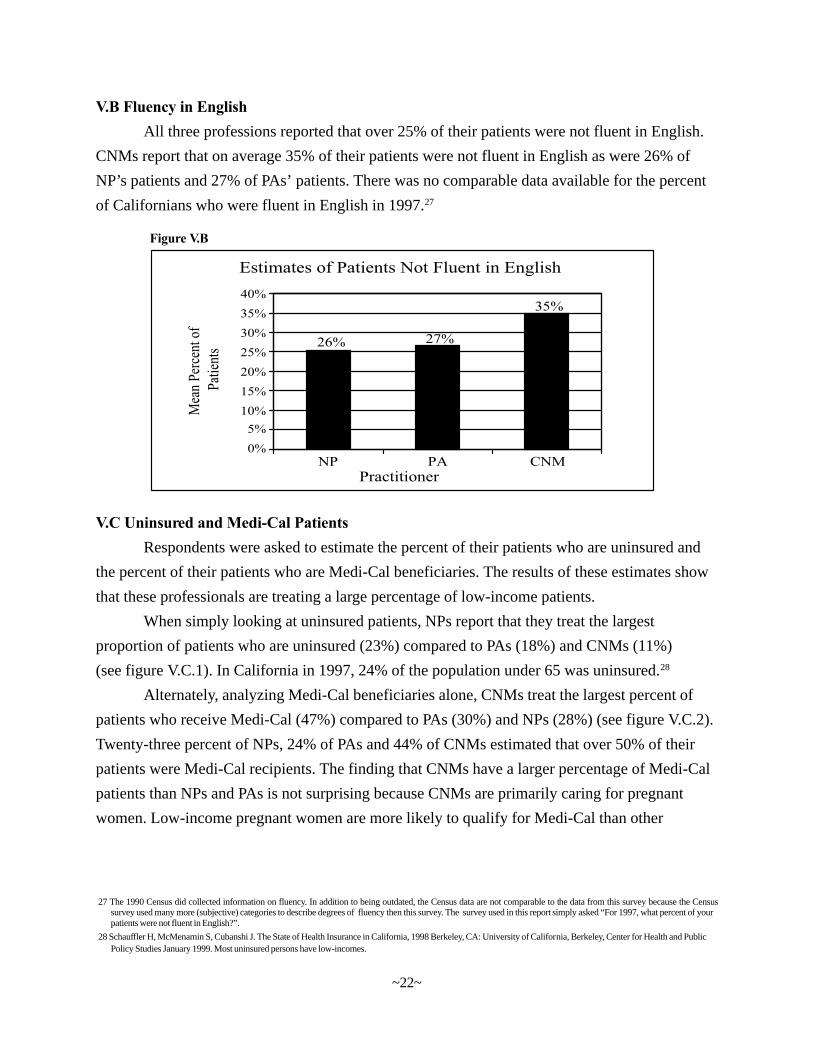
V.B Fluency in EnglishAll three professions reported that over 25% of their patients were not fluent in English.
CNMs report that on average 35% of their patients were not fluent in English as were 26% of
NP’s patients and 27% of PAs’ patients. There was no comparable data available for the percent
of Californians who were fluent in English in 1997.27
Figure V.B
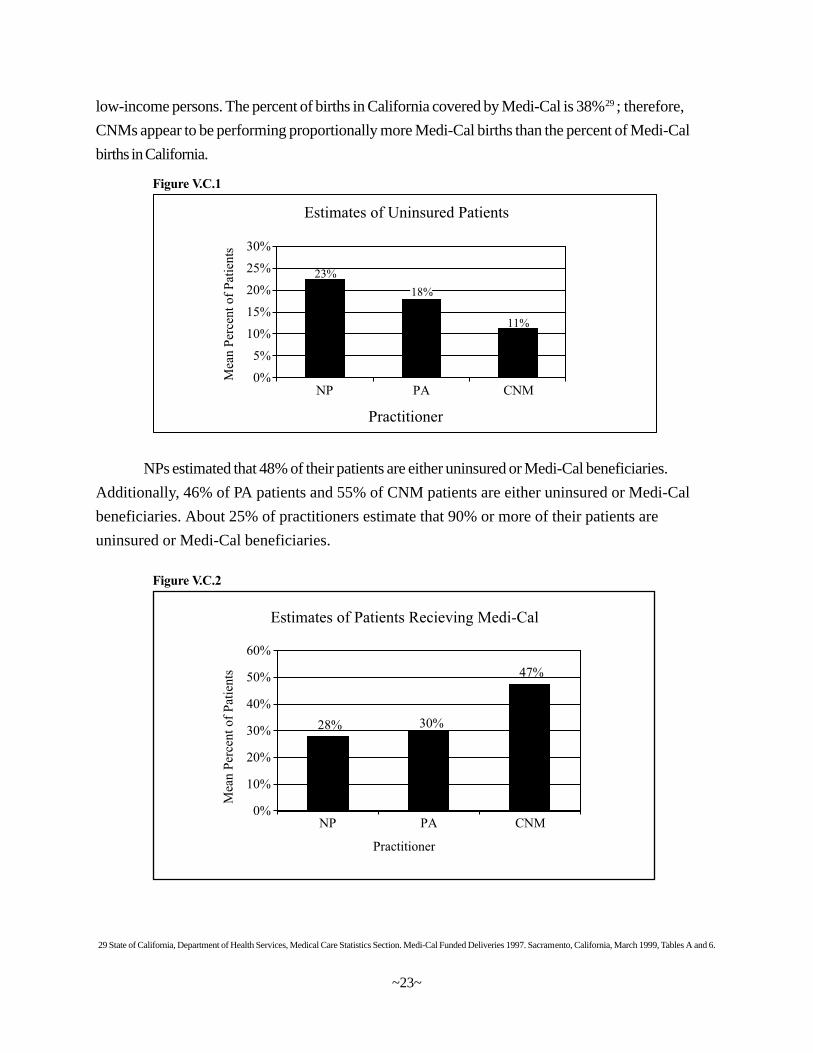
V.C Uninsured and Medi-Cal PatientsRespondents were asked to estimate the percent of their patients who are uninsured and
the percent of their patients who are Medi-Cal beneficiaries. The results of these estimates show
that these professionals are treating a large percentage of low-income patients.
When simply looking at uninsured patients, NPs report that they treat the largest
proportion of patients who are uninsured (23%) compared to PAs (18%) and CNMs (11%)
(see figure V.C.1). In California in 1997, 24% of the population under 65 was uninsured.28
Alternately, analyzing Medi-Cal beneficiaries alone, CNMs treat the largest percent of
patients who receive Medi-Cal (47%) compared to PAs (30%) and NPs (28%) (see figure V.C.2).
Twenty-three percent of NPs, 24% of PAs and 44% of CNMs estimated that over 50% of their
patients were Medi-Cal recipients. The finding that CNMs have a larger percentage of Medi-Cal
patients than NPs and PAs is not surprising because CNMs are primarily caring for pregnant
women. Low-income pregnant women are more likely to qualify for Medi-Cal than other
~22~
27 The 1990 Census did collected information on fluency. In addition to being outdated, the Census data are not comparable to the data from this survey because the Censussurvey used many more (subjective) categories to describe degrees of fluency then this survey. The survey used in this report simply asked “For 1997, what percent of yourpatients were not fluent in English?”.
28 Schauffler H, McMenamin S, Cubanshi J. The State of Health Insurance in California, 1998 Berkeley, CA: University of California, Berkeley, Center for Health and PublicPolicy Studies January 1999. Most uninsured persons have low-incomes.
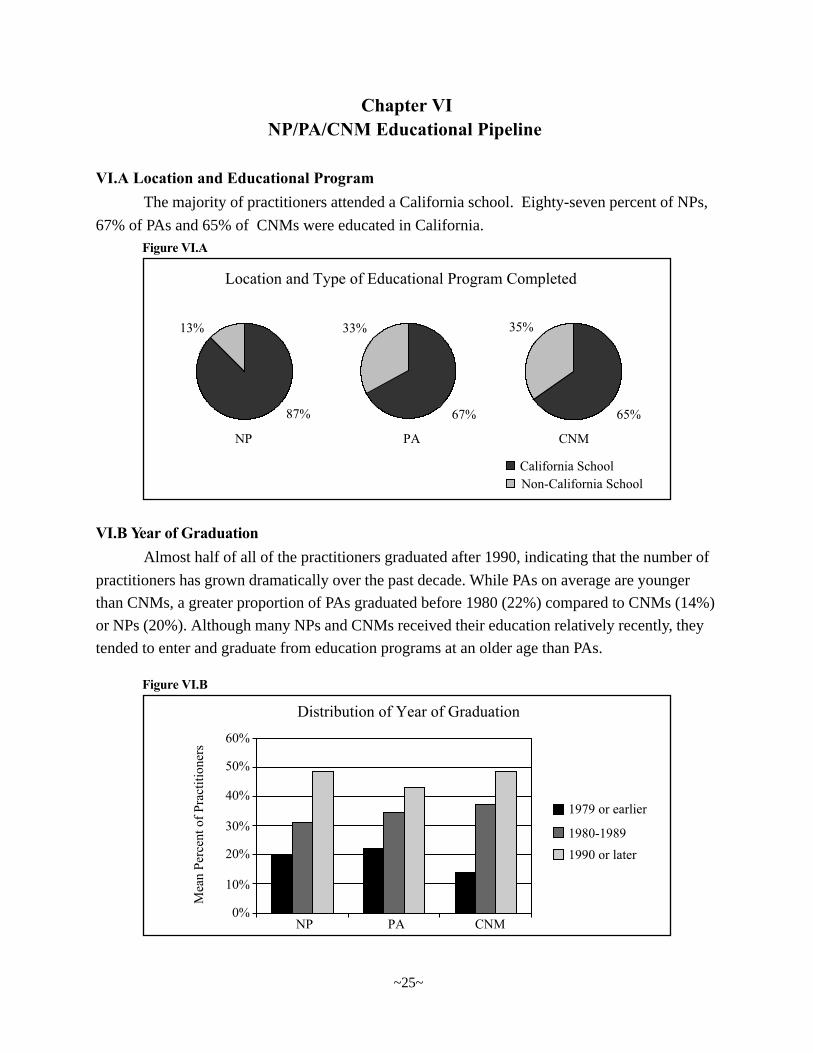
NPs estimated that 48% of their patients are either uninsured or Medi-Cal beneficiaries.
Additionally, 46% of PA patients and 55% of CNM patients are either uninsured or Medi-Cal
beneficiaries. About 25% of practitioners estimate that 90% or more of their patients are
uninsured or Medi-Cal beneficiaries.
low-income persons. The percent of births in California covered by Medi-Cal is 38%29; therefore,
CNMs appear to be performing proportionally more Medi-Cal births than the percent of Medi-Cal
births in California.
Figure V.C.2
Figure V.C.1
29 State of California, Department of Health Services, Medical Care Statistics Section. Medi-Cal Funded Deliveries 1997. Sacramento, California, March 1999, Tables A and 6.
~23~
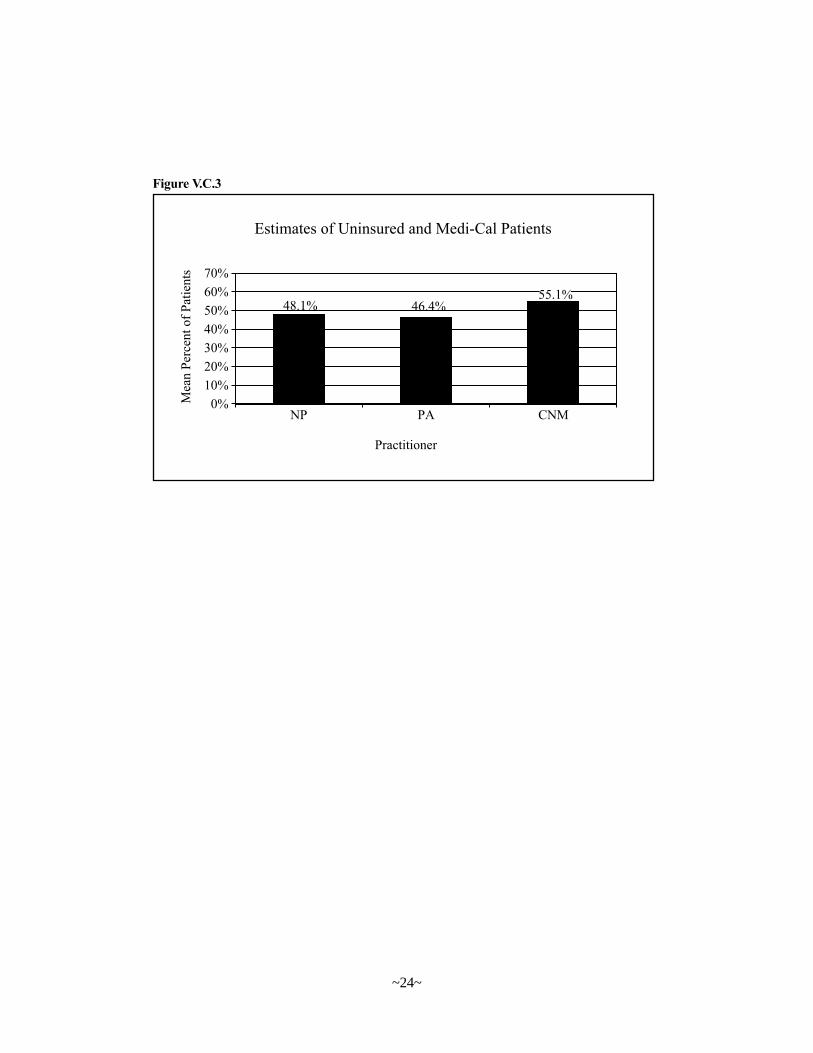
Figure V.C.3
~24~
Chapter VINP/PA/CNM Educational Pipeline
VI.A Location and Educational ProgramThe majority of practitioners attended a California school. Eighty-seven percent of NPs,
67% of PAs and 65% of CNMs were educated in California.Figure VI.A
VI.B Year of GraduationAlmost half of all of the practitioners graduated after 1990, indicating that the number of
practitioners has grown dramatically over the past decade. While PAs on average are younger
than CNMs, a greater proportion of PAs graduated before 1980 (22%) compared to CNMs (14%)
or NPs (20%). Although many NPs and CNMs received their education relatively recently, they
tended to enter and graduate from education programs at an older age than PAs.
Figure VI.B
~25~
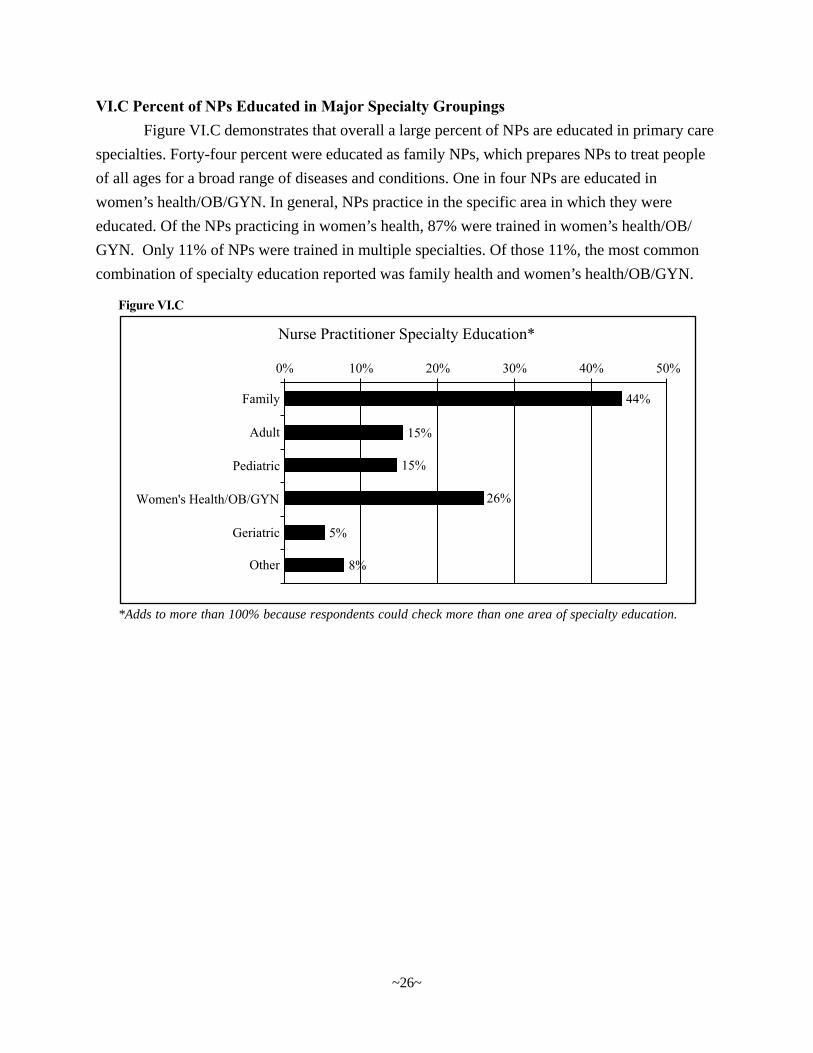
VI.C Percent of NPs Educated in Major Specialty GroupingsFigure VI.C demonstrates that overall a large percent of NPs are educated in primary care
specialties. Forty-four percent were educated as family NPs, which prepares NPs to treat people
of all ages for a broad range of diseases and conditions. One in four NPs are educated in
women’s health/OB/GYN. In general, NPs practice in the specific area in which they were
educated. Of the NPs practicing in women’s health, 87% were trained in women’s health/OB/
GYN. Only 11% of NPs were trained in multiple specialties. Of those 11%, the most common
combination of specialty education reported was family health and women’s health/OB/GYN.
Figure VI.C
*Adds to more than 100% because respondents could check more than one area of specialty education.
~26~
Chapter VIICNMs
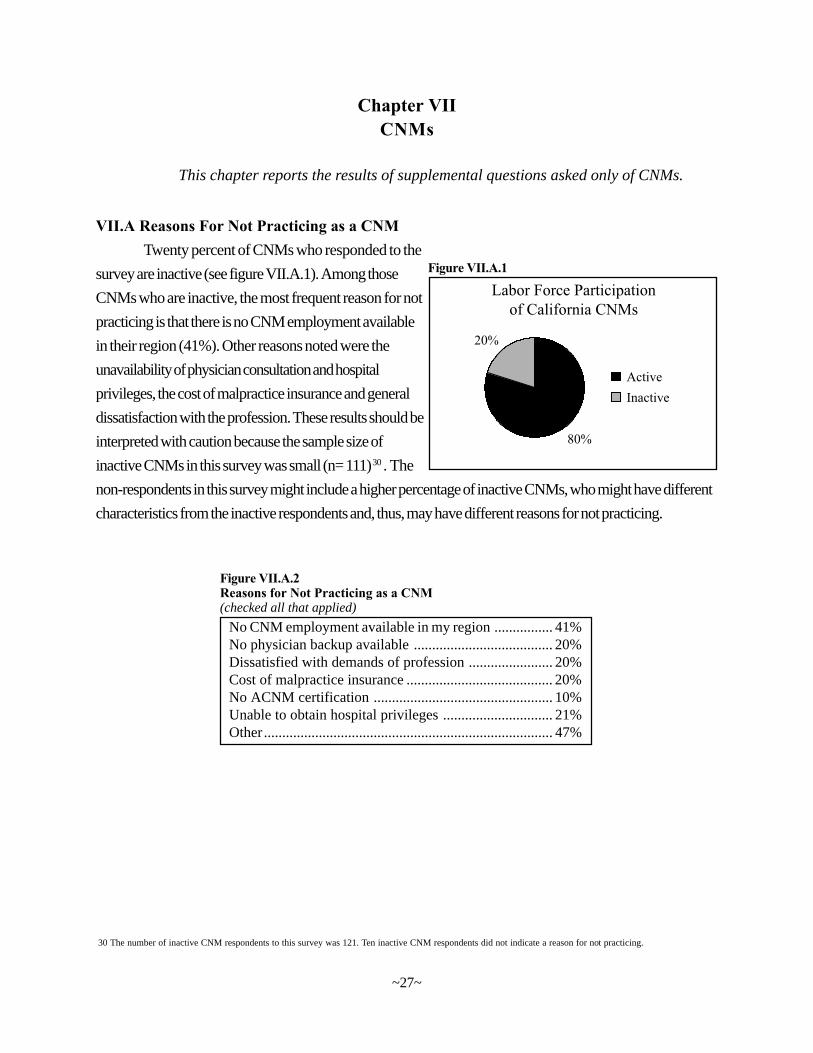
VII.A Reasons For Not Practicing as a CNMTwenty percent of CNMs who responded to the
survey are inactive (see figure VII.A.1). Among those
CNMs who are inactive, the most frequent reason for not
practicing is that there is no CNM employment available
in their region (41%). Other reasons noted were the
unavailability of physician consultation and hospital
privileges, the cost of malpractice insurance and general
dissatisfaction with the profession. These results should be
interpreted with caution because the sample size of
inactive CNMs in this survey was small (n= 111) 30. The
non-respondents in this survey might include a higher percentage of inactive CNMs, who might have different
characteristics from the inactive respondents and, thus, may have different reasons for not practicing.
No CNM employment available in my region ................ 41%No physician backup available ...................................... 20%Dissatisfied with demands of profession ....................... 20%Cost of malpractice insurance ........................................ 20%No ACNM certification ................................................. 10%Unable to obtain hospital privileges .............................. 21%Other............................................................................... 47%
Figure VII.A.2Reasons for Not Practicing as a CNM(checked all that applied)
This chapter reports the results of supplemental questions asked only of CNMs.
30 The number of inactive CNM respondents to this survey was 121. Ten inactive CNM respondents did not indicate a reason for not practicing.
~27~
Figure VII.A.1
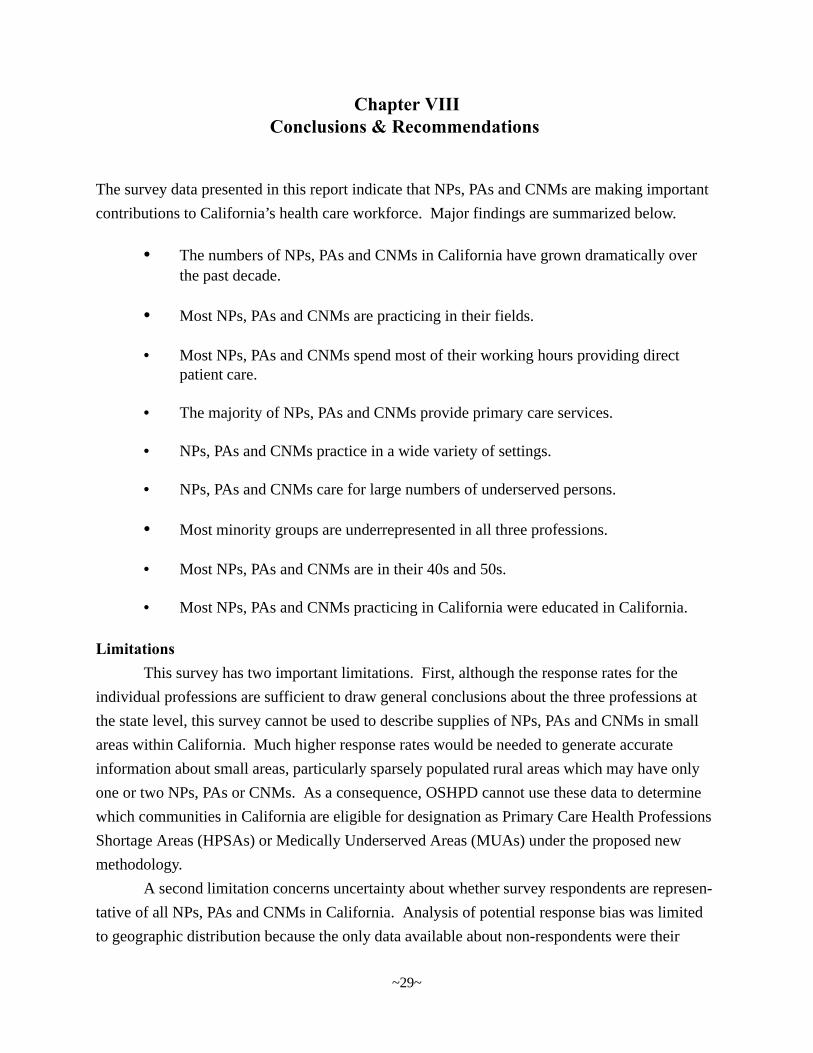
VII.C Type of CNM Educational Program CompletedFigure VII.C.1 shows that 55% of active CNMs have completed a basic certificate pro-
gram, 39% have completed a masters program and 6% have completed a post-masters certificate
program.
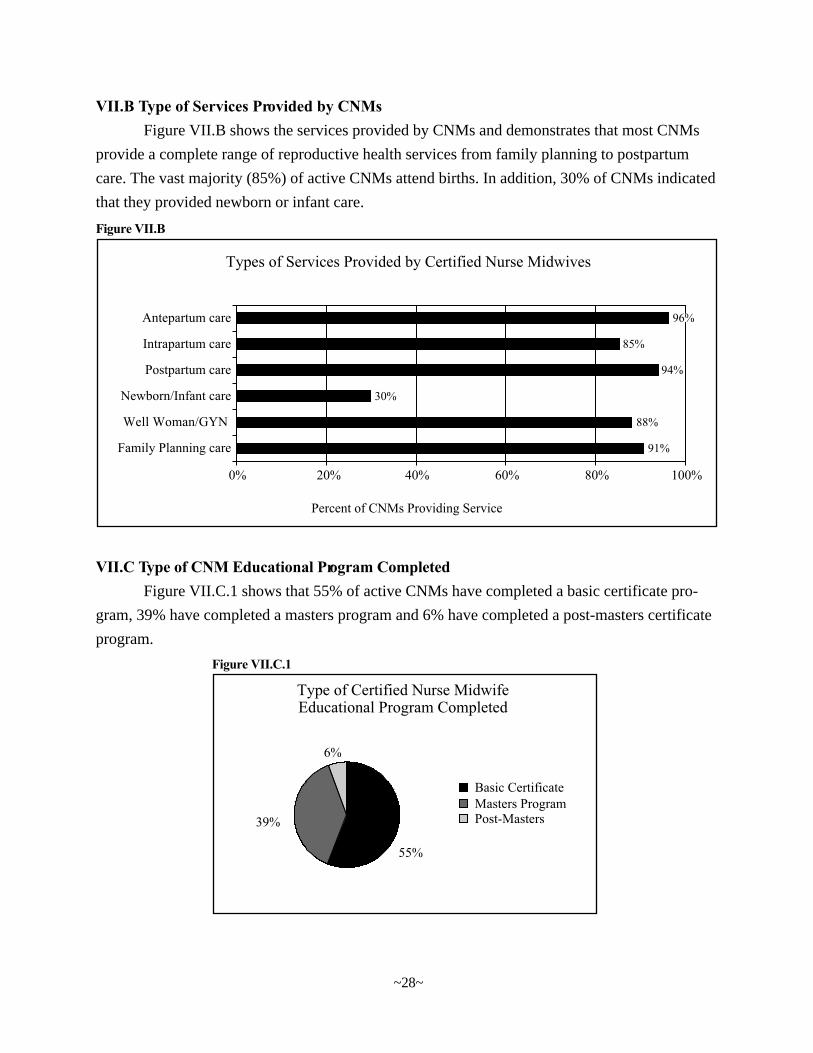
VII.B Type of Services Provided by CNMsFigure VII.B shows the services provided by CNMs and demonstrates that most CNMs
provide a complete range of reproductive health services from family planning to postpartum
care. The vast majority (85%) of active CNMs attend births. In addition, 30% of CNMs indicated
that they provided newborn or infant care.
Figure VII.B
Figure VII.C.1
~28~
Chapter VIIIConclusions & Recommendations
The survey data presented in this report indicate that NPs, PAs and CNMs are making important
contributions to California’s health care workforce. Major findings are summarized below.
• The numbers of NPs, PAs and CNMs in California have grown dramatically overthe past decade.
• Most NPs, PAs and CNMs are practicing in their fields.
• Most NPs, PAs and CNMs spend most of their working hours providing directpatient care.
• The majority of NPs, PAs and CNMs provide primary care services.
• NPs, PAs and CNMs practice in a wide variety of settings.
• NPs, PAs and CNMs care for large numbers of underserved persons.
• Most minority groups are underrepresented in all three professions.
• Most NPs, PAs and CNMs are in their 40s and 50s.
• Most NPs, PAs and CNMs practicing in California were educated in California.
LimitationsThis survey has two important limitations. First, although the response rates for the
individual professions are sufficient to draw general conclusions about the three professions at
the state level, this survey cannot be used to describe supplies of NPs, PAs and CNMs in small
areas within California. Much higher response rates would be needed to generate accurate
information about small areas, particularly sparsely populated rural areas which may have only
one or two NPs, PAs or CNMs. As a consequence, OSHPD cannot use these data to determine
which communities in California are eligible for designation as Primary Care Health Professions
Shortage Areas (HPSAs) or Medically Underserved Areas (MUAs) under the proposed new
methodology.
A second limitation concerns uncertainty about whether survey respondents are represen-
tative of all NPs, PAs and CNMs in California. Analysis of potential response bias was limited
to geographic distribution because the only data available about non-respondents were their
~29~
mailing addresses. An analysis of response rates by county found minimal differences across counties.
This suggests the results are not biased toward NPs, PAs and CNMs in any particular region within the
state. In addition, estimates of NPs and PAs’ demographic characteristics were very similar to those
from a 1995 survey of California NPs31 and from the California subsample of 1998 survey of PAs32,
respectively. However, there may be some important differences between respondents and non-
respondents. For example, the survey may overstate the percentages of NPs, PAs and CNMs in active
practice because individuals who are not practicing may have been less likely to complete the survey.
31 Gilliss CL. The 1995 California NP Data Base Project – A Report to the California Office of Statewide Health Planning and Development. San Francisco:UCSF Department of Family Health Care Nursing, June 1995.32 American Academy of Physician Assistants. Physician Assistant Statistics and Trends, 1991-1998. Alexandria, VA: American Academy of PhysicianAssistants, 1999.
~30~
Recommendations
The California Board of Registered Nursing (BRN) should collect basic informationabout CNMs and NPs in conjunction with licensure application and renewal and make thisinformation available to other state agencies and to researchers. The California PhysicianAssistant Examining Committee (PAEC) should collect similar data about PAs.
Information about NPs, PAs and CNMs’ demographic characteristics and their education
should be collected at the time of initial application for licensure in California (upon completion
of education or relocation from another state). Brief surveys about practice location and
employment patterns should be sent to licensees with licensure renewal materials to ensure that
this information is current. Information collected through initial application and renewal surveys
should be entered into a database that is updated regularly and shared with OSHPD. Other states,
such as New York, have successfully implemented similar surveys.
California policymakers could use information obtained from licensing board surveys for
a variety of purposes. Unlike data from the current survey, information obtained from licensing
board surveys could be used by OSHPD in reviewing requests for HPSA and MUA designations
because data would be collected on all NPs, PAs and CNMs licensed to practice in the state.
OSHPD and other state agencies could also use these data to track the practice locations of NPs,
PAs and CNMs participating in the State Loan Repayment Program, graduates of NP and PA
education programs receiving Song-Brown funds, and participants in other programs aimed at
increasing the supplies of NPs, PAs and CNMs in shortage areas. Finally, researchers could use
these data to analyze trends over time in the employment patterns, geographic distribution and
demographic characteristics of these professionals.
Monitoring trends in the supply of NPs, PAs and CNMs also will be important for
informing educational policies in California. A majority of these professionals received their

education in institutions that receive public funds. The recent rapid growth in the supply of these profes-
sionals may reflect greater demand for a more professionally diversified clinician workforce. Ongoing
evaluation will be required to ensure that the future supply and distribution of these professionals is
appropriate to the state’s workforce requirements.
The benefits of obtaining more timely, complete and accurate data about these professions
outweigh the costs of surveying them in conjunction with licensure application and renewal.
Implementing such surveys would require initial investment of resources at the BRN and PAEC
to develop survey instruments and electronic databases. However, once this infrastructure is
developed the incremental costs of distributing surveys and entering data would be minimal.
The BRN already has legislative authority to collect such data and share them with
OSHPD.33 In addition, the BRN already collects some relevant data through its periodic sample
surveys of registered nurses and a project conducted with the National Council of State Boards of
Nursing. New legislation would be needed to authorize the PAEC to collect and disseminate
comparable data on PAs.34
33 California Health and Safety Code. Sections 127750-127800.34 At one time, the Medical Board and its committees, such as the PAEC, had authority to collect workforce data and share them with OSHPD. However, this authority
was repealed by Chapter 1206 of the California Statutes of 1994.
~31~

APPENDIX
~33~
~34~
~35~
~36~