Embed Size (px)
Citation preview
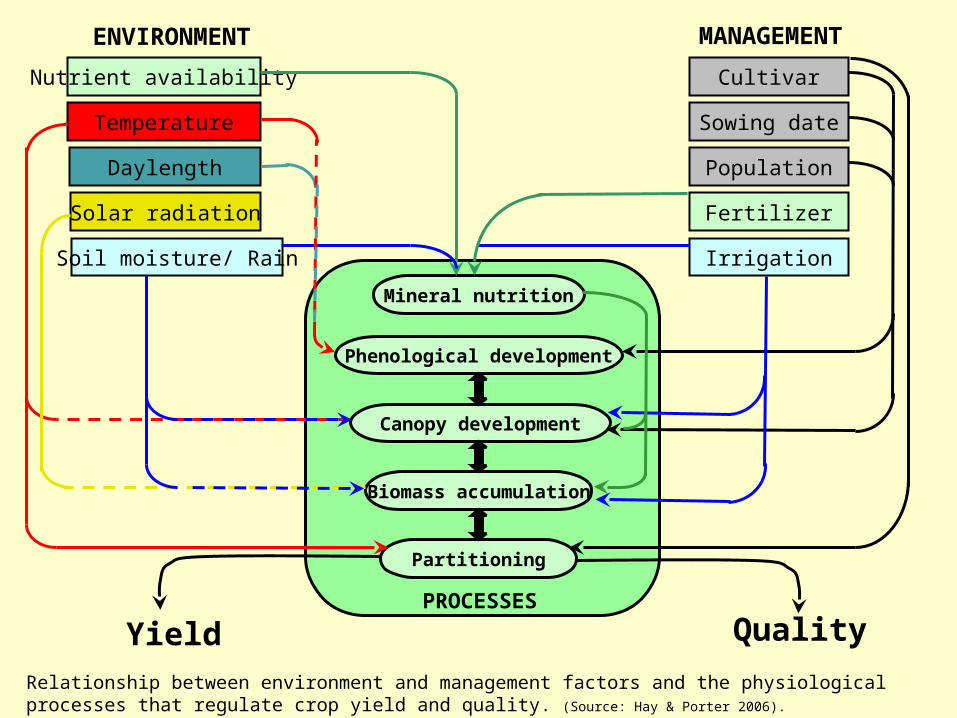
Nutrient availability
Temperature
Daylength
Solar radiation
Soil moisture/ Rain Irrigation
Fertilizer
Population
Sowing date
Cultivar
Mineral nutrition
Phenological development
Canopy development
Biomass accumulation
Partitioning
Yield QualityPROCESSES
ENVIRONMENT MANAGEMENT
Relationship between environment and management factors and the physiological processes that regulate crop yield and quality. (Source: Hay & Porter 2006).
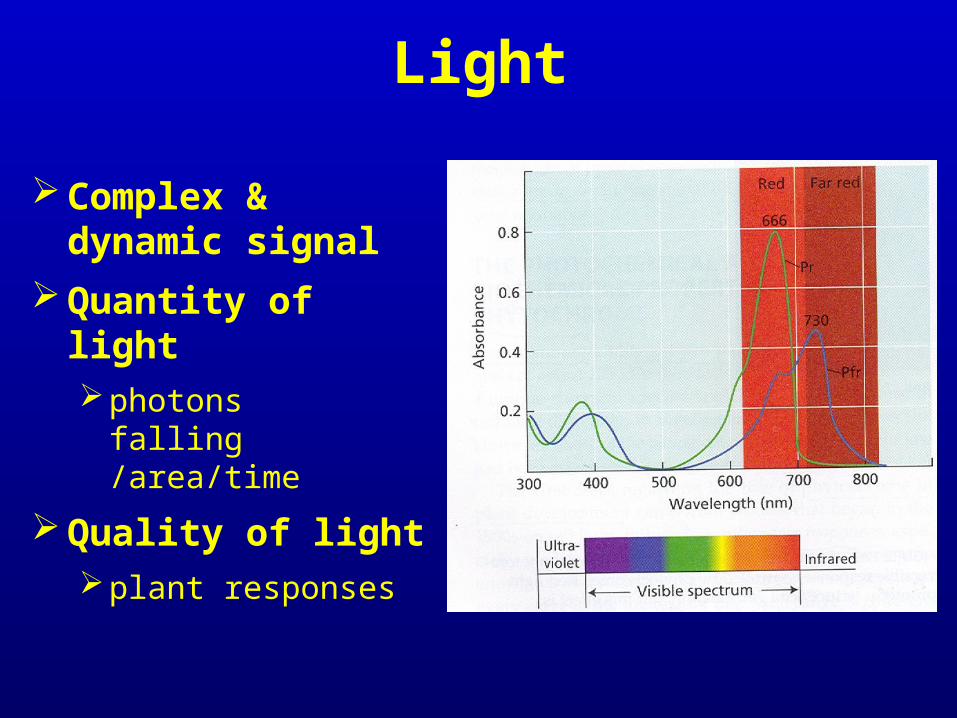
Light
Complex & dynamic signal
Quantity of lightphotons falling
/area/time
Quality of lightplant responses
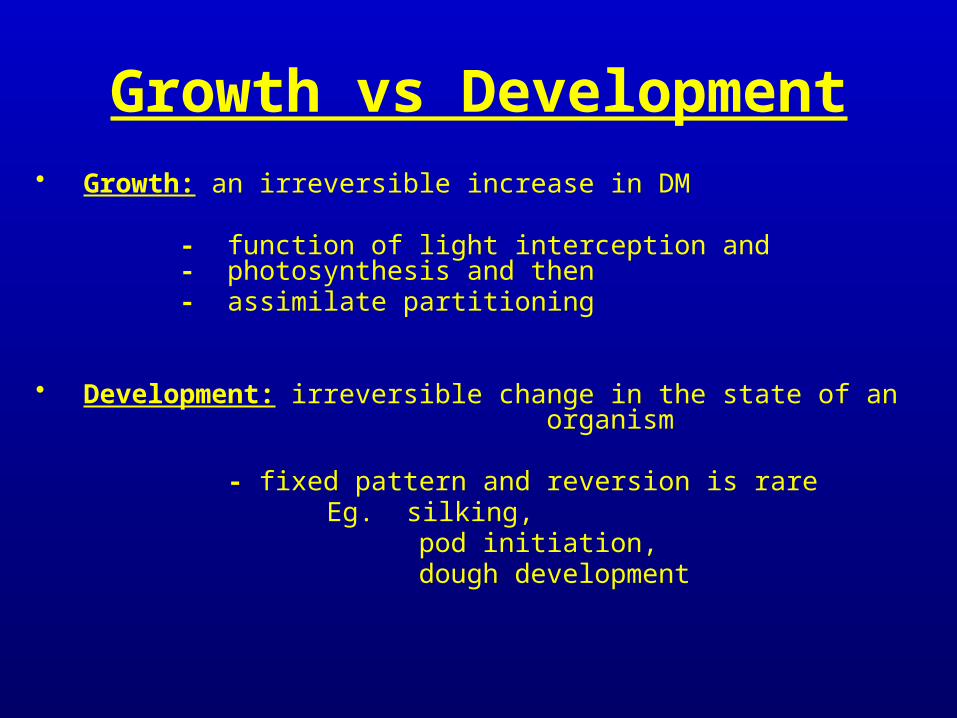
Growth vs Development• Growth: an irreversible increase in DM
- function of light interception and - photosynthesis and then
- assimilate partitioning
• Development: irreversible change in the state of an organism
- fixed pattern and reversion is rareEg. silking,
pod initiation, dough development
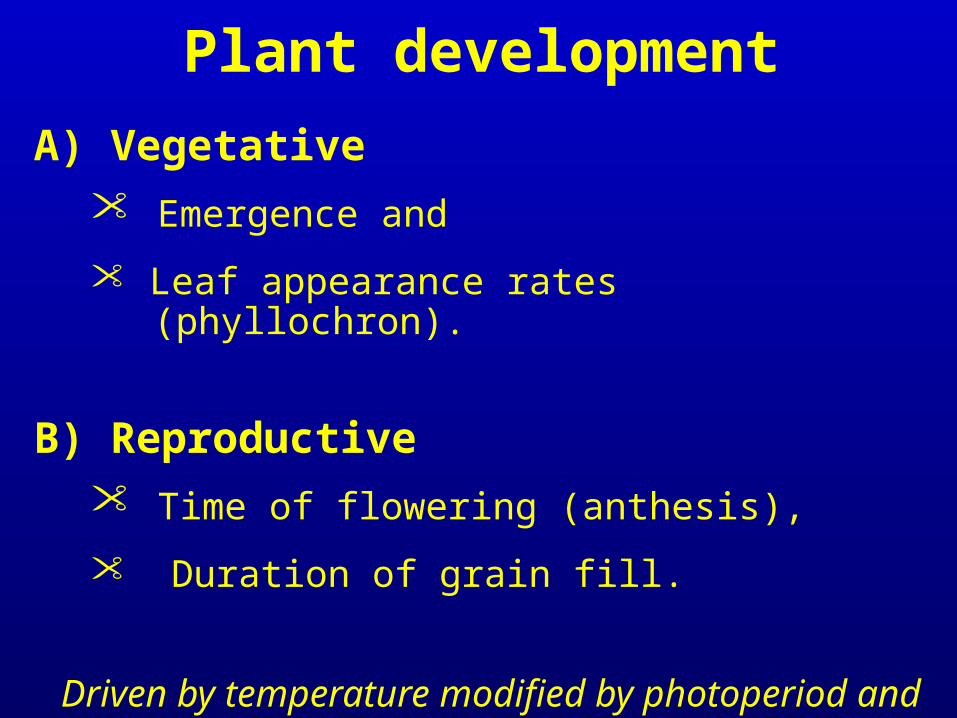
A) Vegetative
• Emergence and
• Leaf appearance rates (phyllochron).
B) Reproductive
• Time of flowering (anthesis),
• Duration of grain fill.
Driven by temperature modified by photoperiod and vernalization
Plant development
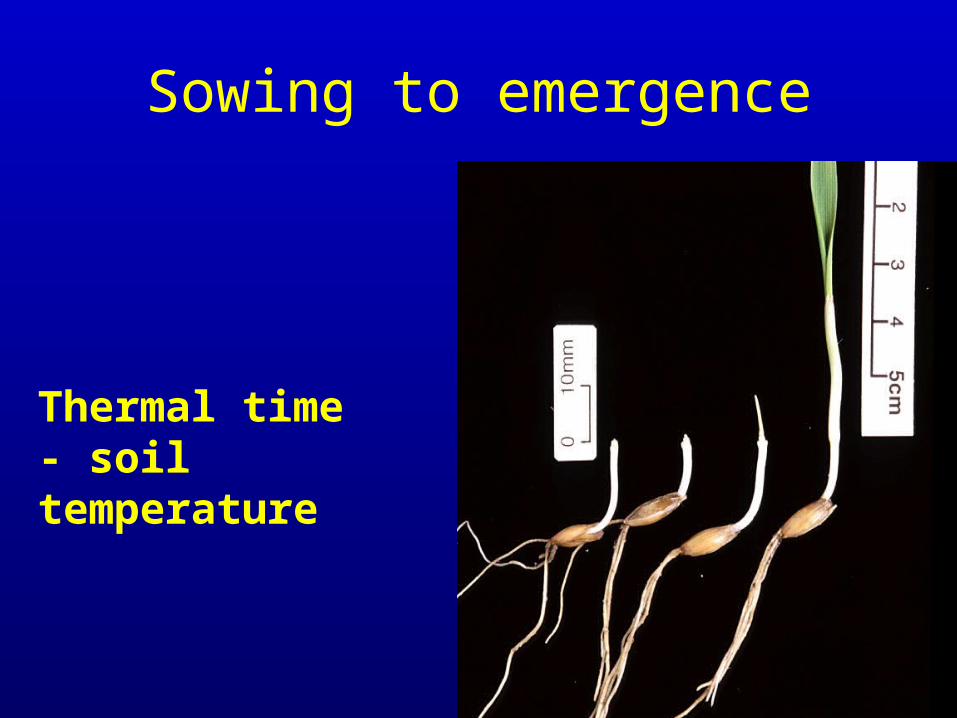
Sowing to emergence
Thermal time - soil temperature
Temperature (°C)
0 10 20 30 40Day
s to
75%
ger
min
atio
n
0
5
10
15
20
25
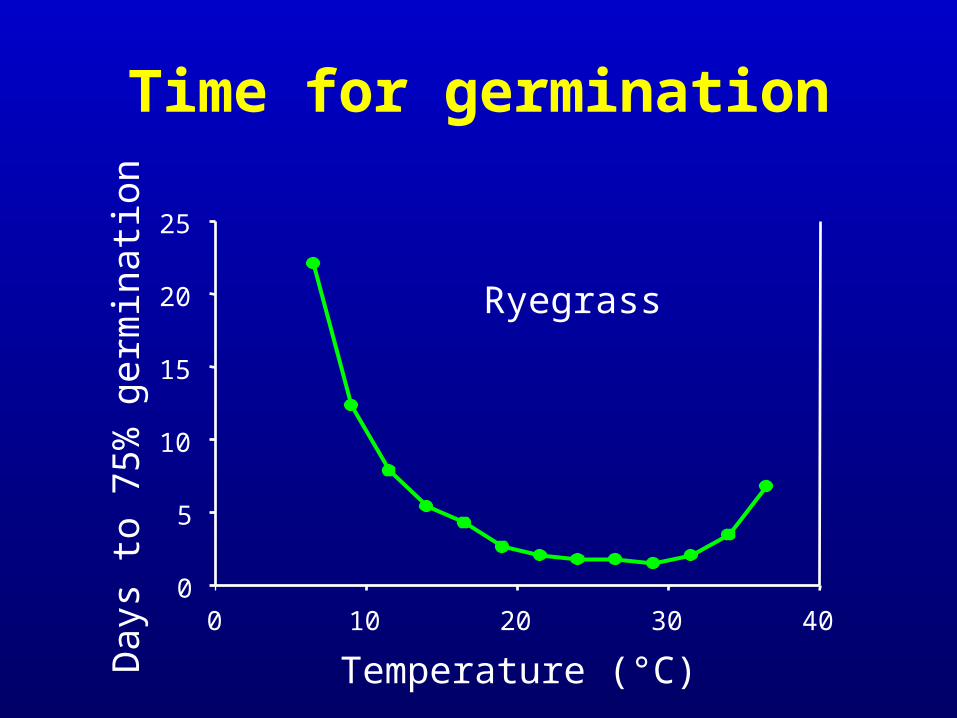
Ryegrass
Time for germination
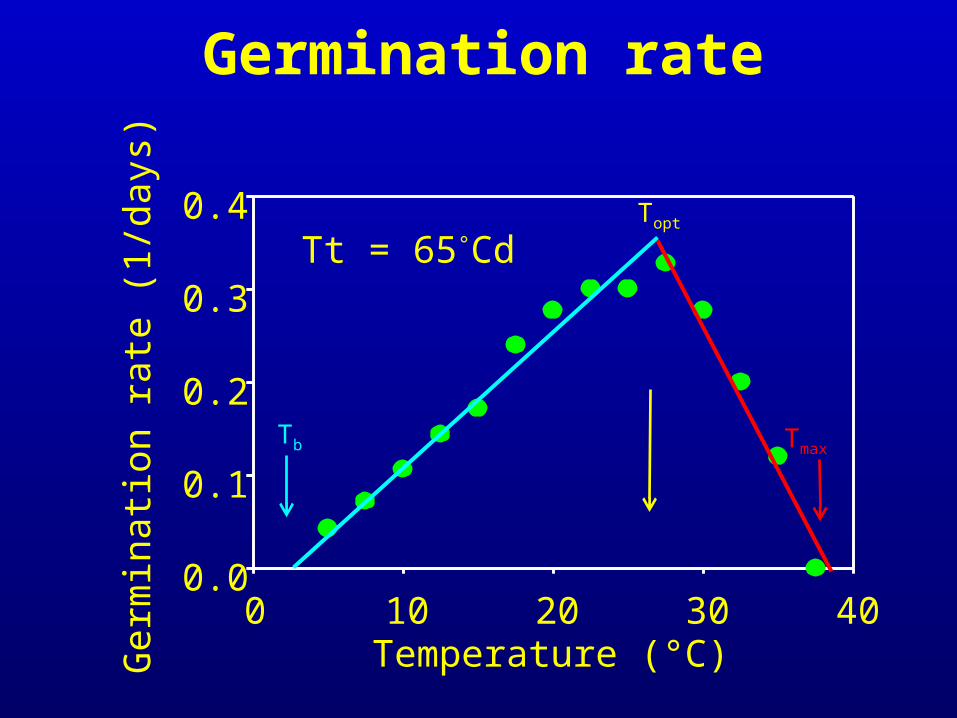
0 10 20 30 40Ger
min
atio
n ra
te (
1/da
ys)
0.0
0.1
0.2
0.3
0.4
Temperature (°C)
Germination rate
Tb
Topt
Tt = 65°Cd
Tmax
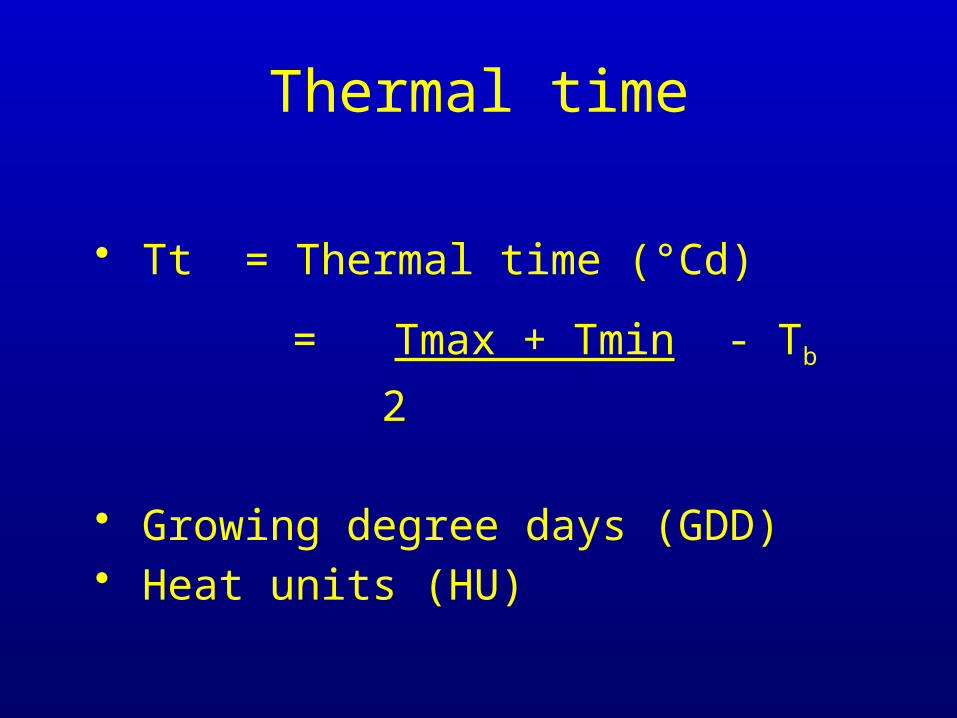
Thermal time
• Tt = Thermal time (°Cd)
= Tmax + Tmin - Tb
2
• Growing degree days (GDD) • Heat units (HU)
20
15
10
5
0
20
30
10
00 3 6 129 15 18
Mean temperature (oC)
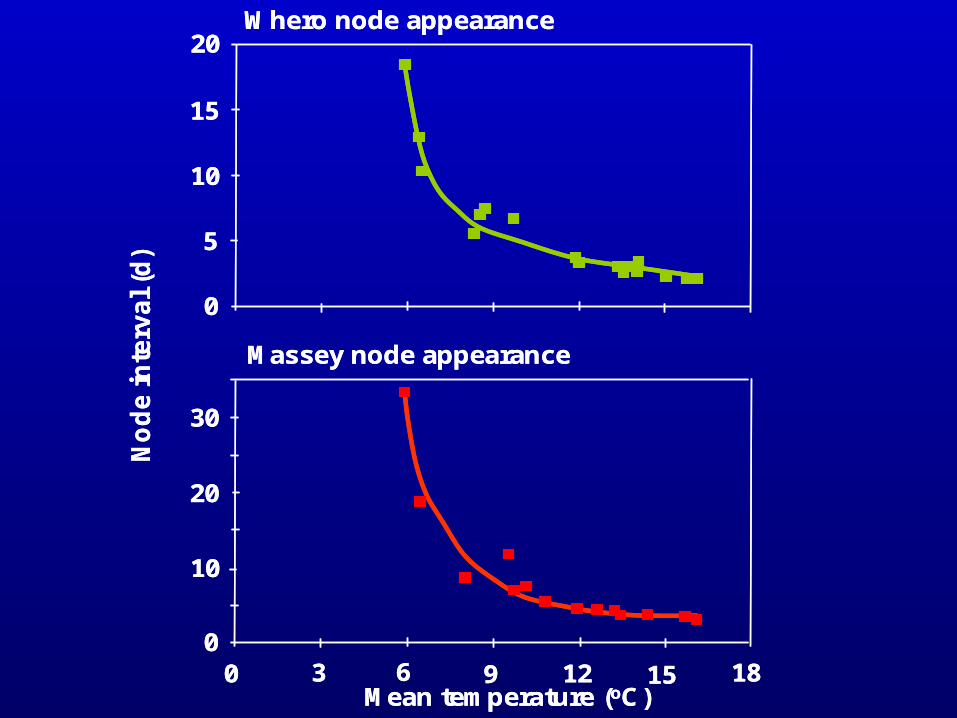
No
de
in
terv
al
(d)
Massey node appearance
Whero node appearance20
15
10
5
0
20
30
10
00 3 6 129 15 18
Mean temperature (oC)
No
de
in
terv
al
(d)
Massey node appearance
Whero node appearance
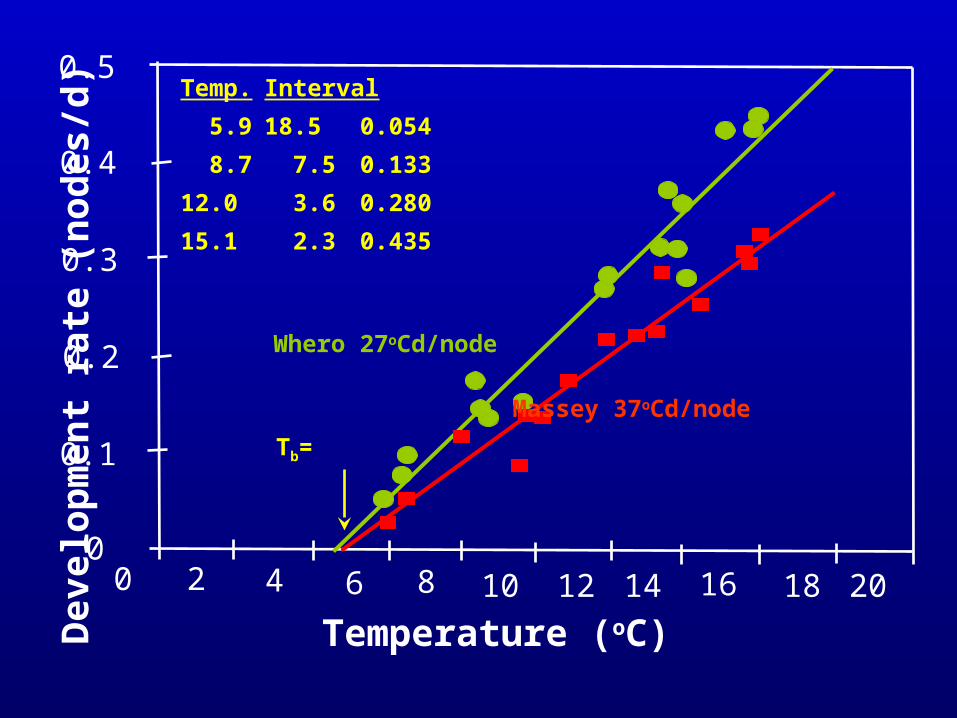
Tb=
Temperature (oC)
0.5
0.4
0.3
0.2
0.1
00 2 8 10 12 14 16 18 204 6
Whero 27oCd/node
Dev
elo
pm
ent
rate
(n
od
es/d
)
Massey 37oCd/node
Temp. Interval
5.9 18.5 0.054
8.7 7.5 0.133
12.0 3.6 0.280
15.1 2.3 0.435
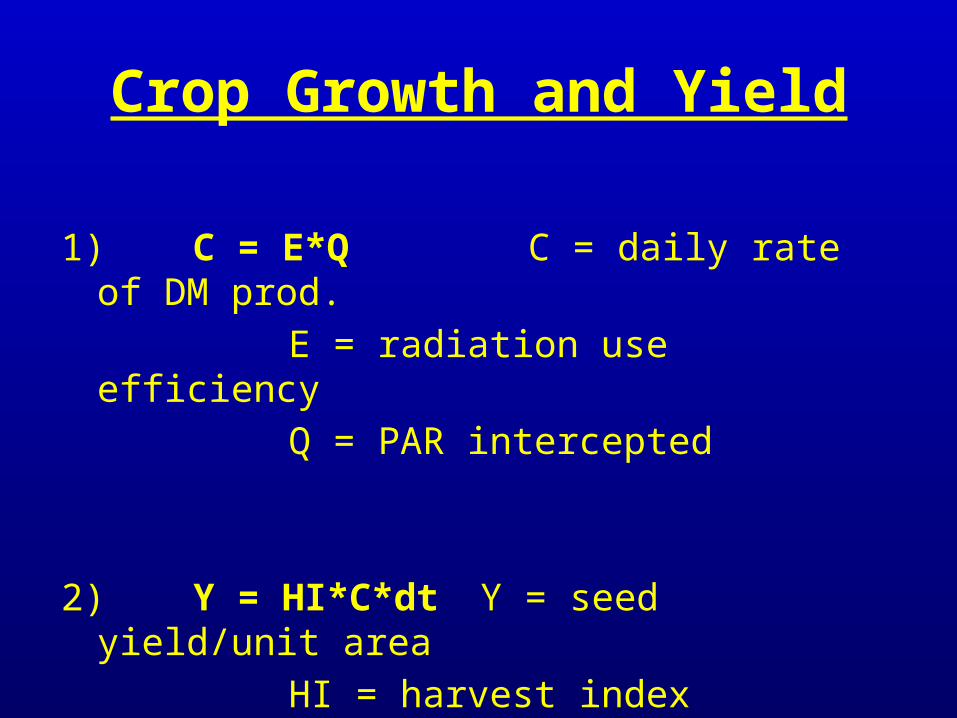
Crop Growth and Yield
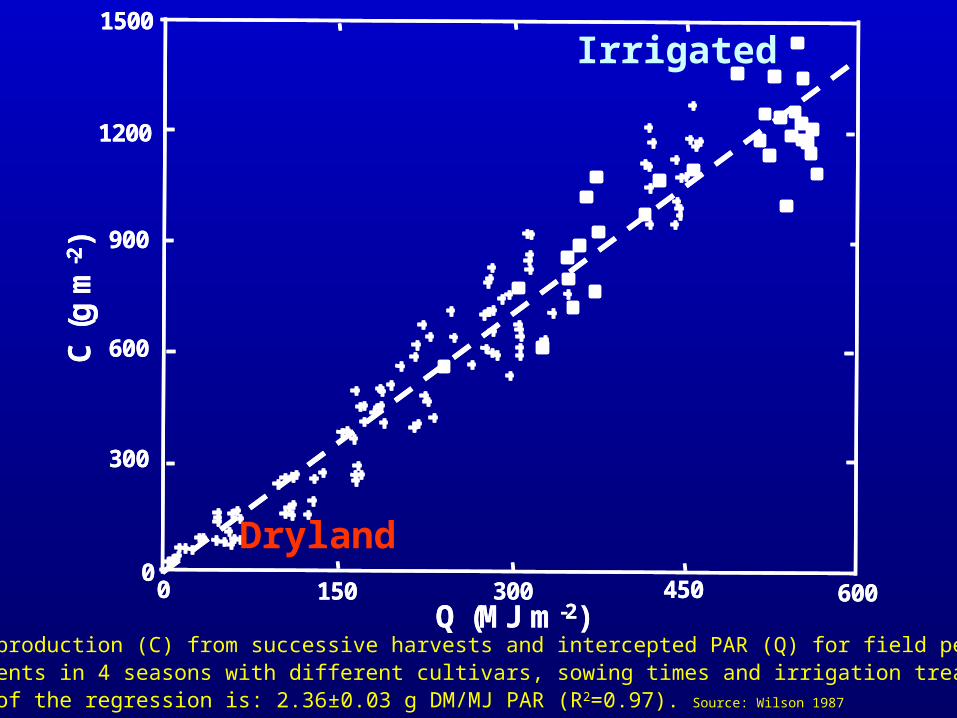
1) C = E*Q C = daily rate of DM prod.
E = radiation use efficiency
Q = PAR intercepted
2) Y = HI*C*dt Y = seed yield/unit area
HI = harvest index
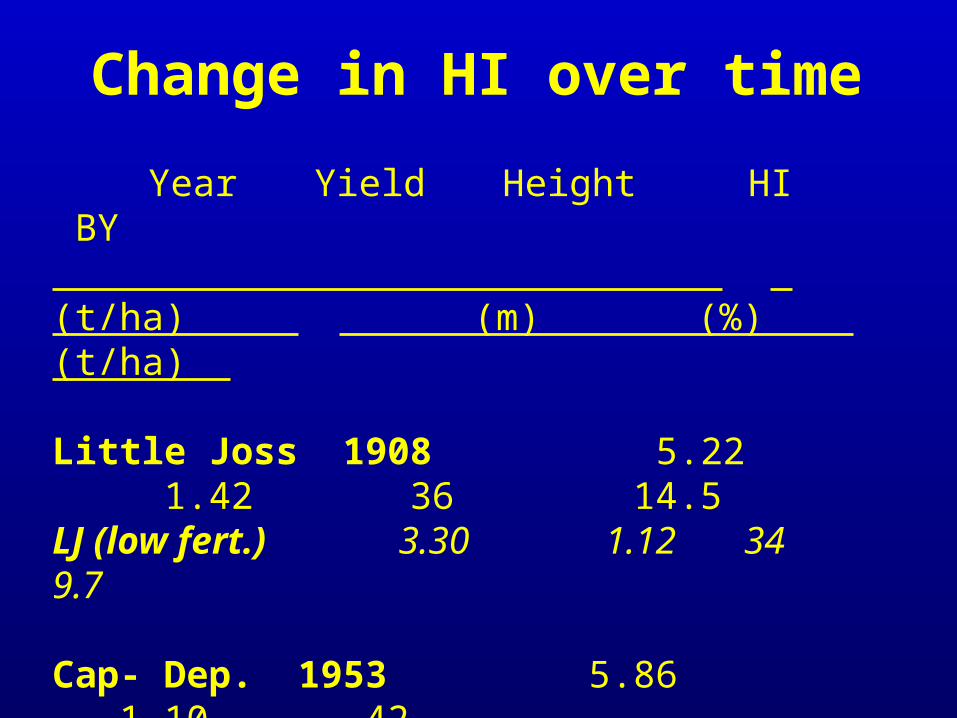
Year Yield Height HI BY (t/ha) (m) (%) (t/ha)
Little Joss 1908 5.22 1.42 36 14.5LJ (low fert.) 3.30 1.12 34 9.7
Cap- Dep. 1953 5.86 1.10 42
rht2
Hobbit 1977 7.30 0.80 48Norman 1981 7.57 0.84 51 14.8Nor. (low fert.) 4.59 0.64 49 9.4
Change in HI over time
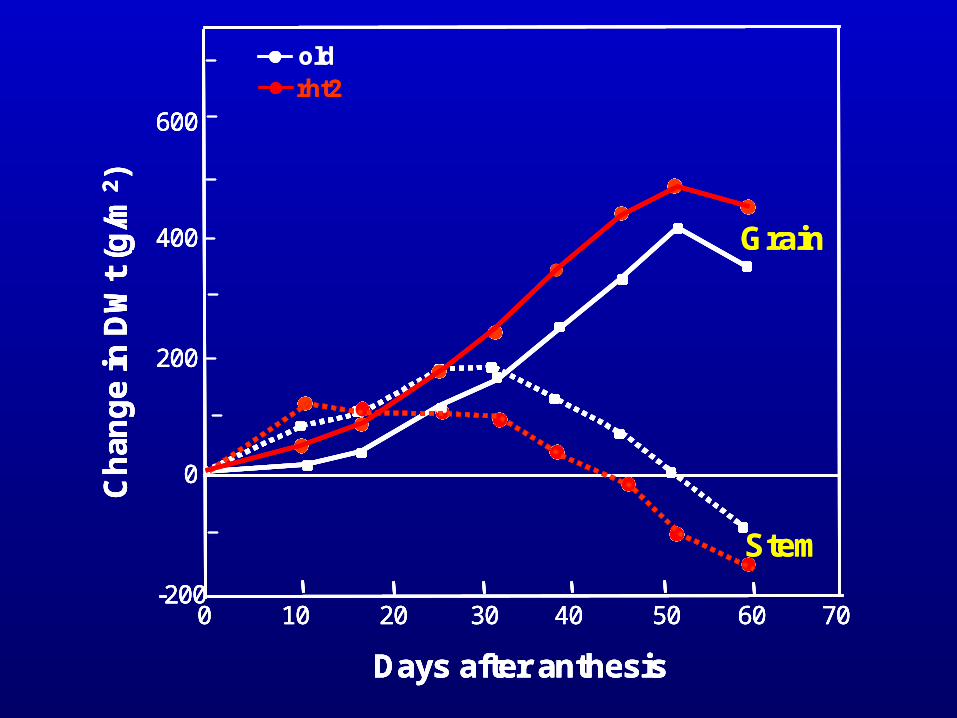
Days after anthesis
0 10 20 30 40 50 60 70
600
400
200
0
-200
Ch
ang
e in
DW
t(g
/m2 )
Days after anthesis
0 10 20 30 40 50 60 70
600
400
200
0
-200
Ch
ang
e in
DW
t(g
/m2 )
Grain
Stem
rht2old
Days after anthesis
0 10 20 30 40 50 60 70
600
400
200
0
-200
Ch
ang
e in
DW
t(g
/m2 )
Days after anthesis
0 10 20 30 40 50 60 70
600
400
200
0
-200
Ch
ang
e in
DW
t(g
/m2 )
Grain
Stem
rht2old
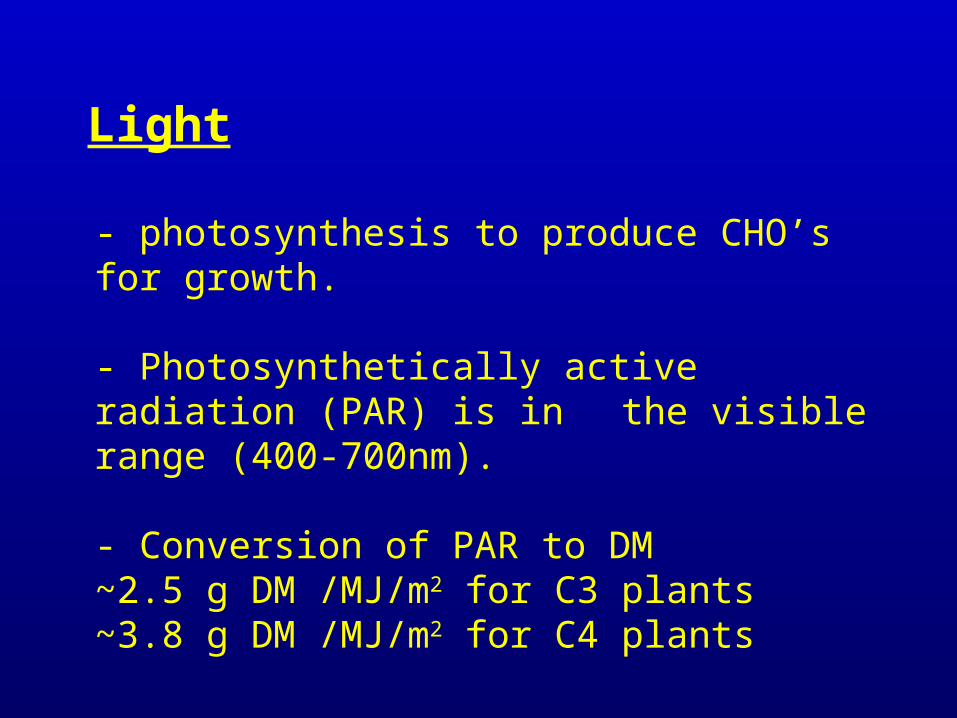
Light
- photosynthesis to produce CHO’s for growth.
- Photosynthetically active radiation (PAR) is in the visible range (400-700nm).
- Conversion of PAR to DM ~2.5 g DM /MJ/m2 for C3 plants~3.8 g DM /MJ/m2 for C4 plants
Q (MJ m-2)
C (
g m
-2)
00
300
300
600
600
150 450
900
1200
1500
Q (MJ m-2)
C (
g m
-2)
00
300
300
600
600
150 450
900
1200
1500
Dryland
Irrigated
Total DM production (C) from successive harvests and intercepted PAR (Q) for field peas in5 experiments in 4 seasons with different cultivars, sowing times and irrigation treatments.The form of the regression is: 2.36±0.03 g DM/MJ PAR (R2=0.97). Source: Wilson 1987
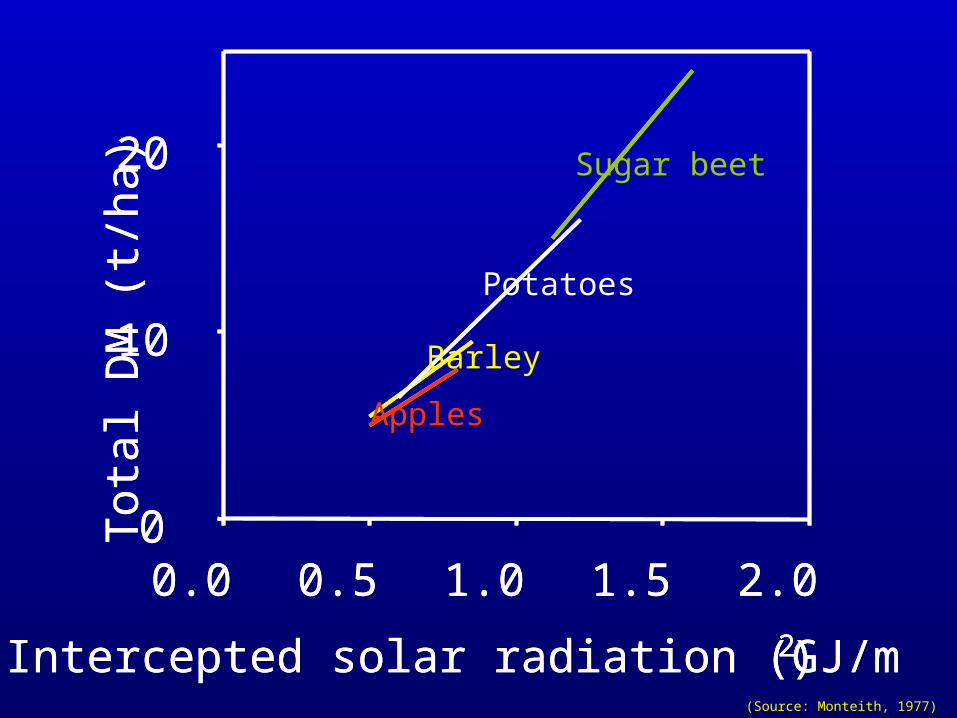
Intercepted solar radiation (GJ/m2)
0.0 0.5 1.0 1.5 2.0
Tota
l DM
(t/h
a)
0
10
20
Intercepted solar radiation (GJ/m2)
0.0 0.5 1.0 1.5 2.0
Tota
l DM
(t/h
a)
0
10
20
Apples
Barley
Potatoes
Sugar beet
(Source: Monteith, 1977)
0
200
400
600
800
1000
1200
0 2 4 6 8 10 12 14 16 18 20 22 24
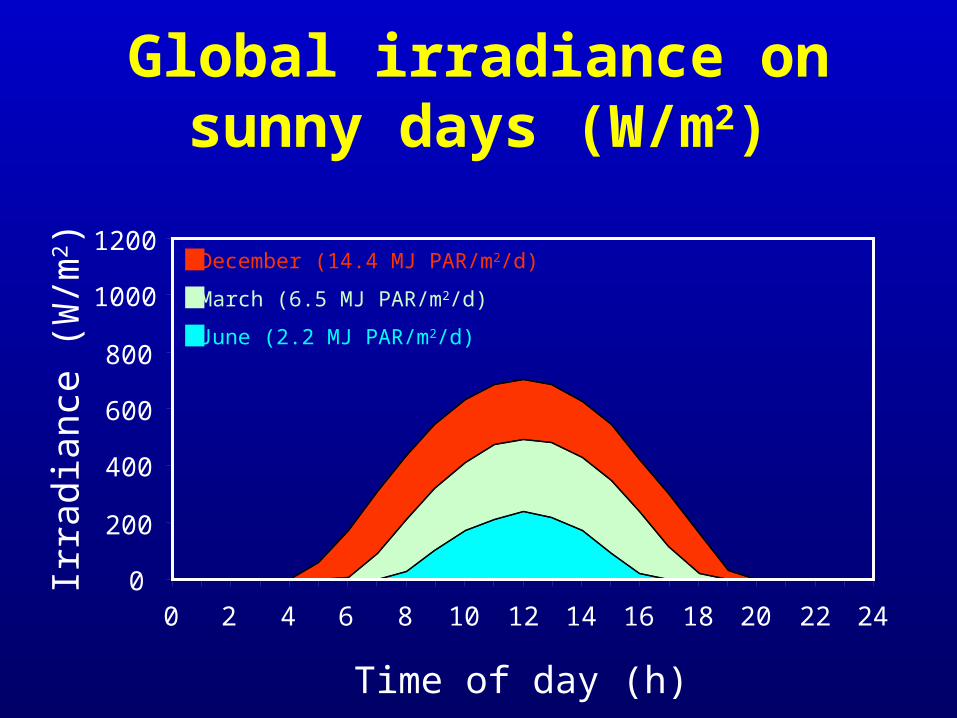
Time of day (h)
Irra
dian
ce (
W/m
2 ) December (14.4 MJ PAR/m2/d)
March (6.5 MJ PAR/m2/d)
June (2.2 MJ PAR/m2/d)
Global irradiance on sunny days (W/m2)
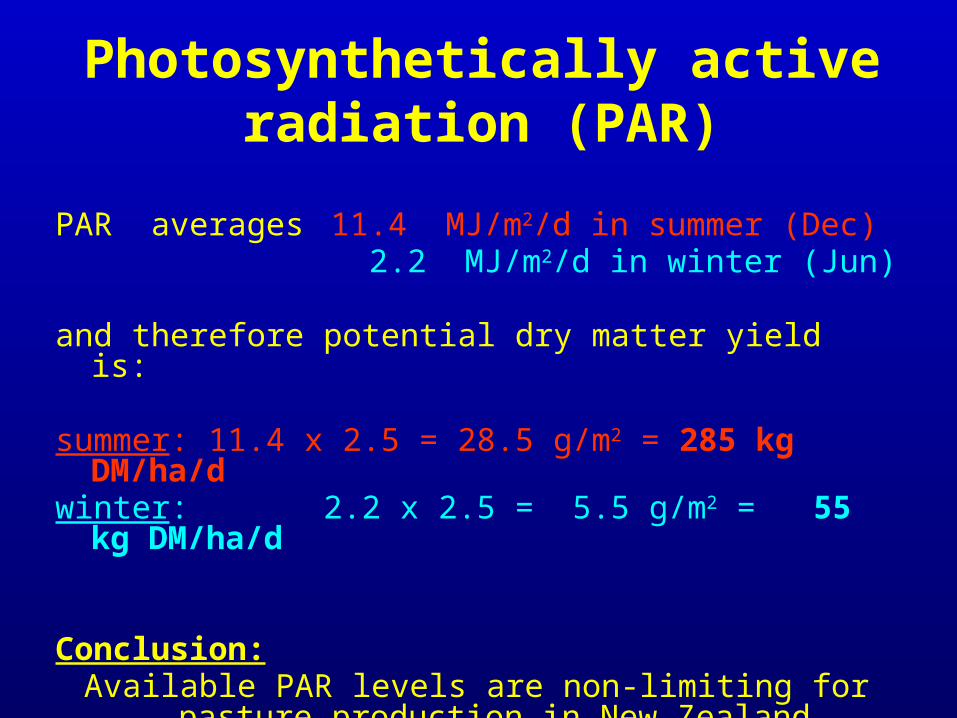
Photosynthetically active radiation (PAR)
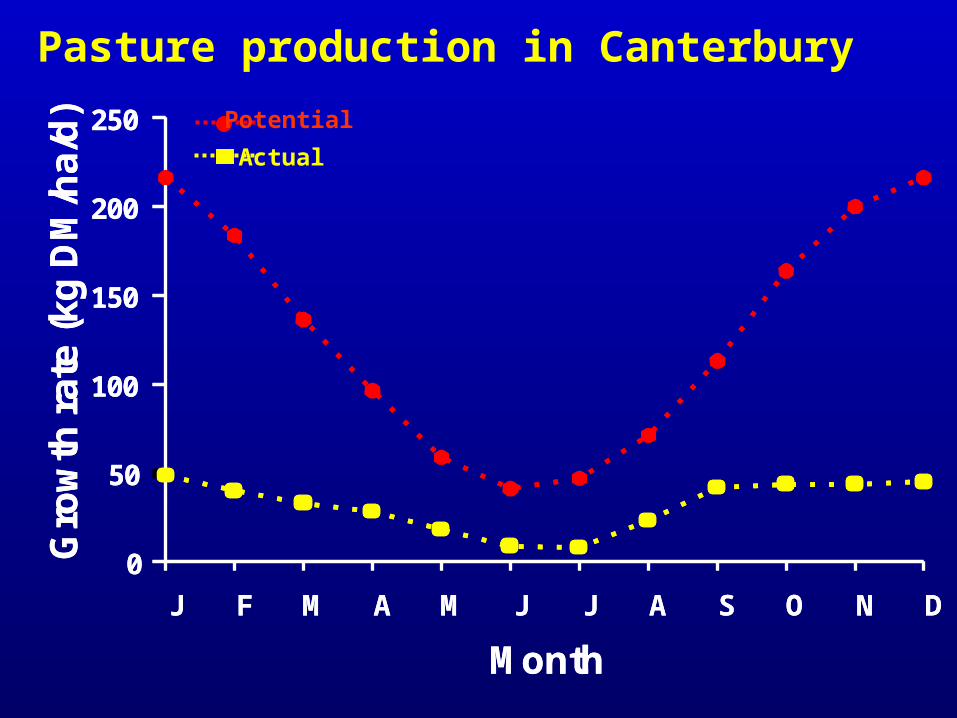
PAR averages 11.4 MJ/m2/d in summer (Dec) 2.2 MJ/m2/d in winter (Jun)
and therefore potential dry matter yield is:
summer: 11.4 x 2.5 = 28.5 g/m2 = 285 kg DM/ha/dwinter: 2.2 x 2.5 = 5.5 g/m2 = 55 kg DM/ha/d
Conclusion: Available PAR levels are non-limiting for pasture production
in New Zealand
0
50
100
150
200
250
J F M A M J J A S O N D
Month
Gro
wth
rat
e (k
g D
M/h
a/d
)
0
50
100
150
200
250
J F M A M J J A S O N D
Month
Gro
wth
rat
e (k
g D
M/h
a/d
)Pasture production in Canterbury
Potential
Actual
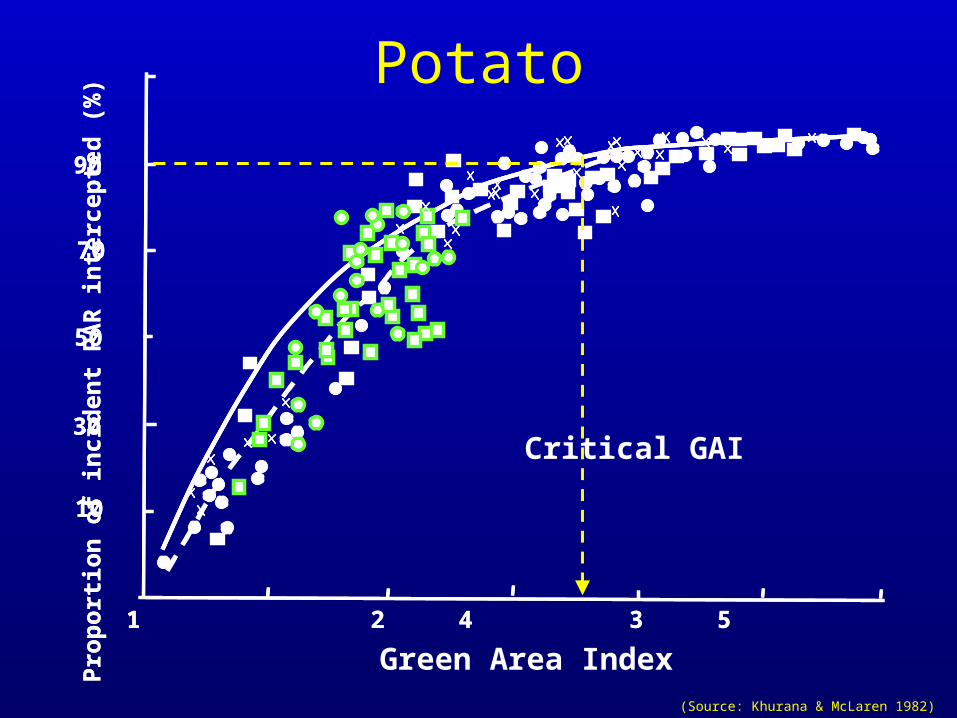
Potato
0 1 2 3 4 5 6Pro
po
rtio
n o
f in
cid
ent
PA
R i
nte
rcep
ted
(%
)
90
70
50
30
10
Green Area Index0 1 2 3 4 5 6Pro
po
rtio
n o
f in
cid
ent
PA
R i
nte
rcep
ted
(%
)
90
70
50
30
10
Critical GAI
(Source: Khurana & McLaren 1982)
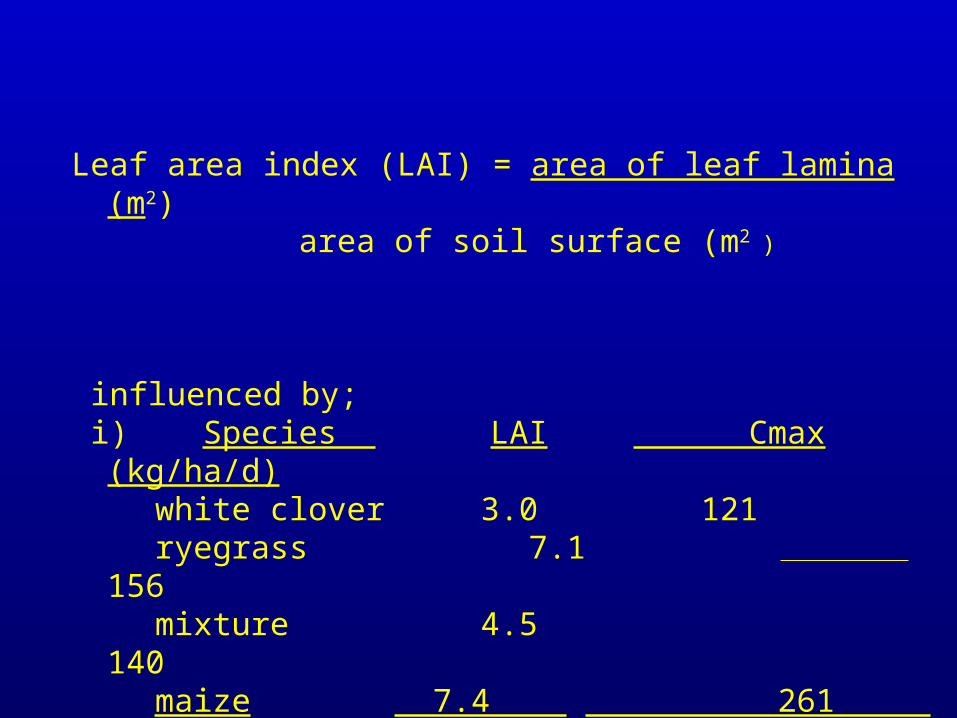
Leaf area index (LAI) = area of leaf lamina (m2)area of soil surface (m2 )
influenced by; i) Species LAI Cmax
(kg/ha/d)white clover 3.0 121ryegrass 7.1 156mixture 4.5 140maize 7.4 261
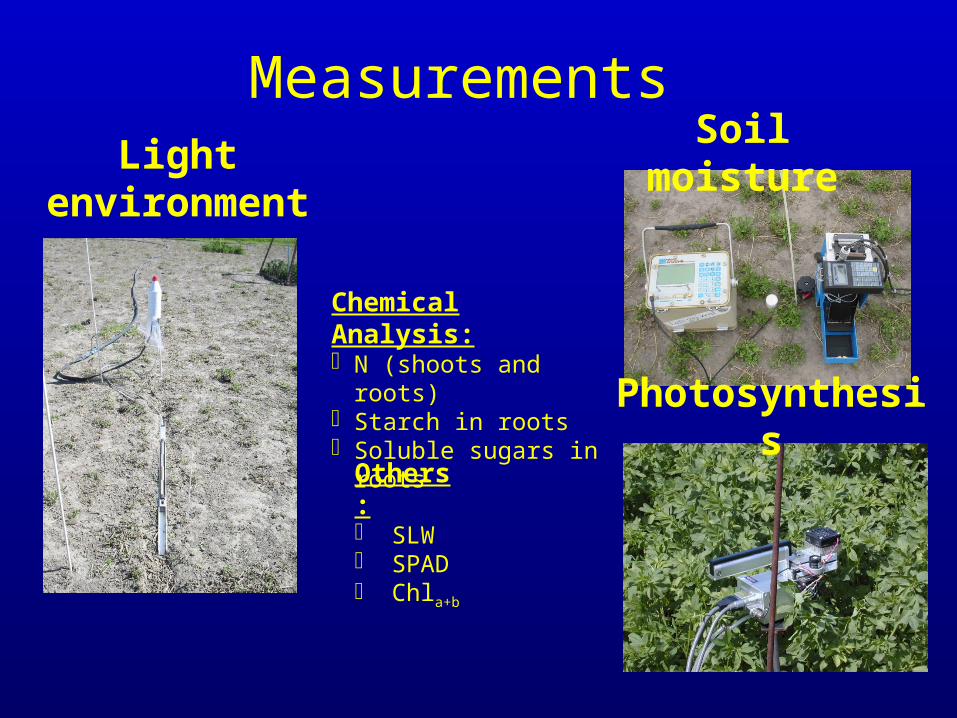
Measurements Light
environment
Photosynthesis
Soil moisture
Chemical Analysis:- N (shoots and roots)- Starch in roots- Soluble sugars in roots
Others:- SLW- SPAD- Chla+b
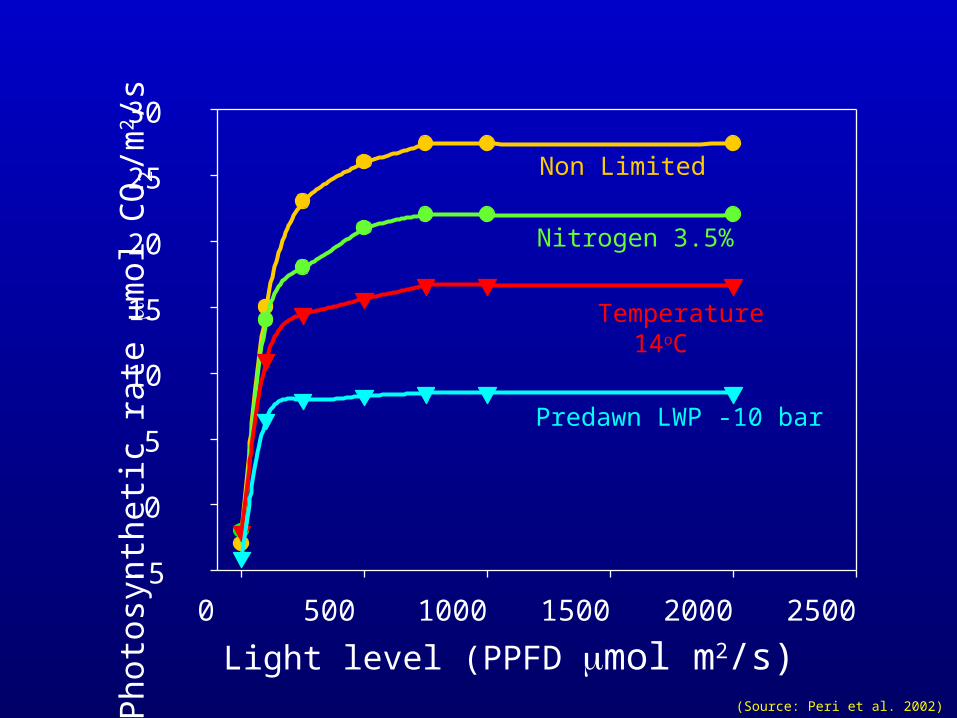
Light level (PPFD mmol m2/s)0 500 1000 1500 2000 2500
Pho
tosy
nthe
tic r
ate m
mol
CO
2/m
2 /s
-5
0
5
10
15
20
25
30
Non Limited
Nitrogen 3.5%
Temperature 14oC
Predawn LWP -10 bar
(Source: Peri et al. 2002)
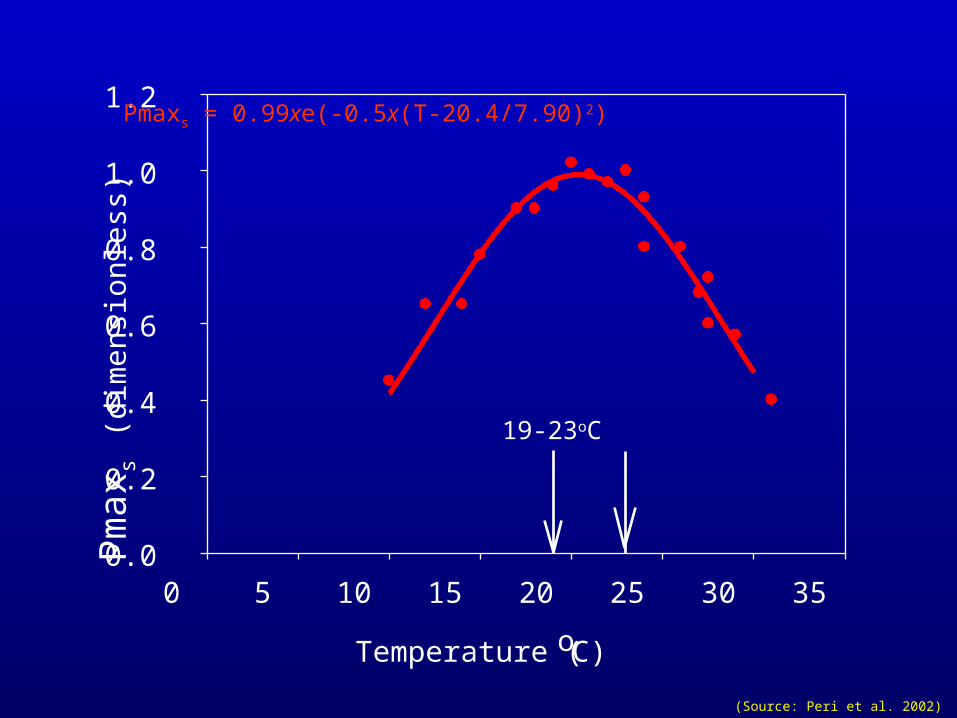
Pm
axs
(dim
ensi
onle
ss)
Temperature (oC)
0 5 10 15 20 25 30 350.0
0.2
0.4
0.6
0.8
1.0
1.2Pmaxs = 0.99xe(-0.5x(T-20.4/7.90)2)
19-23oC
(Source: Peri et al. 2002)
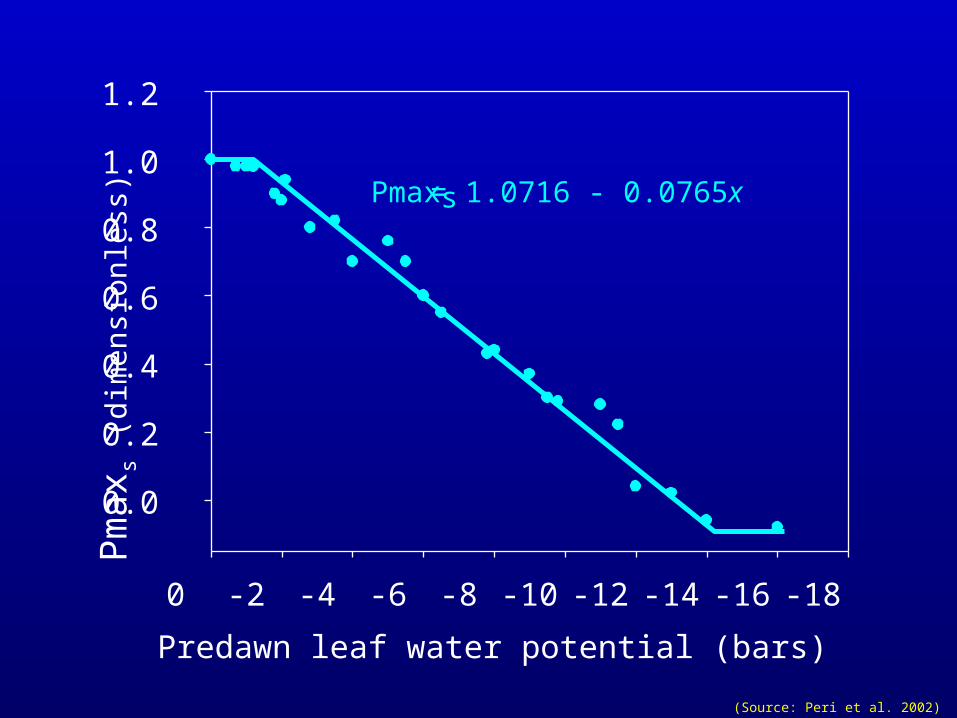
Predawn leaf water potential (bars)
-18-16-14-12-10-8-6-4-20
0.0
0.2
0.4
0.6
0.8
1.0
1.2
Pmaxs = 1.0716 - 0.0765x
Pm
axs
(dim
ensi
onle
ss)
(Source: Peri et al. 2002)
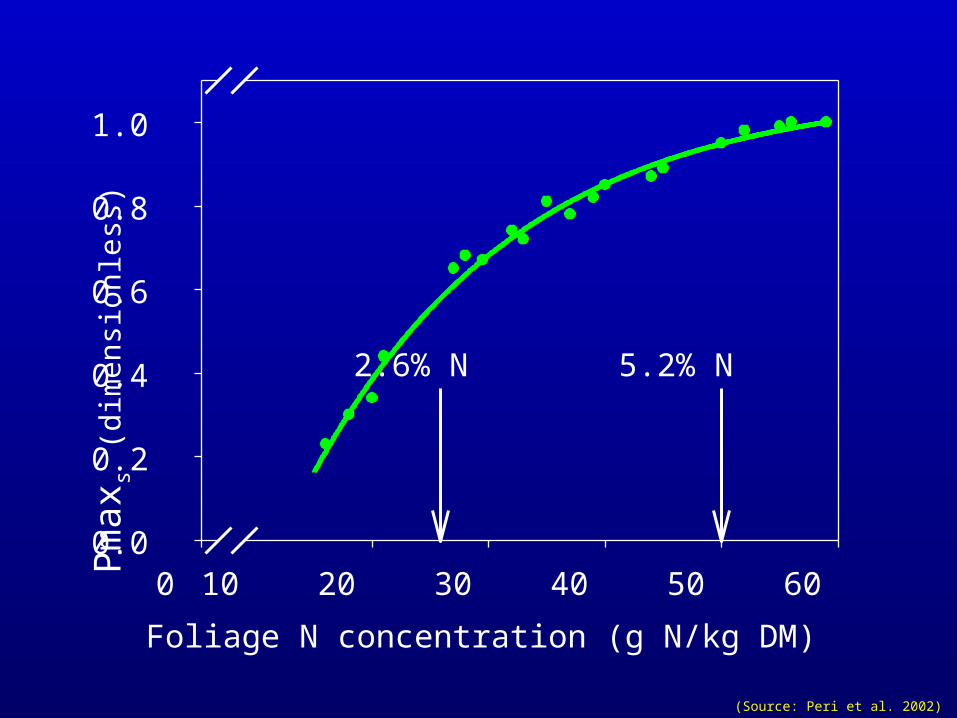
Foliage N concentration (g N/kg DM)
0 10 20 30 40 50 600.0
0.2
0.4
0.6
0.8
1.0
2.6% N 5.2% N
Pm
axs
(dim
ensi
onle
ss)
(Source: Peri et al. 2002)
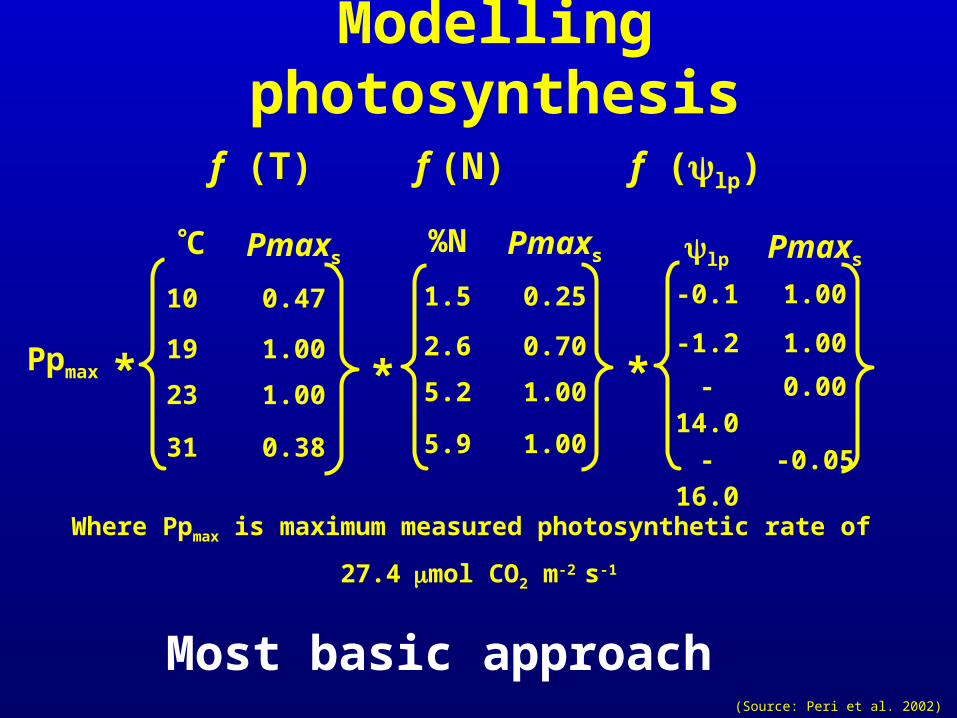
Modelling photosynthesis
C Pmaxs
10 0.47
19 1.00
23 1.00
31 0.38
%N Pmaxs
1.5 0.25
2.6 0.70
5.2 1.00
5.9 1.00
f (T) f (N) f (lp)
lp Pmaxs
-0.1 1.00
-1.2 1.00
-14.0 0.00
-16.0 -0.05
* *Ppmax *
Where Ppmax is maximum measured photosynthetic rate of
27.4 mmol CO2 m-2 s-1
Most basic approach(Source: Peri et al. 2002)
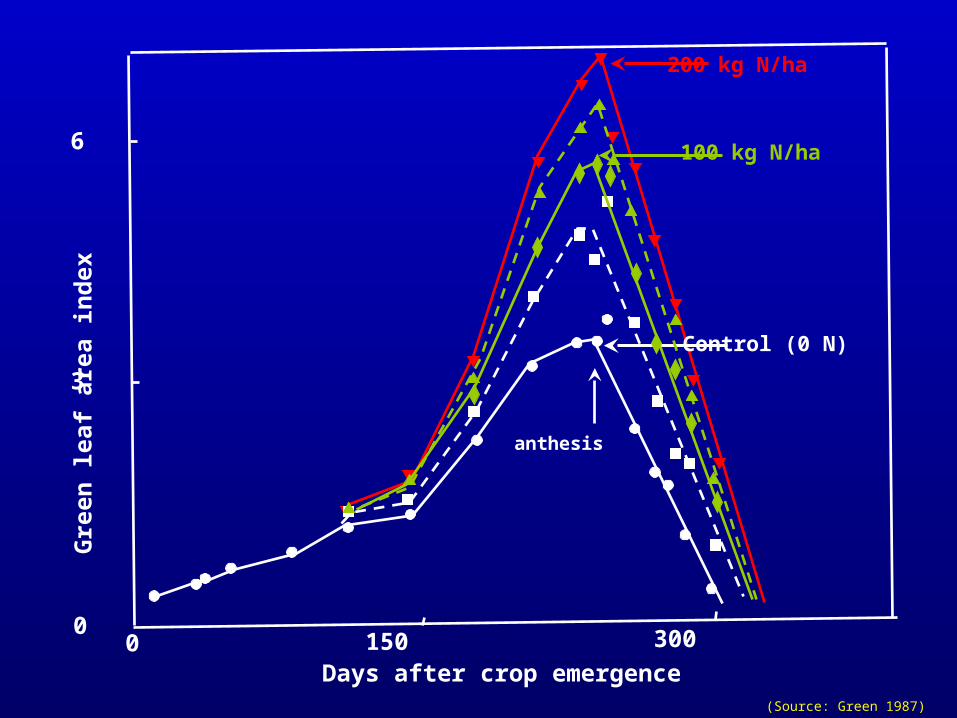
200 kg N/ha
anthesis
Control (0 N)
Days after crop emergence
Gre
en l
eaf
area
in
dex
6
3
00 150 300
100 kg N/ha
(Source: Green 1987)
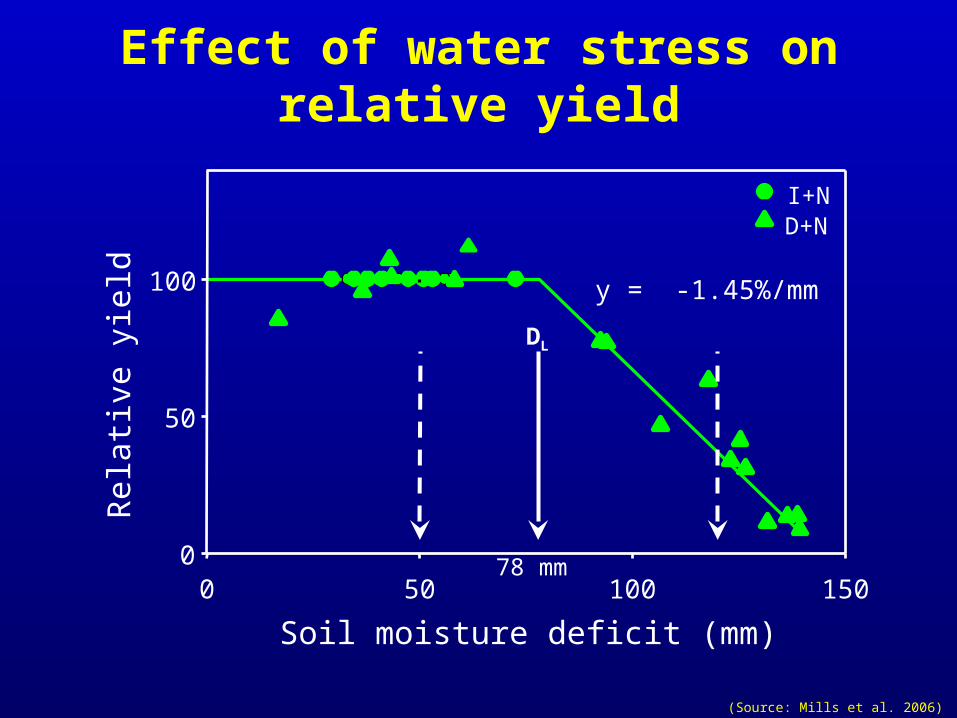
Effect of water stress on relative yield
Soil moisture deficit (mm)
0 50 100 150
Rel
ativ
e yi
eld
0
50
100
I+ND+N
y = -1.45%/mm
78 mm
DL
(Source: Mills et al. 2006)
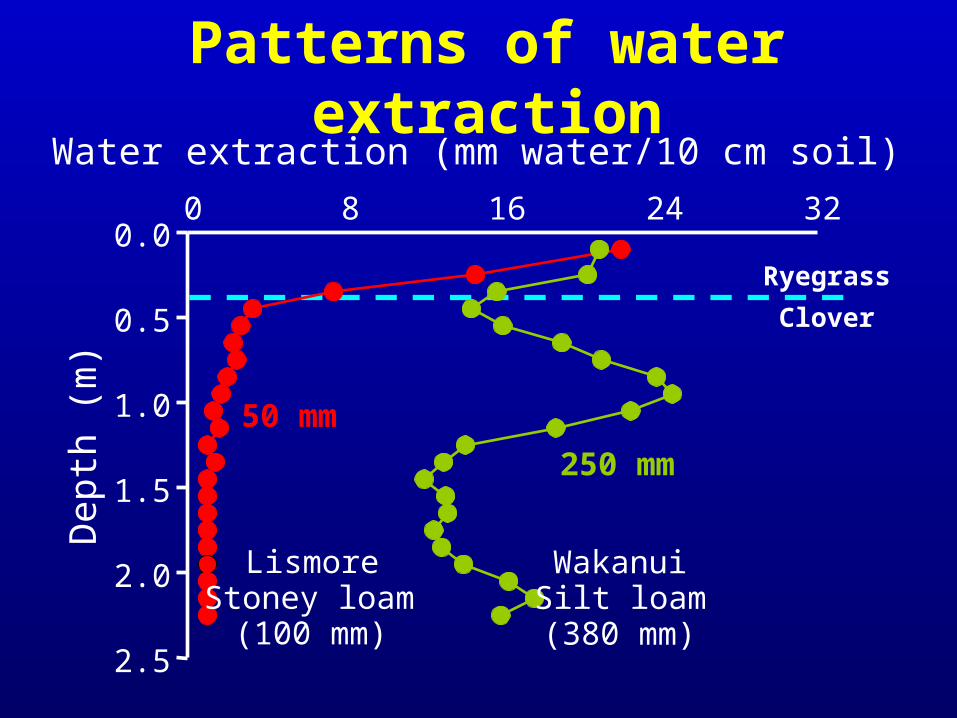
Ryegrass
Clover
50 mm
250 mm
Water extraction (mm water/10 cm soil)
0 8 16 24 32
Dep
th (
m)
2.5
2.0
1.5
1.0
0.5
0.0
LismoreStoney loam
(100 mm)
WakanuiSilt loam(380 mm)
Patterns of water extraction
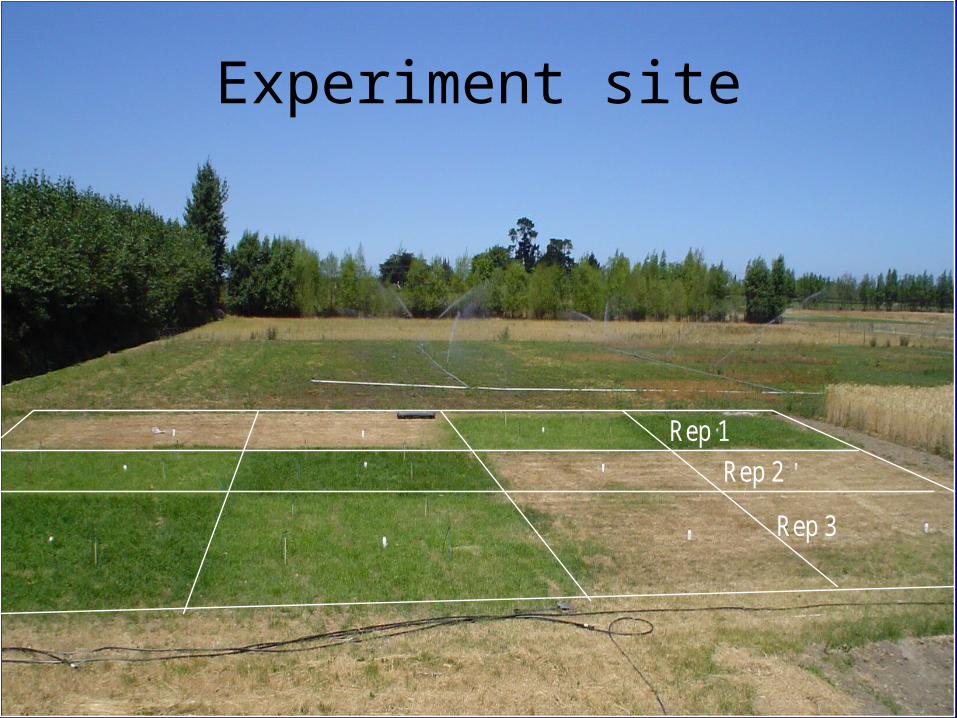
Rep 1
Rep 2
Rep 3
Experiment site
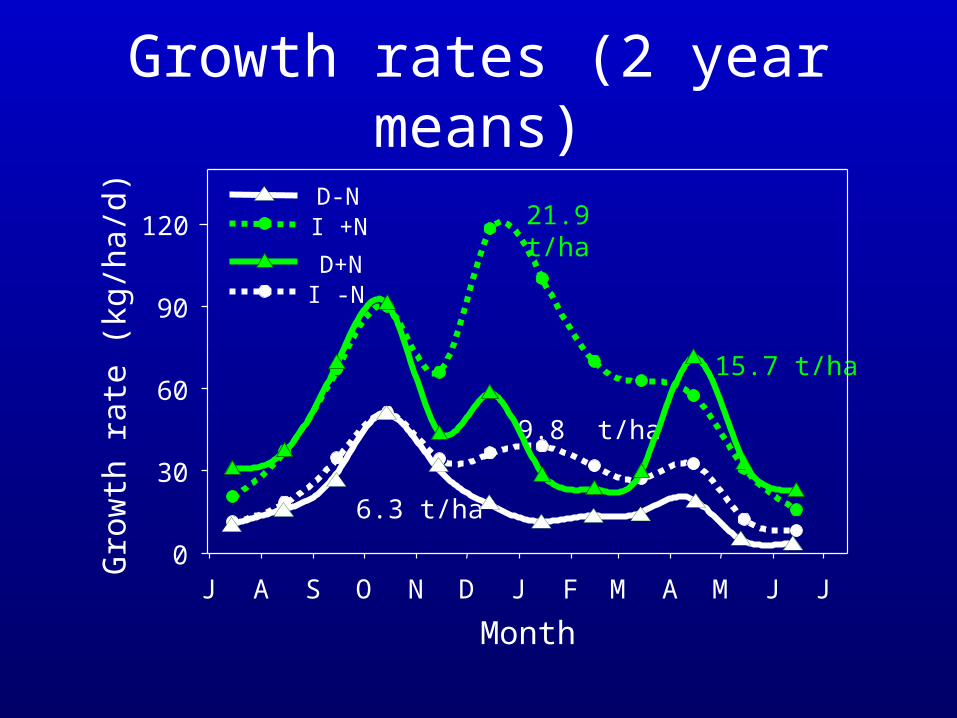
Growth rates (2 year means)
Month
J A S O N D J F M A M J J
Gro
wth
rat
e (k
g/ha
/d)
0
30
60
90
120 I +N 21.9 t/ha
I -N
9.8 t/ha
15.7 t/ha
D+N
6.3 t/ha
D-N
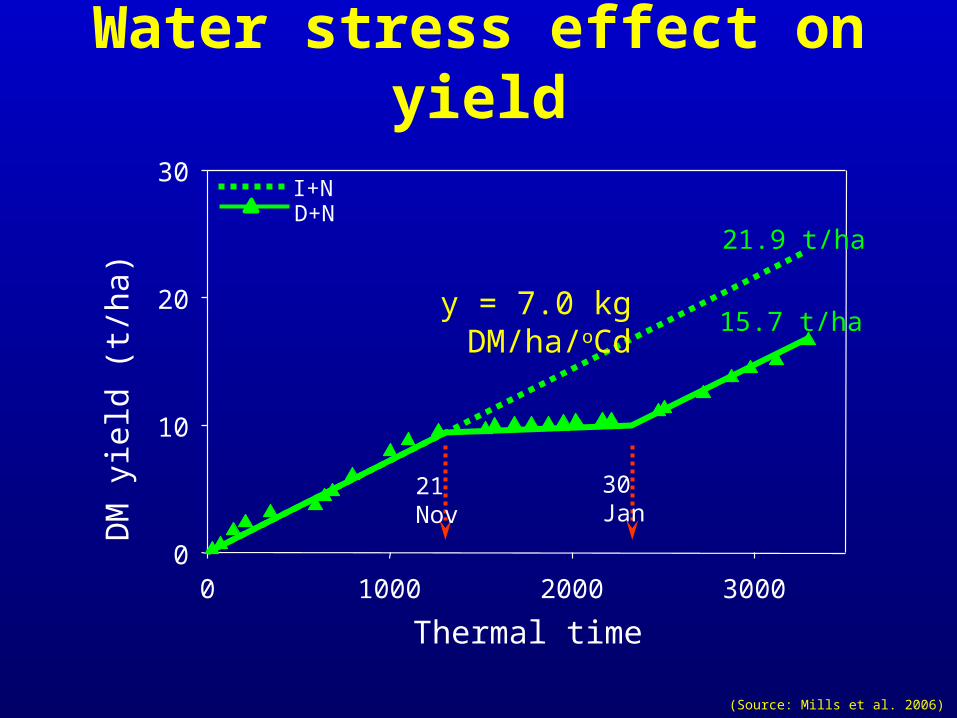
Water stress effect on yield
Thermal time
0 1000 2000 3000
DM
yie
ld (
t/ha
)
0
10
20
30I+N
y = 7.0 kg DM/ha/oCd
21.9 t/haD+N
15.7 t/ha
21 Nov 30 Jan
(Source: Mills et al. 2006)
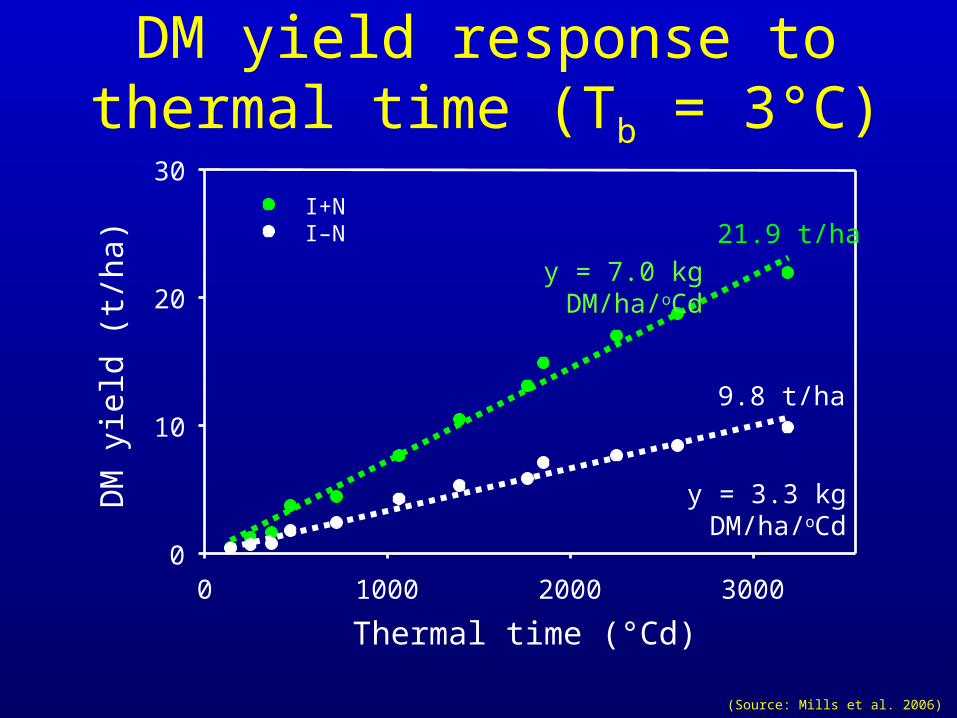
DM yield response to thermal time (Tb = 3°C)
Thermal time (°Cd)
0 1000 2000 3000
DM
yie
ld (
t/ha
)
0
10
20
30I+N
y = 7.0 kg DM/ha/oCd
I–N
y = 3.3 kg DM/ha/oCd
21.9 t/ha
9.8 t/ha
(Source: Mills et al. 2006)
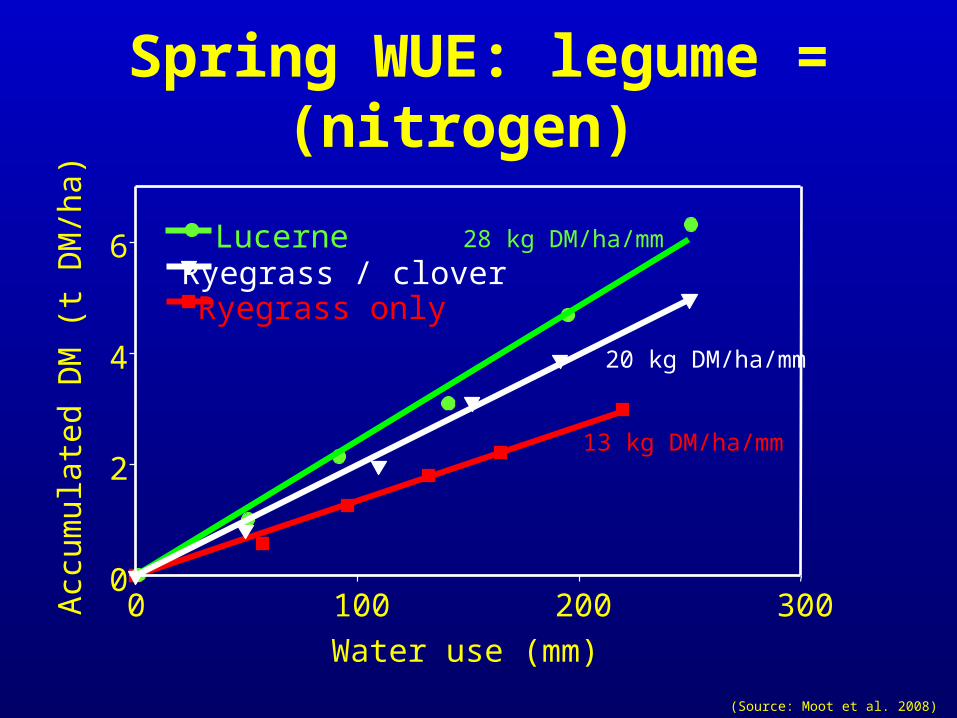
Ryegrass only
13 kg DM/ha/mm
Lucerne 28 kg DM/ha/mm
20 kg DM/ha/mm
Spring WUE: legume = (nitrogen)
Water use (mm)
0 100 200 300
Acc
umul
ated
DM
(t
DM
/ha)
0
2
4
6Ryegrass / clover
(Source: Moot et al. 2008)
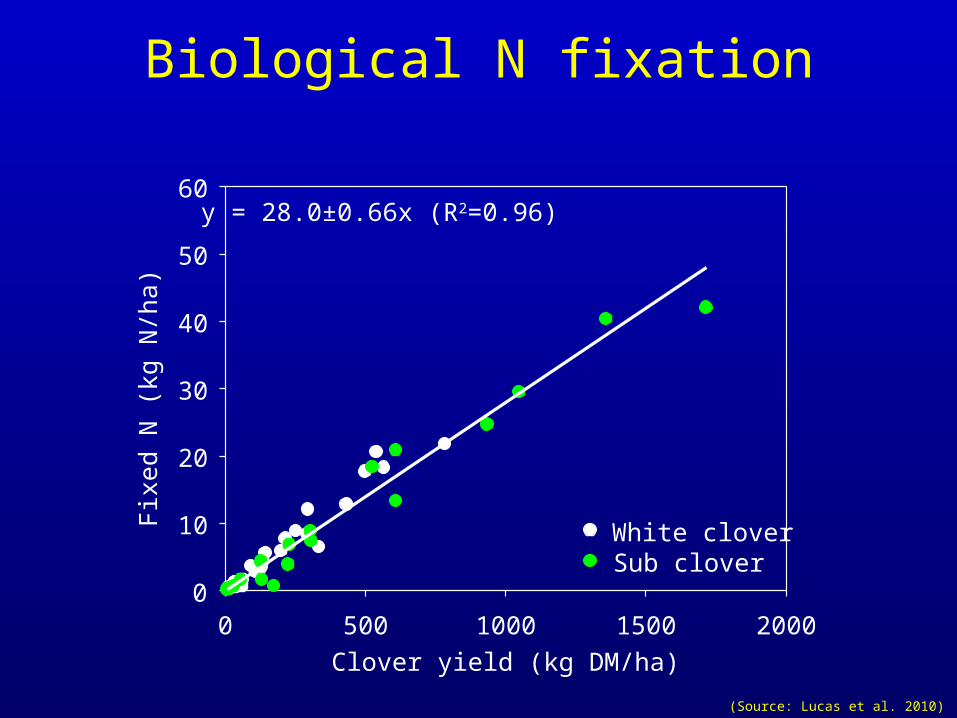
Clover yield (kg DM/ha)
0 500 1000 1500 2000
Fix
ed N
(kg
N/h
a)
0
10
20
30
40
50
60
White cloverSub clover
Biological N fixation
y = 28.0±0.66x (R2=0.96)
(Source: Lucas et al. 2010)
Conclusions
• Light interception drives growth• Nitrogen affects leaf area expansion• Temperature affects leaf area expansion• Water affects leaf area expansion• NTW affect photosynthesis• Pests and diseases affect leaf area!• CANOPY MANAGEMENT