Embed Size (px)
Citation preview
Prepared in cooperation with the Connecticut Department of Energy and Environmental Protection
Nutrient Concentrations and Loads and Escherichia coli Densities in Tributaries of the Niantic River Estuary, Southeastern Connecticut, 2005 and 2008–2011
U.S. Department of the InteriorU.S. Geological Survey
Scientific Investigations Report 2013–5008

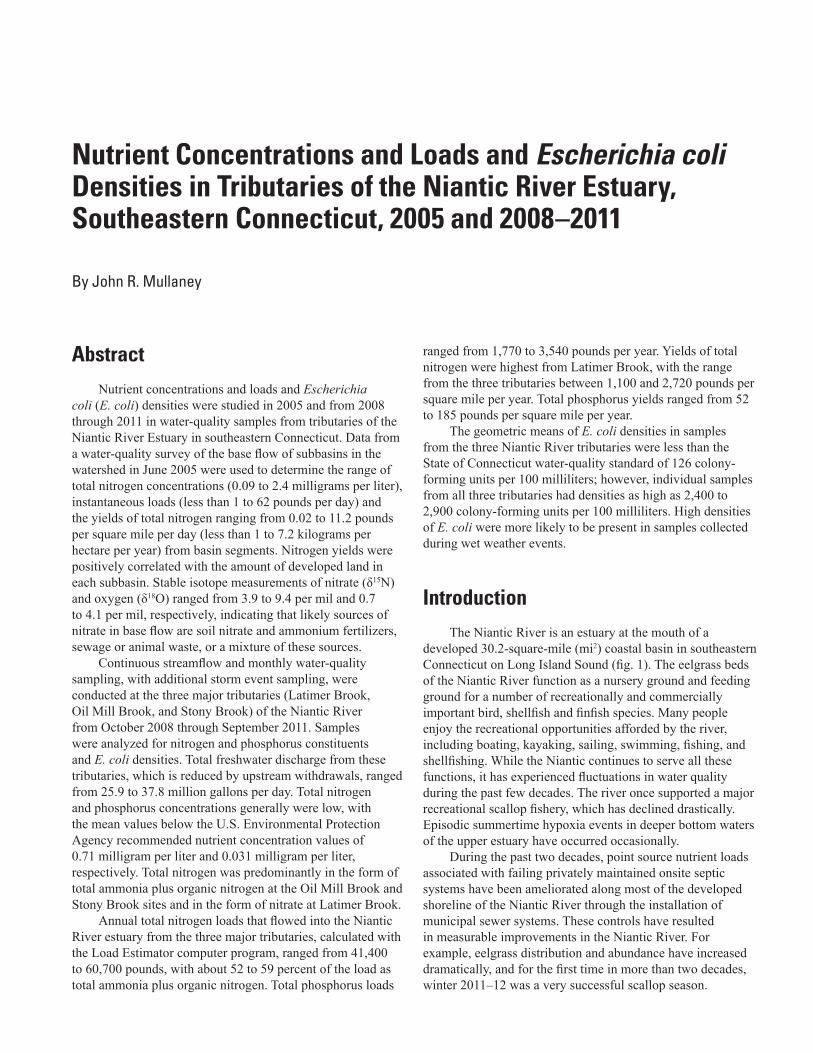
Cover. Photograph of the Niantic River, southeastern Connecticut, looking south toward Long Island Sound. The tributaries of Latimer Brook (right) and Oil Mill Brook (left) discharge to the estuary near the bottom of the photo. Courtesy of the Office of Long Island Sound Programs (OSLIP), Bureau of Water Protection and Land Reuse (WPLR), Connecticut Department of Energy and Environmental Protection (CT DEEP).

Nutrient Concentrations and Loads and Escherichia coli Densities in Tributaries of the Niantic River Estuary, Southeastern Connecticut, 2005 and 2008–2011
By John R. Mullaney
Prepared in cooperation with the Connecticut Department of Energy and Environmental Protection
Scientific Investigations Report 2013–5008
U.S. Department of the InteriorU.S. Geological Survey

U.S. Department of the InteriorKEN SALAZAR, Secretary
U.S. Geological SurveySuzette M. Kimball, Acting Director
U.S. Geological Survey, Reston, Virginia: 2013
For more information on the USGS—the Federal source for science about the Earth, its natural and living resources, natural hazards, and the environment, visit http://www.usgs.gov or call 1–888–ASK–USGS.
For an overview of USGS information products, including maps, imagery, and publications, visit http://www.usgs.gov/pubprod
To order this and other USGS information products, visit http://store.usgs.gov
Any use of trade, firm, or product names is for descriptive purposes only and does not imply endorsement by the U.S. Government.
Although this information product, for the most part, is in the public domain, it also may contain copyrighted materials as noted in the text. Permission to reproduce copyrighted items must be secured from the copyright owner.
Suggested citation:Mullaney, J.R., 2013, Nutrient concentrations and loads and Escherichia coli densities in tributaries of the Niantic River estuary, southeastern Connecticut, 2005 and 2008–2011: U.S. Geological Survey Scientific Investigations Report 2013–5008, 27 p., http://pubs.usgs.gov/sir/2013/5008/.

iii
Acknowledgments
The author would like to thank the following individuals or groups for their assistance: Judy Rondeau and Patricia Young, Niantic River Watershed coordinators; the members of the Niantic River Watershed Committee; Kelly Streich, Eric Thomas, Stan Zaremba, and Paul Stacey, Connecticut Department of Energy and Environmental Protection; and Paul Corrente, Connecticut Department of Transportation. Timothy Frick, Joseph Martin, Guy Holzer, Nicholas Dosch, Michael Colombo, Jason Pollender, and Jonathan Morrison of the U.S. Geological Survey are acknowledged for data collection and analysis. Laura Medalie of the U.S. Geological Survey, and James Latimer of the U.S. Environmental Protection Agency are also thanked for providing technical review of this report.

This page has been left blank intentionally.

v
Contents
Abstract ...........................................................................................................................................................1Introduction.....................................................................................................................................................1
Purpose and Scope ..............................................................................................................................3Description of the Study Area ............................................................................................................3
Methods of Data Collection .........................................................................................................................4Base Flow Survey in 2005 ....................................................................................................................4Sampling of Tributaries From 2008 Through 2011 ............................................................................4Streamflow Measurement ..................................................................................................................6Water-Quality Field Measurement and Sampling Procedures .....................................................6Laboratory Measurements ..................................................................................................................6Nutrient Load Calculation ....................................................................................................................6
Nutrient Concentrations and Loads in Tributaries of the Niantic River Estuary .................................8Watershed Base Flow Survey in 2005 ...............................................................................................8Tributary Monitoring From 2008 Through 2011 ...............................................................................14
Streamflow ..................................................................................................................................14Nitrogen .......................................................................................................................................18Phosphorus .................................................................................................................................20Escherichia coli ..........................................................................................................................20
Summary and Conclusions .........................................................................................................................22Selected References ...................................................................................................................................25
Figures 1. Map showing the Niantic River Basin in southeastern Connecticut ...................................2 2. Map showing land use and land cover in the Niantic River Basin in 2006 .........................5 3. Map showing nitrogen yields from selected basin segments in the Niantic River
Basin on June 1–3, 2005 ............................................................................................................13 4. Graph showing approximate compositional ranges of δ15N and δ18O data for
sources of nitrate ........................................................................................................................14 5. Graph showing the instantaneous nitrogen yield by percentage of developed land
for basin segments in the Niantic River Basin from water-quality samples and streamflow measurements collected June 1–3, 2005 ..........................................................15
6. Graphs showing daily discharge from A, Latimer Brook; B, Oil Mill Brook; C, Stony Brook tributaries of the Niantic River, showing dates of samples collected, Niantic River Basin, southeastern Connecticut ..................................................................................16
7. Boxplots showing the distribution of total nitrogen concentrations in the Niantic River Basin in southeastern Connecticut from August 2008 through February 2012 ......18
8. Boxplots showing distribution of total ammonia plus organic nitrogen concentrations in the Niantic River Basin in southeastern Connecticut from August 2008 through February 2012 .........................................................................................20
9. Boxplots showing distribution of total phosphorus concentrations in the Niantic River Basin in southeastern Connecticut from August 2008 through February 2012 ......22

vi
10. Boxplots showing distribution of Escherichia coli densities in the Niantic River Basin in southeastern Connecticut from August 2008 through February 2012 ................24
11. Graphs showing cumulative probability plots of Escherichia coli densities for dry and wet weather samples from October 2008 through September 2011 ..........................25
Tables 1. Land use in the Niantic River Basin in southeastern Connecticut in 2006 .........................7 2. Analytes for nutrient samples and analytical methods ..........................................................8 3. Instantaneous nitrogen concentrations and loads, yields, and isotopic
measurements in the Niantic River Basin on June 1–3, 2005 ...............................................9 4. Streamflow and total nitrogen loads and yields for 11 basin segments in the
Niantic River Basin on June 1–3, 2005 ....................................................................................10 5. Instantaneous phosphorus concentrations and loads and yields in the Niantic
River Basin on June 1–3, 2005 ..................................................................................................12 6. Streamflow characteristics of three Niantic River tributaries in southeastern
Connecticut for water years 2009–2011 ..................................................................................15 7. Summary statistics of selected nitrogen and phosphorus constituents and
Escherichia coli for water-quality samples collected at three U.S. Geological Survey streamgages in the Niantic River Basin in southeastern Connecticut from August 2008 through February 2012 .........................................................................................19
8. Loads and yields of total nitrogen and total ammonia plus organic nitrogen for three stations in the Niantic River Basin in southeastern Connecticut from October 2008 through September 2011 ...................................................................................21
9. Loads and yields of total phosphorus for three U.S. Geological Survey streamgages in the Niantic River Basin in southeastern Connecticut from October 2008 through September 2011 ...................................................................................23

vii
Conversion Factors and DatumMultiply By To obtain
Length
foot (ft) 0.3048 meter (m)Area
square mile (mi2) 259.0 hectare (ha)square mile (mi2) 2.590 square kilometer (km2)
Volume
million gallons (Mgal) 3,785 cubic meter (m3)cubic foot (ft3) 0.02832 cubic meter (m3)
Flow rate
cubic foot per second (ft3/s) 0.02832 cubic meter per second (m3/s)cubic foot per second per square
mile [(ft3/s)/mi2] 0.01093 cubic meter per second per square
kilometer [(m3/s)/km2]million gallons per day (Mgal/d) 0.04381 cubic meter per second (m3/s)
Mass
pounds per square mile per year [(lb/mi2)yr]
0 .001751 kilogram per hectare per year [(kg/ha)/yr]
Vertical coordinate information is referenced to the North American Vertical Datum of 1988 (NAVD 88).
Horizontal coordinate information is referenced to the North American Datum of 1983 (NAD 83).
Concentrations of chemical constituents in water are given in milligrams per liter (mg/L).
AbbreviationsAMLE adjusted maximum likelihood estimation
CTDEEP Connecticut Department of Energy and Environmental Protection
cfu colony-forming units
E. coli Escherichia coli
EWI equal width increment
LISS Long Island Sound study
LOADEST load estimator
MLE maximum likelihood estimation
NWIS National Water Information System
NWQL National Water Quality Laboratory
USGS U.S. Geological Survey
USEPA U.S. Environmental Protection Agency

viii
This page has been left blank intentionally.
Nutrient Concentrations and Loads and Escherichia coli Densities in Tributaries of the Niantic River Estuary, Southeastern Connecticut, 2005 and 2008–2011
By John R. Mullaney
AbstractNutrient concentrations and loads and Escherichia
coli (E. coli) densities were studied in 2005 and from 2008 through 2011 in water-quality samples from tributaries of the Niantic River Estuary in southeastern Connecticut. Data from a water-quality survey of the base flow of subbasins in the watershed in June 2005 were used to determine the range of total nitrogen concentrations (0.09 to 2.4 milligrams per liter), instantaneous loads (less than 1 to 62 pounds per day) and the yields of total nitrogen ranging from 0.02 to 11.2 pounds per square mile per day (less than 1 to 7.2 kilograms per hectare per year) from basin segments. Nitrogen yields were positively correlated with the amount of developed land in each subbasin. Stable isotope measurements of nitrate (δ15N) and oxygen (δ18O) ranged from 3.9 to 9.4 per mil and 0.7 to 4.1 per mil, respectively, indicating that likely sources of nitrate in base flow are soil nitrate and ammonium fertilizers, sewage or animal waste, or a mixture of these sources.
Continuous streamflow and monthly water-quality sampling, with additional storm event sampling, were conducted at the three major tributaries (Latimer Brook, Oil Mill Brook, and Stony Brook) of the Niantic River from October 2008 through September 2011. Samples were analyzed for nitrogen and phosphorus constituents and E. coli densities. Total freshwater discharge from these tributaries, which is reduced by upstream withdrawals, ranged from 25.9 to 37.8 million gallons per day. Total nitrogen and phosphorus concentrations generally were low, with the mean values below the U.S. Environmental Protection Agency recommended nutrient concentration values of 0.71 milligram per liter and 0.031 milligram per liter, respectively. Total nitrogen was predominantly in the form of total ammonia plus organic nitrogen at the Oil Mill Brook and Stony Brook sites and in the form of nitrate at Latimer Brook.
Annual total nitrogen loads that flowed into the Niantic River estuary from the three major tributaries, calculated with the Load Estimator computer program, ranged from 41,400 to 60,700 pounds, with about 52 to 59 percent of the load as total ammonia plus organic nitrogen. Total phosphorus loads
ranged from 1,770 to 3,540 pounds per year. Yields of total nitrogen were highest from Latimer Brook, with the range from the three tributaries between 1,100 and 2,720 pounds per square mile per year. Total phosphorus yields ranged from 52 to 185 pounds per square mile per year.
The geometric means of E. coli densities in samples from the three Niantic River tributaries were less than the State of Connecticut water-quality standard of 126 colony-forming units per 100 milliliters; however, individual samples from all three tributaries had densities as high as 2,400 to 2,900 colony-forming units per 100 milliliters. High densities of E. coli were more likely to be present in samples collected during wet weather events.
IntroductionThe Niantic River is an estuary at the mouth of a
developed 30.2-square-mile (mi2) coastal basin in southeastern Connecticut on Long Island Sound (fig. 1). The eelgrass beds of the Niantic River function as a nursery ground and feeding ground for a number of recreationally and commercially important bird, shellfish and finfish species. Many people enjoy the recreational opportunities afforded by the river, including boating, kayaking, sailing, swimming, fishing, and shellfishing. While the Niantic continues to serve all these functions, it has experienced fluctuations in water quality during the past few decades. The river once supported a major recreational scallop fishery, which has declined drastically. Episodic summertime hypoxia events in deeper bottom waters of the upper estuary have occurred occasionally.
During the past two decades, point source nutrient loads associated with failing privately maintained onsite septic systems have been ameliorated along most of the developed shoreline of the Niantic River through the installation of municipal sewer systems. These controls have resulted in measurable improvements in the Niantic River. For example, eelgrass distribution and abundance have increased dramatically, and for the first time in more than two decades, winter 2011–12 was a very successful scallop season.

2 Nutrient Concentrations and Loads and E. coli densities, Niantic River, Southeastern Connecticut, 2005 and 2008–2011
EastLyme
Montville
Waterford
Salem
Lyme
Old Lyme
New London
72°10'72°15'
41°25'
41°20'
Niantic River
NianticBay
Lake KonomocLatim
er Brook
Oil
Mill
Bro
okSt
ony
Broo
k
Base from University of Connecticut, Department of Agriculture and Natural Resources, 2000NAD83 Lambert Conformal Conic projection
0 2 MILES1
0 2 KILOMETERS1
0112779101127786
01127778
011277918
011277916
011277913
011277905
011277875
011277795
011277914
0112779165
0112779135
4121480721223
CONNECTICUT
Niantic River BasinIndian River
near ClintonLong Island Sound
01195100
EXPLANATION
Continuous streamflowand periodic water-quality site and number
Base flow water-quality survey site and number
Precipitation gageand number
Basins upstream from continuous streamgages
Basin downstream from continuous streamgages
Basin boundary
Data collections site
Figure 1. The Niantic River Basin in southeastern Connecticut. The locations of U.S. Geological Survey (USGS) water-quality monitoring sites and streamgages in tributaries of the Niantic River Estuary are shown. NAD83, North American Datum of 1983.

Introduction 3
The presence of so-called “nuisance” macroalgae indicates that nitrogen loads are relatively high, though currently low enough to provide a suitable environment for eelgrass (Jamie Vaudrey, professor, University of Connecticut, written commun., April 2012). Excessive nitrogen loading to the Niantic River is considered to be a major cause of decline and variability of eelgrass populations (Connecticut Department of Environmental Protection, 2006). Currently, the Niantic River is the first embayment where eelgrass is present in Long Island Sound, when moving from west (New York City area) to east, along a gradient of improving water quality. Therefore, the Niantic River is currently thought to have marginal water quality with respect to eelgrass habitat. There is concern that, with increasing development in the watershed, the Niantic River will not be able to support eelgrass habitats in the future.
The Long Island Sound Study (LISS) began in 1985 under the sponsorship of the U.S. Environmental Protection Agency (USEPA) and the States of Connecticut and New York to protect and restore the health of Long Island Sound.
The Connecticut Department of Energy and Environmental Protection (CTDEEP) and LISS are interested in improving eelgrass habitats and expanding the areas of suitable eelgrass habitat. In addition, research has been conducted to determine requirements to protect or improve eelgrass habitats in Long Island Sound (Vaudrey, 2008). The development of nutrient requirements for estuaries is complicated by the mixing of freshwater from tributaries and groundwater with saltwater from the ocean. The factors affecting optimal nutrient concentrations for eelgrass include the size of the watershed area relative to the area of the estuary, the volume of the tidal prism, the quality of marine water entering from outside the estuary, and additional factors.
The CTDEEP has listed the Niantic River on the impaired waters list of the State of Connecticut (Clean Water Act, secs. 303b and 305b, 33 U.S.C. §§1313 and 1315); the river is considered to be impaired for habitat for marine fish, other aquatic life, and wildlife. The listed potential cause for this impairment includes eutrophication resulting from nutrients with sources such as flow alterations from water diversions, urban stormwater, on-vessel discharges, and residential land use (Connecticut Department of Environmental Protection, 2011a, table 3–2).
The Niantic River also has been listed as impaired for shellfish harvesting due to the presence of excess fecal coliform bacteria, with sources ranging from urban stormwater, on-vessel discharges, onsite wastewater treatment systems, residential areas, and waterfowl. The lower reaches of the three major Niantic River tributaries also are listed as impaired by Escherichia coli (E. coli) bacteria (Connecticut Department of Environmental Protection, 2011a, table 3–2).
In 2006, the Niantic River watershed protection plan (Connecticut Department of Environmental Protection, 2006) was developed with recommendations to improve water quality throughout the watershed, eliminate shellfish bed closures, support fish and wildlife habitat, and provide safe
and healthy recreational areas. Among the recommendations was monitoring of the Niantic River tributaries to provide baseline data on nutrients and bacteria to be compared with future conditions after management measures have been implemented.
An understanding of the river discharge and quantity and source of nutrients entering the Niantic River from the tributaries of the river is essential for establishing nutrient criteria for eelgrass survival. In addition, accurate information on the tributary loads of nutrients is required for understanding the mass balance and sources of nutrients in the watershed so the loads can be effectively managed. Data on indicator bacteria are necessary to provide baseline information to be compared with future data once management measures are in place to resolve the impairments.
To provide baseline data on the nutrient budget and the distribution of indicator bacteria, the U.S. Geological Survey (USGS) and the CTDEEP conducted cooperative studies in 2005 and from 2008 through 2011 in the Niantic River Basin.
Purpose and Scope
This report provides information on the concentrations, loads, and yields of nitrogen and phosphorus in subbasins of the Niantic River. Data and data analysis are summarized from a basinwide base flow water-quality survey of nutrients from June 1–3, 2005, and includes nitrogen isotope composition of nitrate to assist with identifying sources of nitrogen. Data are presented on instantaneous streamflows and loads of nitrogen from 11 subbasins of the Niantic River.
The main focus of the report is on streamflow, nutrient, and indicator bacteria data from the three major tributaries of the Niantic River for the period October 2008 through February 2012. Data from this time period were used to develop statistical summaries of concentration and bacteria density. Data for water quality and streamflow from October 2008 through September 2011 (water years1 2009–2011) were used to calculate annual loads and yields of nitrogen and phosphorus.
Description of the Study Area
The Niantic River Basin is in coastal southeastern Connecticut, draining an area of 30.2 mi2, and lies between the Connecticut River Basin on the west and the Thames River Basin on the east. The Niantic River estuary is primarily a saltwater environment that covers an area of 1.25 mi2 at the mouth of the basin. The three largest tributaries contributing fresh water to the Niantic River estuary are Latimer Brook, Oil Mill Brook, and Stony Brook (fig. 1).
1A water year is the period between October 1 of the previous year through September 30 of the year designated; for example, water year 2009 covers October 1, 2008, through September 30, 2009.

4 Nutrient Concentrations and Loads and E. coli densities, Niantic River, Southeastern Connecticut, 2005 and 2008–2011
Land surface ranges from sea level near the mouth of the estuary to about 600 feet above the North American Vertical Datum of 1988 (NAVD88) in the headwaters in the town of Montville. Land cover and land use (University of Connecticut, 2009) in the watershed (fig. 2) is about 61 percent forest, about 18 percent developed land, including turf, 5 percent wetlands, and 3.3 percent agricultural areas. The remaining 12.7 percent of the watershed contains areas with water, other grasses, barren land, and utility rights of way. About 12 percent of the watershed is in sewer service areas; not all areas within sewer service districts had sewers in 2012. Wastewater from the sewers is delivered to the sewage treatment system for the city of New London outside the Niantic River Basin and is discharged to the Thames River. The total population of the Niantic River Basin was about 8,500 in 2000 and 10,200 in 2010, based on a spatial analysis overlay of U.S. Census Bureau blocks with the basin boundaries (U.S. Census Bureau, 2012).
The surficial geology of the Niantic River Basin includes deposits of glacial till of varying thickness underlying 75 percent of the watershed and coarse-grained glacial stratified deposits underlying 17 percent of the watershed, primarily in the river and stream valleys (Stone and others, 1992). The remaining land area is underlain by fine-grained glaciolacustrine and swamp deposits. The surficial geology controls whether groundwater discharge or overland runoff is the dominant source of water and nutrients in different regions of the basin. Areas with coarse-grained glacial stratified deposits have higher groundwater recharge rates than areas with glacial till and consequently provide an important source of stream base flow (Thomas, 1966).
Methods of Data CollectionData collected in June 2005 for the first phase of this
project included surface water-quality samples that were collected, during typical base flows, and were analyzed for nitrogen concentrations. Instantaneous streamflow was measured at the time of sample collection to determine loads of nitrogen representative of groundwater discharge in selected parts of the Niantic River Basin. Data were used to determine which regions of the watershed had the largest yields of nitrogen. Water-quality samples were analyzed for nitrogen isotopes as a means identifying dominant sources of nitrate nitrogen.
For the second phase of the project, water-quality samples and continuous streamflow data were collected from 2008 through 2012 at stations near the mouths of the three largest tributaries of the Niantic River—Latimer Brook, Oil Mill Brook, and Stony Brook. Samples were analyzed for concentrations of nutrients and densities of E. coli bacteria.
Base Flow Survey in 2005
A survey of base flow water quality was conducted in 2005 to make initial estimates of the nutrient loads to Niantic River tributaries from groundwater discharge in different parts of the Niantic River Basin. Sites were selected at 11 locations (fig. 1; table 1) in the watershed for water-quality sampling and streamflow measurement.
Ideally, sampling would be designed to occur at a time when groundwater levels and stream base flows in the region were as close as possible to the long-term average. Data from the nearby long-term streamgage at the Indian River in Clinton (USGS streamgage 01195100; fig. 1, inset map) were examined to determine when conditions were similar to long-term average base flows. The base flow separation program PART (Rutledge, 1998) was used to analyze streamflow data from the Indian River streamgage collected from 1982 through 2003 and estimate the long-term average base flow. The mean base flow from this period was estimated to be 6.6 cubic feet per second (ft3/s). Samples were collected in the Niantic River Basin when the flow at the Indian River in Clinton was 3.0 to 3.3 ft3/s, indicating that base flows were about half the long-term average conditions. Therefore, loads estimated for this study may be lower than average.
Sampling was conducted during a dry 3-day period (June 1–3, 2005) to minimize change in streamflows during sampling. Samples were collected and analyzed for nitrogen and phosphorus constituents and for nitrogen 15-to-nitrogen 14 ratio of nitrogen in nitrate (δ15N of NO3) and oxygen 18-to-oxygen 16 ratio of oxygen in nitrate (δ18O of NO3). The nitrogen and oxygen isotopes were used to assist in determining the sources of nitrate in base flow to the tributaries of the basin.
Water-quality concentrations and instantaneous streamflow measurements were used to calculate instantaneous loads of total nitrogen and total phosphorus at each monitoring site. Load estimates were converted to estimates of nutrient yields to compare among subbasins. Loads for the watersheds of selected reaches were calculated by subtracting loads at the upstream monitoring sites from the loads at downstream locations. Yield was then calculated by dividing the instantaneous load (or gain in instantaneous load) by the drainage area in the selected reach.
Sampling of Tributaries From 2008 Through 2011
To determine continuous stream stage and discharge and to calculate the loads of nitrogen and phosphorus and densities of E. coli bacteria, streamgages were established on the three major tributaries of the Niantic River (fig. 1; table 1) during summer 2008. Water-quality samples were collected monthly at these sites and analyzed for nitrogen and phosphorus constituents and E. coli densities. Additional

Methods of Data Collection 5
0112779101127786
01127778
011277918
011277916
011277913
011277905
011277875
011277795
011277914
0112779165
0112779135
72°10'72°15'
41°25'
41°20'
Niantic River
NianticBay
Lake KonomocLatim
er Brook Oil M
ill B
rook
Ston
y Br
ook
4121480721223
Base from University of Connecticut, Department of Agriculture and Natural Resources, 2000NAD83 Lambert Conformal Conic projection
Land use and land cover data from University of Connecticut, 2009,Center for Land Use Education and Research
2
4
5
3 7
9
8
10
1
611
Continuous streamflowand periodic water-quality site and number
Base flow water-quality survey site and number
Precipitation gage andnumber
DevelopedTurf and grassOther grassesAgricultureDeciduous forestConiferous forestWaterNonforested wetlandForested wetlandBarren land
Land use and land cover 2006
EXPLANATION
6 Basin or reach boundary andnumber (table 4)
0 2 MILES1
0 2 KILOMETERS1
Figure 2. Land use and land cover in the Niantic River Basin, southeastern Connecticut, in 2006. NAD83, North American Datum of 1983; USGS, U.S. Geological Survey.

6 Nutrient Concentrations and Loads and E. coli densities, Niantic River, Southeastern Connecticut, 2005 and 2008–2011
samples were collected during three storm and high-flow events in water years 2009 and 2010 to better define the relation between nutrient constituent concentrations and a range of streamflows. Annual loads of nutrient constituents were determined for water years 2009 through 2011. Field measurements of specific conductance, pH, dissolved oxygen, water temperature, and turbidity were made for every sample that was collected.
Streamflow Measurement
As part of the base flow water-quality survey, instantaneous streamflow measurements were made at selected sites in 2005. After the streamgages were established on Latimer Brook, Oil Mill Brook, and Stony Brook in 2008 (fig. 1), streamflow measurements were made to develop and maintain stage-to-discharge rating curves for each site. Stage data were collected at 15-minute intervals at Latimer Brook and 5-minute intervals at Oil Mill Brook and Stony Brook. These stage data were used in conjunction with the rating curves to develop a record of continuous streamflow for each streamgage.
Streamflow measurements and discharge computations until 2010 were done following the procedures described in Rantz (1982a,b); after 2010, the methods were supplemented using techniques in Sauer and Turnipseed (2010) and Turnipseed and Sauer (2010).
Water-Quality Field Measurement and Sampling Procedures
Water-quality sample collection methods and equipment selection for this study are described in Wilde and others (1998a-c, 1999a,b). Sampling methods depended on the flow conditions. In high-flow conditions, samples were collected using an equal width increment (EWI) method, compositing samples from at least 10 equally spaced locations across the stream channel. In low-flow conditions, samples were collected using a single vertical in the channel thalweg. Field measurements were made during each site visit and included specific conductance, temperature, pH, dissolved oxygen, and turbidity. The methods are described in Wilde and Radtke (1998). Water-quality samples for nutrient analyses were preserved as needed and stored on ice before shipping within 3 days to the USGS National Water Quality Laboratory (NWQL) in Denver, Colorado.
Water-quality samples also were collected from Latimer Brook, Oil Mill Brook, and Stony Brook to determine E. coli bacteria densities. The samples were collected, processed, and analyzed by USGS field personnel using standard sampling procedures outlined by the Connecticut Department of Public Health and Connecticut Department of Environmental Protection (2003).
Laboratory Measurements
Table 2 lists the methods used to analyze samples for nitrogen and phosphorus species at the NWQL. Analytical results were entered into the National Water Information System (NWIS) database by laboratory personnel. Total nitrogen was calculated as the sum of total ammonia plus organic nitrogen and nitrite plus nitrate nitrogen.
Subsamples collected during the watershed base flow survey in 2005 also were analyzed for the δ15N of NO3 and δ18O of NO3. Analysis for these isotopes required a concentration of at least 0.03 milligram per liter (mg/L) of nitrate as N and a total mass of 0.002 mg of nitrate as N in the sample. Samples were analyzed at the USGS Stable Isotope Laboratory in Reston, Virginia, using the methods in Coplen and others (2004).
Nutrient Load Calculation
Nutrient loads were calculated for data collected in 2005 and from 2008 through 2011. Instantaneous nitrogen loads were calculated for the sites sampled during the 2005 base flow survey by multiplying the constituent concentration by the instantaneous flow and converting to appropriate units. Using data collected from 2008 through 2011, annual nutrient loads for nitrogen and phosphorus constituents were determined for the three Niantic River tributaries using the Load Estimator (LOADEST) computer program (Runkel and others, 2004). Given a time series of daily streamflow and instantaneous constituent concentration, LOADEST assists the user in developing a regression model for the estimation of constituent load. Explanatory variables in the regression model may include various functions of streamflow, decimal time, seasonal terms, and additional user-specified data. The formulated regression model then is used to estimate loads over a user-specified time interval.
Load estimations for this project used adjusted maximum likelihood estimation (AMLE; Cohn, 1988; Cohn and others, 1992) because the dataset contained censored data (below an analytical or reporting threshold). Retransformation bias (underestimation of true loads resulting from changing estimates made in log space back to actual numbers) is handled in the AMLE by equations specially designed for censored data. Load estimations using datasets with no censored data converge to the Maximum Likelihood Estimation (MLE); either estimation method, used appropriately, results in a minimum-variance, unbiased estimate of constituent loads (Runkel and others, 2004).
Estimations using the AMLE or MLE require that model residuals are normally distributed. As part of the evaluation of models, plots of residuals were analyzed graphically to verify that residuals met or nearly met normality assumptions.

Methods of Data Collection 7Ta
ble
1.
Land
use
in th
e N
iant
ic R
iver
Bas
in in
sou
thea
ster
n Co
nnec
ticut
in 2
006.
[Lan
d us
e an
d la
nd c
over
is e
xpre
ssed
as t
he p
erce
ntag
e of
wat
ersh
ed a
rea
cove
red
by th
e la
nd c
over
cat
egor
y. L
and
use
and
land
cov
er d
ata
from
Uni
vers
ity o
f Con
nect
icut
, 200
9. I
D, U
.S. G
eolo
gica
l Sur
vey
site
iden
tifica
tion
num
ber;
s, ba
se fl
ow w
ater
-qua
lity
site
, Jun
e 1–
3, 2
005;
c, c
ontin
uous
stre
amflo
w a
nd w
ater
-qua
lity
mon
itorin
g si
te fo
r wat
er y
ears
200
8 th
roug
h 20
11]
IDLa
titud
e (°
ʹ ″)
Long
itude
(°
ʹ ″)
Drai
nage
ar
ea,
in m
i2
Site
ty
pe
Land
use
and
land
cov
er, i
n pe
rcen
t
Subb
asin
, site
nam
eD
evel
-op
ed
Turf
an
d gr
ass
Agr
i-cu
lture
an
d ot
her
gras
ses
Fore
stW
ater
Wet
-la
nd
Bar
ren
land
an
d ut
ility
Impe
r-vi
ous
cove
r in
200
2
Latim
er B
rook
0112
7778
41°2
6ʹ39
″72
°12ʹ
09″
0.69
sB
ogue
Bro
ok a
t Che
ster
field
Rd.
nea
r C
hest
erfie
ld, C
onn.
20.2
8.9
5.5
60.6
0.0
4.7
0.1
6.0
0112
7779
541
°26ʹ
20″
72°1
3ʹ25
″6.
75s
Latim
er B
rook
bel
ow B
eckw
ith P
ond
near
C
hest
erfie
ld, C
onn.
7.0
3.4
4.3
69.2
5.1
3.4
7.6
3.1
0112
7786
41°2
4ʹ18
″72
°13ʹ
33″
2.47
sC
ranb
erry
Mea
dow
Bro
ok a
t Rte
. 161
nea
r C
hest
erfie
ld, C
onn.
5.3
3.7
13.7
71.7
0.1
3.9
1.6
2.8
0112
7787
541
°23ʹ
51″
72°1
3ʹ22
″14
.6s
Latim
er B
rook
at R
occo
Dr.
near
Che
ster
field
, C
onn.
8.6
4.4
6.1
68.5
2.7
4.9
4.9
3.5
0112
7790
541
°22ʹ
07″
72°1
2ʹ08
″17
.6c,
sLa
timer
Bro
ok n
ear I
-95
N E
xit 7
5 ne
ar
Flan
ders
, Con
n.10
.54.
66.
266
.62.
84.
64.
73.
9
Oil M
ill B
rook
0112
7791
41°2
4ʹ19
″72
°10ʹ
55″
2.15
sLa
kes P
ond
Bro
ok a
t Sta
te R
te. 8
5 ne
ar
Che
ster
field
, Con
n.7.
51.
62.
957
.221
.34.
94.
53.
1
0112
7791
341
°22ʹ
51″
72°1
1ʹ15
″1.
06s
Will
ys M
eado
w B
rook
at I
-95
S ne
ar F
land
ers,
Con
n.1.
41.
00.
885
.50.
310
.90.
01.
6
0112
7791
3541
°22ʹ
35″
72°1
1ʹ26
″5.
37s
Oil
Mill
Bro
ok n
ear O
il M
ill R
d. n
ear F
land
ers,
Con
n.9.
92.
23.
466
.18.
76.
92.
83.
6
0112
7791
441
°22ʹ
24″
72°1
1ʹ29
″5.
67c
Oil
Mill
Bro
ok a
t Gur
ley
Rd.
nea
r Eas
t Lym
e,
Con
n.10
.12.
13.
466
.48.
36.
63.
13.
7
Ston
y Br
ook
0112
7791
641
°21ʹ
34″
72°1
0ʹ31
″1.
86c,
sSt
ony
Bro
ok a
t Rte
. 1 n
ear F
land
ers,
Con
n.15
.32.
38.
161
.90.
29.
52.
65.
8N
iant
ic R
iver
0112
7791
6541
°20ʹ
00″
72°1
0ʹ24
″0.
23s
Unn
amed
Bro
ok a
t Nia
ntic
Riv
er R
d. n
ear
Gra
nite
ville
, Con
n.32
.710
.20.
246
.13.
47.
10.
311
.3
0112
7791
841
°19ʹ
59″
72°1
1ʹ48
″0.
31s
Unn
amed
Bro
ok a
t Osw
egat
chie
Hill
s Rd.
nea
r N
iant
ic, C
onn.
4.0
4.1
0.8
84.5
3.2
3.1
0.2
3.9

8 Nutrient Concentrations and Loads and E. coli densities, Niantic River, Southeastern Connecticut, 2005 and 2008–2011
Table 2. Analytes for nutrient samples and analytical methods.
AnalyteReporting limit,
in milligrams per literReference to methodology
Nitrogen, ammonia 0.01 Fishman (1993)Nitrogen, ammonia plus organic, total 0.07 Patton and Truitt (2000)Nitrogen, ammonia and organic, dissolved 0.07 Patton and Truitt (2000)Nitrogen, nitrite 0.001 Fishman (1993)Nitrogen, nitrite and nitrate 0.04 Patton and Kryskalla (2011), Fishman (1993)Phosphorus, dissolved 0.003 U.S. Environmental Protection Agency (1993)Phosphorus, phosphate, ortho 0.004 Fishman (1993)Phosphorus, total 0.004 U.S. Environmental Protection Agency (1993)
Nutrient Concentrations and Loads in Tributaries of the Niantic River Estuary
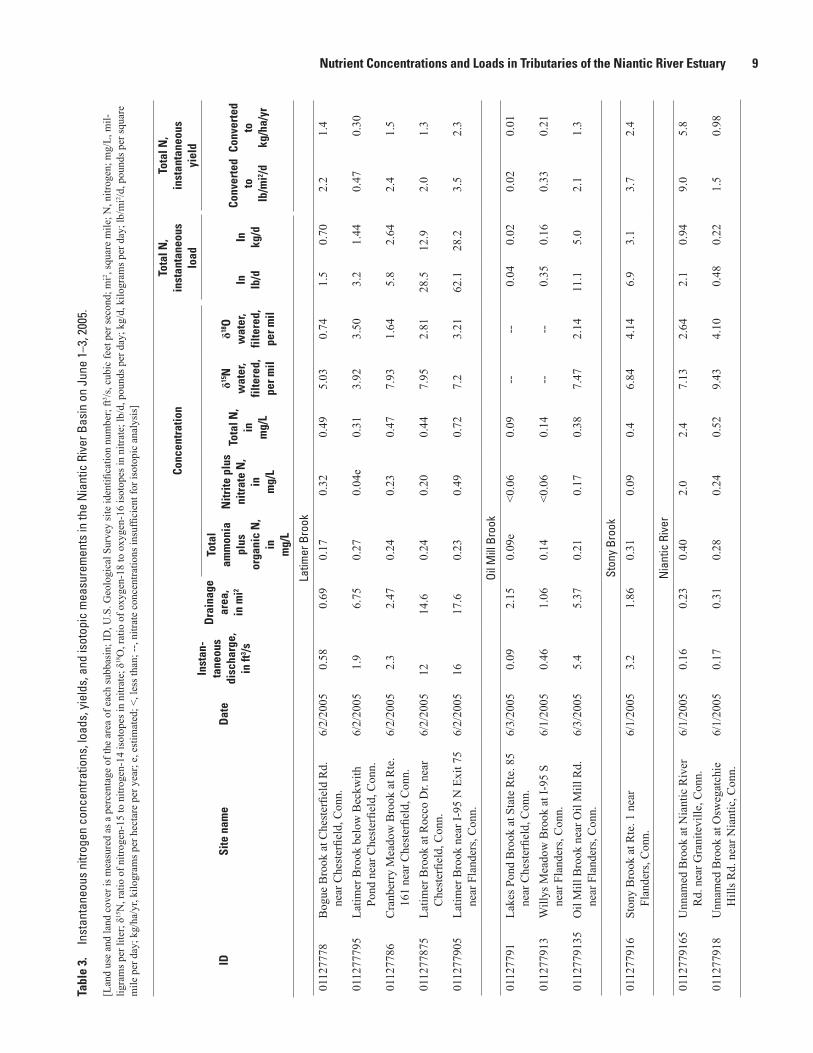
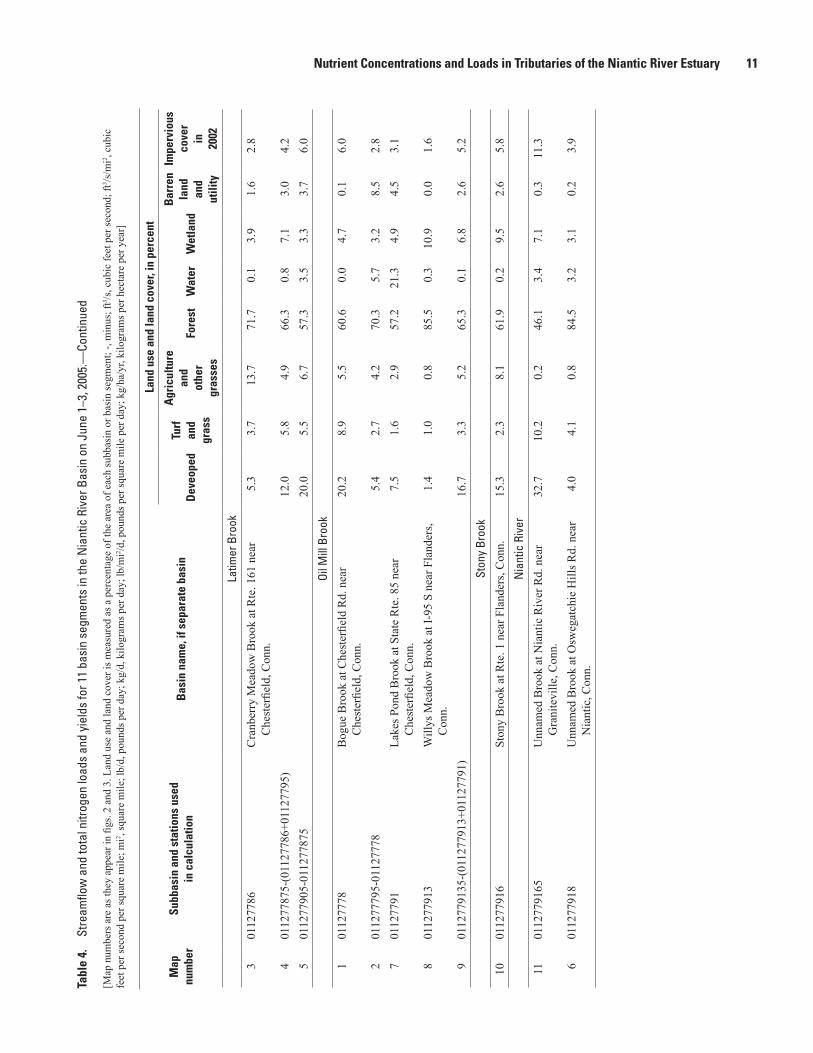
Instantaneous loads of nutrients were calculated for 11 monitoring stations sampled in June 2005, and isotopic analyses of nitrate were compared with known sources of nitrogen for 9 monitoring stations (table 3). Yields of nitrogen during the base flow survey were calculated for reaches of streams between monitoring stations in the Niantic River Basin and compared by differences in land use (table 4).
Data on nutrient concentrations and streamflows collected from August 2008 through February 2012 were analyzed to determine statistical distributions. They also were compared to USEPA recommended criteria for nitrogen and phosphorus concentrations in streams (U.S. Environmental Protection Agency, 2000). Annual loads and yields of total nitrogen and phosphorus, ammonia plus organic nitrogen, and dissolved phosphorus were calculated for water years 2009 through 2011. E. coli densities were analyzed for water-quality samples collected from August 2008 through February 2011 and compared with State of Connecticut water-quality standards. E. coli densities for samples collected from wet weather events and during dry weather for water years 2008 through 2011 were compared.
Watershed Base Flow Survey in 2005
Instantaneous streamflow from the subbasins of the Niantic River during June 1–3, 2005, ranged from 0.09 ft3/s at Lakes Pond Brook (site 01127791; fig. 1) to 16 ft3/s at Latimer Brook (site 011277905; fig. 1; tables 3 and 5). Flows generally increased downstream; however, flows in Latimer Brook and Oil Mill Brook are probably lower than expected due to diversions from upstream reservoirs serving the city of New London. To understand the increase in flow due to groundwater discharge, gains in streamflow were calculated by subtracting the flows of upstream stations from downstream stations in the same subbasin. Gains in
streamflow (table 4), which represent groundwater inflow, ranged from 0.04 to 2.25 cubic feet per second per square mile (ft3/s/mi2; table 4) with the smallest discharge per unit area immediately downstream of reservoirs (site 01127791 at the outlet of Lake Konomoc). The largest discharge per unit area was measured in the lower part of the Oil Mill Brook Basin (basin segment 9; fig. 3). Gains in discharge per unit area were largest in segments dominated by coarse-grained glacial stratified deposits.
Total nitrogen concentrations ranged from 0.09 to 2.4 mg/L (table 3). Total nitrogen concentrations included total ammonia plus organic nitrogen, which ranged from less than 0.09 to 0.27 mg/l, and nitrite plus nitrate nitrogen, which ranged from less than 0.06 to 2.0 mg/L. Samples from two locations did not have sufficient nitrate for isotopic analysis. Isotopic results for the remaining nine samples were overlain on a plot (fig. 4) of estimated compositions from different sources, including atmospheric deposition, synthetic nitrate fertilizers, soil nitrate and ammonium fertilizers, and sewage and animal wastes (Ging and others, 1996). Values of δ15N and δ18O in nitrate ranged from 3.92 to 9.43 per mil and 0.74 to 4.1 per mil, respectively. Values from eight of the samples from the base flow survey plotted near the estimated compositions for soil nitrate and ammonium fertilizers, and one sample plotted within the range expected for sewage and animal wastes. Therefore, the likely sources of nitrogen from base flow samples in the Niantic River Basin are fertilizer, soil nitrate, and sewage or animal wastewater sources, or some combination. Samples from this survey do not show evidence of atmospheric sources or nitrate that has been subject to denitrification; nitrate from atmospheric deposition tends to have high values of δ18O, and samples showing denitrification would tend to have high values of δ18O and δ15N (Kendall, 1998).
Instantaneous total nitrogen loads (table 3) ranged from less than 1 to 62.1 pounds per day (lb/d) at the farthest downstream station on Latimer Brook (site 011277905). Total nitrogen loads at the farthest downstream stations on Oil Mill Brook (site 0112779135) and Stony Brook (site 011277916) were 11.1 lb/d and 6.9 lb/d, respectively. Instantaneous total
Nutrient Concentrations and Loads in Tributaries of the Niantic River Estuary 9Ta
ble
3.
Inst
anta
neou
s ni
troge
n co
ncen
tratio
ns, l
oads
, yie
lds,
and
isot
opic
mea
sure
men
ts in
the
Nia
ntic
Riv
er B
asin
on
June
1–3
, 200
5.
[Lan
d us
e an
d la
nd c
over
is m
easu
red
as a
per
cent
age
of th
e ar
ea o
f eac
h su
bbas
in; I
D, U
.S. G
eolo
gica
l Sur
vey
site
iden
tifica
tion
num
ber;
ft3 /s, c
ubic
feet
per
seco
nd; m
i2 , sq
uare
mile
; N, n
itrog
en; m
g/L,
mil-
ligra
ms p
er li
ter;
δ15N
, rat
io o
f nitr
ogen
-15
to n
itrog
en-1
4 is
otop
es in
nitr
ate;
δ18
O, r
atio
of o
xyge
n-18
to o
xyge
n-16
isot
opes
in n
itrat
e; lb
/d, p
ound
s per
day
; kg/
d, k
ilogr
ams p
er d
ay; l
b/m
i2 /d, p
ound
s per
squa
re
mile
per
day
; kg/
ha/y
r, ki
logr
ams p
er h
ecta
re p
er y
ear;
e, e
stim
ated
; <, l
ess t
han;
--, n
itrat
e co
ncen
tratio
ns in
suffi
cien
t for
isot
opic
ana
lysi
s]
IDSi
te n
ame
Dat
e
Inst
an-
tane
ous
disc
harg
e,
in ft
3 /s
Dra
inag
e ar
ea,
in m
i2
Conc
entr
atio
nTo
tal N
, in
stan
tane
ous
load
Tota
l N,
inst
anta
neou
s
yiel
d
Tota
l am
mon
ia
plus
or
gani
c N
, in
m
g/L
Nitr
ite p
lus
nitr
ate
N,
in
mg/
L
Tota
l N,
in
mg/
L
δ15N
w
ater
, fil
tere
d,
per m
il
δ18O
w
ater
, fil
tere
d,
per m
il
In
lb/d
In
kg/d
Conv
erte
d to
lb
/mi2 /d
Conv
erte
d to
kg
/ha/
yr
Latim
er B
rook
0112
7778
Bog
ue B
rook
at C
hest
erfie
ld R
d.
near
Che
ster
field
, Con
n.6/
2/20
050.
580.
690.
170.
320.
495.
030.
741.
50.
702.
21.
4
0112
7779
5La
timer
Bro
ok b
elow
Bec
kwith
Po
nd n
ear C
hest
erfie
ld, C
onn.
6/2/
2005
1.9
6.75
0.27
0.04
e0.
313.
923.
503.
21.
440.
470.
30
0112
7786
Cra
nber
ry M
eado
w B
rook
at R
te.
161
near
Che
ster
field
, Con
n.6/
2/20
052.
32.
470.
240.
230.
477.
931.
645.
82.
642.
41.
5
0112
7787
5La
timer
Bro
ok a
t Roc
co D
r. ne
ar
Che
ster
field
, Con
n.6/
2/20
0512
14.6
0.24
0.20
0.44
7.95
2.81
28.5
12.9
2.0
1.3
0112
7790
5La
timer
Bro
ok n
ear I
-95
N E
xit 7
5 ne
ar F
land
ers,
Con
n.6/
2/20
0516
17.6
0.23
0.49
0.72
7.2
3.21
62.1
28.2
3.5
2.3
Oil M
ill B
rook
0112
7791
Lake
s Pon
d B
rook
at S
tate
Rte
. 85
near
Che
ster
field
, Con
n.6/
3/20
050.
092.
150.
09e
<0.0
60.
09--
--0.
040.
020.
020.
01
0112
7791
3W
illys
Mea
dow
Bro
ok a
t I-9
5 S
near
Fla
nder
s, C
onn.
6/1/
2005
0.46
1.06
0.14
<0.0
60.
14--
--0.
350.
160.
330.
21
0112
7791
35O
il M
ill B
rook
nea
r Oil
Mill
Rd.
ne
ar F
land
ers,
Con
n.6/
3/20
055.
45.
370.
210.
170.
387.
472.
1411
.15.
02.
11.
3
Ston
y Br
ook
0112
7791
6St
ony
Bro
ok a
t Rte
. 1 n
ear
Flan
ders
, Con
n.6/
1/20
053.
21.
860.
310.
090.
46.
844.
146.
93.
13.
72.
4
Nia
ntic
Riv
er
0112
7791
65U
nnam
ed B
rook
at N
iant
ic R
iver
R
d. n
ear G
rani
tevi
lle, C
onn.
6/1/
2005
0.16
0.23
0.40
2.0
2.4
7.13
2.64
2.1
0.94
9.0
5.8
0112
7791
8U
nnam
ed B
rook
at O
sweg
atch
ie
Hill
s Rd.
nea
r Nia
ntic
, Con
n.6/
1/20
050.
170.
310.
280.
240.
529.
434.
100.
480.
221.
50.
98

10 Nutrient Concentrations and Loads and E. coli densities, Niantic River, Southeastern Connecticut, 2005 and 2008–2011Ta
ble
4.
Stre
amflo
w a
nd to
tal n
itrog
en lo
ads
and
yiel
ds fo
r 11
basi
n se
gmen
ts in
the
Nia
ntic
Riv
er B
asin
on
June
1–3
, 200
5.
[Map
num
bers
are
as t
hey
appe
ar in
figs
. 2 a
nd 3
. Lan
d us
e an
d la
nd c
over
is m
easu
red
as a
per
cent
age
of th
e ar
ea o
f eac
h su
bbas
in o
r bas
in se
gmen
t; -,
min
us; f
t3 /s, c
ubic
feet
per
seco
nd; f
t3 /s/m
i2 , cu
bic
fe
et p
er se
cond
per
squa
re m
ile; m
i2 , sq
uare
mile
; lb/
d, p
ound
s per
day
; kg/
d, k
ilogr
ams p
er d
ay; l
b/m
i2 /d, p
ound
s per
squa
re m
ile p
er d
ay; k
g/ha
/yr,
kilo
gram
s per
hec
tare
per
yea
r]
Map
nu
m-
ber
Subb
asin
and
sta
tions
us
ed in
cal
cula
tion
Bas
in n
ame,
if s
epar
ate
basi
n
Flow
or
diffe
renc
e in
flow
, in
ft3 /s
Dra
inag
e ar
ea o
r di
ffere
nce
in d
rain
age
area
, in
mi2
Flow
/mi2
of b
asin
se
gmen
t in
ft3 /s
/mi2
Tota
l nitr
o-ge
n lo
ad o
r di
ffere
nce
in
nitr
ogen
load
Tota
l nitr
ogen
yie
ld
In
lb/d
In
kg/d
Conv
erte
d to
lb/m
i2 /dCo
nver
ted
to k
g/ha
/yr
Latim
er B
rook
301
1277
86C
ranb
erry
Mea
dow
Bro
ok a
t Rte
. 161
nea
r C
hest
erfie
ld, C
onn.
2.3
2.47
0.93
5.8
2.6
2.4
1.5
401
1277
875-
(011
2778
6+01
1277
95)
7.8
5.38
1.45
19.5
8.8
3.6
2.3
501
1277
905-
0112
7787
54
3.00
1.33
33.7
15.3
11.2
7.2
Oil M
ill B
rook
101
1277
78B
ogue
Bro
ok a
t Che
ster
field
Rd.
nea
r C
hest
erfie
ld, C
onn.
0.58
0.69
0.84
1.5
0.7
2.2
1.4
201
1277
795-
0112
7778
1.32
6.06
0.22
1.6
0.7
0.3
0.17
701
1277
91La
kes P
ond
Bro
ok a
t Sta
te R
te. 8
5 ne
ar
Che
ster
field
, Con
n.0.
092.
150.
040.
040.
020.
020.
01
801
1277
913
Will
ys M
eado
w B
rook
at I
-95
S ne
ar F
land
ers,
Con
n.0.
461.
060.
430.
30.
20.
30.
21
901
1277
9135
-(01
1277
913+
0112
7791
)4.
852.
162.
2510
.74.
84.
93.
2St
ony
Broo
k
1001
1277
916
Ston
y B
rook
at R
te. 1
nea
r Fla
nder
s, C
onn.
3.2
1.86
1.72
6.9
3.1
3.7
2.4
Nia
ntic
Riv
er
1101
1277
9165
Unn
amed
Bro
ok a
t Nia
ntic
Riv
er R
d. n
ear
Gra
nite
ville
, Con
n.0.
160.
230.
702.
10.
99.
05.
8
601
1277
918
Unn
amed
Bro
ok a
t Osw
egat
chie
Hill
s Rd.
nea
r N
iant
ic, C
onn.
0.17
0.31
0.55
0.5
0.2
1.5
0.98
Nutrient Concentrations and Loads in Tributaries of the Niantic River Estuary 11Ta
ble
4.
Stre
amflo
w a
nd to
tal n
itrog
en lo
ads
and
yiel
ds fo
r 11
basi
n se
gmen
ts in
the
Nia
ntic
Riv
er B
asin
on
June
1–3
, 200
5.—
Cont
inue
d
[Map
num
bers
are
as t
hey
appe
ar in
figs
. 2 a
nd 3
. Lan
d us
e an
d la
nd c
over
is m
easu
red
as a
per
cent
age
of th
e ar
ea o
f eac
h su
bbas
in o
r bas
in se
gmen
t; -,
min
us; f
t3 /s, c
ubic
feet
per
seco
nd; f
t3 /s/m
i2 , cu
bic
feet
per
seco
nd p
er sq
uare
mile
; mi2 ,
squa
re m
ile; l
b/d,
pou
nds p
er d
ay; k
g/d,
kilo
gram
s per
day
; lb/
mi2 /d
, pou
nds p
er sq
uare
mile
per
day
; kg/
ha/y
r, ki
logr
ams p
er h
ecta
re p
er y
ear]
Map
nu
mbe
rSu
bbas
in a
nd s
tatio
ns u
sed
in
cal
cula
tion
Bas
in n
ame,
if s
epar
ate
basi
n
Land
use
and
land
cov
er, i
n pe
rcen
t
Dev
eope
dTu
rf
and
gras
s
Agr
icul
ture
an
d
othe
r gr
asse
s
Fore
stW
ater
Wet
land
Bar
ren
land
an
d ut
ility
Impe
rvio
us
cove
r in
20
02
Latim
er B
rook
301
1277
86C
ranb
erry
Mea
dow
Bro
ok a
t Rte
. 161
nea
r C
hest
erfie
ld, C
onn.
5.3
3.7
13.7
71.7
0.1
3.9
1.6
2.8
401
1277
875-
(011
2778
6+01
1277
95)
12.0
5.8
4.9
66.3
0.8
7.1
3.0
4.2
501
1277
905-
0112
7787
520
.05.
56.
757
.33.
53.
33.
76.
0Oi
l Mill
Bro
ok
101
1277
78B
ogue
Bro
ok a
t Che
ster
field
Rd.
nea
r C
hest
erfie
ld, C
onn.
20.2
8.9
5.5
60.6
0.0
4.7
0.1
6.0
201
1277
795-
0112
7778
5.4
2.7
4.2
70.3
5.7
3.2
8.5
2.8
701
1277
91La
kes P
ond
Bro
ok a
t Sta
te R
te. 8
5 ne
ar
Che
ster
field
, Con
n.7.
51.
62.
957
.221
.34.
94.
53.
1
801
1277
913
Will
ys M
eado
w B
rook
at I
-95
S ne
ar F
land
ers,
Con
n.1.
41.
00.
885
.50.
310
.90.
01.
6
901
1277
9135
-(01
1277
913+
0112
7791
)16
.73.
35.
265
.30.
16.
82.
65.
2St
ony
Broo
k
1001
1277
916
Ston
y B
rook
at R
te. 1
nea
r Fla
nder
s, C
onn.
15.3
2.3
8.1
61.9
0.2
9.5
2.6
5.8
Nia
ntic
Riv
er
1101
1277
9165
Unn
amed
Bro
ok a
t Nia
ntic
Riv
er R
d. n
ear
Gra
nite
ville
, Con
n.32
.710
.20.
246
.13.
47.
10.
311
.3
601
1277
918
Unn
amed
Bro
ok a
t Osw
egat
chie
Hill
s Rd.
nea
r N
iant
ic, C
onn.
4.0
4.1
0.8
84.5
3.2
3.1
0.2
3.9

12 Nutrient Concentrations and Loads and E. coli densities, Niantic River, Southeastern Connecticut, 2005 and 2008–2011Ta
ble
5.
Inst
anta
neou
s ph
osph
orus
con
cent
ratio
ns, l
oads
and
yie
lds
in th
e N
iant
ic R
iver
Bas
in o
n Ju
ne 1
–3, 2
005.
[ID
, U.S
. Geo
logi
cal S
urve
y si
te id
entifi
catio
n nu
mbe
r; ft3 /s
, cub
ic fe
et p
er se
cond
; mi2 ,
squa
re m
iles;
mg/
L, m
illig
ram
s per
lite
r; P,
pho
spho
rus;
lb/d
, pou
nds p
er d
ay; k
g/d,
kilo
gram
s per
day
; lb/
mi2 /d
, pou
nds p
er
squa
re m
ile p
er d
ay; k
g/ha
/yr,
kilo
gram
s per
hec
tare
per
yea
r; e,
est
imat
ed; <
, les
s tha
n; n
a, lo
ad c
alcu
latio
n no
t pos
sibl
e du
e to
pho
spho
rus c
once
ntra
tions
less
than
the
repo
rting
lim
it]
IDSi
te n
ame
Dat
e sa
mpl
ed
Inst
anta
-ne
ous
disc
harg
e,
in ft
3 /s
Dra
inag
e ar
ea,
in m
i2
Conc
entr
atio
nTo
tal P
, in
stan
tane
ous
load
Tota
l P,
inst
anta
neou
s
yiel
d
Phos
phor
us,
diss
olve
d,
in m
g/L
Tota
l P,
in m
g/L
In
lb/d
In
kg/d
Conv
erte
d to
lb/m
i2 /dCo
nver
ted
to k
g/ha
/yr
Latim
er B
rook
0112
7778
Bog
ue B
rook
at C
hest
erfie
ld R
d. n
ear C
hest
erfie
ld, C
onn.
6/2/
2005
0.58
0.69
0.00
50.
015
0.04
70.
021
0.06
80.
0401
1277
795
Latim
er B
rook
bel
ow B
eckw
ith P
ond
near
Che
ster
field
, Con
n.6/
2/20
051.
96.
750.
004
0.02
0e0.
205
0.09
30.
030
0.02
0112
7786
Cra
nber
ry M
eado
w B
rook
at R
te. 1
61 n
ear C
hest
erfie
ld, C
onn.
6/2/
2005
2.3
2.47
0.01
00.
017
0.21
10.
096
0.08
50.
0501
1277
875
Latim
er B
rook
at R
occo
Dr.
near
Che
ster
field
, Con
n.6/
2/20
0512
14.6
0.00
60.
016
1.04
0.47
00.
071
0.05
0112
7790
5La
timer
Bro
ok n
ear I
-95
N E
xit 7
5 ne
ar F
land
ers,
Con
n.6/
2/20
0516
17.6
.004
e0.
014
1.21
0.54
80.
069
0.04
Oil M
ill B
rook
0112
7791
Lake
s Pon
d B
rook
at S
tate
Rte
. 85
near
Che
ster
field
, Con
n.6/
3/20
050.
092.
150.
004
<0.0
08na
nana
na01
1277
913
Will
ys M
eado
w B
rook
at I
-95
S ne
ar F
land
ers,
Con
n.6/
1/20
050.
461.
060.
006
<0.0
06na
nana
na01
1277
9135
Oil
Mill
Bro
ok n
ear O
il M
ill R
d. n
ear F
land
ers,
Con
n.6/
3/20
055.
45.
370.
006
0.01
10.
320
0.14
50.
060
0.04
Ston
y Br
ook
0112
7791
6St
ony
Bro
ok a
t Rte
. 1 n
ear F
land
ers,
Con
n.6/
1/20
053.
21.
860.
009
0.01
70.
293
0.13
30.
158
0.10
Nia
ntic
Riv
er
0112
7791
65U
nnam
ed B
rook
at N
iant
ic R
iver
Rd.
nea
r Gra
nite
ville
, Con
n.6/
1/20
050.
160.
230.
019
0.04
00.
035
0.01
60.
150
0.10
0112
7791
8U
nnam
ed B
rook
at O
sweg
atch
ie H
ills R
d. n
ear N
iant
ic, C
onn.
6/1/
2005
0.17
0.31
0.00
60.
011
0.01
00.
005
0.03
30.
02

Nutrient Concentrations and Loads in Tributaries of the Niantic River Estuary 13
2
4
5
3 7
98
10
1
6
72°10'72°15'
41°25'
41°20'
Lake Konomoc
Base from University of Connecticut, Department of Agriculture and Natural Resources, 2000NAD83 Lambert Conformal Conic projection
11
0112779101127786
01127778
011277918
011277916
011277795
0112779165
Latimer Brook O
il M
ill B
rook
Ston
y Br
ook
011277905
Niantic River
011277913
0112779135
EXPLANATIONInstantaneous nitrogen yield, in kg/ha/yr
0.013 - 0.17
>0.17 - 0.98
>0.98 - 1.51
>1.51 - 2.93
>2.93 - 7.17
Base flow water-quality survey site and number
6 Basin or reach boundary andnumber (table 4)
0 2 MILES1
0 2 KILOMETERS1Niantic
Bay
Figure 3. Nitrogen yields from selected basin segments in the Niantic River Basin, southeastern Connecticut, on June 1–3, 2005. kg/ha/, (kilograms per hectare per year); NAD83, North American Datum of 1983; USGS, U.S. Geological Survey.

14 Nutrient Concentrations and Loads and E. coli densities, Niantic River, Southeastern Connecticut, 2005 and 2008–2011
USGS base flow water-qualitysite and identification number
0112779135
-10
0
10
20
30
40
50
60
70
80
-5 0 5 10 15 20 25
Atmosphericsources
Synthetic nitratefertilizers
Soil nitrateand ammoniumfertilizers
Sewage and animal wastes
Areas of overlap
δ15N of nitrate, in per mil
δ18O
of n
itrat
e, in
per
mil
EXPLANATION
01127778011277795
011277918
01127786
0112778750112779135
011277916
011277905
0112779135
Figure 4. Approximate compositional ranges of δ15N and δ18O data for sources of nitrate. Reproduced from Ging and others (1996). Water-quality samples collected June 1–3, 2005, from the Niantic River Basin, southeastern Connecticut, are plotted. δ15N, ratio of nitrogen-15 to nitrogen-14 isotopes of nitrate; δ18O, ratio of oxygen-18 to oxygen-16 isotopes of nitrate; USGS, U.S. Geological Survey.
nitrogen yields also were calculated as gains by river reach, by subtracting the upstream loads from the loads at downstream stations and dividing by the drainage area of the reach (table 4).
Total nitrogen yields from basins or basin segments ranged from 0.02 to 11.2 pounds per square mile per day (lb/mi2/d; 0.01 to 7.2 kilograms per hectare per year (kg/ha/yr); tables 3 and 4). The highest yield was measured for the segment between stations 011277905 and 011277875 on Latimer Brook (fig. 3, segment 5) and was due to an increase of 33.7 lb/d [15.3 kilograms per day (kg/d)] in total nitrogen load (table 4). The next largest yield, 9.0 lb/mi2/d (5.8 kg/ha/yr), was from an unnamed brook (station 0112779165; fig. 3, segment 11). Total nitrogen yields were positively correlated with the percentage of developed land use for each basin segment (fig. 5).
Sources of nitrogen in base flow are generally representative of the quality of groundwater discharging to the stream; the isotopic measurements from the water-quality samples analyzed indicate the possibility of elevated nitrogen from fertilizers and septic systems or some mixture of sources, including soil nitrate. These samples only represent base flow, and therefore, samples collected during stormwater runoff events may have different sources of nitrogen.
Instantaneous total phosphorus concentrations were generally low, ranging from less than 0.006 to 0.040 mg/L. Instantaneous total phosphorus loads ranged from 0.010 to 1.21 lb/d at the farthest downstream station on Latimer Brook (site 011277905). Total phosphorus loads from the farthest downstream stations on Oil Mill Brook (site 0112779135) and Stony Brook (site 011277916) were 0.320 lb/d and 0.293 lb/d, respectively, representing the base flow load of phosphorus to the estuary (table 5). Total phosphorus instantaneous yields ranged from 0.033 to 0.158 lb/mi2/d (0.02 to 0.1 kg/ha/yr).
Tributary Monitoring From 2008 Through 2011
Streamflow
Streamflow was greatest during water year 2010 (table 6, fig. 6) due to extreme high flows caused by excessive rainfall that occurred around March 30, 2010, when a total of 9.2 inches of rainfall was measured at USGS rain gage 4121480721223 (fig. 1) in East Lyme. Although this was an extreme event that affected the mean flows for that year, median flows were highest in water year 2009.

Nutrient Concentrations and Loads in Tributaries of the Niantic River Estuary 15
0 10 20 30
Developed land, in percent
0
2
4
6
Inst
anta
neou
s yi
eld,
conv
erte
d to
kilo
gram
s pe
r hec
tare
per
yea
r
40
8
11
5
1
10
9
4
36
8 2 7
Yield (= 0.1955 x percent developed) - 0.2153adjusted R2= 0.57
EXPLANATION
Basin and number—locationsshown in figures 2 and 3
11
Figure 5. Instantaneous nitrogen yield by percentage of developed land for basin segments in the Niantic River Basin from water-quality samples and streamflow measurements collected June 1–3, 2005. R2, coefficient of determination.
Table 6. Streamflow characteristics of three Niantic River tributaries in southeastern Connecticut for water years 2009–2011.
[ID, U.S. Geological Survey site identification number; mi2, square mile; ft3/s, cubic feet per second; max., maximum; min., minimum]
ID Site nameDrainage
area, in mi2
Minimum, in ft3/s
Lower quartile, in ft3/s
Median, in ft3/s
Mean, in ft3/s
Upper quartile, in ft3/s
Maximum, in ft3/s
Runoff, in
inches
Water year 2009
011277905 Latimer Brook near I-95 N Exit 75 near Flanders, Conn.
17.6 2.8 16.0 29.0 36.0 41.0 462 27.8
011277914 Oil Mill Brook at Gurley Rd. near East Lyme, Conn.
5.67 1.6 4.5 7.0 8.5 10.0 92 20.4
011277916 Stony Brook at Rte. 1 near Flanders, Conn. 1.86 0.48 2.0 3.8 4.5 5.3 56 33.0Water year 2010
011277905 Latimer Brook near I-95 N Exit 75 near Flanders, Conn.
17.6 1.2 8.9 20.0 43.3 42.0 1,350 33.4
011277914 Oil Mill Brook at Gurley Rd. near East Lyme, Conn.
5.67 0.98 2.9 5.9 9.7 10.0 330 23.2
011277916 Stony Brook at Rte. 1 near Flanders, Conn. 1.86 0.41 1.2 3.0 5.6 5.4 194 40.7Water year 2011
011277905 Latimer Brook near I-95 N Exit 75 near Flanders, Conn.
17.6 2.1 9.2 16.0 28.3 32.0 266 21.8
011277914 Oil Mill Brook at Gurley Rd. near East Lyme, Conn.
5.67 1.5 3.1 7.0 8.0 10.0 54 19.2
011277916 Stony Brook at Rte. 1 near Flanders, Conn. 1.86 0.5 1.4 2.3 3.7 4.3 30 27.3

16 Nutrient Concentrations and Loads and E. coli densities, Niantic River, Southeastern Connecticut, 2005 and 2008–2011
1
10
100
1,000
Disc
harg
e, in
cub
ic fe
et p
er s
econ
d
A. Latimer Brook
0.1
1
10
100
1,000
10/1
/08
1/1/
09
4/1/
09
7/1/
09
10/1
/09
1/1/
11
10/1
/10
1/1/
10
4/1/
10
7/1/
10
4/1/
11
10/1
/11
7/1/
11
Date
B. Oil Mill Brook
Daily mean discharge
Water-quality sample collection
EXPLANATION
Daily mean discharge
Water-quality sample collection
EXPLANATION
Figure 6. Daily discharge from A, Latimer Brook; B, Oil Mill Brook; C, Stony Brook tributaries of the Niantic River, showing dates of samples collected, Niantic River Basin, southeastern Connecticut.

Nutrient Concentrations and Loads in Tributaries of the Niantic River Estuary 17
0
1
10
100
1,000
Disc
harg
e, in
cub
ic fe
et p
er s
econ
d
10/1
/08
1/1/
09
4/1/
09
7/1/
09
10/1
/09
1/1/
11
10/1
/10
1/1/
10
4/1/
10
7/1/
10
4/1/
11
10/1
/11
7/1/
11
Date
C. Stony Brook
Daily mean discharge
Water-quality sample collection
EXPLANATION
Figure 6. Daily discharge from A, Latimer Brook; B, Oil Mill Brook; C, Stony Brook tributaries of the Niantic River, showing dates of samples collected, Niantic River Basin, southeastern Connecticut. —Continued
The total mean daily flow from the three major tributaries with continuous streamflow ranged from 40 ft3/s (25.9 million gallons per day (Mgal/d)) in water year 2011 to 58.6 ft3/s (37.8 Mgal/d) in water year 2010.
The annual total runoff (the part of precipitation appearing in surface streams) from each of the watersheds was variable. Stony Brook had the greatest amount of runoff ranging from 27.3 inches in water year 2011 to 40.7 inches in water year 2010. The other two sites had lower runoff for each of the three water years likely due to water diversions from reservoirs in the Latimer Brook and Oil Mill Brook Basins. If runoff from Stony Brook (which has no reservoirs) is representative of the amount of natural runoff for the region, then the difference between the runoff from Oil Mill Brook and Latimer Brook relative to Stony Brook should be generally representative of the amount of water diverted out of the Niantic Basin (assuming change in storage in the reservoirs is negligible). The total difference in runoff between Stony Brook and the other two tributaries (Oil Mill Brook and Latimer Brook) ranged from 10.5 to 16.9 ft3/s (7.8 to 10.9 Mgal/d), indicating that flows to the Niantic River have been altered substantially by diversion. The estimated demand
for water from users in the city of New London for 2010 was expected to be 5.9 Mgal/d, based on projections in the regional water supply plan (Southeastern Connecticut Water Authority, 2003). Differences between the estimated diversions and the calculated differences among tributaries described above may be attributed to (1) the assumption that runoff from Stony Brook is representative of prediversion runoff from the other stations; (2) changes in surface water storage; (3) small errors in measurement of watershed area or streamflow; or (4) diversions of water that were larger than those projected in the water supply plan of 2003.
The diversion of water from the Niantic River likely affects the nutrient cycling of the downstream estuary by (1) reducing the overall loading rate of nutrients that originate upstream of the water diversion and (2) increasing the freshwater residence time of the estuary. Nutrient loads are reduced, but the freshwater that remains in the estuary is likely to reside in the estuary for a longer time period. The remaining nutrients have not been diluted by the lower concentrations of nutrients that would have originated in the forested watersheds upstream of water supply diversions.
18 Nutrient Concentrations and Loads and E. coli densities, Niantic River, Southeastern Connecticut, 2005 and 2008–2011
NitrogenConcentrations of total nitrogen (fig. 7; table 7) were
generally low at all three stations relative to many locations in Connecticut. The highest concentrations of total nitrogen were in samples from the Latimer Brook site, whereas Oil Mill Brook and Stony Brook had similar distributions of concentration for samples collected from 2008 through 2012 (fig. 7). Latimer Brook had higher concentrations of total nitrogen than did Oil Mill Brook and Stony Brook, which had similar distributions of concentration for samples collected from 2008 through 2012 (fig.7; table7). The median concentrations of total nitrogen at these three sites were lower than the median value of 0.67 mg/L of data from 38 stations on streams draining to Long Island Sound.
The mean value of total nitrogen was 0.42 mg/L for Oil Mill Brook and Stony Brook and 0.62 mg/L for Latimer Brook. These mean total nitrogen concentrations are below the 0.71 mg/L USEPA ecoregion XIV (Eastern Coastal Plain) total nitrogen recommended criterion for streams (U.S. Environmental Protection Agency, 2000).
Concentrations of total ammonia plus organic nitrogen ranged from less 0.07 to 0.93 mg/L (fig. 8; table 7). Ammonia plus organic nitrogen typically represented less than 50 percent of the total nitrogen concentrations at the Latimer Brook site, but represented more than 50 percent of the total
nitrogen concentrations in samples from the Oil Mill Brook and Stony Brook sites. Concentrations of dissolved ammonia typically represented less than 10 percent of the total ammonia plus organic nitrogen, indicating that organic nitrogen is dominant species.
Total nitrogen loads for all three Niantic River tributaries combined for water years 2009 through 2011 ranged from 41,400 to 60,700 lb (table 8). Total nitrogen loads were consistent with drainage area with the largest loads from Latimer Brook, followed by Oil Mill Brook and Stony Brook. The largest loads were estimated for water year 2010, likely caused at least in part by the additional runoff associated with the storm of March 30, 2010.
Loads of total ammonia plus organic nitrogen (table 8) for all three Niantic River tributaries combined ranged from 22,000 lb in water year 2011 to 35,600 lb in water year 2010. Total ammonia plus organic nitrogen represented 52 to 59 percent of the load of total nitrogen from the three Niantic River tributaries. Loads of total ammonia plus organic nitrogen were largest relative to loads of total nitrogen at Oil Mill Brook and Stony Brook, representing more than 60 percent of the load of total nitrogen and as much as 80 percent of the load for Stony Brook in 2010.
Total nitrogen yields (table 8) were generally highest at Latimer Brook, followed by Stony Brook and Oil Mill Brook. The total nitrogen yields at all three tributaries are generally
39EXPLANATION
Number of values
75th percentile
Largest value within 1.5 timesinterquartile range above75th percentile
25th percentile
Interquartilerange
x Outside value—Value is greaterthan 1.5 and less than 3 timesthe interquartile rangebeyond either end of the box
50th percentile(median)
Smallest value within 1.5 timesinterquartile range below25th percentile
x
x
x
x
x
011277905 011277914 0112779160.2
0.4
0.6
0.8
1.0
1.251 51 51
Total nitrogen
USGS steamgage
Conc
entra
tion,
in m
illig
ram
s pe
r lite
r
Figure 7. Distribution of total nitrogen concentrations in the Niantic River Basin in southeastern Connecticut from August 2008 through February 2012. Data shown are from U.S. Geological Survey (USGS) streamgages 011277905 at Latimer Brook, 011277914 at Oil Mill Brook, and 011277916 at Stony Brook. Line represents the median of samples from 38 stations in the Long Island Sound watershed from October 1995-September 2009.

Nutrient Concentrations and Loads in Tributaries of the Niantic River Estuary 19Ta
ble
7.
Sum
mar
y st
atis
tics
of s
elec
ted
nitro
gen
and
phos
phor
us c
onst
ituen
ts a
nd E
sche
richi
a co
li fo
r wat
er-q
ualit
y sa
mpl
es c
olle
cted
at t
hree
U.S
. Geo
logi
cal S
urve
y st
ream
gage
s in
the
Nia
ntic
Riv
er B
asin
in s
outh
east
ern
Conn
ectic
ut fr
om A
ugus
t 200
8 th
roug
h Fe
brua
ry 2
012.
[Con
cent
ratio
ns in
mill
igra
ms p
er li
ter;
ID, U
.S. G
eolo
gica
l Sur
vey
site
iden
tifica
tion
num
ber;
cfu,
col
ony
form
ing
units
; e, e
stim
ated
; >, g
reat
er th
an; <
, les
s tha
n; E
. col
i, Es
cher
ichi
a co
li; --
, not
app
licab
le]
IDSt
ream
gage
Cons
titue
ntN
umbe
r of
sa
mpl
esM
inim
umM
ean
25th
pe
rcen
tile
Med
ian
75th
pe
rcen
tile
Max
imum
Geo
met
ric
mea
n
Mill
igra
ms
per l
iter
0112
7790
5La
timer
Bro
ok n
ear I
-95
N E
xit 7
5 ne
ar F
land
ers,
Con
n.N
itrog
en, t
otal
510.
410.
620.
480.
560.
771.
00--
0112
7791
4O
il M
ill B
rook
at G
urle
y R
d. n
ear E
ast L
yme,
Con
n.N
itrog
en, t
otal
510.
240.
420.
330.
400.
480.
86--
0112
7791
6St
ony
Bro
ok a
t Rte
. 1 n
ear F
land
ers,
Con
n.N
itrog
en, t
otal
510.
220.
420.
300.
390.
480.
98--
0112
7790
5La
timer
Bro
ok n
ear I
-95
N E
xit 7
5 ne
ar F
land
ers,
Con
n.A
mm
onia
nitr
ogen
, dis
solv
ed51
<0.0
10.
020.
010.
020.
020.
030
--01
1277
914
Oil
Mill
Bro
ok a
t Gur
ley
Rd.
nea
r Eas
t Lym
e, C
onn.
Am
mon
ia n
itrog
en, d
isso
lved
51e0
.01
0.02
0.01
0.02
0.02
0.06
5--
0112
7791
6St
ony
Bro
ok a
t Rte
. 1 n
ear F
land
ers,
Con
n.A
mm
onia
nitr
ogen
, dis
solv
ed51
<0.0
10.
020.
010.
020.
020.
089
--01
1277
905
Latim
er B
rook
nea
r I-9
5 N
Exi
t 75
near
Fla
nder
s, C
onn.
Am
mon
ia p
lus o
rgan
ic n
itrog
en, d
isso
lved
510.
090.
230.
160.
230.
260.
42--
0112
7791
4O
il M
ill B
rook
at G
urle
y R
d. n
ear E
ast L
yme,
Con
n.A
mm
onia
plu
s org
anic
nitr
ogen
, dis
solv
ed51
0.09
0.22
0.16
0.18
0.26
0.50
--01
1277
916
Ston
y B
rook
at R
te. 1
nea
r Fla
nder
s, C
onn.
Am
mon
ia p
lus o
rgan
ic n
itrog
en, d
isso
lved
510.
070.
270.
170.
260.
320.
58--
0112
7790
5La
timer
Bro
ok n
ear I
-95
N E
xit 7
5 ne
ar F
land
ers,
Con
n.A
mm
onia
plu
s org
anic
nitr
ogen
, tot
al51
0.08
0.27
0.17
0.25
0.32
0.72
--01
1277
914
Oil
Mill
Bro
ok a
t Gur
ley
Rd.
nea
r Eas
t Lym
e, C
onn.
Am
mon
ia p
lus o
rgan
ic n
itrog
en, t
otal
510.
080.
260.
170.
200.
290.
77--
0112
7791
6St
ony
Bro
ok a
t Rte
. 1 n
ear F
land
ers,
Con
n.A
mm
onia
plu
s org
anic
nitr
ogen
, tot
al51
0.07
0.30
0.18
0.27
0.37
0.93
--01
1277
905
Latim
er B
rook
nea
r I-9
5 N
Exi
t 75
near
Fla
nder
s, C
onn.
Nitr
ite p
lus n
itrat
e ni
troge
n, d
isso
lved
510.
050.
350.
210.
330.
510.
71--
0112
7791
4O
il M
ill B
rook
at G
urle
y R
d. n
ear E
ast L
yme,
Con
n.N
itrite
plu
s nitr
ate
nitro
gen,
dis
solv
ed51
<0.0
20.
160.
090.
170.
220.
32--
0112
7791
6St
ony
Bro
ok a
t Rte
. 1 n
ear F
land
ers,
Con
n.N
itrite
plu
s nitr
ate
nitro
gen,
dis
solv
ed51
<0.0
20.
110.
050.
100.
140.
31--
0112
7790
5La
timer
Bro
ok n
ear I
-95
N E
xit 7
5 ne
ar F
land
ers,
Con
n.Ph
osph
orus
, dis
solv
ed50
<0.0
030.
008
0.00
50.
007
0.01
0.02
5--
0112
7791
4O
il M
ill B
rook
at G
urle
y R
d. n
ear E
ast L
yme,
Con
n.Ph
osph
orus
, dis
solv
ed50
0.00
30.
009
0.00
50.
008
0.01
0.02
1--
0112
7791
6St
ony
Bro
ok a
t Rte
. 1 n
ear F
land
ers,
Con
n.Ph
osph
orus
, dis
solv
ed50
<0.0
030.
011
0.00
60.
011
0.02
0.03
4--
0112
7790
5La
timer
Bro
ok n
ear I
-95
N E
xit 7
5 ne
ar F
land
ers,
Con
n.Ph
osph
orus
, tot
al50
e0.0
060.
021
0.00
90.
014
0.02
0.11
--01
1277
914
Oil
Mill
Bro
ok a
t Gur
ley
Rd.
nea
r Eas
t Lym
e, C
onn.
Phos
phor
us, t
otal
50e0
.004
0.02
10.
008
0.01
20.
020.
13--
0112
7791
6St
ony
Bro
ok a
t Rte
. 1 n
ear F
land
ers,
Con
n.Ph
osph
orus
, tot
al50
e0.0
040.
024
0.01
30.
018
0.03
0.15
--Co
lony
form
ing
units
per
100
mill
ilite
r
0112
7790
5La
timer
Bro
ok n
ear I
-95
N E
xit 7
5 ne
ar F
land
ers,
Con
n.E.
col
i51
127
823
5918
0>
2,40
063
0112
7791
4O
il M
ill B
rook
at G
urle
y R
d. n
ear E
ast L
yme,
Con
n.E.
col
i51
221
39
2612
0e 2
,900
3601
1277
916
Ston
y B
rook
at R
te. 1
nea
r Fla
nder
s, C
onn.
E. c
oli
511
300
1642
290
2,80
062
20 Nutrient Concentrations and Loads and E. coli densities, Niantic River, Southeastern Connecticut, 2005 and 2008–2011
51EXPLANATION
Number of values
75th percentile
Largest value within 1.5 timesinterquartile range above75th percentile
25th percentile
Interquartilerange
x Outside value—Value is greaterthan 1.5 and less than 3 timesthe interquartile rangebeyond either end of the box
Far-out value—Value is equal orgreater than 3 times theinterquartile range beyondeither end of box
50th percentile(median)
Smallest value within 1.5 timesinterquartile range below25th percentile
o
x
xx
x
xx
oo
x
x
011277905 011277914 0112779160.0
0.2
0.4
0.6
0.8
1.0
1.251 51 51
Total ammonia plus organic nitrogen
USGS streamgage
Conc
entra
tion,
in m
illig
ram
s pe
r lite
r
Figure 8. Distribution of total ammonia plus organic nitrogen concentrations in the Niantic River Basin in southeastern Connecticut from August 2008 through February 2012. Data shown are from U.S. Geological Survey (USGS) streamgages 011277905 at Latimer Brook, 011277914 at Oil Mill Brook, and 011277916 at Stony Brook.
representative of loads from forested basins, although total nitrogen yields from Latimer Brook are slightly higher than the maximum 2,000 lb/mi2/yr for forested basins reported by Trench (2000). Yields of total nitrogen may be lowest at Oil Mill Brook because of the lowest amount of developed and agricultural land of the three basins (table 1). Nitrogen loads and yields at Oil Mill Brook and Latimer Brook are likely less than they would be under natural flow conditions because of the large diversions of water upstream from the streamgages. Stony Brook had the highest yield of total ammonia plus organic nitrogen.
Phosphorus
Total phosphorus concentrations in most samples were low in all three tributaries of the Niantic River, ranging from less than 0.004 to 0.15 mg/L; dissolved phosphorus concentrations ranged from less than 0.003 mg/L to 0.034 mg/L (fig. 9, table 7). Most samples were below the 0.031-mg/L USEPA total phosphorus criterion for streams for ecoregion XIV (U.S. Environmental Protection Agency, 2000). Dissolved phosphorus typically was less than 50 percent of the total phosphorus in samples from Latimer Brook and Oil Mill Brook, but represented more than 50 percent of total phosphorus in Stony Brook. Selected statistics on phosphorus concentrations are in table 7.
The total phosphorus loads (table 9) from all three Niantic River tributaries ranged from 1,770 lb in water year 2011 to 3,540 lb in water year 2010. Latimer Brook accounted for 72 to 75 percent of the total phosphorus load from the three tributaries; Oil Mill Brook and Stony Brook, 16 to 16.6 percent and 9.7 to 11 percent, respectively.
Total phosphorus yields were highest at Stony Brook, followed by Latimer Brook and Oil Mill Brook. Yields ranged from a low of 52 lb/mi2/yr at Oil Mill Brook in water year 2011 to 185 lb/mi2/yr at Stony Brook in water year 2010. Yields of total phosphorus from Latimer Brook and Oil Mill Brook are likely also lower than would be expected without water diversions from the upper watershed.
Escherichia coli
The geometric mean values of E. coli densities at the three sampling stations from August 2008 through February 2012 (table 7) meet the Connecticut water-quality standard of less than 126 colony-forming units (cfu) per 100 milliliters (mL) for all forms of water recreation (Connecticut Department of Energy and Environmental Protection, 2011b). All three monitoring stations had single sample maximum densities in excess of the 235 cfu per 100 mL, 410 cfu per 100 mL, and 576 cfu per 100 mL standards for designated swimming, nondesignated swimming, and other water
Nutrient Concentrations and Loads in Tributaries of the Niantic River Estuary 21
Table 8. Loads and yields of total nitrogen and total ammonia plus organic nitrogen for three stations in the Niantic River Basin in southeastern Connecticut from October 2008 through September 2011.
[ID, U.S. Geological Survey site identification number; lb/d, pounds per day; lb/yr, pounds per year; lb, pounds; lb/mi2/yr, pounds per square mile per year; kg/ha/yr, kilograms per hectare per year]
ID Site nameWater year
Flux, in
lb/d
Lower limit of the 95th
percent confidence
interval, in lb/yr
Upper limit of the 95th
percent confidence
interval, in lb/yr
Annual load,
in lb
Annual yields,
in lb/mi2/yr
Annual yields,
in kg/ha/
yr
Total nitrogen
011277905 Latimer Brook near I-95 N Exit 75 near Flanders, Conn.
2009 111.0 37,700 43,400 40,400 2,300 4.03
011277905 2010 131.0 43,500 52,800 48,000 2,720 4.76011277905 2011 88.3 30,100 34,500 32,200 1,830 3.20
011277914 Oil Mill Brook at Gurley Rd. near East Lyme, Conn.
2009 19.4 6,580 7,630 7,090 1,250 2.19
011277914 2010 21.7 7,150 8,760 7,920 1,400 2.45011277914 2011 17.2 5,840 6,719 6,270 1,100 1.93
011277916 Stony Brook at Rte. 1 near Flanders, Conn. 2009 9.6 3,220 3,780 3,490 1,880 3.29011277916 2010 13.0 4,250 5,320 4,760 2,560 4.48011277916 2011 8.0 2,720 3,170 2,940 1,580 2.77
Total load from tributaries 2009 51,0002010 60,7002011 41,400
Total ammonia plus organic nitrogen
011277905 Latimer Brook near I-95 N Exit 75 near Flanders, Conn.
2009 51.8 16,100 22,100 18,900 1,070 1.87
011277905 2010 71.9 21,400 31,800 26,200 1,490 2.61011277905 2011 43.2 13,600 18,200 15,800 896 1.57
011277914 Oil Mill Brook at Gurley Rd. near East Lyme, Conn.
2009 12.9 4,200 5,290 4,730 830 1.45
011277914 2010 15.2 4,670 6,540 5,540 980 1.72011277914 2011 10.5 3,500 4,220 3,850 680 1.19
011277916 Stony Brook at Rte. 1 near Flanders, Conn. 2009 7.7 2,530 3,100 2,800 1,510 2.64011277916 2010 10.5 3,220 4,510 3,830 2,060 3.61011277916 2011 6.4 2,110 2,560 2,330 1,250 2.19
Total load from tributaries 2009 26,4002010 35,6002011 22,000

22 Nutrient Concentrations and Loads and E. coli densities, Niantic River, Southeastern Connecticut, 2005 and 2008–2011
50EXPLANATION
Number of values
75th percentile
Largest value within 1.5 timesinterquartile range above75th percentile
25th percentile
Interquartilerange
x Outside value—Value is greaterthan 1.5 and less than 3 timesthe interquartile rangebeyond either end of the box
Far-out value—Value is equal orgreater than 3 times theinterquartile range beyondeither end of box
50th percentile(median)
Smallest value within 1.5 timesinterquartile range below25th percentile
xxxx
o
oo
o
xx
o
oo
o
o
o
011277905 011277914 0112779160.0
0.02
0.06
0.10
0.14
0.18
50 50 50
Total phosphorus
USGS streamgage
Conc
entra
tion,
in m
illig
ram
s pe
r lite
r
o
Figure 9. Distribution of total phosphorus concentrations in the Niantic River Basin in southeastern Connecticut from August 2008 through February 2012. Data shown are from U.S. Geological Survey (USGS) streamgages 011277905 at Latimer Brook, 011277914 at Oil Mill Brook, and 011277916 at Stony Brook.
recreation, respectively (table 7). A Kruskal-Wallis multiple comparison test determined that the distributions of E. coli densities were not significantly different among water-quality samples from the three tributaries (fig. 10).
Wet weather samples (stormflow) were separated from base flow samples for each station by using the base flow separation program PART (Rutledge, 1998) to classify samples as base flow versus storm runoff. Samples collected on days when at least 80 percent of the flow was base flow were considered to be dry weather samples, and samples from days when more than 20 percent of the flow was from stormwater runoff were classified as wet weather samples. Samples of each type (dry and wet) were plotted on cumulative probability plots for comparison of the E. coli distributions (fig. 11A–C). Wet weather samples at all three sites had a higher probability of exceeding Connecticut water-quality standards. The source of these elevated E. coli densities is likely stormwater runoff.
Summary and ConclusionsA study of the concentrations and loads of nitrogen and
phosphorus and the densities of Escherichia coli (E. coli) bacteria in the Niantic River Basin was conducted by the U.S. Geological Survey (USGS) in cooperation with the Connecticut Department of Energy and Environmental Protection in June 2005 and from 2008 through 2011. High
nitrogen loads from the Niantic River Basin have the potential to adversely affect eelgrass growth and survival in the Niantic River. Eelgrass is an important habitat for finfish and shellfish. In addition, several downstream reaches of streams in the Niantic River Basin are impaired because of E. coli densities that exceed State of Connecticut water-quality standards.
Land use in the Niantic River Basin is dominated by forested land; about 21 percent of the land in the watershed has been developed for residential, commercial, or agricultural uses. The surficial geology of the basin is dominated by glacial till deposits. Glacial stratified deposits are present in about 17 percent of the watershed and are an important source of base flow to Niantic River tributaries and the Niantic River.
Water-quality sampling was conducted in subbasins of the watershed at 11 locations in June 2005 as part of a base flow water-quality survey to determine the distribution of nutrient loads from groundwater to Niantic River tributaries. Samples were analyzed for nitrogen and phosphorus constituents and nitrogen and oxygen isotopes of nitrate in order to identify potential sources of nitrogen.
Concentrations of total nitrogen during this base flow survey ranged from 0.09 to 2.4 milligrams per liter (mg/L). Values of δ15N and δ18O in nitrate ranged from 3.92 to 9.43 per mil and 0.74 to 4.10 per mil, respectively. The combinations indicated that the sources of nitrate in most samples are fertilizer or soil nitrate, sewage or animal waste, or a mixture of two or more sources. Instantaneous loads of total nitrogen ranged from 0.04 to 62.1 pounds per day (lb/d),
Summary and Conclusions 23
Table 9. Loads and yields of total and dissolved phosphorus for three U.S. Geological Survey streamgages in the Niantic River Basin in southeastern Connecticut from October 2008 through September 2011.
[ID, U.S. Geological Survey site identification number; lb/d, pounds per day; lb/yr, pounds per year; lb, pounds; lb/mi2/yr, pounds per square mile per year; kg/ha/yr, kilograms per hectare per year]
ID Site nameWater year
Flux, in lb/d
Lower limit of the 95th
percent confidence
interval, in lb/yr
Upper limit of the 95th
percent confidence
interval, in lb/yr
Annual load, in lb
Annual yields, in lb/mi2/yr
Annual yields, in kg/ha/yr
Total phosphorus
011277905 Latimer Brook near I-95 N Exit 75 near Flanders, Conn.
2009 3.9 1,100 1,810 1,420 81 0.14
011277905 2010 7.3 1,790 3,780 2,650 151 0.26011277905 2011 3.5 1,020 1,580 1,280 73 0.13
011277914 Oil Mill Brook at Gurley Rd. near East Lyme, Conn.
2009 0.8 220 416 307 54 0.09
011277914 2010 1.5 282 941 540 95 0.17011277914 2011 0.8 224 380 295 52 0.09
011277916 Stony Brook at Rte. 1 near Flanders, Conn. 2009 0.5 152 234 190 102 0.18011277916 2010 0.9 237 486 345 185 0.32011277916 2011 0.5 159 238 196 105 0.18
Total load from tributaries 2009 1,9202010 3,5402011 1,770
Dissolved phosphorus
011277905 Latimer Brook near I-95 N Exit 75 near Flanders, Conn.
2009 1.7 546 702 620 35 0.06
011277905 2010 1.9 577 849 703 40 0.07011277905 2011 1.4 436 559 495 28 0.05
011277914 Oil Mill Brook at Gurley Rd. near East Lyme, Conn.
2009 0.4 136 171 153 27 0.05
011277914 2010 0.4 131 175 152 27 0.05011277914 2011 0.3 114 139 126 22 0.04
011277916 Stony Brook at Rte. 1 near Flanders, Conn. 2009 0.3 87 115 100 54 0.09011277916 2010 0.3 83 115 98 53 0.09011277916 2011 0.2 77 102 89 48 0.08
Total load from tributaries 2009 8702010 9502011 710

24 Nutrient Concentrations and Loads and E. coli densities, Niantic River, Southeastern Connecticut, 2005 and 2008–2011
51EXPLANATION Number of values
75th percentile
Largest value within 1.5 timesinterquartile range above75th percentile
25th percentile
Interquartilerange
x Outside value—Value is greaterthan 1.5 and less than 3 timesthe interquartile rangebeyond either end of the box
Far-out value—Value is equal orgreater than 3 times theinterquartile range beyondeither end of box
50th percentile(median)
Smallest value within 1.5 timesinterquartile range below25th percentile
o
x
oo
o
o
o
xxx
o
o
o
o
oxxx
oo
o
o
011277905 011277914 0112779160
500
1,000
1,500
2,000
2,500
3,000
3,50051 51 51
USGS streamgage
Escherichia coli
Colo
ny fo
rmin
g un
its p
er 1
00 m
illili
ters
Figure 10. Distribution of Escherichia coli densities in the Niantic River Basin in southeastern Connecticut from August 2008 through February 2012. Data shown are from U.S. Geological Survey (USGS) streamgages 011277905 at Latimer Brook, 011277914 at Oil Mill Brook, and 011277916 at Stony Brook.
with the largest load from the farthest downstream site on Latimer Brook. Nitrogen yields from basin segments were calculated as the difference between downstream and upstream sites divided by the difference in drainage area. Instantaneous total nitrogen yields ranged from 0.02 to 11.2 pounds per square mile per day (lb/mi2/d; less than 0.01 to 7.2 kilograms per hectare per year (kg/ha/yr)). The largest instantaneous yields were measured on the farthest downstream reach of Latimer Brook (between two monitoring stations) and from a small unnamed tributary of the Niantic River that discharges on the southeastern side of the river. The yields measured were generally positively correlated with the percentage of developed land in the drainage area to each reach.
Instantaneous total phosphorus concentrations measured during the base flow survey were generally low, ranging from less than 0.006 to 0.040 mg/L; instantaneous total phosphorus loads ranged from less than 0.010 to 1.20 lb/d.
Beginning in August 2008, streamgages were installed at the downstream end of the three major tributaries of the Niantic River—Latimer Brook, Oil Mill Brook, and Stony Brook. Samples analyzed for nitrogen and phosphorus constituents and for E. coli bacteria collected monthly (with additional stormflow samples) from August 2008 to February 2012 were used in the analysis in this report.
The total mean daily flow from all three Niantic River tributaries measured at the streamgages ranged from 25.9 to 37.8 million gallons per day (Mgal/d). The runoff from the Stony Brook site was greater than that from Oil Mill Brook and Latimer Brook likely due to diversions of water
for public water supply from the headwaters of these basins. The difference in runoff (converted to streamflow) between Stony Brook and Oil Mill Brook and Latimer Brook combined is equivalent to 7.8 to 10.9 Mgal/d, which is more than the estimated water diversions from the Oil Mill Brook and Latimer Brook Basins. Withdrawal of water from the Niantic River Basin may affect the cycling and delivery of nutrients to the estuary.
Total nitrogen concentrations were generally low at all three tributary monitoring stations, with mean values below the 0.71-mg/L U.S. Environmental Protection Agency (USEPA) recommended nitrogen criterion. Samples from Latimer Brook had higher concentrations of total nitrogen than Oil Mill Brook and Stony Brook, but all concentrations measured were at or less than 1 mg/L. Total ammonia plus organic nitrogen was more than 50 percent of the total nitrogen in samples from Oil Mill Brook and Stony Brook. Organic nitrogen was the dominant species in total ammonia plus organic nitrogen analyses of samples from all three tributaries.
Total nitrogen loads for water years 2009 through 2011 ranged from 41,400 to 60,700 lb combined for all three Niantic River tributaries, with the largest loads during water year 2010. The largest loads were from Latimer Brook and represented 78 to 80 percent of the total nitrogen load from the three tributaries. Loads of total ammonia plus organic nitrogen ranged from 22,000 to 35,600 lb and represented 52 to 60 percent of the total nitrogen load from the three tributaries. The total nitrogen load from Stony Brook was dominated by

Selected References 25
1 50 100 500 1,0000
0.2
0.4
0.6
0.8
1.0
Cum
ulat
ive
prob
abili
ty
A. Latimer Brook
Escherichia coli, in colony forming units per 100 milliliters
Dry weather, 28 samplesWet weather, 16 samplesEXPLANATION
105
Dry weather, 31 samplesWet weather, 13 samplesEXPLANATION
0.0
0.2
0.4
0.6
0.8
1.0
Cum
ulat
ive
prob
abili
ty
Escherichia coli, in colony forming units per 100 milliliters
B. Oil Mill Brook
1 50 100 500 1,000105
Dry weather, 29 samplesWet weather, 15 samplesEXPLANATION
1 50 100 500 1,0001050.0
0.2
0.4
0.6
0.8
1.0
Cum
ulat
ive
prob
abili
ty
Escherichia coli, in colony forming units per 100 milliliters
C. Stony Brook
Figure 11. Cumulative probability plots of Escherichia coli densities for dry and wet weather samples from October 2008 through September 2011. Data from U.S. Geological Survey (USGS) streamgages A, 011277905 at Latimer Brook, B, 011277914 at Oil Mill Brook, and C, 011277916 at Stony Brook are shown.
total ammonia plus organic nitrogen. Total nitrogen yields ranged from 1,100 lb/mi2/yr at Oil Mill Brook in water year 2011 to 2,720 lb/mi2/yr at Latimer Brook in water year 2010. Total nitrogen yields were generally within the range for other forested basins in New England; Latimer Brook had the highest yields.
Total phosphorus concentrations ranged from less than 0.004 to 0.15 mg/L, and mean concentrations from all three stations were less than the mg/L USEPA recommended nutrient criterion for ecoregion XIV. Total phosphorus loads from the three stations totaled 1,770 to 3,540 pounds per year (lb/yr), with yields ranging from 53 to 187 lb/mi2/yr.
The geometric means of E. coli densities in samples from the three Niantic River tributaries were less than State of Connecticut water-quality standards. Single samples from all three stations had densities that exceeded the single-sample maximum values for the State’s water-quality standards. An analysis of E. coli densities by sample type (wet weather versus base flow) indicated that wet weather (stormflow) samples were more likely to exceed the State’s water-quality standards.
Selected References
Cohn, T.A., 1988, Adjusted maximum likelihood estimation of the moments of lognormal populations from type I censored samples: U.S. Geological Survey Open-File Report 88–350, 34 p.
Cohn, T.A., Gilroy, E.J., and Baier, W.G., 1992, Estimating fluvial transport of trace constituents using a regression model with data subject to censoring, in Proceedings of the Section on Statistics and the Environment, joint statistical meeting, Boston, August 9–13, 1992: Alexandria, Virginia, American Statistical Association, p. 142–151.
Connecticut Department of Environmental Protection, 2006, Niantic River watershed protection plan: Connecticut Department of Environmental Protection, 180 p., 7 appendixes, accessed at http://www.ct.gov/dep/cwp/ view.asp?A=2719&Q=379296#nianticriver.

26 Nutrient Concentrations and Loads and E. coli densities, Niantic River, Southeastern Connecticut, 2005 and 2008–2011
Connecticut Department of Environmental Protection, 2011a, State of Connecticut integrated water quality report: Hartford, Conn., Connecticut Department of Environmental Protection, 403 p., accessed May 24, 2012, at http://www.ct.gov/dep/lib/dep/water/water_quality_management/305b/ctiwqr10final.pdf.
Connecticut Department of Environmental Protection, 2011b, Water quality standards: Hartford, Conn., Connecticut Department of Environmental Protection, 65 p., at http://www.ct.gov/dep/lib/dep/water/water_quality_standards/wqs_final_adopted_2_25_11.pdf.
Connecticut Department of Public Health and Connecticut Department of Environmental Protection, 2003, Quality assurance project plan for the beach monitoring and notification program for Connecticut Coastal Beaches: Connecticut Department of Public Health and Connecticut Department of Environmental Protection, 23 p., 4 appendixes. [Revised plan available at http://www.ct.gov/dep/lib/dep/water/beach_monitoring/beach_qapp_11.pdf.]
Coplen, T.B., Bӧhlke, J.K., and Casciotti, K.L., 2004, Using dual-bacterial denitrification to improve δ15N determinations of nitrates containing mass-independent 17O: Rapid Communications in Mass Spectrometry, v. 18, p. 245–250.
Fishman, M.J., ed., 1993, Methods of analysis by the U.S. Geological Survey National Water Quality Laboratory—Determination of inorganic and organic constituents in water and fluvial sediments: U.S. Geological Survey Open-File Report 93–125, 217 p.
Ging, P.B., Lee, R.W., and Silva, S.R., 1996, Water chemistry of Shoal Creek and Waller Creek, Austin, Texas and potential sources of nitrate: U.S. Geological Survey Water-Resources Investigations Report 96–4167, 24 p.
Kendall, Carol, 1998, Tracing nitrogen sources and cycling in catchments, chap. 16 of Kendall, Carol, and McDonnell, J.J., eds, Isotope tracers in catchment hydrology: Amsterdam, Elsevier Science B.V., p. 519–576.
Marshall, Nelson, 1994, The scallop estuary—The natural features of the Niantic River: St. Michaels, Maryland, Th’Anchorage Publisher, 152 p.
Patton, C.J., and Kryskalla, J.R., 2011, Colorimetric determination of nitrate plus nitrite in water by enzymatic reduction, automated discrete analyzer methods: U.S. Geological Survey Techniques and Methods, book 5, chap. B8, 34 p., at http://pubs.usgs.gov/tm/05b08/.
Patton, C.J., and Truitt, E.P., 2000, Methods of analysis by the U.S. Geological Survey National Water Quality Laboratory—Determination of ammonium plus organic nitrogen by a Kjeldahl digestion method and an automated photometric finish that includes digest cleanup by gas diffusion: U.S. Geological Survey Open-File Report 00–170, 31 p.
Rantz, S.E., and others, 1982a, Measurement of stage and discharge, v. 1 of Measurement and computation of streamflow: U.S. Geological Survey Water-Supply Paper 2175, p. 1–284.
Rantz, S.E., and others, 1982b, Computation of discharge, v. 2 of Measurement and computation of streamflow: U.S. Geological Survey Water-Supply Paper 2175, p. 285–631.
Runkel, R.L., Crawford, C.G., Cohn, T.A., 2004, Load estimator (LOADEST)—A Fortran program for estimating constituent loads in streams and rivers: U.S. Geological Survey Techniques and Methods book 4, chap. A5, 69 p., at http://pubs.usgs.gov/tm/2005/tm4A5/.
Rutledge, A.T., 1998, Computer programs for describing the recession of ground-water discharge and for estimating mean ground-water recharge and discharge from streamflow records—Update: U.S. Geological Survey Water-Resources Investigations Report 98–4148, 43 p. [Supersedes U.S. Geological Survey Water-Resources Investigations Report 93–4121.]
Sauer, V.B., and Turnipseed, D.P., 2010, Stage measurement at gaging stations: U.S. Geological Survey Techniques and Methods book 3, chap. A7, 45 p.
Southeastern Connecticut Regional Water Authority, 2012, Supplemental report to the June 2003 southeastern Connecticut regional water supply plan: Southeastern Connecticut Regional Water Authority, 19 p.
Stone, J.R., Schafer, J.P., London, E.H., and Thompson, W.B., 1992, Surficial materials map of Connecticut: U.S. Geological Special Map, scale 1:125,000, 2 sheets.
Thomas, M.P., 1966, Effect of glacial geology upon the time distribution of streamflow in eastern and southern Connecticut, in Geological Survey research 1966: U.S. Geological Survey Professional Paper 550–B, p. B209–B212.
Trench, E.C.T., 2000, Nutrient sources and loads in the Connecticut, Housatonic, and Thames River Basins: U.S. Geological Survey Water-Resources Investigations Report 99-4236, 66 p.

Selected References 27
Turnipseed, D.P., and Sauer, V.B., 2010, Discharge measurements at gaging stations: U.S. Geological Survey Techniques and Methods book 3, chap. A8, 87 p.
U.S. Census Bureau, 2012, Census block shapefiles with 2010 census population and housing unit counts Web site, accessed November 13, 2012, at http://www.census.gov/geo/www/tiger/tgrshp2010/pophu.html.
U.S. Environmental Protection Agency, State of Connecticut, State of New York, Interstate Sanitation Commission, and National Oceanic and Atmospheric Administration, 1985, Long Island Sound estuarine study, water quality management strategy: 10 p.
U.S. Environmental Protection Agency, 1993, Determination of phosphorus by semi-automated colorimetry (revision 2.0), method 365.1 of Methods for the determination of inorganic substances in environmental samples: U.S. Environmental Protection Agency EPA/600/R–93/100, p. 365.1–1—365.1–17.
U.S. Environmental Protection Agency, 2000, Ambient water quality criteria recommendations—Information supporting the development of state and tribal nutrient criteria; rivers and streams in nutrient ecoregion XIV: U.S. Environmental Protection Agency EPA 822–B–00–022, 84 p.
University of Connecticut, 2009, 2006 land use land cover dataset: University of Connecticut, Center for Land Use Education and Research, Connecticut’s Changing Landscape Web site, accessed November 27, 2012 at http://clear.uconn.edu/projects/landscape/download.asp.
Vaudrey, J.P., 2008, Establishing restoration objectives for eelgrass in Long Island Sound; Part II—Case studies: Groton, Conn., University of Connecticut FRS#542190, 59 p.
Wilde F.D., and Radtke, D.B., 1998, Field measurements: U.S. Geological Survey Techniques of Water-Resources Investigations, book 9, chap. A6, [variously paged].
Wilde, F.D., Radtke, D.B., Gibs, Jacob, and Iwatsubo, R.T., 1998a, Cleaning of equipment for water sampling: U.S. Geological Survey Techniques of Water-Resources Investigations, book 9, chap. A3, [variously paged].
Wilde, F.D., Radtke, D.B., Gibs, Jacob, and Iwatsubo, R.T., 1998b, Preparations for water sampling: U.S. Geological Survey Techniques of Water-Resources Investigations, book 9, chap. A1, [variously paged].
Wilde, F.D., Radtke, D.B., Gibs, Jacob, and Iwatsubo, R.T., 1998c, Selection of equipment for water sampling: U.S. Geological Survey Techniques of Water-Resources Investigations, book 9, chap. A2, [variously paged].
Wilde, F.D., Radtke, D.B., Gibs, Jacob, and Iwatsubo, R.T., 1999a, Collection of water samples: U.S. Geological Survey Techniques of Water- Resources Investigations, book 9, chap. A4, [variously paged].
Wilde, F.D., Radtke, D.B., Gibs, Jacob, and Iwatsubo, R.T., 1999b, Processing of water samples: U.S. Geological Survey Techniques of Water-Resources Investigations, book 9, chap. A5, [variously paged].

This page has been left blank intentionally.

Prepared by the Pembroke Publishing Service Center.
For more information concerning this report, contact:
Office ChiefU.S. Geological SurveyNew England Water Science Center Connecticut Water Science Office101 Pitkin StreetEast Hartford, CT [email protected]
or visit our Web site at:http://ct.water.usgs.gov

Mullaney—
Nutrient Concentrations and Loads and E. coli densities, N
iantic River, Southeastern Connecticut, 2005 and 2008–2011—Scientific Investigations Report 2013–5008