Embed Size (px)
Citation preview
Nutrient Management Research
Conducted by Market Directions
for the
Conservation Technology Information Center
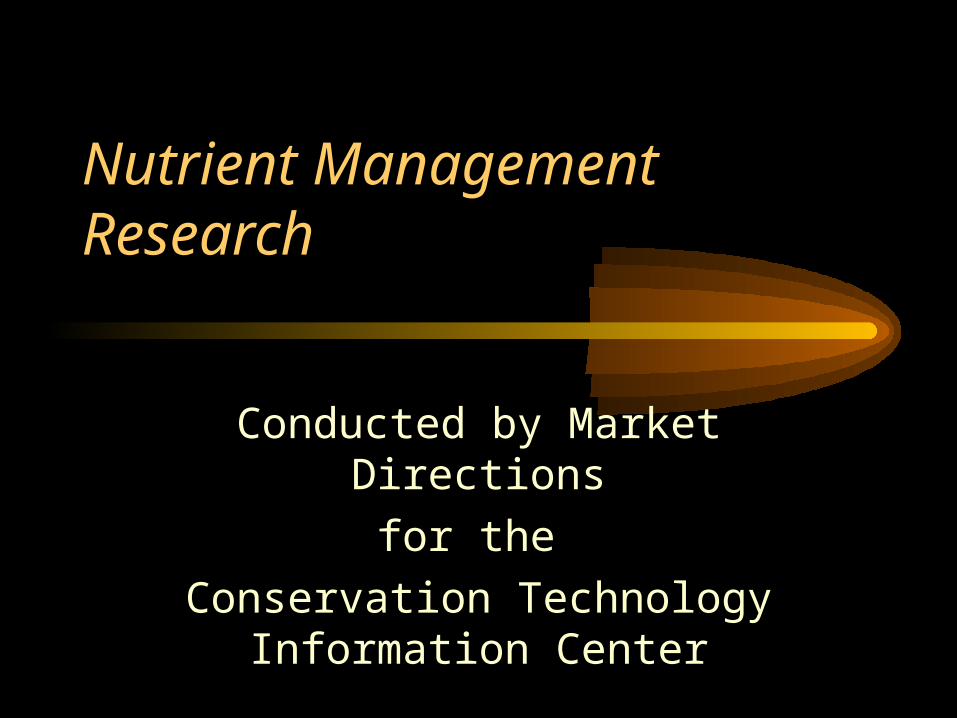
Crop Nutrient Management Goal
Increase the adoption of crop nutrientmanagement practices
1999 2000 2001 2002
Establish a baseline
Set the goal
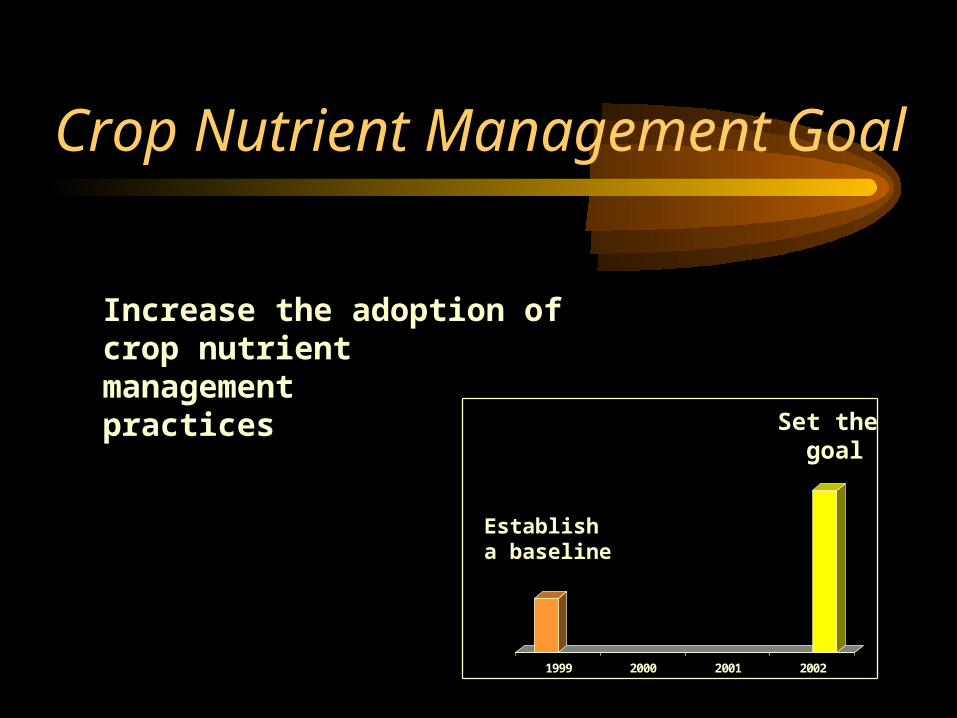
Grower Focus Groups
• Focus groups– Davenport, IA– Greenville, MS– Lubbock, TX– Goodland, KS
• One-on-one interviews– Washington, Arkansas, Penn., S. Carolina,
Maryland, Indiana
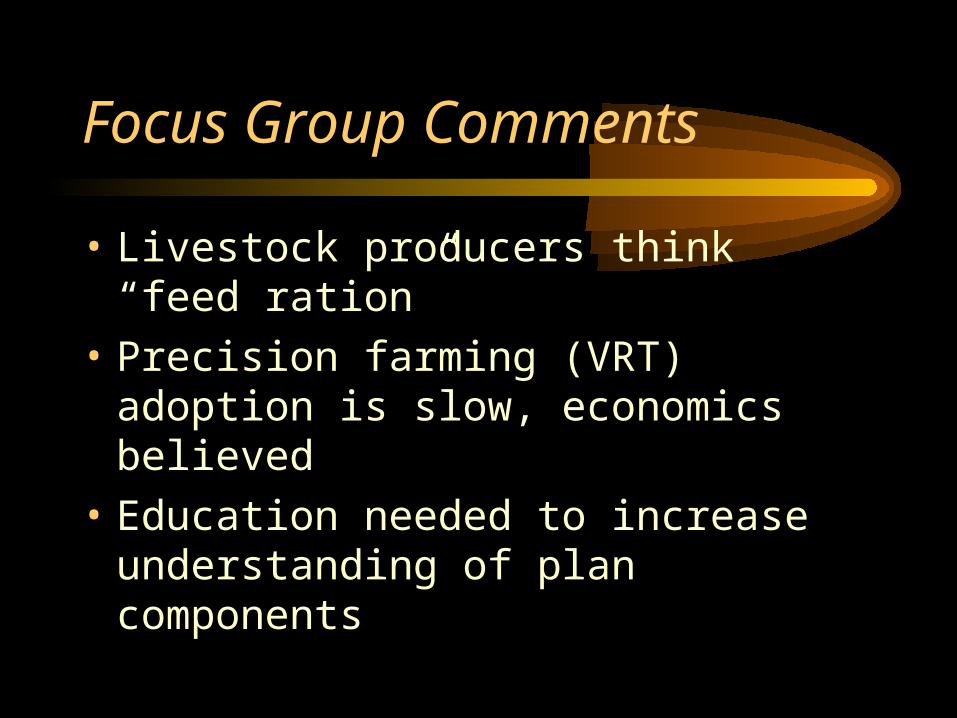
Focus Group Comments
• Livestock producers think “feed ration”
• Precision farming (VRT) adoption is slow, economics believed
• Education needed to increase understanding of plan components
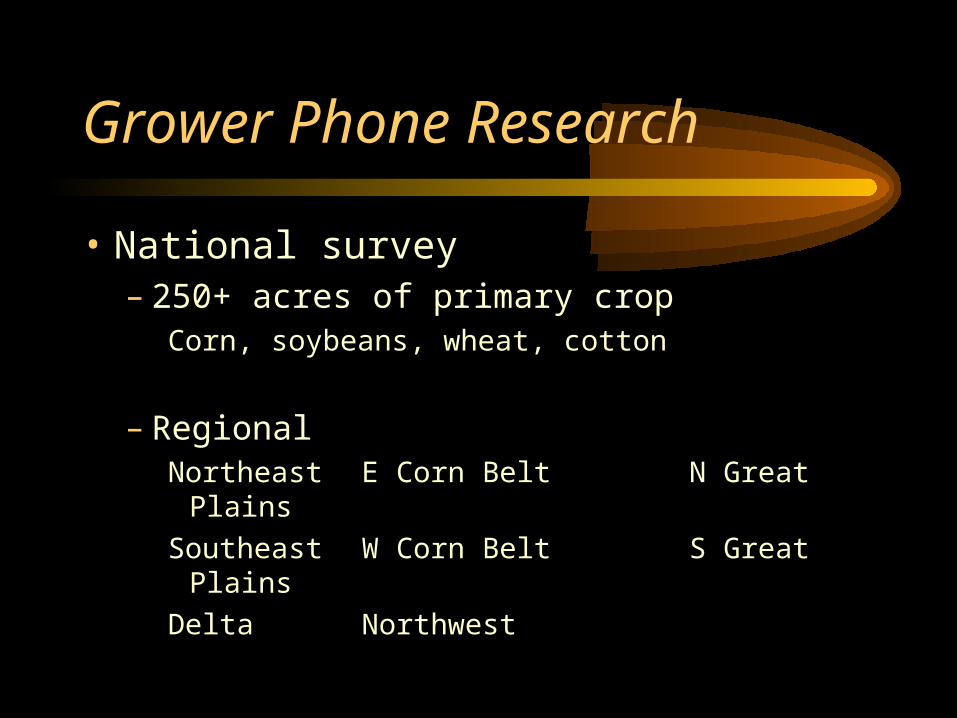
Grower Phone Research
• National survey – 250+ acres of primary crop
Corn, soybeans, wheat, cotton
– Regional Northeast E Corn Belt N Great Plains
Southeast W Corn Belt S Great Plains
Delta Northwest
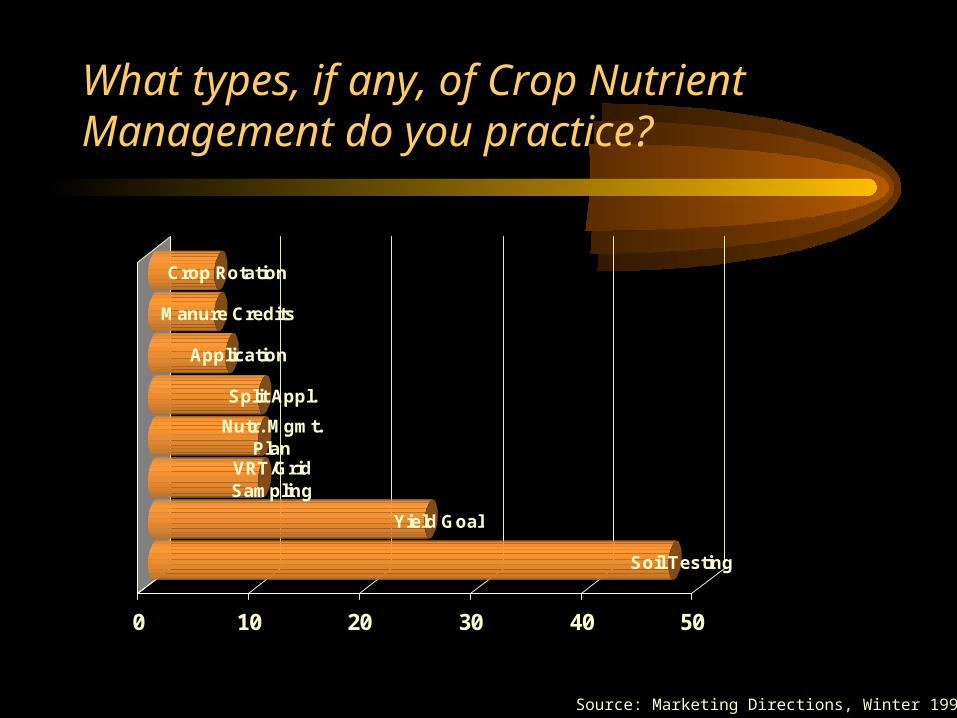
What types, if any, of Crop Nutrient Management do you practice?
Soil Testing
Yield Goal
VRT/Grid Sampling
Nutr. Mgmt. Plan
Split Appl.
Application
Manure Credits
Crop Rotation
0 10 20 30 40 50
Source: Marketing Directions, Winter 1997-98
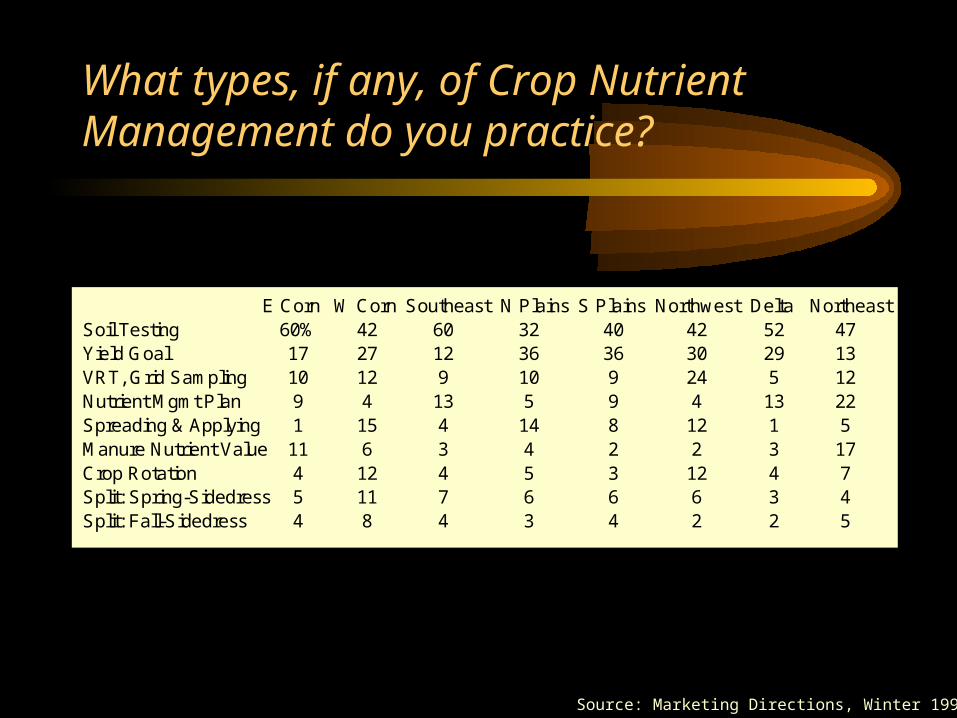
What types, if any, of Crop Nutrient Management do you practice?
Source: Marketing Directions, Winter 1997-98
E Corn W Corn Southeast N Plains S Plains Northwest Delta Northeast Soil Testing 60% 42 60 32 40 42 52 47 Yield Goal 17 27 12 36 36 30 29 13 VRT, Grid Sampling 10 12 9 10 9 24 5 12 Nutrient Mgmt Plan 9 4 13 5 9 4 13 22 Spreading & Applying 1 15 4 14 8 12 1 5 Manure Nutrient Value 11 6 3 4 2 2 3 17 Crop Rotation 4 12 4 5 3 12 4 7 Split: Spring-Sidedress 5 11 7 6 6 6 3 4 Split: Fall-Sidedress 4 8 4 3 4 2 2 5
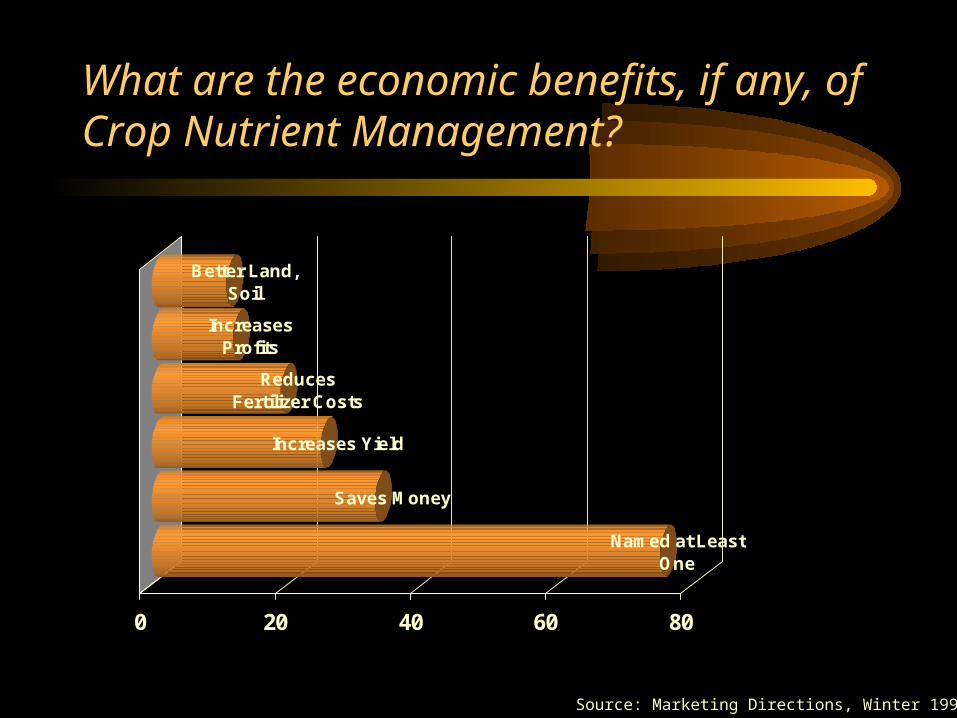
What are the economic benefits, if any, of Crop Nutrient Management?
Named at Least One
Saves Money
Increases Yield
Reduces Fertilizer Costs
Increases Profits
Better Land, Soil
0 20 40 60 80
Source: Marketing Directions, Winter 1997-98
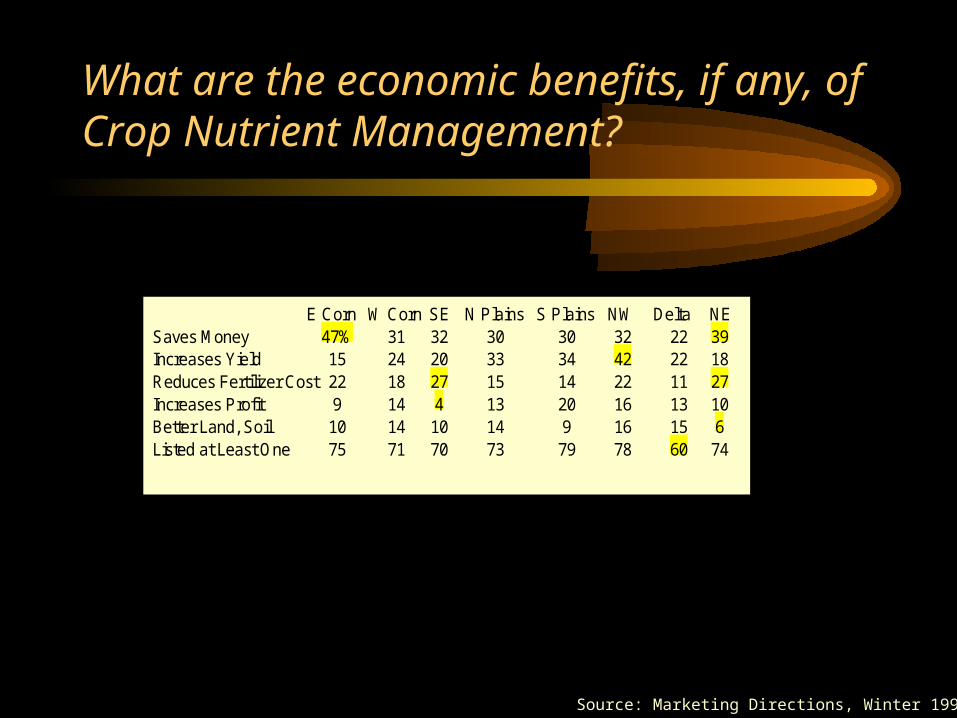
What are the economic benefits, if any, of Crop Nutrient Management?
Source: Marketing Directions, Winter 1997-98
E Corn W Corn SE N Plains S Plains NW Delta NE Saves Money 47% 31 32 30 30 32 22 39 Increases Yield 15 24 20 33 34 42 22 18 Reduces Fertilizer Cost 22 18 27 15 14 22 11 27 Increases Profit 9 14 4 13 20 16 13 10 Better Land, Soil 10 14 10 14 9 16 15 6 Listed at Least One 75 71 70 73 79 78 60 74
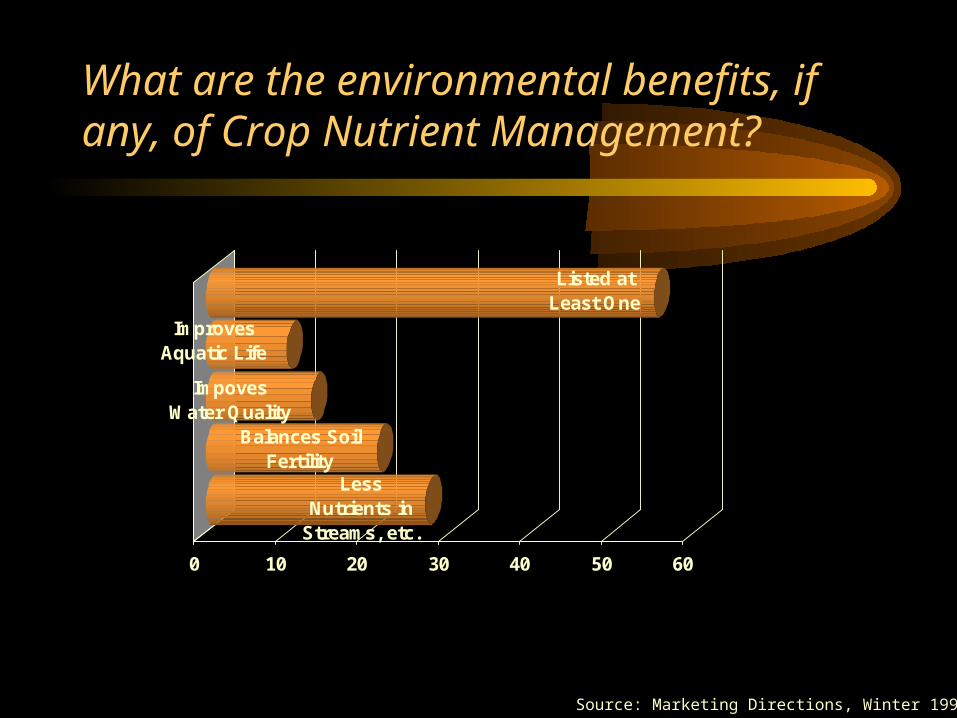
What are the environmental benefits, if any, of Crop Nutrient Management?
Less Nutrients in
Streams, etc.
Balances Soil Fertility
Impoves Water Quality
Improves Aquatic Life
Listed at Least One
0 10 20 30 40 50 60
Source: Marketing Directions, Winter 1997-98
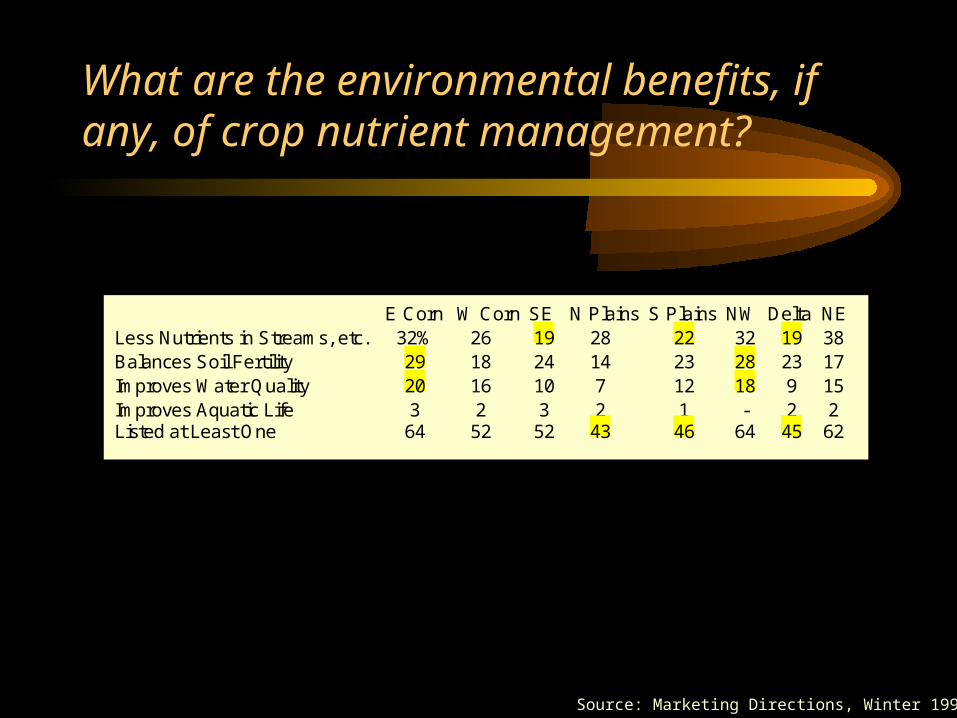
What are the environmental benefits, if any, of crop nutrient management?
Source: Marketing Directions, Winter 1997-98
E Corn W Corn SE N Plains S Plains NW Delta NE Less Nutrients in Streams, etc. 32% 26 19 28 22 32 19 38 Balances Soil Fertility 29 18 24 14 23 28 23 17 Improves Water Quality 20 16 10 7 12 18 9 15 Improves Aquatic Life 3 2 3 2 1 - 2 2 Listed at Least One 64 52 52 43 46 64 45 62
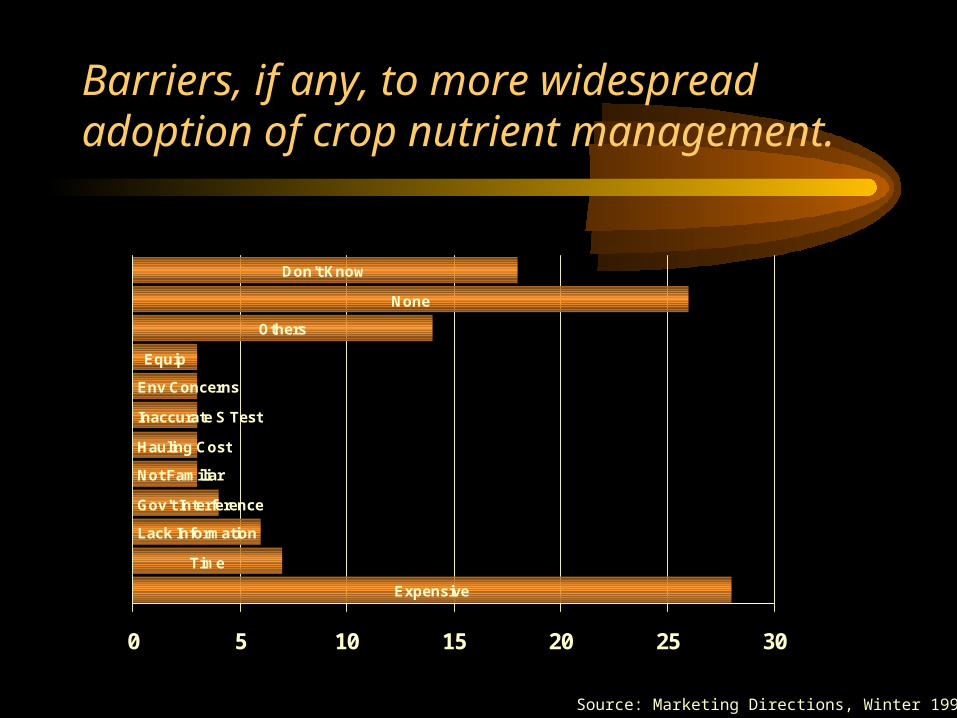
Barriers, if any, to more widespread adoption of crop nutrient management.
Expensive
Time
Lack Information
Gov't Interference
Not Familiar
Env Concerns
Others
None
Don't Know
Equip
Hauling Cost
Inaccurate S Test
0 5 10 15 20 25 30
Source: Marketing Directions, Winter 1997-98
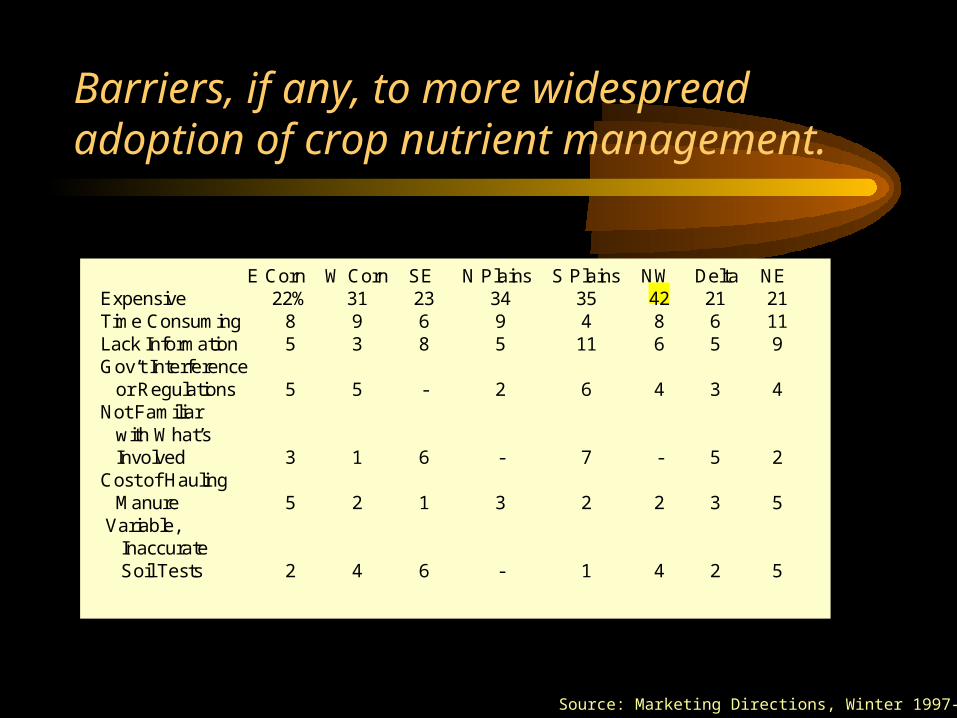
Barriers, if any, to more widespread adoption of crop nutrient management.
Source: Marketing Directions, Winter 1997-98
E Corn W Corn SE N Plains S Plains NW Delta NE Expensive 22% 31 23 34 35 42 21 21 Time Consuming 8 9 6 9 4 8 6 11 Lack Information 5 3 8 5 11 6 5 9 Gov’t Interference or Regulations 5 5 - 2 6 4 3 4 Not Familiar with What’s Involved 3 1 6 - 7 - 5 2 Cost of Hauling Manure 5 2 1 3 2 2 3 5 Variable, Inaccurate Soil Tests 2 4 6 - 1 4 2 5
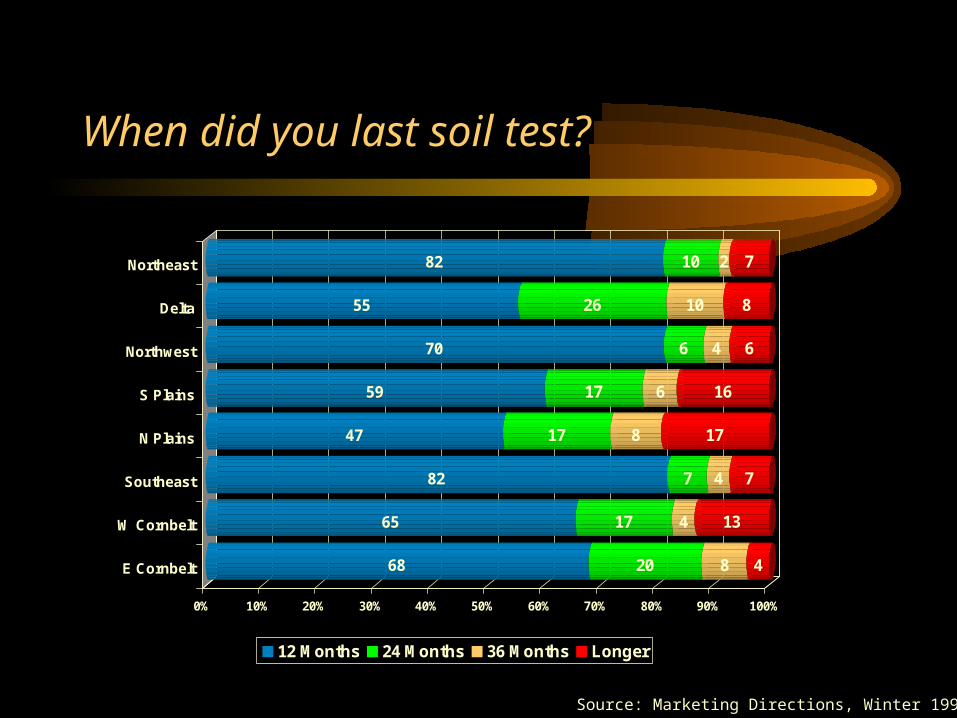
When did you last soil test?
Source: Marketing Directions, Winter 1997-98
68 20 8 4
65 17 4 13
82 7 4 7
47 17 8 17
59 17 6 16
70 6 4 6
55 26 10 8
82 10 2 7
0% 10% 20% 30% 40% 50% 60% 70% 80% 90% 100%
E Cornbelt
W Cornbelt
Southeast
N Plains
S Plains
Northwest
Delta
Northeast
12 Months 24 Months 36 Months Longer
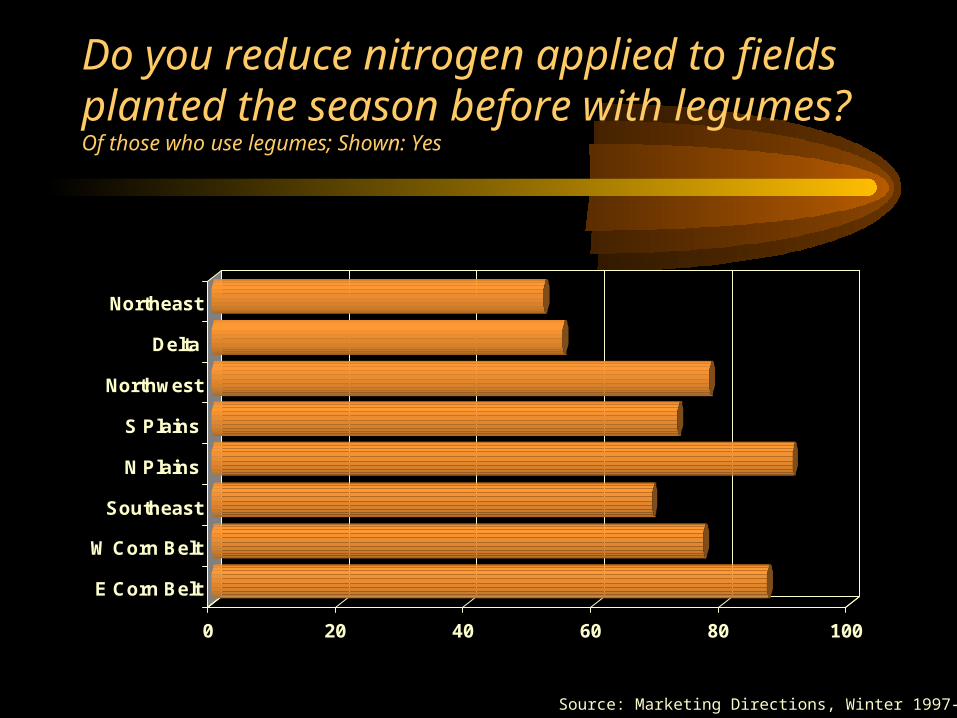
Do you reduce nitrogen applied to fields planted the season before with legumes?Of those who use legumes; Shown: Yes
Source: Marketing Directions, Winter 1997-98
0 20 40 60 80 100
E Corn Belt
W Corn Belt
Southeast
N Plains
S Plains
Northwest
Delta
Northeast
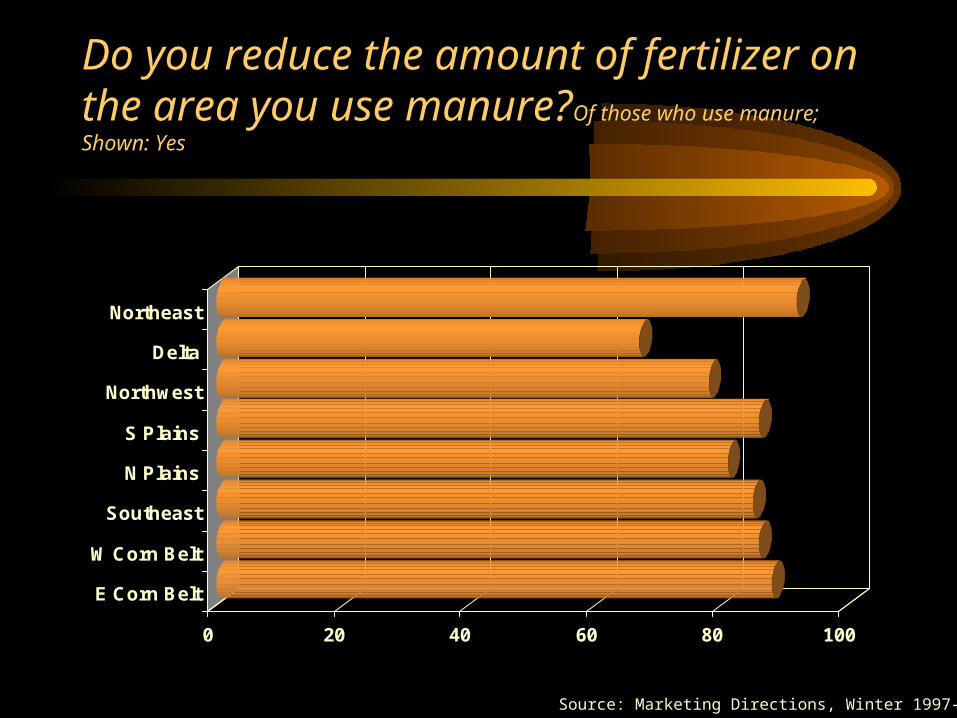
Do you reduce the amount of fertilizer on the area you use manure?Of those who use manure; Shown: Yes
Source: Marketing Directions, Winter 1997-98
0 20 40 60 80 100
E Corn Belt
W Corn Belt
Southeast
N Plains
S Plains
Northwest
Delta
Northeast
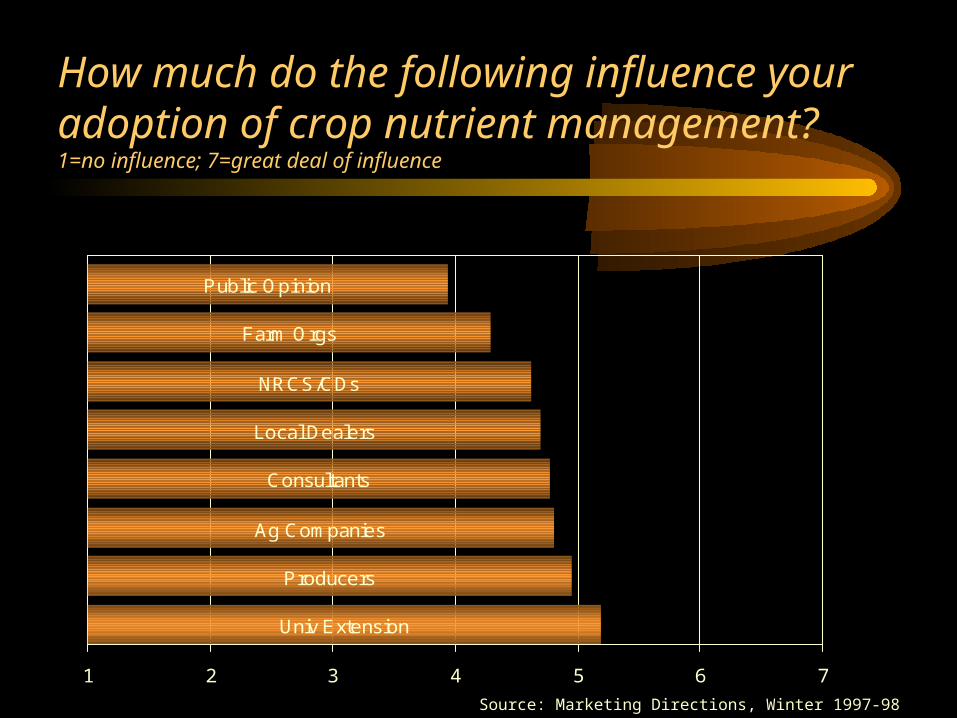
Univ Extension
Producers
Ag Companies
Consultants
Local Dealers
NRCS/CDs
Farm Orgs
Public Opinion
1 2 3 4 5 6 7
Source: Marketing Directions, Winter 1997-98
How much do the following influence your adoption of crop nutrient management?1=no influence; 7=great deal of influence
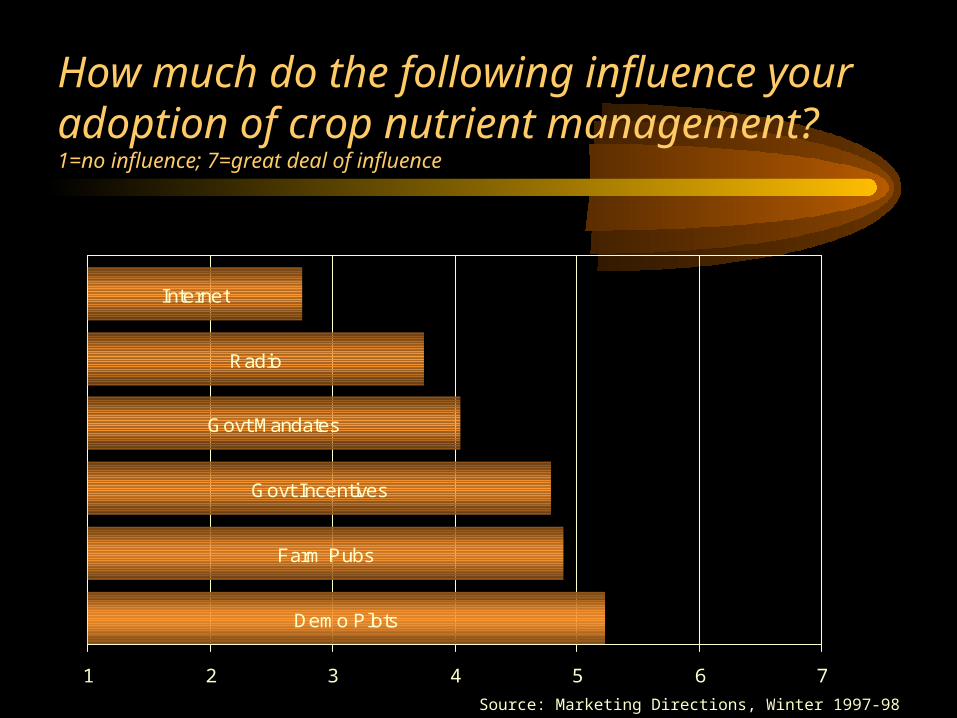
Demo Plots
Farm Pubs
Govt Incentives
Govt Mandates
Radio
Internet
1 2 3 4 5 6 7
Source: Marketing Directions, Winter 1997-98
How much do the following influence your adoption of crop nutrient management?1=no influence; 7=great deal of influence
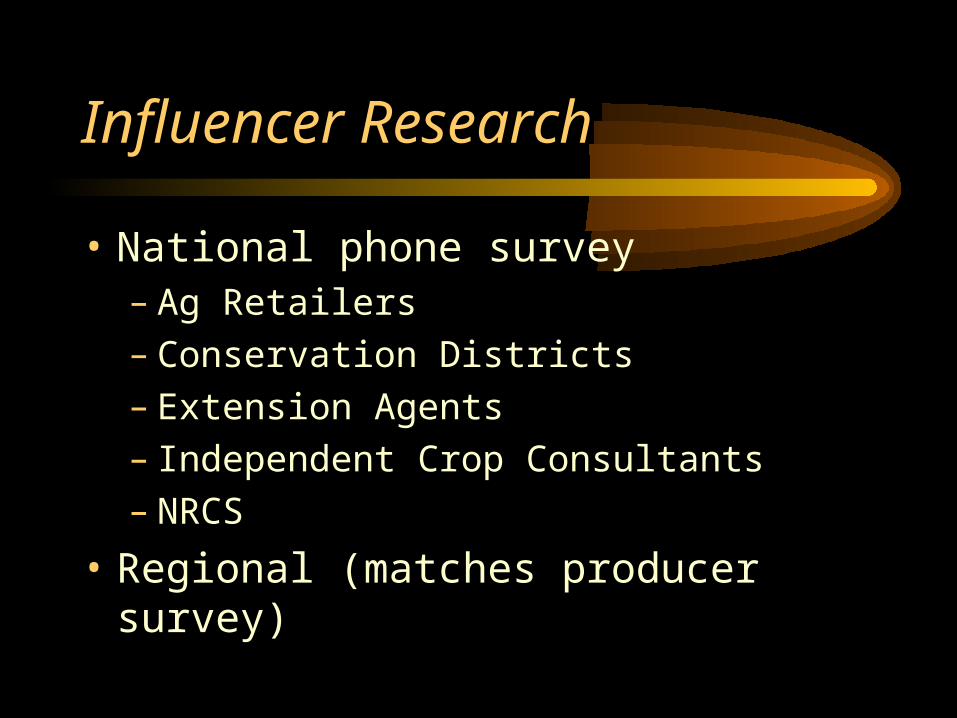
Influencer Research
• National phone survey – Ag Retailers– Conservation Districts– Extension Agents– Independent Crop Consultants– NRCS
• Regional (matches producer survey)
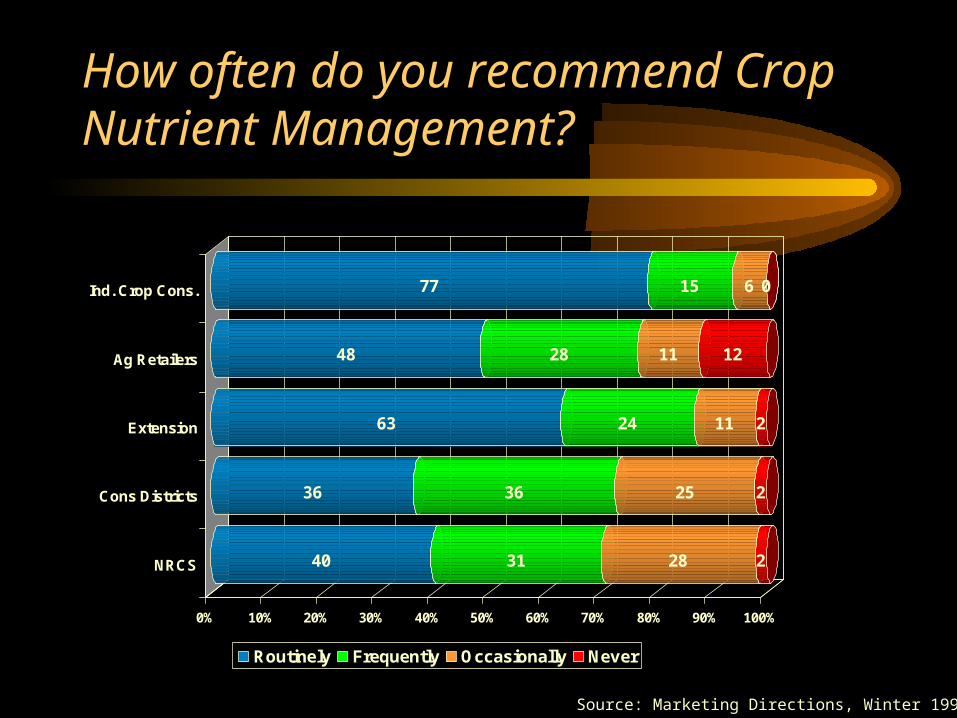
How often do you recommend Crop Nutrient Management?
Source: Marketing Directions, Winter 1997-98
40 31 28 2
36 36 25 2
63 24 11 2
48 28 11 12
77 15 6 0
0% 10% 20% 30% 40% 50% 60% 70% 80% 90% 100%
NRCS
Cons Districts
Extension
Ag Retailers
Ind. Crop Cons.
Routinely Frequently Occasionally Never
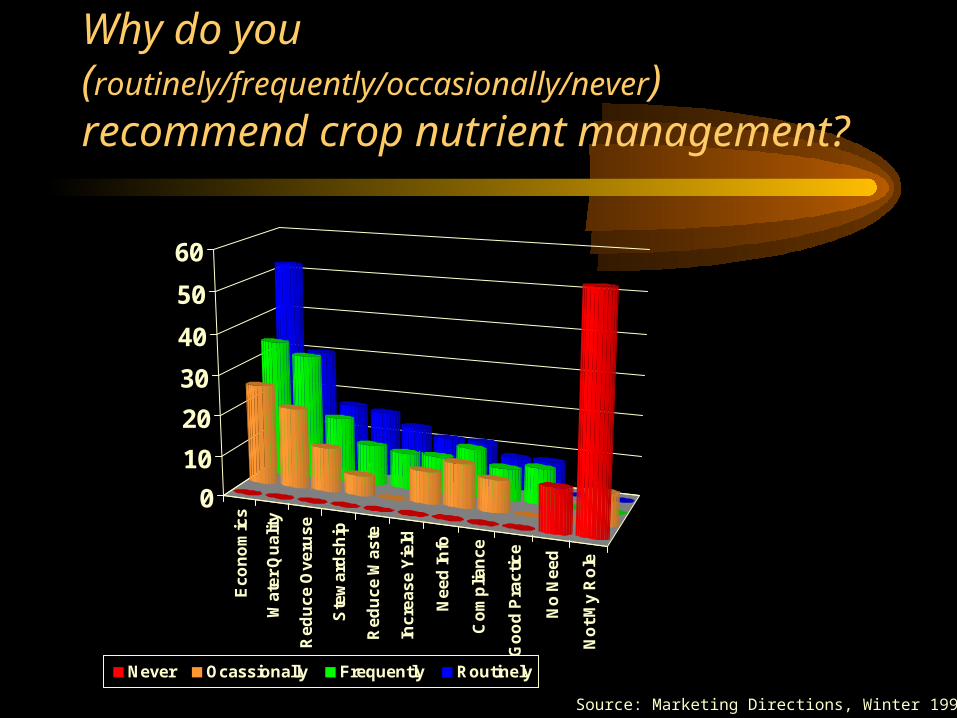
Why do you (routinely/frequently/occasionally/never) recommend crop nutrient management?
Ec
on
om
ics
Wa
ter
Qu
alit
y
Re
du
ce
Ov
eru
se
Ste
wa
rds
hip
Re
du
ce
Wa
ste
Inc
rea
se
Yie
ld
Ne
ed
Info
Co
mp
lian
ce
Go
od
Pra
cti
ce
No
Ne
ed
No
t M
y R
ole
0
10
20
30
40
50
60
Never Ocassionally Frequently Routinely
Source: Marketing Directions, Winter 1997-98
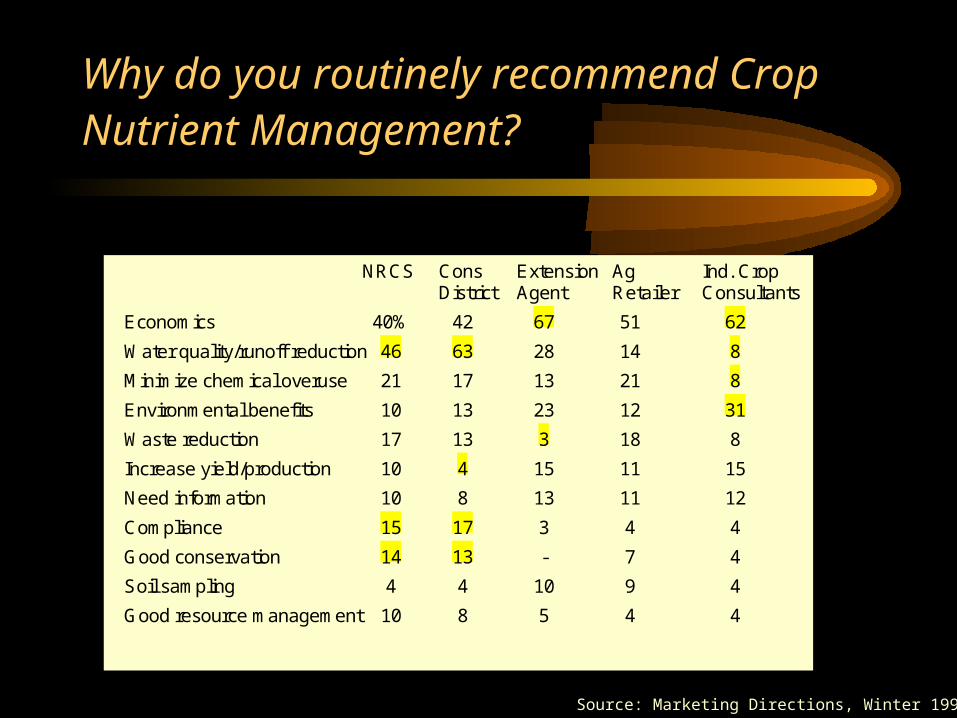
Why do you routinely recommend Crop Nutrient Management?
Source: Marketing Directions, Winter 1997-98
NRCS Cons Extension Ag Ind. CropDistrict Agent Retailer Consultants
Economics 40% 42 67 51 62
Water quality/runoff reduction 46 63 28 14 8
Minimize chemical overuse 21 17 13 21 8
Environmental benefits 10 13 23 12 31
Waste reduction 17 13 3 18 8
Increase yield/production 10 4 15 11 15
Need information 10 8 13 11 12
Compliance 15 17 3 4 4
Good conservation 14 13 - 7 4
Soil sampling 4 4 10 9 4
Good resource management 10 8 5 4 4
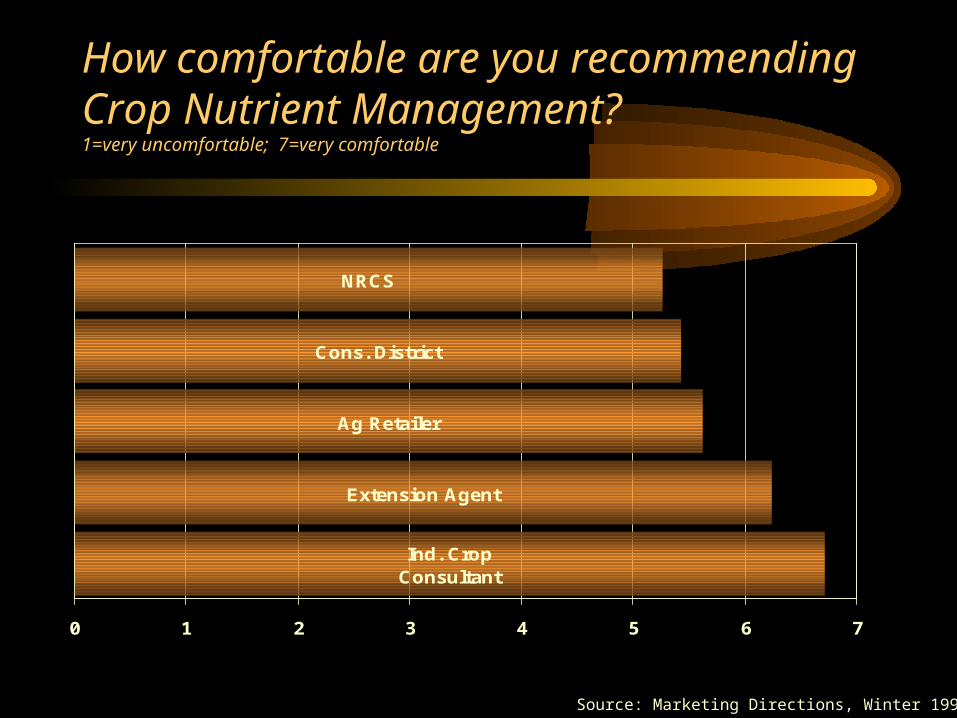
How comfortable are you recommending Crop Nutrient Management?1=very uncomfortable; 7=very comfortable
Ind. Crop Consultant
Extension Agent
Ag Retailer
Cons. District
NRCS
0 1 2 3 4 5 6 7
Source: Marketing Directions, Winter 1997-98
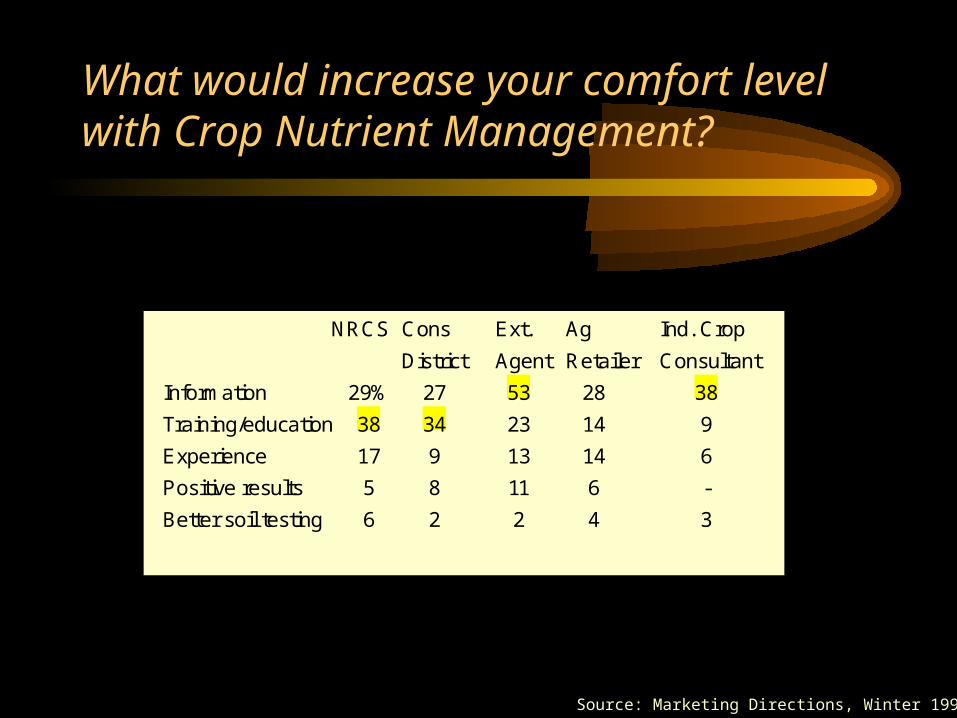
What would increase your comfort level with Crop Nutrient Management?
Source: Marketing Directions, Winter 1997-98
NRCS Cons Ext. Ag Ind. Crop
District Agent Retailer Consultant
Information 29% 27 53 28 38
Training/education 38 34 23 14 9
Experience 17 9 13 14 6
Positive results 5 8 11 6 -
Better soil testing 6 2 2 4 3
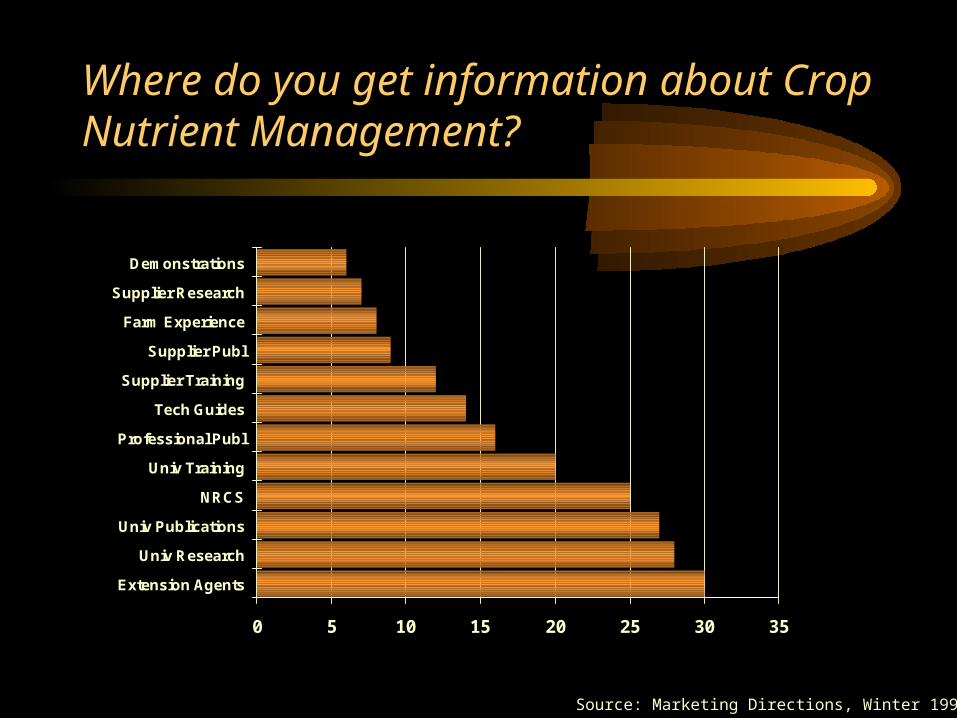
Where do you get information about Crop Nutrient Management?
0 5 10 15 20 25 30 35
Extension Agents
Univ Research
Univ Publications
NRCS
Univ Training
Professional Publ
Tech Guides
Supplier Training
Supplier Publ
Farm Experience
Supplier Research
Demonstrations
Source: Marketing Directions, Winter 1997-98
Source: Marketing Directions, Winter 1997-98
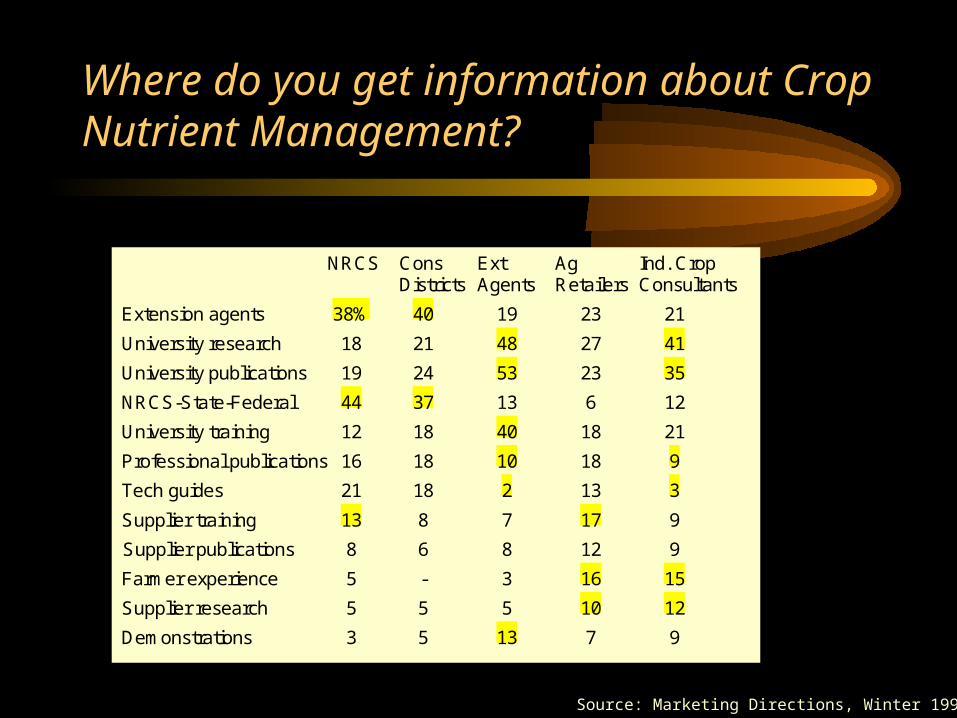
Where do you get information about Crop Nutrient Management?
NRCS Cons Ext Ag Ind. CropDistricts Agents Retailers Consultants
Extension agents 38% 40 19 23 21
University research 18 21 48 27 41
University publications 19 24 53 23 35
NRCS-State-Federal 44 37 13 6 12
University training 12 18 40 18 21
Professional publications 16 18 10 18 9
Tech guides 21 18 2 13 3
Supplier training 13 8 7 17 9
Supplier publications 8 6 8 12 9
Farmer experience 5 - 3 16 15
Supplier research 5 5 5 10 12
Demonstrations 3 5 13 7 9
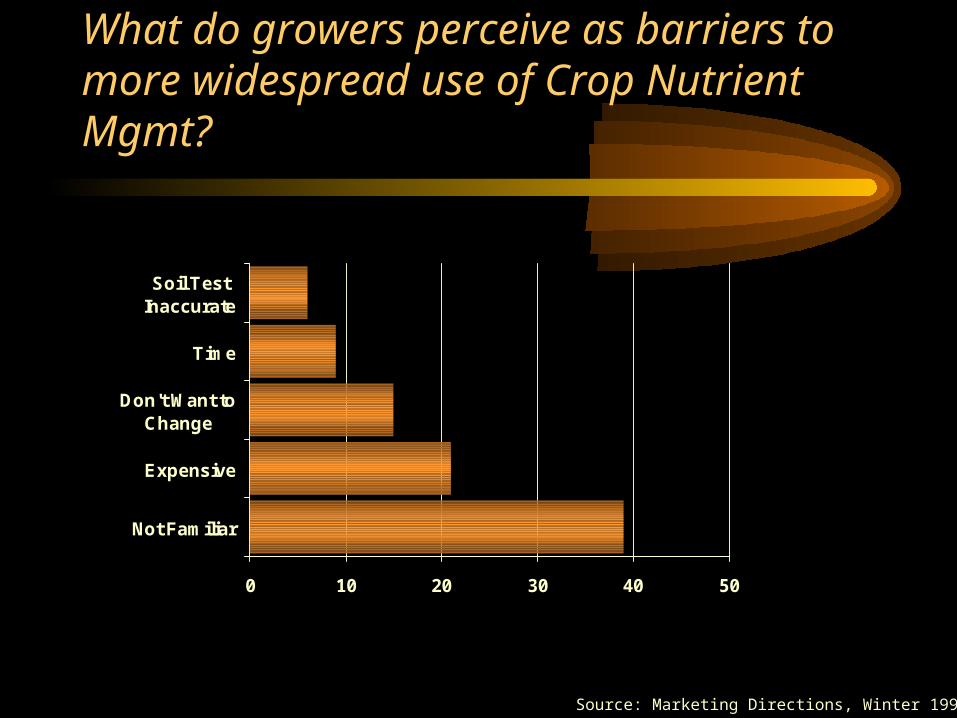
What do growers perceive as barriers to more widespread use of Crop Nutrient Mgmt?
0 10 20 30 40 50
Not Familiar
Expensive
Don't Want toChange
Time
Soil TestInaccurate
Source: Marketing Directions, Winter 1997-98
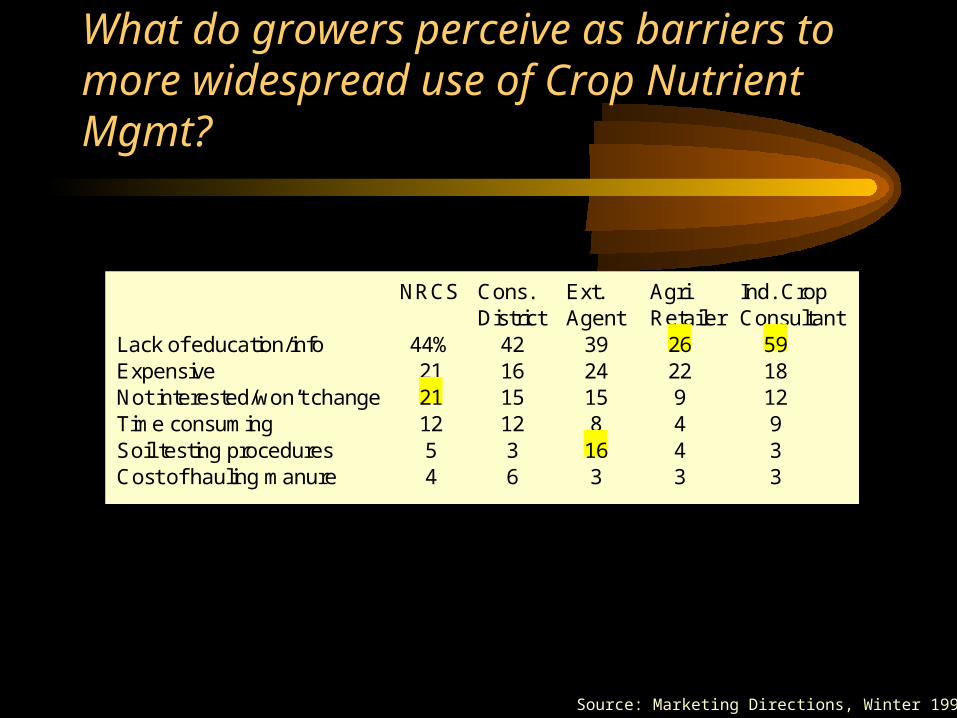
Source: Marketing Directions, Winter 1997-98
NRCS Cons. Ext. Agri Ind. CropDistrict Agent Retailer Consultant
Lack of education/info 44% 42 39 26 59Expensive 21 16 24 22 18Not interested/won’t change 21 15 15 9 12Time consuming 12 12 8 4 9Soil testing procedures 5 3 16 4 3Cost of hauling manure 4 6 3 3 3
What do growers perceive as barriers to more widespread use of Crop Nutrient Mgmt?
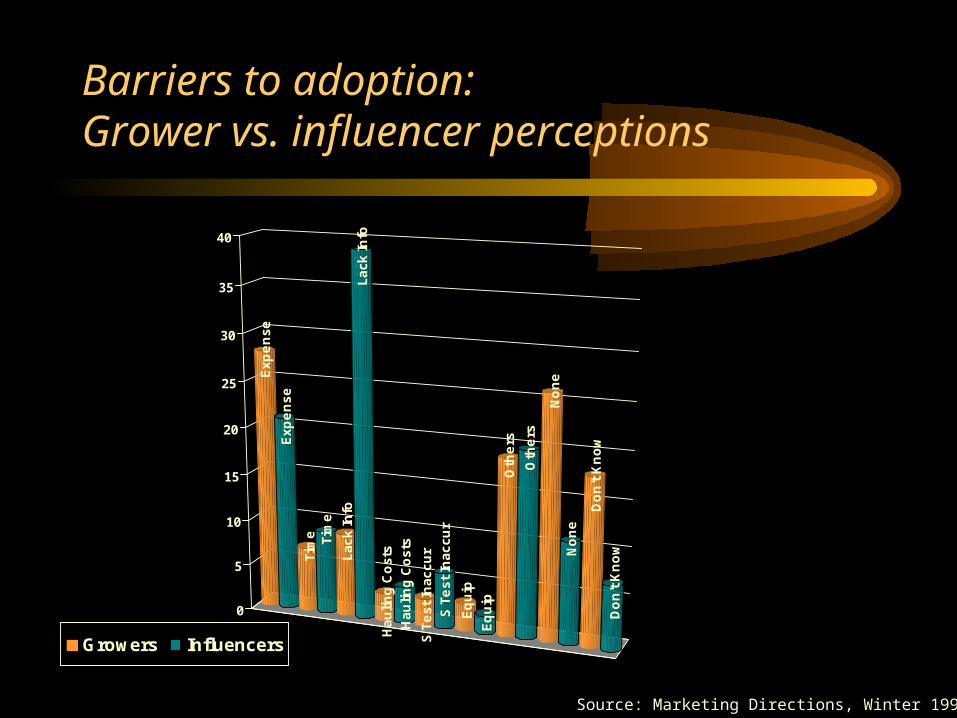
Barriers to adoption: Grower vs. influencer perceptions
Ex
pe
ns
e
Ex
pe
ns
e
Tim
e Tim
e
La
ck
In
foL
ac
k I
nfo
Ha
uli
ng
Co
sts
Ha
uli
ng
Co
sts
S T
es
t In
ac
cu
r
S T
es
t In
ac
cu
r
Eq
uip
Eq
uip
Oth
ers
Oth
ers
No
ne
No
ne
Do
n't
Kn
ow
Do
n't
Kn
ow
0
5
10
15
20
25
30
35
40
Growers Influencers
Source: Marketing Directions, Winter 1997-98