Embed Size (px)
Citation preview
FLORIDA DEPARTMENT OF ENVIRONMENTAL PROTECTION Division of Environmental Assessment and Restoration, Bureau of Watershed Restoration
CENTRAL DISTRICT • OCKLAWAHA BASIN
Nutrient TMDL for Silver Springs, Silver Springs Group, and
Upper Silver River (WBIDs 2772A, 2772C, and 2772E)
Richard Hicks and Kathryn Holland
Ground Water Management Section
November 2012
TMDL Report: Ocklawaha Basin; Silver Springs, Silver Springs Group, and Upper Silver River (WBIDs 2772A, 2772C, and 2772E); Nutrients; November 2012
ii Florida Department of Environmental Protection
Acknowledgments This analysis could not have been accomplished without significant contributions from Teayann Tinsley, Debra Harrington, Edgar Wade, Akia Laurant, and Paul Lee in the Florida Department of Environmental Protection’s (Department) Bureau of Watershed Restoration, Ground Water Management Section.
John Hallas and Wayne Magley, in their Total Maximum Daily Load (TMDL) document for the Suwannee River and springs, provided a model for the approach taken in the development of this TMDL.
Jan Mandrup-Poulsen, Doug Gilbert, and Wayne Magley provided invaluable review comments and support as the report was written.
Map production was provided by Yesenia Escribano of the Department.
Kim Dinkins from Marion County provided assistance in interpreting Marion County onsite sewage treatment and disposal systems data.
Fay Baird from the St. Johns River Water Management District provided data on discharge and assistance with interpreting Silver River discharge data.
Editorial assistance was provided by Linda Lord.
For additional information on the watershed management approach and impaired waters in the Ocklawaha Basin, contact:
Mary Paulic Florida Department of Environmental Protection Bureau of Watershed Restoration Watershed Planning and Coordination Section 2600 Blair Stone Road, Mail Station 3565 Tallahassee, FL 32399-2400 Email: [email protected] Phone: (850) 245–8560 Fax: (850) 245–8434 Access to all data used in the development of this report can be obtained by contacting:
Richard Hicks, P.G. Florida Department of Environmental Protection Bureau of Watershed Restoration Ground Water Management Section 2600 Blair Stone Road, Mail Station 3575 Tallahassee, FL 32399-2400 Email: [email protected] Phone: (850) 245–8229 Fax: (850) 245–8236
TMDL Report: Ocklawaha Basin; Silver Springs, Silver Springs Group, and Upper Silver River (WBIDs 2772A, 2772C, and 2772E); Nutrients; November 2012
iii Florida Department of Environmental Protection
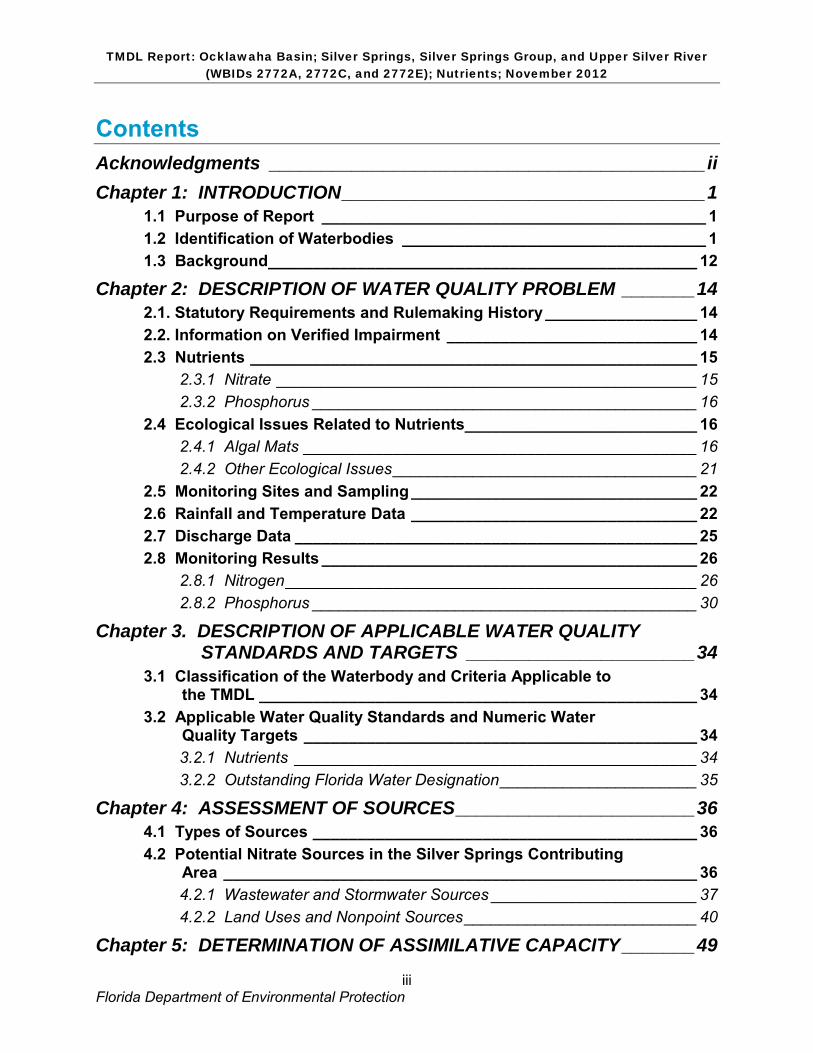
Contents Acknowledgments __________________________________________ ii Chapter 1: INTRODUCTION ___________________________________ 1
1.1 Purpose of Report ___________________________________________ 1 1.2 Identification of Waterbodies __________________________________ 1 1.3 Background ________________________________________________ 12
Chapter 2: DESCRIPTION OF WATER QUALITY PROBLEM _______ 14 2.1. Statutory Requirements and Rulemaking History _________________ 14 2.2. Information on Verified Impairment ____________________________ 14 2.3 Nutrients __________________________________________________ 15
2.3.1 Nitrate _______________________________________________ 15 2.3.2 Phosphorus ___________________________________________ 16
2.4 Ecological Issues Related to Nutrients__________________________ 16 2.4.1 Algal Mats ____________________________________________ 16 2.4.2 Other Ecological Issues __________________________________ 21
2.5 Monitoring Sites and Sampling ________________________________ 22 2.6 Rainfall and Temperature Data ________________________________ 22 2.7 Discharge Data _____________________________________________ 25 2.8 Monitoring Results __________________________________________ 26
2.8.1 Nitrogen ______________________________________________ 26 2.8.2 Phosphorus ___________________________________________ 30
Chapter 3. DESCRIPTION OF APPLICABLE WATER QUALITY STANDARDS AND TARGETS ______________________ 34
3.1 Classification of the Waterbody and Criteria Applicable to the TMDL _________________________________________________ 34
3.2 Applicable Water Quality Standards and Numeric Water Quality Targets ____________________________________________ 34 3.2.1 Nutrients _____________________________________________ 34 3.2.2 Outstanding Florida Water Designation ______________________ 35
Chapter 4: ASSESSMENT OF SOURCES _______________________ 36 4.1 Types of Sources ___________________________________________ 36 4.2 Potential Nitrate Sources in the Silver Springs Contributing
Area _____________________________________________________ 36 4.2.1 Wastewater and Stormwater Sources _______________________ 37 4.2.2 Land Uses and Nonpoint Sources __________________________ 40
Chapter 5: DETERMINATION OF ASSIMILATIVE CAPACITY _______ 49
TMDL Report: Ocklawaha Basin; Silver Springs, Silver Springs Group, and Upper Silver River (WBIDs 2772A, 2772C, and 2772E); Nutrients; November 2012
iv Florida Department of Environmental Protection
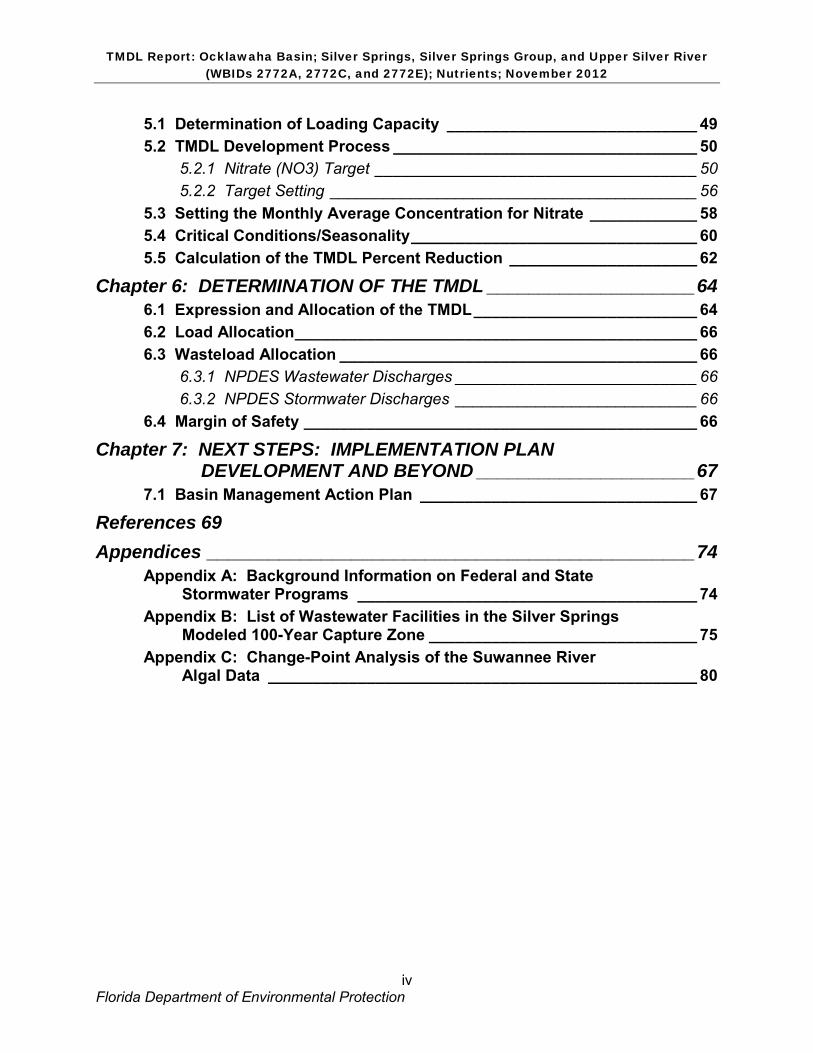
5.1 Determination of Loading Capacity ____________________________ 49 5.2 TMDL Development Process __________________________________ 50
5.2.1 Nitrate (NO3) Target ____________________________________ 50 5.2.2 Target Setting _________________________________________ 56
5.3 Setting the Monthly Average Concentration for Nitrate ____________ 58 5.4 Critical Conditions/Seasonality ________________________________ 60 5.5 Calculation of the TMDL Percent Reduction _____________________ 62
Chapter 6: DETERMINATION OF THE TMDL ____________________ 64 6.1 Expression and Allocation of the TMDL _________________________ 64 6.2 Load Allocation _____________________________________________ 66 6.3 Wasteload Allocation ________________________________________ 66
6.3.1 NPDES Wastewater Discharges ___________________________ 66 6.3.2 NPDES Stormwater Discharges ___________________________ 66
6.4 Margin of Safety ____________________________________________ 66
Chapter 7: NEXT STEPS: IMPLEMENTATION PLAN DEVELOPMENT AND BEYOND _____________________ 67
7.1 Basin Management Action Plan _______________________________ 67
References 69
Appendices _______________________________________________ 74 Appendix A: Background Information on Federal and State
Stormwater Programs ______________________________________ 74 Appendix B: List of Wastewater Facilities in the Silver Springs
Modeled 100-Year Capture Zone ______________________________ 75 Appendix C: Change-Point Analysis of the Suwannee River
Algal Data ________________________________________________ 80
TMDL Report: Ocklawaha Basin; Silver Springs, Silver Springs Group, and Upper Silver River (WBIDs 2772A, 2772C, and 2772E); Nutrients; November 2012
v Florida Department of Environmental Protection
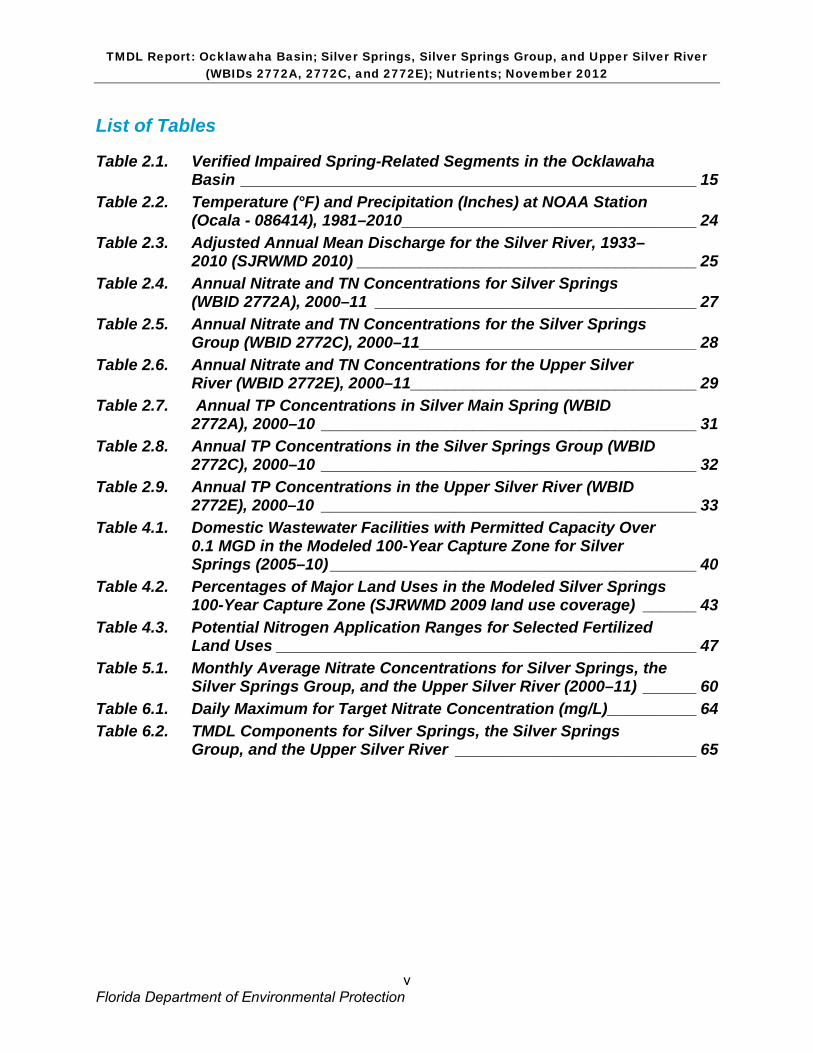
List of Tables
Table 2.1. Verified Impaired Spring-Related Segments in the Ocklawaha Basin ___________________________________________________ 15
Table 2.2. Temperature (°F) and Precipitation (Inches) at NOAA Station (Ocala - 086414), 1981–2010 _________________________________ 24
Table 2.3. Adjusted Annual Mean Discharge for the Silver River, 1933–2010 (SJRWMD 2010) ______________________________________ 25
Table 2.4. Annual Nitrate and TN Concentrations for Silver Springs (WBID 2772A), 2000–11 ____________________________________ 27
Table 2.5. Annual Nitrate and TN Concentrations for the Silver Springs Group (WBID 2772C), 2000–11 _______________________________ 28
Table 2.6. Annual Nitrate and TN Concentrations for the Upper Silver River (WBID 2772E), 2000–11 ________________________________ 29
Table 2.7. Annual TP Concentrations in Silver Main Spring (WBID 2772A), 2000–10 __________________________________________ 31
Table 2.8. Annual TP Concentrations in the Silver Springs Group (WBID 2772C), 2000–10 __________________________________________ 32
Table 2.9. Annual TP Concentrations in the Upper Silver River (WBID 2772E), 2000–10 __________________________________________ 33
Table 4.1. Domestic Wastewater Facilities with Permitted Capacity Over 0.1 MGD in the Modeled 100-Year Capture Zone for Silver Springs (2005–10) _________________________________________ 40
Table 4.2. Percentages of Major Land Uses in the Modeled Silver Springs 100-Year Capture Zone (SJRWMD 2009 land use coverage) ______ 43
Table 4.3. Potential Nitrogen Application Ranges for Selected Fertilized Land Uses _______________________________________________ 47
Table 5.1. Monthly Average Nitrate Concentrations for Silver Springs, the Silver Springs Group, and the Upper Silver River (2000–11) ______ 60
Table 6.1. Daily Maximum for Target Nitrate Concentration (mg/L) __________ 64 Table 6.2. TMDL Components for Silver Springs, the Silver Springs
Group, and the Upper Silver River ___________________________ 65
TMDL Report: Ocklawaha Basin; Silver Springs, Silver Springs Group, and Upper Silver River (WBIDs 2772A, 2772C, and 2772E); Nutrients; November 2012
vi Florida Department of Environmental Protection
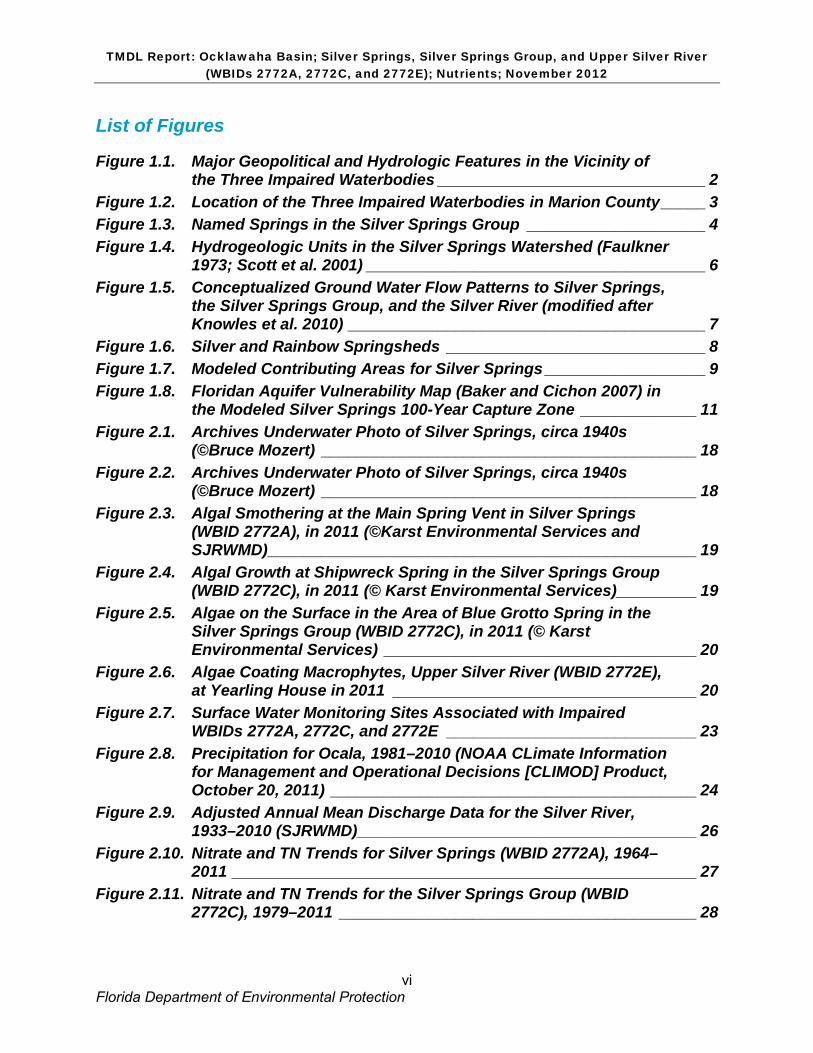
List of Figures
Figure 1.1. Major Geopolitical and Hydrologic Features in the Vicinity of the Three Impaired Waterbodies ______________________________ 2
Figure 1.2. Location of the Three Impaired Waterbodies in Marion County _____ 3 Figure 1.3. Named Springs in the Silver Springs Group ____________________ 4 Figure 1.4. Hydrogeologic Units in the Silver Springs Watershed (Faulkner
1973; Scott et al. 2001) ______________________________________ 6 Figure 1.5. Conceptualized Ground Water Flow Patterns to Silver Springs,
the Silver Springs Group, and the Silver River (modified after Knowles et al. 2010) ________________________________________ 7
Figure 1.6. Silver and Rainbow Springsheds _____________________________ 8 Figure 1.7. Modeled Contributing Areas for Silver Springs __________________ 9 Figure 1.8. Floridan Aquifer Vulnerability Map (Baker and Cichon 2007) in
the Modeled Silver Springs 100-Year Capture Zone _____________ 11 Figure 2.1. Archives Underwater Photo of Silver Springs, circa 1940s
(©Bruce Mozert) __________________________________________ 18 Figure 2.2. Archives Underwater Photo of Silver Springs, circa 1940s
(©Bruce Mozert) __________________________________________ 18 Figure 2.3. Algal Smothering at the Main Spring Vent in Silver Springs
(WBID 2772A), in 2011 (©Karst Environmental Services and SJRWMD) ________________________________________________ 19
Figure 2.4. Algal Growth at Shipwreck Spring in the Silver Springs Group (WBID 2772C), in 2011 (© Karst Environmental Services) _________ 19
Figure 2.5. Algae on the Surface in the Area of Blue Grotto Spring in the Silver Springs Group (WBID 2772C), in 2011 (© Karst Environmental Services) ___________________________________ 20
Figure 2.6. Algae Coating Macrophytes, Upper Silver River (WBID 2772E), at Yearling House in 2011 __________________________________ 20
Figure 2.7. Surface Water Monitoring Sites Associated with Impaired WBIDs 2772A, 2772C, and 2772E ____________________________ 23
Figure 2.8. Precipitation for Ocala, 1981–2010 (NOAA CLimate Information for Management and Operational Decisions [CLIMOD] Product, October 20, 2011) _________________________________________ 24
Figure 2.9. Adjusted Annual Mean Discharge Data for the Silver River, 1933–2010 (SJRWMD) ______________________________________ 26
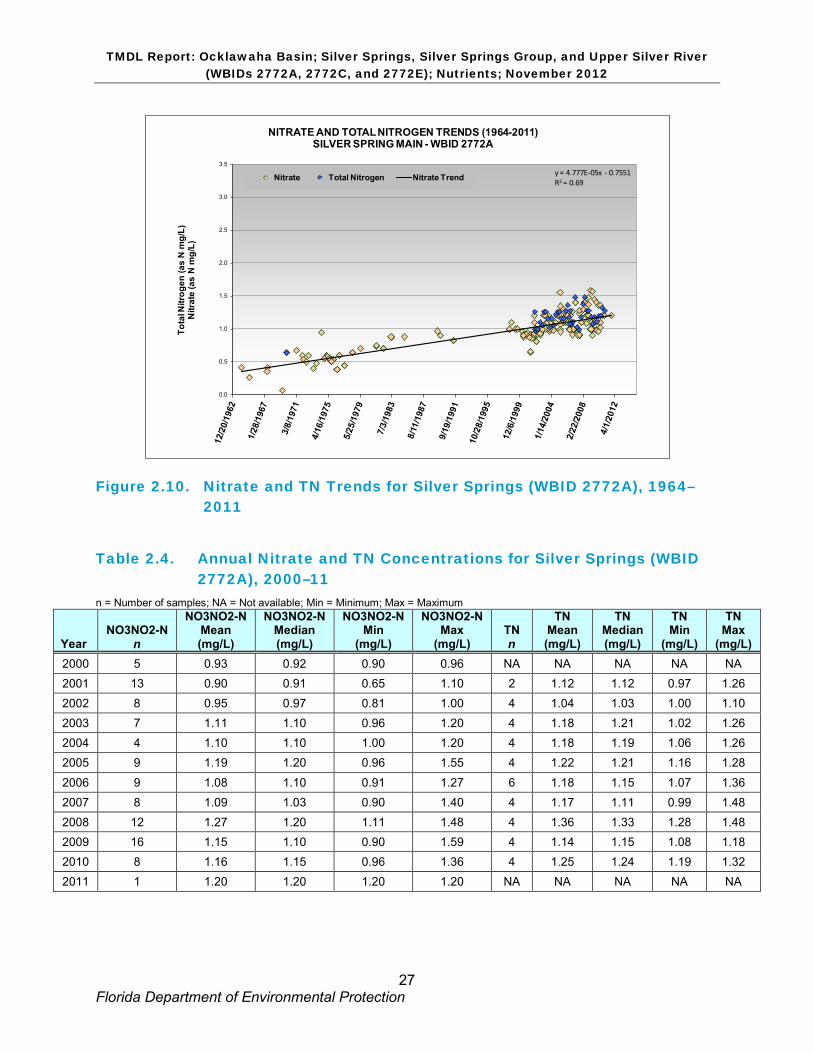
Figure 2.10. Nitrate and TN Trends for Silver Springs (WBID 2772A), 1964–2011 ____________________________________________________ 27
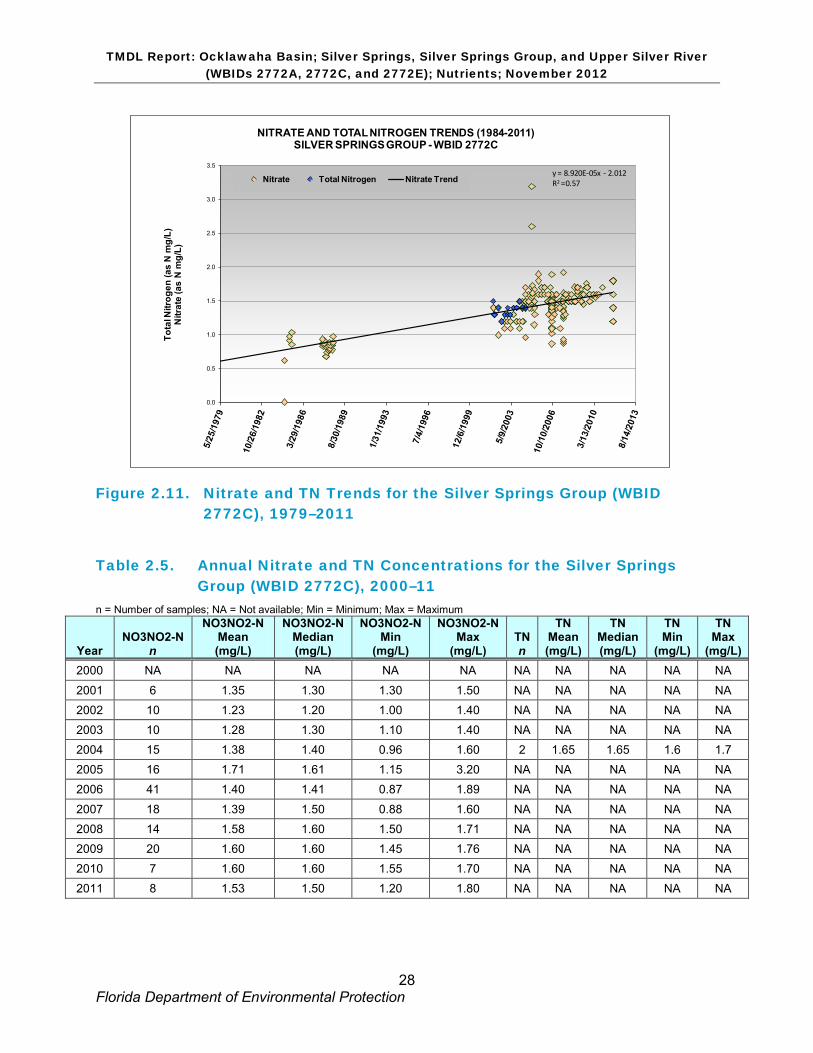
Figure 2.11. Nitrate and TN Trends for the Silver Springs Group (WBID 2772C), 1979–2011 ________________________________________ 28

TMDL Report: Ocklawaha Basin; Silver Springs, Silver Springs Group, and Upper Silver River (WBIDs 2772A, 2772C, and 2772E); Nutrients; November 2012
vii Florida Department of Environmental Protection
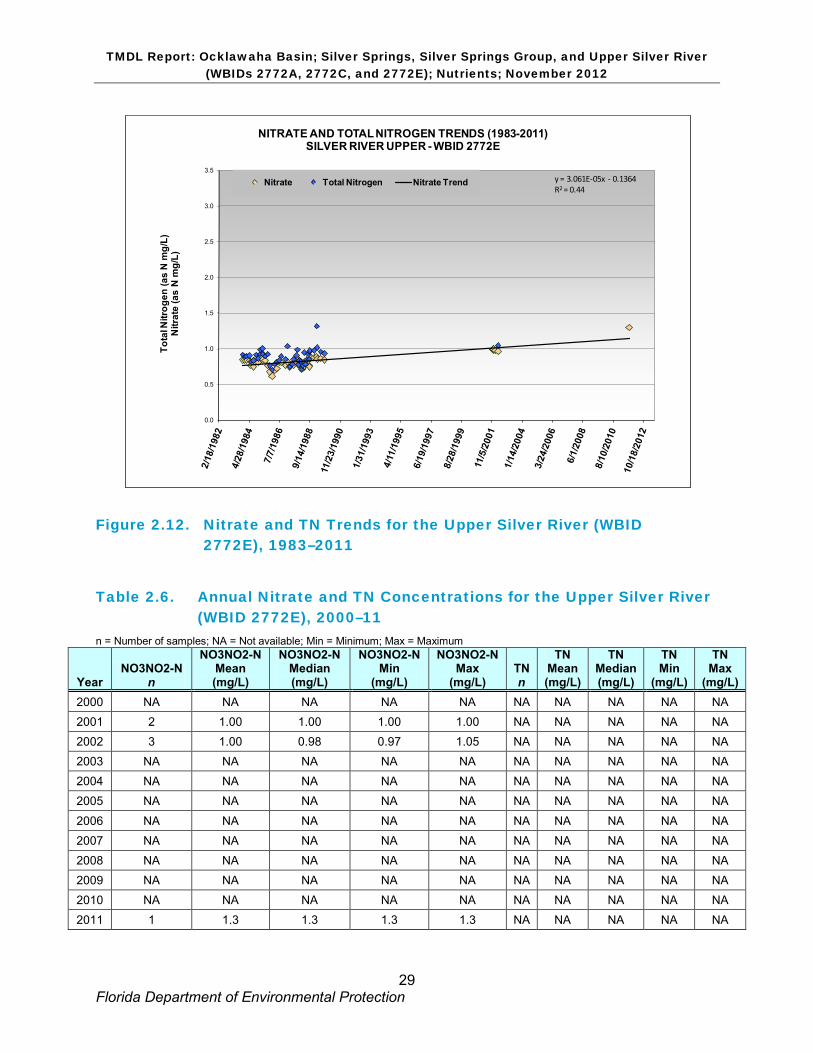
Figure 2.12. Nitrate and TN Trends for the Upper Silver River (WBID 2772E), 1983–2011 _______________________________________________ 29
Figure 2.13. TP Trends in Silver Main Spring (WBID 2772A), 1969–2010 _______ 31 Figure 2.14. TP Trends in the Silver Springs Group (WBID 2772C), 1968–
2010 ____________________________________________________ 32 Figure 2.15. TP Trends in the Silver Springs Group (WBID 2772E), 1983–
2002 ____________________________________________________ 33 Figure 4.1. Domestic and Industrial Wastewater Facilities in the Modeled
100-Year Capture Zone for Silver Springs _____________________ 38 Figure 4.2. Domestic Wastewater Facilities in the Modeled 100-Year
Capture Zone for Silver Springs and Their Design Capacities _____ 39 Figure 4.3. Location of Stormwater Drainage Wells near Silver Springs ______ 41 Figure 4.4. Population Density in the Modeled 100-Year Capture Zone for
Silver Springs (based on 2010 Census) _______________________ 42 Figure 4.5. Principal Land Uses in the Modeled 100-Year Capture Zone for
Silver Springs (2009) ______________________________________ 44 Figure 4.6. Density of OSTDS in the Modeled 100-Year Capture Zone for
Silver Springs (Marion County 2008 coverage) _________________ 46 Figure 5.1. Correlation between Ecological Efficiency and Nitrate
Concentration in the Wekiva River, Rock Springs Run, Alexander Springs Creek, and Juniper Creek __________________ 51
Figure 5.2. Springs Included in Algal Growth Studies Conducted by Stevenson et al. (2007) _____________________________________ 52
Figure 5.3. Change-Point Study Sites in the Suwannee River System ________ 53 Figure 5.4. Relationship Between Mean NOx Concentration and Mean
Periphyton Biomass from 12 Sampling Sites on the Suwannee, Santa Fe, and Withlacoochee Rivers _________________________ 54
Figure 5.5. Relationship Between Mean NOx Concentration and Mean Periphyton Cell Density from 12 Sampling Sites on the Suwannee, Santa Fe, and Withlacoochee Rivers ________________ 55
Figure 5.6. Change-Point Analyses (the 95% Confidence Interval) ___________ 57 Figure 5.7. Central Tendency and Upper 95% Confidence Interval
Approach ________________________________________________ 57 Figure 5.8. Upper and Lower 95% Confidence Interval Approach ____________ 58 Figure 5.9a. Relationship of Discharge in the Silver River to Nitrate
Concentrations in the Silver Springs Group, 2000–10 ___________ 61 Figure 5.9b. Relationship of Discharge in the Silver River to Nitrate
Concentrations in the Silver Springs Group, 1964–2010 _________ 62
TMDL Report: Ocklawaha Basin; Silver Springs, Silver Springs Group, and Upper Silver River (WBIDs 2772A, 2772C, and 2772E); Nutrients; November 2012
viii Florida Department of Environmental Protection
Websites
Florida Department of Environmental Protection, Bureau of Watershed Restoration
TMDL Program http://www.dep.state.fl.us/water/tmdl/index.htm Identification of Impaired Surface Waters Rule http://www.dep.state.fl.us/legal/Rules/shared/62-303/62-303.pdf Florida STORET Program http://www.dep.state.fl.us/water/storet/index.htm 2012 Integrated Report http://www.dep.state.fl.us/water/docs/2012_integrated_report.pdf Criteria for Surface Water Quality Classifications http://www.dep.state.fl.us/legal/Rules/shared/62-302/62-302.pdf Basin Status Report and Water Quality Assessment Report:
Ocklawaha http://www.dep.state.fl.us/water/basin411/default.htm Florida’s Springs http://www.floridasprings.org/
U.S. Environmental Protection Agency, National STORET Program
Region 4: TMDLs in Florida
http://www.epa.gov/region4/water/tmdl/florida/
National STORET Program
http://www.epa.gov/storet/
TMDL Report: Ocklawaha Basin; Silver Springs, Silver Springs Group, and Upper Silver River (WBIDs 2772A, 2772C, and 2772E); Nutrients; October 2012
1 Florida Department of Environmental Protection
Chapter 1: INTRODUCTION 1.1 Purpose of Report This report presents the Total Maximum Daily Load (TMDL) for nitrate (NO3), which was determined to be a cause of the impairment of three segments of the Silver River within the Marshall Swamp Planning Unit of the Ocklawaha Basin: Silver Springs, the Silver Springs Group, and the Upper Silver River. These were verified by the Florida Department of Environmental Protection (Department) as impaired by nutrients (algal mats) and included on the Verified List of impaired waters for the Ocklawaha Basin that was adopted by Secretarial Order in May 2009. The TMDL presented in this report is the threshold concentration of nitrate for Silver Springs, the Silver Springs Group, and the Upper Silver River that will allow these waterbodies to meet the applicable water quality criterion for nutrients. This report will be used as the basis for discussions during the development of the Basin Management Action Plan (BMAP).
1.2 Identification of Waterbodies For assessment purposes, the Department has divided the Ocklawaha Basin into water assessment polygons with a unique waterbody identification (WBID) number for each watershed or stream reach. Silver Springs is WBID 2772A, Silver Springs Group is WBID 2772C, and the Upper Silver River is WBID 2772E.
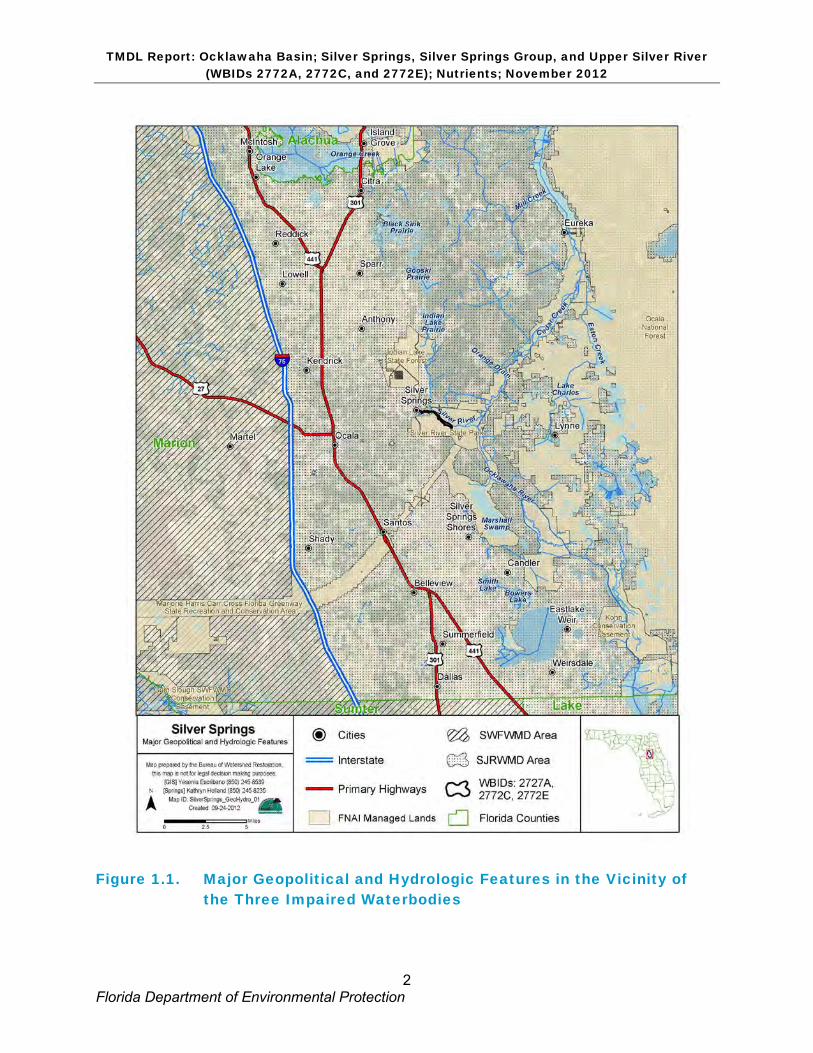
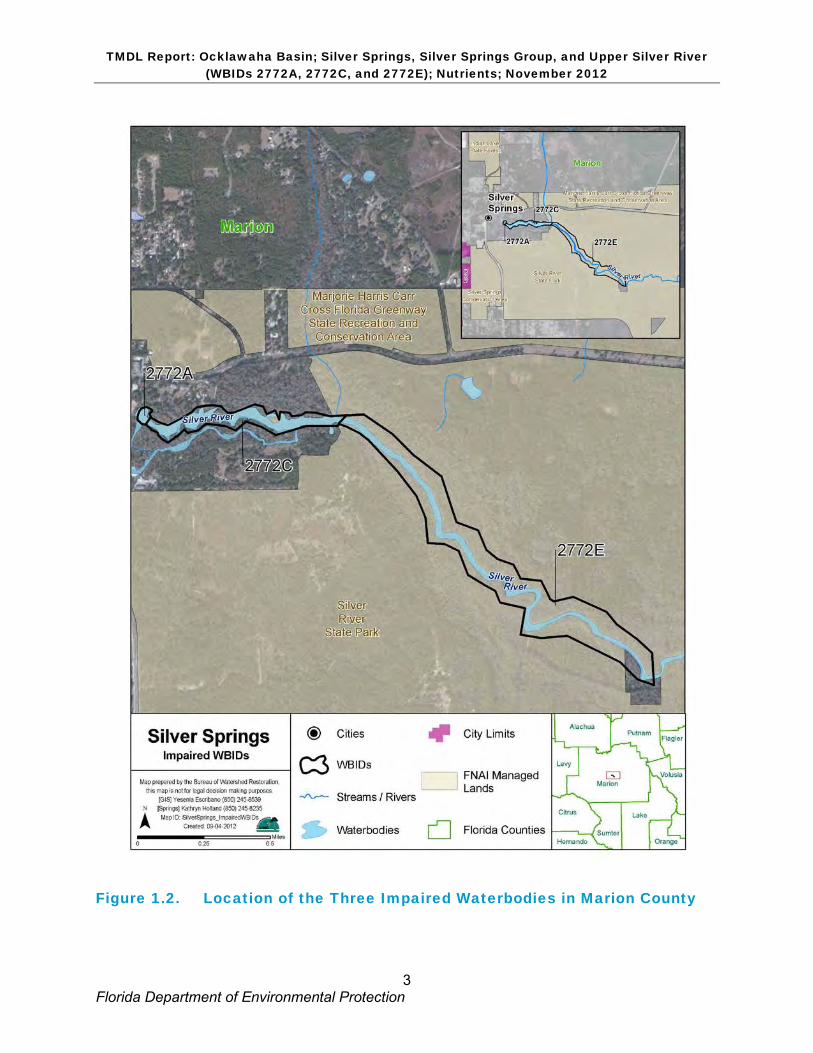
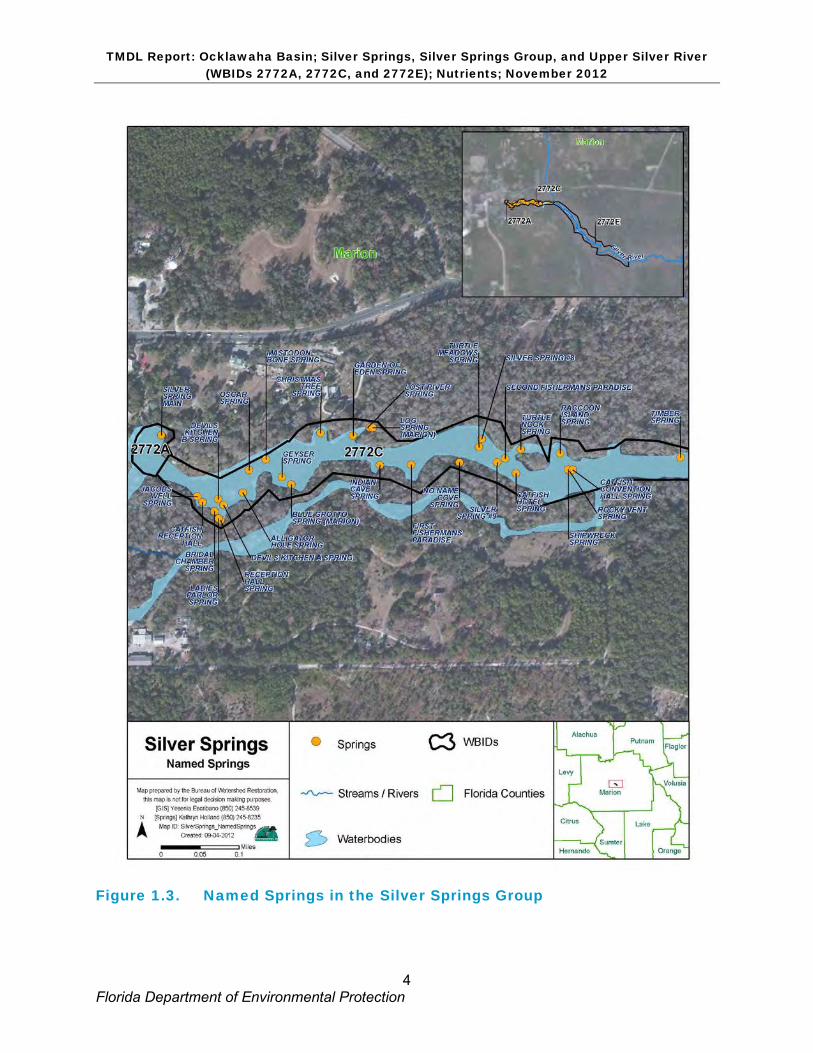
These three impaired segments of the Silver River are located in Marion County, Florida, east of the city of Ocala and within Silver River State Park (Figure 1.1). Silver Springs (WBID 2772A) is the uppermost segment of the Silver River and contains the largest spring in the system, Silver Main Spring (also known as Mammoth Spring). Silver Main Spring consists of 2 caverns or vents and is historically the largest nontidal spring in Florida by volume. On average, about 45% of flow in the Silver River is from Silver Main Spring. The Silver Springs Group (WBID 2772C) is the segment of the Silver River downstream from Silver Main that contains at least 3 other major springs, 26 other named springs, and numerous smaller, unnamed springs that contribute flow and nutrients to the system. WBIDs 2772A and 2772C combined include the cluster of springs, most commonly known as the Silver Springs Group, that forms the headwaters of the Silver River, which flows eastward approximately 5 miles to the Ocklawaha River. The Upper Silver River (WBID 2772E) consists of a 1.7-mile segment of the river below the Silver Springs Group that has no named springs but does have documented evidence of an imbalance of flora due to algal smothering. The remainder of the Silver River, while not subject to this TMDL, will benefit from nutrient load reductions since the majority of the loading comes from the springs complex. These segments of the Silver River support a complex aquatic ecosystem and are an important cultural and economic resource for the state. Figure 1.2 shows the impaired segments, and Figure 1.3 shows the named springs within them.
The impaired segments lie within a karst plain region where the landforms and surface water features depend on the underlying geology. In general, the topography and drainage within karst regions are caused by the underground erosion and subsidence of near-surface carbonate rocks. Within the rock, slightly acidic rainwater causes the limestone to dissolve, and further
TMDL Report: Ocklawaha Basin; Silver Springs, Silver Springs Group, and Upper Silver River (WBIDs 2772A, 2772C, and 2772E); Nutrients; November 2012
2 Florida Department of Environmental Protection
Figure 1.1. Major Geopolitical and Hydrologic Features in the Vicinity of the Three Impaired Waterbodies
TMDL Report: Ocklawaha Basin; Silver Springs, Silver Springs Group, and Upper Silver River (WBIDs 2772A, 2772C, and 2772E); Nutrients; November 2012
3 Florida Department of Environmental Protection
Figure 1.2. Location of the Three Impaired Waterbodies in Marion County
TMDL Report: Ocklawaha Basin; Silver Springs, Silver Springs Group, and Upper Silver River (WBIDs 2772A, 2772C, and 2772E); Nutrients; November 2012
4 Florida Department of Environmental Protection
Figure 1.3. Named Springs in the Silver Springs Group
TMDL Report: Ocklawaha Basin; Silver Springs, Silver Springs Group, and Upper Silver River (WBIDs 2772A, 2772C, and 2772E); Nutrients; November 2012
5 Florida Department of Environmental Protection
dissolution along zones of fractured rock and bedding planes causes the development of caves and interconnected openings known as conduits. Ground water migrates within these zones, and springs occur where hydraulic head differences in the aquifer coincide with openings in the earth.
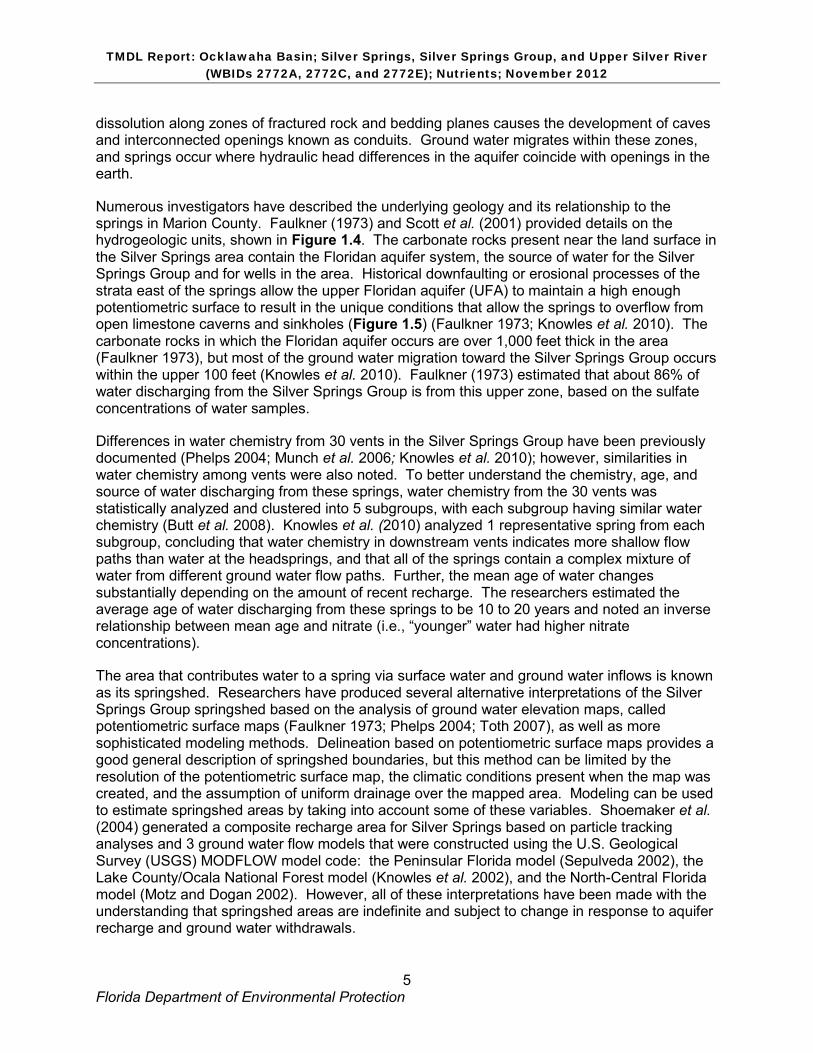
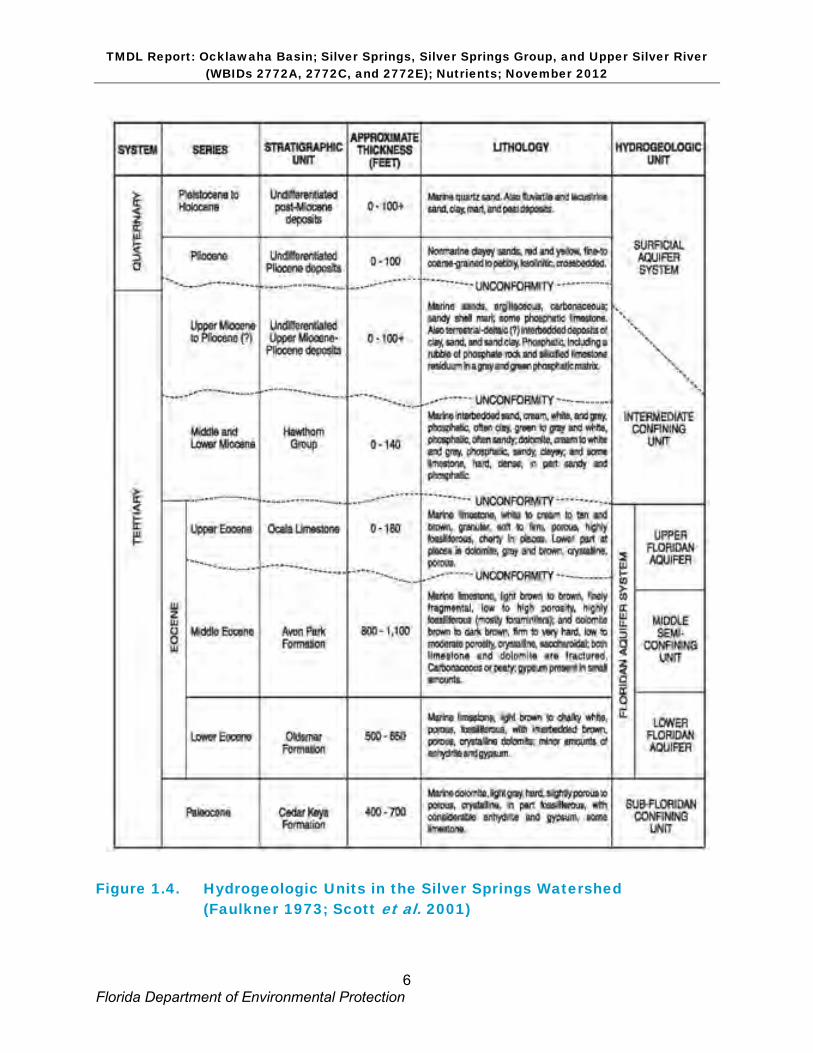
Numerous investigators have described the underlying geology and its relationship to the springs in Marion County. Faulkner (1973) and Scott et al. (2001) provided details on the hydrogeologic units, shown in Figure 1.4. The carbonate rocks present near the land surface in the Silver Springs area contain the Floridan aquifer system, the source of water for the Silver Springs Group and for wells in the area. Historical downfaulting or erosional processes of the strata east of the springs allow the upper Floridan aquifer (UFA) to maintain a high enough potentiometric surface to result in the unique conditions that allow the springs to overflow from open limestone caverns and sinkholes (Figure 1.5) (Faulkner 1973; Knowles et al. 2010). The carbonate rocks in which the Floridan aquifer occurs are over 1,000 feet thick in the area (Faulkner 1973), but most of the ground water migration toward the Silver Springs Group occurs within the upper 100 feet (Knowles et al. 2010). Faulkner (1973) estimated that about 86% of water discharging from the Silver Springs Group is from this upper zone, based on the sulfate concentrations of water samples.
Differences in water chemistry from 30 vents in the Silver Springs Group have been previously documented (Phelps 2004; Munch et al. 2006; Knowles et al. 2010); however, similarities in water chemistry among vents were also noted. To better understand the chemistry, age, and source of water discharging from these springs, water chemistry from the 30 vents was statistically analyzed and clustered into 5 subgroups, with each subgroup having similar water chemistry (Butt et al. 2008). Knowles et al. (2010) analyzed 1 representative spring from each subgroup, concluding that water chemistry in downstream vents indicates more shallow flow paths than water at the headsprings, and that all of the springs contain a complex mixture of water from different ground water flow paths. Further, the mean age of water changes substantially depending on the amount of recent recharge. The researchers estimated the average age of water discharging from these springs to be 10 to 20 years and noted an inverse relationship between mean age and nitrate (i.e., “younger” water had higher nitrate concentrations).
The area that contributes water to a spring via surface water and ground water inflows is known as its springshed. Researchers have produced several alternative interpretations of the Silver Springs Group springshed based on the analysis of ground water elevation maps, called potentiometric surface maps (Faulkner 1973; Phelps 2004; Toth 2007), as well as more sophisticated modeling methods. Delineation based on potentiometric surface maps provides a good general description of springshed boundaries, but this method can be limited by the resolution of the potentiometric surface map, the climatic conditions present when the map was created, and the assumption of uniform drainage over the mapped area. Modeling can be used to estimate springshed areas by taking into account some of these variables. Shoemaker et al. (2004) generated a composite recharge area for Silver Springs based on particle tracking analyses and 3 ground water flow models that were constructed using the U.S. Geological Survey (USGS) MODFLOW model code: the Peninsular Florida model (Sepulveda 2002), the Lake County/Ocala National Forest model (Knowles et al. 2002), and the North-Central Florida model (Motz and Dogan 2002). However, all of these interpretations have been made with the understanding that springshed areas are indefinite and subject to change in response to aquifer recharge and ground water withdrawals.
TMDL Report: Ocklawaha Basin; Silver Springs, Silver Springs Group, and Upper Silver River (WBIDs 2772A, 2772C, and 2772E); Nutrients; November 2012
6 Florida Department of Environmental Protection
Figure 1.4. Hydrogeologic Units in the Silver Springs Watershed (Faulkner 1973; Scott et al. 2001)
TMDL Report: Ocklawaha Basin; Silver Springs, Silver Springs Group, and Upper Silver River (WBIDs 2772A, 2772C, and 2772E); Nutrients; November 2012
7 Florida Department of Environmental Protection
Figure 1.5. Conceptualized Ground Water Flow Patterns to Silver Springs, the Silver Springs Group, and the Silver River (modified after Knowles et al. 2010)
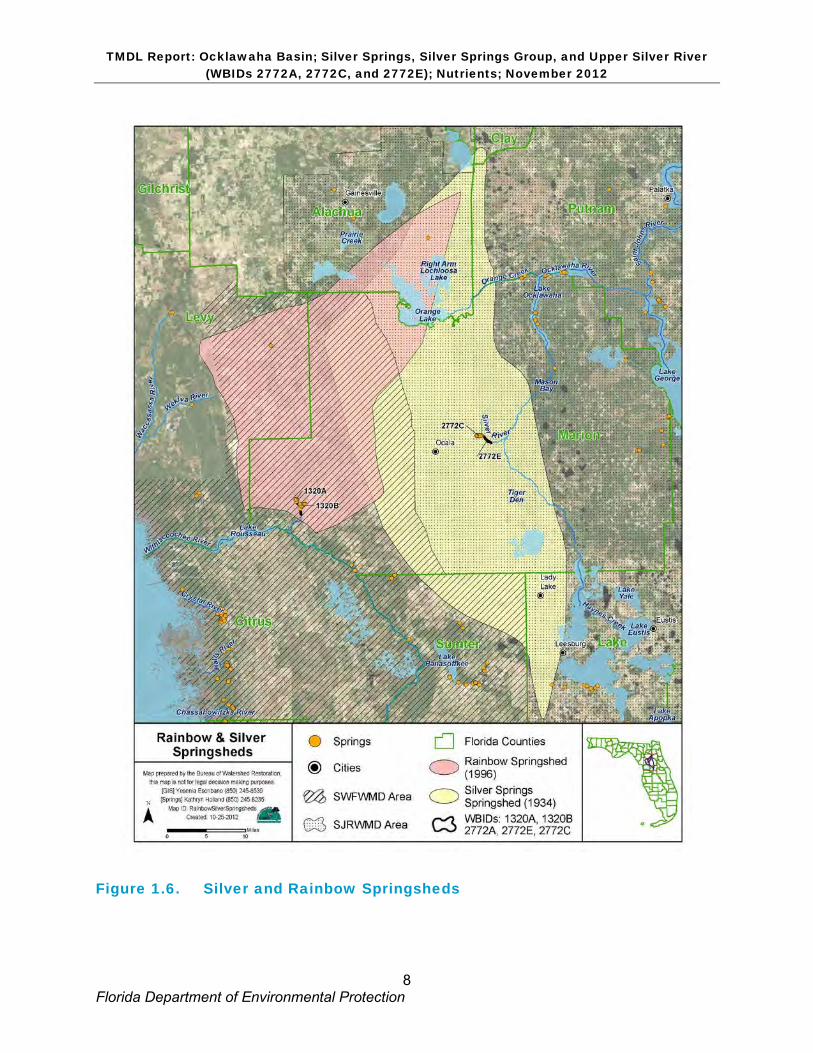
Many of Florida’s major springs have overlapping springsheds and share ground water recharge areas. This is the case for Silver Springs and its neighboring spring group, Rainbow Springs (Figure 1.6). Springsheds expand, shrink, and fluctuate in response to changes in rainfall and sometimes ground water withdrawals, and so their boundaries are not definite and can be interpreted in different ways.
Modeling was used to develop generalized estimates of travel time of ground water to the springs from various locations in the springshed (Figure 1.7). The 1,000-year travel time area closely approximates the historical springshed boundary. Upchurch and Farrell (2005) used the North-Central Florida model (Motz and Dogan 2004), the Peninsular Florida model (Sepulveda 2002), and particle tracking conducted by the St. Johns River Water Management District (SJRWMD) to simulate the 10- and 100-year travel times of ground water to Silver Springs. The 100-year capture zone boundary was predicted by the model to encompass the area in which ground water flows to the spring within a 100-year period. This boundary was also assumed to
TMDL Report: Ocklawaha Basin; Silver Springs, Silver Springs Group, and Upper Silver River (WBIDs 2772A, 2772C, and 2772E); Nutrients; November 2012
8 Florida Department of Environmental Protection
Figure 1.6. Silver and Rainbow Springsheds

TMDL Report: Ocklawaha Basin; Silver Springs, Silver Springs Group, and Upper Silver River (WBIDs 2772A, 2772C, and 2772E); Nutrients; November 2012
9 Florida Department of Environmental Protection
Figure 1.7. Modeled Contributing Areas for Silver Springs
TMDL Report: Ocklawaha Basin; Silver Springs, Silver Springs Group, and Upper Silver River (WBIDs 2772A, 2772C, and 2772E); Nutrients; November 2012
10 Florida Department of Environmental Protection
define the area most vulnerable to the rapid movement of contamination to the springs and ground water discharge from the spring or cavern system (Upchurch and Farrell 2005).
The 100-year capture zone has become an accepted planning tool for Marion County and local stakeholders. However, this modeling product also has inherent flaws, as the modeling tools cannot account for conduit flow within karst aquifers. A 2010–11 study conducted by the SJRWMD (McGurk et al. 2011) used dye tracing to demonstrate that flow pathways in the springshed move water to the spring vents more rapidly than predicted by particle tracking models. Estimates of ground water travel times based on regional-scale flow models do not account for conduit flow and therefore can significantly underestimate ground water migration rates.
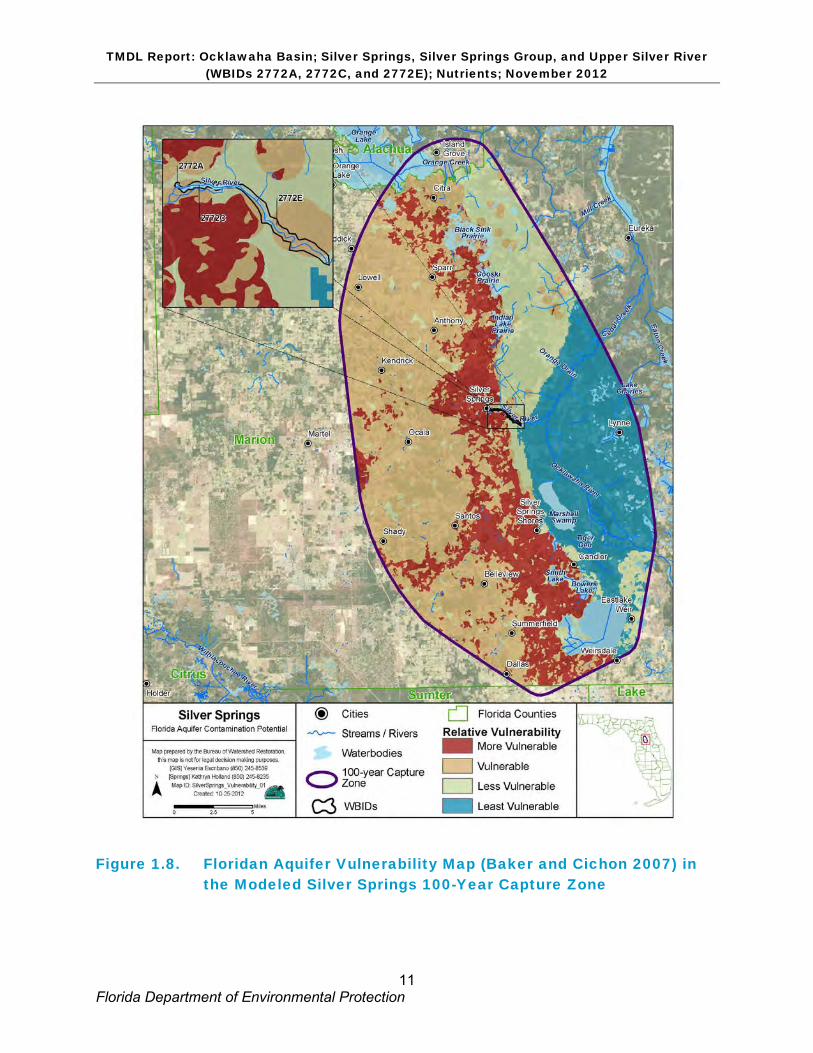
However, the 100-year capture zone for Silver Springs does include the bulk of the land use– derived sources of nitrate that are likely causing elevated nitrate concentrations in the impaired waters. For reference purposes in this TMDL document, the 100-year capture zone is used in discussions of the inventory of land use types and nitrogen sources that are provided in the following chapters. This area includes the main portion of the various springshed areas drawn for the Silver Springs Group and also includes the surface watershed of the impaired segments of the Silver River.
The modeled 100-year capture zone for Silver Springs includes approximately 502 square miles, almost all of it lying within Marion County. Small portions extend into Alachua and Sumter Counties. The Marion County Aquifer Vulnerability Assessment (MCAVA) model for the Floridan aquifer system in Marion County (Baker and Cichon 2007) classified the Floridan aquifer beneath the western half of this area as “vulnerable” and “more vulnerable” to contamination from overlying land uses because of the karst terrain, the lack of confining clays above the aquifer, and the high rate of recharge through the overlying material (Figure 1.8).
In the evaluation of potential sources of nutrients impacting the springs and their impaired receiving waters, the Department considered the estimated main contributing area for ground water as well as the surface watershed of the upper Silver River; however, the surface watershed is characterized by minimal surface drainage. Most of the drainage in this area is internal, either directly into closed depressions or by seepage into the unconfined limestone of the UFA. Ground water basins in the area do not coincide with the boundaries of surface water drainage divides (Faulkner 1973).
Additional information about the springs’ hydrology and hydrogeologic setting is available in the Basin Status Report for the Ocklawaha Basin (Department 2001a).
TMDL Report: Ocklawaha Basin; Silver Springs, Silver Springs Group, and Upper Silver River (WBIDs 2772A, 2772C, and 2772E); Nutrients; November 2012
11 Florida Department of Environmental Protection
Figure 1.8. Floridan Aquifer Vulnerability Map (Baker and Cichon 2007) in the Modeled Silver Springs 100-Year Capture Zone
TMDL Report: Ocklawaha Basin; Silver Springs, Silver Springs Group, and Upper Silver River (WBIDs 2772A, 2772C, and 2772E); Nutrients; November 2012
12 Florida Department of Environmental Protection
1.3 Background This report was developed as part of the Department’s watershed management approach for restoring and protecting state waters and addressing TMDL Program requirements. The watershed approach, which is implemented using a cyclical management process that rotates through the state’s 52 river basins over a 5-year cycle, provides a framework for implementing the TMDL Program–related requirements of the 1972 federal Clean Water Act and the 1999 Florida Watershed Restoration Act (FWRA) (Chapter 99-223, Laws of Florida).
A TMDL represents the maximum amount of a given pollutant that a waterbody can assimilate and still meet water quality standards, including its applicable water quality criteria and its designated uses. TMDLs are developed for waterbodies that are verified as not meeting their water quality standards. They provide important water quality restoration goals that will guide restoration activities.
This TMDL Report will be followed by the development and implementation of a Basin Management Action Plan, or BMAP, to reduce the amount of nutrients that caused the verified impairment of Silver Springs, the Silver Springs Group, and the Upper Silver River. The restoration of these waterbodies will depend heavily on the active participation of stakeholders in the contributing area, including Marion County, the city of Ocala, other local governments, landowners, businesses, and private citizens. The SJRWMD and Florida Department of Agriculture and Consumer Services (FDACS) will also play important roles in the implementation of restoration activities.
Silver Springs is economically valuable to the state and local communities. The land surrounding Silver Springs and the Silver Springs Group is state owned and administered by the Department’s Division of State Lands (DSL). The DSL currently leases a theme park located at the springs (Silver Springs–Nature’s Theme Park) to Palace Entertainment, a privately owned company that operates an attraction offering glass bottom–boat river cruises, concerts and special events, wildlife exhibits, botanical gardens, shopping, and dining. The Wild Waters Water Park is adjacent to the attraction. A recent economic impact study by Bonn (2004) of several spring parks, including the Silver Springs attraction, estimated that 1 million visitors contribute over $60 million to the local economy annually, creating 1,060 full- or part-time jobs with a payroll of $12.61 million. More than 70% of the visitors come from outside Marion County. Visits to Silver Springs are distributed fairly evenly throughout the year, leading to a more stable contribution to the local economy than if visits were highly seasonal.
Silver River State Park, located downriver from the state-owned land that includes the attraction, was created by the state in 1987 and is managed by the Department’s Division of Recreation and Parks. The park includes the springs and river. The SJRWMD owns 1 parcel within the park. Silver River State Park was created to protect the natural value of the Silver River and its headwaters, Silver Springs, for the benefit of the people of Florida. Currently, the park contains about 4,230 acres, with a 220-acre parcel leased to the Department by Marion County. The designated use of the property is public outdoor recreation and conservation, with no legislative or executive directive constraining the use of the property. The DSL estimated that during state fiscal year 2010–11 alone, visitors to Silver Springs contributed nearly $11 million in direct economic impacts and the equivalent of 217 jobs to the local economy (Department 2011a).
The unique ecological attributes of Silver Springs and the Silver River have also generated much local interest in protecting and restoring water quality and habitat. Numerous research
TMDL Report: Ocklawaha Basin; Silver Springs, Silver Springs Group, and Upper Silver River (WBIDs 2772A, 2772C, and 2772E); Nutrients; November 2012
13 Florida Department of Environmental Protection
projects have been conducted on the hydrology, biology, ecology, and water quality of Silver Springs and the Silver River to understand changes in the system that have been observed over the decades (Allen 1946; Odum 1957; Knight 1980, 1983; Toth 2003; Phelps 2004; Munch et al. 2006; Knowles et al. 2010). In 2006, Munch et al., in collaboration with Wetland Solutions, Inc. (WSI), and the University of Florida, compiled a comprehensive overview, Fifty-Year Retrospective Study of the Ecology of Silver Springs, in which existing data from these and other reports were summarized and the relationship between land use changes and the ecology of the springshed assessed (Munch et al. 2006). Some of the findings are summarized later in this document.
Public interest in the restoration and protection of the springs and river prompted the formation of the Silver Springs Working Group in 1999. The group, which was funded by the Department until 2011, helped to raise the public awareness of anthropogenic impacts to the springs such as nutrient enrichment and declines in water flow. In 2011, the working group, coordinated by Normandeau Associates, Inc., produced a draft restoration plan for the Silver Springs and River that outlined goals and actions for water quality, fish and wildlife, flows, and ecosystem-level restoration. The restoration goals are grouped into water quality, water quantity, biodiversity, education and outreach, land use and development, and recreational categories, and involve many levels of stakeholder participation. This plan will provide the foundation for developing and implementing water quality restoration actions during the BMAP process.
The Marion County Board of County Commissioners (BOCC) has also supported numerous efforts to restore and protect the springs. In 2005, the BOCC approved a resolution to “develop support for the protection of Marion County springs” and directed staff to develop recommended policies to protect springs. In addition, Marion County developed a Springs Protection Program to prevent the further degradation of springs and focus on water quality issues. In 2007, the BOCC appointed a County Aquifer and Springs Protection Task Force to recommend revisions to the Land Development Regulations (LDRs) for the county. In 2009, the BOCC voted to adopt the Springs Protection Ordinance (Ordinance 09-17), which added Article 6.4, Springs Protection Overlay Zone, to the LDRs and also amended Article 8.2.10, Landscape Standards, to reflect language in Article 6.4. In addition, the Marion County Extension Service helps owners implement voluntary farm best management practices (BMPs) to manage manure, crops, and pastures. In 2008, Marion County passed the Florida-Friendly Fertilizer Use on Urban Landscapes ordinance to reduce residential fertilizer use and protect ground water (Marion County 2008).
The most significant stormwater improvement project affecting the springs was the Silver Springs/River Pollution Reduction Project, which was constructed to treat stormwater discharging to Half Mile Creek a short distance upstream of the impaired Upper Silver River segment. This project, completed by the Florida Department of Transportation (FDOT) District 5 and Marion County in 2011, with funding support from the Department, collects and treats stormwater runoff from a segment of State Road 40 and its 192-acre watershed.
TMDL Report: Ocklawaha Basin; Silver Springs, Silver Springs Group, and Upper Silver River (WBIDs 2772A, 2772C, and 2772E); Nutrients; November 2012
14 Florida Department of Environmental Protection
Chapter 2: DESCRIPTION OF WATER QUALITY PROBLEM 2.1. Statutory Requirements and Rulemaking History Section 303(d) of the federal Clean Water Act requires states to submit to the U.S. Environmental Protection Agency (EPA) a list of surface waters that do not meet applicable water quality standards (impaired waters) and establish a TMDL for each pollutant causing the impairment of listed waters on a schedule. The Department has developed such lists, commonly referred to as 303(d) lists, since 1992. The list of impaired waters in each basin, referred to as the Verified List, is also required by the FWRA (Subsection 403.067[4], Florida Statutes [F.S.]), and the state’s 303(d) list is amended annually to include basin updates.
Florida’s 1998 303(d) list included 41 waterbodies in the Ocklawaha Basin. However, the FWRA (Section 403.067, F.S.) stated that all previous Florida 303(d) lists were for planning purposes only and directed the Department to develop, and adopt by rule, a new science-based methodology to identify impaired waters. After a long rulemaking process, the Environmental Regulation Commission adopted the new methodology as Rule 62-303, Florida Administrative Code (F.A.C.) (Identification of Impaired Surface Waters Rule, or IWR), in April 2001. The IWR was modified in 2006 and 2007.
2.2. Information on Verified Impairment Rule 62-303, F.A.C., includes a methodology for listing nutrient-impaired surface waters based on documentation that supports the determination of an imbalance of flora or fauna. In 2009, the Department used available water quality data in the IWR database, data from the Department’s Springs Initiative monitoring network, and other available information to document the nitrate concentrations and effects of nutrient enrichment at Silver Springs and the upper segments of the Silver River. The Springs Initiative monitoring data from 2001 to 2009 comprised the bulk of the nitrate data used in the evaluation. Biological assessment documents prepared by the Department’s Environmental Assessment Section, USGS, SJRWMD, and WSI, as well as other published reports and photographs, were used to provide evidence of algal smothering.
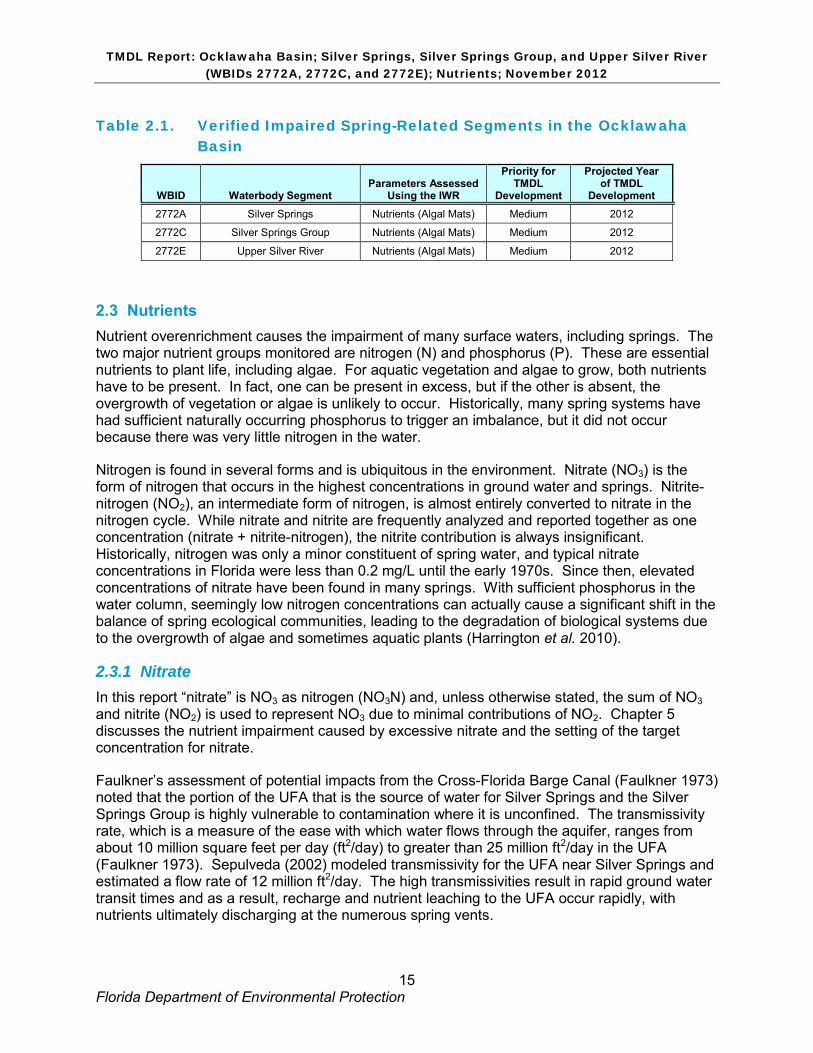
These spring-related waters were listed as impaired for nutrients because of their consistently elevated concentrations of nitrate (above 0.6 milligrams per liter [mg/L]) and the corresponding evidence of imbalance of flora and fauna caused by algal smothering. This information, documented by Hicks et al. (2009), supplemented the determination of impairment for the 2009 Verified List of impaired waters. Table 2.1 lists the waterbodies in the Ocklawaha Basin on the Cycle 2 Verified List that are addressed in this report.
TMDL Report: Ocklawaha Basin; Silver Springs, Silver Springs Group, and Upper Silver River (WBIDs 2772A, 2772C, and 2772E); Nutrients; November 2012
15 Florida Department of Environmental Protection
Table 2.1. Verified Impaired Spring-Related Segments in the Ocklawaha Basin
WBID Waterbody Segment Parameters Assessed
Using the IWR
Priority for TMDL
Development
Projected Year of TMDL
Development 2772A Silver Springs Nutrients (Algal Mats) Medium 2012 2772C Silver Springs Group Nutrients (Algal Mats) Medium 2012
2772E Upper Silver River Nutrients (Algal Mats) Medium 2012
2.3 Nutrients Nutrient overenrichment causes the impairment of many surface waters, including springs. The two major nutrient groups monitored are nitrogen (N) and phosphorus (P). These are essential nutrients to plant life, including algae. For aquatic vegetation and algae to grow, both nutrients have to be present. In fact, one can be present in excess, but if the other is absent, the overgrowth of vegetation or algae is unlikely to occur. Historically, many spring systems have had sufficient naturally occurring phosphorus to trigger an imbalance, but it did not occur because there was very little nitrogen in the water.
Nitrogen is found in several forms and is ubiquitous in the environment. Nitrate (NO3) is the form of nitrogen that occurs in the highest concentrations in ground water and springs. Nitrite-nitrogen (NO2), an intermediate form of nitrogen, is almost entirely converted to nitrate in the nitrogen cycle. While nitrate and nitrite are frequently analyzed and reported together as one concentration (nitrate + nitrite-nitrogen), the nitrite contribution is always insignificant. Historically, nitrogen was only a minor constituent of spring water, and typical nitrate concentrations in Florida were less than 0.2 mg/L until the early 1970s. Since then, elevated concentrations of nitrate have been found in many springs. With sufficient phosphorus in the water column, seemingly low nitrogen concentrations can actually cause a significant shift in the balance of spring ecological communities, leading to the degradation of biological systems due to the overgrowth of algae and sometimes aquatic plants (Harrington et al. 2010).
2.3.1 Nitrate In this report “nitrate” is NO3 as nitrogen (NO3N) and, unless otherwise stated, the sum of NO3 and nitrite (NO2) is used to represent NO3 due to minimal contributions of NO2. Chapter 5 discusses the nutrient impairment caused by excessive nitrate and the setting of the target concentration for nitrate.
Faulkner’s assessment of potential impacts from the Cross-Florida Barge Canal (Faulkner 1973) noted that the portion of the UFA that is the source of water for Silver Springs and the Silver Springs Group is highly vulnerable to contamination where it is unconfined. The transmissivity rate, which is a measure of the ease with which water flows through the aquifer, ranges from about 10 million square feet per day (ft2/day) to greater than 25 million ft2/day in the UFA (Faulkner 1973). Sepulveda (2002) modeled transmissivity for the UFA near Silver Springs and estimated a flow rate of 12 million ft2/day. The high transmissivities result in rapid ground water transit times and as a result, recharge and nutrient leaching to the UFA occur rapidly, with nutrients ultimately discharging at the numerous spring vents.

TMDL Report: Ocklawaha Basin; Silver Springs, Silver Springs Group, and Upper Silver River (WBIDs 2772A, 2772C, and 2772E); Nutrients; November 2012
16 Florida Department of Environmental Protection
The UFA’s vulnerability to contamination can be observed in the nitrate concentrations at the springs and wells within the contributing area, where concentrations increased as land use transitioned from natural land to agricultural and urban development. Anthropogenic sources of nitrate in the contributing area include atmospheric deposition, agricultural and residential fertilizers, and human and animal wastes.
Ground water concentrations of nitrate in the Silver Springs area reveal an impact. In a USGS study of nitrate impacts to Silver Springs, Phelps (2004) sampled 56 wells in the Silver Springs area for nitrate and other parameters. Concentrations of nitrate varied widely across the sampling area, which fell generally within the modeled 100-year travel zone described in this report. Concentrations ranged from less than the detection limit to 12 mg/L, with a median of 1.2 mg/L. A cluster analysis of water quality data from the 56 wells indicated that wells with elevated concentrations of nitrate were located in three geographic regions: one area 6 miles northwest of Silver Springs, and two areas 8 miles and 14 miles south of Silver Springs (O’Connell et al. 2008).
Private well sampling data from the Florida Department of Health (FDOH) were also reviewed. A total of 234 private well samples were collected for nitrate in the 100-year capture zone since 2001. For samples collected during that period, the average nitrate concentration was 3 mg/L and the maximum concentration was 31 mg/L. Most of the samples were collected in an area of known ground water contamination near Lake Weir, which is approximately 15 miles south of Silver Springs.
2.3.2 Phosphorus Neither orthophosphate nor total phosphorus (TP) has shown an increasing temporal trend in the Silver Springs system, and concentrations remain close to those levels found in the early 1950s. Therefore, phosphorus was not considered a target nutrient for the TMDL. In general, only the inorganic form of phosphorus, orthophosphate, is found in ground water in Florida. While the overlying Hawthorn Group can contribute orthophosphate to ground water throughout much of the state, this geologic formation is relatively thin and discontinuous in the contributing area and therefore is not a major contributor of orthophosphate (Phelps 2004). Although phosphorus is not a nutrient of concern in this TMDL, synergistic interaction with elevated nitrate could be contributing to the algal mat issues described below.
2.4 Ecological Issues Related to Nutrients
2.4.1 Algal Mats Evidence of an increasing trend in algal coverage, especially Lyngbya spp., and algal smothering has been documented in Silver Springs and the Upper Silver River (Quinlan et al. 2008). The dominant submerged aquatic vegetation (SAV) observed by Odum (1957) and Munch et al. (2006) was strap-leaf sagittaria (Sagittaria kurziana). In 2004, WSI researchers observed that algae blooms covered the SAV. The dominant epiphytic algae based on biomass were the green alga Ulothrix and the diatom Aulacoseira (=Melosira). The dominant benthic algal species was Lyngbya sp., which covered 100% of the substrate in some parts of the study area.
These researchers also noted that in some areas Lyngbya covered 100% of the river bottom. The predominance of Lyngbya in the benthic algal assemblage of the Silver River is an
TMDL Report: Ocklawaha Basin; Silver Springs, Silver Springs Group, and Upper Silver River (WBIDs 2772A, 2772C, and 2772E); Nutrients; November 2012
17 Florida Department of Environmental Protection
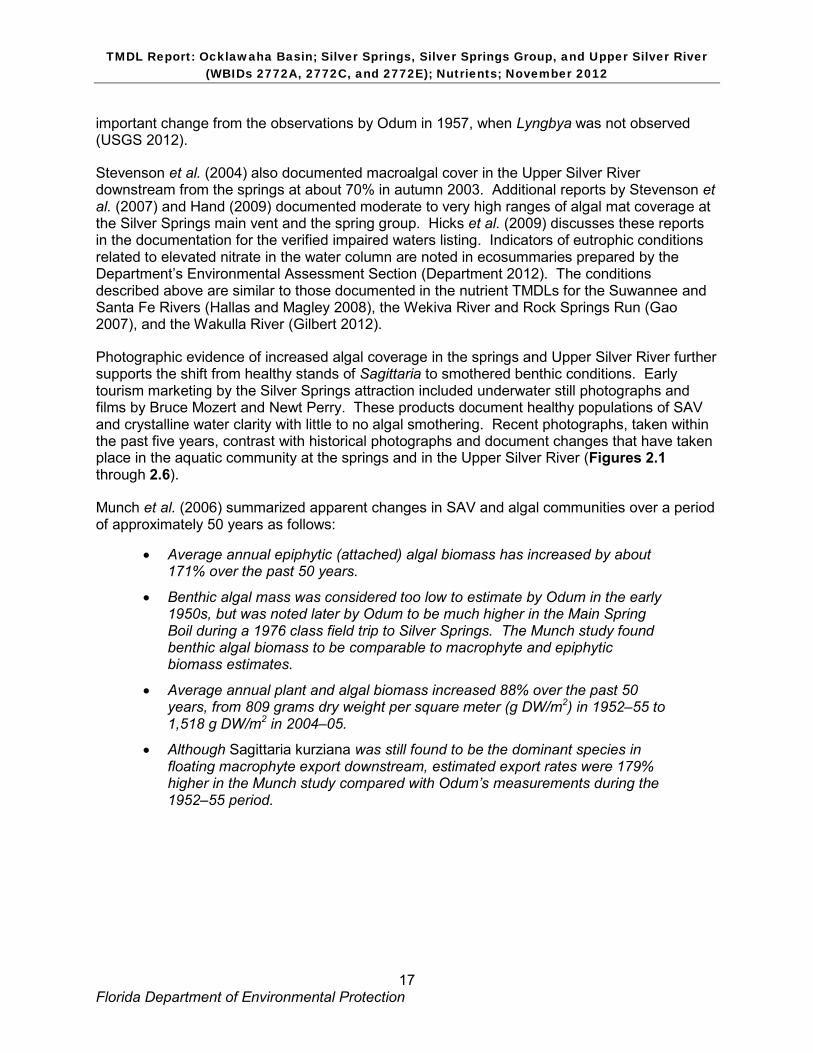
important change from the observations by Odum in 1957, when Lyngbya was not observed (USGS 2012).
Stevenson et al. (2004) also documented macroalgal cover in the Upper Silver River downstream from the springs at about 70% in autumn 2003. Additional reports by Stevenson et al. (2007) and Hand (2009) documented moderate to very high ranges of algal mat coverage at the Silver Springs main vent and the spring group. Hicks et al. (2009) discusses these reports in the documentation for the verified impaired waters listing. Indicators of eutrophic conditions related to elevated nitrate in the water column are noted in ecosummaries prepared by the Department’s Environmental Assessment Section (Department 2012). The conditions described above are similar to those documented in the nutrient TMDLs for the Suwannee and Santa Fe Rivers (Hallas and Magley 2008), the Wekiva River and Rock Springs Run (Gao 2007), and the Wakulla River (Gilbert 2012).
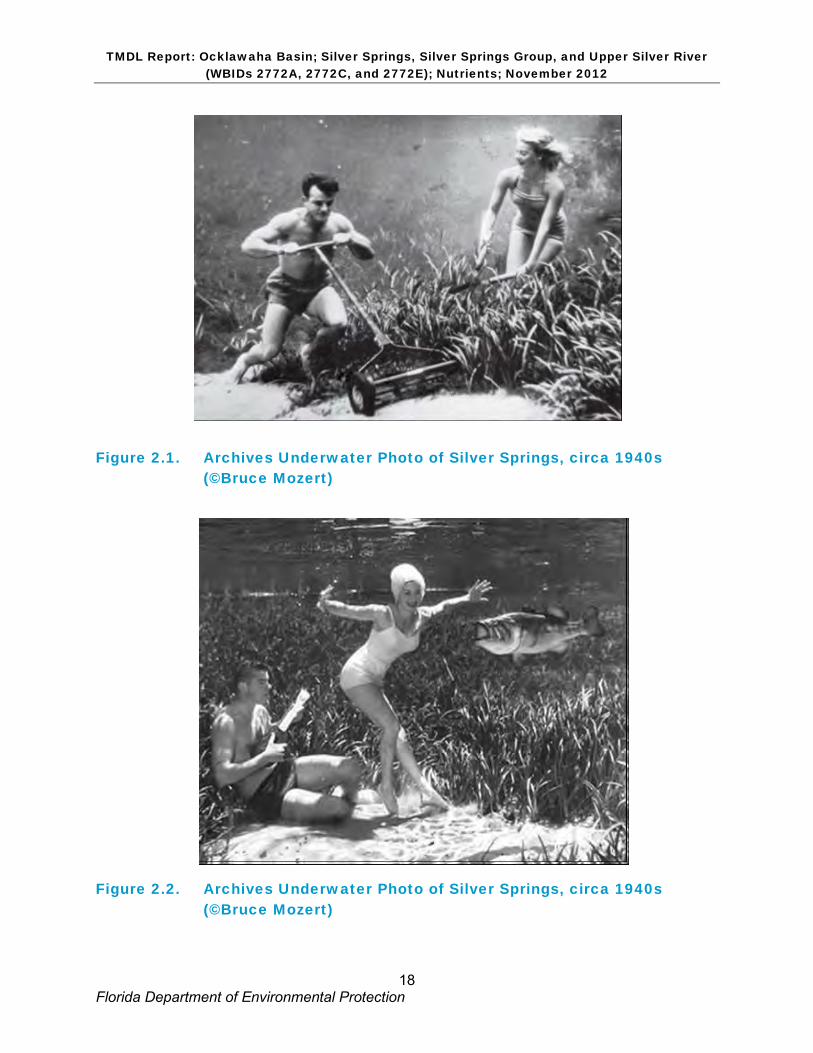
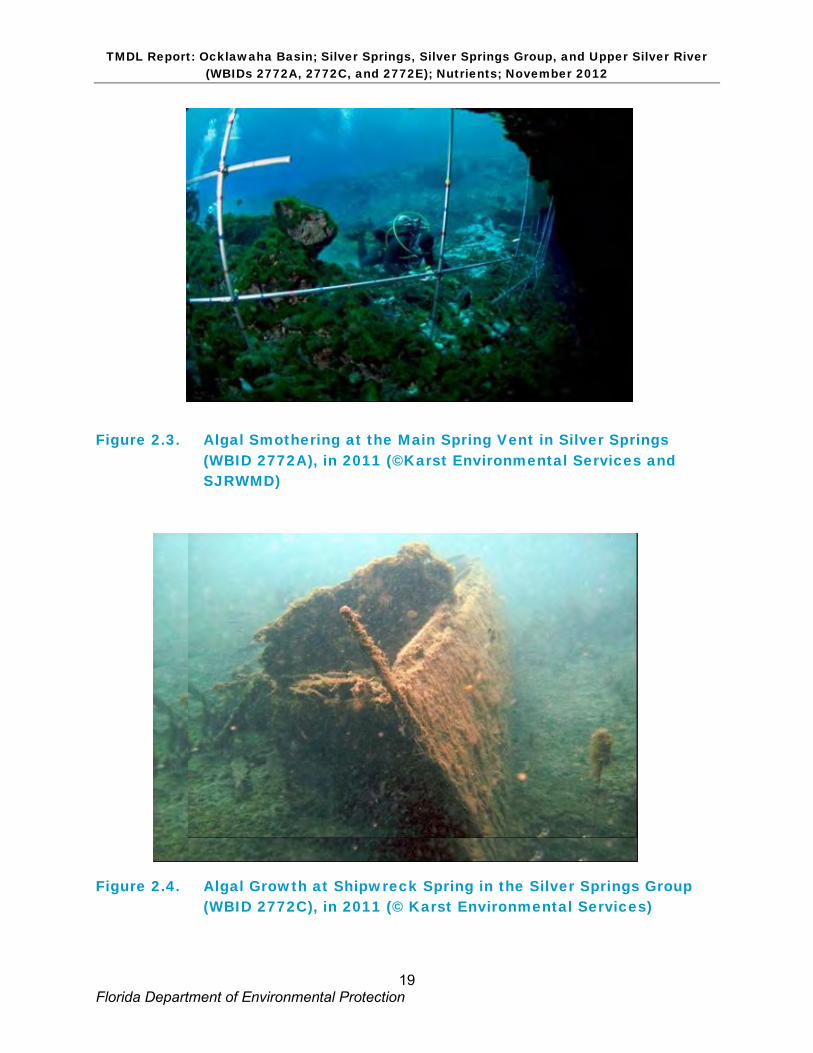
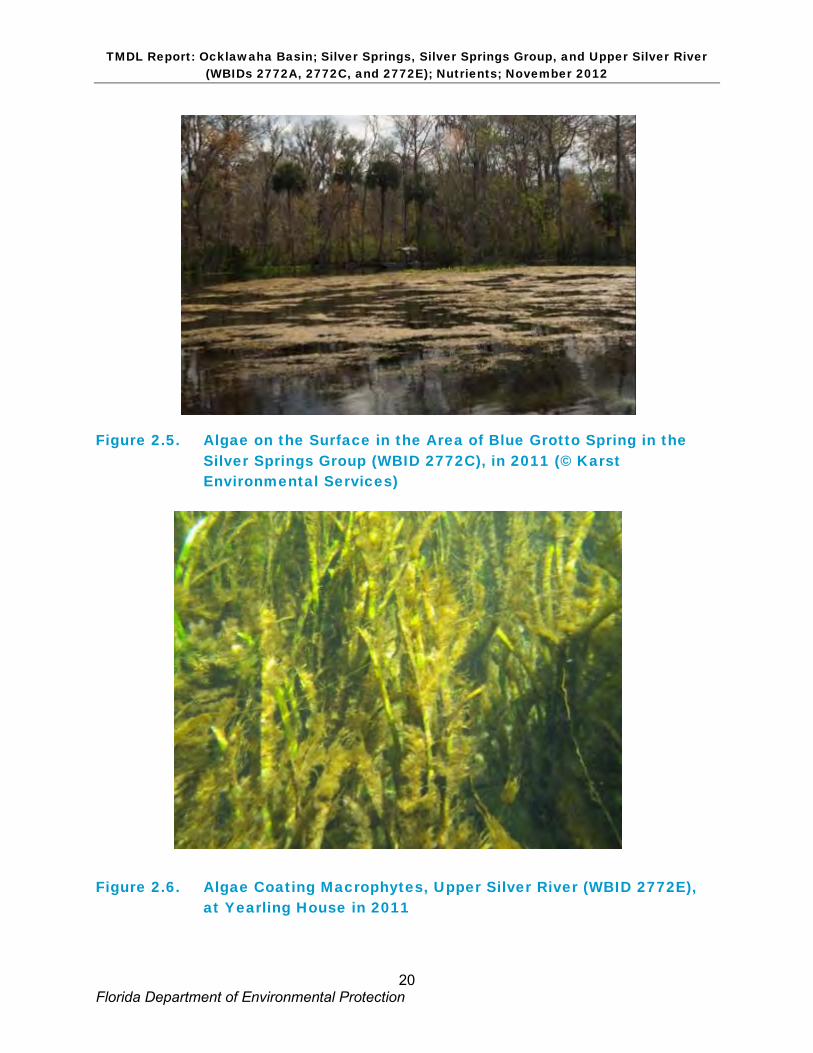
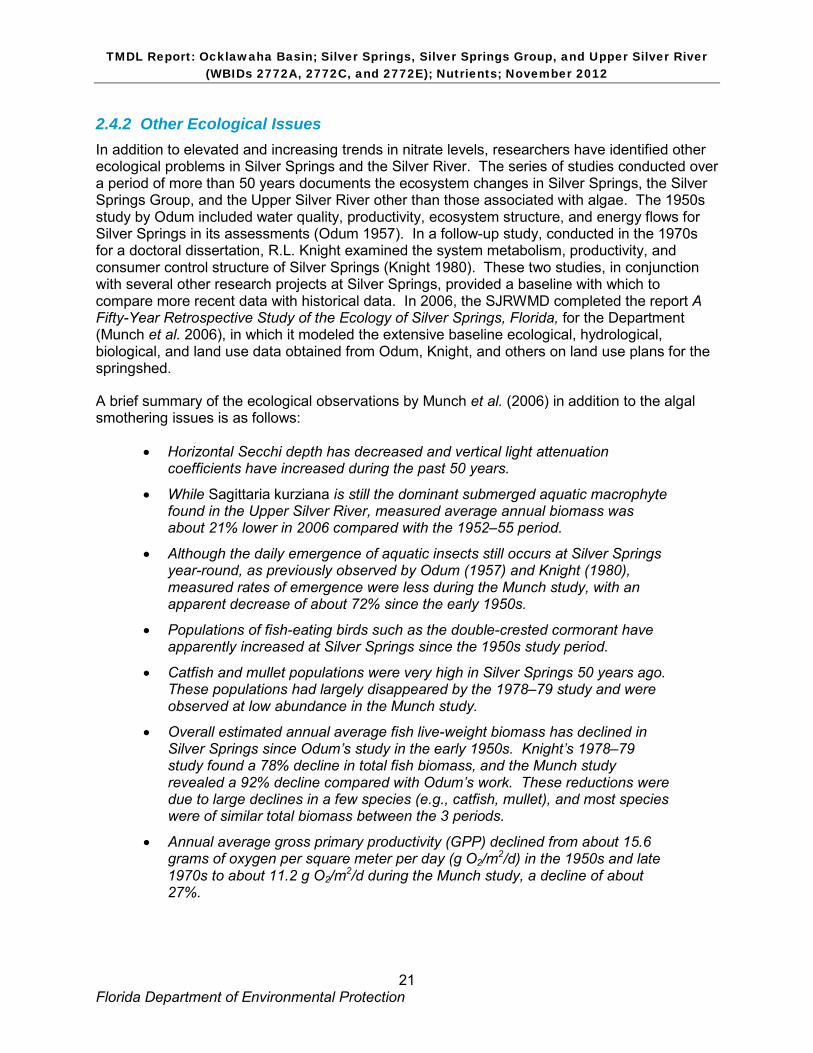
Photographic evidence of increased algal coverage in the springs and Upper Silver River further supports the shift from healthy stands of Sagittaria to smothered benthic conditions. Early tourism marketing by the Silver Springs attraction included underwater still photographs and films by Bruce Mozert and Newt Perry. These products document healthy populations of SAV and crystalline water clarity with little to no algal smothering. Recent photographs, taken within the past five years, contrast with historical photographs and document changes that have taken place in the aquatic community at the springs and in the Upper Silver River (Figures 2.1 through 2.6).
Munch et al. (2006) summarized apparent changes in SAV and algal communities over a period of approximately 50 years as follows:
• Average annual epiphytic (attached) algal biomass has increased by about 171% over the past 50 years.
• Benthic algal mass was considered too low to estimate by Odum in the early 1950s, but was noted later by Odum to be much higher in the Main Spring Boil during a 1976 class field trip to Silver Springs. The Munch study found benthic algal biomass to be comparable to macrophyte and epiphytic biomass estimates.
• Average annual plant and algal biomass increased 88% over the past 50 years, from 809 grams dry weight per square meter (g DW/m2) in 1952–55 to 1,518 g DW/m2 in 2004–05.
• Although Sagittaria kurziana was still found to be the dominant species in floating macrophyte export downstream, estimated export rates were 179% higher in the Munch study compared with Odum’s measurements during the 1952–55 period.
TMDL Report: Ocklawaha Basin; Silver Springs, Silver Springs Group, and Upper Silver River (WBIDs 2772A, 2772C, and 2772E); Nutrients; November 2012
18 Florida Department of Environmental Protection
Figure 2.1. Archives Underwater Photo of Silver Springs, circa 1940s (©Bruce Mozert)
Figure 2.2. Archives Underwater Photo of Silver Springs, circa 1940s (©Bruce Mozert)
TMDL Report: Ocklawaha Basin; Silver Springs, Silver Springs Group, and Upper Silver River (WBIDs 2772A, 2772C, and 2772E); Nutrients; November 2012
19 Florida Department of Environmental Protection
Figure 2.3. Algal Smothering at the Main Spring Vent in Silver Springs (WBID 2772A), in 2011 (©Karst Environmental Services and SJRWMD)
Figure 2.4. Algal Growth at Shipwreck Spring in the Silver Springs Group (WBID 2772C), in 2011 (© Karst Environmental Services)
TMDL Report: Ocklawaha Basin; Silver Springs, Silver Springs Group, and Upper Silver River (WBIDs 2772A, 2772C, and 2772E); Nutrients; November 2012
20 Florida Department of Environmental Protection
Figure 2.5. Algae on the Surface in the Area of Blue Grotto Spring in the Silver Springs Group (WBID 2772C), in 2011 (© Karst Environmental Services)
Figure 2.6. Algae Coating Macrophytes, Upper Silver River (WBID 2772E), at Yearling House in 2011
TMDL Report: Ocklawaha Basin; Silver Springs, Silver Springs Group, and Upper Silver River (WBIDs 2772A, 2772C, and 2772E); Nutrients; November 2012
21 Florida Department of Environmental Protection
2.4.2 Other Ecological Issues In addition to elevated and increasing trends in nitrate levels, researchers have identified other ecological problems in Silver Springs and the Silver River. The series of studies conducted over a period of more than 50 years documents the ecosystem changes in Silver Springs, the Silver Springs Group, and the Upper Silver River other than those associated with algae. The 1950s study by Odum included water quality, productivity, ecosystem structure, and energy flows for Silver Springs in its assessments (Odum 1957). In a follow-up study, conducted in the 1970s for a doctoral dissertation, R.L. Knight examined the system metabolism, productivity, and consumer control structure of Silver Springs (Knight 1980). These two studies, in conjunction with several other research projects at Silver Springs, provided a baseline with which to compare more recent data with historical data. In 2006, the SJRWMD completed the report A Fifty-Year Retrospective Study of the Ecology of Silver Springs, Florida, for the Department (Munch et al. 2006), in which it modeled the extensive baseline ecological, hydrological, biological, and land use data obtained from Odum, Knight, and others on land use plans for the springshed.
A brief summary of the ecological observations by Munch et al. (2006) in addition to the algal smothering issues is as follows:
• Horizontal Secchi depth has decreased and vertical light attenuation coefficients have increased during the past 50 years.
• While Sagittaria kurziana is still the dominant submerged aquatic macrophyte found in the Upper Silver River, measured average annual biomass was about 21% lower in 2006 compared with the 1952–55 period.
• Although the daily emergence of aquatic insects still occurs at Silver Springs year-round, as previously observed by Odum (1957) and Knight (1980), measured rates of emergence were less during the Munch study, with an apparent decrease of about 72% since the early 1950s.
• Populations of fish-eating birds such as the double-crested cormorant have apparently increased at Silver Springs since the 1950s study period.
• Catfish and mullet populations were very high in Silver Springs 50 years ago. These populations had largely disappeared by the 1978–79 study and were observed at low abundance in the Munch study.
• Overall estimated annual average fish live-weight biomass has declined in Silver Springs since Odum’s study in the early 1950s. Knight’s 1978–79 study found a 78% decline in total fish biomass, and the Munch study revealed a 92% decline compared with Odum’s work. These reductions were due to large declines in a few species (e.g., catfish, mullet), and most species were of similar total biomass between the 3 periods.
• Annual average gross primary productivity (GPP) declined from about 15.6 grams of oxygen per square meter per day (g O2/m2/d) in the 1950s and late 1970s to about 11.2 g O2/m2/d during the Munch study, a decline of about 27%.
TMDL Report: Ocklawaha Basin; Silver Springs, Silver Springs Group, and Upper Silver River (WBIDs 2772A, 2772C, and 2772E); Nutrients; November 2012
22 Florida Department of Environmental Protection
• Community respiration also declined from about 14.8 g O2/m2/d during the earlier studies to about 10.9 g O2
/m2/d during the Munch study, a 26% reduction.
• Resulting net community primary productivity declined from about 1.0 g O2/m2/d in the 1950s, to 0.80 g O2/m2/d in the late 1970s, to about 0.42 g O2/m2/d during the Munch study, a decline of about 59% over the past 50 years.
• Ecological efficiency declined from about 1.09 gram of oxygen per mol (g O2/mol) of photosynthetically active radiation (PAR) during Odum’s study to about 0.94 g O2/mol during the Munch study, a decline of about 13%.
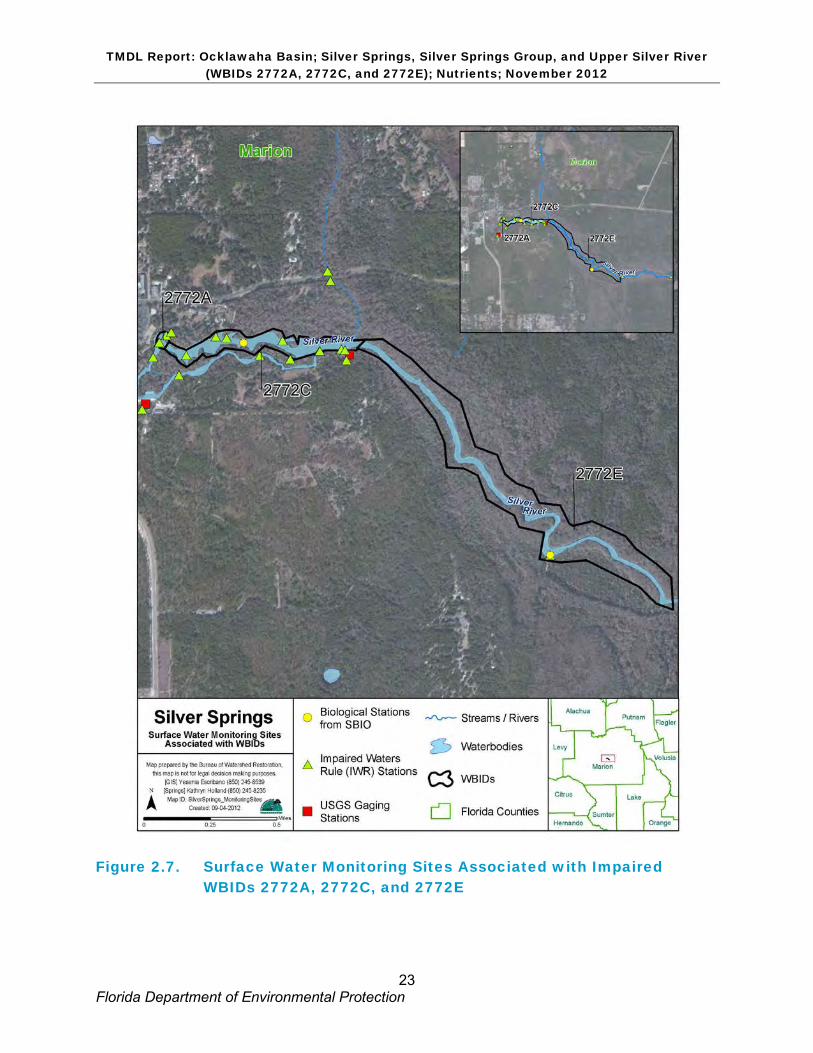
2.5 Monitoring Sites and Sampling Historical water quality data for Silver Springs are limited, but they do provide a glimpse of current versus “background” water quality. Water quality data have been collected from various locations around the springs and in the river since 1907, and the EPA Storage and Retrieval (STORET) and USGS National Water Information System (NWIS) databases contain many of these data. Figure 2.7 shows the locations of the current and past routine water quality sampling stations and biological stations monitored by the Department.
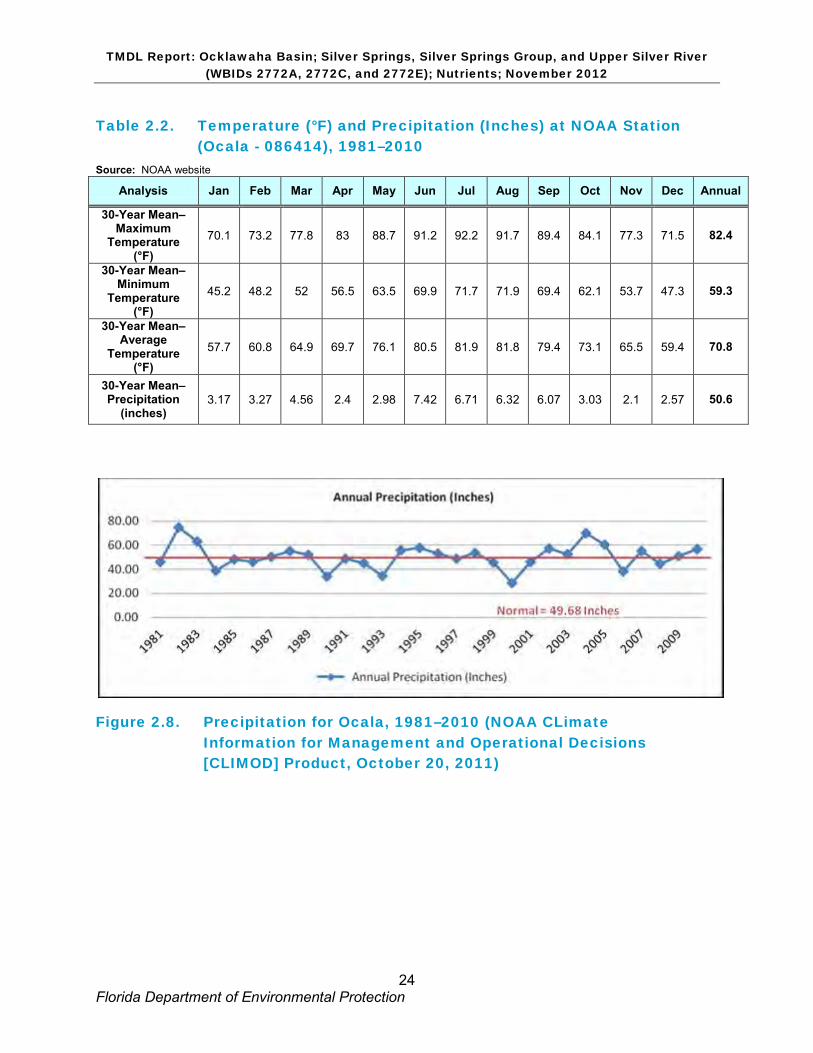
2.6 Rainfall and Temperature Data The climate in the Silver Springs area is humid subtropical, with hot, rainy summers and cool, generally dry winters. Recharge to ground water is entirely dependent on rainfall. In a typical year, more than half of the rainfall in the area occurs during the 4 months from June through September (on average about 25 inches) as a result of seasonal thunderstorms and tropical systems. The rest of the year is typically drier, averaging about 3 inches per month. Rainfall and temperature data were reviewed for the 30-year period of record from 1981–2010 (Table 2.2). Annual rainfall averages about 50.6 inches per year (in/yr) with an average air temperature of about 71oF (National Oceanic and Atmospheric Administration [NOAA] 2010).
Figure 2.8 shows the 30-year historical rainfall trend measured at Ocala. Over this period, the lowest annual rainfall of 28.58 inches occurred in 2000, and the highest annual rainfall of 74.71 inches occurred in 1982. The NOAA “normal” value for rainfall from 1981 to 2010 is 49.68 inches. Munch et al. (2006) reviewed rainfall data beginning in 1891 and noted that expected rainfall at this station has declined since 1980. The annual average rainfall from 1891 to 1980 was 53.30 inches.
TMDL Report: Ocklawaha Basin; Silver Springs, Silver Springs Group, and Upper Silver River (WBIDs 2772A, 2772C, and 2772E); Nutrients; November 2012
23 Florida Department of Environmental Protection
Figure 2.7. Surface Water Monitoring Sites Associated with Impaired WBIDs 2772A, 2772C, and 2772E
TMDL Report: Ocklawaha Basin; Silver Springs, Silver Springs Group, and Upper Silver River (WBIDs 2772A, 2772C, and 2772E); Nutrients; November 2012
24 Florida Department of Environmental Protection
Table 2.2. Temperature (°F) and Precipitation (Inches) at NOAA Station (Ocala - 086414), 1981–2010
Source: NOAA website
Analysis Jan Feb Mar Apr May Jun Jul Aug Sep Oct Nov Dec Annual
30-Year Mean–Maximum
Temperature (°F)
70.1 73.2 77.8 83 88.7 91.2 92.2 91.7 89.4 84.1 77.3 71.5 82.4
30-Year Mean– Minimum
Temperature (°F)
45.2 48.2 52 56.5 63.5 69.9 71.7 71.9 69.4 62.1 53.7 47.3 59.3
30-Year Mean– Average
Temperature (°F)
57.7 60.8 64.9 69.7 76.1 80.5 81.9 81.8 79.4 73.1 65.5 59.4 70.8
30-Year Mean–Precipitation
(inches) 3.17 3.27 4.56 2.4 2.98 7.42 6.71 6.32 6.07 3.03 2.1 2.57 50.6
Figure 2.8. Precipitation for Ocala, 1981–2010 (NOAA CLimate Information for Management and Operational Decisions [CLIMOD] Product, October 20, 2011)
TMDL Report: Ocklawaha Basin; Silver Springs, Silver Springs Group, and Upper Silver River (WBIDs 2772A, 2772C, and 2772E); Nutrients; November 2012
25 Florida Department of Environmental Protection
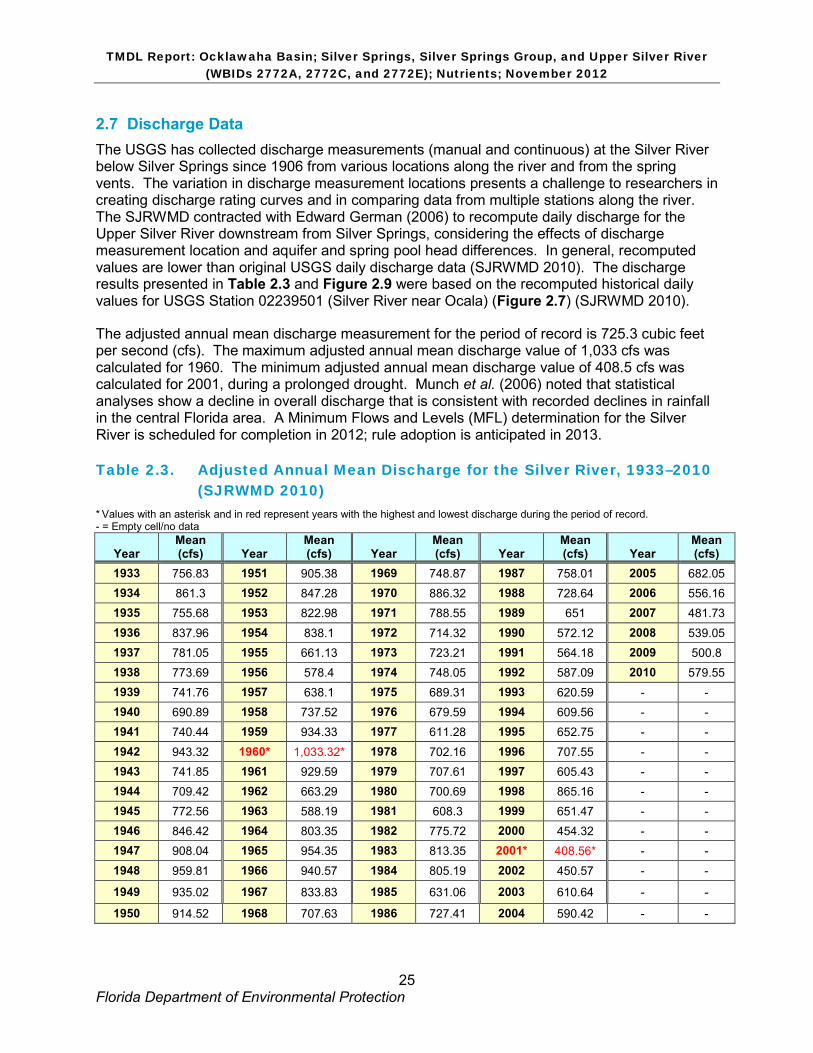
2.7 Discharge Data The USGS has collected discharge measurements (manual and continuous) at the Silver River below Silver Springs since 1906 from various locations along the river and from the spring vents. The variation in discharge measurement locations presents a challenge to researchers in creating discharge rating curves and in comparing data from multiple stations along the river. The SJRWMD contracted with Edward German (2006) to recompute daily discharge for the Upper Silver River downstream from Silver Springs, considering the effects of discharge measurement location and aquifer and spring pool head differences. In general, recomputed values are lower than original USGS daily discharge data (SJRWMD 2010). The discharge results presented in Table 2.3 and Figure 2.9 were based on the recomputed historical daily values for USGS Station 02239501 (Silver River near Ocala) (Figure 2.7) (SJRWMD 2010).
The adjusted annual mean discharge measurement for the period of record is 725.3 cubic feet per second (cfs). The maximum adjusted annual mean discharge value of 1,033 cfs was calculated for 1960. The minimum adjusted annual mean discharge value of 408.5 cfs was calculated for 2001, during a prolonged drought. Munch et al. (2006) noted that statistical analyses show a decline in overall discharge that is consistent with recorded declines in rainfall in the central Florida area. A Minimum Flows and Levels (MFL) determination for the Silver River is scheduled for completion in 2012; rule adoption is anticipated in 2013.
Table 2.3. Adjusted Annual Mean Discharge for the Silver River, 1933–2010 (SJRWMD 2010)
* Values with an asterisk and in red represent years with the highest and lowest discharge during the period of record. - = Empty cell/no data
Year Mean (cfs) Year
Mean (cfs) Year
Mean (cfs) Year
Mean (cfs) Year
Mean (cfs)
1933 756.83 1951 905.38 1969 748.87 1987 758.01 2005 682.05 1934 861.3 1952 847.28 1970 886.32 1988 728.64 2006 556.16 1935 755.68 1953 822.98 1971 788.55 1989 651 2007 481.73 1936 837.96 1954 838.1 1972 714.32 1990 572.12 2008 539.05 1937 781.05 1955 661.13 1973 723.21 1991 564.18 2009 500.8 1938 773.69 1956 578.4 1974 748.05 1992 587.09 2010 579.55 1939 741.76 1957 638.1 1975 689.31 1993 620.59 - - 1940 690.89 1958 737.52 1976 679.59 1994 609.56 - - 1941 740.44 1959 934.33 1977 611.28 1995 652.75 - - 1942 943.32 1960* 1,033.32* 1978 702.16 1996 707.55 - - 1943 741.85 1961 929.59 1979 707.61 1997 605.43 - - 1944 709.42 1962 663.29 1980 700.69 1998 865.16 - - 1945 772.56 1963 588.19 1981 608.3 1999 651.47 - - 1946 846.42 1964 803.35 1982 775.72 2000 454.32 - - 1947 908.04 1965 954.35 1983 813.35 2001* 408.56* - - 1948 959.81 1966 940.57 1984 805.19 2002 450.57 - -
1949 935.02 1967 833.83 1985 631.06 2003 610.64 - -
1950 914.52 1968 707.63 1986 727.41 2004 590.42 - -

TMDL Report: Ocklawaha Basin; Silver Springs, Silver Springs Group, and Upper Silver River (WBIDs 2772A, 2772C, and 2772E); Nutrients; November 2012
26 Florida Department of Environmental Protection
Figure 2.9. Adjusted Annual Mean Discharge Data for the Silver River, 1933–2010 (SJRWMD)
2.8 Monitoring Results
2.8.1 Nitrogen Nitrate has been measured at Silver Springs since 1907 by the USGS, the SJRWMD, and the Department. Publications by all 3 agencies document a clear increasing trend in nitrate levels over time (Ferguson et al. 1947; Rosenau et al. 1977; Osborn et al. 2002; Harrington et al. 2010). The nitrate nitrogen concentration has increased from an average of about 0.38 to 1.05 mg/L over the past 50 years (Munch et al. 2006). An analysis of 328 private drinking water well samples collected by FDOH in the 100-year capture zone revealed nitrate concentrations higher than 1 mg/L in 66% of the wells, with 23 well samples having nitrate concentrations higher than 10 mg/L. The higher nitrate concentrations were detected in wells in the central and western regions of the 100-year capture zone (Harrington et al. 2010). Median nitrate concentrations from spring samples taken by the Department between 2001 and 2006 were highest in 3 springs: Blue Grotto (1.5 mg/L), followed by Catfish Reception Hall (1.4 mg/L) and Main Spring (1.1 mg/L). Figure 1.3 shows these spring locations.
Figures 2.10 through 2.12 and Tables 2.4 through 2.6 depict nitrate and total nitrogen (TN) data for Silver Springs, the Silver Springs Group, and the Upper Silver River, respectively. The sum of nitrate (NO3) and nitrite (NO2) is used below to represent nitrate due to minimal concentrations of nitrite. In all cases, the comparative data show that nitrate is the predominant form of nitrogen. Tables 2.4 through 2.6 provide the annual nitrate summary data for the 2000–11 period used in developing the TMDL.
TMDL Report: Ocklawaha Basin; Silver Springs, Silver Springs Group, and Upper Silver River (WBIDs 2772A, 2772C, and 2772E); Nutrients; November 2012
27 Florida Department of Environmental Protection
Figure 2.10. Nitrate and TN Trends for Silver Springs (WBID 2772A), 1964–2011
Table 2.4. Annual Nitrate and TN Concentrations for Silver Springs (WBID 2772A), 2000–11
n = Number of samples; NA = Not available; Min = Minimum; Max = Maximum
Year NO3NO2-N
n
NO3NO2-N Mean (mg/L)
NO3NO2-N Median (mg/L)
NO3NO2-N Min
(mg/L)
NO3NO2-N Max
(mg/L) TN n
TN Mean (mg/L)
TN Median (mg/L)
TN Min
(mg/L)
TN Max
(mg/L) 2000 5 0.93 0.92 0.90 0.96 NA NA NA NA NA 2001 13 0.90 0.91 0.65 1.10 2 1.12 1.12 0.97 1.26 2002 8 0.95 0.97 0.81 1.00 4 1.04 1.03 1.00 1.10 2003 7 1.11 1.10 0.96 1.20 4 1.18 1.21 1.02 1.26 2004 4 1.10 1.10 1.00 1.20 4 1.18 1.19 1.06 1.26 2005 9 1.19 1.20 0.96 1.55 4 1.22 1.21 1.16 1.28
2006 9 1.08 1.10 0.91 1.27 6 1.18 1.15 1.07 1.36 2007 8 1.09 1.03 0.90 1.40 4 1.17 1.11 0.99 1.48 2008 12 1.27 1.20 1.11 1.48 4 1.36 1.33 1.28 1.48 2009 16 1.15 1.10 0.90 1.59 4 1.14 1.15 1.08 1.18 2010 8 1.16 1.15 0.96 1.36 4 1.25 1.24 1.19 1.32 2011 1 1.20 1.20 1.20 1.20 NA NA NA NA NA
0.0
0.5
1.0
1.5
2.0
2.5
3.0
3.5
Tota
l Nitr
ogen
(as
N m
g/L)
Nitr
ate
(as
N m
g/L)
NITRATE AND TOTAL NITROGEN TRENDS (1964-2011) SILVER SPRING MAIN - WBID 2772A
Nitrate Total Nitrogen Nitrate Trend y = 4.777E-05x - 0.7551R2 = 0.69
TMDL Report: Ocklawaha Basin; Silver Springs, Silver Springs Group, and Upper Silver River (WBIDs 2772A, 2772C, and 2772E); Nutrients; November 2012
28 Florida Department of Environmental Protection
Figure 2.11. Nitrate and TN Trends for the Silver Springs Group (WBID 2772C), 1979–2011
Table 2.5. Annual Nitrate and TN Concentrations for the Silver Springs Group (WBID 2772C), 2000–11
n = Number of samples; NA = Not available; Min = Minimum; Max = Maximum
Year NO3NO2-N
n
NO3NO2-N Mean (mg/L)
NO3NO2-N Median (mg/L)
NO3NO2-N Min
(mg/L)
NO3NO2-N Max
(mg/L) TN n
TN Mean (mg/L)
TN Median (mg/L)
TN Min
(mg/L)
TN Max
(mg/L) 2000 NA NA NA NA NA NA NA NA NA NA
2001 6 1.35 1.30 1.30 1.50 NA NA NA NA NA 2002 10 1.23 1.20 1.00 1.40 NA NA NA NA NA 2003 10 1.28 1.30 1.10 1.40 NA NA NA NA NA 2004 15 1.38 1.40 0.96 1.60 2 1.65 1.65 1.6 1.7 2005 16 1.71 1.61 1.15 3.20 NA NA NA NA NA 2006 41 1.40 1.41 0.87 1.89 NA NA NA NA NA
2007 18 1.39 1.50 0.88 1.60 NA NA NA NA NA 2008 14 1.58 1.60 1.50 1.71 NA NA NA NA NA 2009 20 1.60 1.60 1.45 1.76 NA NA NA NA NA 2010 7 1.60 1.60 1.55 1.70 NA NA NA NA NA 2011 8 1.53 1.50 1.20 1.80 NA NA NA NA NA
0.0
0.5
1.0
1.5
2.0
2.5
3.0
3.5To
tal N
itrog
en (a
s N
mg/
L)N
itrat
e (a
s N
mg/
L)
NITRATE AND TOTAL NITROGEN TRENDS (1984-2011) SILVER SPRINGS GROUP - WBID 2772C
Nitrate Total Nitrogen Nitrate Trendy = 8.920E-05x - 2.012 R2 =0.57
TMDL Report: Ocklawaha Basin; Silver Springs, Silver Springs Group, and Upper Silver River (WBIDs 2772A, 2772C, and 2772E); Nutrients; November 2012
29 Florida Department of Environmental Protection
Figure 2.12. Nitrate and TN Trends for the Upper Silver River (WBID 2772E), 1983–2011
Table 2.6. Annual Nitrate and TN Concentrations for the Upper Silver River (WBID 2772E), 2000–11
n = Number of samples; NA = Not available; Min = Minimum; Max = Maximum
Year NO3NO2-N
n
NO3NO2-N Mean (mg/L)
NO3NO2-N Median (mg/L)
NO3NO2-N Min
(mg/L)
NO3NO2-N Max
(mg/L) TN n
TN Mean (mg/L)
TN Median (mg/L)
TN Min
(mg/L)
TN Max
(mg/L) 2000 NA NA NA NA NA NA NA NA NA NA 2001 2 1.00 1.00 1.00 1.00 NA NA NA NA NA 2002 3 1.00 0.98 0.97 1.05 NA NA NA NA NA 2003 NA NA NA NA NA NA NA NA NA NA 2004 NA NA NA NA NA NA NA NA NA NA 2005 NA NA NA NA NA NA NA NA NA NA
2006 NA NA NA NA NA NA NA NA NA NA 2007 NA NA NA NA NA NA NA NA NA NA 2008 NA NA NA NA NA NA NA NA NA NA 2009 NA NA NA NA NA NA NA NA NA NA 2010 NA NA NA NA NA NA NA NA NA NA 2011 1 1.3 1.3 1.3 1.3 NA NA NA NA NA
0.0
0.5
1.0
1.5
2.0
2.5
3.0
3.5To
tal N
itrog
en (a
s N
mg/
L)N
itrat
e (a
s N
mg/
L)
NITRATE AND TOTAL NITROGEN TRENDS (1983-2011) SILVER RIVER UPPER - WBID 2772E
Nitrate Total Nitrogen Nitrate Trend y = 3.061E-05x - 0.1364R2 = 0.44
0.0
0.5
1.0
1.5
2.0
2.5
3.0
3.5To
tal N
itrog
en (a
s N
mg/
L)N
itrat
e (a
s N
mg/
L)
NITRATE AND TOTAL NITROGEN TRENDS (1983-2011) SILVER RIVER UPPER - WBID 2772E
Nitrate Total Nitrogen Nitrate Trend y = 3.061E-05x - 0.1364R2 = 0.44
TMDL Report: Ocklawaha Basin; Silver Springs, Silver Springs Group, and Upper Silver River (WBIDs 2772A, 2772C, and 2772E); Nutrients; November 2012
30 Florida Department of Environmental Protection
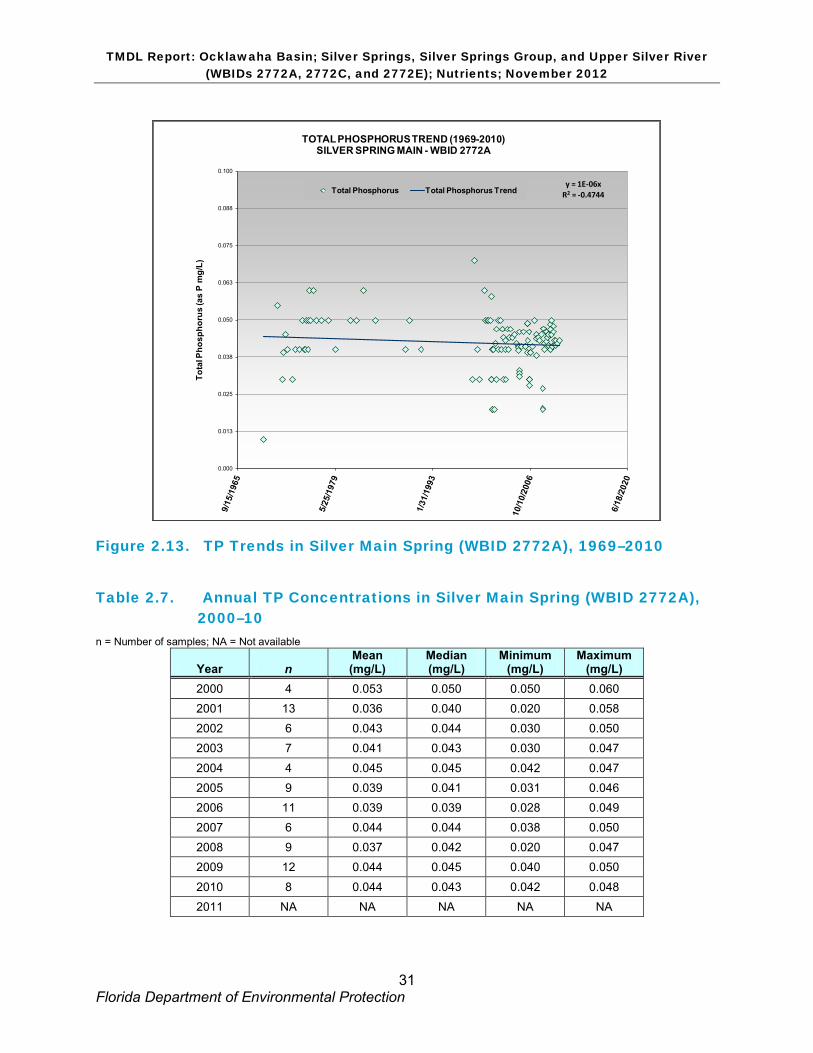
Plotted data from Silver Main Spring (Figure 2.13) show that nitrate levels have steadily risen from 1964 to the present. Nitrate levels exceeded 1.0 mg/L around 2002 and continue to increase. The mean nitrate level at Silver Main in 2010 was about 1.2 mg/L. Phelps (2004) has also reported increased nitrate levels in samples from Silver Main; concentrations have gone from less than 0.05 mg/L in the 1960s to about 1.0 mg/L in 2003.
The data shown in Figure 2.11 indicate that median nitrate levels in 2010 in the Silver Springs Group segment (WBID 2772C; 1.6 mg/L median) were higher than those in the upstream Silver Springs segment (WBID 2772A; 1.2 mg/L median), which agrees with the earlier observation that the highest individual spring concentrations are from springs vents within the Silver Springs Group. Knowles et al. (2010) also noted that the highest nitrate-N concentration was measured in water from the farthest downstream vent in the group.
Figure 2.12 and Table 2.6 depict the TN and nitrate data for the Upper Silver River. The nitrate trend in this WBID is similar to Silver Main and the Silver Springs Group, as the springs are the source of water for the Upper Silver River WBID. The attenuation of nitrate by vegetation and denitrification have resulted in a lower concentration overall, but values are still elevated.
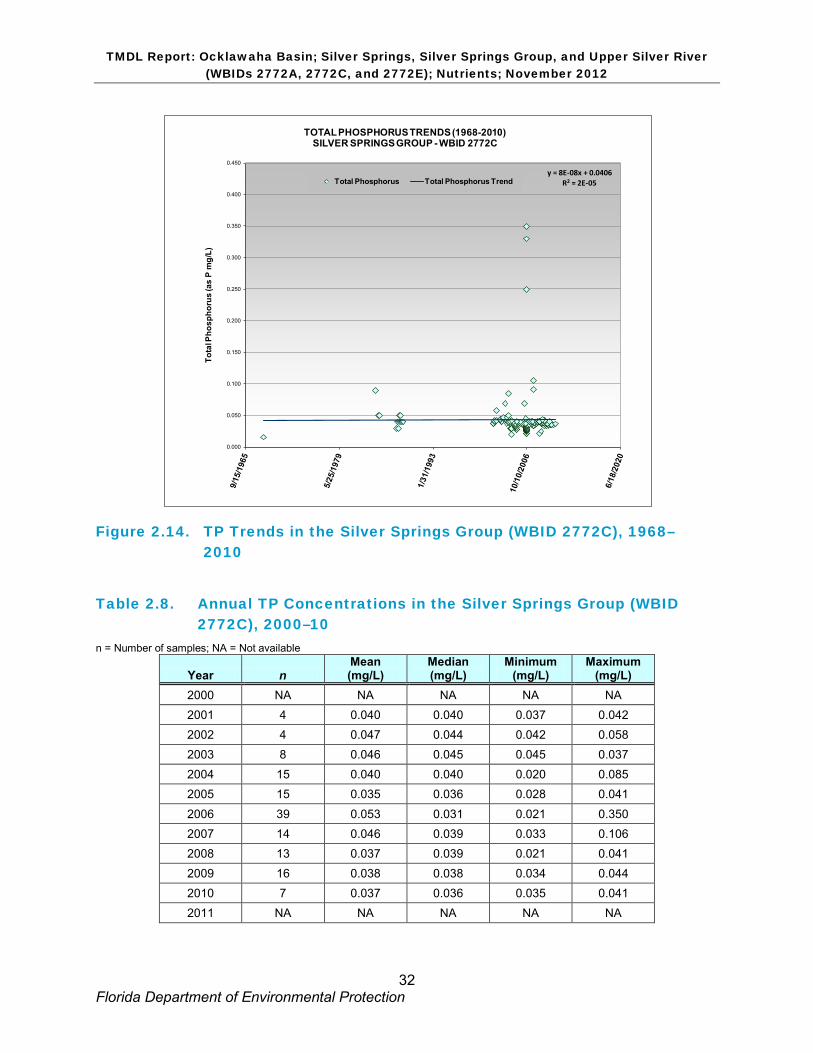
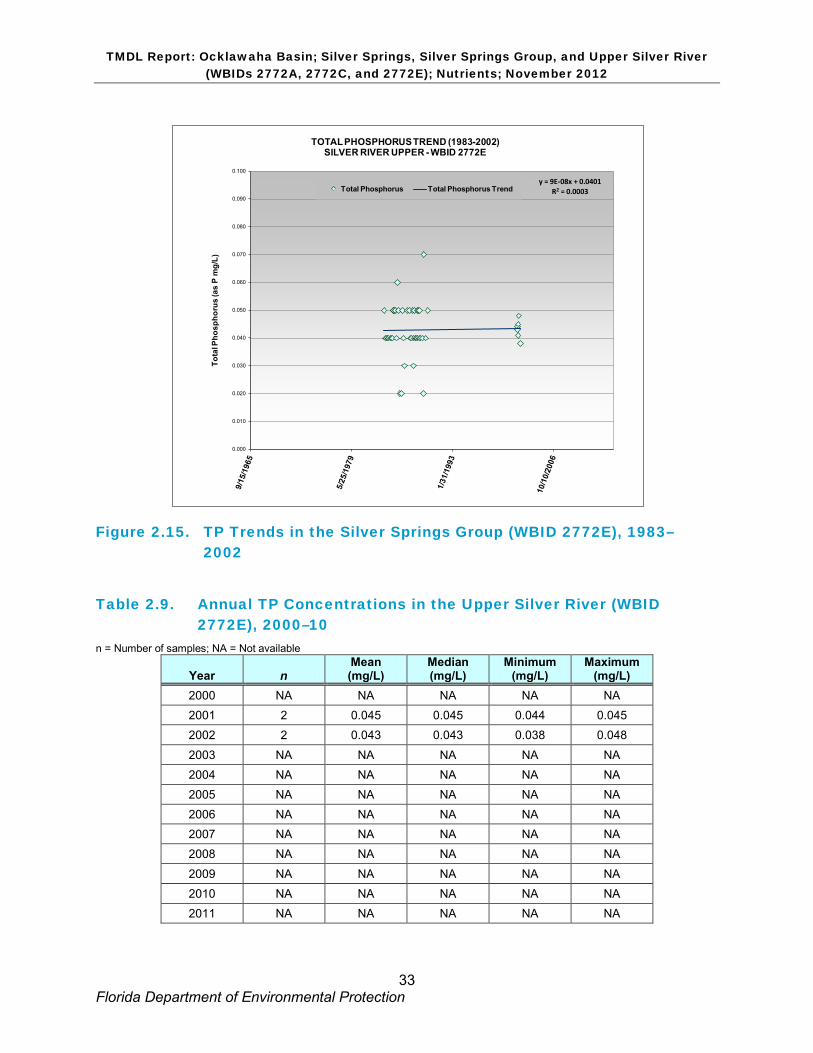
2.8.2 Phosphorus Figures 2.13 through 2.15 and Tables 2.7 through 2.9 depict TP data for Silver Main, the Silver Springs Group, and the Upper Silver River, respectively. While one anomalously high value of 2.1 mg/L was detected in Catfish Convention Hall in 2006, in general, median phosphorus levels have not varied greatly over the period of record and remain relatively consistent with background ground water concentrations in the region (0.03 to 0.04 mg/L). There was no correlation between phosphorus and nitrate values from 2000 through 2010.
TMDL Report: Ocklawaha Basin; Silver Springs, Silver Springs Group, and Upper Silver River (WBIDs 2772A, 2772C, and 2772E); Nutrients; November 2012
31 Florida Department of Environmental Protection
Figure 2.13. TP Trends in Silver Main Spring (WBID 2772A), 1969–2010
Table 2.7. Annual TP Concentrations in Silver Main Spring (WBID 2772A), 2000–10
n = Number of samples; NA = Not available
Year n Mean (mg/L)
Median (mg/L)
Minimum (mg/L)
Maximum (mg/L)
2000 4 0.053 0.050 0.050 0.060 2001 13 0.036 0.040 0.020 0.058 2002 6 0.043 0.044 0.030 0.050 2003 7 0.041 0.043 0.030 0.047
2004 4 0.045 0.045 0.042 0.047 2005 9 0.039 0.041 0.031 0.046 2006 11 0.039 0.039 0.028 0.049 2007 6 0.044 0.044 0.038 0.050 2008 9 0.037 0.042 0.020 0.047 2009 12 0.044 0.045 0.040 0.050
2010 8 0.044 0.043 0.042 0.048 2011 NA NA NA NA NA
y = 1E-06xR2 = -0.4744
0.000
0.013
0.025
0.038
0.050
0.063
0.075
0.088
0.100
Tota
l Pho
spho
rus
(as
P m
g/L)
TOTAL PHOSPHORUS TREND (1969-2010) SILVER SPRING MAIN - WBID 2772A
Total Phosphorus Total Phosphorus Trend
TMDL Report: Ocklawaha Basin; Silver Springs, Silver Springs Group, and Upper Silver River (WBIDs 2772A, 2772C, and 2772E); Nutrients; November 2012
32 Florida Department of Environmental Protection
Figure 2.14. TP Trends in the Silver Springs Group (WBID 2772C), 1968–2010
Table 2.8. Annual TP Concentrations in the Silver Springs Group (WBID 2772C), 2000–10
n = Number of samples; NA = Not available
Year n Mean (mg/L)
Median (mg/L)
Minimum (mg/L)
Maximum (mg/L)
2000 NA NA NA NA NA 2001 4 0.040 0.040 0.037 0.042 2002 4 0.047 0.044 0.042 0.058 2003 8 0.046 0.045 0.045 0.037 2004 15 0.040 0.040 0.020 0.085 2005 15 0.035 0.036 0.028 0.041
2006 39 0.053 0.031 0.021 0.350 2007 14 0.046 0.039 0.033 0.106 2008 13 0.037 0.039 0.021 0.041 2009 16 0.038 0.038 0.034 0.044 2010 7 0.037 0.036 0.035 0.041 2011 NA NA NA NA NA
y = 8E-08x + 0.0406R2 = 2E-05
0.000
0.050
0.100
0.150
0.200
0.250
0.300
0.350
0.400
0.450
Tota
l Pho
spho
rus
(as
P m
g/L)
TOTAL PHOSPHORUS TRENDS (1968-2010) SILVER SPRINGS GROUP - WBID 2772C
Total Phosphorus Total Phosphorus Trend
TMDL Report: Ocklawaha Basin; Silver Springs, Silver Springs Group, and Upper Silver River (WBIDs 2772A, 2772C, and 2772E); Nutrients; November 2012
33 Florida Department of Environmental Protection
Figure 2.15. TP Trends in the Silver Springs Group (WBID 2772E), 1983–2002
Table 2.9. Annual TP Concentrations in the Upper Silver River (WBID 2772E), 2000–10
n = Number of samples; NA = Not available
Year n Mean (mg/L)
Median (mg/L)
Minimum (mg/L)
Maximum (mg/L)
2000 NA NA NA NA NA 2001 2 0.045 0.045 0.044 0.045 2002 2 0.043 0.043 0.038 0.048
2003 NA NA NA NA NA 2004 NA NA NA NA NA 2005 NA NA NA NA NA 2006 NA NA NA NA NA 2007 NA NA NA NA NA 2008 NA NA NA NA NA
2009 NA NA NA NA NA 2010 NA NA NA NA NA 2011 NA NA NA NA NA
y = 9E-08x + 0.0401R2 = 0.0003
0.000
0.010
0.020
0.030
0.040
0.050
0.060
0.070
0.080
0.090
0.100
Tota
l Pho
spho
rus
(as
P m
g/L)
TOTAL PHOSPHORUS TREND (1983-2002) SILVER RIVER UPPER - WBID 2772E
Total Phosphorus Total Phosphorus Trend
TMDL Report: Ocklawaha Basin; Silver Springs, Silver Springs Group, and Upper Silver River (WBIDs 2772A, 2772C, and 2772E); Nutrients; November 2012
34 Florida Department of Environmental Protection
Chapter 3. DESCRIPTION OF APPLICABLE WATER QUALITY STANDARDS AND TARGETS 3.1 Classification of the Waterbody and Criteria Applicable to the TMDL Florida’s surface waters are protected for five designated use classifications, as follows:
Class I Potable water supplies Class II Shellfish propagation or harvesting Class III Recreation, propagation, and maintenance of a healthy, well-
balanced population of fish and wildlife Class IV Agricultural water supplies Class V Navigation, utility, and industrial use (there are no state waters
currently in this class) Silver Springs (WBID 2772A), the Silver Springs Group (WBID 2772C), and the Upper Silver River (WBID 2772E) are Class III fresh waterbodies (with designated uses of recreation, propagation and maintenance of a healthy, well-balanced population of fish and wildlife). The Class III freshwater quality criterion applicable to the impairment addressed by this TMDL is excessive nutrients, which have been demonstrated to adversely affect flora or fauna.
3.2 Applicable Water Quality Standards and Numeric Water Quality Targets
3.2.1 Nutrients Thresholds of nutrient impairment for streams are interpreted in the IWR, Section 62-303.351, F.A.C. (Nutrients in Streams), to include stream segments if an imbalance of flora or fauna occurs due to nutrient enrichment. This imbalance includes algal blooms, changes in alga species richness, excessive macrophyte growth, a decrease in the areal coverage or density of seagrasses or other SAV, and excessive diel oxygen variation.
For Silver Springs, the Silver Springs Group, and the Upper Silver River, benthic macroalgae mats and epiphytic algae growing on macrophytes were shown to be a significant problem. Algal growth causes a variety of ecological impairments, including, but not limited to, habitat smothering, the provision of nutrition and habitat for pathogenic bacteria, the production of toxins that may affect biota, the reduction of oxygen levels, and an increase in diurnal swings of the dissolved oxygen (DO) regime in the stream. Macroalgae mats can produce human health problems, foul beaches, inhibit navigation, and reduce the aesthetic value of clear springs or stream runs.
Ongoing research on many Florida springs, including Silver Springs, has resulted in significant progress in understanding the threshold concentrations of nitrogen or phosphorus that cause nuisance macroalgae growth (Stevenson et al. 2007). Macroalgae may sequester ground water sources of nutrients or sediment nutrients that are not measured with surface water sampling. In the case of Silver Springs, the Silver Springs Group, and the Upper Silver River, TP concentrations average about 0.03 to 0.04 mg/L, within the range of natural background levels. Additionally, the average range of TP in the 3 impaired WBIDs is below the 0.065 to 0.09 mg/L concentration range shown to contribute to biological impairments (Hallas and Magley 2008; Gao 2007). As nitrate is the dominant form of nitrogen in the Silver River system based on
TMDL Report: Ocklawaha Basin; Silver Springs, Silver Springs Group, and Upper Silver River (WBIDs 2772A, 2772C, and 2772E); Nutrients; November 2012
35 Florida Department of Environmental Protection
concentration, the nutrient linked to the algal growth in WBIDs 2772A, 2772C, and 2772E is nitrate nitrogen.
Chapter 5 discusses the NO3 nutrient impairment and the setting of the TMDL target concentration of NO3.
3.2.2 Outstanding Florida Water Designation The Outstanding Florida Water (OFW) criterion in Section 62-302.700, F.A.C., requires no degradation of water quality for Special Waters, which include the Silver River and much of its receiving waterbody, the Ocklawaha River. The Silver River was designated in 1987 as worthy of special protection because of its natural attributes. At the time of the OFW designation, nitrate concentrations in Silver Springs were already significantly elevated (Figures 2.10 through 2.12).
TMDL Report: Ocklawaha Basin; Silver Springs, Silver Springs Group, and Upper Silver River (WBIDs 2772A, 2772C, and 2772E); Nutrients; November 2012
36 Florida Department of Environmental Protection
Chapter 4: ASSESSMENT OF SOURCES 4.1 Types of Sources An important part of the TMDL analysis is the identification of pollutant source categories, source subcategories, or individual sources of nutrients in the watershed and the magnitude of pollutant loading contributed by each of these sources. Sources are broadly classified as either “point sources” or “nonpoint sources.” Historically, the term “point sources” has meant discharges to surface waters that typically have a continuous flow via a discernible, confined, and discrete conveyance, such as a pipe. Domestic and industrial wastewater treatment facilities (WWTFs) discharging directly to surface waters are examples of traditional point sources. In contrast, the term “nonpoint sources” was used to describe intermittent, rainfall-driven, diffuse sources of pollution associated with everyday human activities and those sources that do not directly discharge to an impaired surface water, including runoff from urban land uses, wastewater treatment sites, stormwater drainage wells, agriculture, silviculture, mining, discharges from failing septic systems, and atmospheric deposition.
However, the 1987 amendments to the Clean Water Act redefined certain nonpoint sources of surface water pollution as point sources subject to regulation under the EPA’s National Pollutant Discharge Elimination System (NPDES) Program. These nonpoint sources included certain urban stormwater discharges to surface water, such as those from local government master drainage systems, construction sites over five acres, and a wide variety of industries (see Appendix A for background information on the federal and state stormwater programs).
To be consistent with Clean Water Act definitions, the term “point source” will be used to describe traditional point sources (such as domestic and industrial wastewater discharges to surface water) and stormwater system discharges to surface water that require an NPDES stormwater permit when allocating pollutant load reductions required by a TMDL (see Section 6.1). However, the methodologies used to estimate nonpoint source loads do not distinguish between NPDES stormwater discharges and non-NPDES stormwater discharges, and as such, this source assessment section does not make any distinction between the two types of stormwater.
4.2 Potential Nitrate Sources in the Silver Springs Contributing Area Information on the ratio of stable isotopes of nitrogen (δ15N/ δ14N) can provide information about the sources of nitrate in springs. Values less than 6 per mil (i.e., parts per thousand) are generally indicative of inorganic fertilizers, while values greater than 9 per mil indicate organic nitrogen from human or animal waste (Katz et al. 1999).
The results of several isotope studies indicate that the nitrate in the springs is from a combination of inorganic and organic sources of nitrogen. These studies also documented seasonal fluctuations that indicated changes in the source type (Phelps 2004; Albertin 2009; Knowles et al. 2010). While nitrate occurs naturally in the environment through nitrogen fixation, bacterial processes, and lightning, the elevated and increasing levels of nitrate in the environment are attributable to anthropogenic sources. Anthropogenic sources ofnitrate from an inorganic origin include fertilizer applied to agricultural fields, yards, and golf courses. Anthropogenic sources of nitrate derived from organic material include domestic wastewater and residuals, septic tank effluent, and animal waste derived from equine and cow/calf operations.
TMDL Report: Ocklawaha Basin; Silver Springs, Silver Springs Group, and Upper Silver River (WBIDs 2772A, 2772C, and 2772E); Nutrients; November 2012
37 Florida Department of Environmental Protection
4.2.1 Wastewater and Stormwater Sources Facilities that discharge wastewater must obtain permits from the Department, and facilities that discharge to surface water must have federal NPDES permits. All stormwater discharges from facilities or government entities of a certain size also must have NPDES permits. There are no permitted wastewater facilities that discharge treated water directly to the impaired surface waters addressed in this TMDL, and only a small amount of the stormwater from permitted wastewater and stormwater facilities in the 100-year capture zone discharges directly to these impaired waters. However, some of these sources may still influence nitrate concentrations in the ground water and springs as nonpoint sources.
Domestic Wastewater Figure 4.1 shows the locations of the 104 domestic and industrial wastewater facilities within the Silver Springs 100-year capture zone. Appendix B lists the facilities and their permit numbers. Only a few of these have NPDES permits. The remaining 96 non-NPDES facilities in the contributing area discharge to ground water, and those that discharge nitrogen to ground water in this area may contribute to the nitrate load reaching Silver Springs, the Silver Springs Group, or the Silver River. Of these, 72 are permitted for domestic wastewater use, including spray irrigation, percolation, holding ponds, extended aeration, drainfields, rapid infiltration basins, contact stabilization, biobreakdown and settling, and reuse (Figure 4.2).
Table 4.1 lists domestic facilities in the 100-year capture zone with authorization to discharge over 0.1 million gallons per day (MGD). The largest wastewater facilities in this area comprise 2 of the 3 city of Ocala Water Reclamation Facilities (WRFs # 1 and 2), which have a combined design capacity of approximately 9 MGD. The other 8 wastewater facilities in the area are much smaller. The city of Ocala, Marion County, and the city of Belleview currently provide reclaimed water for irrigation at several locations.
Permitted Stormwater Discharges A municipal separate storm sewer system (MS4) is a publicly owned conveyance or system of conveyances (i.e., ditches, curbs, catch basins, underground pipes, etc.) that is designed or used for collecting or conveying stormwater and that discharges to surface waters of the state. There are four entities with Phase II NPDES MS4 permits within the Silver Springs 100-year capture zone: Alachua County (FLR04E005), Marion County (FLR04E021), the city of Ocala (FLR04E046), and FDOT District 5 (FLR04E022). Only Marion County and FDOT District 5 have direct discharges to the impaired waterbodies.
There are also a number of industrial stormwater permits. Of the 104 domestic and industrial wastewater facilities in the 100-year capture zone, only 8 facilities have NPDES stormwater permits: 2 CEMEX Construction Materials facilities (FLG110331 and FLG110651), Prestige AB Ready Mix (FLG110397), 2 Evans Septic Tanks and Ready Mix facilities (FLG110232 and FLG110233), SCI Concrete Batch Plant (FLG110461), Marion County School Board NW Transportation Facility (FLA010671), and Steven Counts Inc. (FLG110811). Seven of the facilities are concrete batch plants (CBPs). Stormwater permits beginning with the letters FLG are specifically assigned to CBPs to identify them as operations that reuse their water rather than discharge to surface waters. None of the facilities with industrial stormwater permits discharges directly to the impaired waterbodies.
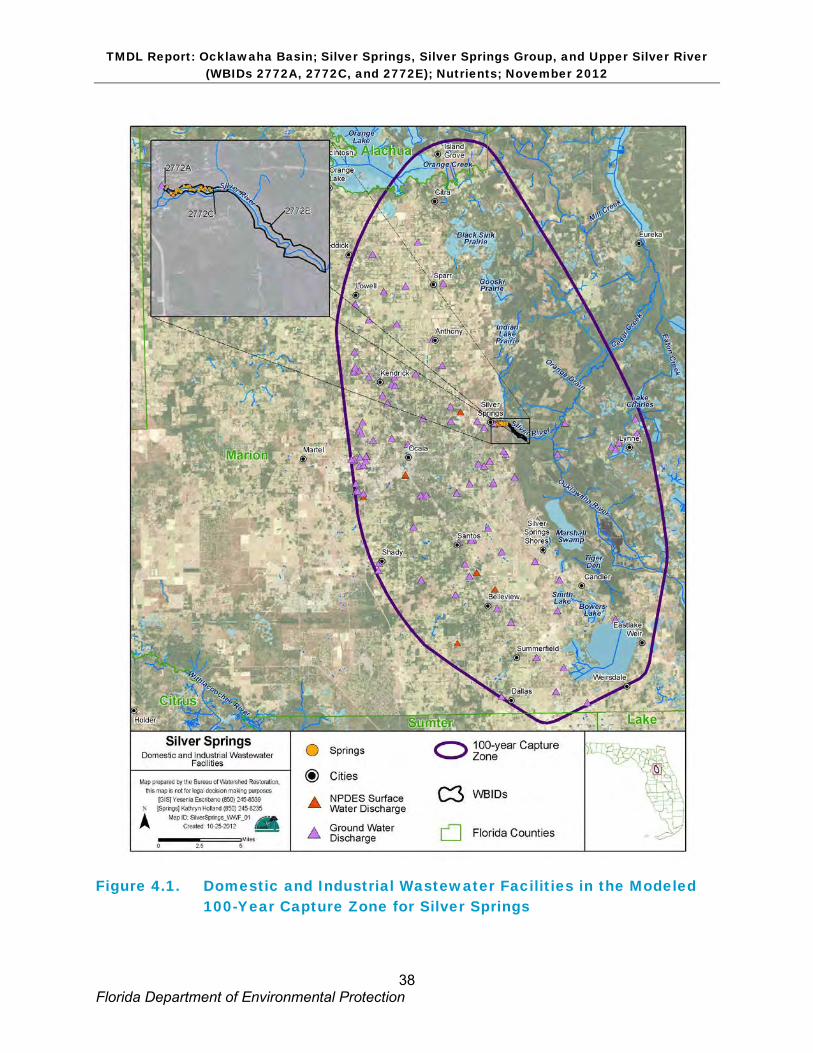
TMDL Report: Ocklawaha Basin; Silver Springs, Silver Springs Group, and Upper Silver River (WBIDs 2772A, 2772C, and 2772E); Nutrients; November 2012
38 Florida Department of Environmental Protection
Figure 4.1. Domestic and Industrial Wastewater Facilities in the Modeled 100-Year Capture Zone for Silver Springs

TMDL Report: Ocklawaha Basin; Silver Springs, Silver Springs Group, and Upper Silver River (WBIDs 2772A, 2772C, and 2772E); Nutrients; November 2012
39 Florida Department of Environmental Protection
Figure 4.2. Domestic Wastewater Facilities in the Modeled 100-Year Capture Zone for Silver Springs and Their Design Capacities
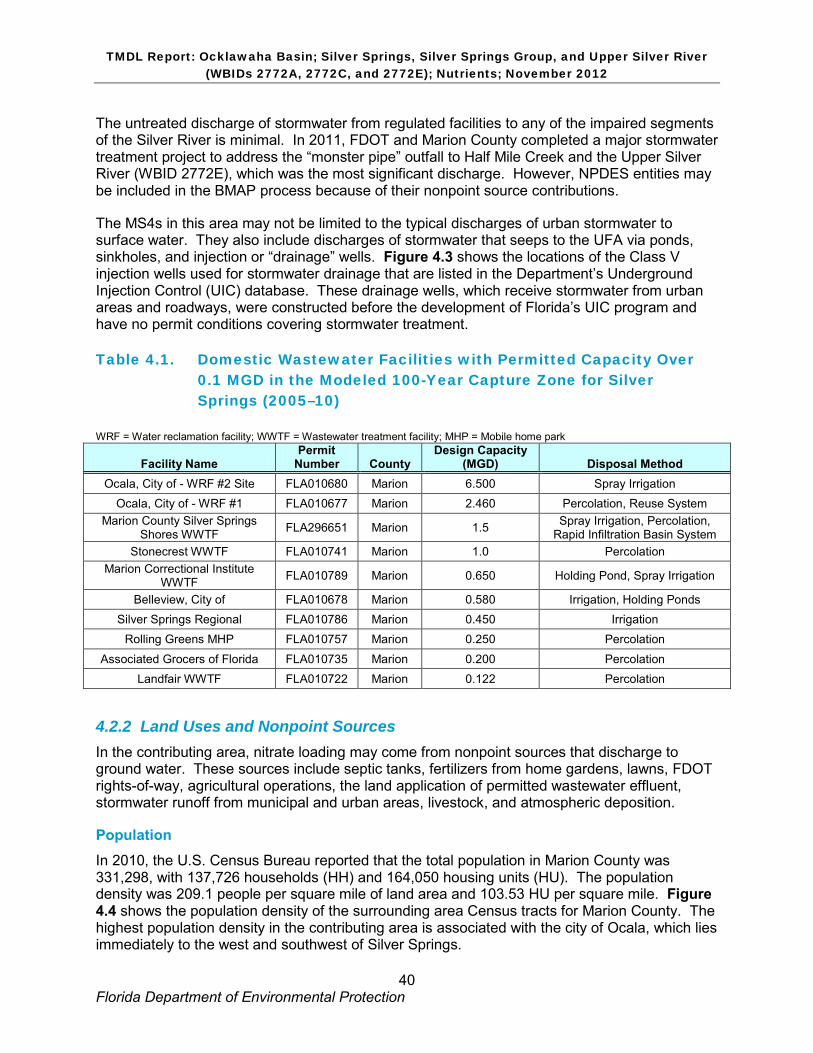
TMDL Report: Ocklawaha Basin; Silver Springs, Silver Springs Group, and Upper Silver River (WBIDs 2772A, 2772C, and 2772E); Nutrients; November 2012
40 Florida Department of Environmental Protection
The untreated discharge of stormwater from regulated facilities to any of the impaired segments of the Silver River is minimal. In 2011, FDOT and Marion County completed a major stormwater treatment project to address the “monster pipe” outfall to Half Mile Creek and the Upper Silver River (WBID 2772E), which was the most significant discharge. However, NPDES entities may be included in the BMAP process because of their nonpoint source contributions.
The MS4s in this area may not be limited to the typical discharges of urban stormwater to surface water. They also include discharges of stormwater that seeps to the UFA via ponds, sinkholes, and injection or “drainage” wells. Figure 4.3 shows the locations of the Class V injection wells used for stormwater drainage that are listed in the Department’s Underground Injection Control (UIC) database. These drainage wells, which receive stormwater from urban areas and roadways, were constructed before the development of Florida’s UIC program and have no permit conditions covering stormwater treatment.
Table 4.1. Domestic Wastewater Facilities with Permitted Capacity Over 0.1 MGD in the Modeled 100-Year Capture Zone for Silver Springs (2005–10)
WRF = Water reclamation facility; WWTF = Wastewater treatment facility; MHP = Mobile home park
Facility Name Permit
Number County Design Capacity
(MGD) Disposal Method Ocala, City of - WRF #2 Site FLA010680 Marion 6.500 Spray Irrigation
Ocala, City of - WRF #1 FLA010677 Marion 2.460 Percolation, Reuse System Marion County Silver Springs
Shores WWTF FLA296651 Marion 1.5 Spray Irrigation, Percolation, Rapid Infiltration Basin System
Stonecrest WWTF FLA010741 Marion 1.0 Percolation Marion Correctional Institute
WWTF FLA010789 Marion 0.650 Holding Pond, Spray Irrigation
Belleview, City of FLA010678 Marion 0.580 Irrigation, Holding Ponds Silver Springs Regional FLA010786 Marion 0.450 Irrigation
Rolling Greens MHP FLA010757 Marion 0.250 Percolation
Associated Grocers of Florida FLA010735 Marion 0.200 Percolation Landfair WWTF FLA010722 Marion 0.122 Percolation
4.2.2 Land Uses and Nonpoint Sources In the contributing area, nitrate loading may come from nonpoint sources that discharge to ground water. These sources include septic tanks, fertilizers from home gardens, lawns, FDOT rights-of-way, agricultural operations, the land application of permitted wastewater effluent, stormwater runoff from municipal and urban areas, livestock, and atmospheric deposition.
Population In 2010, the U.S. Census Bureau reported that the total population in Marion County was 331,298, with 137,726 households (HH) and 164,050 housing units (HU). The population density was 209.1 people per square mile of land area and 103.53 HU per square mile. Figure 4.4 shows the population density of the surrounding area Census tracts for Marion County. The highest population density in the contributing area is associated with the city of Ocala, which lies immediately to the west and southwest of Silver Springs.
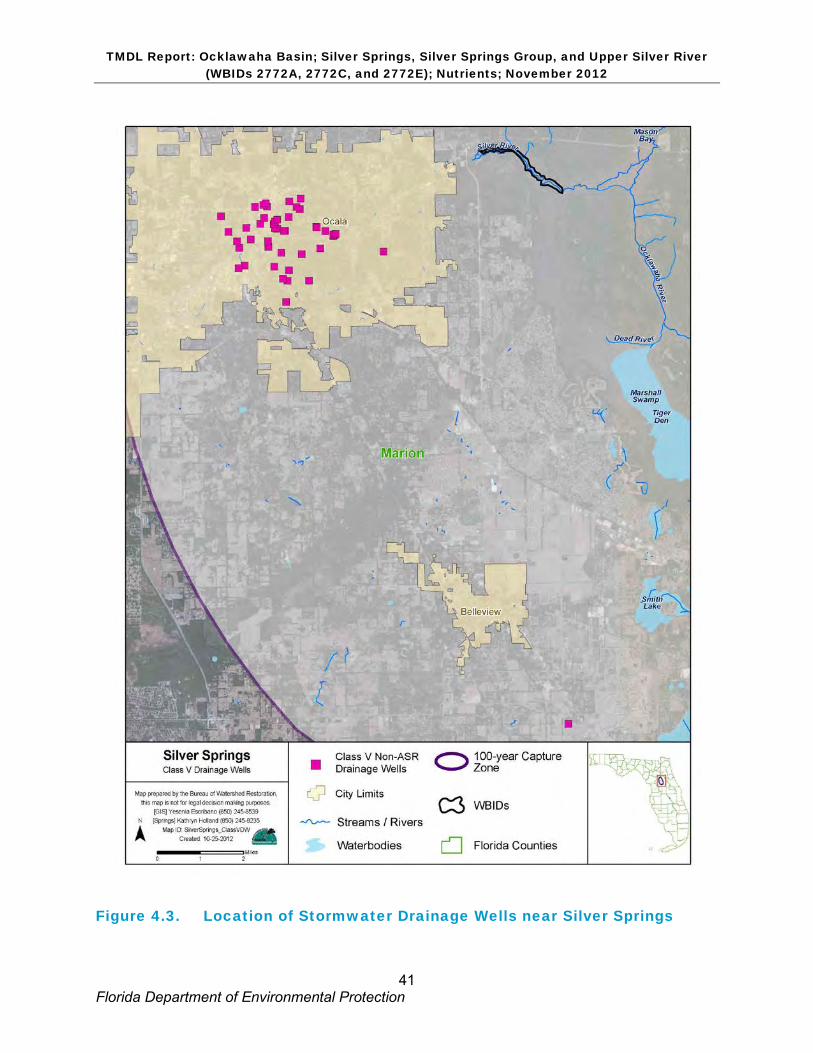
TMDL Report: Ocklawaha Basin; Silver Springs, Silver Springs Group, and Upper Silver River (WBIDs 2772A, 2772C, and 2772E); Nutrients; November 2012
41 Florida Department of Environmental Protection
Figure 4.3. Location of Stormwater Drainage Wells near Silver Springs
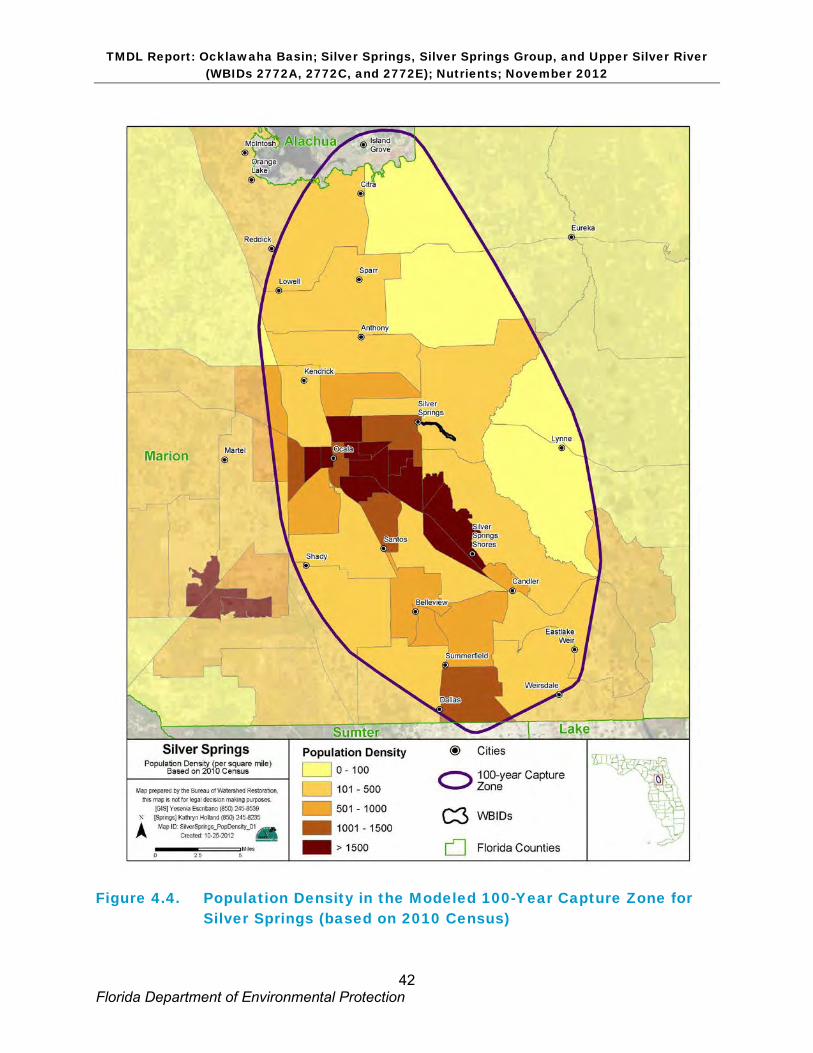
TMDL Report: Ocklawaha Basin; Silver Springs, Silver Springs Group, and Upper Silver River (WBIDs 2772A, 2772C, and 2772E); Nutrients; November 2012
42 Florida Department of Environmental Protection
Figure 4.4. Population Density in the Modeled 100-Year Capture Zone for Silver Springs (based on 2010 Census)
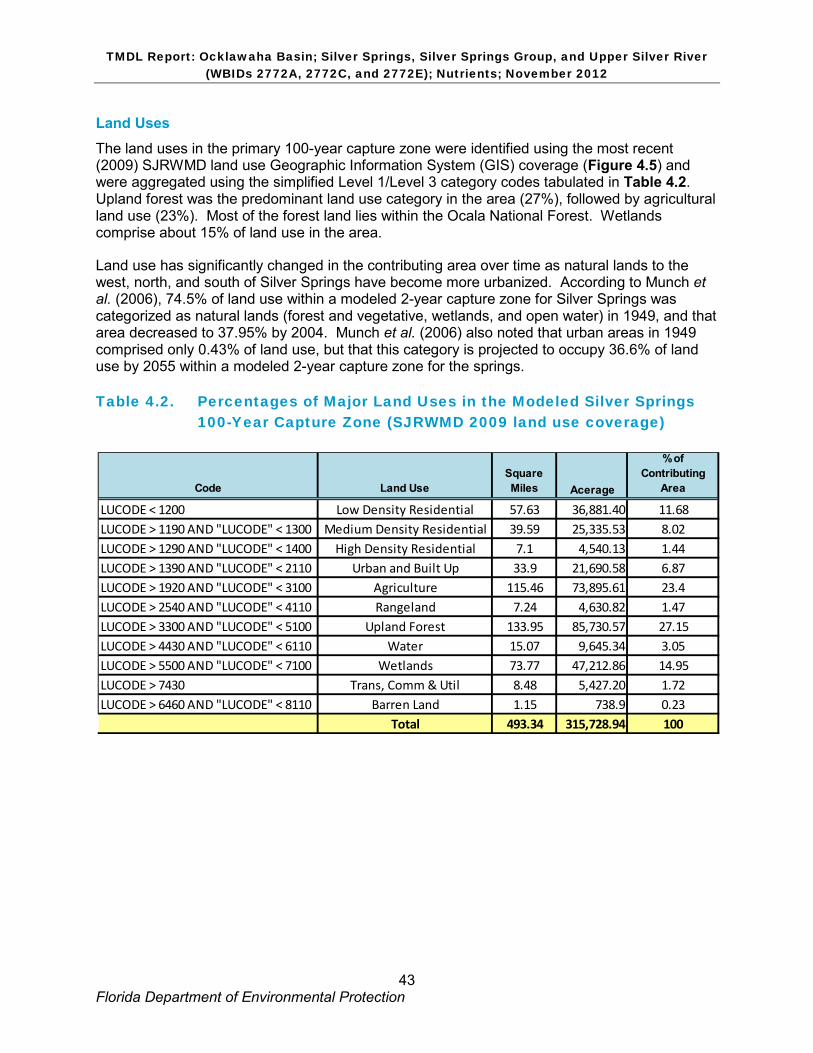
TMDL Report: Ocklawaha Basin; Silver Springs, Silver Springs Group, and Upper Silver River (WBIDs 2772A, 2772C, and 2772E); Nutrients; November 2012
43 Florida Department of Environmental Protection
Land Uses The land uses in the primary 100-year capture zone were identified using the most recent (2009) SJRWMD land use Geographic Information System (GIS) coverage (Figure 4.5) and were aggregated using the simplified Level 1/Level 3 category codes tabulated in Table 4.2. Upland forest was the predominant land use category in the area (27%), followed by agricultural land use (23%). Most of the forest land lies within the Ocala National Forest. Wetlands comprise about 15% of land use in the area.
Land use has significantly changed in the contributing area over time as natural lands to the west, north, and south of Silver Springs have become more urbanized. According to Munch et al. (2006), 74.5% of land use within a modeled 2-year capture zone for Silver Springs was categorized as natural lands (forest and vegetative, wetlands, and open water) in 1949, and that area decreased to 37.95% by 2004. Munch et al. (2006) also noted that urban areas in 1949 comprised only 0.43% of land use, but that this category is projected to occupy 36.6% of land use by 2055 within a modeled 2-year capture zone for the springs.
Table 4.2. Percentages of Major Land Uses in the Modeled Silver Springs 100-Year Capture Zone (SJRWMD 2009 land use coverage)
Code Land UseSquare Miles Acerage
% of Contributing
Area
LUCODE < 1200 Low Density Residential 57.63 36,881.40 11.68LUCODE > 1190 AND "LUCODE" < 1300 Medium Density Residential 39.59 25,335.53 8.02LUCODE > 1290 AND "LUCODE" < 1400 High Density Residential 7.1 4,540.13 1.44LUCODE > 1390 AND "LUCODE" < 2110 Urban and Built Up 33.9 21,690.58 6.87LUCODE > 1920 AND "LUCODE" < 3100 Agriculture 115.46 73,895.61 23.4LUCODE > 2540 AND "LUCODE" < 4110 Rangeland 7.24 4,630.82 1.47LUCODE > 3300 AND "LUCODE" < 5100 Upland Forest 133.95 85,730.57 27.15LUCODE > 4430 AND "LUCODE" < 6110 Water 15.07 9,645.34 3.05LUCODE > 5500 AND "LUCODE" < 7100 Wetlands 73.77 47,212.86 14.95LUCODE > 7430 Trans, Comm & Util 8.48 5,427.20 1.72LUCODE > 6460 AND "LUCODE" < 8110 Barren Land 1.15 738.9 0.23
Total 493.34 315,728.94 100
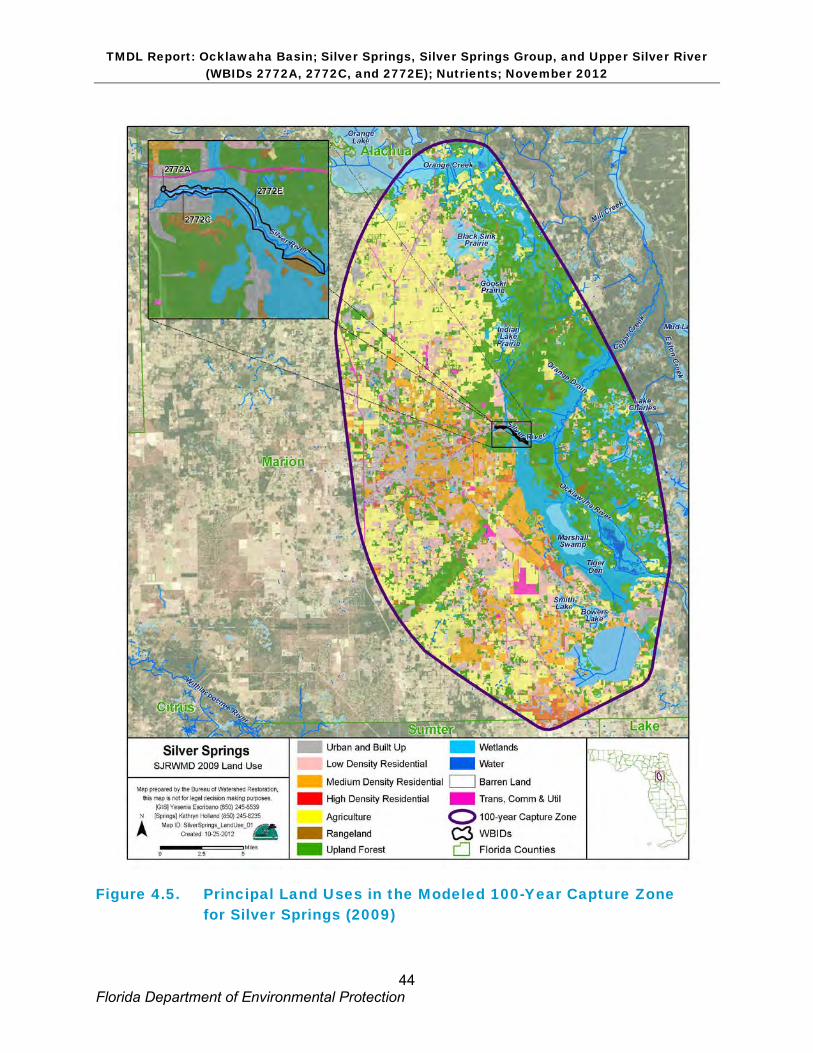
TMDL Report: Ocklawaha Basin; Silver Springs, Silver Springs Group, and Upper Silver River (WBIDs 2772A, 2772C, and 2772E); Nutrients; November 2012
44 Florida Department of Environmental Protection
Figure 4.5. Principal Land Uses in the Modeled 100-Year Capture Zone for Silver Springs (2009)
TMDL Report: Ocklawaha Basin; Silver Springs, Silver Springs Group, and Upper Silver River (WBIDs 2772A, 2772C, and 2772E); Nutrients; November 2012
45 Florida Department of Environmental Protection
Nonpoint Sources
ONSITE SEWAGE TREATMENT AND DISPOSAL SYSTEMS
Onsite sewage treatment and disposal systems (OSTDS) are used for the disposal of domestic wastes from homes that are not on central sewer, often because providing central sewer is not cost-effective or practical. When properly sited, designed, constructed, maintained, and operated, OSTDS are a sanitary means of disposing of domestic waste. The effluent from a well-functioning OSTDS is generally higher in TN concentration than secondarily treated wastewater from a sewage treatment plant, although the wastewater profile can vary from home to home. On average, the TN concentration in septic tank effluent from a typical OSTDS is 57.7 mg/L (Hazen and Sawyer 2009).
Under a low-density residential setting, loadings of nitrogen by OSTDS may not be significant, but under a higher density setting, one could expect a TN input of 129 pounds per acre per year (lb/acre/yr), although additional treatment can occur in the drainfield and soils before the wastewater reaches ground water (Harrington et al. 2010). There has been growing concern over the abundance and continuing use of septic tanks as the primary sanitary sewer disposal method within the contributing area, particularly in higher-density residential areas close to the springs. Munch et al. (2006) described a projected land use/land cover feature class for 2055 that predicted an 84% increase in nitrogen levels in the springs due partially to a projected increase in OSTDS numbers; however, this value may not be likely to match actual values provided that septic tank use in the county decreases.
The OSTDS GIS coverage provided by Marion County for 2008 showed an estimated 97,371 OSTDS in the county, 48,617 of which were located in the Silver Springs modeled 100-year capture zone (Figure 4.6). Kuphal (2005) used GIS and data from multiple sources to analyze the spatial distribution of domestic waste treatment systems within Marion County and to quantify their relative potential to contaminate ground water and springs. His analyses indicated that there were between 92,000 and 105,000 septic tank systems and 131 central wastewater treatment facilities in Marion County, with a total discharge of domestic wastewater estimated at 27.8 MGD, less than 40% of which was discharged by permitted wastewater treatment facilities.
LIVESTOCK
The majority of agricultural land use in the area consists of equine facilities (horse farms), cow/calf operations, and associated improved pasture. Other livestock in the area that could possibly contribute loading include poultry, hogs, pigs, and sheep. Their combined estimated rates can vary between 10% and 30% of the load reaching ground water, according to some estimates (Katz et al. 1999).
There are approximately 240 horse farms in the 100-year capture zone, many of them breeding and training facilities for thoroughbred racehorses. Because of the relatively large number of horse farms, animal waste could be a significant source of nitrate to the springs (Harrington et al. 2010). Animal waste management is often a challenge for horse farms. An average 1,000-pound horse produces about 50 pounds of manure and about 10 pounds of urine per day (Higgins et al. 2008). A small percentage of nitrate leaching from improperly stored manure can contribute a significant load of nitrate to ground water and receiving springs.

TMDL Report: Ocklawaha Basin; Silver Springs, Silver Springs Group, and Upper Silver River (WBIDs 2772A, 2772C, and 2772E); Nutrients; November 2012
46 Florida Department of Environmental Protection
Figure 4.6. Density of OSTDS in the Modeled 100-Year Capture Zone for Silver Springs (Marion County 2008 coverage)
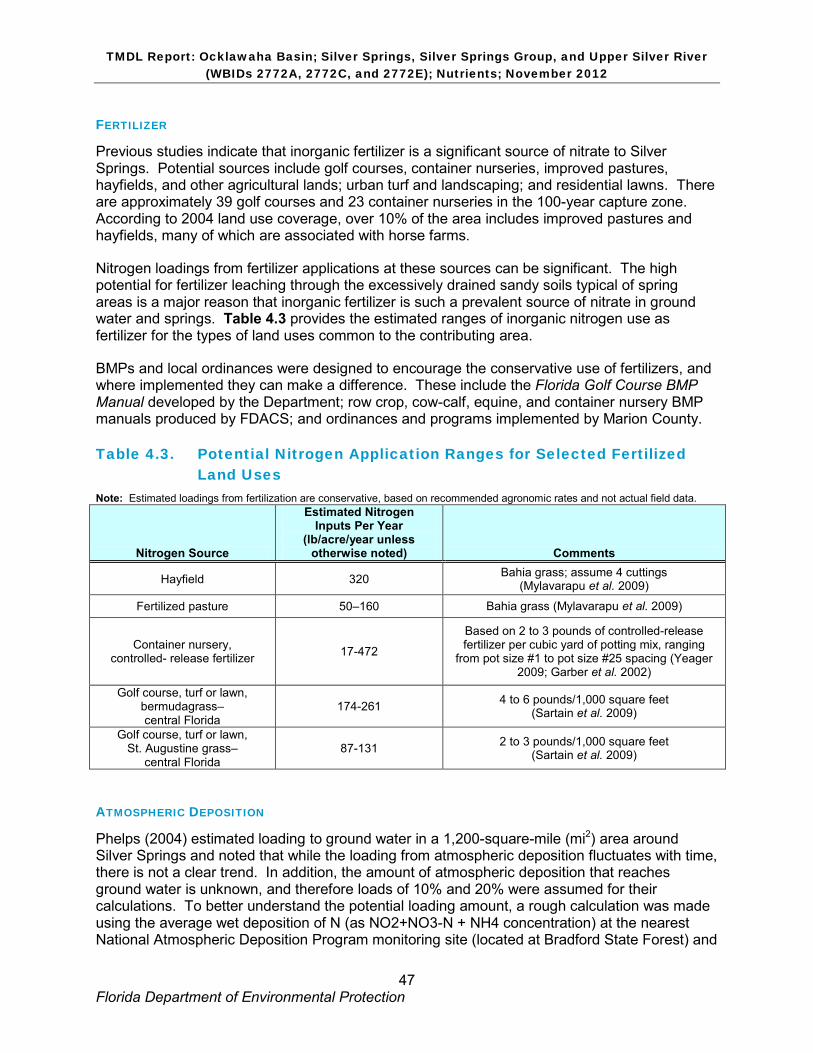
TMDL Report: Ocklawaha Basin; Silver Springs, Silver Springs Group, and Upper Silver River (WBIDs 2772A, 2772C, and 2772E); Nutrients; November 2012
47 Florida Department of Environmental Protection
FERTILIZER
Previous studies indicate that inorganic fertilizer is a significant source of nitrate to Silver Springs. Potential sources include golf courses, container nurseries, improved pastures, hayfields, and other agricultural lands; urban turf and landscaping; and residential lawns. There are approximately 39 golf courses and 23 container nurseries in the 100-year capture zone. According to 2004 land use coverage, over 10% of the area includes improved pastures and hayfields, many of which are associated with horse farms.
Nitrogen loadings from fertilizer applications at these sources can be significant. The high potential for fertilizer leaching through the excessively drained sandy soils typical of spring areas is a major reason that inorganic fertilizer is such a prevalent source of nitrate in ground water and springs. Table 4.3 provides the estimated ranges of inorganic nitrogen use as fertilizer for the types of land uses common to the contributing area.
BMPs and local ordinances were designed to encourage the conservative use of fertilizers, and where implemented they can make a difference. These include the Florida Golf Course BMP Manual developed by the Department; row crop, cow-calf, equine, and container nursery BMP manuals produced by FDACS; and ordinances and programs implemented by Marion County.
Table 4.3. Potential Nitrogen Application Ranges for Selected Fertilized Land Uses
Note: Estimated loadings from fertilization are conservative, based on recommended agronomic rates and not actual field data.
Nitrogen Source
Estimated Nitrogen Inputs Per Year
(lb/acre/year unless otherwise noted) Comments
Hayfield 320 Bahia grass; assume 4 cuttings (Mylavarapu et al. 2009)
Fertilized pasture 50–160 Bahia grass (Mylavarapu et al. 2009)
Container nursery, controlled- release fertilizer 17-472
Based on 2 to 3 pounds of controlled-release fertilizer per cubic yard of potting mix, ranging
from pot size #1 to pot size #25 spacing (Yeager 2009; Garber et al. 2002)
Golf course, turf or lawn, bermudagrass– central Florida
174-261 4 to 6 pounds/1,000 square feet (Sartain et al. 2009)
Golf course, turf or lawn, St. Augustine grass–
central Florida 87-131 2 to 3 pounds/1,000 square feet
(Sartain et al. 2009)
ATMOSPHERIC DEPOSITION
Phelps (2004) estimated loading to ground water in a 1,200-square-mile (mi2) area around Silver Springs and noted that while the loading from atmospheric deposition fluctuates with time, there is not a clear trend. In addition, the amount of atmospheric deposition that reaches ground water is unknown, and therefore loads of 10% and 20% were assumed for their calculations. To better understand the potential loading amount, a rough calculation was made using the average wet deposition of N (as NO2+NO3-N + NH4 concentration) at the nearest National Atmospheric Deposition Program monitoring site (located at Bradford State Forest) and

TMDL Report: Ocklawaha Basin; Silver Springs, Silver Springs Group, and Upper Silver River (WBIDs 2772A, 2772C, and 2772E); Nutrients; November 2012
48 Florida Department of Environmental Protection
the 30-year return period average rainfall (50.6 inches, from Table 2.2). Using the average N concentration of 2.48 mg/L, the potential input as wet deposition is 3.5 lb/acre/year. If only 10% to 20% of this nitrogen were to leach to ground water, the wet deposition of nitrogen would seem to be a relatively minor source. However, this input will be re-evaluated as an updated nitrogen budget is developed for the contributing area as part of the BMAP.
TMDL Report: Ocklawaha Basin; Silver Springs, Silver Springs Group, and Upper Silver River (WBIDs 2772A, 2772C, and 2772E); Nutrients; November 2012
49 Florida Department of Environmental Protection
Chapter 5: DETERMINATION OF ASSIMILATIVE CAPACITY The Department often uses hydraulic and water quality models to simulate loading and the effect of the loading within a waterbody. However, there are other appropriate methods to develop a TMDL that are just as credible as a modeling approach. Such an alternative approach was used to estimate existing conditions and calculate a TMDL for Silver Springs, the Silver Springs Group, and the Upper Silver River.
5.1 Determination of Loading Capacity Typically, the target loading and existing loading for a stream or watershed is based on hydrologic and water quality modeling. Many of these models depend on the relationship between flow and surface water drainage area, as well as the relationship between land use and soils and pollutant delivery.
The predominant source of nitrate loading to Silver Springs and the Silver Springs Group is ground water, which discharges from the major spring vents as well as smaller springs and seeps along its spring run, the Silver River. Thus, a direct relationship between surface water loadings in the watershed is not appropriate. This nontypical situation requires the use of an alternative approach for establishing the nutrient TMDL.
Existing stream loading can be estimated by multiplying the measured stream flow by the measured pollutant concentrations in the stream. To estimate the pollutant loading this way, synoptic flow and concentration data measured at the outlet of each stream segment under question are required. These data were not available for all sources covering the same period.
The Department considered the feasibility of using the available flow measurements to estimate the flow at each segment outlet based on the drainage area ratio among these stream segments. This method would normally provide an approximation of flow estimates at the stream segment outlets. However, because the contributing area of Silver Springs, the Silver Springs Group, and the Upper Silver River is internally drained, most surface drainage tends to flow toward sinkholes and closed depressions, where it infiltrates and reaches Silver Springs and the Silver Springs Group via ground water. Thus flow estimation based on surface drainage area ratio is not possible.
Estimates of current nutrient loads from the ground water of Silver Springs and the Silver Springs Group could still be made based on spring flow and concentration. However, as both current and TMDL loads would be generated from the same flow data, there would be a linear or proportional relationship based on current and target concentrations. Therefore, the loads of nitrate were not explicitly calculated.
Instead, the percent load reduction required to achieve the nitrate concentration target was calculated assuming that the percent loading reduction would be the same as the percent concentration reduction. The percent reduction required to achieve the water quality target was calculated using the following formula:
[(existing mean concentration – target concentration)/existing mean concentration] x 100
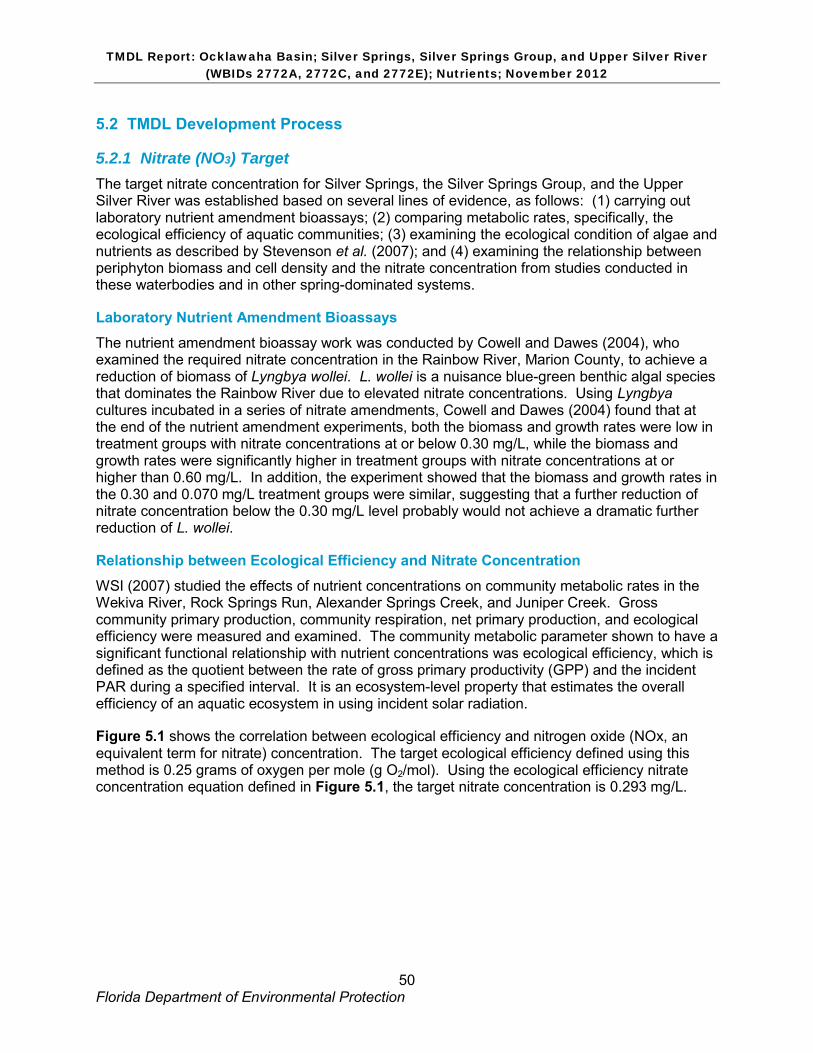
TMDL Report: Ocklawaha Basin; Silver Springs, Silver Springs Group, and Upper Silver River (WBIDs 2772A, 2772C, and 2772E); Nutrients; November 2012
50 Florida Department of Environmental Protection
5.2 TMDL Development Process
5.2.1 Nitrate (NO3) Target The target nitrate concentration for Silver Springs, the Silver Springs Group, and the Upper Silver River was established based on several lines of evidence, as follows: (1) carrying out laboratory nutrient amendment bioassays; (2) comparing metabolic rates, specifically, the ecological efficiency of aquatic communities; (3) examining the ecological condition of algae and nutrients as described by Stevenson et al. (2007); and (4) examining the relationship between periphyton biomass and cell density and the nitrate concentration from studies conducted in these waterbodies and in other spring-dominated systems.
Laboratory Nutrient Amendment Bioassays The nutrient amendment bioassay work was conducted by Cowell and Dawes (2004), who examined the required nitrate concentration in the Rainbow River, Marion County, to achieve a reduction of biomass of Lyngbya wollei. L. wollei is a nuisance blue-green benthic algal species that dominates the Rainbow River due to elevated nitrate concentrations. Using Lyngbya cultures incubated in a series of nitrate amendments, Cowell and Dawes (2004) found that at the end of the nutrient amendment experiments, both the biomass and growth rates were low in treatment groups with nitrate concentrations at or below 0.30 mg/L, while the biomass and growth rates were significantly higher in treatment groups with nitrate concentrations at or higher than 0.60 mg/L. In addition, the experiment showed that the biomass and growth rates in the 0.30 and 0.070 mg/L treatment groups were similar, suggesting that a further reduction of nitrate concentration below the 0.30 mg/L level probably would not achieve a dramatic further reduction of L. wollei.
Relationship between Ecological Efficiency and Nitrate Concentration WSI (2007) studied the effects of nutrient concentrations on community metabolic rates in the Wekiva River, Rock Springs Run, Alexander Springs Creek, and Juniper Creek. Gross community primary production, community respiration, net primary production, and ecological efficiency were measured and examined. The community metabolic parameter shown to have a significant functional relationship with nutrient concentrations was ecological efficiency, which is defined as the quotient between the rate of gross primary productivity (GPP) and the incident PAR during a specified interval. It is an ecosystem-level property that estimates the overall efficiency of an aquatic ecosystem in using incident solar radiation.
Figure 5.1 shows the correlation between ecological efficiency and nitrogen oxide (NOx, an equivalent term for nitrate) concentration. The target ecological efficiency defined using this method is 0.25 grams of oxygen per mole (g O2/mol). Using the ecological efficiency nitrate concentration equation defined in Figure 5.1, the target nitrate concentration is 0.293 mg/L.
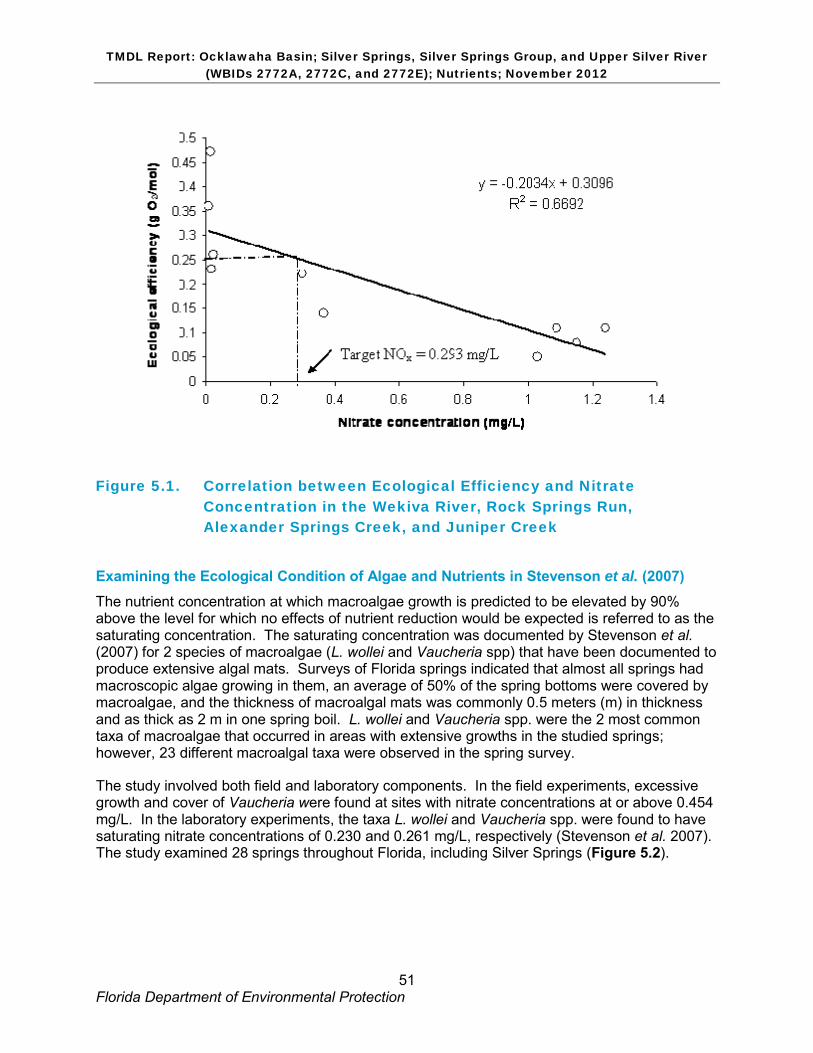
TMDL Report: Ocklawaha Basin; Silver Springs, Silver Springs Group, and Upper Silver River (WBIDs 2772A, 2772C, and 2772E); Nutrients; November 2012
51 Florida Department of Environmental Protection
Figure 5.1. Correlation between Ecological Efficiency and Nitrate Concentration in the Wekiva River, Rock Springs Run, Alexander Springs Creek, and Juniper Creek
Examining the Ecological Condition of Algae and Nutrients in Stevenson et al. (2007) The nutrient concentration at which macroalgae growth is predicted to be elevated by 90% above the level for which no effects of nutrient reduction would be expected is referred to as the saturating concentration. The saturating concentration was documented by Stevenson et al. (2007) for 2 species of macroalgae (L. wollei and Vaucheria spp) that have been documented to produce extensive algal mats. Surveys of Florida springs indicated that almost all springs had macroscopic algae growing in them, an average of 50% of the spring bottoms were covered by macroalgae, and the thickness of macroalgal mats was commonly 0.5 meters (m) in thickness and as thick as 2 m in one spring boil. L. wollei and Vaucheria spp. were the 2 most common taxa of macroalgae that occurred in areas with extensive growths in the studied springs; however, 23 different macroalgal taxa were observed in the spring survey.
The study involved both field and laboratory components. In the field experiments, excessive growth and cover of Vaucheria were found at sites with nitrate concentrations at or above 0.454 mg/L. In the laboratory experiments, the taxa L. wollei and Vaucheria spp. were found to have saturating nitrate concentrations of 0.230 and 0.261 mg/L, respectively (Stevenson et al. 2007). The study examined 28 springs throughout Florida, including Silver Springs (Figure 5.2).
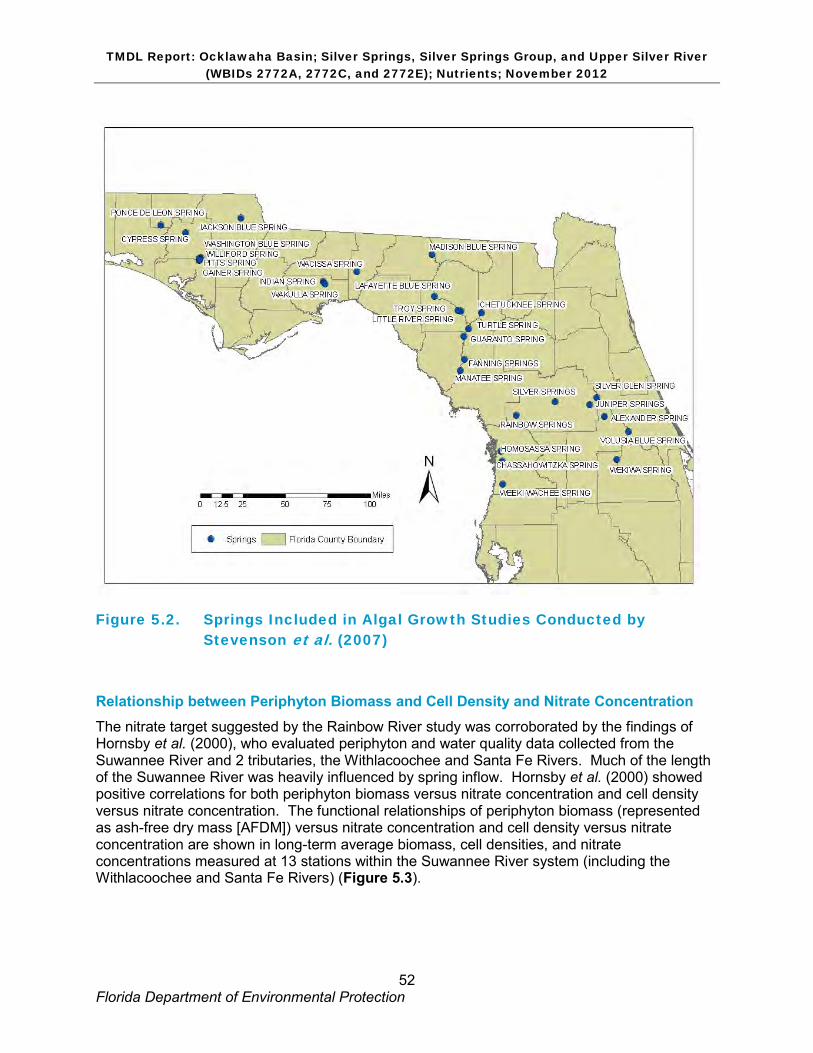
TMDL Report: Ocklawaha Basin; Silver Springs, Silver Springs Group, and Upper Silver River (WBIDs 2772A, 2772C, and 2772E); Nutrients; November 2012
52 Florida Department of Environmental Protection
Figure 5.2. Springs Included in Algal Growth Studies Conducted by Stevenson et al. (2007)
Relationship between Periphyton Biomass and Cell Density and Nitrate Concentration The nitrate target suggested by the Rainbow River study was corroborated by the findings of Hornsby et al. (2000), who evaluated periphyton and water quality data collected from the Suwannee River and 2 tributaries, the Withlacoochee and Santa Fe Rivers. Much of the length of the Suwannee River was heavily influenced by spring inflow. Hornsby et al. (2000) showed positive correlations for both periphyton biomass versus nitrate concentration and cell density versus nitrate concentration. The functional relationships of periphyton biomass (represented as ash-free dry mass [AFDM]) versus nitrate concentration and cell density versus nitrate concentration are shown in long-term average biomass, cell densities, and nitrate concentrations measured at 13 stations within the Suwannee River system (including the Withlacoochee and Santa Fe Rivers) (Figure 5.3).
TMDL Report: Ocklawaha Basin; Silver Springs, Silver Springs Group, and Upper Silver River (WBIDs 2772A, 2772C, and 2772E); Nutrients; November 2012
53 Florida Department of Environmental Protection
Figure 5.3. Change-Point Study Sites in the Suwannee River System
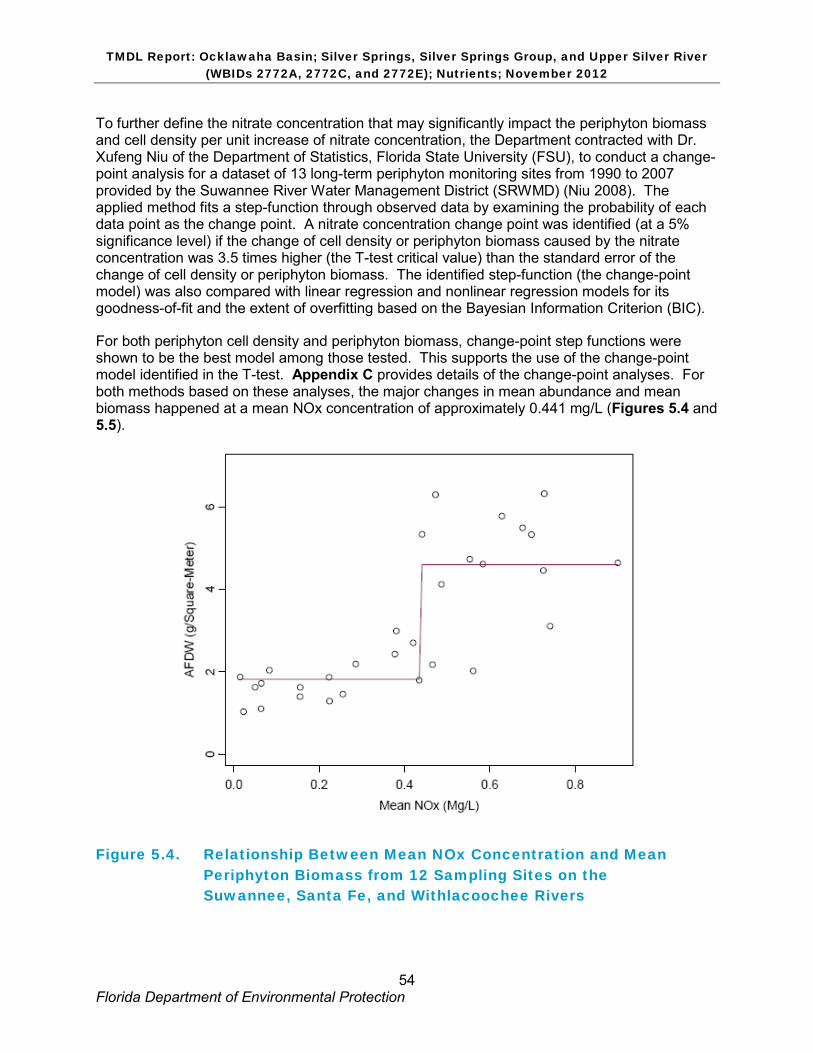
TMDL Report: Ocklawaha Basin; Silver Springs, Silver Springs Group, and Upper Silver River (WBIDs 2772A, 2772C, and 2772E); Nutrients; November 2012
54 Florida Department of Environmental Protection
To further define the nitrate concentration that may significantly impact the periphyton biomass and cell density per unit increase of nitrate concentration, the Department contracted with Dr. Xufeng Niu of the Department of Statistics, Florida State University (FSU), to conduct a change-point analysis for a dataset of 13 long-term periphyton monitoring sites from 1990 to 2007 provided by the Suwannee River Water Management District (SRWMD) (Niu 2008). The applied method fits a step-function through observed data by examining the probability of each data point as the change point. A nitrate concentration change point was identified (at a 5% significance level) if the change of cell density or periphyton biomass caused by the nitrate concentration was 3.5 times higher (the T-test critical value) than the standard error of the change of cell density or periphyton biomass. The identified step-function (the change-point model) was also compared with linear regression and nonlinear regression models for its goodness-of-fit and the extent of overfitting based on the Bayesian Information Criterion (BIC).
For both periphyton cell density and periphyton biomass, change-point step functions were shown to be the best model among those tested. This supports the use of the change-point model identified in the T-test. Appendix C provides details of the change-point analyses. For both methods based on these analyses, the major changes in mean abundance and mean biomass happened at a mean NOx concentration of approximately 0.441 mg/L (Figures 5.4 and 5.5).
Figure 5.4. Relationship Between Mean NOx Concentration and Mean Periphyton Biomass from 12 Sampling Sites on the Suwannee, Santa Fe, and Withlacoochee Rivers
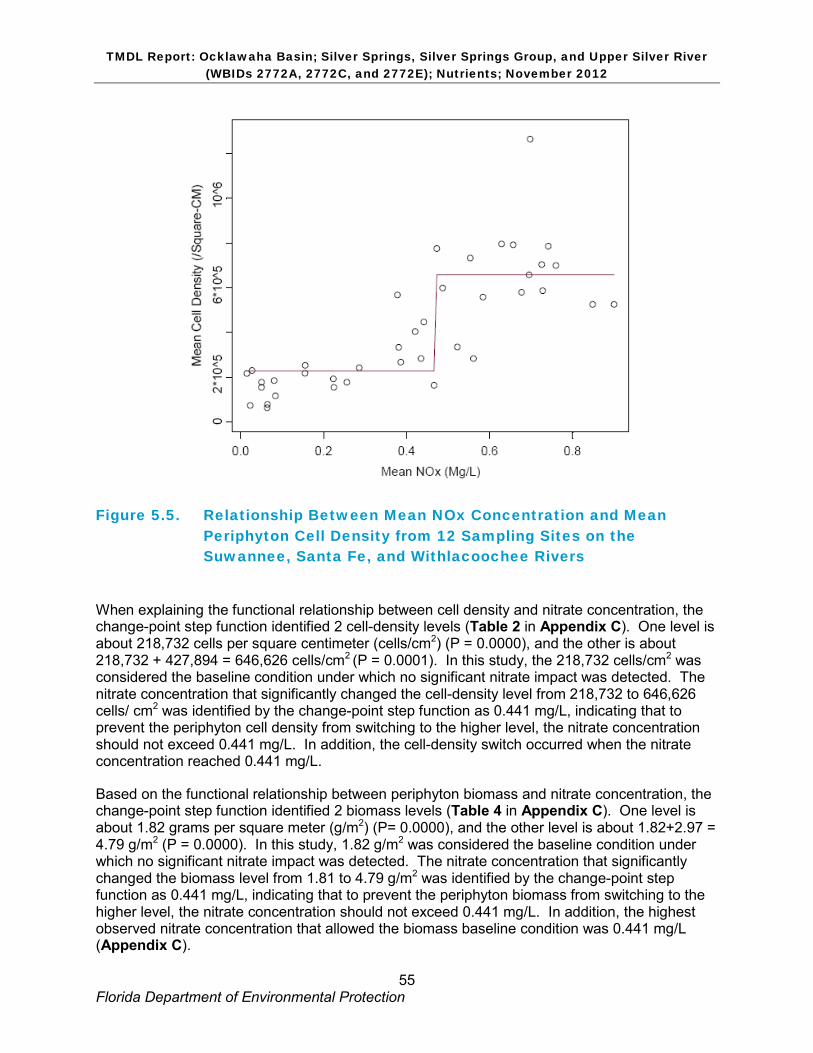
TMDL Report: Ocklawaha Basin; Silver Springs, Silver Springs Group, and Upper Silver River (WBIDs 2772A, 2772C, and 2772E); Nutrients; November 2012
55 Florida Department of Environmental Protection
Figure 5.5. Relationship Between Mean NOx Concentration and Mean Periphyton Cell Density from 12 Sampling Sites on the Suwannee, Santa Fe, and Withlacoochee Rivers
When explaining the functional relationship between cell density and nitrate concentration, the change-point step function identified 2 cell-density levels (Table 2 in Appendix C). One level is about 218,732 cells per square centimeter (cells/cm2) (P = 0.0000), and the other is about 218,732 + 427,894 = 646,626 cells/cm2 (P = 0.0001). In this study, the 218,732 cells/cm2 was considered the baseline condition under which no significant nitrate impact was detected. The nitrate concentration that significantly changed the cell-density level from 218,732 to 646,626 cells/ cm2 was identified by the change-point step function as 0.441 mg/L, indicating that to prevent the periphyton cell density from switching to the higher level, the nitrate concentration should not exceed 0.441 mg/L. In addition, the cell-density switch occurred when the nitrate concentration reached 0.441 mg/L.
Based on the functional relationship between periphyton biomass and nitrate concentration, the change-point step function identified 2 biomass levels (Table 4 in Appendix C). One level is about 1.82 grams per square meter (g/m2) (P= 0.0000), and the other level is about 1.82+2.97 = 4.79 g/m2 (P = 0.0000). In this study, 1.82 g/m2 was considered the baseline condition under which no significant nitrate impact was detected. The nitrate concentration that significantly changed the biomass level from 1.81 to 4.79 g/m2 was identified by the change-point step function as 0.441 mg/L, indicating that to prevent the periphyton biomass from switching to the higher level, the nitrate concentration should not exceed 0.441 mg/L. In addition, the highest observed nitrate concentration that allowed the biomass baseline condition was 0.441 mg/L (Appendix C).
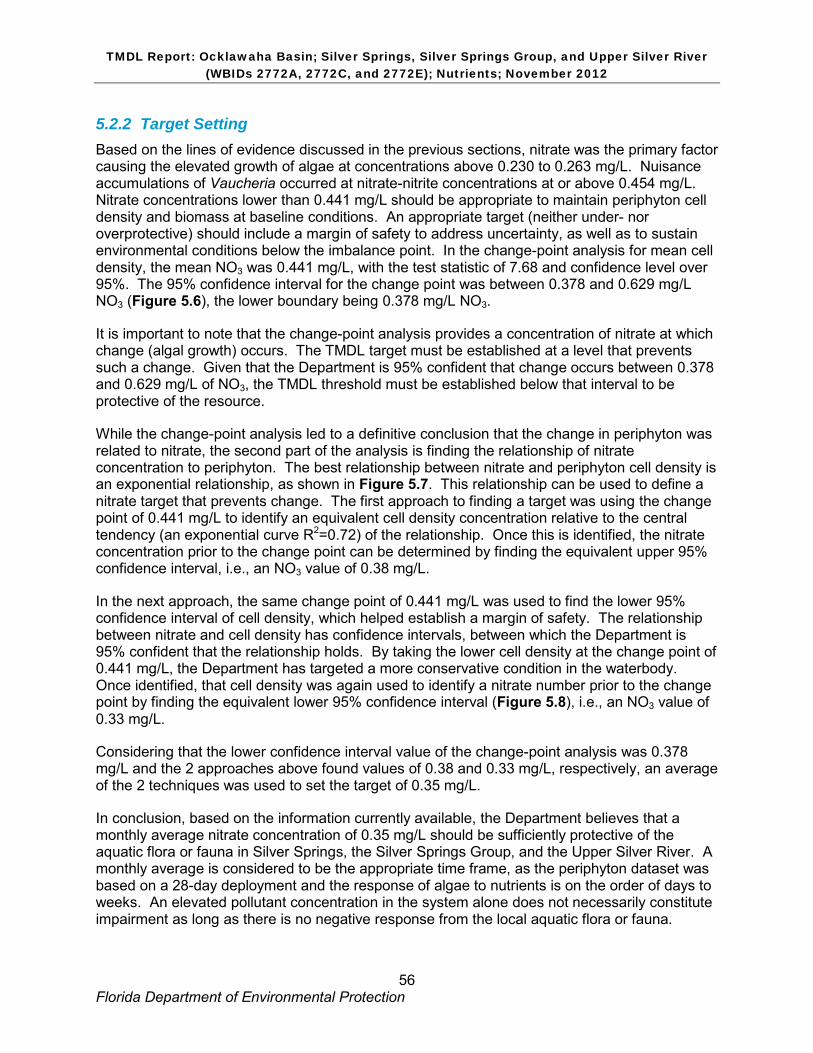
TMDL Report: Ocklawaha Basin; Silver Springs, Silver Springs Group, and Upper Silver River (WBIDs 2772A, 2772C, and 2772E); Nutrients; November 2012
56 Florida Department of Environmental Protection
5.2.2 Target Setting Based on the lines of evidence discussed in the previous sections, nitrate was the primary factor causing the elevated growth of algae at concentrations above 0.230 to 0.263 mg/L. Nuisance accumulations of Vaucheria occurred at nitrate-nitrite concentrations at or above 0.454 mg/L. Nitrate concentrations lower than 0.441 mg/L should be appropriate to maintain periphyton cell density and biomass at baseline conditions. An appropriate target (neither under- nor overprotective) should include a margin of safety to address uncertainty, as well as to sustain environmental conditions below the imbalance point. In the change-point analysis for mean cell density, the mean NO3 was 0.441 mg/L, with the test statistic of 7.68 and confidence level over 95%. The 95% confidence interval for the change point was between 0.378 and 0.629 mg/L NO3 (Figure 5.6), the lower boundary being 0.378 mg/L NO3.
It is important to note that the change-point analysis provides a concentration of nitrate at which change (algal growth) occurs. The TMDL target must be established at a level that prevents such a change. Given that the Department is 95% confident that change occurs between 0.378 and 0.629 mg/L of NO3, the TMDL threshold must be established below that interval to be protective of the resource.
While the change-point analysis led to a definitive conclusion that the change in periphyton was related to nitrate, the second part of the analysis is finding the relationship of nitrate concentration to periphyton. The best relationship between nitrate and periphyton cell density is an exponential relationship, as shown in Figure 5.7. This relationship can be used to define a nitrate target that prevents change. The first approach to finding a target was using the change point of 0.441 mg/L to identify an equivalent cell density concentration relative to the central tendency (an exponential curve R2=0.72) of the relationship. Once this is identified, the nitrate concentration prior to the change point can be determined by finding the equivalent upper 95% confidence interval, i.e., an NO3 value of 0.38 mg/L.
In the next approach, the same change point of 0.441 mg/L was used to find the lower 95% confidence interval of cell density, which helped establish a margin of safety. The relationship between nitrate and cell density has confidence intervals, between which the Department is 95% confident that the relationship holds. By taking the lower cell density at the change point of 0.441 mg/L, the Department has targeted a more conservative condition in the waterbody. Once identified, that cell density was again used to identify a nitrate number prior to the change point by finding the equivalent lower 95% confidence interval (Figure 5.8), i.e., an NO3 value of 0.33 mg/L.
Considering that the lower confidence interval value of the change-point analysis was 0.378 mg/L and the 2 approaches above found values of 0.38 and 0.33 mg/L, respectively, an average of the 2 techniques was used to set the target of 0.35 mg/L.
In conclusion, based on the information currently available, the Department believes that a monthly average nitrate concentration of 0.35 mg/L should be sufficiently protective of the aquatic flora or fauna in Silver Springs, the Silver Springs Group, and the Upper Silver River. A monthly average is considered to be the appropriate time frame, as the periphyton dataset was based on a 28-day deployment and the response of algae to nutrients is on the order of days to weeks. An elevated pollutant concentration in the system alone does not necessarily constitute impairment as long as there is no negative response from the local aquatic flora or fauna.
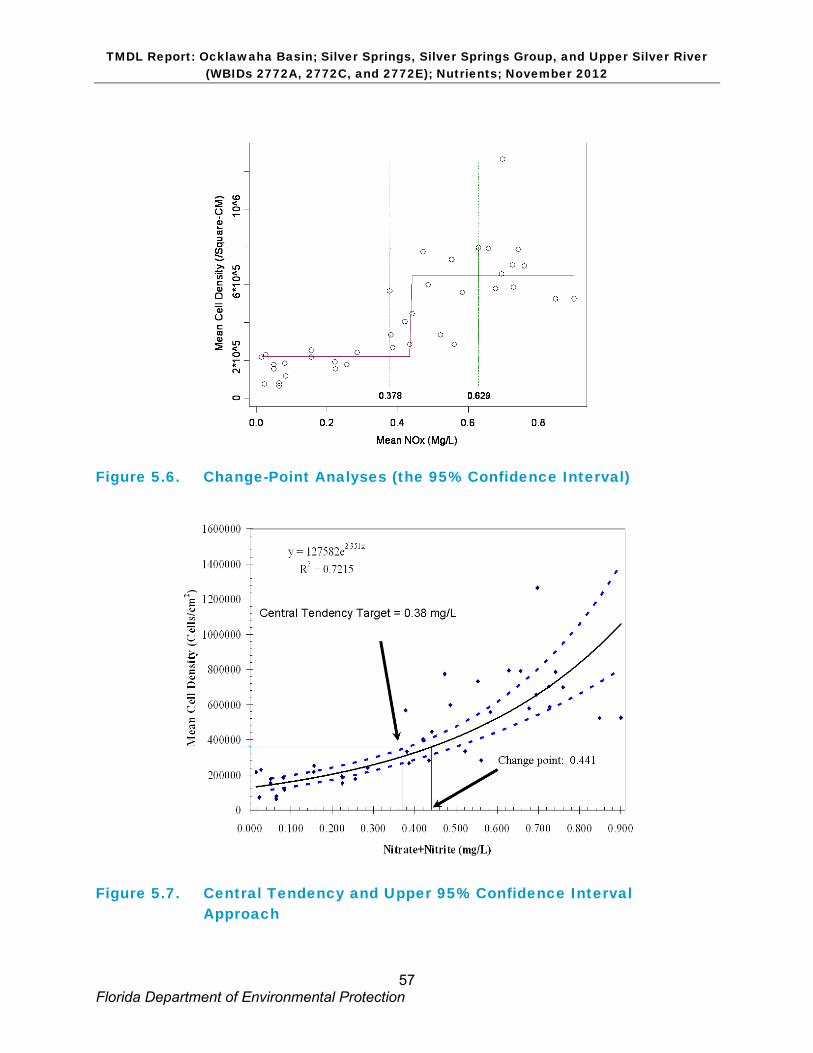
TMDL Report: Ocklawaha Basin; Silver Springs, Silver Springs Group, and Upper Silver River (WBIDs 2772A, 2772C, and 2772E); Nutrients; November 2012
57 Florida Department of Environmental Protection
Figure 5.6. Change-Point Analyses (the 95% Confidence Interval)
Figure 5.7. Central Tendency and Upper 95% Confidence Interval Approach
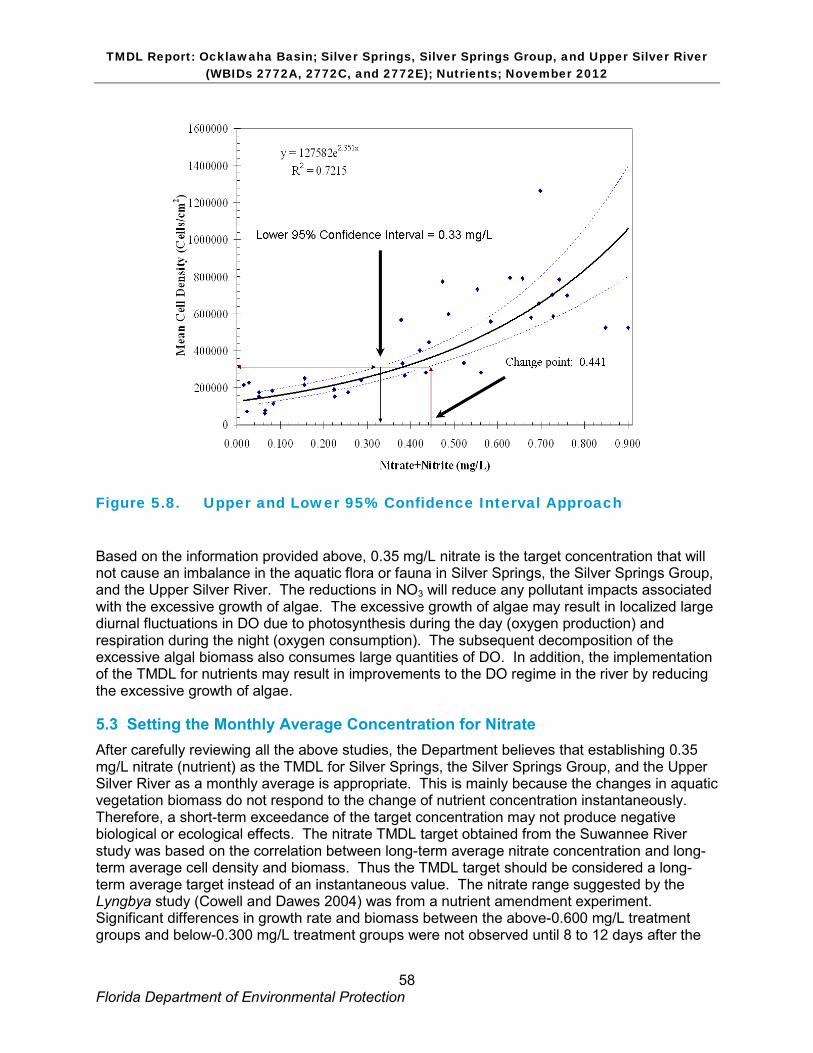
TMDL Report: Ocklawaha Basin; Silver Springs, Silver Springs Group, and Upper Silver River (WBIDs 2772A, 2772C, and 2772E); Nutrients; November 2012
58 Florida Department of Environmental Protection
Figure 5.8. Upper and Lower 95% Confidence Interval Approach Based on the information provided above, 0.35 mg/L nitrate is the target concentration that will not cause an imbalance in the aquatic flora or fauna in Silver Springs, the Silver Springs Group, and the Upper Silver River. The reductions in NO3 will reduce any pollutant impacts associated with the excessive growth of algae. The excessive growth of algae may result in localized large diurnal fluctuations in DO due to photosynthesis during the day (oxygen production) and respiration during the night (oxygen consumption). The subsequent decomposition of the excessive algal biomass also consumes large quantities of DO. In addition, the implementation of the TMDL for nutrients may result in improvements to the DO regime in the river by reducing the excessive growth of algae.
5.3 Setting the Monthly Average Concentration for Nitrate After carefully reviewing all the above studies, the Department believes that establishing 0.35 mg/L nitrate (nutrient) as the TMDL for Silver Springs, the Silver Springs Group, and the Upper Silver River as a monthly average is appropriate. This is mainly because the changes in aquatic vegetation biomass do not respond to the change of nutrient concentration instantaneously. Therefore, a short-term exceedance of the target concentration may not produce negative biological or ecological effects. The nitrate TMDL target obtained from the Suwannee River study was based on the correlation between long-term average nitrate concentration and long-term average cell density and biomass. Thus the TMDL target should be considered a long-term average target instead of an instantaneous value. The nitrate range suggested by the Lyngbya study (Cowell and Dawes 2004) was from a nutrient amendment experiment. Significant differences in growth rate and biomass between the above-0.600 mg/L treatment groups and below-0.300 mg/L treatment groups were not observed until 8 to 12 days after the
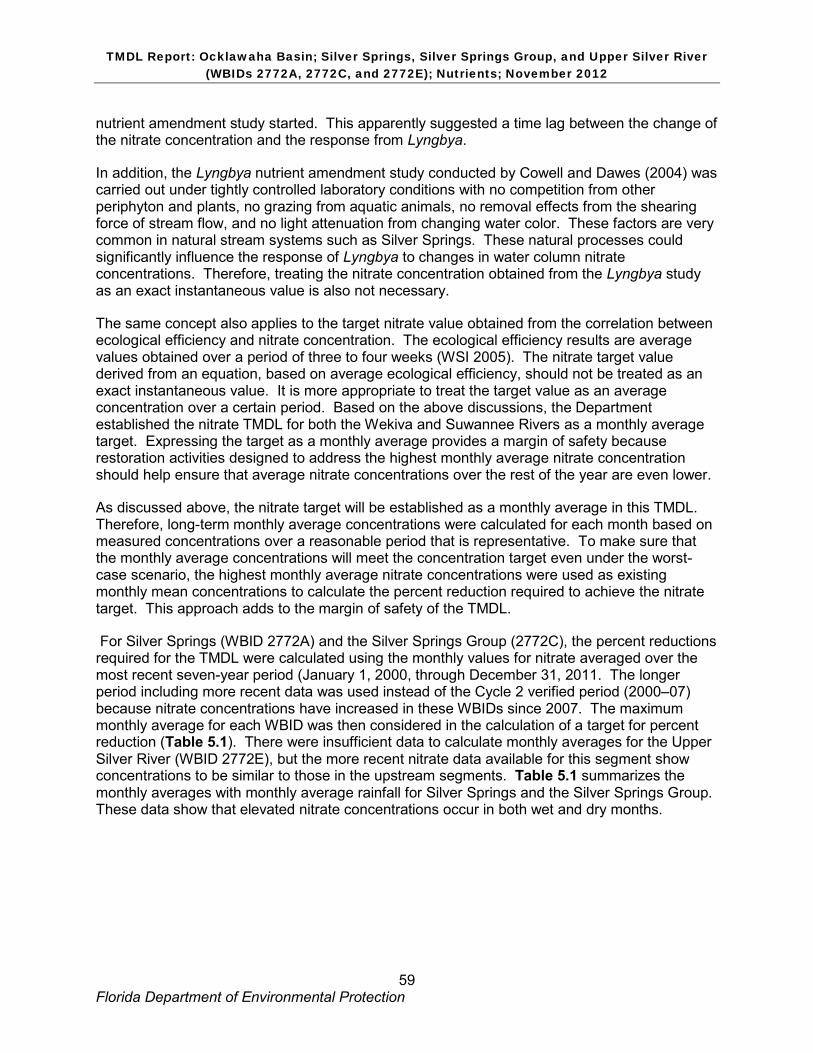
TMDL Report: Ocklawaha Basin; Silver Springs, Silver Springs Group, and Upper Silver River (WBIDs 2772A, 2772C, and 2772E); Nutrients; November 2012
59 Florida Department of Environmental Protection
nutrient amendment study started. This apparently suggested a time lag between the change of the nitrate concentration and the response from Lyngbya.
In addition, the Lyngbya nutrient amendment study conducted by Cowell and Dawes (2004) was carried out under tightly controlled laboratory conditions with no competition from other periphyton and plants, no grazing from aquatic animals, no removal effects from the shearing force of stream flow, and no light attenuation from changing water color. These factors are very common in natural stream systems such as Silver Springs. These natural processes could significantly influence the response of Lyngbya to changes in water column nitrate concentrations. Therefore, treating the nitrate concentration obtained from the Lyngbya study as an exact instantaneous value is also not necessary.
The same concept also applies to the target nitrate value obtained from the correlation between ecological efficiency and nitrate concentration. The ecological efficiency results are average values obtained over a period of three to four weeks (WSI 2005). The nitrate target value derived from an equation, based on average ecological efficiency, should not be treated as an exact instantaneous value. It is more appropriate to treat the target value as an average concentration over a certain period. Based on the above discussions, the Department established the nitrate TMDL for both the Wekiva and Suwannee Rivers as a monthly average target. Expressing the target as a monthly average provides a margin of safety because restoration activities designed to address the highest monthly average nitrate concentration should help ensure that average nitrate concentrations over the rest of the year are even lower.
As discussed above, the nitrate target will be established as a monthly average in this TMDL. Therefore, long-term monthly average concentrations were calculated for each month based on measured concentrations over a reasonable period that is representative. To make sure that the monthly average concentrations will meet the concentration target even under the worst-case scenario, the highest monthly average nitrate concentrations were used as existing monthly mean concentrations to calculate the percent reduction required to achieve the nitrate target. This approach adds to the margin of safety of the TMDL.
For Silver Springs (WBID 2772A) and the Silver Springs Group (2772C), the percent reductions required for the TMDL were calculated using the monthly values for nitrate averaged over the most recent seven-year period (January 1, 2000, through December 31, 2011. The longer period including more recent data was used instead of the Cycle 2 verified period (2000–07) because nitrate concentrations have increased in these WBIDs since 2007. The maximum monthly average for each WBID was then considered in the calculation of a target for percent reduction (Table 5.1). There were insufficient data to calculate monthly averages for the Upper Silver River (WBID 2772E), but the more recent nitrate data available for this segment show concentrations to be similar to those in the upstream segments. Table 5.1 summarizes the monthly averages with monthly average rainfall for Silver Springs and the Silver Springs Group. These data show that elevated nitrate concentrations occur in both wet and dry months.
TMDL Report: Ocklawaha Basin; Silver Springs, Silver Springs Group, and Upper Silver River (WBIDs 2772A, 2772C, and 2772E); Nutrients; November 2012
60 Florida Department of Environmental Protection
Table 5.1. Monthly Average Nitrate Concentrations for Silver Springs, the Silver Springs Group, and the Upper Silver River (2000–11)
1 Very limited dataset for WBID 2772E; not statistically valid ND = No data for this month - = Empty cell/no data
Month
Silver Springs (WBID 2772A)
Average (mg/L)
Silver Springs Group (WBID 2772C)
Average (mg/L)
Upper Silver River (WBID 2772E)
Average1
(mg/L)
30-Year Rainfall
(1981–2010) (inches)
January 1.18 1.69 0.98 (n=1) 3.55 February 1.09 1.60 ND 3.11
March 1.05 1.41 ND 4.02 April 1.08 1.41 0.97 (n=1) 2.78 May 0.95 1.43 ND 3.55 June 0.98 1.30 ND 7.20 July 1.08 1.45 ND 6.20
August 1.09 1.58 ND 5.84
September 1.07 1.38 1.30 (n=1) 5.60 October 1.14 1.46 ND 2.71
November 1.13 1.54 1.00 (n=1) 2.47 December 0.97 1.30 1.00 (n=1) 2.65 Maximum Monthly Average
1.18 1.69 Not calculated -
5.4 Critical Conditions/Seasonality Establishing the critical conditions for algae growth in a given watershed depends on many factors. For typical surface waters, the critical conditions exist when there is an extended dry period followed by a rainfall runoff event. During the wet weather period, rainfall washes off nutrients that have built up on the land surface under dry conditions. Similar correlations have also been noted for some spring systems, but they may not be as dramatically influenced by rain events. The water discharged from the springs that comprise the Silver Springs Group comes from infiltrating precipitation somewhere in the springshed that migrates within the UFA system to the spring vents. Water discharged from the vents comes from a mixture of sources and may range in age from days to decades. At Silver Springs, fluctuations in spring water quality have been observed, and these could be a response to flushing from seasonal rainfall events or to seasonal nonpoint impacts such as fertilization. However, throughout the year, nitrate concentrations remain above the 0.35 mg/L threshold for algal growth.
One potential seasonal influence on the growth of some forms of algae may be stream velocity, which is based on spring discharge, which is in turn influenced by precipitation. Stevenson et al. (2007) noted a positive correlation between current and the growth of Vaucheria. In addition, sediments that have accumulated for months may provide a flux of nutrients to the water column under certain weather or DO conditions. For the TMDL established for Silver Springs, the Silver Springs Group, and the Upper Silver River, there does not appear to be any correlation between monthly average nitrate concentrations and rainfall. However, Table 5.1 does show that the
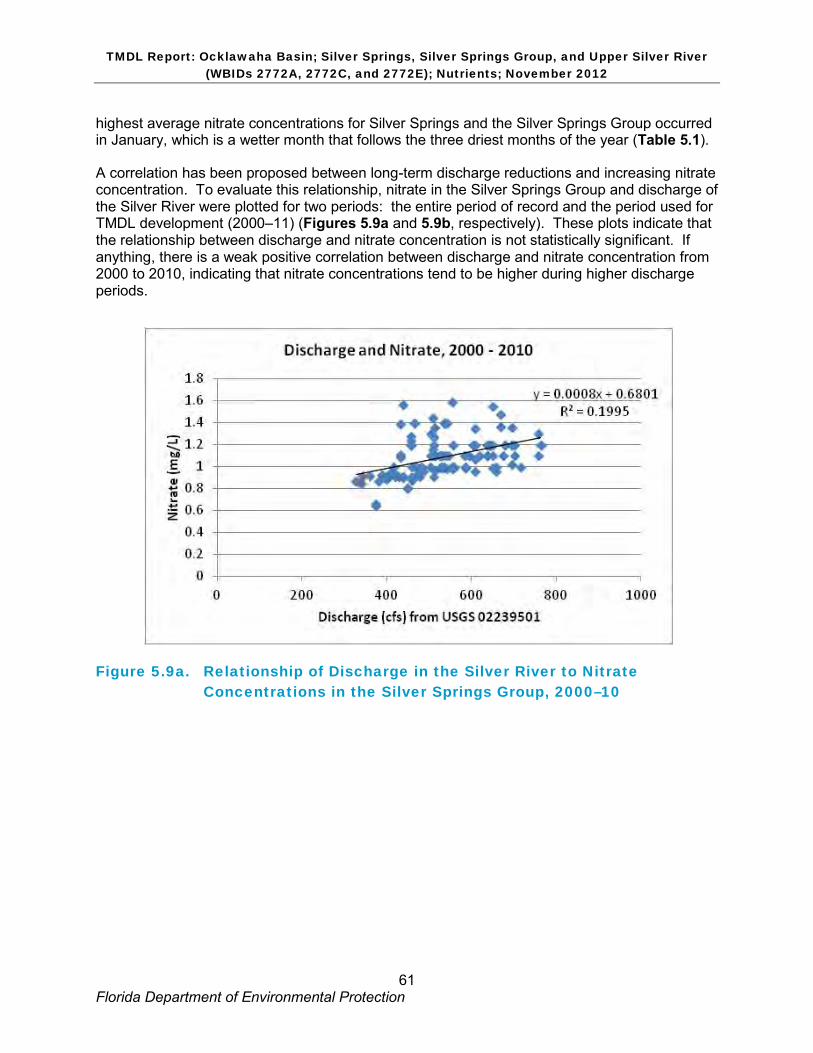
TMDL Report: Ocklawaha Basin; Silver Springs, Silver Springs Group, and Upper Silver River (WBIDs 2772A, 2772C, and 2772E); Nutrients; November 2012
61 Florida Department of Environmental Protection
highest average nitrate concentrations for Silver Springs and the Silver Springs Group occurred in January, which is a wetter month that follows the three driest months of the year (Table 5.1).
A correlation has been proposed between long-term discharge reductions and increasing nitrate concentration. To evaluate this relationship, nitrate in the Silver Springs Group and discharge of the Silver River were plotted for two periods: the entire period of record and the period used for TMDL development (2000–11) (Figures 5.9a and 5.9b, respectively). These plots indicate that the relationship between discharge and nitrate concentration is not statistically significant. If anything, there is a weak positive correlation between discharge and nitrate concentration from 2000 to 2010, indicating that nitrate concentrations tend to be higher during higher discharge periods.
Figure 5.9a. Relationship of Discharge in the Silver River to Nitrate Concentrations in the Silver Springs Group, 2000–10
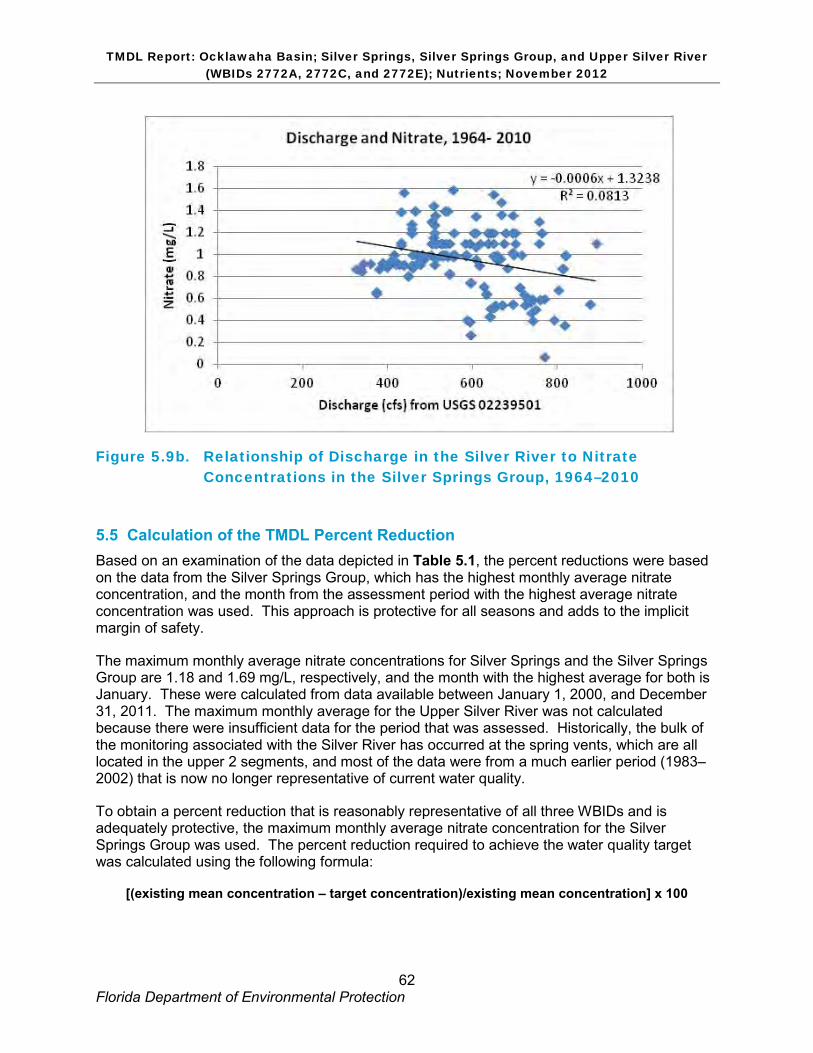
TMDL Report: Ocklawaha Basin; Silver Springs, Silver Springs Group, and Upper Silver River (WBIDs 2772A, 2772C, and 2772E); Nutrients; November 2012
62 Florida Department of Environmental Protection
Figure 5.9b. Relationship of Discharge in the Silver River to Nitrate Concentrations in the Silver Springs Group, 1964–2010
5.5 Calculation of the TMDL Percent Reduction Based on an examination of the data depicted in Table 5.1, the percent reductions were based on the data from the Silver Springs Group, which has the highest monthly average nitrate concentration, and the month from the assessment period with the highest average nitrate concentration was used. This approach is protective for all seasons and adds to the implicit margin of safety.
The maximum monthly average nitrate concentrations for Silver Springs and the Silver Springs Group are 1.18 and 1.69 mg/L, respectively, and the month with the highest average for both is January. These were calculated from data available between January 1, 2000, and December 31, 2011. The maximum monthly average for the Upper Silver River was not calculated because there were insufficient data for the period that was assessed. Historically, the bulk of the monitoring associated with the Silver River has occurred at the spring vents, which are all located in the upper 2 segments, and most of the data were from a much earlier period (1983–2002) that is now no longer representative of current water quality.
To obtain a percent reduction that is reasonably representative of all three WBIDs and is adequately protective, the maximum monthly average nitrate concentration for the Silver Springs Group was used. The percent reduction required to achieve the water quality target was calculated using the following formula:
[(existing mean concentration – target concentration)/existing mean concentration] x 100
TMDL Report: Ocklawaha Basin; Silver Springs, Silver Springs Group, and Upper Silver River (WBIDs 2772A, 2772C, and 2772E); Nutrients; November 2012
63 Florida Department of Environmental Protection
For the Silver Springs Group: [(1.69 mg/L – 0.35 mg/L) / 1.69 mg/L] * 100
Equals a 79% reduction in nitrate.
A 79% percent reduction in the nitrate concentrations in all 3 WBIDs is proposed because it is a protective value that, when achieved, will satisfy the nutrient reduction requirement for the system. The nitrate in these 3 segments comes almost entirely from ground water discharging from the Silver Springs main vent and the springs complex within the Silver Springs Group. The elevated nitrate concentrations in the Upper Silver River are from the upstream sources, and thus no additional reductions from this segment are needed.
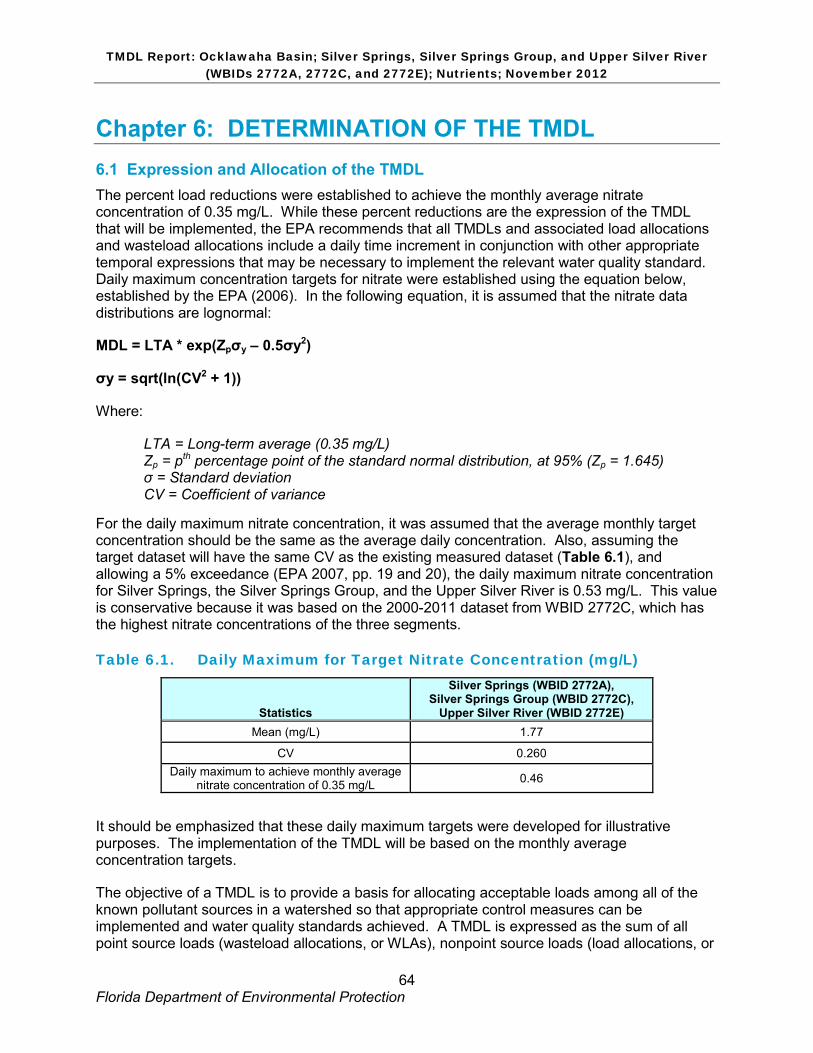
TMDL Report: Ocklawaha Basin; Silver Springs, Silver Springs Group, and Upper Silver River (WBIDs 2772A, 2772C, and 2772E); Nutrients; November 2012
64 Florida Department of Environmental Protection
Chapter 6: DETERMINATION OF THE TMDL 6.1 Expression and Allocation of the TMDL The percent load reductions were established to achieve the monthly average nitrate concentration of 0.35 mg/L. While these percent reductions are the expression of the TMDL that will be implemented, the EPA recommends that all TMDLs and associated load allocations and wasteload allocations include a daily time increment in conjunction with other appropriate temporal expressions that may be necessary to implement the relevant water quality standard. Daily maximum concentration targets for nitrate were established using the equation below, established by the EPA (2006). In the following equation, it is assumed that the nitrate data distributions are lognormal:
MDL = LTA * exp(Zpσy – 0.5σy2)
σy = sqrt(ln(CV2 + 1))
Where:
LTA = Long-term average (0.35 mg/L) Zp = pth percentage point of the standard normal distribution, at 95% (Zp = 1.645) σ = Standard deviation CV = Coefficient of variance
For the daily maximum nitrate concentration, it was assumed that the average monthly target concentration should be the same as the average daily concentration. Also, assuming the target dataset will have the same CV as the existing measured dataset (Table 6.1), and allowing a 5% exceedance (EPA 2007, pp. 19 and 20), the daily maximum nitrate concentration for Silver Springs, the Silver Springs Group, and the Upper Silver River is 0.53 mg/L. This value is conservative because it was based on the 2000-2011 dataset from WBID 2772C, which has the highest nitrate concentrations of the three segments.
Table 6.1. Daily Maximum for Target Nitrate Concentration (mg/L)
Statistics
Silver Springs (WBID 2772A), Silver Springs Group (WBID 2772C),
Upper Silver River (WBID 2772E) Mean (mg/L) 1.77
CV 0.260 Daily maximum to achieve monthly average
nitrate concentration of 0.35 mg/L 0.46
It should be emphasized that these daily maximum targets were developed for illustrative purposes. The implementation of the TMDL will be based on the monthly average concentration targets.
The objective of a TMDL is to provide a basis for allocating acceptable loads among all of the known pollutant sources in a watershed so that appropriate control measures can be implemented and water quality standards achieved. A TMDL is expressed as the sum of all point source loads (wasteload allocations, or WLAs), nonpoint source loads (load allocations, or
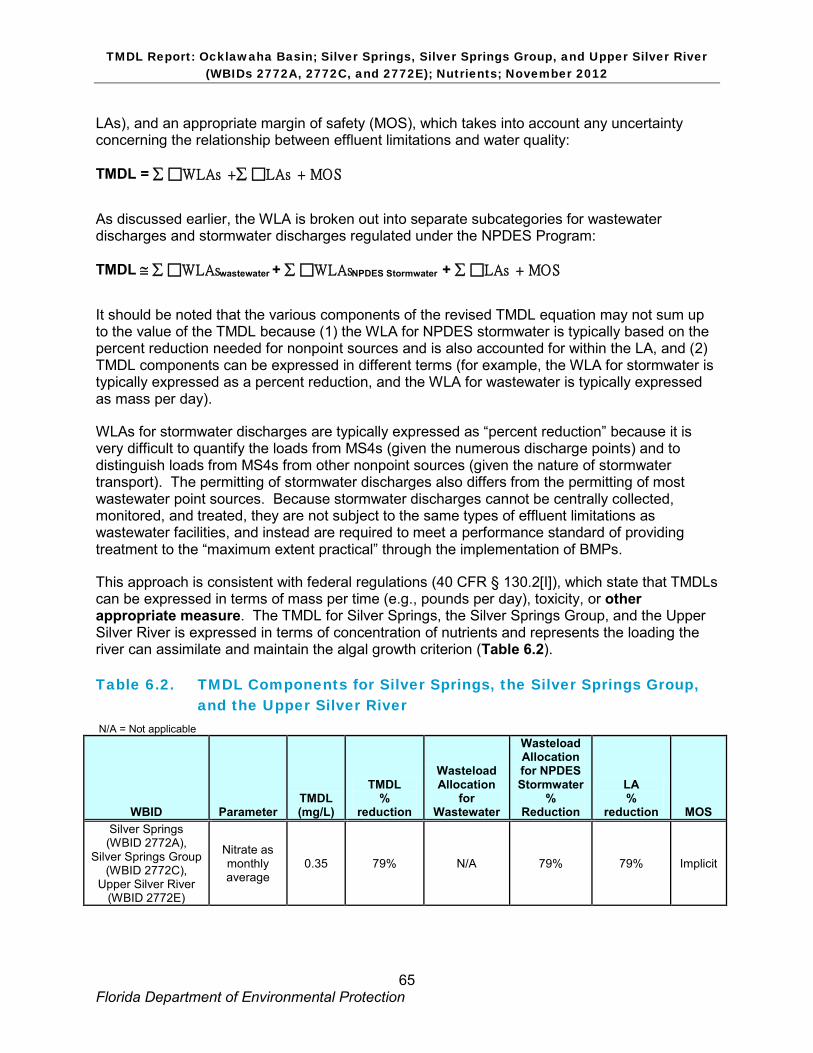
TMDL Report: Ocklawaha Basin; Silver Springs, Silver Springs Group, and Upper Silver River (WBIDs 2772A, 2772C, and 2772E); Nutrients; November 2012
65 Florida Department of Environmental Protection
LAs), and an appropriate margin of safety (MOS), which takes into account any uncertainty concerning the relationship between effluent limitations and water quality:
TMDL = ∑ WLAs + ∑ LAs + MOS
As discussed earlier, the WLA is broken out into separate subcategories for wastewater discharges and stormwater discharges regulated under the NPDES Program:
TMDL ≅ ∑ WLAswastewater + ∑ WLAsNPDES Stormwater + ∑ LAs + MOS
It should be noted that the various components of the revised TMDL equation may not sum up to the value of the TMDL because (1) the WLA for NPDES stormwater is typically based on the percent reduction needed for nonpoint sources and is also accounted for within the LA, and (2) TMDL components can be expressed in different terms (for example, the WLA for stormwater is typically expressed as a percent reduction, and the WLA for wastewater is typically expressed as mass per day).
WLAs for stormwater discharges are typically expressed as “percent reduction” because it is very difficult to quantify the loads from MS4s (given the numerous discharge points) and to distinguish loads from MS4s from other nonpoint sources (given the nature of stormwater transport). The permitting of stormwater discharges also differs from the permitting of most wastewater point sources. Because stormwater discharges cannot be centrally collected, monitored, and treated, they are not subject to the same types of effluent limitations as wastewater facilities, and instead are required to meet a performance standard of providing treatment to the “maximum extent practical” through the implementation of BMPs.
This approach is consistent with federal regulations (40 CFR § 130.2[I]), which state that TMDLs can be expressed in terms of mass per time (e.g., pounds per day), toxicity, or other appropriate measure. The TMDL for Silver Springs, the Silver Springs Group, and the Upper Silver River is expressed in terms of concentration of nutrients and represents the loading the river can assimilate and maintain the algal growth criterion (Table 6.2).
Table 6.2. TMDL Components for Silver Springs, the Silver Springs Group, and the Upper Silver River
N/A = Not applicable
WBID Parameter TMDL (mg/L)
TMDL %
reduction
Wasteload Allocation
for Wastewater
Wasteload Allocation for NPDES Stormwater
% Reduction
LA %
reduction MOS Silver Springs (WBID 2772A),
Silver Springs Group (WBID 2772C),
Upper Silver River (WBID 2772E)
Nitrate as monthly average
0.35 79% N/A 79% 79% Implicit
TMDL Report: Ocklawaha Basin; Silver Springs, Silver Springs Group, and Upper Silver River (WBIDs 2772A, 2772C, and 2772E); Nutrients; November 2012
66 Florida Department of Environmental Protection
6.2 Load Allocation Because no target loads were explicitly calculated in this TMDL report, the TMDL is represented as the percent reduction required to achieve the nitrate target. The percent reduction assigned to all the nonpoint source areas (LA) is the same as that defined for the TMDL percent reduction. To achieve the monthly average nitrate target of 0.35 mg/L in Silver Springs, the Silver Springs Group, or the Upper Silver River, the nitrate loads that result from inputs of nitrogen from nonpoint sources need to be reduced by 79%. The target monthly average nitrate of 0.35 mg/L and the percent reduction represent an estimate of the maximum amount of reduction required to meet the target. It may be possible to meet the target before achieving the percent reductions. It should be noted that the LA also includes loading from stormwater discharges regulated by the Department and the water management district that are not part of the NPDES Stormwater Program, as well as the loading of stormwater discharges to ground water (see Appendix C).
6.3 Wasteload Allocation
6.3.1 NPDES Wastewater Discharges Currently, there are no NPDES wastewater facilities that discharge directly into Silver Springs, the Silver Springs Group, or the Upper Silver River. Any new potential discharger is expected to comply with the Class III criterion for nutrients and with nitrate limits consistent with this TMDL.
6.3.2 NPDES Stormwater Discharges Currently, the untreated discharges of stormwater from NPDES MS4 stormwater facilities directly into Silver Springs, the Silver Springs Group, or the Upper Silver River are limited. In addition, there are no entities covered under general NPDES stormwater permits that discharge to the system. The 79% wasteload allocation to MS4 facilities in Table 6.2 applies to nitrate derived from direct discharges of nitrogen to surface water and not discharges to ground water. Recent stormwater projects to minimize pollutant discharges will be included in the BMAP process.
6.4 Margin of Safety Consistent with the recommendations of the Allocation Technical Advisory Committee (Department 2001b), an implicit MOS was used in the development of this TMDL, and was provided by the conservative decisions associated with a number of assumptions and the development of assimilative capacity. For example, the nitrate target was established based on a conservative concentration from the 4 lines of evidence (Section 5). Requiring the 0.35 mg/L target to be met every month should result in a nitrate concentration even lower than the target concentration during the summer algal growth season based on a seasonal analysis of the nitrate concentration, and therefore adds to the MOS. In addition, when estimating the required percent reduction to achieve the water quality target, the highest long-term monthly average of measured nitrate concentrations was used instead of the average of the monthly averages. This will make estimating the required percent load reduction more conservative and therefore adds to the MOS.
TMDL Report: Ocklawaha Basin; Silver Springs, Silver Springs Group, and Upper Silver River (WBIDs 2772A, 2772C, and 2772E); Nutrients; November 2012
67 Florida Department of Environmental Protection
Chapter 7: NEXT STEPS: IMPLEMENTATION PLAN DEVELOPMENT AND BEYOND 7.1 Basin Management Action Plan Following the adoption of this TMDL by rule, the Department will determine the best course of action regarding its implementation. Depending on the pollutant(s) causing the waterbody impairment and the significance of the waterbody, the Department will select the best course of action leading to the development of a plan to restore the waterbody. Often this will be accomplished cooperatively with stakeholders by creating a Basin Management Action Plan, referred to as the BMAP. BMAPs are the primary mechanism through which TMDLs are implemented in Florida (see Subsection 403.067[7], F.S.). A single BMAP may provide the conceptual plan for the restoration of one or many impaired waterbodies.
If the Department determines that a BMAP is needed to support the implementation of this TMDL, it will be developed through a transparent, stakeholder-driven process intended to result in a plan that is cost-effective, is technically feasible, and meets the restoration needs of the applicable waterbodies.
Once adopted by order of the Department Secretary, BMAPs are enforceable through wastewater and municipal stormwater permits for point sources and through BMP implementation for nonpoint sources. Among other components, BMAPs typically include the following:
• Water quality goals (based directly on the TMDL);
• Refined source identification;
• Load reduction requirements for stakeholders (quantitative detailed allocations, if technically feasible);
• A description of the load reduction activities to be undertaken, including structural projects, nonstructural BMPs, and public education and outreach;
• A description of further research, data collection, or source identification needed in order to achieve the TMDL;
• Timetables for implementation;
• Implementation funding mechanisms;
• An evaluation of future increases in pollutant loading due to population growth;
• Implementation milestones, project tracking, water quality monitoring, and adaptive management procedures; and
• Stakeholder statements of commitment (typically a local government resolution).
BMAPs are updated through annual meetings and may be officially revised every five years. Completed BMAPs in the state have improved communication and cooperation among local
TMDL Report: Ocklawaha Basin; Silver Springs, Silver Springs Group, and Upper Silver River (WBIDs 2772A, 2772C, and 2772E); Nutrients; November 2012
68 Florida Department of Environmental Protection
stakeholders and state agencies; improved internal communication within local governments; applied high-quality science and local information to the management of water resources; clarified the obligations of wastewater point source, MS4, and non-MS4 stakeholders in TMDL implementation; enhanced transparency in the Department’s decision making; and built strong relationships between the Department and local stakeholders that have benefited other program areas.
TMDL Report: Ocklawaha Basin; Silver Springs, Silver Springs Group, and Upper Silver River (WBIDs 2772A, 2772C, and 2772E); Nutrients; November 2012
69 Florida Department of Environmental Protection
References Albertin, A.R. 2009. Nutrient dynamics in Florida springs and relationships to algal blooms.
Ph.D. dissertation. Gainesville, FL: University of Florida.
Allen, R.E. 1946. Fishes of Silver Springs, Florida. No publisher.
Baker, A.E., and J.R. Cichon. 2007. The Marion County aquifer vulnerability assessment. Marion County Board of County Commissioners.
Bonn, M.A. 2004. Visitor profiles, economic impacts, and recreational aesthetic values associated with eight priority Florida springs located in the St. Johns River Water Management District. St. Johns River Water Management District.
Butt, P., A. Aly, and D. Toth (eds). 2008. Silver Springs spring vent documentation and geochemical characterization. St. Johns River Water Management District Special Publication SJ2008-SP6.
Cowell, B.C., and C.J. Dawes. 2004. Growth and nitrate-nitrogen uptake by the cyanobacterium Lyngbya wollei. Notes. J Aquat Plant Manage 42: 69-71.
Faulkner, G. 1973. Geohydrology of the Cross-Florida Barge Canal area with special reference to the Ocala vicinity. U.S. Geological Survey Water-Resources Investigations Report 1-73.
Ferguson, G.E., C.W. Lingham, S.K. Love, and R.O. Vernon. 1947. Springs of Florida. Florida Geological Survey 31: 1–197.
Florida Department of Environmental Protection. 2001a. Basin status report: Ocklawaha. Tallahassee, FL: Division of Water Resource Management.
———. 2001b. A report to the Governor and the Legislature on the allocation of Total Maximum Daily Loads in Florida. Tallahassee, FL: Bureau of Watershed Management.
———. 2008. Standard Operating Procedure (SOP) FS7420. Available: http://www.dep.state.fl.us/water/sas/sop/sops.htm.
———. 2011a. Florida state park system economic impact assessment for FY 2010/2011. Tallahassee, FL: Division of Recreation and Parks.
———. 2011b. Draft restoration plan for Silver Springs. Prepared for the Florida Department of Environmental Protection by Normandeau Associates, Inc., Gainesville, FL.
———. 2012. Bureau of Laboratories technical reports. Tallahassee, FL: Environmental Assessment Section. Available: http://www.dep.state.fl.us/labs/cgi-bin/reports/results.asp.
Gao, X. November 15, 2007. Nutrient TMDLs for the Wekiva River (WBIDs 2956, 2956A, and 2956C) and Rock Springs Run (WBID 2967). TMDL report. Tallahassee, FL: Florida Department of Environmental Protection, Division of Environmental Assessment and Restoration, Bureau of Watershed Restoration.
TMDL Report: Ocklawaha Basin; Silver Springs, Silver Springs Group, and Upper Silver River (WBIDs 2772A, 2772C, and 2772E); Nutrients; November 2012
70 Florida Department of Environmental Protection
Garber, M.P., J.M. Ruter, J.T. Midcap, and K. Bondari. October-December 2002. Survey of container nursery irrigation practices in Georgia. HortTechnology 12(4).
German, E.R. 2006. Assessment of spring discharge measurement data for priority springs in the St. Johns River Water Management District. Special Publication SJ2006-SP9.
———. July 7, 2010. Evaluation and recomputation of daily-discharge for Silver Springs near Ocala, Florida. Special Publication SJ2010-SP9. St. Johns River Water Management District. Available: http://www.sjrwmd.com/technicalreports/pdfs/SP/SJ2010-SP9.pdf.
Gilbert, D. 2012. Nutrient (biology) TMDL for the Wakulla River, WBID 1006. TMDL report. Tallahassee, FL: Florida Department of Environmental Protection, Division of Environmental Assessment and Restoration, Bureau of Watershed Restoration.
Hall, P., and S.J. Clancy. 2009. The Florida statewide inventory of onsite sewage treatment and disposal systems (OSTDS): Final draft report and database. Prepared for the Florida Department of Health, Bureau of Onsite Sewage Programs, by EarthSTEPS and GlobalMind.
Hallas, J.F., and W. Magley. September 2008. Nutrient and dissolved oxygen TMDL for the Suwannee River, Santa Fe River, Manatee Springs (3422R), Fanning Springs (3422S), Branford Spring (3422J), Ruth Spring (3422L), Troy Spring (3422T), Royal Spring (3422U), and Falmouth Spring (3422Z) . TMDL report. Tallahassee, FL: Florida Department of Environmental Protection, Division of Environmental Assessment and Restoration, Bureau of Watershed Restoration.
Hand, J. February 2009. Florida springs assessment decision matrix. Tallahassee, FL: Florida Department of Environmental Protection, Watershed Assessment Section.
Harrington, D., G. Maddox, and R. Hicks. February 2010. Florida Springs Initiative Monitoring Network report and recognized sources of nitrate. Tallahassee, FL: Florida Department of Environmental Protection, Division of Environmental Assessment and Restoration, Bureau of Watershed Restoration, Ground Water Protection Section.
Hazen and Sawyer. August 2009. Florida onsite sewage nitrogen reduction strategies study: Task A.2, Final report, Literature review of nitrogen reduction technologies for onsite sewage treatment systems. Florida Department of Health Contract CORCL.
Hicks, R., D. Harrington, and G. Maddox. March 2009. Documentation to support listing of nutrient impaired springs and spring runs (Volusia Blue Spring and Volusia Blue Spring Run; DeLeon Spring; Jackson Blue Spring and Merritts Mill Pond; Silver Springs, Silver Springs Group, and Upper Silver River; Rainbow Springs Group and Rainbow Springs Group Run; and Weeki Wachee Spring and Weeki Wachee Spring Run. Tallahassee, FL: Florida Department of Environmental Protection, Division of Environmental Assessment and Restoration, Bureau of Watershed Restoration, Ground Water Protection Section.
Higgins, S., S. Workman, V.N. Gallagher, and D.J. Stamper. 2008. Composting horse muck. Cooperative Extension Services Publication ID-168. Lexington, KY: University of Kentucky, College of Agriculture.
TMDL Report: Ocklawaha Basin; Silver Springs, Silver Springs Group, and Upper Silver River (WBIDs 2772A, 2772C, and 2772E); Nutrients; November 2012
71 Florida Department of Environmental Protection
Hornsby, D., R, A. Mattson, and T. Mirti. 2000. Surface water quality and biological monitoring: Annual report, 1999. Suwannee River Water Management District Technical Report WR-00-04, iv.
Katz, B.G., H.D. Hornsby, J.K. Bohlke, and M.F. Mokray. 1999. Sources and chronology of nitrate contamination in spring waters, Suwannee River Basin, Florida. U.S. Geological Survey Water-Resources Investigations Report 99-4252.
Knight, R.L. 1980. Energy basis of control in aquatic ecosystems. Ph.D. dissertation. Gainesville, FL: University of Florida.
———. 1983. Energy basis of ecosystem control at Silver Springs, Florida. In: T.D. Fontaine and S.M. Bartell (eds.), Dynamics of lotic ecosystems (Ann Arbor, MI: Ann Arbor Science Publishers, pp. 161–79).
Knowles, L., Jr., A.M. O’Reilly, and J.C. Adamski. 2002. Hydrogeology and simulated effects of ground-water withdrawals from the Floridan aquifer system in Lake County and in the Ocala National Forest and vicinity, north-central Florida. U.S. Geological Survey Water-Resources Investigations Report 02-4207.
Knowles, L., B.G. Katz, and D.J Toth. 2010. Using multiple chemical indicators to characterize and determine the age of ground water from selected vents of the Silver Springs Group, central Florida, USA. Hydrogeol J 18: 1825–1838.
Kuphal, T. 2005. Quantification of domestic wastewater discharge and associated nitrate loading in Marion County, Florida. Report prepared for the Marion County Planning Department.
Marion County. 2008. Ordinance No. 08-35, § 1, 11-4-08.
McGurk, B.E., J.B. Davis, J.A. Stokes, and D.J. Toth, with URS Corporation and Karst Environmental Services. 2011. Silver Springs nutrient pathway characterization project, Final report. St. Johns River Water Management District Special Publication SJ2012-SP3.
Motz, L.H., and A. Dogan. 2002. Revised north central Florida regional ground water flow model. Prepared for the St. Johns River Water Management District.
———. 2004. North-central Florida active water-table regional ground water model. Contract report prepared by the Department of Civil and Coastal Engineering, University of Florida, for the St. Johns River Water Management District.
Munch, D.A., D. Toth, C. Huang, J. Davis, and C.M. Fortich et al. 2006. Fifty-year retrospective study of the ecology of Silver Springs, Florida. St. Johns River Water Management District Special Publication SJ2007-SP4.
Mylavarapu, R., D. Wright, G. Kidder, and C.G. Chambliss. 2009. UF/IFAS standardized fertilization recommendations for agronomic crops. SL129. Gainesville, FL: Soil and Water Science Department, Florida Cooperative Extension Service, Institute of Food and Agricultural Sciences, University of Florida.
TMDL Report: Ocklawaha Basin; Silver Springs, Silver Springs Group, and Upper Silver River (WBIDs 2772A, 2772C, and 2772E); Nutrients; November 2012
72 Florida Department of Environmental Protection
National Oceanic and Atmospheric Administration. 2010. Online meteorological data.
Niu, X.-F. June-August 2008. Change point analysis of Suwannee River algal data based on an updated data set. Tallahassee, FL: Florida State University, Department of Statistics.
O’Connell, M., B. Treder, and D. Toth. 2008. Cluster analysis and principal component analysis of water quality data from Silver Springs and wells in the spring shed. St. Johns River Water Management District Special Publication SJ2008-SP20.
Odum, H.T. 1957. Primary production measurements in eleven Florida springs and a marine turtlegrass community. Limnol Oceanogr 2:85-97.
Osborn, W., D. Toth, and D. Boniol. 2002. Springs of the St. Johns River Water Management District. Technical Report SJ2006-3.
Phelps, G.G. 2004. Chemistry of ground water in the Silver Springs Basin, Florida, with an emphasis on nitrate. U.S. Geological Survey Scientific Investigations Report 2004-5144. Denver, CO.
Quinlan, E.L., E.J. Philips, K.A. Donnelly, C.H. Jett, P. Sleszynski, and S. Keller. 2008. Primary producers and nutrient loading in Silver Springs, FL, USA. Aquat Bot 88: 247–255.
Rosenau, J.C., G.L. Faulkner, C.W. Hendry, Jr., and R.W. Hull. 1977. Springs of Florida. Florida Geological Survey 31, revised.
Sartain, J.B., L.T. Trenholm, E.F. Gilman, T.A. Obreza, and G. Toor. 2009. Frequently asked questions about landscaping fertilization for Florida-friendly landscaping ordinances. ENH1115. Gainesville, FL: Soil and Water Science Department, Florida Cooperative Extension Service, Institute of Food and Agricultural Sciences, University of Florida.
Scott, T.M., K.M. Campbell, F.R. Rupert, J.D. Arthur, and T.M. Missimer et al. 2001. Geologic map of the state of Florida. Florida Department of Environmental Protection, Florida Geological Survey Map Series 146.
Scott, T.M., G.H. Means, R.P. Meegan, R.C. Means, and S.B. Upchurch et al. 2004. Springs of Florida. Florida Geological Survey 66.
Sepulveda, N. 2002. Simulation of ground-water flow in the intermediate and Floridan aquifer systems in peninsular Florida. U.S. Geological Survey Water-Resources Investigations Report 02-4009.
Shoemaker, W.B., A. O’Reilly, N. Sepúlveda, S. Williams, L.H. Motz, and Q. Sun. 2004. Comparison of estimated areas contributing recharge to selected springs in north-central Florida by using multiple ground-water flow models. U.S. Geological Survey Open-File Report 03-0448.
St. Johns River Water Management District. 2004. Land use–land cover GIS coverage.
———. 2010. Evaluation and recomputation of daily-discharge for Silver Springs near Ocala, Florida. Special Publication SJ2010-SP9.
TMDL Report: Ocklawaha Basin; Silver Springs, Silver Springs Group, and Upper Silver River (WBIDs 2772A, 2772C, and 2772E); Nutrients; November 2012
73 Florida Department of Environmental Protection
Stevenson, R.J., A. Pinowska, and Y.K. Yang. 2004. Ecological condition of algae and nutrients in Florida springs. Tallahassee, FL: Florida Department of Environmental Protection.
Stevenson, R.J., A. Pinowska, A. Albertin, and J.O. Sickman. 2007. Ecological condition of algae and nutrients in Florida springs: The synthesis report. Submitted to the Florida Department of Environmental Protection.
Toth, D.J. 2003. Water quality and isotope concentrations from selected springs in the St. Johns River Water Management District. Technical Publication SJ2003-1. Palatka, FL: St. Johns River Water Management District.
———. 2007. Silver Springs ground water basin (predevelopment: 1936) Florida. Digitized from Johnston et al., 1980, U.S. Geological Survey.
Upchurch, S.B., and M.D. Farrell. 2005. Strategies and recommendations for protecting Silver and Rainbow Springs. A report to the Marion County Board of County Commissioners by Water Resources Associates in association with SDII Global Corporation.
U.S. Census Bureau. 2012. Available: http://www.census.gov/.
U.S. Environmental Protection Agency. November 2006. Memorandum establishing TMDL “daily” loads in light of the decision by the U.S. Court of Appeals for the D.C. Circuit in Friends of the Earth, Inc. v. EPA et al., No.05-5015 (D.C. Cir. 2006) and implications for NPDES permits. Washington, DC.
———. June 2007. Options for expressing daily load in TMDL (The Option).
U.S. Geological Survey. 2012. Silver Springs. Available: http://fl.biology.usgs.gov/OFR_2006-1107/Silver_Springs/silver_springs.html.
Wetland Solutions, Inc. 2005. Pollutant Load Reduction Goal (PLRG) analysis for the Wekiva River and Rock Springs Run, Florida. Final Report. Prepared for the St. Johns River Water Management District, Palatka, FL.
Wetland Solutions, Inc. 2007. Pollutant Load Reduction Goal (PLRG) analysis for the Wekiva River and Rock Springs Run, Florida, 2006–2007. Final Phase 3 report. Special Publication SJ2008-SP2. Prepared for the St. Johns River Water Management District, Palatka, FL.
Yeager, T.H. 2009. Current fertilization practices used in container nurseries. Unpublished manuscript. Gainesville, FL: University of Florida Institute of Food and Agricultural Sciences.
TMDL Report: Ocklawaha Basin; Silver Springs, Silver Springs Group, and Upper Silver River (WBIDs 2772A, 2772C, and 2772E); Nutrients; November 2012
74 Florida Department of Environmental Protection
Appendices
Appendix A: Background Information on Federal and State Stormwater Programs In 1982, Florida became the first state in the country to implement statewide regulations to address the issue of nonpoint source pollution by requiring new development and redevelopment to treat stormwater before it is discharged. The Stormwater Rule, as authorized in Chapter 403, F.S., was established as a technology-based program that relies on the implementation of BMPs that are designed to achieve a specific level of treatment (i.e., performance standards) as set forth in Rule 62-40, F.A.C. In 1994, the Department’s stormwater treatment requirements were integrated with the stormwater flood control requirements of the water management districts, along with wetland protection requirements, into the Environmental Resource Permit (ERP) regulations.
Rule 62-40, F.A.C., also requires the state’s water management districts to establish stormwater pollutant load reduction goals (PLRGs) and adopt them as part of a Surface Water Improvement and Management (SWIM) plan, other watershed plan, or rule. Stormwater PLRGs are a major component of the load allocation part of a TMDL. To date, stormwater PLRGs have been established for Tampa Bay, Lake Thonotosassa, the Winter Haven Chain of Lakes, the Everglades, Lake Okeechobee, and Lake Apopka.
In 1987, the U.S. Congress established Section 402(p) as part of the federal Clean Water Act Reauthorization. This section of the law amended the scope of the federal NPDES permitting program to designate certain stormwater discharges as “point sources” of pollution. The EPA promulgated regulations and began implementing the Phase I NPDES Stormwater Program in 1990. These stormwater discharges include certain discharges that are associated with industrial activities designated by specific standard industrial classification (SIC) codes, construction sites disturbing 5 or more acres of land, and the master drainage systems of local governments with a population above 100,000, which are better known as MS4s. However, because the master drainage systems of most local governments in Florida are interconnected, the EPA implemented Phase I of the MS4 permitting program on a countywide basis, which brought in all cities (incorporated areas), Chapter 298 urban water control districts, and FDOT throughout the 15 counties meeting the population criteria. The Department received authorization to implement the NPDES Stormwater Program in 2000.
An important difference between the federal NPDES and the state’s Stormwater/ERP Programs is that the NPDES Program covers both new and existing discharges, while the state’s program focus on new discharges only. Additionally, Phase II of the NPDES Program, implemented in 2003, expands the need for these permits to construction sites between 1 and 5 acres, and to local governments with as few as 1,000 people. While these urban stormwater discharges are now technically referred to as “point sources” for the purpose of regulation, they are still diffuse sources of pollution that cannot be easily collected and treated by a central treatment facility, as are other point sources of pollution such as domestic and industrial wastewater discharges. It should be noted that all MS4 permits issued in Florida include a reopener clause that allows permit revisions to implement TMDLs when the implementation plan is formally adopted.
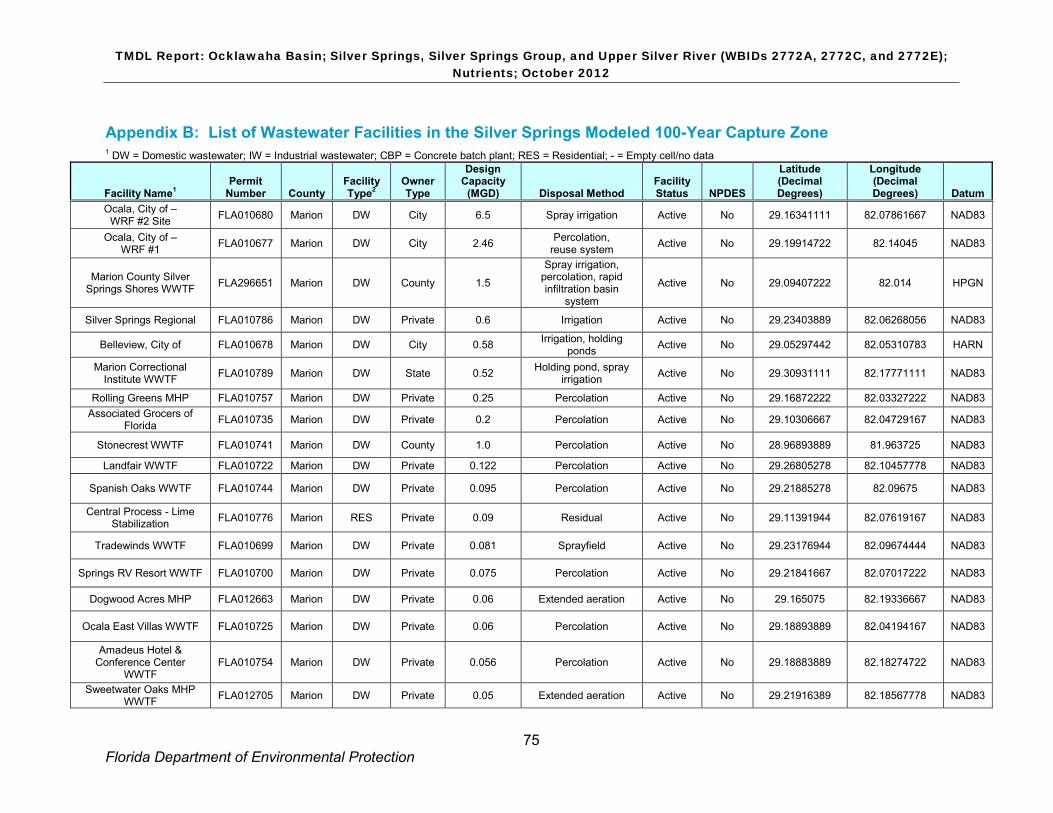
TMDL Report: Ocklawaha Basin; Silver Springs, Silver Springs Group, and Upper Silver River (WBIDs 2772A, 2772C, and 2772E); Nutrients; October 2012
75 Florida Department of Environmental Protection
Appendix B: List of Wastewater Facilities in the Silver Springs Modeled 100-Year Capture Zone 1 DW = Domestic wastewater; IW = Industrial wastewater; CBP = Concrete batch plant; RES = Residential; - = Empty cell/no data
Facility Name1 Permit
Number County Facility Type2
Owner Type
Design Capacity
(MGD) Disposal Method Facility Status NPDES
Latitude (Decimal Degrees)
Longitude (Decimal Degrees) Datum
Ocala, City of – WRF #2 Site FLA010680 Marion DW City 6.5 Spray irrigation Active No 29.16341111 82.07861667 NAD83
Ocala, City of – WRF #1 FLA010677 Marion DW City 2.46 Percolation,
reuse system Active No 29.19914722 82.14045 NAD83
Marion County Silver Springs Shores WWTF FLA296651 Marion DW County 1.5
Spray irrigation, percolation, rapid infiltration basin
system
Active No 29.09407222 82.014 HPGN
Silver Springs Regional FLA010786 Marion DW Private 0.6 Irrigation Active No 29.23403889 82.06268056 NAD83
Belleview, City of FLA010678 Marion DW City 0.58 Irrigation, holding ponds Active No 29.05297442 82.05310783 HARN
Marion Correctional Institute WWTF FLA010789 Marion DW State 0.52 Holding pond, spray
irrigation Active No 29.30931111 82.17771111 NAD83
Rolling Greens MHP FLA010757 Marion DW Private 0.25 Percolation Active No 29.16872222 82.03327222 NAD83 Associated Grocers of
Florida FLA010735 Marion DW Private 0.2 Percolation Active No 29.10306667 82.04729167 NAD83
Stonecrest WWTF FLA010741 Marion DW County 1.0 Percolation Active No 28.96893889 81.963725 NAD83
Landfair WWTF FLA010722 Marion DW Private 0.122 Percolation Active No 29.26805278 82.10457778 NAD83
Spanish Oaks WWTF FLA010744 Marion DW Private 0.095 Percolation Active No 29.21885278 82.09675 NAD83
Central Process - Lime Stabilization FLA010776 Marion RES Private 0.09 Residual Active No 29.11391944 82.07619167 NAD83
Tradewinds WWTF FLA010699 Marion DW Private 0.081 Sprayfield Active No 29.23176944 82.09674444 NAD83
Springs RV Resort WWTF FLA010700 Marion DW Private 0.075 Percolation Active No 29.21841667 82.07017222 NAD83
Dogwood Acres MHP FLA012663 Marion DW Private 0.06 Extended aeration Active No 29.165075 82.19336667 NAD83
Ocala East Villas WWTF FLA010725 Marion DW Private 0.06 Percolation Active No 29.18893889 82.04194167 NAD83
Amadeus Hotel & Conference Center
WWTF FLA010754 Marion DW Private 0.056 Percolation Active No 29.18883889 82.18274722 NAD83
Sweetwater Oaks MHP WWTF FLA012705 Marion DW Private 0.05 Extended aeration Active No 29.21916389 82.18567778 NAD83
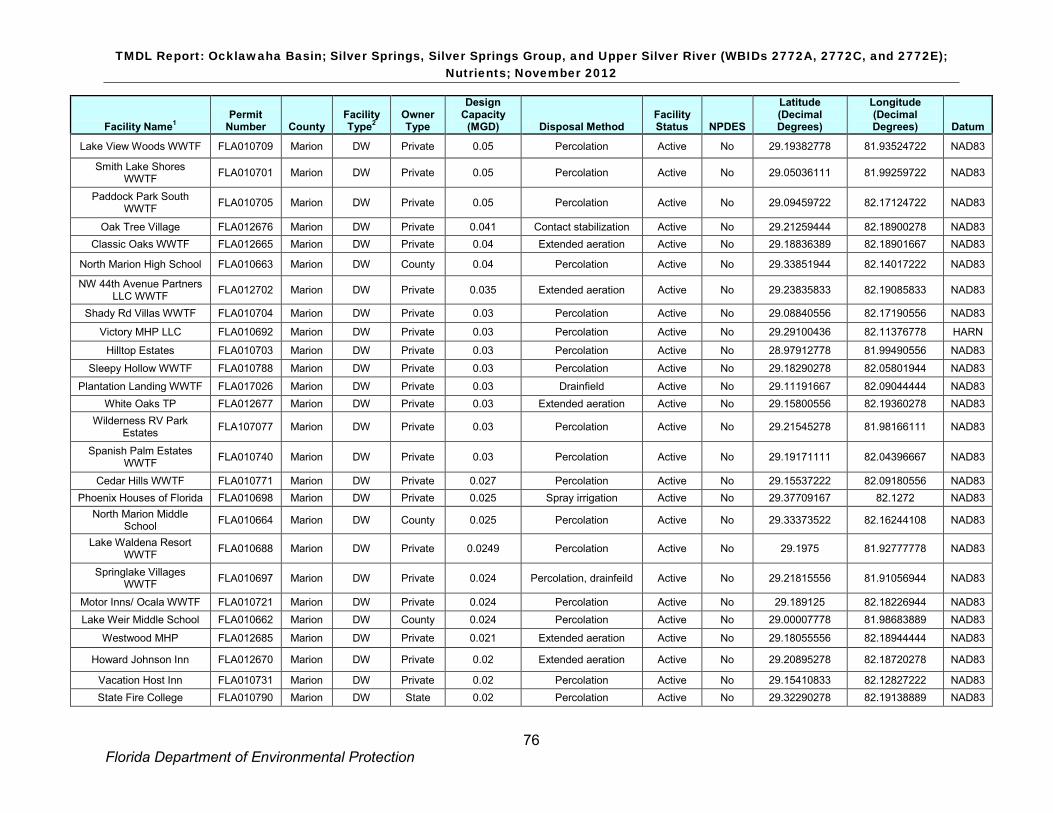
TMDL Report: Ocklawaha Basin; Silver Springs, Silver Springs Group, and Upper Silver River (WBIDs 2772A, 2772C, and 2772E); Nutrients; November 2012
76 Florida Department of Environmental Protection
Facility Name1 Permit
Number County Facility Type2
Owner Type
Design Capacity
(MGD) Disposal Method Facility Status NPDES
Latitude (Decimal Degrees)
Longitude (Decimal Degrees) Datum
Lake View Woods WWTF FLA010709 Marion DW Private 0.05 Percolation Active No 29.19382778 81.93524722 NAD83
Smith Lake Shores WWTF FLA010701 Marion DW Private 0.05 Percolation Active No 29.05036111 81.99259722 NAD83
Paddock Park South WWTF FLA010705 Marion DW Private 0.05 Percolation Active No 29.09459722 82.17124722 NAD83
Oak Tree Village FLA012676 Marion DW Private 0.041 Contact stabilization Active No 29.21259444 82.18900278 NAD83 Classic Oaks WWTF FLA012665 Marion DW Private 0.04 Extended aeration Active No 29.18836389 82.18901667 NAD83
North Marion High School FLA010663 Marion DW County 0.04 Percolation Active No 29.33851944 82.14017222 NAD83
NW 44th Avenue Partners LLC WWTF FLA012702 Marion DW Private 0.035 Extended aeration Active No 29.23835833 82.19085833 NAD83
Shady Rd Villas WWTF FLA010704 Marion DW Private 0.03 Percolation Active No 29.08840556 82.17190556 NAD83
Victory MHP LLC FLA010692 Marion DW Private 0.03 Percolation Active No 29.29100436 82.11376778 HARN
Hilltop Estates FLA010703 Marion DW Private 0.03 Percolation Active No 28.97912778 81.99490556 NAD83
Sleepy Hollow WWTF FLA010788 Marion DW Private 0.03 Percolation Active No 29.18290278 82.05801944 NAD83
Plantation Landing WWTF FLA017026 Marion DW Private 0.03 Drainfield Active No 29.11191667 82.09044444 NAD83 White Oaks TP FLA012677 Marion DW Private 0.03 Extended aeration Active No 29.15800556 82.19360278 NAD83
Wilderness RV Park Estates FLA107077 Marion DW Private 0.03 Percolation Active No 29.21545278 81.98166111 NAD83
Spanish Palm Estates WWTF FLA010740 Marion DW Private 0.03 Percolation Active No 29.19171111 82.04396667 NAD83
Cedar Hills WWTF FLA010771 Marion DW Private 0.027 Percolation Active No 29.15537222 82.09180556 NAD83 Phoenix Houses of Florida FLA010698 Marion DW Private 0.025 Spray irrigation Active No 29.37709167 82.1272 NAD83
North Marion Middle School FLA010664 Marion DW County 0.025 Percolation Active No 29.33373522 82.16244108 NAD83
Lake Waldena Resort WWTF FLA010688 Marion DW Private 0.0249 Percolation Active No 29.1975 81.92777778 NAD83
Springlake Villages WWTF FLA010697 Marion DW Private 0.024 Percolation, drainfeild Active No 29.21815556 81.91056944 NAD83
Motor Inns/ Ocala WWTF FLA010721 Marion DW Private 0.024 Percolation Active No 29.189125 82.18226944 NAD83 Lake Weir Middle School FLA010662 Marion DW County 0.024 Percolation Active No 29.00007778 81.98683889 NAD83
Westwood MHP FLA012685 Marion DW Private 0.021 Extended aeration Active No 29.18055556 82.18944444 NAD83
Howard Johnson Inn FLA012670 Marion DW Private 0.02 Extended aeration Active No 29.20895278 82.18720278 NAD83
Vacation Host Inn FLA010731 Marion DW Private 0.02 Percolation Active No 29.15410833 82.12827222 NAD83 State Fire College FLA010790 Marion DW State 0.02 Percolation Active No 29.32290278 82.19138889 NAD83

TMDL Report: Ocklawaha Basin; Silver Springs, Silver Springs Group, and Upper Silver River (WBIDs 2772A, 2772C, and 2772E); Nutrients; November 2012
77 Florida Department of Environmental Protection
Facility Name1 Permit
Number County Facility Type2
Owner Type
Design Capacity
(MGD) Disposal Method Facility Status NPDES
Latitude (Decimal Degrees)
Longitude (Decimal Degrees) Datum
On Golden Pond Mobile Home Park WWTF FLA010685 Marion DW Private 0.02 Percolation Active No 29.06574167 82.09455 NAD83
Pilot Travel Center #424 FLA277134 Marion DW Private 0.02 - Active No 29.26454444 82.18831667 NAD83
Camp Sonlight FLA010689 Marion DW Private 0.02 Percolation Active No 28.975375 82.04993056 NAD83
Ocala RV Camp Resort WWTF FLA012667 Marion DW Private 0.02 Extended aeration Active No 29.15609722 82.18590556 NAD83
Tall Timber WWTF FLA010736 Marion DW Private 0.0192 Spray irrigation Active No 29.20561944 81.90904167 NAD83 Sharpes Ferry Mobile
Home Park WWTF FLA010729 Marion DW Private 0.019 Spray irrigation Active No 29.188325 81.98978056 NAD83
Wandering Oaks RV Resort FLA010756 Marion DW Private 0.018 Spray irrigation Active No 29.25803611 82.15301667 NAD83
Belleview Santos Elementary School
WWTF FLA010661 Marion DW County 0.018 Percolation Active No 29.08196667 82.08039722 NAD83
Lake Weir Laundromat FLA010780 Marion IW Private 0.016 Bio-breakdown settling and aeration Active No 29.04181389 81.93417778 NAD83
Days Inn - Ocala West WWTF FLA010763 Marion DW Private 0.015 Sprayfield Active No 29.185 82.18305556 NAD83
Cliftwood MHP WWTF FLA010745 Marion DW Private 0.015 Percolation Active No 29.26116111 82.13135556 NAD83
Sparr Elementary School FLA010667 Marion DW County 0.015 Percolation Active No 29.34038333 82.10221389 NAD83
Fessenden Elementary School WWTF FLA010666 Marion DW County 0.015 Percolation Active No 29.28134722 82.19284167 NAD83
Royal Oak Enterprises FLA282995 Marion IW Private 0.014 - Active No 29.20445278 82.15634167 NAD83
Nautilus Trailer Park FLA010708 Marion DW Private 0.012 Percolation Active No 29.15425556 82.12274444 NAD83
Ocala Springs Shopping Center WWTF FLA010773 Marion DW Private 0.011 Percolation Active No 29.26121667 82.14916667 NAD83
Pilot SSA #92 WWTF FLA016765 Marion DW Private 0.0105 - Active No 29.2676 82.19229722 NAD83 CEMEX Cnstrct Mtrls FL
LLC - Ocala South Concrete Batch Plant
FLG110331 Marion CBP Private 0.01 Percolation Active Yes 29.17151389 82.14381111 NAD83
Our Lucaya FLA010784 Marion DW Private 0.01 Spray irrigation Active No 29.25897778 82.17886944 NAD83
Magnolia Garden Estates WWTF FLA012668 Marion DW Private 0.01 Extended aeration Active No 29.15838333 82.19151667 NAD83
East Marion Elementary School WWTF FLA010674 Marion DW County 0.01 Percolation Active No 29.20045556 81.90925278 NAD83
Baseline Square WWTF FLA010766 Marion DW Private 0.01 Drainfield Active No 29.16310556 82.05526389 NAD83
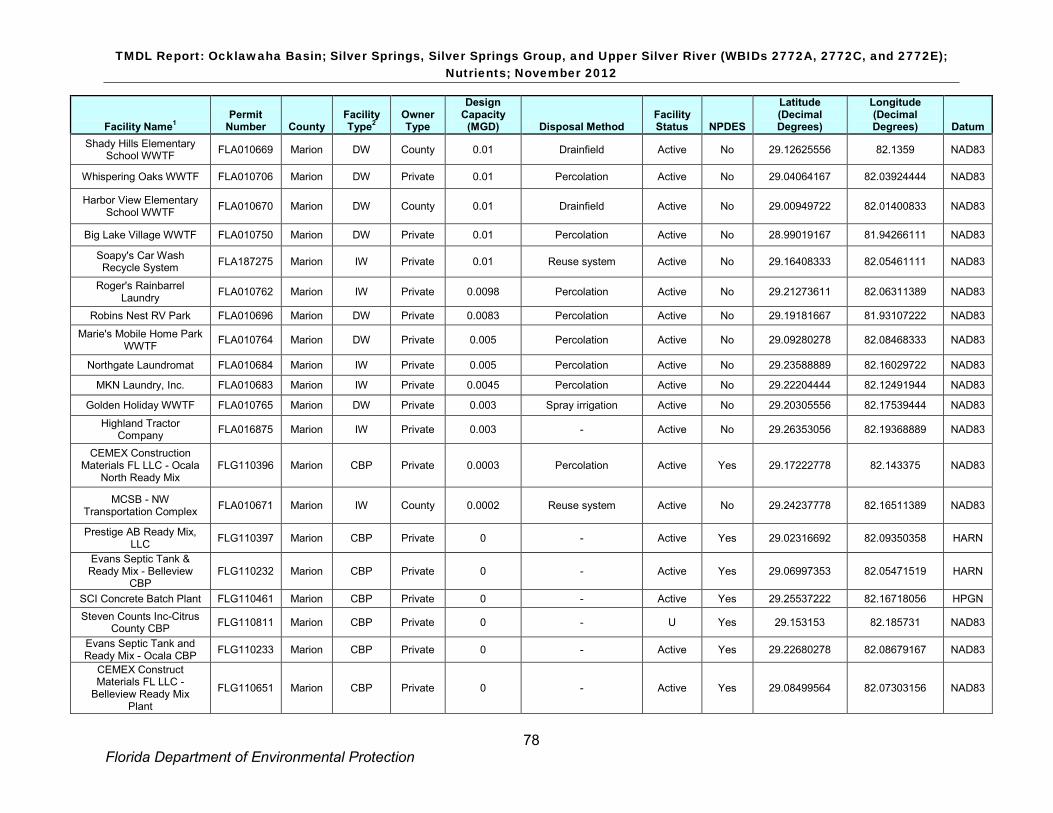
TMDL Report: Ocklawaha Basin; Silver Springs, Silver Springs Group, and Upper Silver River (WBIDs 2772A, 2772C, and 2772E); Nutrients; November 2012
78 Florida Department of Environmental Protection
Facility Name1 Permit
Number County Facility Type2
Owner Type
Design Capacity
(MGD) Disposal Method Facility Status NPDES
Latitude (Decimal Degrees)
Longitude (Decimal Degrees) Datum
Shady Hills Elementary School WWTF FLA010669 Marion DW County 0.01 Drainfield Active No 29.12625556 82.1359 NAD83
Whispering Oaks WWTF FLA010706 Marion DW Private 0.01 Percolation Active No 29.04064167 82.03924444 NAD83
Harbor View Elementary School WWTF FLA010670 Marion DW County 0.01 Drainfield Active No 29.00949722 82.01400833 NAD83
Big Lake Village WWTF FLA010750 Marion DW Private 0.01 Percolation Active No 28.99019167 81.94266111 NAD83
Soapy's Car Wash Recycle System FLA187275 Marion IW Private 0.01 Reuse system Active No 29.16408333 82.05461111 NAD83
Roger's Rainbarrel Laundry FLA010762 Marion IW Private 0.0098 Percolation Active No 29.21273611 82.06311389 NAD83
Robins Nest RV Park FLA010696 Marion DW Private 0.0083 Percolation Active No 29.19181667 81.93107222 NAD83
Marie's Mobile Home Park WWTF FLA010764 Marion DW Private 0.005 Percolation Active No 29.09280278 82.08468333 NAD83
Northgate Laundromat FLA010684 Marion IW Private 0.005 Percolation Active No 29.23588889 82.16029722 NAD83
MKN Laundry, Inc. FLA010683 Marion IW Private 0.0045 Percolation Active No 29.22204444 82.12491944 NAD83
Golden Holiday WWTF FLA010765 Marion DW Private 0.003 Spray irrigation Active No 29.20305556 82.17539444 NAD83
Highland Tractor Company FLA016875 Marion IW Private 0.003 - Active No 29.26353056 82.19368889 NAD83
CEMEX Construction Materials FL LLC - Ocala
North Ready Mix FLG110396 Marion CBP Private 0.0003 Percolation Active Yes 29.17222778 82.143375 NAD83
MCSB - NW Transportation Complex FLA010671 Marion IW County 0.0002 Reuse system Active No 29.24237778 82.16511389 NAD83
Prestige AB Ready Mix, LLC FLG110397 Marion CBP Private 0 - Active Yes 29.02316692 82.09350358 HARN
Evans Septic Tank & Ready Mix - Belleview
CBP FLG110232 Marion CBP Private 0 - Active Yes 29.06997353 82.05471519 HARN
SCI Concrete Batch Plant FLG110461 Marion CBP Private 0 - Active Yes 29.25537222 82.16718056 HPGN Steven Counts Inc-Citrus
County CBP FLG110811 Marion CBP Private 0 - U Yes 29.153153 82.185731 NAD83
Evans Septic Tank and Ready Mix - Ocala CBP FLG110233 Marion CBP Private 0 - Active Yes 29.22680278 82.08679167 NAD83
CEMEX Construct Materials FL LLC -
Belleview Ready Mix Plant
FLG110651 Marion CBP Private 0 - Active Yes 29.08499564 82.07303156 NAD83
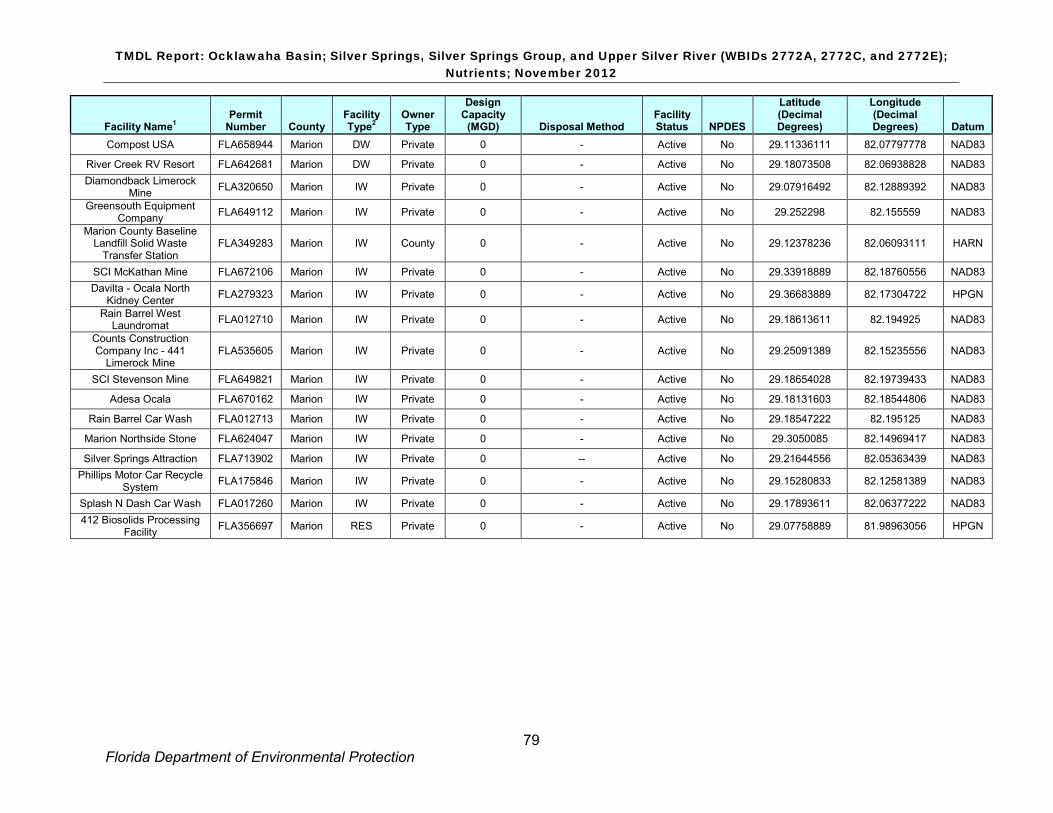
TMDL Report: Ocklawaha Basin; Silver Springs, Silver Springs Group, and Upper Silver River (WBIDs 2772A, 2772C, and 2772E); Nutrients; November 2012
79 Florida Department of Environmental Protection
Facility Name1 Permit
Number County Facility Type2
Owner Type
Design Capacity
(MGD) Disposal Method Facility Status NPDES
Latitude (Decimal Degrees)
Longitude (Decimal Degrees) Datum
Compost USA FLA658944 Marion DW Private 0 - Active No 29.11336111 82.07797778 NAD83
River Creek RV Resort FLA642681 Marion DW Private 0 - Active No 29.18073508 82.06938828 NAD83 Diamondback Limerock
Mine FLA320650 Marion IW Private 0 - Active No 29.07916492 82.12889392 NAD83
Greensouth Equipment Company FLA649112 Marion IW Private 0 - Active No 29.252298 82.155559 NAD83
Marion County Baseline Landfill Solid Waste
Transfer Station FLA349283 Marion IW County 0 - Active No 29.12378236 82.06093111 HARN
SCI McKathan Mine FLA672106 Marion IW Private 0 - Active No 29.33918889 82.18760556 NAD83 Davilta - Ocala North
Kidney Center FLA279323 Marion IW Private 0 - Active No 29.36683889 82.17304722 HPGN
Rain Barrel West Laundromat FLA012710 Marion IW Private 0 - Active No 29.18613611 82.194925 NAD83
Counts Construction Company Inc - 441
Limerock Mine FLA535605 Marion IW Private 0 - Active No 29.25091389 82.15235556 NAD83
SCI Stevenson Mine FLA649821 Marion IW Private 0 - Active No 29.18654028 82.19739433 NAD83
Adesa Ocala FLA670162 Marion IW Private 0 - Active No 29.18131603 82.18544806 NAD83
Rain Barrel Car Wash FLA012713 Marion IW Private 0 - Active No 29.18547222 82.195125 NAD83
Marion Northside Stone FLA624047 Marion IW Private 0 - Active No 29.3050085 82.14969417 NAD83
Silver Springs Attraction FLA713902 Marion IW Private 0 -- Active No 29.21644556 82.05363439 NAD83 Phillips Motor Car Recycle
System FLA175846 Marion IW Private 0 - Active No 29.15280833 82.12581389 NAD83
Splash N Dash Car Wash FLA017260 Marion IW Private 0 - Active No 29.17893611 82.06377222 NAD83 412 Biosolids Processing
Facility FLA356697 Marion RES Private 0 - Active No 29.07758889 81.98963056 HPGN
TMDL Report: Ocklawaha Basin; Silver Springs, Silver Springs Group, and Upper Silver River (WBIDs 2772A, 2772C, and 2772E); Nutrients; October 2012
80 Florida Department of Environmental Protection
Appendix C: Change-Point Analysis of the Suwannee River Algal Data
Change Point Analysis of Suwannee River Algal Data
Based on an Updated Data Set (13 Stations).
Xu-Feng Niu
Department of Statistics
Florida State University
Tallahassee, FL 32306-4330
June 30-August 31, 2008
Technical Report Submitted to the Florida Department of Environmental Protection
for the Fulfillment of Task 3, Assignment 4, Contract No. LAB027
TMDL Report: Ocklawaha Basin; Silver Springs, Silver Springs Group, and Upper Silver River (WBIDs 2772A, 2772C, and 2772E); Nutrients; November 2012
81 Florida Department of Environmental Protection
I. Background Per the request of the Wekiva Parkway and Protection Act (WPPA) passed by the Florida Legislature in 2004 (Chapter 369, Part III, FS), the Florida Department Environmental Protection is developing a nitrate Total Maximum Daily Load (TMDL) for the Wekiva River and Rock Springs Run in the central Florida area. Establishing a nitrate target for the Wekiva River and Rock Springs Run is a critical part of the TMDL development. To define this target, a functional relationship between the periphyton abundance and nitrate concentration needs to be characterized. Ideally, the functional relationship would be built upon data collected from the Wekiva River and Rock Springs Run. Unfortunately, because of the limit amount of time available to this project, not enough data were available to establish the relationship in these two waterbodies. Therefore, this study uses nitrate and periphyton data collected from a monitoring network on the Suwannee River, which was established for the Surface Water Improvement and Management (SWIM) program by the Suwannee River Water Management District (Hornsby et al. 2000). Much of the length of the Suwannee River is heavily influenced by spring inflow, and the algal communities appear to be generally similar in composition to those in the Wekvia River and Rock Springs Run. Therefore, results from the Suwannee River are considered applicable to the Wekiva River and Rock Springs Run (Mattson et al. 2006).
Nitrate and periphyton data were collected from 13 stations across the Suwannee River and two tributaries (Withlacoochee River and Santa Fe River). Figure 1 (Niu and Gao 2007) shows locations of these water quality stations. Periphyton abundance was measured as both the cell density (cells/cm2) and biomass density (ash free dry mass – AFDM/cm2). Niu and Gao (2007) performed a change point analysis of the Suwannee River algal data collected during the period of 1990-1998 for the purpose of identifying a threshold nitrate concentration., in which mean periphyton cell density and mean periphyton biomass were treated as response variables and mean nitrate concentration (NOx) was treated as the predictor. The main finding of Niu and Gao (2007) are: 1) for the change point analysis of mean abundance vs mean NOx, one change point was detected at NOx=0.401 that is corresponding to the data at the site SUW100. The change point is significant at the confidence level 95%; 2) for the change point analysis of mean biomass vs mean NOx, one change point was detected at NOx=0.420 that is corresponding to the data at the site SUW130. The change point is significant at the confidence level 95%.
Recently, the Suwannee River Water Management District (SRWMD) provides an updated data set for the 13 stations along the Suwannee River and its two major tributaries (Withlacoochee and Santa Fe). The updated data set covered the period from 1990 through 2007. In this report, change point analysis of the Suwannee River algal data will be performed based on the updated data set. For self-completeness, the statistical methods used in Niu and Gao (2007) will be restated in this report.
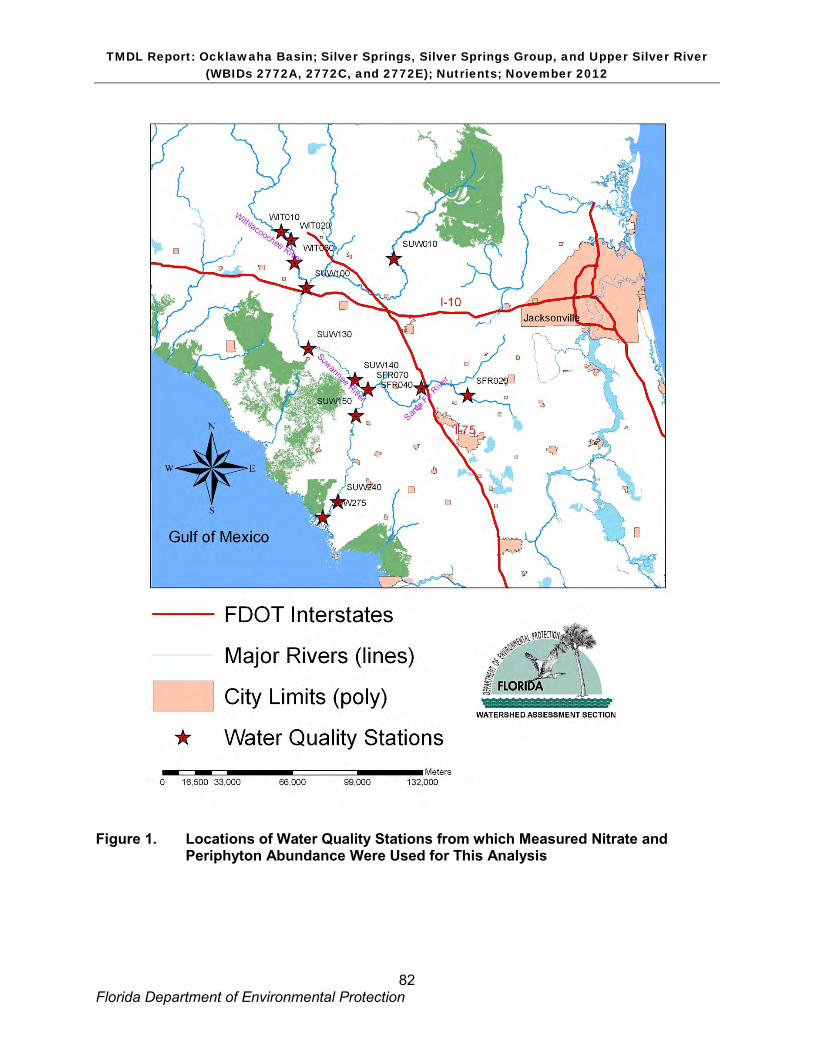
TMDL Report: Ocklawaha Basin; Silver Springs, Silver Springs Group, and Upper Silver River (WBIDs 2772A, 2772C, and 2772E); Nutrients; November 2012
82 Florida Department of Environmental Protection
Figure 1. Locations of Water Quality Stations from which Measured Nitrate and
Periphyton Abundance Were Used for This Analysis
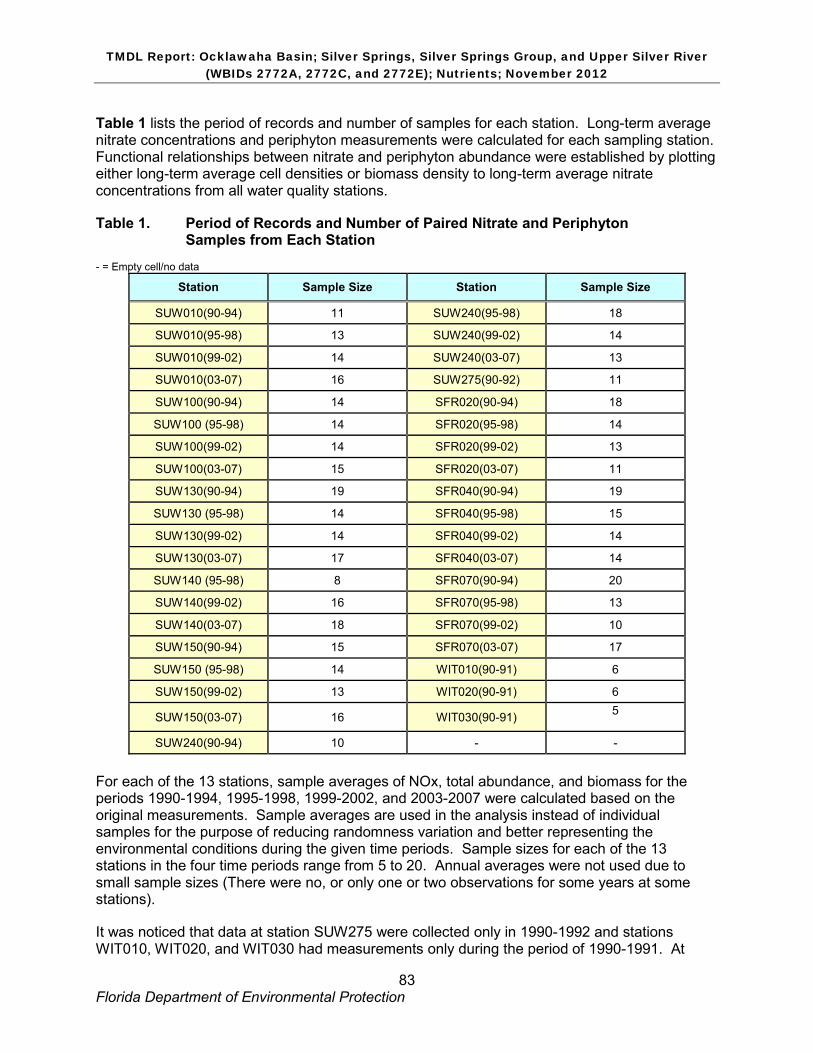
TMDL Report: Ocklawaha Basin; Silver Springs, Silver Springs Group, and Upper Silver River (WBIDs 2772A, 2772C, and 2772E); Nutrients; November 2012
83 Florida Department of Environmental Protection
Table 1 lists the period of records and number of samples for each station. Long-term average nitrate concentrations and periphyton measurements were calculated for each sampling station. Functional relationships between nitrate and periphyton abundance were established by plotting either long-term average cell densities or biomass density to long-term average nitrate concentrations from all water quality stations.
Table 1. Period of Records and Number of Paired Nitrate and Periphyton Samples from Each Station
- = Empty cell/no data
Station Sample Size Station Sample Size
SUW010(90-94) 11 SUW240(95-98) 18
SUW010(95-98) 13 SUW240(99-02) 14
SUW010(99-02) 14 SUW240(03-07) 13
SUW010(03-07) 16 SUW275(90-92) 11
SUW100(90-94) 14 SFR020(90-94) 18
SUW100 (95-98) 14 SFR020(95-98) 14
SUW100(99-02) 14 SFR020(99-02) 13
SUW100(03-07) 15 SFR020(03-07) 11
SUW130(90-94) 19 SFR040(90-94) 19
SUW130 (95-98) 14 SFR040(95-98) 15
SUW130(99-02) 14 SFR040(99-02) 14
SUW130(03-07) 17 SFR040(03-07) 14
SUW140 (95-98) 8 SFR070(90-94) 20
SUW140(99-02) 16 SFR070(95-98) 13
SUW140(03-07) 18 SFR070(99-02) 10
SUW150(90-94) 15 SFR070(03-07) 17
SUW150 (95-98) 14 WIT010(90-91) 6
SUW150(99-02) 13 WIT020(90-91) 6
SUW150(03-07) 16 WIT030(90-91) 5
SUW240(90-94) 10 - -
For each of the 13 stations, sample averages of NOx, total abundance, and biomass for the periods 1990-1994, 1995-1998, 1999-2002, and 2003-2007 were calculated based on the original measurements. Sample averages are used in the analysis instead of individual samples for the purpose of reducing randomness variation and better representing the environmental conditions during the given time periods. Sample sizes for each of the 13 stations in the four time periods range from 5 to 20. Annual averages were not used due to small sample sizes (There were no, or only one or two observations for some years at some stations).
It was noticed that data at station SUW275 were collected only in 1990-1992 and stations WIT010, WIT020, and WIT030 had measurements only during the period of 1990-1991. At

TMDL Report: Ocklawaha Basin; Silver Springs, Silver Springs Group, and Upper Silver River (WBIDs 2772A, 2772C, and 2772E); Nutrients; November 2012
84 Florida Department of Environmental Protection
other 9 stations, data were collected up to 2007 or 2006. Therefore, the change point analysis will be performed with and without data from these four stations.
The purpose of this study is to use change-point statistical analysis to identify the threshold nitrate concentration. This nitrate threshold, once being identified, can be used as the target nitrate concentration for the nitrate TMDL of the Wekiva River and Rock Springs Run.
II. The Detection Procedure Niu et al. (2000) introduced an iterative procedure for detecting and modeling level-shift change points. Niu and Miller (2007) reported the change point analysis and a model comparison procedure for the Stream Condition Index (SCI) and Biological Condition Gradient (BCG) data. The change-point detection procedure in Niuet al. (2000) is similar to that suggested by Chang (1982) and further developed by Chang et al. (1988) for detecting outliers and level shifts in time series analysis. Statistical details of this procedure can also be found in Pankratz (1991, Chapter 8).
For simplicity, let us consider a response variable Y, after an appropriate transformation. Suppose that observations { ( , )i iX Y , 1, 2, ,i n= } are available where n is the sample size and X is an independent variable. Moreover, we assume that the observations are arranged in the following manner:
The values { ,iX 1, 2, ,i n= } are distinct. If several 'iY s are corresponding to a single X
value, the median of the 'iY s is taken to be the response value for the X value.
• { ( , )i iX Y , 1, 2, ,i n= } are sorted according to the values of X from least to greatest.
For each integer 1l > , define the step variable ( ) 0iS l = for i l< and ( ) 1iS l = for i l≥ .
Step 1. Fit the linear regression model:
0 1( ) ( ) ( ) ( )i i iY l l S l lβ β ε= + + , 1, 2, ,i n= , (1)
where for a fixed l, the ( ) 'i l sε are assumed to be independent and identically distributed normal
random variables with mean zero and variance 2 ( )lσ .
Step 2. Calculate the values { 1 1( ) ( ) / ( ( ))L l l se lβ β=
, 2, 3, , ( 1)l n= − } where 1( ( ))se lβ
is the
estimated standard error of 1( )lβ
.

TMDL Report: Ocklawaha Basin; Silver Springs, Silver Springs Group, and Upper Silver River (WBIDs 2772A, 2772C, and 2772E); Nutrients; November 2012
85 Florida Department of Environmental Protection
Step 3. Let 1( ) max{ (2), (3), , ( 1)}L l L L L n= − and compare 1( )L l with the critical value C=3.0 (or C=3.5). The critical value C=3.0 (or C=3.5) corresponds roughly to 0.10α = (or
0.05α = ), or the 10% (or the 5%) significance level, based on the simulation results of Chang et al. (1988). If 1( )L l is significant, we conclude that the response Y has a change point at
1lX
with a level-shift 1( )lβ
.
Step 4. Let *1 1 1( ) ( )i i iY Y l S lβ= − . Repeat Steps 1-3 on the new response variable *
iY for detecting a possible second change point. Continue the process until no further change point can be identified.
Step 5. Suppose that k change points are detected in the response variable Y and the corresponding X values are
1 2{ , , , }
kl l lX X X . Fit the model
0 1 1 2 2( ) ( ) ( )i i i k i k iY S l S l S lβ β β β ε= + + + + + , 1, 2, ,i n= . (2)
Then the estimated coefficients 1 2{ , , , }kβ β β
will be the k estimated level-shift values.
III. Model Comparison
Model (2) fits a step function 0 1 1 2 2( ) ( ) ( )i i k i kS l S l S lβ β β β+ + + + to estimate the mean (or median) value of the response variable Y and the predictor variable X. In practice, many other models may be considered to describe the relationship between Y and X. In particular, if the scatter plot of observations { ( , )i iX Y , 1, 2, ,i n= } shows a straight line or a smooth curve pattern, a linear regression model or a nonlinear smooth-curve model should be fitted to the data instead of the step-function change point model in (2).
For the response variable Y and the predictor variable X, the linear regression model has the form:
0 1i i iY Xβ β ε= + + , 1, 2, ,i n= . (3)
If the relationship between Y and X is nonlinear, many smooth-curve models may be considered. One of the choices is transforming the predictor variable X and fitting a regression model. For example, we may use the natural logarithm transformation log(X) instead of X as the predictor variable and fit the regression model:
0 1 log( )i i iY Xβ β ε= + + , 1, 2, ,i n= . (4)

TMDL Report: Ocklawaha Basin; Silver Springs, Silver Springs Group, and Upper Silver River (WBIDs 2772A, 2772C, and 2772E); Nutrients; November 2012
86 Florida Department of Environmental Protection
When different models are fitted to the observations { ( , )i iX Y , 1, 2, ,i n= }, model selection techniques need to be used to decide which model fits the data better. Statistical inferences such as estimation and prediction will then be based on the best model selected. The Bayesian Information Criterion (SBC) suggested by Schwartz (1978) is one of the popular criteria for model comparison. For a fitted model (linear or nonlinear) with p parameters, the SBC is defined as
SBC(p) = 2− log(maximum likelihood function) + p × log(n),
where the likelihood function is based on the distribution assumption of the model such as normal or log-normal or other distribution families, and n is the sample size. When the random errors iε ’s have a normal distribution, the SBC(p) has the simplified form:
SBC(p) = ( )21
ˆlog ( ) /( 1)ni ii
n Y Y n p=
× − − −∑ + p × log(n), (5)
where ˆiY is the fitted value based on one of the candidate models and 2
1ˆ( )n
i iiY Y
=−∑ is the
Residual Sum of Squares (RSS) based on the fitted candidate model.
Intuitively, there are two parts in (5), the first part is
( )21
ˆlog ( ) /( 1)ni ii
n Y Y n p=
× − − −∑ = 2ˆlogn σ× ,
which is a measure of the goodness-of-fit of the candidate model. In general, increasing the number of parameters in a model will improve the goodness-of-fit of the model to the data regardless how many parameters are in the true model that generated the data. When a model with too many predicators (significant or not significant ones) is fitted to a data set, we may get a perfect fit but the model will be useless for inference such as prediction. In statistics, fitting a model with too many unnecessary parameters is called over-fitting. The second part in SBC, p × log(n), puts a penalty term on the complexity of a candidate model, which will increase when the number of parameters in a candidate model increases. Thus the criterion SBC requires a candidate model fitting the data well and penalizing the complexity of the model. For a group of candidate models, the SBC value can be calculated for each of the models and the preferred model is the one with the lowest SBC value.
IV. Change Point Analysis of Suwannee River Algal Data 1. Mean Abundance (Cell Density) vs Mean NOx a). Change Point Analysis
Table 1 presents the mean NOx and mean abundance data at stations along the Suwannee river and its two major tributaries (Withlacoochee and Santa Fe). The data were collected by the Suwannee River Water Management District (SRWMD).

TMDL Report: Ocklawaha Basin; Silver Springs, Silver Springs Group, and Upper Silver River (WBIDs 2772A, 2772C, and 2772E); Nutrients; November 2012
87 Florida Department of Environmental Protection
Change point analysis was performed for mean abundance vs mean NOx. When all the 13 stations are included, one change points was detected at the mean NOx values of 0.473. The change point has the statistic 1( ) 7.86L l = and is significant at the 5% level (95% confidence). When the four stations, SUW275, WIT010, WIT020, and WIT030, are excluded, the change points was detected at the mean NOx values of 0.441. The change point has the statistics
1( ) 7.03L l = and is also significant at the 5% level (95% confidence). Figures 1 and 2 present the fitted step-function regression models to the mean abundance values.
Table 1. Mean NOx and Mean Abundance Data at the 13 Suwannee River
Stations (Sorted by Mean NOx) With Stations SUW275, WIT010, WIT020, and WIT030: One change point was detected at Mean NOx=0.473 with the test statistic of 7.86 and confidence level over 95%. The 95% confidence interval for the change point based on 1000 Bootstrapping samples is [0.378, 0.629]. Without Stations SUW275, WIT010, WIT020, and WIT030: One change point was detected at Mean NOx=0.441 with the test statistic of 7.03 and confidence level over 95%. The 95% confidence interval for the change point based on 1000 Bootstrapping samples is [0.378, 0.657]. - = Empty cell/no data
Station Mean NOx Mean Abundance Station Mean NOx Mean Abundance
SUW010(03-07) 0.015 215863 SUW130(03-07)(2) 0.441 446534
SUW010(95-98) 0.023 72775 SUW275(90-92) 0.466 163244
SUW010(99-02) 0.027 229545 SUW130(95-98)(1) 0.473 774970
SUW010(90-94) 0.050 153580 SUW150(90-94) 0.487 598208
SFR020(99-02) 0.050 177079 SUW130(99-02) 0.522 334294
SFR020(90-94) 0.064 62343 SFR070(90-94) 0.553 732480
SFR020(95-98) 0.065 78021 SUW240(90-94) 0.561 282885
SFR040(99-02) 0.081 184470 SFR070(95-98) 0.584 557997
SFR020(03-07) 0.084 115671 SFR070(03-07) 0.629 795424
SFR040(90-94) 0.155 216861 SFR070(99-02) 0.657 791649
SFR040(03-07) 0.156 252165 SUW150(03-07) 0.677 579348
WIT020(90-91) 0.223 191813 SUW240(99-02) 0.695 656715
SFR040(95-98) 0.225 153825 SUW150(95-98) 0.698 1264802
WIT010(90-91) 0.256 176644 SUW240(03-07) 0.726 703205
WIT030(90-91) 0.286 241469 SUW140(03-07) 0.728 586243
SUW100(95-98) 0.378 567218 SUW240(95-98) 0.741 785583
SUW130(90-94) 0.381 332953 SUW150(99-02) 0.760 699194
SUW100(99-02) 0.386 266619 SUW140(99-02) 0.848 524728
SUW100(90-94) 0.421 402964 SUW140(95-98) 0.900 525039
SUW100(03-07) 0.435 282783 - - -
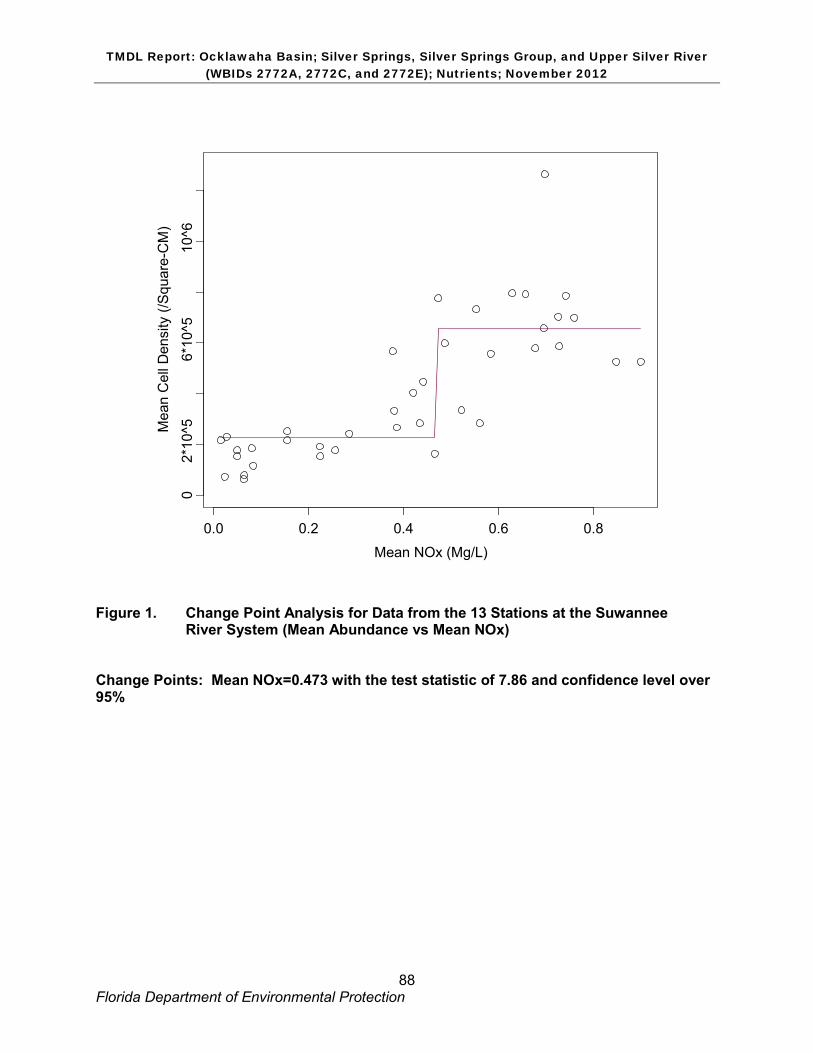
TMDL Report: Ocklawaha Basin; Silver Springs, Silver Springs Group, and Upper Silver River (WBIDs 2772A, 2772C, and 2772E); Nutrients; November 2012
88 Florida Department of Environmental Protection
Mean NOx (Mg/L)
Mea
n C
ell D
ensi
ty (/
Squ
are-
CM
)
0.0 0.2 0.4 0.6 0.8
02*
10^5
6*10
^510
^6
Figure 1. Change Point Analysis for Data from the 13 Stations at the Suwannee
River System (Mean Abundance vs Mean NOx) Change Points: Mean NOx=0.473 with the test statistic of 7.86 and confidence level over 95%
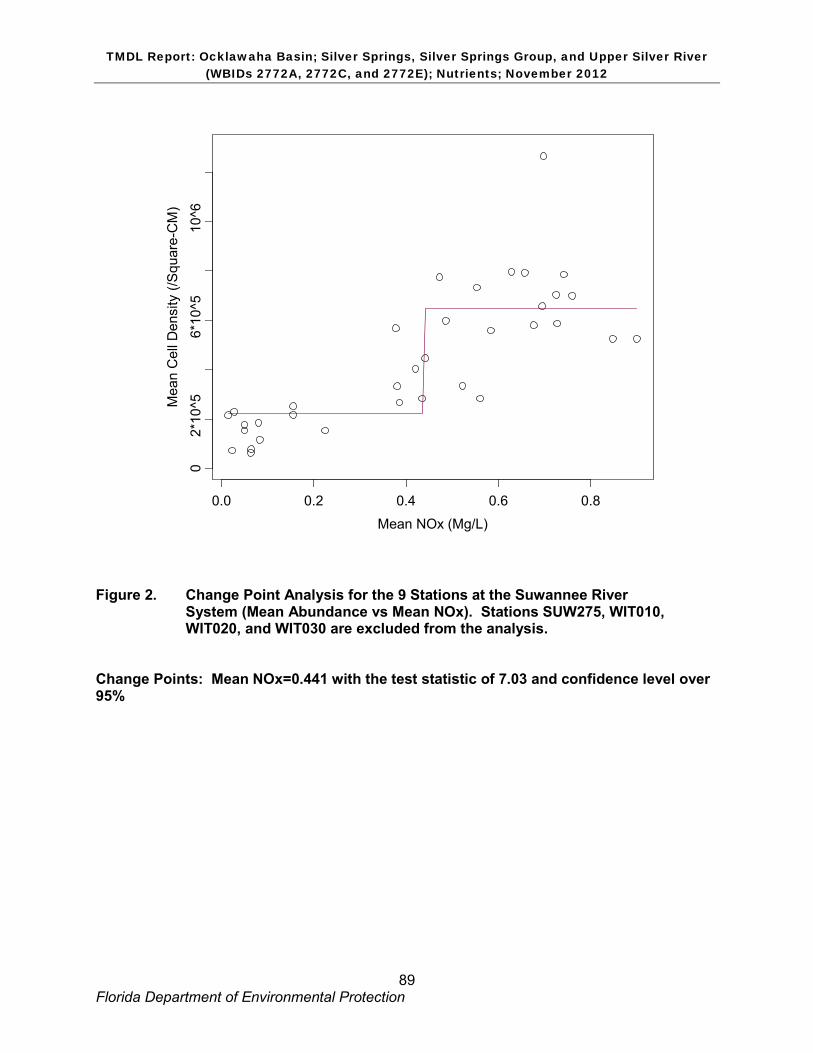
TMDL Report: Ocklawaha Basin; Silver Springs, Silver Springs Group, and Upper Silver River (WBIDs 2772A, 2772C, and 2772E); Nutrients; November 2012
89 Florida Department of Environmental Protection
Mean NOx (Mg/L)
Mea
n C
ell D
ensi
ty (/
Squ
are-
CM
)
0.0 0.2 0.4 0.6 0.8
02*
10^5
6*10
^510
^6
Figure 2. Change Point Analysis for the 9 Stations at the Suwannee River
System (Mean Abundance vs Mean NOx). Stations SUW275, WIT010, WIT020, and WIT030 are excluded from the analysis.
Change Points: Mean NOx=0.441 with the test statistic of 7.03 and confidence level over 95%
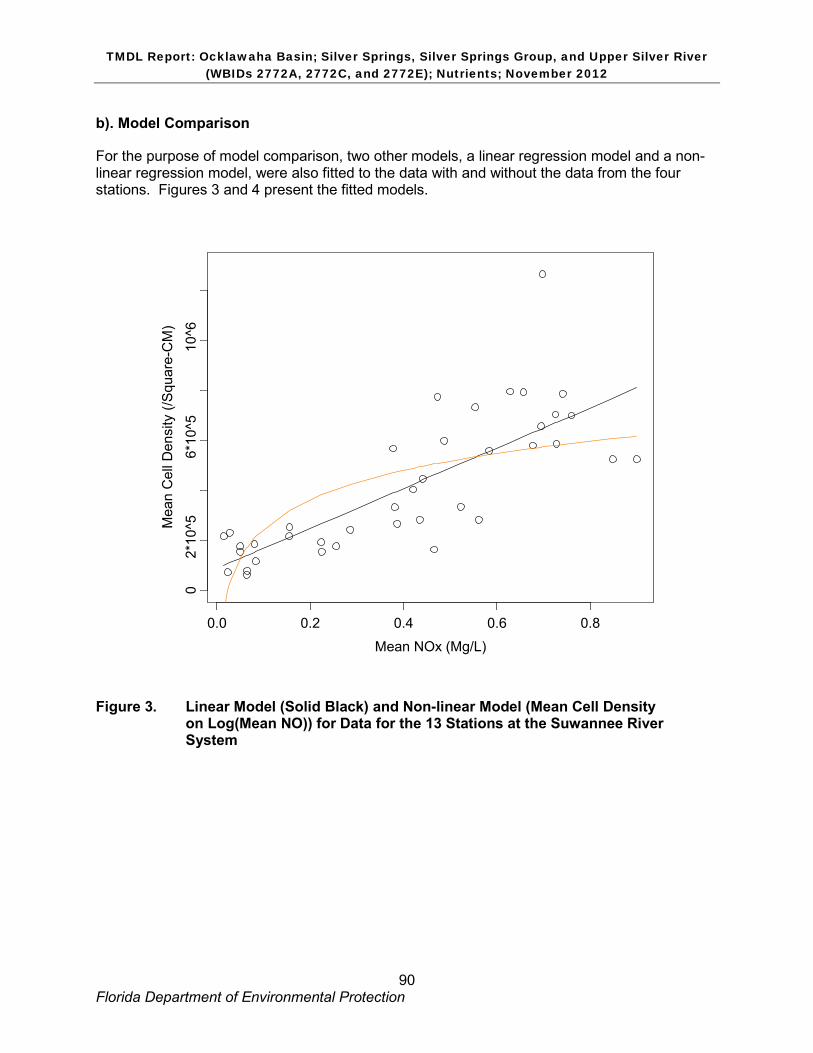
TMDL Report: Ocklawaha Basin; Silver Springs, Silver Springs Group, and Upper Silver River (WBIDs 2772A, 2772C, and 2772E); Nutrients; November 2012
90 Florida Department of Environmental Protection
b). Model Comparison
For the purpose of model comparison, two other models, a linear regression model and a non-linear regression model, were also fitted to the data with and without the data from the four stations. Figures 3 and 4 present the fitted models.
Mean NOx (Mg/L)
Mea
n C
ell D
ensi
ty (/
Squ
are-
CM
)
0.0 0.2 0.4 0.6 0.8
02*
10^5
6*10
^510
^6
Figure 3. Linear Model (Solid Black) and Non-linear Model (Mean Cell Density
on Log(Mean NO)) for Data for the 13 Stations at the Suwannee River System
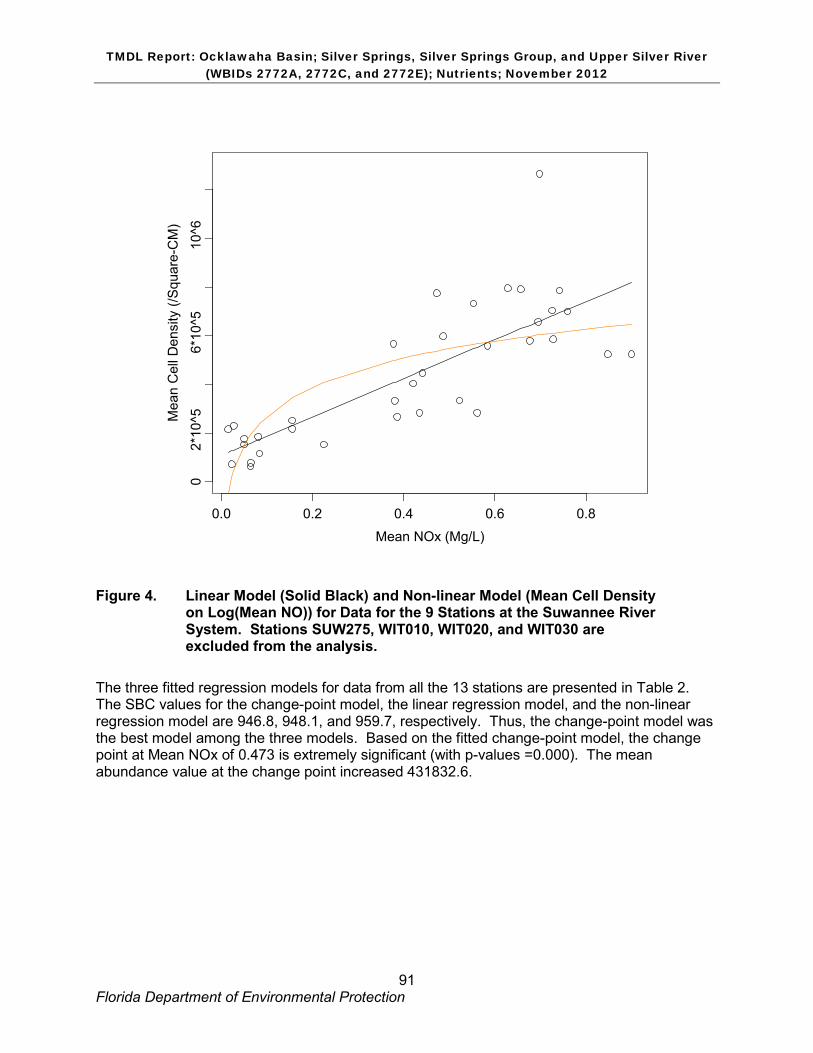
TMDL Report: Ocklawaha Basin; Silver Springs, Silver Springs Group, and Upper Silver River (WBIDs 2772A, 2772C, and 2772E); Nutrients; November 2012
91 Florida Department of Environmental Protection
Mean NOx (Mg/L)
Mea
n C
ell D
ensi
ty (/
Squ
are-
CM
)
0.0 0.2 0.4 0.6 0.8
02*
10^5
6*10
^510
^6
Figure 4. Linear Model (Solid Black) and Non-linear Model (Mean Cell Density
on Log(Mean NO)) for Data for the 9 Stations at the Suwannee River System. Stations SUW275, WIT010, WIT020, and WIT030 are excluded from the analysis.
The three fitted regression models for data from all the 13 stations are presented in Table 2. The SBC values for the change-point model, the linear regression model, and the non-linear regression model are 946.8, 948.1, and 959.7, respectively. Thus, the change-point model was the best model among the three models. Based on the fitted change-point model, the change point at Mean NOx of 0.473 is extremely significant (with p-values =0.000). The mean abundance value at the change point increased 431832.6.
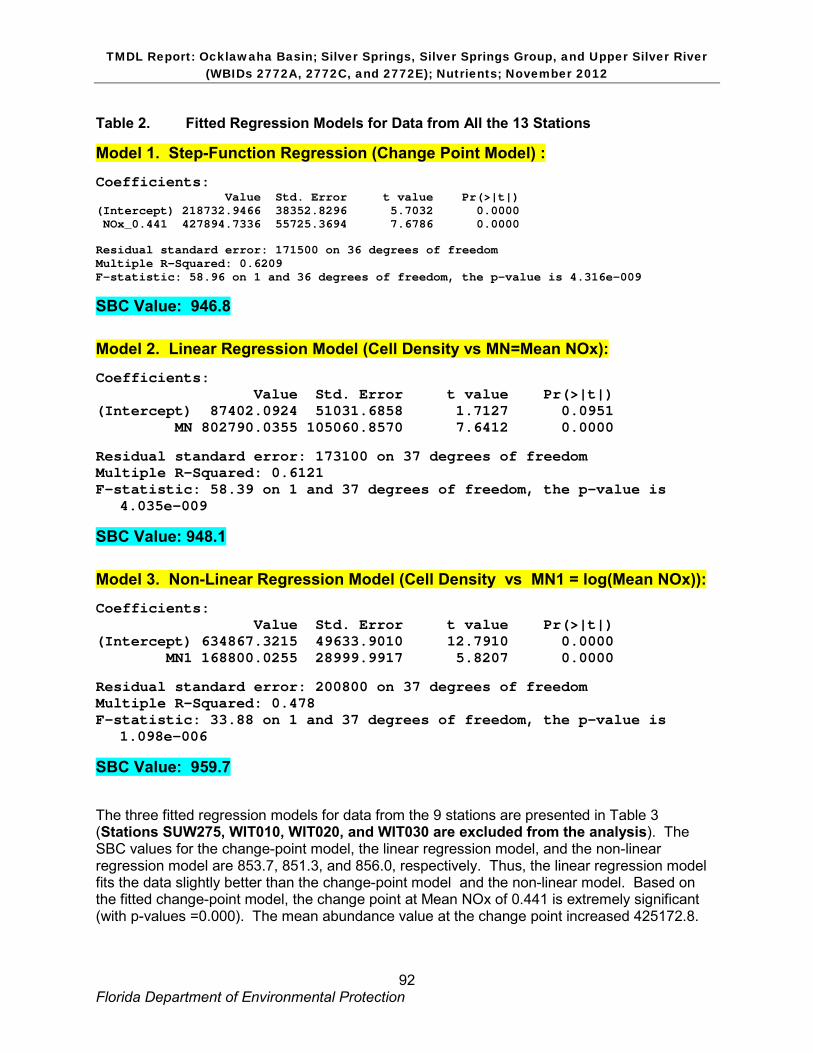
TMDL Report: Ocklawaha Basin; Silver Springs, Silver Springs Group, and Upper Silver River (WBIDs 2772A, 2772C, and 2772E); Nutrients; November 2012
92 Florida Department of Environmental Protection
Table 2. Fitted Regression Models for Data from All the 13 Stations Model 1. Step-Function Regression (Change Point Model) : Coefficients: Value Std. Error t value Pr(>|t|) (Intercept) 218732.9466 38352.8296 5.7032 0.0000 NOx_0.441 427894.7336 55725.3694 7.6786 0.0000 Residual standard error: 171500 on 36 degrees of freedom Multiple R-Squared: 0.6209 F-statistic: 58.96 on 1 and 36 degrees of freedom, the p-value is 4.316e-009 SBC Value: 946.8 Model 2. Linear Regression Model (Cell Density vs MN=Mean NOx): Coefficients: Value Std. Error t value Pr(>|t|) (Intercept) 87402.0924 51031.6858 1.7127 0.0951 MN 802790.0355 105060.8570 7.6412 0.0000 Residual standard error: 173100 on 37 degrees of freedom Multiple R-Squared: 0.6121 F-statistic: 58.39 on 1 and 37 degrees of freedom, the p-value is
4.035e-009 SBC Value: 948.1 Model 3. Non-Linear Regression Model (Cell Density vs MN1 = log(Mean NOx)): Coefficients: Value Std. Error t value Pr(>|t|) (Intercept) 634867.3215 49633.9010 12.7910 0.0000 MN1 168800.0255 28999.9917 5.8207 0.0000 Residual standard error: 200800 on 37 degrees of freedom Multiple R-Squared: 0.478 F-statistic: 33.88 on 1 and 37 degrees of freedom, the p-value is
1.098e-006 SBC Value: 959.7 The three fitted regression models for data from the 9 stations are presented in Table 3 (Stations SUW275, WIT010, WIT020, and WIT030 are excluded from the analysis). The SBC values for the change-point model, the linear regression model, and the non-linear regression model are 853.7, 851.3, and 856.0, respectively. Thus, the linear regression model fits the data slightly better than the change-point model and the non-linear model. Based on the fitted change-point model, the change point at Mean NOx of 0.441 is extremely significant (with p-values =0.000). The mean abundance value at the change point increased 425172.8.
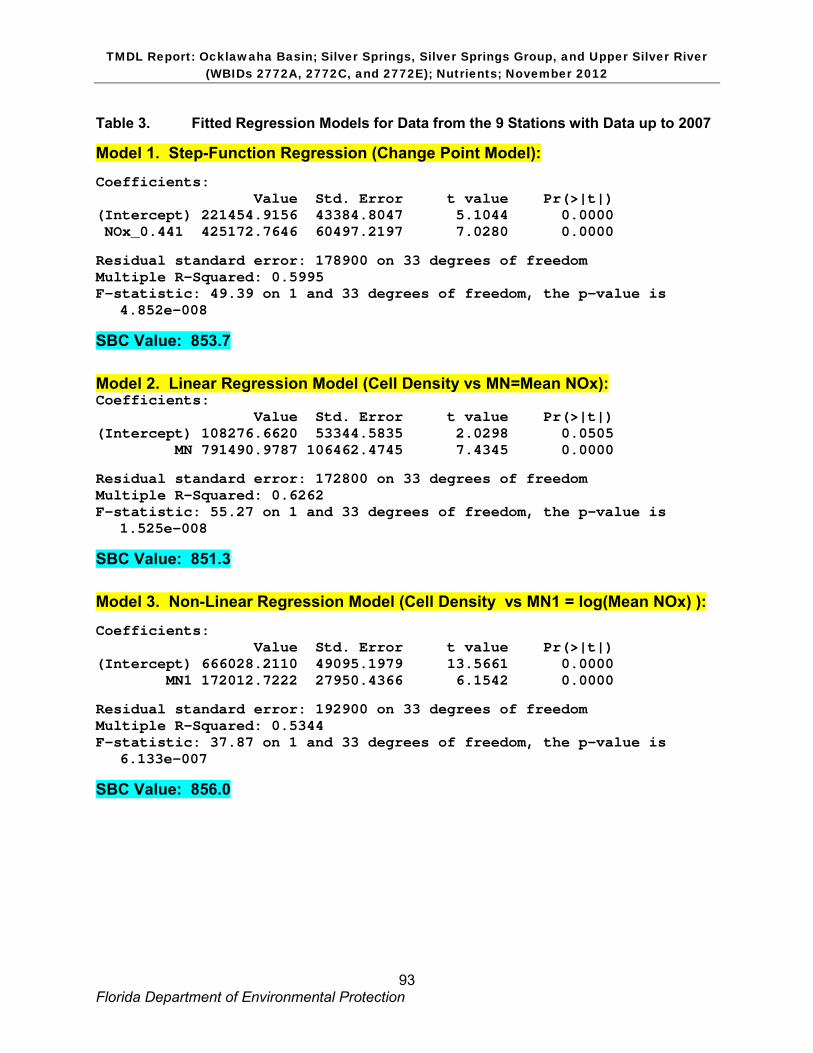
TMDL Report: Ocklawaha Basin; Silver Springs, Silver Springs Group, and Upper Silver River (WBIDs 2772A, 2772C, and 2772E); Nutrients; November 2012
93 Florida Department of Environmental Protection
Table 3. Fitted Regression Models for Data from the 9 Stations with Data up to 2007 Model 1. Step-Function Regression (Change Point Model): Coefficients: Value Std. Error t value Pr(>|t|) (Intercept) 221454.9156 43384.8047 5.1044 0.0000 NOx_0.441 425172.7646 60497.2197 7.0280 0.0000 Residual standard error: 178900 on 33 degrees of freedom Multiple R-Squared: 0.5995 F-statistic: 49.39 on 1 and 33 degrees of freedom, the p-value is
4.852e-008 SBC Value: 853.7 Model 2. Linear Regression Model (Cell Density vs MN=Mean NOx): Coefficients: Value Std. Error t value Pr(>|t|) (Intercept) 108276.6620 53344.5835 2.0298 0.0505 MN 791490.9787 106462.4745 7.4345 0.0000 Residual standard error: 172800 on 33 degrees of freedom Multiple R-Squared: 0.6262 F-statistic: 55.27 on 1 and 33 degrees of freedom, the p-value is
1.525e-008 SBC Value: 851.3 Model 3. Non-Linear Regression Model (Cell Density vs MN1 = log(Mean NOx) ): Coefficients: Value Std. Error t value Pr(>|t|) (Intercept) 666028.2110 49095.1979 13.5661 0.0000 MN1 172012.7222 27950.4366 6.1542 0.0000 Residual standard error: 192900 on 33 degrees of freedom Multiple R-Squared: 0.5344 F-statistic: 37.87 on 1 and 33 degrees of freedom, the p-value is
6.133e-007 SBC Value: 856.0
TMDL Report: Ocklawaha Basin; Silver Springs, Silver Springs Group, and Upper Silver River (WBIDs 2772A, 2772C, and 2772E); Nutrients; November 2012
94 Florida Department of Environmental Protection
2. Mean Biomass vs Mean NOx a). Change Point Analysis
Table 4 presents the mean NOx and mean biomass data (ash free dry mass – AFDM/cm2) at stations along the Suwannee river and its two major tributaries (Withlacoochee and Santa Fe). Biomass data are not available for the period of 1999-2002 at the 13 stations.
Change point analysis was performed for mean biomass vs mean NOx. When all the 13 stations are included, one change points was detected at the mean NOx values of 0.441. The change point has the statistic 1( ) 7.51L l = and is significant at the 5% level (95% confidence). When the four stations, SUW275, WIT010, WIT020, and WIT030, are excluded, the change points was detected at the same point with mean NOx values of 0.441. The change point has the statistics 1( ) 7.90L l = and is also significant at the 5% level (95% confidence). Figures 5 and 6 present the fitted step-function regression models to the mean biomass values.
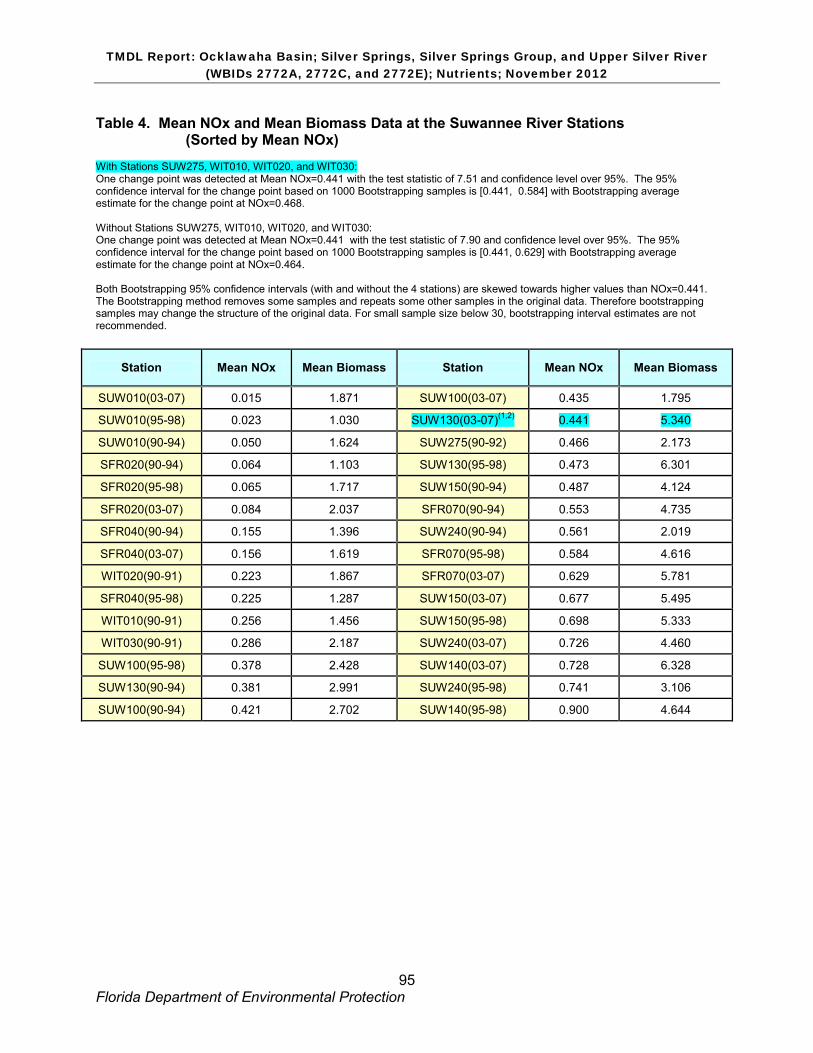
TMDL Report: Ocklawaha Basin; Silver Springs, Silver Springs Group, and Upper Silver River (WBIDs 2772A, 2772C, and 2772E); Nutrients; November 2012
95 Florida Department of Environmental Protection
Table 4. Mean NOx and Mean Biomass Data at the Suwannee River Stations (Sorted by Mean NOx)
With Stations SUW275, WIT010, WIT020, and WIT030: One change point was detected at Mean NOx=0.441 with the test statistic of 7.51 and confidence level over 95%. The 95% confidence interval for the change point based on 1000 Bootstrapping samples is [0.441, 0.584] with Bootstrapping average estimate for the change point at NOx=0.468. Without Stations SUW275, WIT010, WIT020, and WIT030: One change point was detected at Mean NOx=0.441 with the test statistic of 7.90 and confidence level over 95%. The 95% confidence interval for the change point based on 1000 Bootstrapping samples is [0.441, 0.629] with Bootstrapping average estimate for the change point at NOx=0.464. Both Bootstrapping 95% confidence intervals (with and without the 4 stations) are skewed towards higher values than NOx=0.441. The Bootstrapping method removes some samples and repeats some other samples in the original data. Therefore bootstrapping samples may change the structure of the original data. For small sample size below 30, bootstrapping interval estimates are not recommended.
Station Mean NOx Mean Biomass Station Mean NOx Mean Biomass
SUW010(03-07) 0.015 1.871 SUW100(03-07) 0.435 1.795
SUW010(95-98) 0.023 1.030 SUW130(03-07)(1,2) 0.441 5.340
SUW010(90-94) 0.050 1.624 SUW275(90-92) 0.466 2.173
SFR020(90-94) 0.064 1.103 SUW130(95-98) 0.473 6.301
SFR020(95-98) 0.065 1.717 SUW150(90-94) 0.487 4.124
SFR020(03-07) 0.084 2.037 SFR070(90-94) 0.553 4.735
SFR040(90-94) 0.155 1.396 SUW240(90-94) 0.561 2.019
SFR040(03-07) 0.156 1.619 SFR070(95-98) 0.584 4.616
WIT020(90-91) 0.223 1.867 SFR070(03-07) 0.629 5.781
SFR040(95-98) 0.225 1.287 SUW150(03-07) 0.677 5.495
WIT010(90-91) 0.256 1.456 SUW150(95-98) 0.698 5.333
WIT030(90-91) 0.286 2.187 SUW240(03-07) 0.726 4.460
SUW100(95-98) 0.378 2.428 SUW140(03-07) 0.728 6.328
SUW130(90-94) 0.381 2.991 SUW240(95-98) 0.741 3.106
SUW100(90-94) 0.421 2.702 SUW140(95-98) 0.900 4.644
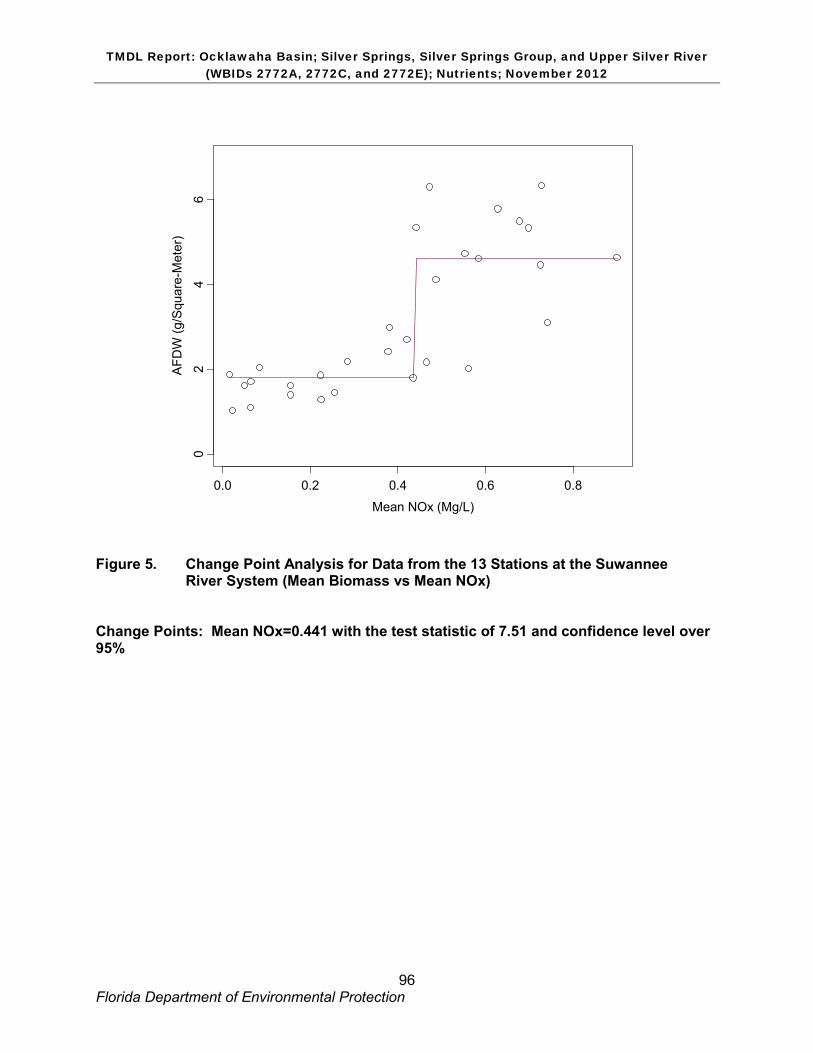
TMDL Report: Ocklawaha Basin; Silver Springs, Silver Springs Group, and Upper Silver River (WBIDs 2772A, 2772C, and 2772E); Nutrients; November 2012
96 Florida Department of Environmental Protection
Mean NOx (Mg/L)
AFD
W (g
/Squ
are-
Met
er)
0.0 0.2 0.4 0.6 0.8
02
46
Figure 5. Change Point Analysis for Data from the 13 Stations at the Suwannee
River System (Mean Biomass vs Mean NOx) Change Points: Mean NOx=0.441 with the test statistic of 7.51 and confidence level over 95%
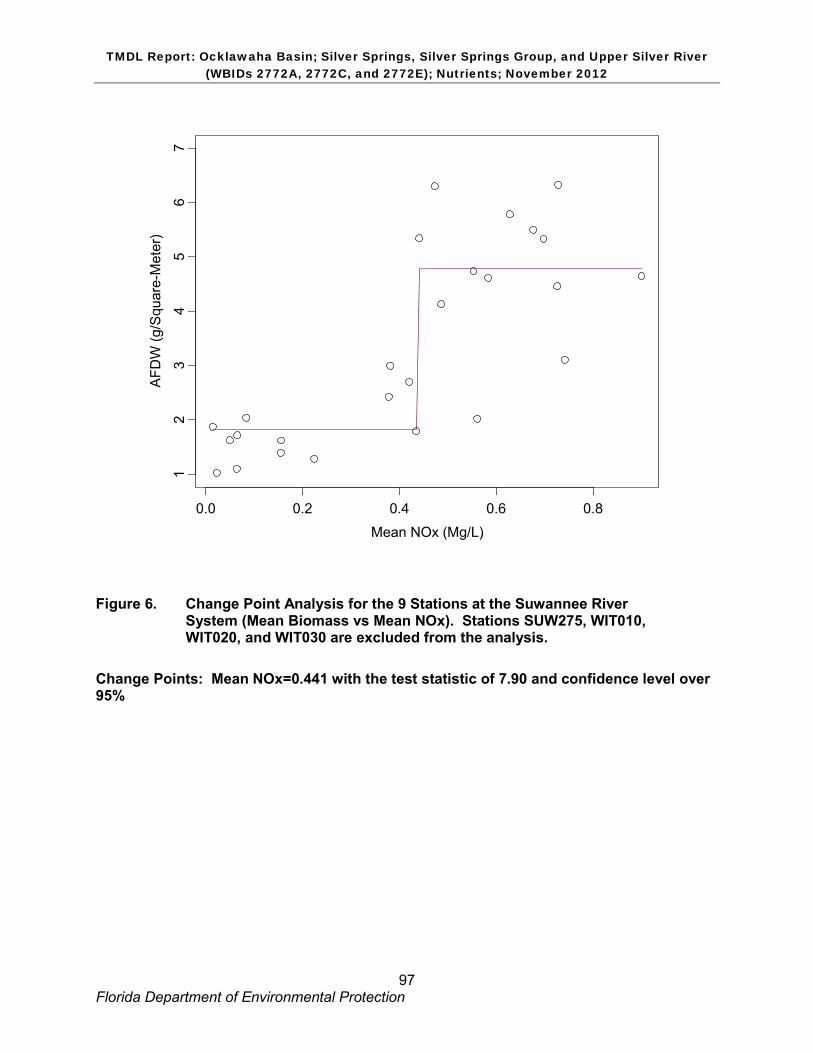
TMDL Report: Ocklawaha Basin; Silver Springs, Silver Springs Group, and Upper Silver River (WBIDs 2772A, 2772C, and 2772E); Nutrients; November 2012
97 Florida Department of Environmental Protection
Mean NOx (Mg/L)
AFD
W (g
/Squ
are-
Met
er)
0.0 0.2 0.4 0.6 0.8
12
34
56
7
Figure 6. Change Point Analysis for the 9 Stations at the Suwannee River
System (Mean Biomass vs Mean NOx). Stations SUW275, WIT010, WIT020, and WIT030 are excluded from the analysis.
Change Points: Mean NOx=0.441 with the test statistic of 7.90 and confidence level over 95%
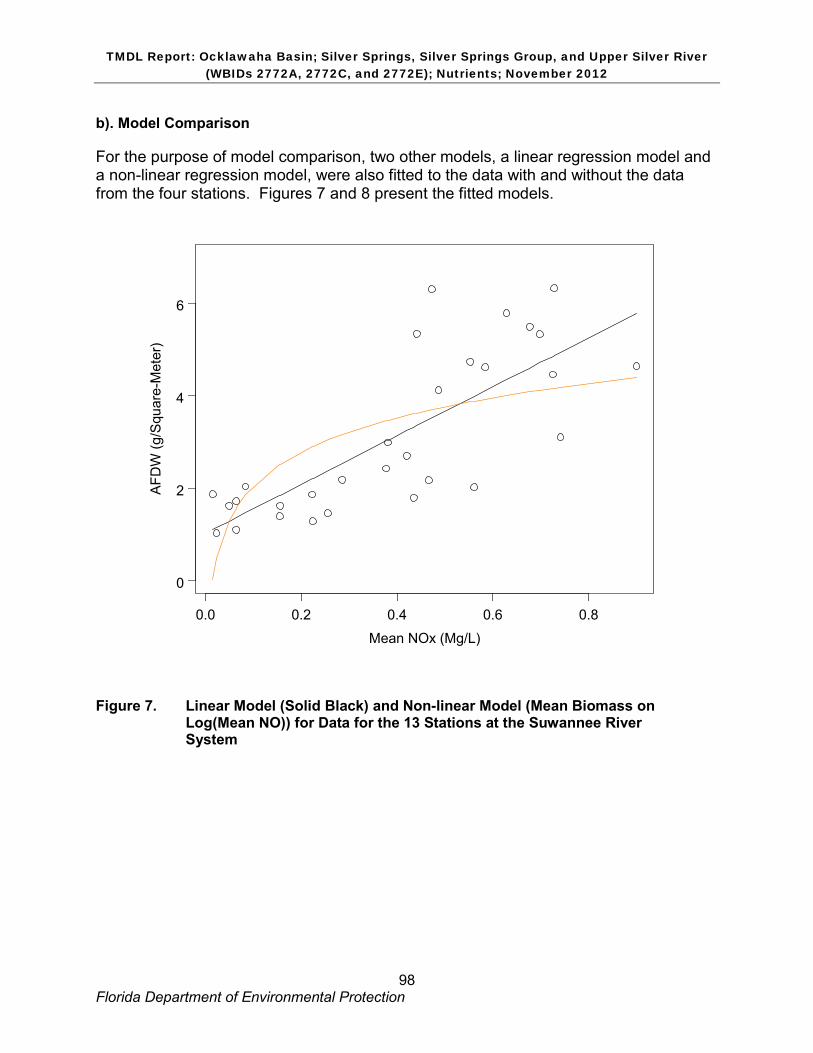
TMDL Report: Ocklawaha Basin; Silver Springs, Silver Springs Group, and Upper Silver River (WBIDs 2772A, 2772C, and 2772E); Nutrients; November 2012
98 Florida Department of Environmental Protection
b). Model Comparison
For the purpose of model comparison, two other models, a linear regression model and a non-linear regression model, were also fitted to the data with and without the data from the four stations. Figures 7 and 8 present the fitted models.
Mean NOx (Mg/L)
AFD
W (g
/Squ
are-
Met
er)
0.0 0.2 0.4 0.6 0.8
0
2
4
6
Figure 7. Linear Model (Solid Black) and Non-linear Model (Mean Biomass on
Log(Mean NO)) for Data for the 13 Stations at the Suwannee River System
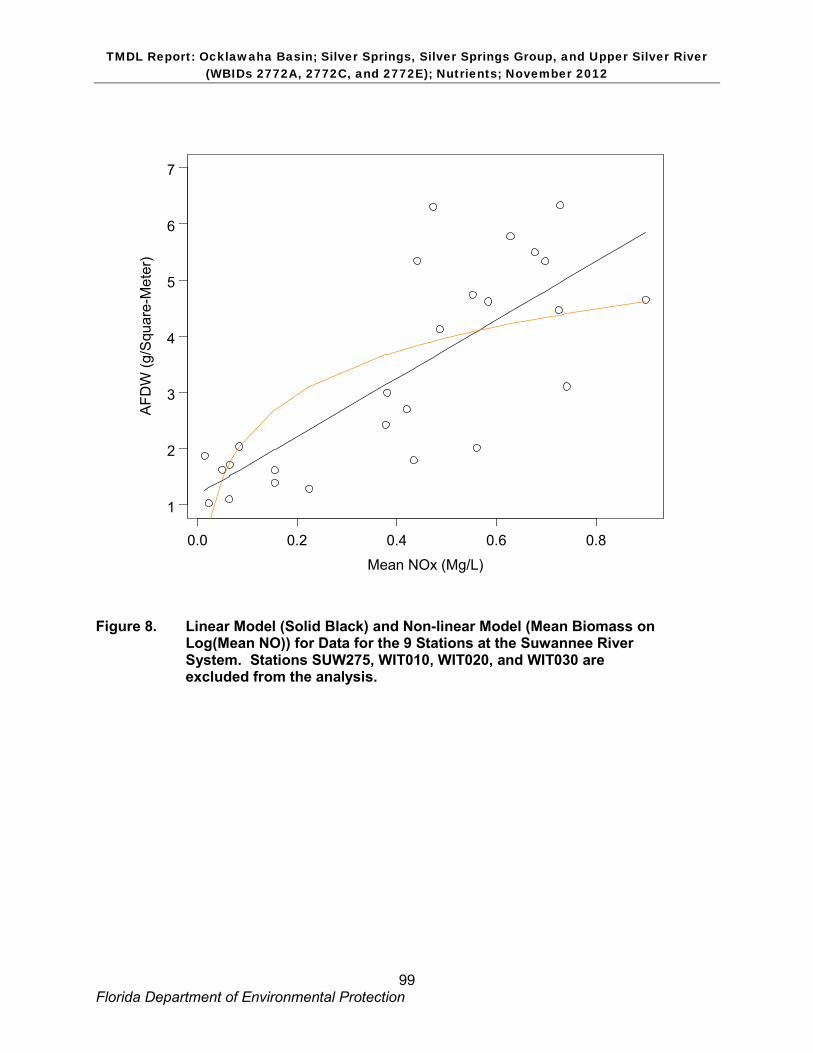
TMDL Report: Ocklawaha Basin; Silver Springs, Silver Springs Group, and Upper Silver River (WBIDs 2772A, 2772C, and 2772E); Nutrients; November 2012
99 Florida Department of Environmental Protection
Mean NOx (Mg/L)
AFD
W (g
/Squ
are-
Met
er)
0.0 0.2 0.4 0.6 0.8
1
2
3
4
5
6
7
Figure 8. Linear Model (Solid Black) and Non-linear Model (Mean Biomass on
Log(Mean NO)) for Data for the 9 Stations at the Suwannee River System. Stations SUW275, WIT010, WIT020, and WIT030 are excluded from the analysis.
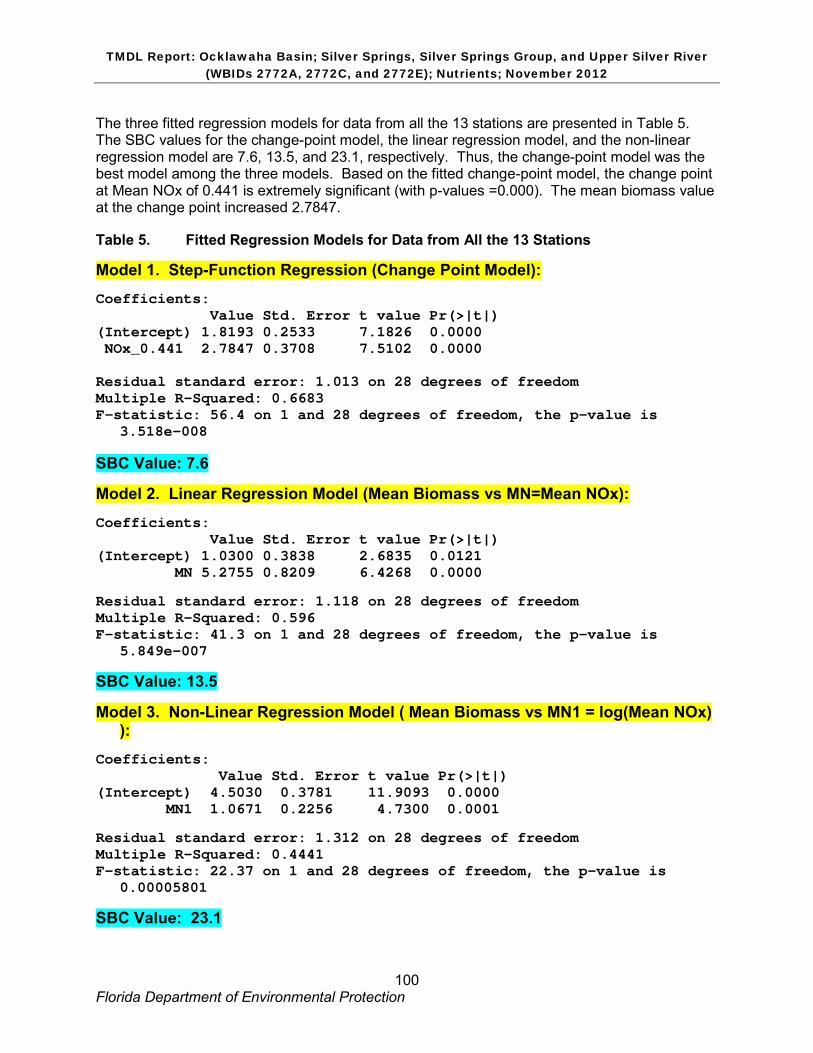
TMDL Report: Ocklawaha Basin; Silver Springs, Silver Springs Group, and Upper Silver River (WBIDs 2772A, 2772C, and 2772E); Nutrients; November 2012
100 Florida Department of Environmental Protection
The three fitted regression models for data from all the 13 stations are presented in Table 5. The SBC values for the change-point model, the linear regression model, and the non-linear regression model are 7.6, 13.5, and 23.1, respectively. Thus, the change-point model was the best model among the three models. Based on the fitted change-point model, the change point at Mean NOx of 0.441 is extremely significant (with p-values =0.000). The mean biomass value at the change point increased 2.7847.
Table 5. Fitted Regression Models for Data from All the 13 Stations Model 1. Step-Function Regression (Change Point Model): Coefficients: Value Std. Error t value Pr(>|t|) (Intercept) 1.8193 0.2533 7.1826 0.0000 NOx_0.441 2.7847 0.3708 7.5102 0.0000 Residual standard error: 1.013 on 28 degrees of freedom Multiple R-Squared: 0.6683 F-statistic: 56.4 on 1 and 28 degrees of freedom, the p-value is
3.518e-008
SBC Value: 7.6 Model 2. Linear Regression Model (Mean Biomass vs MN=Mean NOx): Coefficients: Value Std. Error t value Pr(>|t|) (Intercept) 1.0300 0.3838 2.6835 0.0121 MN 5.2755 0.8209 6.4268 0.0000 Residual standard error: 1.118 on 28 degrees of freedom Multiple R-Squared: 0.596 F-statistic: 41.3 on 1 and 28 degrees of freedom, the p-value is
5.849e-007 SBC Value: 13.5 Model 3. Non-Linear Regression Model ( Mean Biomass vs MN1 = log(Mean NOx)
): Coefficients: Value Std. Error t value Pr(>|t|) (Intercept) 4.5030 0.3781 11.9093 0.0000 MN1 1.0671 0.2256 4.7300 0.0001 Residual standard error: 1.312 on 28 degrees of freedom Multiple R-Squared: 0.4441 F-statistic: 22.37 on 1 and 28 degrees of freedom, the p-value is
0.00005801 SBC Value: 23.1
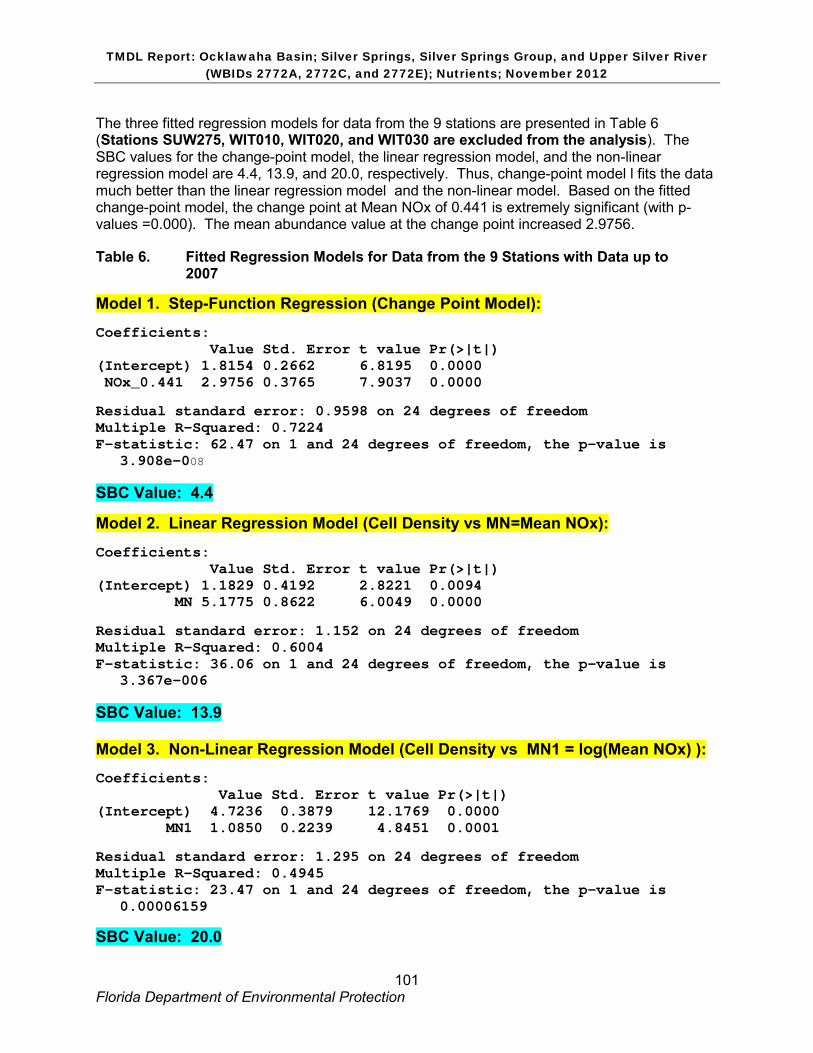
TMDL Report: Ocklawaha Basin; Silver Springs, Silver Springs Group, and Upper Silver River (WBIDs 2772A, 2772C, and 2772E); Nutrients; November 2012
101 Florida Department of Environmental Protection
The three fitted regression models for data from the 9 stations are presented in Table 6 (Stations SUW275, WIT010, WIT020, and WIT030 are excluded from the analysis). The SBC values for the change-point model, the linear regression model, and the non-linear regression model are 4.4, 13.9, and 20.0, respectively. Thus, change-point model l fits the data much better than the linear regression model and the non-linear model. Based on the fitted change-point model, the change point at Mean NOx of 0.441 is extremely significant (with p-values =0.000). The mean abundance value at the change point increased 2.9756.
Table 6. Fitted Regression Models for Data from the 9 Stations with Data up to 2007
Model 1. Step-Function Regression (Change Point Model): Coefficients: Value Std. Error t value Pr(>|t|) (Intercept) 1.8154 0.2662 6.8195 0.0000 NOx_0.441 2.9756 0.3765 7.9037 0.0000 Residual standard error: 0.9598 on 24 degrees of freedom Multiple R-Squared: 0.7224 F-statistic: 62.47 on 1 and 24 degrees of freedom, the p-value is
3.908e-008 SBC Value: 4.4 Model 2. Linear Regression Model (Cell Density vs MN=Mean NOx): Coefficients: Value Std. Error t value Pr(>|t|) (Intercept) 1.1829 0.4192 2.8221 0.0094 MN 5.1775 0.8622 6.0049 0.0000 Residual standard error: 1.152 on 24 degrees of freedom Multiple R-Squared: 0.6004 F-statistic: 36.06 on 1 and 24 degrees of freedom, the p-value is
3.367e-006 SBC Value: 13.9 Model 3. Non-Linear Regression Model (Cell Density vs MN1 = log(Mean NOx) ): Coefficients: Value Std. Error t value Pr(>|t|) (Intercept) 4.7236 0.3879 12.1769 0.0000 MN1 1.0850 0.2239 4.8451 0.0001 Residual standard error: 1.295 on 24 degrees of freedom Multiple R-Squared: 0.4945 F-statistic: 23.47 on 1 and 24 degrees of freedom, the p-value is
0.00006159 SBC Value: 20.0
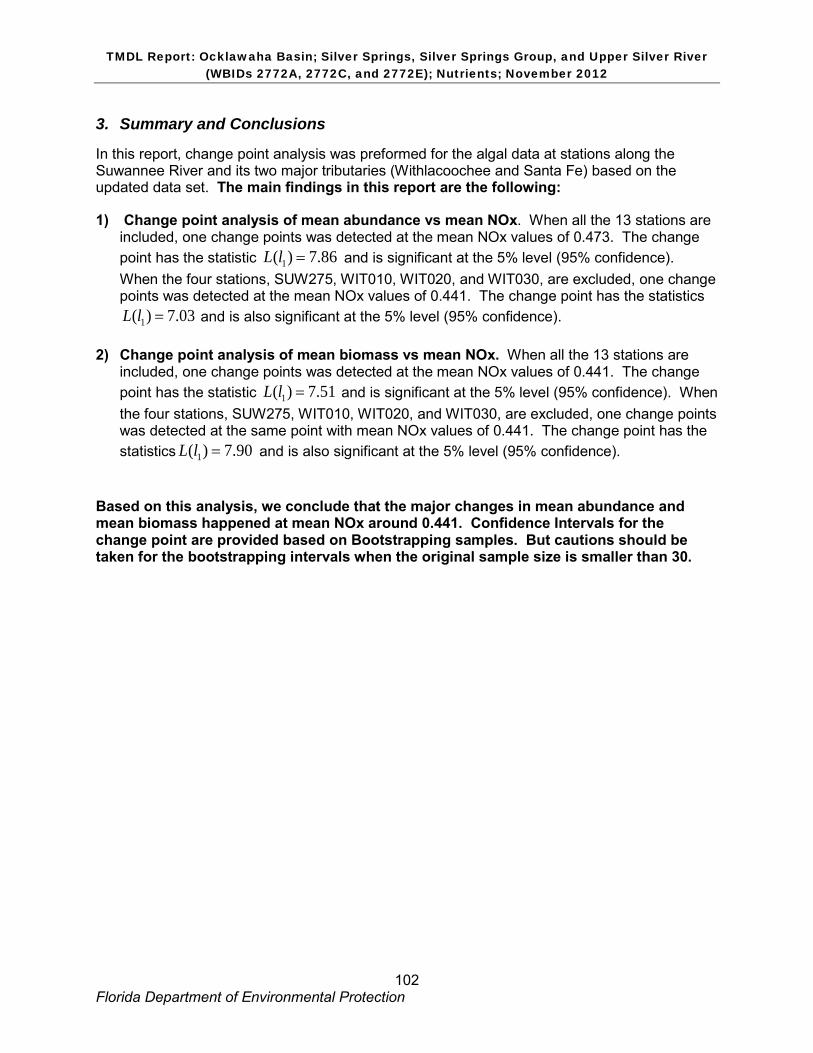
TMDL Report: Ocklawaha Basin; Silver Springs, Silver Springs Group, and Upper Silver River (WBIDs 2772A, 2772C, and 2772E); Nutrients; November 2012
102 Florida Department of Environmental Protection
3. Summary and Conclusions In this report, change point analysis was preformed for the algal data at stations along the Suwannee River and its two major tributaries (Withlacoochee and Santa Fe) based on the updated data set. The main findings in this report are the following:
1) Change point analysis of mean abundance vs mean NOx. When all the 13 stations are included, one change points was detected at the mean NOx values of 0.473. The change point has the statistic 1( ) 7.86L l = and is significant at the 5% level (95% confidence). When the four stations, SUW275, WIT010, WIT020, and WIT030, are excluded, one change points was detected at the mean NOx values of 0.441. The change point has the statistics
1( ) 7.03L l = and is also significant at the 5% level (95% confidence). 2) Change point analysis of mean biomass vs mean NOx. When all the 13 stations are
included, one change points was detected at the mean NOx values of 0.441. The change point has the statistic 1( ) 7.51L l = and is significant at the 5% level (95% confidence). When the four stations, SUW275, WIT010, WIT020, and WIT030, are excluded, one change points was detected at the same point with mean NOx values of 0.441. The change point has the statistics 1( ) 7.90L l = and is also significant at the 5% level (95% confidence).
Based on this analysis, we conclude that the major changes in mean abundance and mean biomass happened at mean NOx around 0.441. Confidence Intervals for the change point are provided based on Bootstrapping samples. But cautions should be taken for the bootstrapping intervals when the original sample size is smaller than 30.
TMDL Report: Ocklawaha Basin; Silver Springs, Silver Springs Group, and Upper Silver River (WBIDs 2772A, 2772C, and 2772E); Nutrients; November 2012
103 Florida Department of Environmental Protection
References
Chang, I. 1982. Outliers in time series. Unpublished Ph.D. Dissertation. Department of Statistics, University of Wisconsin, Madison, WI.
Chang, I., G.C. Tiao, and C. Chen. 1988. Estimation of time series parameters in the presence of outliers. Technometrics 30: 193–204.
Hornsby, D., R.A. Mattson, and T. Mirti. 2000. Surface water quality and biological monitoring. Annual report. 1999. Suwannee River Water Management District Technical Report WR-00-04.
Mattson, R.A., E.F. Lowe, C.L. Lippincott, J. Di, and L. Battoe. 2006. Wekiva River and Rock Springs Run pollutant load reduction goals. Report to the Florida Department of Environmental Protection. St. Johns River Water Management District.
Niu, X-F.., P. Lin, and D. Meeter. 2000. Detecting change points in the species composition and water quality data of WCA2A. Department of Statistics, Florida State University, Tallahassee, FL. Technical Report Submitted to the Florida Department of Environmental Protection.
Niu, X-F., and Gao, X-Q. 2007. Change point analysis of the Suwannee River algal data. Technical Report submitted to the Florida Department of Environmental Protection.
Niu, X-F., and D. Miller 2007. Change point analysis and model comparison of Stream Condition Index and biological condition gradient data. Technical report submitted to the Florida Department of Environmental Protection.
Pankratz, A. 1991. Forecasting with dynamic regression models. John Wiley & Sons Inc. New York.
Schwartz, G. 1978. Estimating the dimension of a model. The Annals of Statistics 6: 461–464.

Florida Department of Environmental Protection Division of Environmental Assessment and Restoration
Bureau of Watershed Restoration 2600 Blair Stone Road, Mail Station 3575
Tallahassee, FL 32399-2400