1
Nutrient Uptake and Partitioning in High-Yielding Corn Ross R. Bender 1 , Jason W. Haegele 1 , Matias Ruffo 2 , and Fred E. Below 1 1 Crop Physiology Laboratory, Department of Crop Sciences, University of Illinois at Urbana-Champaign 2 Mosaic Company, Buenos Aires, Argentina Nutrient uptake capabilities of hybrids with management practices in the 1940’s through 1980’s are well documented. Refined agronomic production practices (earlier planting dates, narrower row spacing, increased planting density) and the advent of transgenic insect protection may have changed the potential for season-long nutrient accumulation and utilization (Table 1). Current fertilizer recommendations based on older nutrient uptake data may not be adequate in supporting modern hybrids and management practices. 1. Are there key nutrients for high yield corn production? Yes, nutrients with high requirements for production (N, P, K), or that have a high HI (P, Zn, S, N) allude to important nutrients for high yield. 2. Can the agronomic management of nutrient application rate, placement, and timing in corn production be further improved? Yes, accumulation of P, S, and Zn was greater during grain-fill than vegetative growth and as such, season-long supply of these nutrients are critical for optimum grain production. Application of fertilizers should meet plant needs during the greatest period of nutrient uptake, from V10 to V14. Field experiments were conducted in 2010 at Champaign, Illinois on a Drummer-Flanagan silty clay loam and in DeKalb, Illinois on a Flanagan silt loam. Plots were planted in Champaign on May 24 th and in DeKalb on May 20 th to achieve a final stand of 84,000 plants ha -1 (34,000 plants ac -1 ). One week before planting, 202 kg N ha -1 was applied as urea ammonium nitrate (28-0-0) with a sidedress application of 67 kg N ha -1 at V6 as weather-protected urea (46-0-0). At planting, 168 kg P 2 O 5 ha -1 was applied as MicroEssentials® SZ TM (12-40-0-10S-1Zn) to mimic a fertilizer regime for a corn- soybean rotation (commonplace in Illinois, USA). All hybrids possessed herbicide tolerance and resistance to feeding from certain above-ground and below-ground insects: DKC61-21 SSTX, 111 RM DKC61-69 VT3, 111 RM DKC63-42 VT3, 113 RM Six plants were sampled at each of six growth stages (V6, V10, V14, R2, R4, R6) for dry weight and nutrient analysis. Grain and stover samples were analyzed for N, P, K, Mg, S, Zn, B, Mn, Fe, and Cu concentration by A&L Great Lakes Laboratories (Fort Wayne, IN). Only N, P, K, S, and Zn are presented here. All values are expressed on a dry weight (0% moisture) basis. Figures were prepared in SigmaPlot using the simple spline option with smoothed data points. Figure 1. The seasonal accumulation and partitioning of dry weight (DW), nitrogen (N), phosphorus (P), potassium (K), sulfur (S), and zinc (Zn) averaged over six hybrids evaluated at two locations in 2010. The average grain yield of six hybrids was approximately 12.0 Mg ha -1 . Average grain yield and total biomass production were 12.0 and 23.2 Mg ha -1 respectively (Figure 1). Nutrients supplied in these quantities (Table 2) would be expected to meet corn requirements for this yield level. Location did not influence uptake of nutrients (data not shown) thus uptake patterns between locations were combined (Figure 1). Nutrient uptake at R6 was significantly different among hybrids (P<0.05, data not shown) and as a result, ranges of nutrient uptake are shown in Table 2. Nutrients with high total uptake (i.e. N, P, K) represent a yield limitation if not supplied in sufficient quantities. Those nutrients with greater HI values (e.g. N, P, S, Zn) are removed from a cropping system to a relatively greater extent. Our data (Table 2) suggest that total nutrient uptake has increased nearly two- fold compared to values reported by Hanway (1962b; see Table 1). Table 1. Agronomic management practices and measured total nutrient uptake in corn, compiled from select nutrient accumulation studies during the past 60 years. All units are expressed on a dry weight (0% moisture) basis. No fertility practice information was provided by Sayre (1948), although four differing fertility regimes were averaged from Hanway (1962a/1962b), and an irrigated, intensively fertilized and limed study was used by Karlen et al. (1988). Previous literature demonstrates the range in nutrient uptake capabilities of hybrids and management practices common in the 1940’s through the 1980’s (Table 1). Although the biology of maize nutrient uptake and partitioning has likely not changed from earlier studies, increased grain yields and biomass production may be associated with greater total plant uptake and increased removal. These studies favored early season nutrient accumulation with an estimated 55% and 80% of P and K uptake occurring before flowering (Hanway, 1962b). Nutrient Total Nutrient Uptake Nutrient Removal Nutrient HI Mean Range Mean Range Mean Range ----------------------------------- kg ha -1 ----------------------------------- ------------- % ------------- N 286 266 – 307 166 145 – 188 58 51 – 62 P 2 O 5 114 100 – 133 90 73 – 108 79 70 – 82 K 2 O 202 181 – 225 66 57 – 78 33 27 – 37 S 26 24 – 28 15 13 – 16 57 52 – 60 ----------------------------------- g ha -1 ----------------------------------- ------------- % ------------- Zn 498 448 – 563 308 269 – 353 62 60 – 65 Table 3. Rates of biomass and nutrient accumulation determined between the V10 and V14 growth stages and the percent of total nutrient uptake by R1 for measured parameters evaluated at two locations in Illinois during 2010. Rate of accumulation represents the maximum rate of nutrient uptake during the growing season. Sayre, 1948 Hanway, 1962a/1962b Karlen et al., 1988 Agronomic parameters Row spacing, cm 107 107 30 Plant spacing, cm 36 66 30 Plant density, plants ha -1 25,960 42,583 111,111 Productivity Grain yield, kg ha -1 6,300 4,600 16,300 Biomass yield, kg ha -1 13,700 13,600 31,800 Nutrient uptake N, kg ha -1 159 141 386 P 2 O 5 , kg ha -1 77 56 161 K 2 O, kg ha -1 131 87 446 S, kg ha -1 - - 40 Zn, g ha -1 - - 800 † Biomass and nutrient accumulation means averaged across four major fertility practices used by Hanway. ‡ Planted using a ‘hill’ system in which three seeds were placed in each cluster spaced 66-cm apart. Measurement Rate of accumulation Uptake by R1 ----------- kg ha -1 day -1 ----------- ------- % ------- Biomass 439 35 N 8.9 65 P 2 O 5 2.4 44 K 2 O 5.8 63 S 0.7 48 -----------g ha -1 day -1 ----------- ------- % ------- Zn 14.2 48 What are the season-long mineral nutrition needs in contemporary corn production? Quantify nutrient uptake and partitioning in commercial germplasm with transgenic insect protection grown under modern management practices. Table 2. Total macronutrient and micronutrient uptake and removal in Urbana and DeKalb, IL (2010). Harvest Index (HI) was calculated as the ratio between nutrient removed with grain and total nutrient uptake and is reported as a percent. ASA, CSSA, and SSSA 2012 International Annual Meetings, Oct. 21-24, Cincinnati, OH. As much as two-thirds of N and K uptake occurred before flowering compared to only one-half of P, S, and Zn (Table 3, Figure 1). Our data demonstrated greater post-flowering accumulation of P and K compared to Hanway (1962b) which may be due to longer relative maturity hybrids with greater dry matter production during late reproductive growth (e.g. R4-R6). Maximum rates of nutrient accumulation coincided with maximum rates of dry weight production, a 10-day period between V10 and V14 (Table 3). This period accounted for 20-30% of total uptake for all nutrients. DKC64-24 VT3, 114 RM P33W84 HXX, 110 RM H-9014 3000GT, 112 RM Dry Weight (kg ha -1 ) 3000 6000 9000 12000 15000 18000 21000 Percent of Total (%) 25 50 75 100 N Uptake (kg N ha -1 ) 0 40 80 120 160 200 240 280 Percent of Total (%) 25 50 75 100 P Uptake (kg P 2 O 5 ha -1 ) 0 15 30 45 60 75 90 105 GDD C 0 200 400 600 800 1000 1200 1400 Percent of Total (%) 0 25 50 75 100 Grain Tassel, Cob, Husk Stalk and Leaf Sheaths Leaf Blades V6 V10 V14 R2 R4 R6 VE V4 V2 VT/R1 R5 Growth Stage DW N P K Uptake (kg K 2 O ha -1 ) 25 50 75 100 125 150 175 200 Percent of Total (%) 25 50 75 100 S Uptake (kg S ha -1 ) 3.3 6.5 9.8 13.0 16.3 19.5 22.7 26.0 Percent of Total (%) 25 50 75 100 Zn Uptake (g Zn ha -1 ) 0 100 200 300 400 500 GDD C 0 200 400 600 800 1000 1200 1400 Percent of Total (%) 0 25 50 75 100 K S Zn V6 V10 V14 R2 R4 R6 VE V4 V2 VT/R1 R5 Growth Stage

Nutrient Uptake and Partitioning in High-Yielding Corn

  • Upload
    others

  • View
    3

  • Download
    0

Embed Size (px)

Citation preview

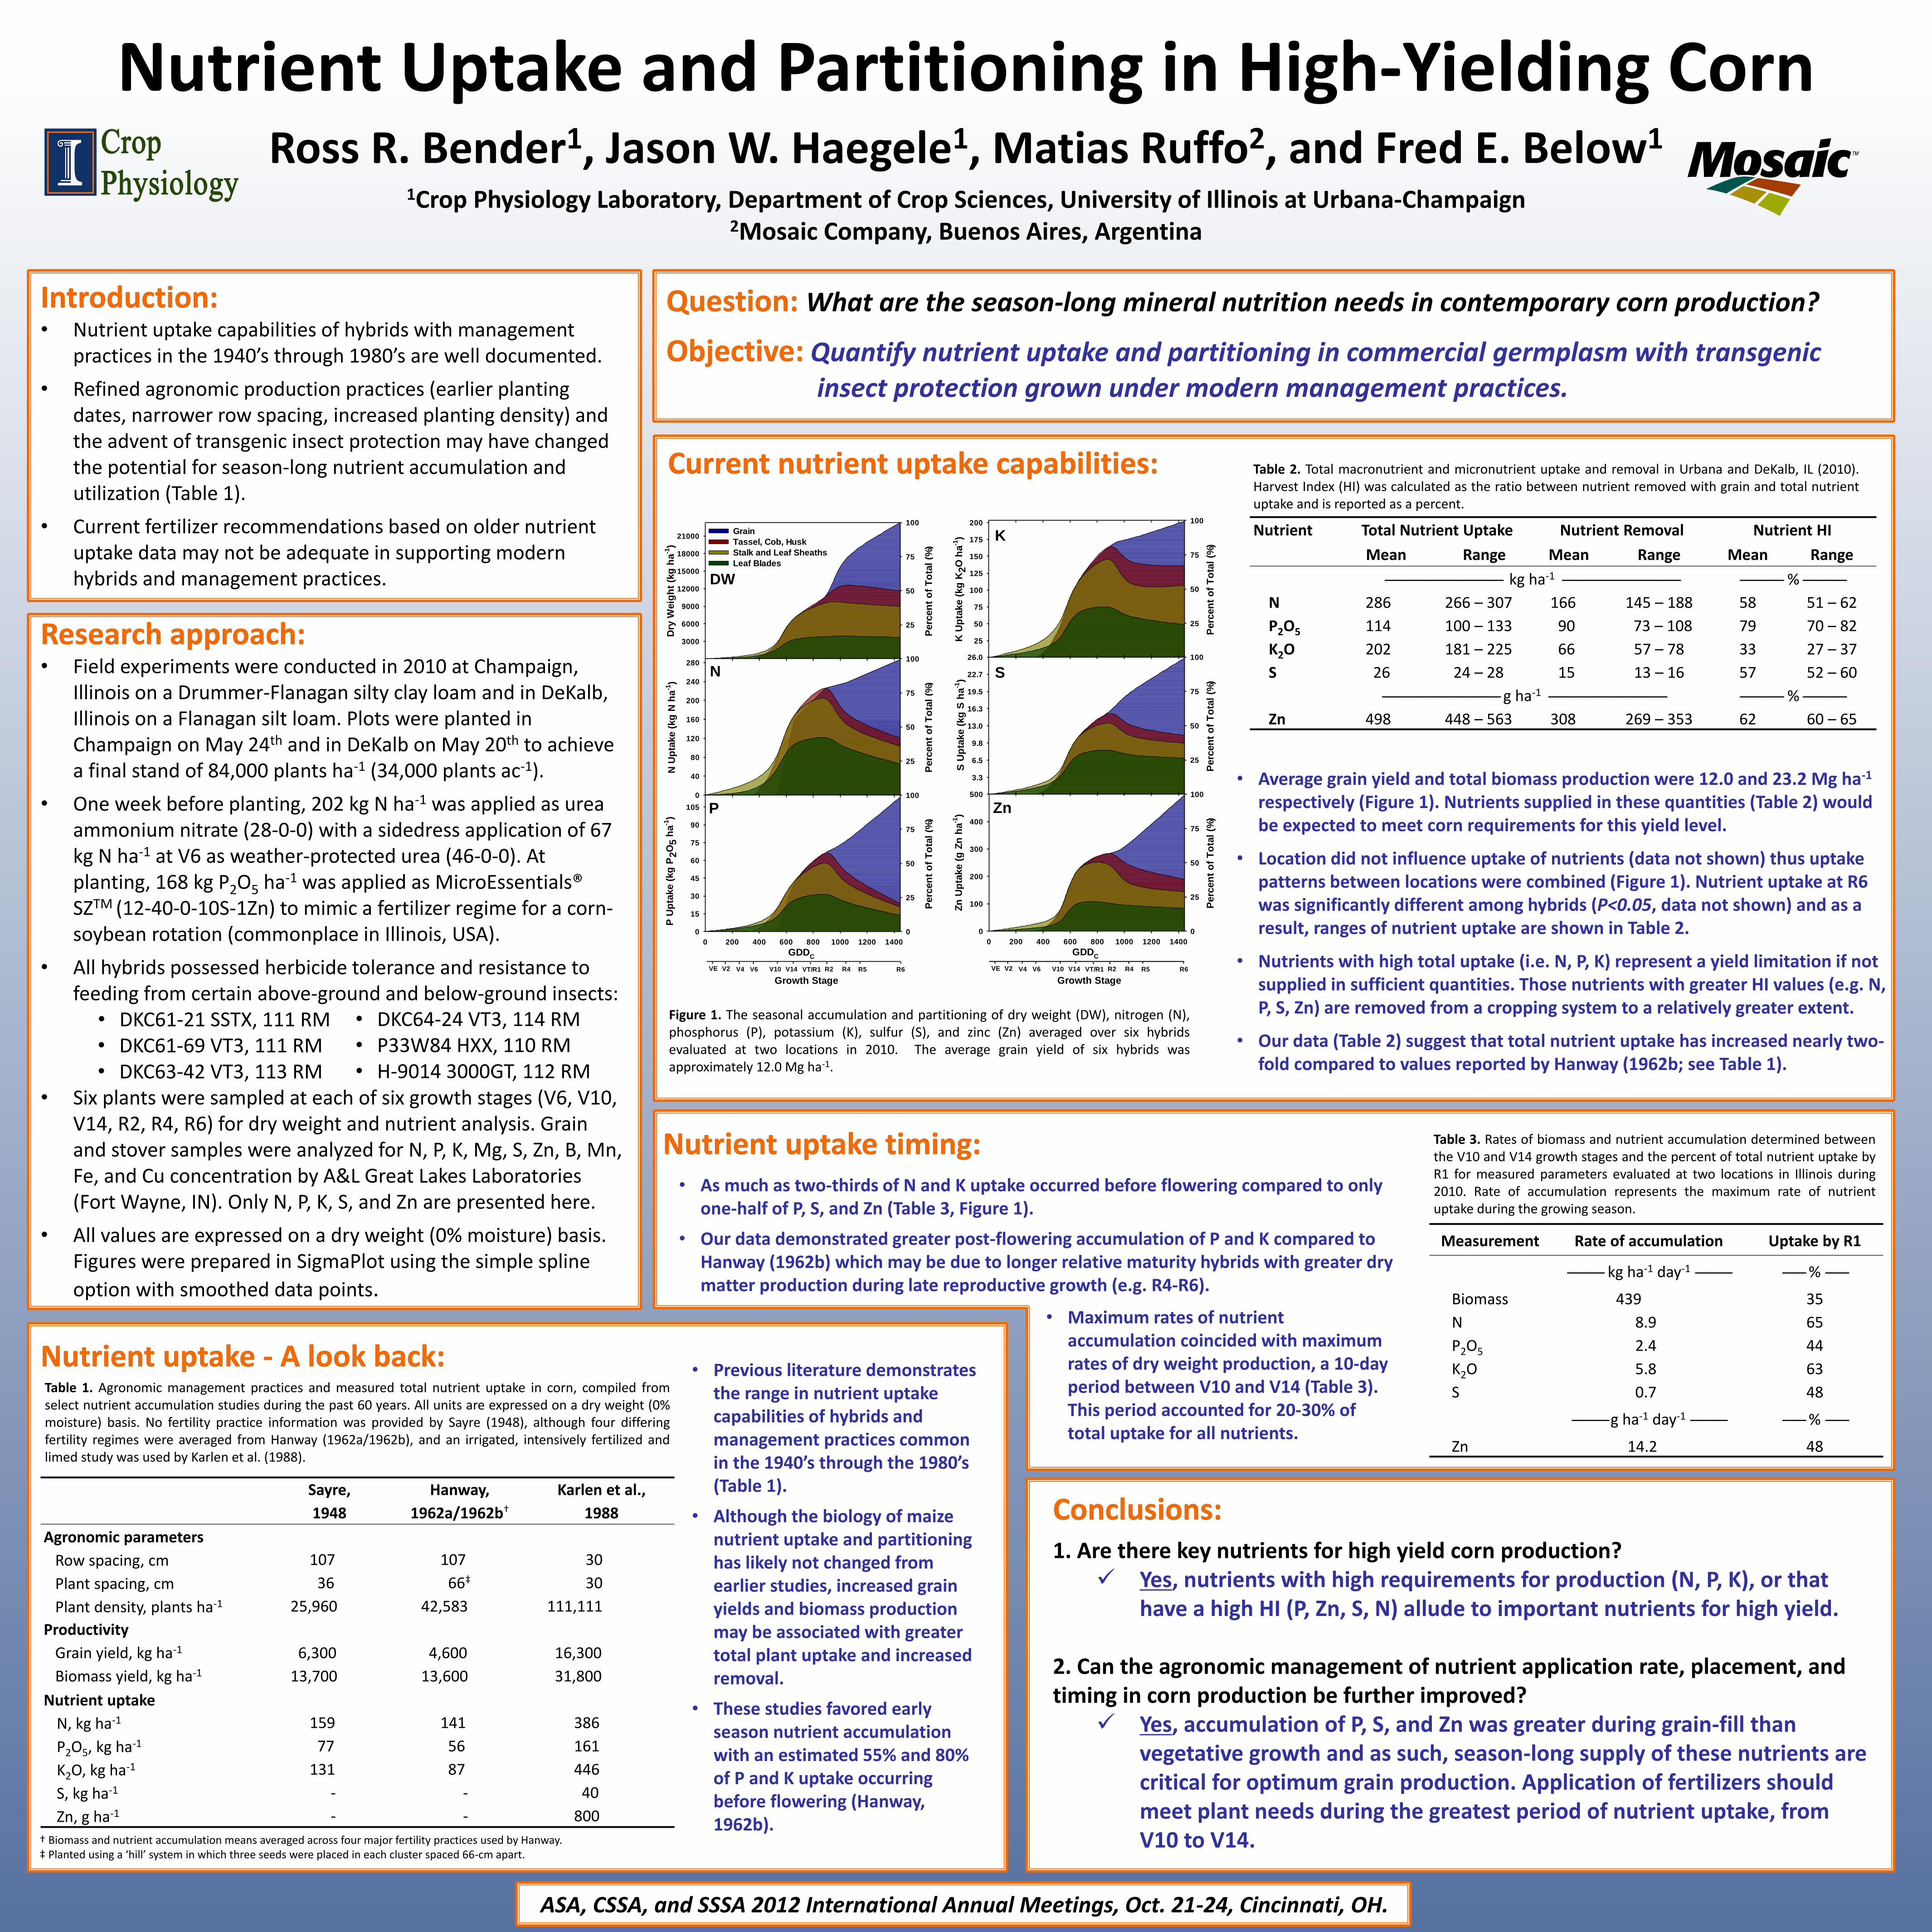
Nutrient Uptake and Partitioning in High-Yielding Corn Ross R. Bender1, Jason W. Haegele1, Matias Ruffo2, and Fred E. Below1

1Crop Physiology Laboratory, Department of Crop Sciences, University of Illinois at Urbana-Champaign 2Mosaic Company, Buenos Aires, Argentina

• Nutrient uptake capabilities of hybrids with management practices in the 1940’s through 1980’s are well documented.

• Refined agronomic production practices (earlier planting dates, narrower row spacing, increased planting density) and the advent of transgenic insect protection may have changed the potential for season-long nutrient accumulation and utilization (Table 1).

• Current fertilizer recommendations based on older nutrient uptake data may not be adequate in supporting modern hybrids and management practices.

1. Are there key nutrients for high yield corn production? Yes, nutrients with high requirements for production (N, P, K), or that

have a high HI (P, Zn, S, N) allude to important nutrients for high yield.

2. Can the agronomic management of nutrient application rate, placement, and timing in corn production be further improved?

Yes, accumulation of P, S, and Zn was greater during grain-fill than vegetative growth and as such, season-long supply of these nutrients are critical for optimum grain production. Application of fertilizers should meet plant needs during the greatest period of nutrient uptake, from V10 to V14.

• Field experiments were conducted in 2010 at Champaign, Illinois on a Drummer-Flanagan silty clay loam and in DeKalb, Illinois on a Flanagan silt loam. Plots were planted in Champaign on May 24th and in DeKalb on May 20th to achieve a final stand of 84,000 plants ha-1 (34,000 plants ac-1).

• One week before planting, 202 kg N ha-1 was applied as urea ammonium nitrate (28-0-0) with a sidedress application of 67 kg N ha-1 at V6 as weather-protected urea (46-0-0). At planting, 168 kg P2O5 ha-1 was applied as MicroEssentials® SZTM (12-40-0-10S-1Zn) to mimic a fertilizer regime for a corn-soybean rotation (commonplace in Illinois, USA).

• All hybrids possessed herbicide tolerance and resistance to feeding from certain above-ground and below-ground insects:

• DKC61-21 SSTX, 111 RM • DKC61-69 VT3, 111 RM • DKC63-42 VT3, 113 RM

• Six plants were sampled at each of six growth stages (V6, V10, V14, R2, R4, R6) for dry weight and nutrient analysis. Grain and stover samples were analyzed for N, P, K, Mg, S, Zn, B, Mn, Fe, and Cu concentration by A&L Great Lakes Laboratories (Fort Wayne, IN). Only N, P, K, S, and Zn are presented here.

• All values are expressed on a dry weight (0% moisture) basis. Figures were prepared in SigmaPlot using the simple spline

option with smoothed data points.

Figure 1. The seasonal accumulation and partitioning of dry weight (DW), nitrogen (N), phosphorus (P), potassium (K), sulfur (S), and zinc (Zn) averaged over six hybrids evaluated at two locations in 2010. The average grain yield of six hybrids was approximately 12.0 Mg ha-1.

• Average grain yield and total biomass production were 12.0 and 23.2 Mg ha-1

respectively (Figure 1). Nutrients supplied in these quantities (Table 2) would be expected to meet corn requirements for this yield level.

• Location did not influence uptake of nutrients (data not shown) thus uptake patterns between locations were combined (Figure 1). Nutrient uptake at R6 was significantly different among hybrids (P<0.05, data not shown) and as a result, ranges of nutrient uptake are shown in Table 2.

• Nutrients with high total uptake (i.e. N, P, K) represent a yield limitation if not supplied in sufficient quantities. Those nutrients with greater HI values (e.g. N, P, S, Zn) are removed from a cropping system to a relatively greater extent.

• Our data (Table 2) suggest that total nutrient uptake has increased nearly two-fold compared to values reported by Hanway (1962b; see Table 1).

Table 1. Agronomic management practices and measured total nutrient uptake in corn, compiled from select nutrient accumulation studies during the past 60 years. All units are expressed on a dry weight (0% moisture) basis. No fertility practice information was provided by Sayre (1948), although four differing fertility regimes were averaged from Hanway (1962a/1962b), and an irrigated, intensively fertilized and limed study was used by Karlen et al. (1988).

• Previous literature demonstrates the range in nutrient uptake capabilities of hybrids and management practices common in the 1940’s through the 1980’s (Table 1).

• Although the biology of maize nutrient uptake and partitioning has likely not changed from earlier studies, increased grain yields and biomass production may be associated with greater total plant uptake and increased removal.

• These studies favored early season nutrient accumulation with an estimated 55% and 80% of P and K uptake occurring before flowering (Hanway, 1962b).

Nutrient Total Nutrient Uptake Nutrient Removal Nutrient HI

Mean Range Mean Range Mean Range

----------------------------------- kg ha-1 ----------------------------------- ------------- % -------------

N 286 266 – 307 166 145 – 188 58 51 – 62

P2O5 114 100 – 133 90 73 – 108 79 70 – 82

K2O 202 181 – 225 66 57 – 78 33 27 – 37

S 26 24 – 28 15 13 – 16 57 52 – 60

----------------------------------- g ha-1 ----------------------------------- ------------- % -------------

Zn 498 448 – 563 308 269 – 353 62 60 – 65

Table 3. Rates of biomass and nutrient accumulation determined between the V10 and V14 growth stages and the percent of total nutrient uptake by R1 for measured parameters evaluated at two locations in Illinois during 2010. Rate of accumulation represents the maximum rate of nutrient uptake during the growing season.

Sayre,

1948

Hanway,

1962a/1962b†

Karlen et al.,

1988

Agronomic parameters

Row spacing, cm 107 107 30

Plant spacing, cm 36 66‡ 30

Plant density, plants ha-1 25,960 42,583 111,111

Productivity

Grain yield, kg ha-1 6,300 4,600 16,300

Biomass yield, kg ha-1 13,700 13,600 31,800

Nutrient uptake

N, kg ha-1 159 141 386

P2O5, kg ha-1 77 56 161

K2O, kg ha-1 131 87 446

S, kg ha-1 - - 40

Zn, g ha-1 - - 800

† Biomass and nutrient accumulation means averaged across four major fertility practices used by Hanway. ‡ Planted using a ‘hill’ system in which three seeds were placed in each cluster spaced 66-cm apart.

Measurement Rate of accumulation Uptake by R1

----------- kg ha-1 day-1 ----------- ------- % -------

Biomass 439 35

N 8.9 65

P2O5 2.4 44

K2O 5.8 63

S 0.7 48

----------- g ha-1 day-1 ----------- ------- % -------

Zn 14.2 48

What are the season-long mineral nutrition needs in contemporary corn production?

Quantify nutrient uptake and partitioning in commercial germplasm with transgenic insect protection grown under modern management practices.

Table 2. Total macronutrient and micronutrient uptake and removal in Urbana and DeKalb, IL (2010). Harvest Index (HI) was calculated as the ratio between nutrient removed with grain and total nutrient uptake and is reported as a percent.

ASA, CSSA, and SSSA 2012 International Annual Meetings, Oct. 21-24, Cincinnati, OH.

• As much as two-thirds of N and K uptake occurred before flowering compared to only one-half of P, S, and Zn (Table 3, Figure 1).

• Our data demonstrated greater post-flowering accumulation of P and K compared to Hanway (1962b) which may be due to longer relative maturity hybrids with greater dry matter production during late reproductive growth (e.g. R4-R6).

• Maximum rates of nutrient accumulation coincided with maximum rates of dry weight production, a 10-day period between V10 and V14 (Table 3). This period accounted for 20-30% of total uptake for all nutrients.

• DKC64-24 VT3, 114 RM • P33W84 HXX, 110 RM • H-9014 3000GT, 112 RM

Dry

Weig

ht

(kg

ha

-1)

3000

6000

9000

12000

15000

18000

21000

Perc

en

t o

f T

ota

l (%

)

25

50

75

100

N U

pta

ke (

kg

N h

a-1

)

0

40

80

120

160

200

240

280

Perc

en

t o

f T

ota

l (%

)

25

50

75

100

P U

pta

ke (

kg

P2O

5 h

a-1

)

0

15

30

45

60

75

90

105

GDDC

0 200 400 600 800 1000 1200 1400

Perc

en

t o

f T

ota

l (%

)0

25

50

75

100

Grain

Tassel, Cob, Husk

Stalk and Leaf Sheaths

Leaf Blades

V6 V10 V14 R2 R4 R6VE V4V2 VT/R1 R5

Growth Stage

DW

N

P

K U

pta

ke (

kg

K2O

ha

-1)

25

50

75

100

125

150

175

200

Perc

en

t o

f T

ota

l (%

)

25

50

75

100

S U

pta

ke (

kg

S h

a-1

)

3.3

6.5

9.8

13.0

16.3

19.5

22.7

26.0

Perc

en

t o

f T

ota

l (%

)

25

50

75

100

Zn

Up

take (

g Z

n h

a-1

)

0

100

200

300

400

500

GDDC

0 200 400 600 800 1000 1200 1400

Perc

en

t o

f T

ota

l (%

)

0

25

50

75

100

K

S

Zn

V6 V10 V14 R2 R4 R6VE V4V2 VT/R1 R5

Growth Stage