Embed Size (px)
Citation preview
Queensland Alliance for Agriculture and Food Innovation
Mike Bell QAAFI, Univ of Qld
Nutrients in soils

Queensland Alliance for Agriculture and Food Innovation
Nutrient dynamics in healthy soils Soils can be considered both a source (provider) and a
sink (storage area) for nutrients Those nutrients can be in either organic or inorganic
(mineral) materials, derived from local geological processes or imported from off site.
The organic materials can be inert (soil organic matter), recently deceased or alive and ‘kicking’
The inorganic materials range from ions dissolved in soil water, to native minerals with varying solubilities and synthetic bag fertilisers
Adequate nutrient supplies are a key requirement of a healthy soil

Queensland Alliance for Agriculture and Food Innovation
We need to understand both nutrient behaviour in soils and nutrient cycling in different land
management systems if we are to manage these nutrients.

Queensland Alliance for Agriculture and Food Innovation
Let’s consider natural systems
Undisturbed Groundcover Little net nutrient removal Ecosystems developed in
response to soil types and climate
We have changed these markedly, with those changes potentially impacting on soil health
Queensland Alliance for Agriculture and Food Innovation
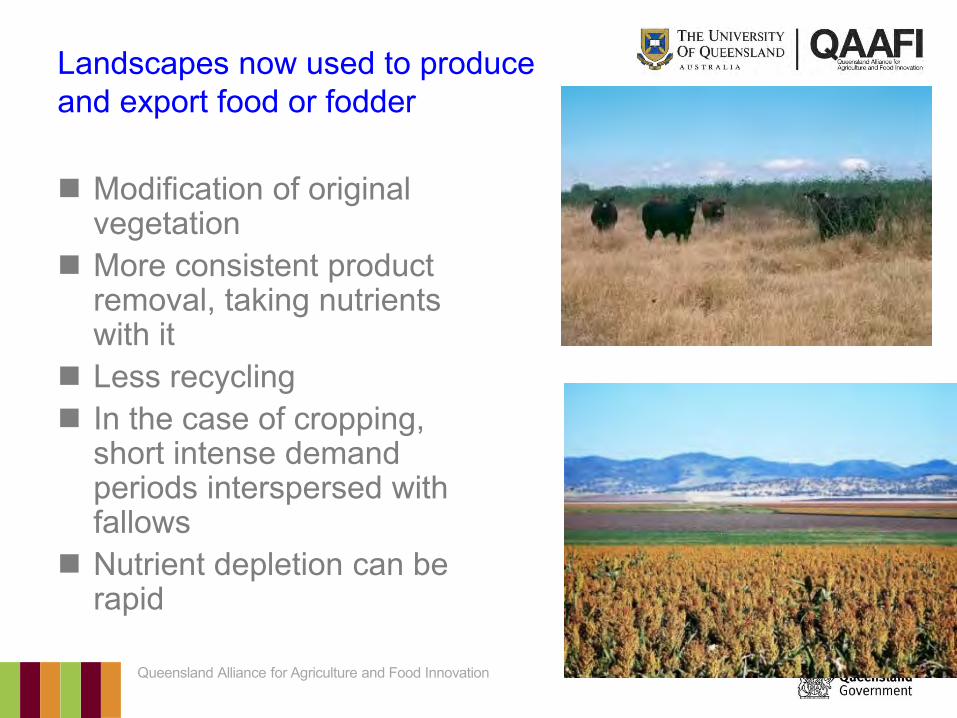
Landscapes now used to produce and export food or fodder
Modification of original vegetation
More consistent product removal, taking nutrients with it
Less recycling In the case of cropping,
short intense demand periods interspersed with fallows
Nutrient depletion can be rapid

Queensland Alliance for Agriculture and Food Innovation
In summary….
The relative sizes of the input and output arrows are critical…especially the red ones!

Queensland Alliance for Agriculture and Food Innovation
A case study – Darling Downs
Cropping property with records from the mid 60’s
Productivity has increased hugely
Nutrient demand has risen as native reserves have been depleted
Fertiliser use (esp N) has increased to compensate
We need to consider removal rates to see how sustainable all this is
0
1
2
3
4
5
6
7
1960 1970 1980 1990 2000
Yiel
d (t/
ha)
Wheat Sorghum
0
20
40
60
80
100
120
140
160
1960 1970 1980 1990 2000
N f
erti
lise
r ap
pli
ed (
kg/h
a)
Wheat Sorghum

Queensland Alliance for Agriculture and Food Innovation
Nutrient removal in crop produce
…………. In grain (kg/t) N P K Ca Mg S Peanut (pods) 32 3 10 1 2 2 Maize 15 3 3 <0.1 1 1 Soybean 68 5 21 2 3 3 Wheat 23 4 4 1 1 2 Sorghum 17 2 3 1 1 2
Assume legume N comes from fixation (ie. free)

Queensland Alliance for Agriculture and Food Innovation
Nutrient removal in hay ……. Crop residues or forages (kg/t dry) N P K Ca Mg S Lucerne 30 2 24 10 3 3 Oats 13 2 17 2 1 1 Silage corn 12 2 15 2 2 1 Peanut (tops) 20 1 20 15 4 2 Soybean (trash) 5 1 10 10 5 4

Queensland Alliance for Agriculture and Food Innovation
Some rough calculations provide some big numbers…
Nutrient removal (kg/ha) in hays ….. N P K Ca Mg S 18 t/ha Lucerne 540 36 430 180 49 47 6 t/ha Oats 78 10 102 14 7 7 10 t/ha Silage corn 120 19 150 21 24 10 2 t/ha Peanut hay 40 3 40 30 8 4 2 t/ha Soybean trash 10 1 20 20 10 8

Queensland Alliance for Agriculture and Food Innovation
Putting this in $ terms…
Nutrient to be replaced ($/ha) ….. N P K Ca Mg S 18 t/ha Lucerne - $700/ha 6 t/ha Oats $230/ha 10 t/ha Silage corn $360/ha 2 t/ha Peanut hay - $70/ha 2 t/ha Soybean trash - $45/ha

Queensland Alliance for Agriculture and Food Innovation
We are still mining nutrients!. Budgets were calculated by subtracting nutrients removed
in grain from fertilizers added on farms across the region. Budgets were derived for individual crops and for ‘typical’
crop rotations over a number of years Data are shown for N, P and K
Comparisons over a rotation sequence of 5 crops
-300
-250
-200
-150
-100
-50
0
50
CentralHighlands
DawsonCallide
EasternDowns
Goondiwindi-Moonie
LiverpoolPlains
Moree-Narrabri North Star
WesternDowns
Def
icit
or s
urpl
us (k
g/ha
)
N P K
Comparisons over a rotation sequence of 5 crops
-300
-250
-200
-150
-100
-50
0
50
CentralHighlands
DawsonCallide
EasternDowns
Goondiwindi-Moonie
LiverpoolPlains
Moree-Narrabri North Star
WesternDowns
Def
icit
or s
urpl
us (k
g/ha
)
N P K

Queensland Alliance for Agriculture and Food Innovation
Where have these nutrients come from??
Forms – depends on the nutrient. Most N and S has come from organic matter,
decomposed by microbes (see next slides on how release happens).
Most other nutrients have come from soil minerals (eg. P, K, Ca, Mg, Zn etc). Most soils have (had?) some minerals that can dissolve to help meet plant demand.
In both cases, a good analogy is a credit card. The credit limit varies with soil type, but eventually deposits (manures, fertilisers, legumes) have to balance withdrawals.

Queensland Alliance for Agriculture and Food Innovation
Where have these nutrients come from??
Position – depends on the nutrient. Most N and S are in the topsoils with organic matter. However, once ‘mineralised’ by microbes, N and S can move with water into deeper soil layers
Most other nutrients are much less mobile. They stay near where they are put (or dissolved). Most net depletion is in the subsoil.
Roots deplete subsoils; residues and fertilisers replenish topsoils, with only some nutrients able to get back into subsoils quickly
Queensland Alliance for Agriculture and Food Innovation
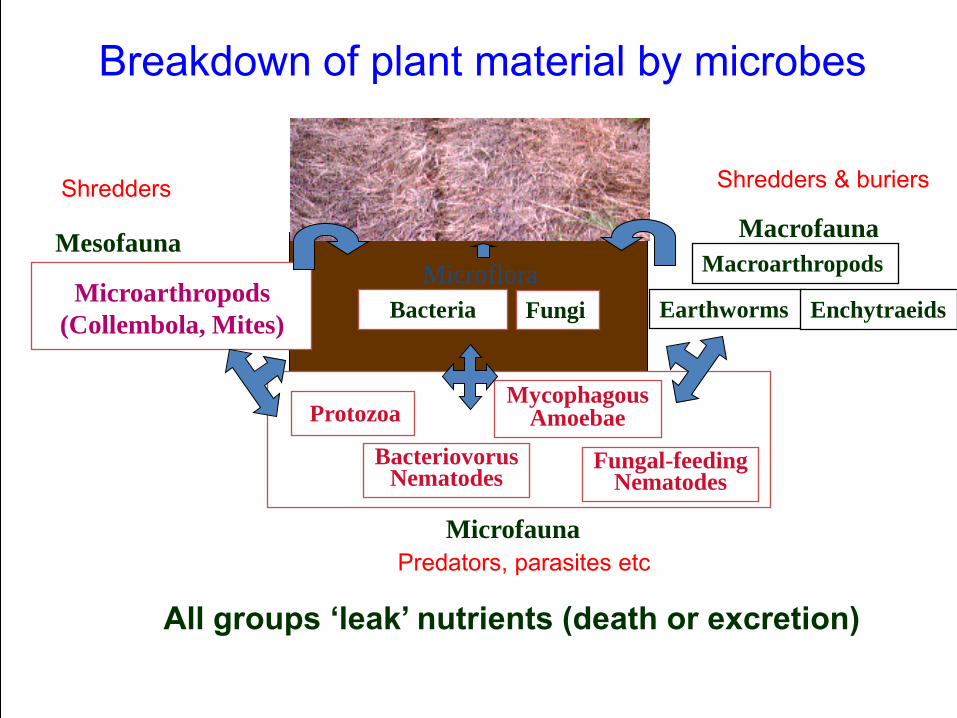
Breakdown of plant material by microbes
Microarthropods
(Collembola, Mites)
Mesofauna Macrofauna
Macroarthropods
Earthworms Enchytraeids
Shredders Shredders & buriers
Fungi Bacteria
Microflora
Protozoa Mycophagous
Amoebae
Bacteriovorus Nematodes
Fungal-feeding Nematodes
Microfauna
Predators, parasites etc
All groups ‘leak’ nutrients (death or excretion)

Queensland Alliance for Agriculture and Food Innovation
Eg. N release from fungal or bacterial decomposition of residues
PLANT RESIDUE
Bacteria (C/N = 4)
Fungi (C/N = 8)
Bacterial-feeding nematodes (C/N = 6)
Fungal-feeding nematodes (C/N = 9)
Nematodes excrete excess N in mineral form for use by plants

Queensland Alliance for Agriculture and Food Innovation
Key points about the position of nutrients in the profile
Remember nutrients behave differently in soil
N and S are mobile in water, so can move into deeper soil layers
P and K are not mobile, so stay where they are put
All have to be where plant roots can get at them to grow a good crop
N and S – Mineralised in topsoil, then move in water
P and K – Depleted in subsoil (native fertility); Topsoils replenished by fertiliser and stubble

Queensland Alliance for Agriculture and Food Innovation
What does this mean for our soils?
Much more of our soil nutrients are now in the topsoil layers
When those layers are dry, crops can’t get at them and there is less underneath.
When we have an erosion event, we can lose both organic matter and immobile nutrients.
In essence, our soils have lost some of their natural resilience

Queensland Alliance for Agriculture and Food Innovation
Key points about plant roots
Top 10cm – highest root density if wet, but can be dry for long periods
Next 20-30cm – Wetter for longer, high root density. NB for supply of nutrients during dry periods
Subsoil (30-90cm) – Variable depth of wetting, much lower root density. NB for water and NO3-N during dry periods

Queensland Alliance for Agriculture and Food Innovation
What are our management options?
Balance our nutrient removal with inputs (fertilisers, manures, use of legumes)
Put those nutrients where they will do the most good (deep for immobile nutrients)
Try to rebuild soil organic matter (a nutrient store and driver of soil biology)

Queensland Alliance for Agriculture and Food Innovation
The way we place immobile nutrients is critical for crop access – especially in subsoils
If we put immobile nutrients in bands, we have to get lots of roots in and around those bands
Alternately we need to mix the nutrients better - lots of bands or lots of tillage
The nutrient mix in the band can encourage roots to exploit those nutrients. N and P help root activity
Band with root proliferation
Dilute nutrient through a large soil volume
0.00
0.50
1.00
1.50
2.00
2.50
3.00
Maize Cotton
K up
take
(g)
Control 80 kg/ha KCl, 20 kg/ha RbCl80 kg/ha KCl, 20 kg/ha RbCl + 30 kg/ha TSP 80 kg/ha KCl, 20 kg/ha RbCl + 48 kg/ha MAP

Queensland Alliance for Agriculture and Food Innovation
But be realistic about changing soil organic matter….
0
10
20
30
40
50
60
70
80
90
0.9 1 1.1 1.2 1.3 1.4 1.5 1.6 1.7
Bulk density (g/cm3)
Am
ount
of c
arbo
n in
the
0-10
cm
laye
r (M
g C
/ ha)
1% SOC 2% SOC 3% SOC 4% SOC 5% SOC
10
20
Amount of C required: 10 t C/ha 24 t Dry Matter (DM) This is in addition to what is returned already Remember also that only a fraction of C added is actually retained

Queensland Alliance for Agriculture and Food Innovation
You will also tie up nutrients if you increase soil organic matter
Assumptions: C/N =10 and C/P=120)
0
200
400
600
800
1000
1200
1400
1600
1800
0.0 0.2 0.4 0.6 0.8 1.0 Change in soil carbon
(% of soil mass)
Am
ount
of N
(kg
/ha)
BD = 1.0
BD = 1.6
0
20
40
60
80
100
120
140
0.0 0.2 0.4 0.6 0.8 1.0 Change in soil carbon
(% of soil mass)
Am
ount
of P
(kg
/ha)
BD = 1.0
BD = 1.6
Increasing soil organic C by 1% will require 900-1500 kg N/ha and 70-120 kg P/ha

Queensland Alliance for Agriculture and Food Innovation
Maintaining soil fertility is an ongoing challenge
Business as usual won’t keep us producing food long term
Economics are against us in the short term…it is expensive to add more nutrients!
We have to get smarter… - changing our rotations to include more legumes (N) - use the lack of N fertiliser needed for legumes to free
up $ to invest in other nutrients - deep place the immobile nutrients periodically - use available water to grow things to contribute to
rebuilding soil organic matter

Queensland Alliance for Agriculture and Food Innovation
Specific issues arising from recent floods

Queensland Alliance for Agriculture and Food Innovation
Nutrient issues…
Two main processes - erosion (loss of nutrient
rich topsoil); and - loss of mobile nutrients
like N and S through leaching (both) or denitrification (N).
Floods ain’t floods! Very different implications
and management responses

Queensland Alliance for Agriculture and Food Innovation
Erosion of topsoil…
Impacts Loss of organic matter,
especially in top10cm – effects on N and S as well as soil biota
Removal of immobile nutrients (P, K, Zn etc)
Exposure of less hospitable subsoils (sodic, poor structure, hard setting…)
Response Know what the new topsoil
is like – soil test and apply ameliorants like gypsum if needed
Use amendments like manures to restore some OM and microbial activity
Get a crop in the ground asap. Green manure if possible
Recognize the new nutrient reality and fertilise accordingly

Queensland Alliance for Agriculture and Food Innovation
Example from Mundubbera
Classic case of erosive loss of (at least) approx 10cm of topsoil
Changes in pH, organic C, P, K and Zn
The ‘new’ topsoil needs some help before it will be productive again
0
0.2
0.4
0.6
0.8
1
1.2
0-10cm 10-30cm
Org
anic
C (%
)
No wash Wash
0
0.2
0.4
0.6
0.8
1
1.2
1.4
1.6
1.8
0-10cm 10-30cm
DTPA
Zn
(mg/
kg))
No wash Wash

Queensland Alliance for Agriculture and Food Innovation
0
10
20
30
40
50
60
0-10cm 10-30cm 30-60cm
Col
wel
l P (m
g/kg
)No wash Wash
0
0.1
0.2
0.3
0.4
0.5
0.6
0-10cm 10-30cm 30-60cm
Exc
h K
(cm
ol/k
g)
No wash Wash
3
4
5
6
7
8
9
10
0-10cm 10-30cm 30-60cm
pH
No wash Wash

Queensland Alliance for Agriculture and Food Innovation
Prolonged heavy rainfall, water logging…
Loss pathways will vary with nutrient and soil type
Effects can be more transient – nutrients leached to deeper layers can be retrieved by deep rooted crops.
If lost as a gas (denitrification) it is gone forever
You have to measure the losses to know what you are dealing with.
0
2
4
6
8
10
12
14
16
0-30cm 30-60cm 60-90cm
Nitr
ate
N (m
g/kg
)
Nov-10 Mar-11
Loss = 93 kg N/ha
Queensland Alliance for Agriculture and Food Innovation
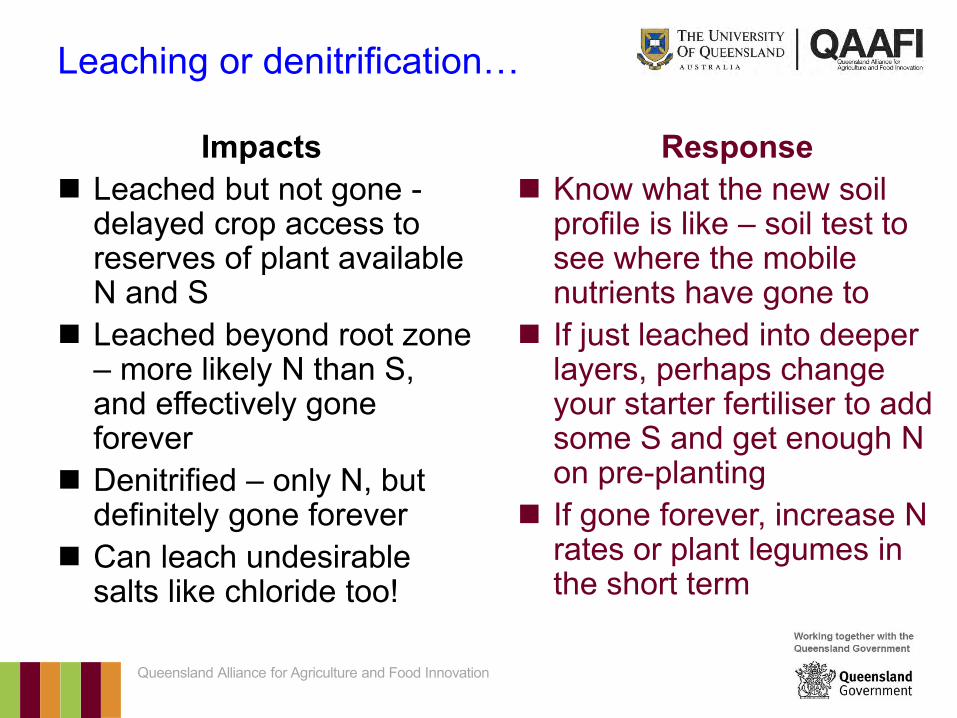
Leaching or denitrification…
Impacts Leached but not gone -
delayed crop access to reserves of plant available N and S
Leached beyond root zone – more likely N than S, and effectively gone forever
Denitrified – only N, but definitely gone forever
Can leach undesirable salts like chloride too!
Response Know what the new soil
profile is like – soil test to see where the mobile nutrients have gone to
If just leached into deeper layers, perhaps change your starter fertiliser to add some S and get enough N on pre-planting
If gone forever, increase N rates or plant legumes in the short term

Queensland Alliance for Agriculture and Food Innovation
Example from Boobyjan
Little evidence of wash/erosion
Sites with contrasting periods of inundation
Very little mineral N (all lost??), so hard to use that as an indicator of denitrification or leaching
However chloride and sulphate-S data tell a story of leaching of mobile nutrients with extended inundation
0
50
100
150
200
250
300
350
400
0-10cm 10-30cm 30-60cm 60-90cm
Chlo
ride
(mg/
kg)
Short inundation Long inundation
0
5
10
15
20
25
30
0-10cm 10-30cm 30-60cm 60-90cm
Chlo
ride
(mg/
kg)
Short inundation Long inundation
Queensland Alliance for Agriculture and Food Innovation
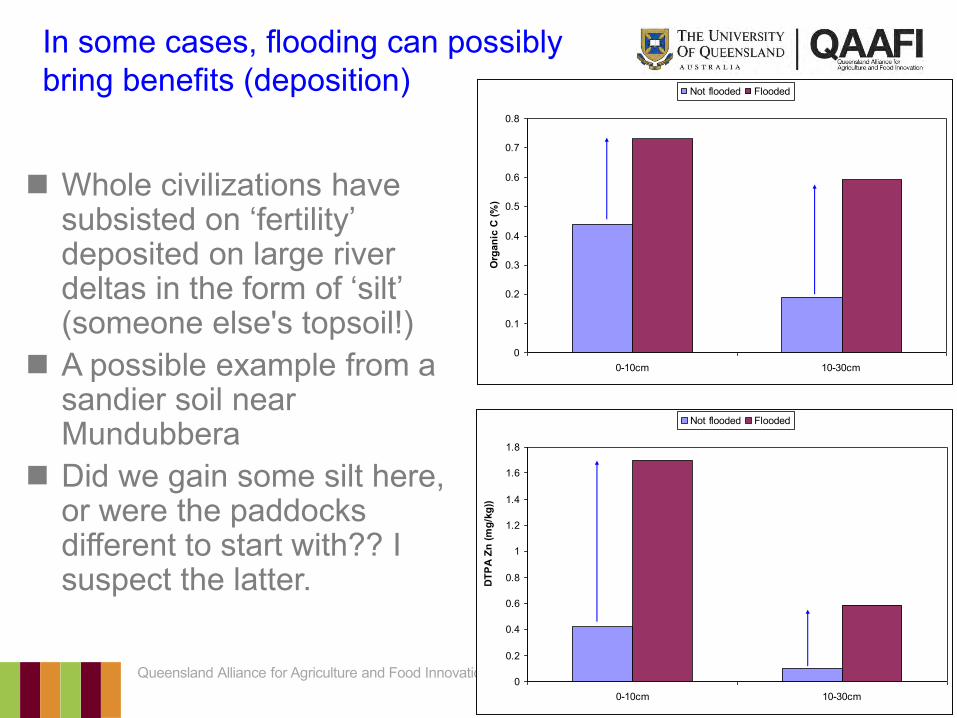
In some cases, flooding can possibly bring benefits (deposition)
Whole civilizations have subsisted on ‘fertility’ deposited on large river deltas in the form of ‘silt’ (someone else's topsoil!)
A possible example from a sandier soil near Mundubbera
Did we gain some silt here, or were the paddocks different to start with?? I suspect the latter.
0
0.1
0.2
0.3
0.4
0.5
0.6
0.7
0.8
0-10cm 10-30cm
Org
anic
C (%
)
Not flooded Flooded
0
0.2
0.4
0.6
0.8
1
1.2
1.4
1.6
1.8
0-10cm 10-30cm
DTPA
Zn
(mg/
kg))
Not flooded Flooded

Queensland Alliance for Agriculture and Food Innovation 3
4
5
6
7
8
9
0-10cm 10-30cm 30-60cm
pH
Not flooded Flooded
0
5
10
15
20
25
30
35
40
45
0-10cm 10-30cm 30-60cm
Col
wel
l P (m
g/kg
)Not flooded Flooded
0
0.1
0.2
0.3
0.4
0.5
0.6
0.7
0-10cm 10-30cm 30-60cm
Exc
h K
(cm
ol/k
g)
Not flooded Flooded

Queensland Alliance for Agriculture and Food Innovation
In summary..
Recovering post-flooding can be a long term process Soil testing is the key, to work out what has changed, and
by how much Once you have that information you can design a strategy
to return the land to productivity The cost and effectiveness of any strategy relies on
knowing what you are trying to achieve, and the key success factors

Queensland Alliance for Agriculture and Food Innovation
Questions??