Embed Size (px)
Citation preview
U.S. Department of the InteriorU.S. Geological Survey
Scientific Investigations Report 2007–5065
Prepared in cooperation with the Minnesota Pollution Control Agency
Nutrients, Suspended Sediment, and Pesticides in Water of the Red River of the North Basin, Minnesota and North Dakota, 1990–2004

Nutrients, Suspended Sediment, and Pesticides in Water of the Red River of the North Basin, Minnesota and North Dakota, 1990-2004
By V. G. Christensen
Prepared in cooperation with the Minnesota Pollution Control Agency
Scientific Investigations Report 2007–5065
U.S. Department of the InteriorU.S. Geological Survey
U.S. Department of the InteriorDIRK KEMPTHORNE, Secretary
U.S. Geological SurveyMark D. Myers, Director
U.S. Geological Survey, Reston, Virginia: 2007
For product and ordering information: World Wide Web: http://www.usgs.gov/pubprod Telephone: 1-888-ASK-USGS
For more information on the USGS--the Federal source for science about the Earth, its natural and living resources, natural hazards, and the environment: World Wide Web: http://www.usgs.gov Telephone: 1-888-ASK-USGS
Although this report is in the public domain, permission must be secured from the individual copyright owners to reproduce any copyrighted materials contained within this report.
Suggested citation:Christensen, V.G., 2007, Nutrients, suspended sediment, and pesticides in water of the Red River of the North River Basin, Minnesota and North Dakota, 1990–2004: U.S Geological Survey Scientific Investigations Report 2007–5065, 36 p.

iii
Contents
Abstract ...........................................................................................................................................................1Introduction.....................................................................................................................................................1
Purpose and Scope ..............................................................................................................................1Environmental Setting ..........................................................................................................................2Uses and Sources of Nutrients, Sediment, and Pesticides ...........................................................5
Methods.........................................................................................................................................................12Nutrients, Suspended Sediment, and Pesticides in Water of the Red River Basin ..........................16
Nutrients ...............................................................................................................................................16Surface Water ............................................................................................................................16Ground Water .............................................................................................................................22
Suspended Sediment .........................................................................................................................26Pesticides .............................................................................................................................................29
Surface Water ............................................................................................................................29Ground Water .............................................................................................................................31
Comparison to Historical Data ...................................................................................................................32Summary........................................................................................................................................................33References Cited..........................................................................................................................................34
Figures1.–3. Maps showing: 1. Location of the Red River of the North Basin in Minnesota and North Dakota. ....2 2. Land use and land cover and physiographic areas in the Red River of the North Basin. .........................................................................................................................4 3. Surface-water sampling sites in the Red River of the North Basin, 1990–2004. .........................................................................................................................174.–6. Graphs showing: 4. Distribution of mean annual streamflow for 22 U.S. Geological Survey sites with continuous streamflow record in the Red River of the North Basin, 1990–2004. .........................................................................................................................18 5. Distribution of (A) nitrite plus nitrate nitrogen, (B) total Kjeldahl nitrogen, (C) total phosphorus, and (D) dissolved phosphorus concentrations for 23 ........... selected U.S. Geological Survey stream sites in the Red River of the North Basin, 1990–2004. .................................................................................................19 6. Distribution of (A) nitrite plus nitrate nitrogen, (B) total Kjeldahl nitrogen, and (C) total phosphorus concentrations for selected U.S. Environmental Protection Agency STOrage and RETrieval stream sites in the Red River of the North Basin, 1990–2004 ...................................................................................... 21 7. Map showing numbers of wells sampled, by county, during 1990–2004 in
the Red River of the North Basin. .............................................................................................23

iv
8.–12. Graphs showing: 8. Distribution of nitrate nitrogen concentrations in water from wells in North Dakota counties in the Red River of the North Basin, 1990–2004. ............ 24 9. Distribution of nitrate nitrogen concentrations in water from wells in Minnesota counties in the Red River of the North Basin, 1990–2004. ................. 25 10. Distribution of suspended-sediment concentrations for stream sites in the Red River of the North Basin upstream from Grand Forks, North Dakota, 1990–2004. ........................................................................................................................ 27 11. Distribution of suspended-sediment concentrations for stream sites in the Red River of the North Basin at Grand Forks, North Dakota and downstream, 1990–2004. ........................................................................................................................ 28 12. Monthly distribution of pesticide concentrations for five selected U.S. Geological Survey stream sites (1990–2004): (A) de-ethylatrazine, (B) atrazine, (C) metolachlor, and (D) triallate. .......................................................... 30
Tables 1. Estimates of fertilizer application for counties in the Red River of the
North Basin, 2002 ..........................................................................................................................6 2. Pesticide applications in Minnesota and North Dakota, 1997 ..............................................8 3. Selected U. S. Geological Survey surface-water sites sampled for streamflow
or analysis of nutrients, suspended sediment, and pesticides ...........................................13 4. Selected U.S. Environmental Protection Agency STORage and RETrieval System
surface-water sites sampled for analysis of nutrients, suspended sediment, or pesticides .....................................................................................................................................15
5. Summary of the most frequently detected pesticides from 12 surface-water sites in the Red River of the North Basin, 1990–2004. ..........................................................30
6. Summary of the most frequently detected pesticides in ground water from 263 sites in the Red River of the North Basin, 1990–2004. ..........................................31

v
Conversion Factors
Inch/Pound to SI
Multiply By To obtain
Lengthinch (in.) 2.54 centimeter (cm)foot (ft) 0.3048 meter (m)mile (mi) 1.609 kilometer (km)
Areaacre 0.4047 hectare (ha)square mile (mi2) 2.590 square kilometer (km2)
Flow ratecubic foot per second (ft3/s) 0.02832 cubic meter per second (m3/s)
Masspound, avoirdupois (lb) 0.4536 kilogram (kg)
Hydraulic gradientfoot per mile (ft/mi) 0.1894 meter per kilometer (m/km)
Application ratepounds per acre per year
[(lb/acre)/yr] 1.121 kilograms per hectare per year
[(kg/ha)/yr]
Temperature in degrees Fahrenheit (°F) may be converted to degrees Celsius (°C) as follows: °C=(°F-32)/1.8
Concentrations of chemical constituents in water are given either in milligrams per liter (mg/L) or micrograms per liter (μg/L).

vi

Nutrients, Suspended Sediment, and Pesticides in Water of the Red River of the North Basin, Minnesota and North Dakota, 1990–2004
By Victoria G. Christensen
System (STORET) during 1990–2004 were detected fre-quently during 1970-90, with the exception of 2,4-D.
IntroductionThe Red River of the North (herein referred to as the
Red River) Basin covers parts of South Dakota, North Dakota, Minnesota (fig. 1), and flows north into Canada where it drains into Lake Winnipeg. The basin is rich in agriculture. Nutrients, such as nitrogen and phosphorus, are applied in the form of fertilizers to increase agricultural productivity. Pesticides also are used in abundance (Minnesota Department of Agriculture and Minnesota Agricultural Statistics Service, 2005; Zollinger and others, 2006). Nutrients, suspended sedi-ment, and pesticides often are associated with sediment runoff from farm fields.
A comprehensive report, Nutrients, Suspended Sediment, and Pesticides in Waters of the Red River of the North Basin, Minnesota, North Dakota, and South Dakota, 1970–1990 by Tornes and Brigham (1994), summarized water quality and related data collected by selected agencies in the Red River Basin from 1970–90. Because there is continued concern about agricultural chemicals in the Red River Basin and there has been considerable data collected since 1990, the U.S. Geological Survey (USGS) and the Minnesota Pollution Control Agency (MPCA) cooperated on a study to compile, review, and summarize available data collected from 1990 through 2004 by several agencies on sediment and agricultural chemicals in the Red River Basin in northwestern Minnesota and eastern North Dakota.
Purpose and Scope
The purpose of this report is to compile, review, and sum-marize available data on nutrients, suspended sediment, and pesticides in the Red River Basin in northwestern Minnesota and eastern North Dakota collected during 1990–2004. Data for this compilation includes surface- and ground-water data
AbstractNutrient, suspended sediment, and pesticide data from
1990 through 2004 in the Red River of the North Basin were compiled, summarized, and compared to historical data. Streamflow varied widely throughout the basin during the 1990–2004 study period. For 19 of 22 streamflow sites, median annual streamflow during the study period exceeded the long-term average streamflow. High streamflow can have a substantial effect on water quality. In water samples from selected surface-water sites, nitrite plus nitrate concentra-tions ranged from less than 0.005 to 7.7 milligrams per liter; total Kjeldahl nitrogen concentrations ranged from 0.1 to 7.5 milligrams per liter; total phosphorus concentrations ranged from less than 0.005 to 4.14 milligrams per liter; and dissolved phosphorus concentrations ranged from 0.003 to 4.13 milli-grams per liter. Surface-water samples from the Pembina River Basin generally had higher nitrite plus nitrate, total phos-phorus, and suspended sediment concentrations compared to samples from other Red River Basin sites. Historical data from 1970 through 1990 showed relatively high nitrite plus nitrate and suspended sediment concentrations in samples from some Pembina River sites; in contrast to the 1990–2004 period, total phosphorus concentrations from the 1970–90 period generally were highest at Red River of the North sites. Nitrate concentrations in ground-water samples for the 1990–2004 period were highest in Sheridan County, North Dakota and Marshall and Otter Tail Counties in Minnesota. Concentrations of nitrate in ground water in Marshall and Otter Tail Counties corresponded to relatively high reported fertilizer applica-tions during 2002; however, Sheridan County did not have the high fertilizer applications in 2002 compared to other North Dakota and Minnesota counties. The most frequently detected pesticides or pesticide metabolites were 2,4-D, bentazon, de-ethylatrazine, metolachlor, picloram, and triallate in surface water and alachlor ethanesulfonic acid (ESA), atrazine, de-ethylatrazine, picloram, and triazine in ground water. None of the most frequently detected pesticides or metabolites sampled and analyzed by the U.S. Geological Survey or available in the U.S. Environmental Protection Agency Storage and Retrieval
2 Nutrients, Suspended Sediment, and Pesticides in Water of the Red River of the North Basin, 1990–2004
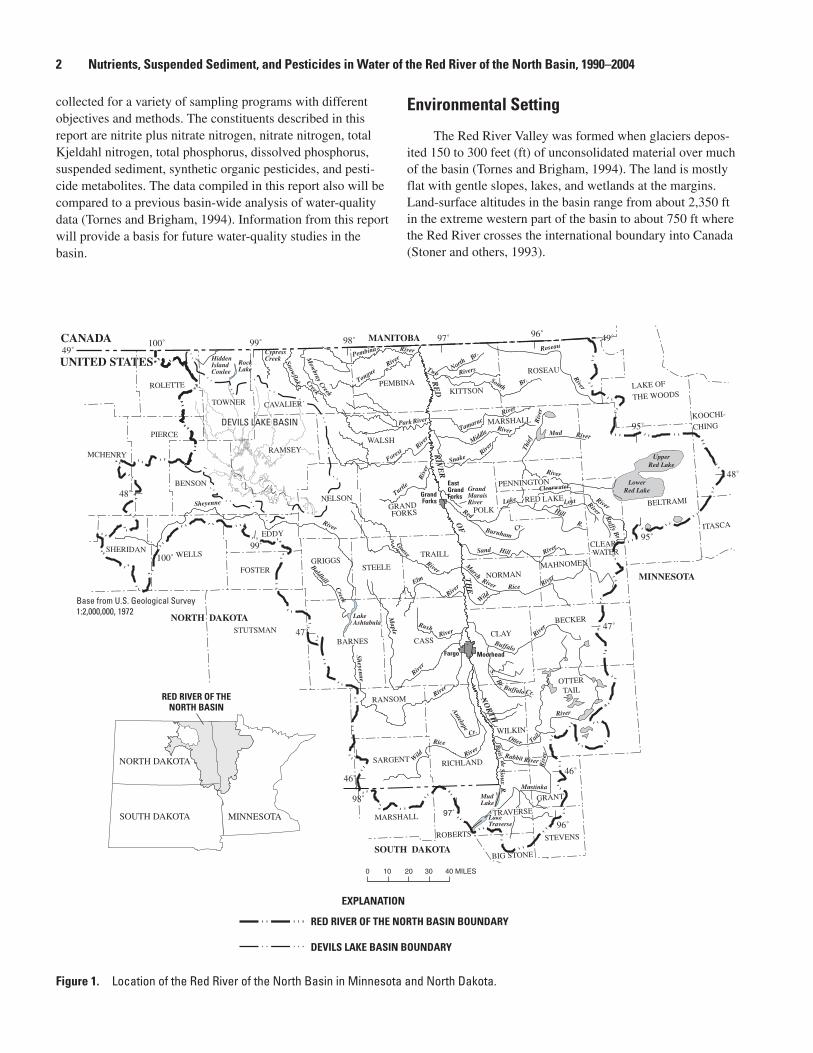
Figure 1. Location of the Red River of the North Basin in Minnesota and North Dakota.
UpperRed Lake
LowerRed Lake
RockLake
LakeAshtabula
LakeTraverse
MudLake
RE
DR
IVE
R
OF
TH
E
NO
RTH
Creek
Elm
River
Rush
River
River
River
Maple
Baldhill
River
Wild
Rice
Sheyenne
River
Goose
Antelope
Turtle
River
Sheyenne
River
RiverRiver
Pembina
Tongue
Park RiverR
iver
Forest
Creek
Mow
bray
Snowflake Creek
Sand Hill River
Marsh
River
Buffalo
River
River
Tail
River
Wild
Buffalo
S. Br.
Cr.
Rabbit River
Mustinka
Riv
er
Otter
Sioux R.
Bois
Two Rivers
Red
River
Lake
Middle
River
Snake
River
River
Tamarac
North
Br.South
River
Roseau
River
Clearwater
RiverLost
R.
Hill Ruffy B
r.
Br.
BurnhamCr.
Mud River
Riv
er
Thie
f
HiddenIslandCoulee
CypressCreek
GrandMaraisRiver
Rice
de
Cr.
MANITOBA
NORTH DAKOTA
MINNESOTA
SOUTH DAKOTA
CANADA
UNITED STATES
DEVILS LAKE BASINDEVILS LAKE BASIN
CAVALIER
KITTSONROLETTE
MARSHALL
TOWNER
RAMSEYRAMSEY
BENSON
POLK
ITASCA
NELSON
EDDY
WELLSGRIGGS
SHERIDAN
STEELE
BECKER
BARNESBARNES
RANSOM
OTTERTAIL
RICHLAND
TRAVERSETRAVERSE
STUTSMAN
MCHENRY
PIERCE
PENNINGTONPENNINGTON
RED LAKERED LAKEGRANDFORKS
TRAILL
CASS
NORMANMAHNOMEN
CLAY
SARGENT
MARSHALL
ROBERTS
BIG STONE
STEVENS
GRANT
WILKIN
CLEAR-WATER
CLEAR-WATER
BELTRAMI
LAKE OF
THE WOODS
KOOCHI-
CHING
ROSEAU
PEMBINA
WALSH
FOSTER
EastGrand ForksGrand
Forks
MoorheadFargo
98˚
98˚
47˚
46˚
47˚
48˚
48˚
97˚ 96˚100˚
95˚
96˚
46˚
49˚
99˚
49˚99˚
95˚
100˚
97˚
0 10 20 30 40 MILES
Figure 1. Location of study area in the Red River of the North Basin.
Base from U.S. Geological Survey1:2,000,000, 1972
RED RIVER OF THE NORTH BASIN BOUNDARY
DEVILS LAKE BASIN BOUNDARY
EXPLANATION
RED RIVER OF THENORTH BASIN
NORTH DAKOTA
SOUTH DAKOTA MINNESOTA
collected for a variety of sampling programs with different objectives and methods. The constituents described in this report are nitrite plus nitrate nitrogen, nitrate nitrogen, total Kjeldahl nitrogen, total phosphorus, dissolved phosphorus, suspended sediment, synthetic organic pesticides, and pesti-cide metabolites. The data compiled in this report also will be compared to a previous basin-wide analysis of water-quality data (Tornes and Brigham, 1994). Information from this report will provide a basis for future water-quality studies in the basin.
Environmental Setting
The Red River Valley was formed when glaciers depos-ited 150 to 300 feet (ft) of unconsolidated material over much of the basin (Tornes and Brigham, 1994). The land is mostly flat with gentle slopes, lakes, and wetlands at the margins. Land-surface altitudes in the basin range from about 2,350 ft in the extreme western part of the basin to about 750 ft where the Red River crosses the international boundary into Canada (Stoner and others, 1993).

Soils range from heavy, poorly drained clays and silts to light, well-drained sands (Stoner and others, 1993). Black, fine-grained soils are found throughout the basin. Because of the superior quality of soils, land use is primarily agricultural (74 percent, Stoner and others, 1993) of which 66 percent (Stoner and others, 1993) is cropland. Crops grown include barley, corn, dry beans, sugarbeets, soybeans, sunflower seeds, and wheat (U.S. Department of Agriculture, 2002). Live-stock in the basin includes cattle, hogs, pigs, and sheep (U.S. Department of Agriculture, 2002).
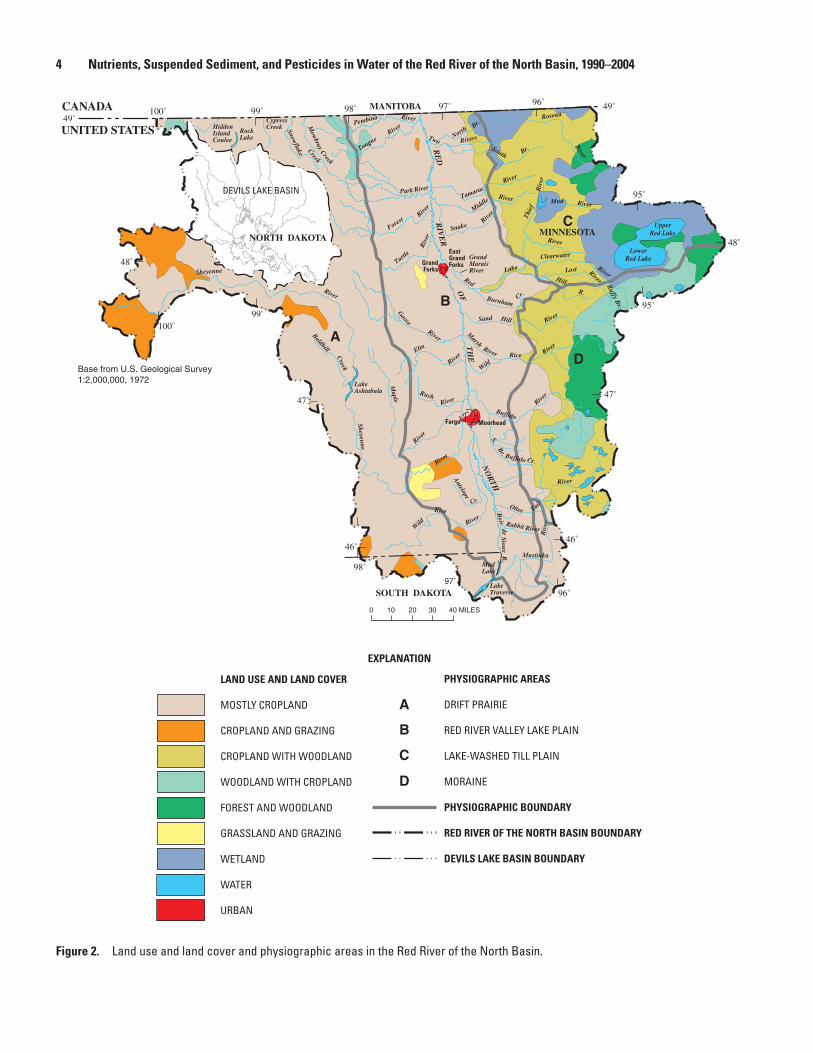
The physiographic areas in the basin were first described by Anderson (1967) and include Drift Prairie, Red River Val-ley Lake Plain, Lake-Washed Till Plain, and Moraine (fig. 2). Tornes and others (1997) described the physiographic areas for the Red River Basin as follows: the Drift Prairies are an area of low rolling hills and prairie, with many prairie-pothole wet-lands; the Red River Valley Lake Plain is an extensive area of flat land mostly comprised of clays and silts deposited by Gla-cial Lake Agassiz; the Lake-Washed Till Plain is a relatively flat upland area having extensive wetlands and peat deposits; and, the Moraine consists mostly of lakes and woodlands. The type of physiography can play heavily on the land uses that are established in an area. Land use, in turn, can be related to water quality.
From the confluence of the Bois de Sioux and Otter Tail Rivers, the Red River flows north, forming the border between North Dakota and Minnesota, into Canada, and ultimately into Lake Winnipeg in Manitoba, Canada. The study area includes 394 river miles to the United States-Canadian border (Tornes and Brigham, 1994). The slope of the main channel averages only about 0.5 feet per mile (ft/mi) (River Keepers, 2003). Seventy-five percent of the annual flow comes from the eastern tributaries (Tornes and Brigham, 1994) as a result of topography as well as regional patterns in precipitation, evaporation, and soils. Flooding in the spring can be a major problem (U.S. Geological Survey, 2001) and seasonal variabil-ity in streamflow is high (Vecchia, 2005). The drainage of the Red River Basin also includes the Devils Lake Basin, which is a closed basin except during extreme conditions. However, due to rising lake levels in Devils Lake and the construction of an emergency outlet to the Sheyenne River (Devils Lake Basin Joint Water Resources Board and North Dakota State Water Commission, 2006), it is important to consider the Devils Lake Basin as hydrologically connected to the Red River Basin and, thus, contributing to the water quality of the basin.
Sand and gravel aquifers occur in the glacial drift that underlies much of the Red River Basin. Regionally, the water moves toward the Red River. Many of the bedrock and glacial drift aquifers are hydraulically connected to streams in the region (Tornes and Brigham, 1994). Water levels in wells in glacial drift aquifers generally fluctuate less than 3 feet per year (Stoner and others, 1993, p. 601).
A recent study (River Keepers, 2003) has shown that nitrite and nitrate concentrations during 2001–2003 in water from the Red River generally were less than 1.0 milligrams per liter (mg/L). The MPCA uses the U.S. Environmental Protec-tion Agency (USEPA) limit of 10 and 1.0 mg/L for nitrate and nitrite in public water supplies, respectively, whereas the North Dakota Department of Health (NDDH) has an interim guide-line of 1.0 mg/L for nitrate. Nitrite plus nitrate concentrations increased significantly from the mid-1980s to the mid-1990s for several Red River locations (Vecchia, 2005). Increasing concentrations for main-stem Red River sites may have been caused by human activities. Phosphorus concentrations for the Red River from 2001 to 2003 were greater than the 0.1 mg/L North Dakota Department of Health standard (River Keepers, 2003). Only small amounts of pesticides have been detected in surface water—usually less than 2 percent of the amount applied (Tornes and Brigham, 1995). Surface-water quality in the Red River Basin varies seasonally (Red River Basin Board, 2001). Generally, concentrations of dissolved chemical constituents are low during spring runoff and after rain events (Tornes and Brigham, 1994). During low flow, the water qual-ity reflects the chemistry of the glacial-drift aquifer system.
Ground water in surficial aquifers commonly is a calcium-bicarbonate type (Tornes and Brigham, 1994). Water deeper in the glacial drift is primarily a magnesium-sulfate type. Water in sedimentary bedrock aquifers is a sodium-chloride type and is characterized by dissolved solids concen-trations of 1,000 mg/L or more (Tornes and Brigham, 1994). A previous study showed that ground water from the eastern part of the Red River Basin had significantly higher concentrations of nitrate and agricultural herbicides than did ground water from the western part of the basin (Cowdery, 1995). Agricul-tural land use and soil texture explain pesticide and nutrient distribution, respectively (Cowdery, 1995).
The Red River Basin has a subhumid to humid continen-tal climate. North Dakota’s climate is characterized by large temperature variations, irregular precipitation, and nearly continuous wind (Enz, 2003). The annual mean temperature in the area of Fargo, N.Dak. and Moorhead, Minn. is about 40 degrees Fahrenheit (ºF) (Owenby and others, 1992). However, the annual mean temperature can be misleading because of the large temperature variations. The January average temperature is about 0 ºF and the average temperature in July is about 65 ºF (Enz, 2003). The near continuous wind often results in large day to day temperature fluctuations in all seasons (Enz, 2003). Mean annual precipitation is about 21 inches (in.) (Owenby and others, 1992), most of which occurs during April through September. Precipitation in the basin generally increases from west to east. The greatest annual precipitation for the period of record for Fargo (34.75 in.) occurred in 2002 (Godon and Godon, 2002).
Introduction 3
4 Nutrients, Suspended Sediment, and Pesticides in Water of the Red River of the North Basin, 1990–2004
Figure 2. Land use and land cover and physiographic areas in the Red River of the North Basin.
A
B
C
D
UpperRed Lake
LowerRed Lake
RockLake
LakeAshtabula
LakeTraverse
MudLake
RE
DR
IVE
R
OF
TH
E
NO
RTH
Creek
Elm
River
Rush
River
River
River
Maple
Baldhill
River
Wild
Rice
Sheyenne
River
Goose
Antelope
Turtle
River
Sheyenne
River
RiverRiver
Pembina
Tongue
Park River
Riv
er
Forest
Creek
Mow
bray
Snowflake Creek
Sand Hill River
Marsh
River
Buffalo
River
River
Tail
River
Wild
Buffalo
S. Br.
Cr.
Rabbit River
Mustinka
Riv
er
Otter
Sioux R.
Bois
Two Rivers
Red
River
Lake
Middle
River
Snake
River
River
Tamarac
North
Br.South
River
Roseau
River
Clearwater
RiverLost
R.
Hill Ruffy B
r.
Br.
BurnhamCr.
Mud River
Riv
er
Thie
f
HiddenIslandCoulee
CypressCreek
GrandMaraisRiver
Rice
de
Cr.
MANITOBA
NORTH DAKOTAMINNESOTA
SOUTH DAKOTA
CANADA
UNITED STATES
DEVILS LAKE BASIN
EastGrand ForksGrand
Forks
MoorheadFargo
98˚
98˚
47˚
46˚
47˚
48˚
48˚
97˚ 96˚100˚
95˚
96˚
46˚
49˚
99˚
49˚99˚
95˚
100˚
97˚
0 10 20 30 40 MILES
Figure 2. Land use and land cover and physiographic areas in the Red River of the North Basin.(Modified from Tornes and others, 1997)
Base from U.S. Geological Survey1:2,000,000, 1972
LAND USE AND LAND COVER
MOSTLY CROPLAND
CROPLAND AND GRAZING
CROPLAND WITH WOODLAND
WOODLAND WITH CROPLAND
FOREST AND WOODLAND
GRASSLAND AND GRAZING
WETLAND
WATER
URBAN
PHYSIOGRAPHIC AREAS
DRIFT PRAIRIE
RED RIVER VALLEY LAKE PLAIN
LAKE-WASHED TILL PLAIN
MORAINE
PHYSIOGRAPHIC BOUNDARY
RED RIVER OF THE NORTH BASIN BOUNDARY
DEVILS LAKE BASIN BOUNDARY
A
B
C
D
EXPLANATION
Uses and Sources of Nutrients, Sediment, and Pesticides
Nutrients, such as nitrogen and phosphorus, are essential for the growth and reproduction of plants. Excess nutrients in water, however, can fertilize naturally occurring aquatic plants and cause excessive algal growth. This may produce taste and odor problems in drinking water, reduce the aesthetic and recreational value of the water, and stress aquatic organisms by the depletion of dissolved oxygen when algal blooms die (Christensen and Pope, 1997). Sources of nutrients in the Red River Basin include fertilizers, sewage treatment plants, septic systems, combined sewer overflows, sediment mobilization, runoff from animal feeding operations, atmospheric transport, and nutrient recycling from sediments to the water column (Red River Basin Board, 2001).
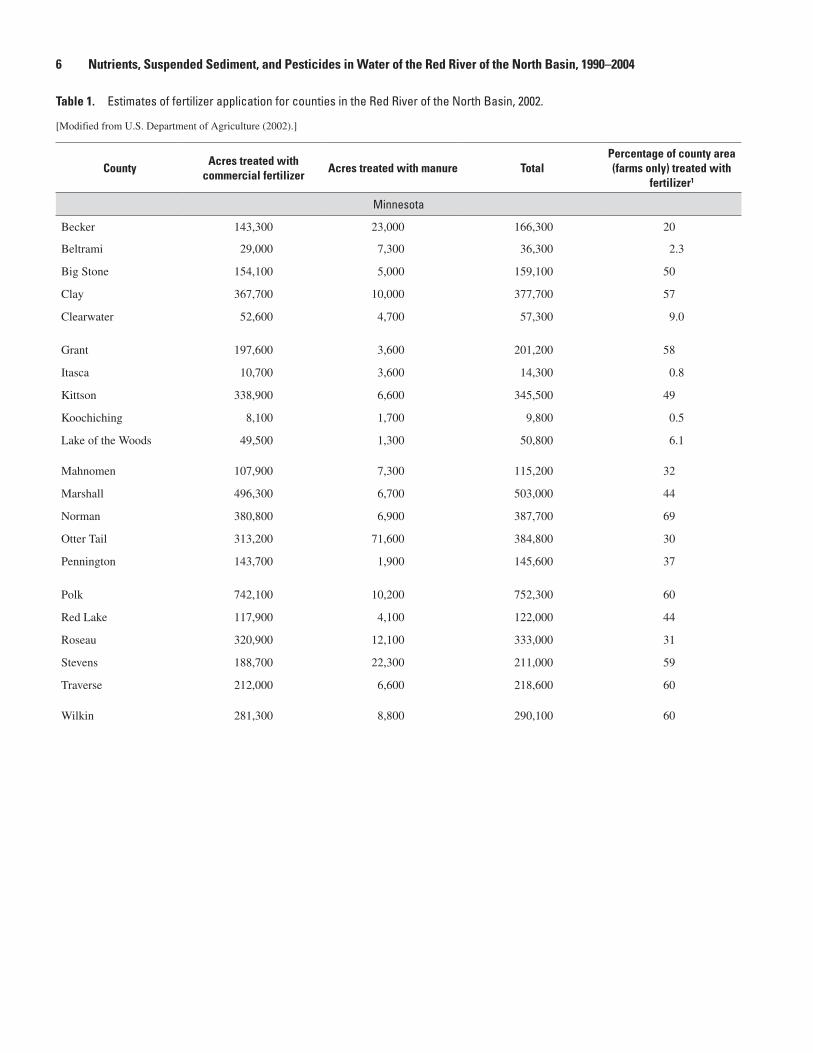
Application of nutrients to crops as manure and com-mercial fertilizer can result in increased nutrients in surface and ground water. Estimates of fertilizer applications are provided for the counties in the Red River Basin (table 1). The total nutrient input from fertilizer applications is calculated by adding input from commercial fertilizers to inputs from manure. Commercial fertilizer and total application is great-est in Polk County, Minn. and Cass County, N. Dak. Both of these counties border the main stem of the Red River (fig. 1). Previous research (Tornes and Brigham, 1994) also identified counties adjacent to the Red River as having the greatest fertil-izer applications. Manure application is greatest in Otter Tail County, Minn.
Land use influences the movement of nutrients from land to surface water (Bourne and others, 2002). In the Red River Valley an estimated 1.56 pounds per acre per year [(lb/acre)/yr] of total nitrogen and 0.20 (lb/acre)/yr of total phosphorus are exported from pasture and 2.81 (lb/acre)/yr nitrogen and 0.58 (lb/acre)/yr total phosphorus are exported from cropland (Bourne and others, 2002). Commercial fertilizers and manure contain varying ratios of nitrogen to phosphorus (Tornes and Brigham, 1994). In several large rivers, nitrogen to phospho-rus (N:P) ratios were significantly related to the N:P ratios in fertilizer applied to the basins (Caraco, 1995, p. 242). Due to the concern about phosphorus loading to the lakes in Minne-sota, a phosphorus ban on lawn fertilizers was passed in 2005 (Minnesota, State of, 2005).
Land use and agricultural practices also can affect the amount of suspended sediment in surface water. Sediment is an important indicator of water quality because of solute-sediment interactions (between sediment and some organic compounds, for example). Excess sedimentation occurs in areas of larger municipal and industrial centers and in regions
affected by agricultural and urban runoff (Red River Basin Board, 2001). Sediment erosion can be increased by cultiva-tion practices and by livestock that trample stream banks (Stoner and others, 1993).
Pesticides applied to crops mainly include herbicides, fungicides, and insecticides. Other pesticides include fumi-gants, growth regulators, and defoliants. A 1997 survey (Gianessi and Marcelli, 2000) indicates that the pesticides used in the greatest abundance in Minnesota and North Dakota are 2,4-D, MCPA, and dicamba (acres treated, table 2). These three pesticides also were some of the most frequently applied pesticides in 1989 (Tornes and Brigham, 1994). Changes in pesticide use may be the result of a number of causes, includ-ing pest outbreaks, changes in pest populations, tillage prac-tices, changes between nonchemical and chemical methods, changes in the acreage of major crops, or new developments in pest control technology (Zollinger and others, 2006).
Pesticide applications reported in table 2 are for the entire States of Minnesota and North Dakota and are not limited to the Red River Basin. Application rates specifically for the Red River Basin were not available. However, it is likely that the amounts and types of pesticides applied are different than the statewide applications due to the different crops grown in the region. For example, atrazine was one of the most widely applied pesticides (in acres treated) for the State of Minnesota. However, atrazine is applied mainly to corn crops and much of the corn is grown in the southern half of the State, south of the Red River Basin. It is important to consider this when compar-ing the pesticide applications in table 2 to pesticides detected in surface and ground water in the Red River Basin.
Erosion is a concern in many agricultural regions and it can be influenced by many factors. Tornes and Brigham (1994) noted that the Red River Valley was affected by many agricultural factors, including the frequency and timing of tillage, tillage of steep lands and gullies, direction of plow-ing with respect to the land slope, and overgrazing, which can damage plant cover. Many best management practices have been put into place to minimize erosion. These include reduced-tillage farming methods, contour farming, buffer strips along streams, cover crops, and conservation reserve programs.
Agricultural land is not the only source of pesticides that are transported to the waters of the basin. Many pesticides are applied to residential lawns, parks, and golf courses. Further-more, land that is removed from agricultural production and planted in native grasses often is treated with pesticides to control the spread of weeds to nearby crops. These applica-tions often are not well documented.
Introduction 5
6 Nutrients, Suspended Sediment, and Pesticides in Water of the Red River of the North Basin, 1990–2004
Table 1. Estimates of fertilizer application for counties in the Red River of the North Basin, 2002.—Continued
[Modified from U.S. Department of Agriculture (2002).]
CountyAcres treated with
commercial fertilizerAcres treated with manure Total
Percentage of county area (farms only) treated with
fertilizer1
Minnesota
Becker 143,300 23,000 166,300 20
Beltrami 29,000 7,300 36,300 2.3
Big Stone 154,100 5,000 159,100 50
Clay 367,700 10,000 377,700 57
Clearwater 52,600 4,700 57,300 9.0
Grant 197,600 3,600 201,200 58
Itasca 10,700 3,600 14,300 0.8
Kittson 338,900 6,600 345,500 49
Koochiching 8,100 1,700 9,800 0.5
Lake of the Woods 49,500 1,300 50,800 6.1
Mahnomen 107,900 7,300 115,200 32
Marshall 496,300 6,700 503,000 44
Norman 380,800 6,900 387,700 69
Otter Tail 313,200 71,600 384,800 30
Pennington 143,700 1,900 145,600 37
Polk 742,100 10,200 752,300 60
Red Lake 117,900 4,100 122,000 44
Roseau 320,900 12,100 333,000 31
Stevens 188,700 22,300 211,000 59
Traverse 212,000 6,600 218,600 60
Wilkin 281,300 8,800 290,100 60

Table 1. Estimates of fertilizer application for counties in the Red River of the North Basin, 2002.—Continued
[Modified from U.S. Department of Agriculture (2002).]
CountyAcres treated with
commercial fertilizerAcres treated with manure Total
Percentage of county area (farms only) treated with
fertilizer1
North Dakota
Barnes 540,100 4,400 544,500 57
Benson 387,900 4,900 392,800 44
Cass 748,500 4,300 752,800 67
Cavalier 649,900 600 650,400 68
Eddy 117,500 3,500 120,900 30
Foster 219,600 1,900 221,400 55
Grand Forks 548,600 2,100 550,700 60
Griggs 186,800 900 187,700 41
Nelson 286,800 1,900 288,700 46
Pembina 480,500 1,500 482,000 67
Pierce 239,100 5,000 244,100 38
Ransom 212,300 7,100 219,400 40
Richland 589,100 7,400 596,600 65
Rolette 189,900 2,900 192,900 33
Sargent 254,500 4,100 258,600 47
Sheridan 211,700 2,800 214,500 35
Steele 288,800 800 289,600 64
Towner 312,000 2,500 314,500 48
Traill 420,800 1,600 422,400 77
1 Fertilizer application to land other than farms (for example golf courses and residences) was not included.
Introduction 7

8 Nutrients, Suspended Sediment, and Pesticides in Water of the Red River of the North Basin, 1990–2004
Table 2. Pesticide applications in Minnesota and North Dakota, 1997.—Continued
[Data from the National Center for Food and Agricultural Policy described in Gianessi and Marcelli (2004) and available at http://www.ncfap.org; all values in thousands; pesticides are in order of decreasing total (Minnesota plus North Dakota) acres treated; MCPA, methyl chlorophenoxy acetic acid; —, no data; EPTC, dipropyl thiocarbamic acid s-ethyl ester; <, less than]
Minnesota North Dakota
Pesticide CropsAcres
treatedPounds applied
Acres treated
Pounds applied
Herbicides
2,4-D Barley, corn, fallow land, flax, millet, oats, hay, pasture, rye, soybeans, wheat
2,463 711 7727 2,188
MCPA Barley, flax, oats, rye, wheat 2,078 845 6,759 2,304
Dicamba Barley, corn, fallow land, flax, millet, oats, wheat 3,093 1,137 5,209 525
Trifluralin Alfalfa, barley, canola, dry beans, fallow land, flax, pota-toes, soybeans, sugarbeets, sunflowers, wheat
2,509 2,073 3,586 1,928
Fenoxaprop Barley, soybeans, wheat 1,744 134 4,121 251
Imazethapyr Corn, dry beans, soybeans 4,583 184 533 26
Tribenuron Barley, oats, wheat 598 2 4,138 25
Clopyralid Barley, canola, corn, sugarbeets, wheat 1,379 176 2,470 267
Atrazine Corn 3,199 1,982 186 186
Glyphosate Alfalfa, barley, corn, fallow land, flax, oats, potatoes, rye, soybeans, sugarbeets, sunflowers, wheat
460 388 2,762 1,241
Bromoxynil Barley, corn, flax, oats, rye, wheat 1,498 374 1,496 374
Thifensulfuron Barley, corn, oats, soybeans, wheat 1,553 9 1,286 11
Nicosulfuron Corn, sweet corn 2,145 43 334 8
Acetochlor Corn 1,866 2,968 149 204
Metolachlor Corn, potatoes, soybeans 1,730 3,550 30 69
Bentazon Corn, dry beans, soybeans 887 654 675 506
Quizalofop Canola, dry beans, soybean, sugarbeets 1,150 62 410 26
Sethoxydim Alfalfa, canola, dry beans, flax, green beans, green peas, onion, potatoes, strawberries, soybeans, sunflowers
863 122 514 107
Pendimethalin Corn, potatoes, soybeans, sunflowers 1,203 1,368 147 186
Ethalfluralin Canola, dry beans, soybeans, sunflowers 69 58 1,248 972
Clethodim Soybeans, sugarbeets 765 61 341 25
Flumetsulam Corn, soybeans 847 30 79 4
Primisulfuron Corn 867 17 — —
Desmedipham Sugarbeets 456 73 235 38
Phenmedipham Soybeans 456 68 235 35
Triflusulfuron Sugarbeets 456 9 235 5
Acifluorfen Soybeans 494 123 128 38
Imazamethabenz Barley, sunflowers, wheat 141 40 461 155
Lactofen Soybeans 370 37 128 9
Fomesafen Soybeans 432 82 53 10

Table 2. Pesticide applications in Minnesota and North Dakota, 1997.—Continued
[Data from the National Center for Food and Agricultural Policy described in Gianessi and Marcelli (2004) and available at http://www.ncfap.org; all values in thousands; pesticides are in order of decreasing total (Minnesota plus North Dakota) acres treated; MCPA, methyl chlorophenoxy acetic acid; —, no data; EPTC, dipropyl thiocarbamic acid s-ethyl ester; <, less than]
Minnesota North Dakota
Pesticide CropsAcres
treatedPounds applied
Acres treated
Pounds applied
Herbicides—Continued
EPTC Alfalfa, corn, potatoes, sugarbeets, sunflowers 294 1090 178 642
Alachlor Corn, soybeans 422 1179 39 92
Cyanazine Corn 414 475 37 44
Dimenthenamid Corn, soybeans 365 316 75 102
Diclofop Barley, wheat 91 65 326 230
Fluazifop Soybeans 373 34 32 6
Prosulfuron Corn 400 8 — —
Triallate Barley, flax, wheat 113 113 283 283
Metsulfuron Barley, wheat 1 <1 370 1
Picloram Barley, flax, oats, hay, pasture 72 9 264 51
Chlorsulfuron Barley, oats, wheat — — 282 3
Paraquat Corn, dry beans, potatoes, soybeans, sugarbeets 128 52 133 29
Chlorimuron Soybeans 247 2 — —
Triasulfuron Fallow land, wheat — — 238 2
Metribuzin Potatoes, soybeans 157 29 79 27
Difenzoquat Barley, wheat 89 59 131 99
Ethofumesate Sugarbeets 137 34 75 19
Rimsulfuron Corn 133 1 53 1
Cycloate Sugarbeets 105 315 54 135
Clomazone Green peas, pumpkin, soybeans 139 102 — —
Halosulfuron Corn 133 4 — —
Diquat Potatoes 59 18 37 17
Flumiclorac Soybeans 62 2 — —
2,4-DB Alfalfa 22 16 13 14
Linuron Potatoes 7 9 18 18
Endothall Potatoes, sugarbeets 16 10 6 3
Hexazinone Alfalfa 13 10 — —
MCPB Green peas 10 8 — —
Propachlor Corn, sweet corn 6 12 — —
MCPP Sod 4 1 — —
Simazine Apples 1 2 — —
DCPA Onions <1 <1 — —
Diuron Apples <1 1 — —
Introduction 9

10 Nutrients, Suspended Sediment, and Pesticides in Water of the Red River of the North Basin, 1990–2004
Table 2. Pesticide applications in Minnesota and North Dakota, 1997.—Continued
[Data from the National Center for Food and Agricultural Policy described in Gianessi and Marcelli (2004) and available at http://www.ncfap.org; all values in thousands; pesticides are in order of decreasing total (Minnesota plus North Dakota) acres treated; MCPA, methyl chlorophenoxy acetic acid; —, no data; EPTC, dipropyl thiocarbamic acid s-ethyl ester; <, less than]
Minnesota North Dakota
Pesticide CropsAcres
treatedPounds applied
Acres treated
Pounds applied
Herbicides—Continued
Napropamide Strawberries <1 1 — —
Oxyfluorfen Onions <1 <1 — —
Terbacil Strawberries <1 <1 — —
Fungicides
Tebuconazole Wheat 502 60 783 86
Mancozeb Barley, potatoes, sugarbeets, wheat 331 990 316 636
Propiconazole Barley, dry beans, sweet corn, wheat, wild rice 338 46 280 34
Triphenyltinhyd Potatoes, sugarbeets 334 243 164 117
Thiophanate methyl Dry beans, sugarbeets 118 70 139 9
Benomyl Dry beans, sugarbeets, wheat 62 43 174 74
Chlorothalonil Dry beans, potatoes 69 288 113 767
Maneb Dry beans, potatoes, sugarbeets 73 156 54 91
Metalaxyl Potatoes 7 2 45 9
Copper Potatoes 21 32 7 7
Cymoxanil Potatoes 13 3 14 2
Propamocarb Potatoes 14 12 10 9
Metiram Potatoes 8 31 10 47
Captan Apples, pumpkin, strawberries 4 38 — —
Dimethomorph Potatoes 4 1 — —
Myclobutanil Apples 3 1 — —
Iprodione Onions 1 1 — —
Vinclozolin Green beans, onions, strawberries 1 1 — —
Fenarimol Apples <1 <1 — —
Streptomycin Apples <1 <1 — —
Insecticides
Chlorpyrifos Barley, sugarbeets, wheat 400 424 473 250
Esfenvalerate Dry beans, potatoes, soybeans, sunflowers 53 2 572 23
Terbufos Corn, soybeans, sweet corn 451 457 162 187
Permethrin Alfalfa, apples, corn, onions, potatoes, pumpkins, sweet corn
122 42 299 63
Lambdacyhalothrin Canola, corn, sunflowers 45 2 236 7
Tefluthrin Corn, sweet corn 272 22 7 1
Phorate Corn, potatoes 141 143 60 103
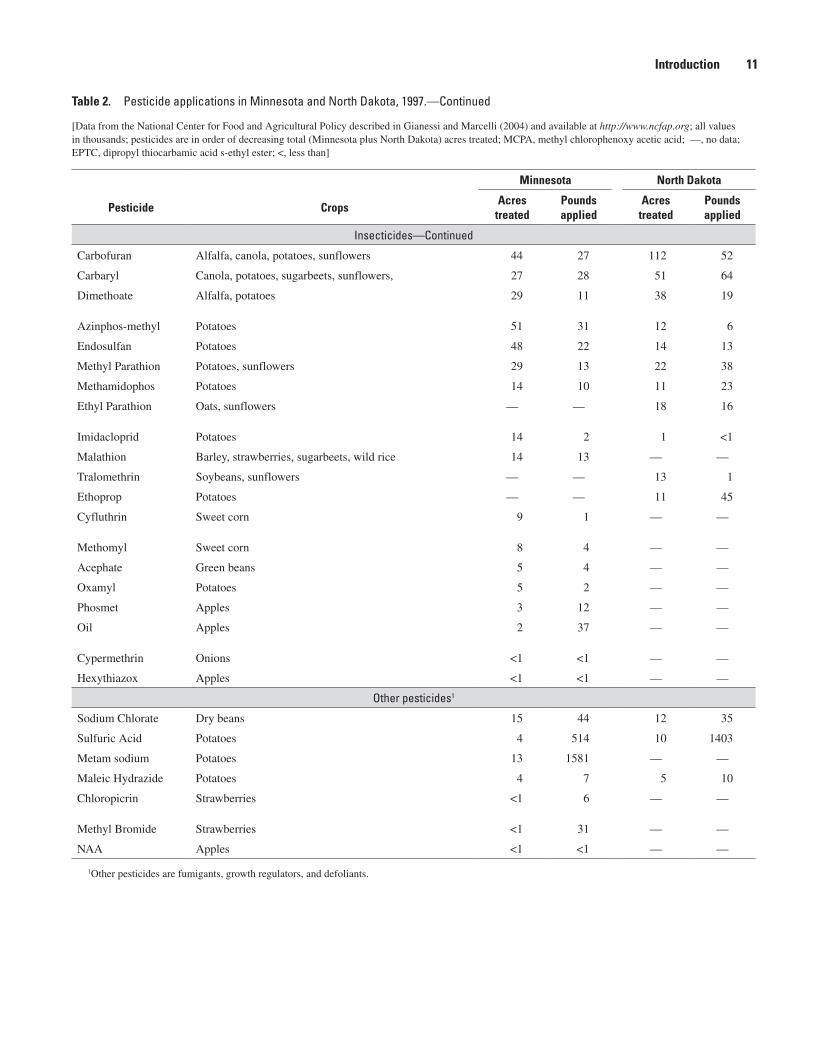
Table 2. Pesticide applications in Minnesota and North Dakota, 1997.—Continued
[Data from the National Center for Food and Agricultural Policy described in Gianessi and Marcelli (2004) and available at http://www.ncfap.org; all values in thousands; pesticides are in order of decreasing total (Minnesota plus North Dakota) acres treated; MCPA, methyl chlorophenoxy acetic acid; —, no data; EPTC, dipropyl thiocarbamic acid s-ethyl ester; <, less than]
Minnesota North Dakota
Pesticide CropsAcres
treatedPounds applied
Acres treated
Pounds applied
Insecticides—Continued
Carbofuran Alfalfa, canola, potatoes, sunflowers 44 27 112 52
Carbaryl Canola, potatoes, sugarbeets, sunflowers, 27 28 51 64
Dimethoate Alfalfa, potatoes 29 11 38 19
Azinphos-methyl Potatoes 51 31 12 6
Endosulfan Potatoes 48 22 14 13
Methyl Parathion Potatoes, sunflowers 29 13 22 38
Methamidophos Potatoes 14 10 11 23
Ethyl Parathion Oats, sunflowers — — 18 16
Imidacloprid Potatoes 14 2 1 <1
Malathion Barley, strawberries, sugarbeets, wild rice 14 13 — —
Tralomethrin Soybeans, sunflowers — — 13 1
Ethoprop Potatoes — — 11 45
Cyfluthrin Sweet corn 9 1 — —
Methomyl Sweet corn 8 4 — —
Acephate Green beans 5 4 — —
Oxamyl Potatoes 5 2 — —
Phosmet Apples 3 12 — —
Oil Apples 2 37 — —
Cypermethrin Onions <1 <1 — —
Hexythiazox Apples <1 <1 — —
Other pesticides1
Sodium Chlorate Dry beans 15 44 12 35
Sulfuric Acid Potatoes 4 514 10 1403
Metam sodium Potatoes 13 1581 — —
Maleic Hydrazide Potatoes 4 7 5 10
Chloropicrin Strawberries <1 6 — —
Methyl Bromide Strawberries <1 31 — —
NAA Apples <1 <1 — —
1Other pesticides are fumigants, growth regulators, and defoliants.
Introduction 11

12 Nutrients, Suspended Sediment, and Pesticides in Water of the Red River of the North Basin, 1990–2004
MethodsData for this report came from several different sources,
primarily the USEPA’s STORET (STOrage and RETrieval) data base (http://www.epa.gov/storet/dbtop.html) and the U.S. Geological Survey NWIS (National Water Information System) data base (http://waterdata.usgs.gov/nwis). Data in STORET are provided by many agencies and processed by the MPCA and NDDH. Additional ground-water data were obtained from Minnesota Department of Natural Resources (MDNR), the North Dakota State Water Commission (ND SWC), and the Minnesota Department of Agriculture (MDA).
The concentrations of constituents provided in this report are dependent on sampling and analytical methods. Sampling and analytical methods can vary among agencies and over time. These differences can confound direct comparison of water-quality data as methods change and improve. In addi-tion, improvements in analytical methods can result in lower detection limits, and therefore lower reporting levels (Tornes and Brigham, 1994). Improved methods can yield data that, when combined with earlier data, show false downward temporal trends in chemical concentrations (Flegal and Coale, 1989).
In addition, different agencies may use different reporting levels in electronic data bases. For USGS data, reporting levels provided in the NWIS data base are the smallest concentration of a constituent that may be reported by using a given analyti-cal method (Timme, 1995). The STORET data base reports detection limits. The USEPA defines a detection limit as the minimum concentration of a substance that can be measured and reported with 99-percent confidence that the analyte con-centration is greater than zero (U.S. Environmental Protection Agency, 1997).
With the exception of the USGS data, no attempt was made to research the quality-assurance procedures used by the agencies that collected and analyzed the data presented in this report. For USGS data, in addition to the quality-con-trol samples submitted from the field (Wershaw and others, 1987; Edwards and Glysson, 1988; Ward and Harr, 1990; and Horowitz and others, 1994), internal quality-assurance practices at the USGS National Water-Quality Laboratory (NWQL) included analysis of calibration standards, standard-reference samples, replicate samples, blanks, and spikes (Pritt and Raese, 1995).
In general, reporting levels, detection limits, and con-centration values are reported uncensored as they are found in their respective data bases. The one exception is nitrate values. Nitrate was reported differently by different agencies. The values of nitrate reported for USGS and ND SWC well sites were nitrite plus nitrate. Both agencies have determined that the nitrite concentrations in ground water were negligible, and, therefore, concentrations of nitrite plus nitrate in ground
water are reported here as nitrate. In addition, the ND SWC reports values of nitrate as nitrate (Bill Shuh, North Dakota State Water Commission, oral commun., October 15, 2006). Therefore, a conversion factor of 0.2258 was used to convert the nitrate as nitrate concentrations to nitrate as nitrogen for this report. The ND SWC laboratory changed nitrate methods in the early 1990s. No adjustment was made to the data to account for this method change.
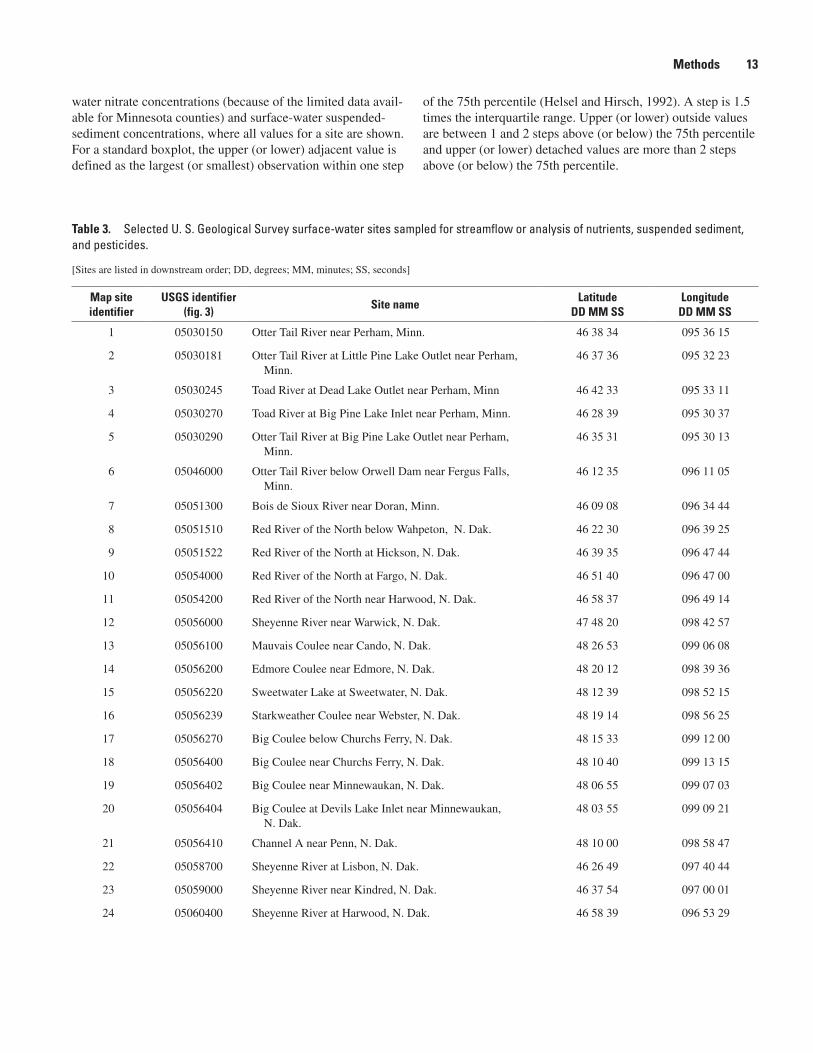
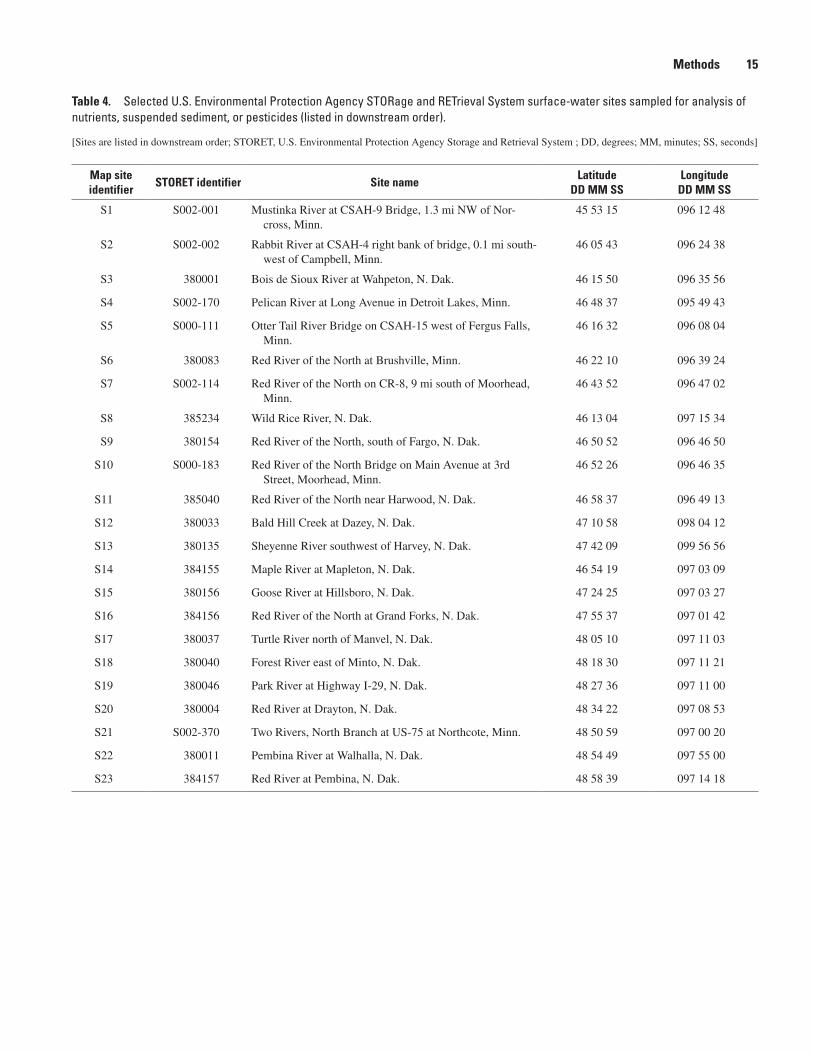
To optimize comparability between sites and facilitate comparison to the earlier report (Tornes and Brigham, 1994), certain criteria were used to determine which surface-water sites were to be included in this analysis. These selection crite-ria were: (1) the site must have had at least 2 years of data col-lected over two sampling seasons, generally from about March through October, within the 1990–2004 time period, and (2) at least 8 samples from the site were analyzed for the constituent evaluated. The surface-water sites included in this report are listed in table 3 (USGS sites) and table 4 (STORET sites).
Many ground-water sites did not meet the same selection criteria as the surface-water sites of a minimum of 8 samples over 2 years. The study area has more ground-water wells than surface-water sampling sites. A large number of wells were sampled only a few times during 1990 through 2004; there-fore, in order to evaluate nutrient concentrations, ground-water sites were grouped by county.
Several agencies throughout the Red River Basin have collected and analyzed ground-water samples. In North Dakota, most of the samples have been collected and analyzed by the ND SWC. Through cooperative studies, the USGS also has collected and analyzed some samples on the North Dakota side of the basin. Most of the ground-water samples from the Minnesota side of the basin were collected and analyzed by the USGS and the results are available from the NWIS data base. Some samples from Minnesota were collected and analyzed by the MDA, MDNR, or the MPCA’s Ground Water Monitoring Assessment Program (GWMAP). Generally, very little Red River Basin ground-water nutrient and pesticide data were available from STORET.
The spatial distribution of ground-water wells sampled for nutrients was variable and no or very few wells were sampled in several counties (fig. 7). Samples were collected from more than 300 wells during 1990–2004 in Grand Forks, McHenry, Ransom, and Sargent Counties, N. Dak. In general, more wells in the basin were sampled in North Dakota than in Minnesota, and many of the wells in North Dakota had numer-ous nutrient samples because they were part of a long-term sampling program.
Data in this report generally are summarized as box plots truncated at the 10th and 90th percentiles (Helsel and Hirsch, 1992). Box plots are a good visual representation of range, central tendency, and skewness. By truncating the box plots, extreme values are not displayed. The exceptions are ground-
water nitrate concentrations (because of the limited data avail-able for Minnesota counties) and surface-water suspended-sediment concentrations, where all values for a site are shown. For a standard boxplot, the upper (or lower) adjacent value is defined as the largest (or smallest) observation within one step
of the 75th percentile (Helsel and Hirsch, 1992). A step is 1.5 times the interquartile range. Upper (or lower) outside values are between 1 and 2 steps above (or below) the 75th percentile and upper (or lower) detached values are more than 2 steps above (or below) the 75th percentile.
Table 3. Selected U. S. Geological Survey surface-water sites sampled for streamflow or analysis of nutrients, suspended sediment, and pesticides. —Continued
[Sites are listed in downstream order; DD, degrees; MM, minutes; SS, seconds]
Map site identifier
USGS identifier (fig. 3)
Site nameLatitude
DD MM SSLongitudeDD MM SS
1 05030150 Otter Tail River near Perham, Minn. 46 38 34 095 36 15
2 05030181 Otter Tail River at Little Pine Lake Outlet near Perham, Minn.
46 37 36 095 32 23
3 05030245 Toad River at Dead Lake Outlet near Perham, Minn 46 42 33 095 33 11
4 05030270 Toad River at Big Pine Lake Inlet near Perham, Minn. 46 28 39 095 30 37
5 05030290 Otter Tail River at Big Pine Lake Outlet near Perham, Minn.
46 35 31 095 30 13
6 05046000 Otter Tail River below Orwell Dam near Fergus Falls, Minn.
46 12 35 096 11 05
7 05051300 Bois de Sioux River near Doran, Minn. 46 09 08 096 34 44
8 05051510 Red River of the North below Wahpeton, N. Dak. 46 22 30 096 39 25
9 05051522 Red River of the North at Hickson, N. Dak. 46 39 35 096 47 44
10 05054000 Red River of the North at Fargo, N. Dak. 46 51 40 096 47 00
11 05054200 Red River of the North near Harwood, N. Dak. 46 58 37 096 49 14
12 05056000 Sheyenne River near Warwick, N. Dak. 47 48 20 098 42 57
13 05056100 Mauvais Coulee near Cando, N. Dak. 48 26 53 099 06 08
14 05056200 Edmore Coulee near Edmore, N. Dak. 48 20 12 098 39 36
15 05056220 Sweetwater Lake at Sweetwater, N. Dak. 48 12 39 098 52 15
16 05056239 Starkweather Coulee near Webster, N. Dak. 48 19 14 098 56 25
17 05056270 Big Coulee below Churchs Ferry, N. Dak. 48 15 33 099 12 00
18 05056400 Big Coulee near Churchs Ferry, N. Dak. 48 10 40 099 13 15
19 05056402 Big Coulee near Minnewaukan, N. Dak. 48 06 55 099 07 03
20 05056404 Big Coulee at Devils Lake Inlet near Minnewaukan, N. Dak.
48 03 55 099 09 21
21 05056410 Channel A near Penn, N. Dak. 48 10 00 098 58 47
22 05058700 Sheyenne River at Lisbon, N. Dak. 46 26 49 097 40 44
23 05059000 Sheyenne River near Kindred, N. Dak. 46 37 54 097 00 01
24 05060400 Sheyenne River at Harwood, N. Dak. 46 58 39 096 53 29
Methods 13
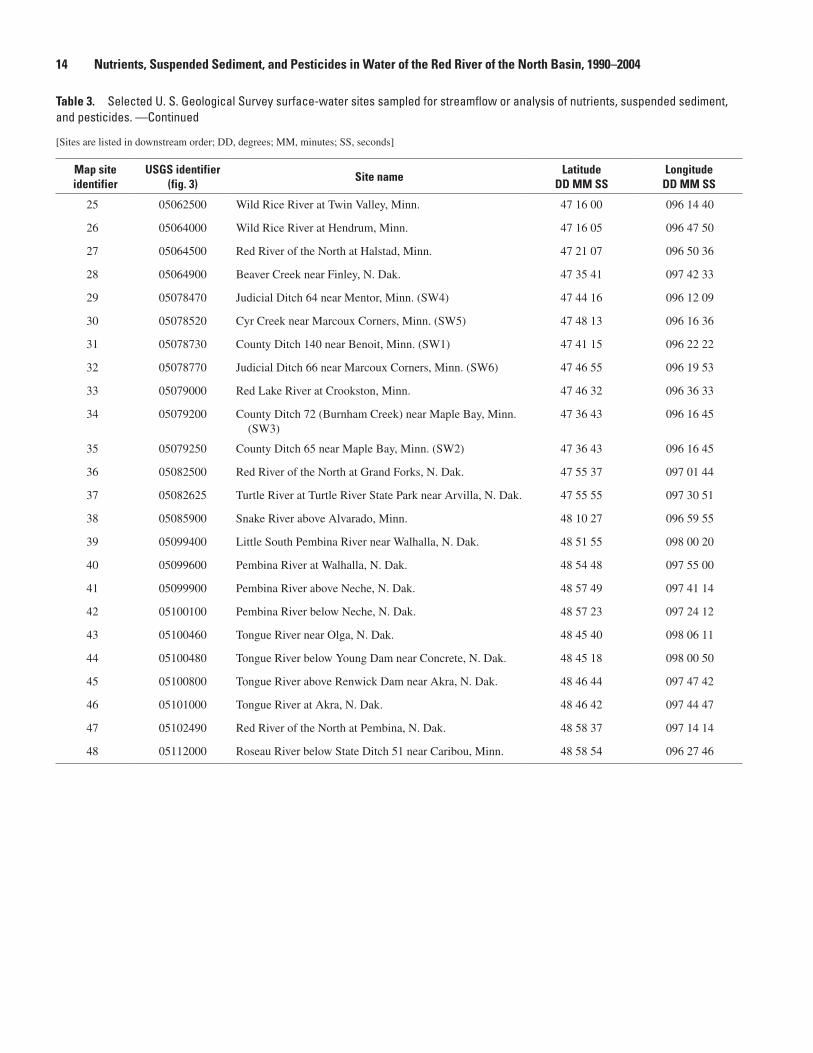
14 Nutrients, Suspended Sediment, and Pesticides in Water of the Red River of the North Basin, 1990–2004
Table 3. Selected U. S. Geological Survey surface-water sites sampled for streamflow or analysis of nutrients, suspended sediment, and pesticides. —Continued
[Sites are listed in downstream order; DD, degrees; MM, minutes; SS, seconds]
Map site identifier
USGS identifier (fig. 3)
Site nameLatitude
DD MM SSLongitudeDD MM SS
25 05062500 Wild Rice River at Twin Valley, Minn. 47 16 00 096 14 40
26 05064000 Wild Rice River at Hendrum, Minn. 47 16 05 096 47 50
27 05064500 Red River of the North at Halstad, Minn. 47 21 07 096 50 36
28 05064900 Beaver Creek near Finley, N. Dak. 47 35 41 097 42 33
29 05078470 Judicial Ditch 64 near Mentor, Minn. (SW4) 47 44 16 096 12 09
30 05078520 Cyr Creek near Marcoux Corners, Minn. (SW5) 47 48 13 096 16 36
31 05078730 County Ditch 140 near Benoit, Minn. (SW1) 47 41 15 096 22 22
32 05078770 Judicial Ditch 66 near Marcoux Corners, Minn. (SW6) 47 46 55 096 19 53
33 05079000 Red Lake River at Crookston, Minn. 47 46 32 096 36 33
34 05079200 County Ditch 72 (Burnham Creek) near Maple Bay, Minn. (SW3)
47 36 43 096 16 45
35 05079250 County Ditch 65 near Maple Bay, Minn. (SW2) 47 36 43 096 16 45
36 05082500 Red River of the North at Grand Forks, N. Dak. 47 55 37 097 01 44
37 05082625 Turtle River at Turtle River State Park near Arvilla, N. Dak. 47 55 55 097 30 51
38 05085900 Snake River above Alvarado, Minn. 48 10 27 096 59 55
39 05099400 Little South Pembina River near Walhalla, N. Dak. 48 51 55 098 00 20
40 05099600 Pembina River at Walhalla, N. Dak. 48 54 48 097 55 00
41 05099900 Pembina River above Neche, N. Dak. 48 57 49 097 41 14
42 05100100 Pembina River below Neche, N. Dak. 48 57 23 097 24 12
43 05100460 Tongue River near Olga, N. Dak. 48 45 40 098 06 11
44 05100480 Tongue River below Young Dam near Concrete, N. Dak. 48 45 18 098 00 50
45 05100800 Tongue River above Renwick Dam near Akra, N. Dak. 48 46 44 097 47 42
46 05101000 Tongue River at Akra, N. Dak. 48 46 42 097 44 47
47 05102490 Red River of the North at Pembina, N. Dak. 48 58 37 097 14 14
48 05112000 Roseau River below State Ditch 51 near Caribou, Minn. 48 58 54 096 27 46
Methods 15
Table 4. Selected U.S. Environmental Protection Agency STORage and RETrieval System surface-water sites sampled for analysis of nutrients, suspended sediment, or pesticides (listed in downstream order).
[Sites are listed in downstream order; STORET, U.S. Environmental Protection Agency Storage and Retrieval System ; DD, degrees; MM, minutes; SS, seconds]
Map site identifier
STORET identifier Site nameLatitude
DD MM SSLongitudeDD MM SS
S1 S002-001 Mustinka River at CSAH-9 Bridge, 1.3 mi NW of Nor-cross, Minn.
45 53 15 096 12 48
S2 S002-002 Rabbit River at CSAH-4 right bank of bridge, 0.1 mi south-west of Campbell, Minn.
46 05 43 096 24 38
S3 380001 Bois de Sioux River at Wahpeton, N. Dak. 46 15 50 096 35 56
S4 S002-170 Pelican River at Long Avenue in Detroit Lakes, Minn. 46 48 37 095 49 43
S5 S000-111 Otter Tail River Bridge on CSAH-15 west of Fergus Falls, Minn.
46 16 32 096 08 04
S6 380083 Red River of the North at Brushville, Minn. 46 22 10 096 39 24
S7 S002-114 Red River of the North on CR-8, 9 mi south of Moorhead, Minn.
46 43 52 096 47 02
S8 385234 Wild Rice River, N. Dak. 46 13 04 097 15 34
S9 380154 Red River of the North, south of Fargo, N. Dak. 46 50 52 096 46 50
S10 S000-183 Red River of the North Bridge on Main Avenue at 3rd Street, Moorhead, Minn.
46 52 26 096 46 35
S11 385040 Red River of the North near Harwood, N. Dak. 46 58 37 096 49 13
S12 380033 Bald Hill Creek at Dazey, N. Dak. 47 10 58 098 04 12
S13 380135 Sheyenne River southwest of Harvey, N. Dak. 47 42 09 099 56 56
S14 384155 Maple River at Mapleton, N. Dak. 46 54 19 097 03 09
S15 380156 Goose River at Hillsboro, N. Dak. 47 24 25 097 03 27
S16 384156 Red River of the North at Grand Forks, N. Dak. 47 55 37 097 01 42
S17 380037 Turtle River north of Manvel, N. Dak. 48 05 10 097 11 03
S18 380040 Forest River east of Minto, N. Dak. 48 18 30 097 11 21
S19 380046 Park River at Highway I-29, N. Dak. 48 27 36 097 11 00
S20 380004 Red River at Drayton, N. Dak. 48 34 22 097 08 53
S21 S002-370 Two Rivers, North Branch at US-75 at Northcote, Minn. 48 50 59 097 00 20
S22 380011 Pembina River at Walhalla, N. Dak. 48 54 49 097 55 00
S23 384157 Red River at Pembina, N. Dak. 48 58 39 097 14 18
16 Nutrients, Suspended Sediment, and Pesticides in Water of the Red River of the North Basin, 1990–2004
Nutrients, Suspended Sediment, and Pesticides in Water of the Red River Basin
Numerous stream sites were sampled in the Red River Basin during 1990–2004 (fig. 3). The number of samples col-lected at each site, however, often was not sufficient to charac-terize water-quality during all streamflow conditions. Stream-flow was greater than average during some years and was less than average during others. The distributions of mean annual streamflows for 1990–2004 are shown in figure 4 for 22 USGS stream sites with continuous streamflow record. Long-term average streamflows for the period of record at each site also are shown. Streamflows at the four Red River sites exceeded the long-term average during 1990–2004. This is particularly evident at the Red River at Fargo (site 10), where 75 percent of the flows were greater than the long-term average. For 19 of the 22 streamflow sites in the basin, average annual stream-flow exceeded the long-term average for the period of record at that site (fig. 4). Streamflows generally were less than the long-term average at the Bois de Sioux (site 7), Turtle River (site 37), and Pembina River (site 40) sites.
The importance of streamflow variability to this report is that streamflow can have a substantial effect on water chem-istry. The high streamflows of the early 1990s are particularly important because they occurred during the growing sea-son after pesticides were applied. Tornes and others (1997) reported that streamflows at most sites in the Red River Basin exceeded the 90th percentile of historical mean annual stream-flows during 1993–95. The effect of these high streamflows was more apparent for southern and western streams where runoff was especially large. Suspended sediment and constitu-ents related to the solid phase rather than the dissolved phase (total phosphorus, for example) typically are higher during higher flows.
Flooding can affect water quality in the spring when agricultural chemicals have been applied and when there is no crop cover on fields to hold soils in place. There were large floods in the basin in 1997 and 2001. The 1997 floods were the result of record high snow packs across the region, whereas the 2001 floods were the result of above average soil moistures in some areas of the basin (Macek-Rowland, 2001). The flat terrain of the Red River Basin and the shallowness of the channel can aggravate flooding. Samples collected during floods usually indicate much different stream quality than samples collected during low flow. Whereas floods can cause increases for some constituents, such as fertilizers and sedi-ment, they also can have a diluting effect on other constituents, such as dissolved solids.
Nutrients
Nutrients, particularly nitrogen and phosphorus, have been identified as a source of the degradation of much of the Nation’s surface water with respect to water quality (U.S. Environmental Agency, 2000). Although nutrients occur natu-rally in the environment, certain human activities can increase their transport to natural waters. Sources of nutrients include sewage effluent, lawn fertilizer, storm runoff, and certain agri-cultural practices such as livestock production and application of fertilizers.
Nitrogen occurs in several forms—ammonia, nitrite, nitrate, and as part of organic compounds. Ammonia plus organic nitrogen, also known as total Kjeldahl nitrogen (TKN), is a laboratory test for measuring the amount of organic nitro-gen and ammonia in water. In most oxygenated surface water, nitrate is by far the most predominant ion because of the rapid oxidation of nitrite. Adverse human-health effects of large concentrations of nitrates (greater than 10 mg/L) in drinking water include methemoglobinemia, “blue-baby syndrome” in infants (U.S. Environmental Protection Agency, 1986).
Phosphorus is an essential nutrient for plant growth; however, if critical concentrations are exceeded, it may con-tribute to eutrophication. Eutrophication is characterized by an abundance of nutrients, decreases in dissolved oxygen, dense growth of algae, and an acceleration of the normal rate of eco-logical succession (Reid and Wood, 1976, p. 293).
Surface WaterMost of the sampling sites are primarily along the Red
River (fig. 3) and in the Red River Valley Lake Plain (fig. 2). Another area of intense sampling is within the closed Devils Lake Basin (fig. 3). Few sites are in the Lake-Washed Till Plain or the Moraine. The limited distribution of sampling sites makes it difficult to generalize about the water quality for a certain physiographic area in the Red River Basin. Tornes and others (1997) found that nutrient concentrations generally were related to the physiographic area that a stream drains.
Because methods of collection and analysis are differ-ent, USGS data for nutrients in surface water and the nutrient data collected and analyzed by other agencies are discussed separately. All 23 USGS sites meeting selection criteria are included in figure 5. Nitrite plus nitrate concentrations ranged from 0.02 to 5.2 mg/L in samples from USGS stream sampling sites; concentrations between the 10th and 90th percentile are displayed in fig. 5A. Median nitrite plus nitrate concentrations ranged from 0.05 to 0.67 mg/L.
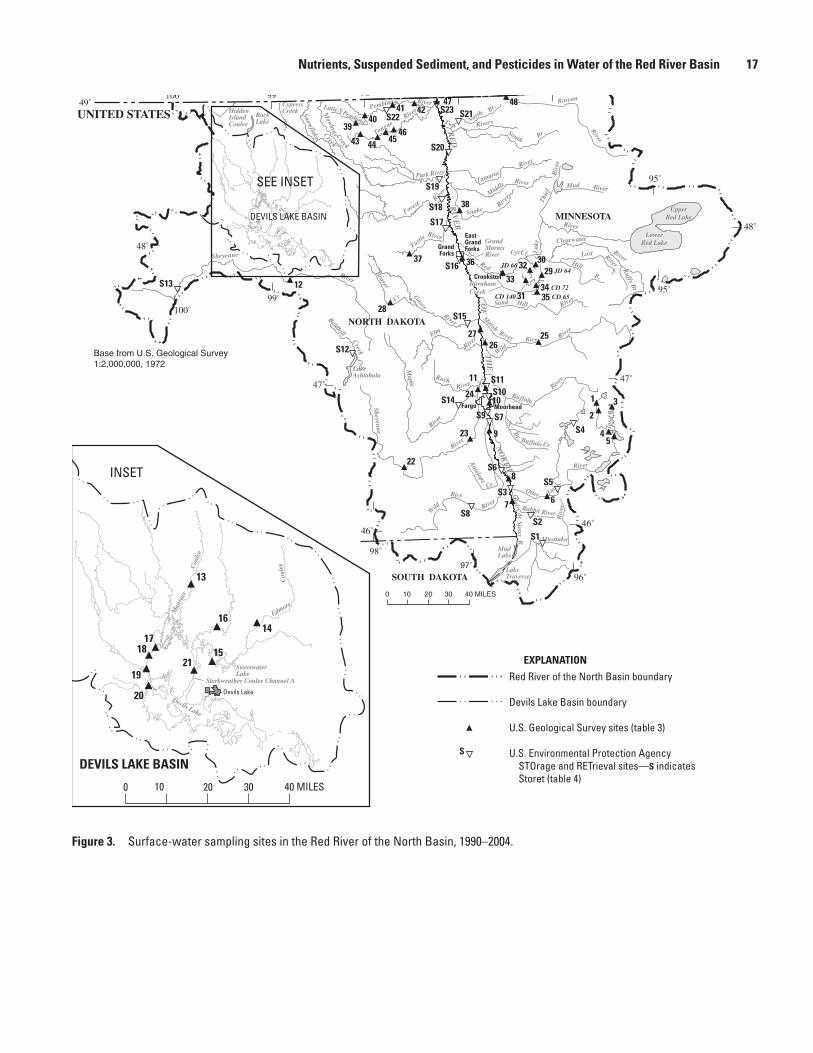
Figure 3. Surface-water sampling sites in the Red River of the North Basin, 1990–2004.
UpperRed Lake
LowerRed Lake
RockLake
LakeAshtabula
LakeTraverse
MudLake
EastGrand Forks
EastGrand Forks
CrookstonCrookston
GrandForks
MoorheadMoorheadFargoFargo
BurnhamCreekBurnhamCreek
RE
DR
IVE
R
OF
TH
EN
OR
TH
Creek
Elm
River
Rush
River
River
River
Maple
Baldhill
River
Wild
Rice
Sheyenne
River
Goose
Antelope
Turtle
River
Sheyenne
River
RiverRiver
Pembina
Tongue
Park River
River
Forest
Creek
Mow
bray
Snowflake Creek
Sand Hill River
Marsh
River
Buffalo
River
River
Tail
River
Wild
Buffalo
S. Br.
Cr.
Rabbit River
Mustinka
Riv
er
Otter
Sioux R.
Bois
Two Rivers
Red
River
Lak
e
Middle
River
Snake
River
River
Tamarac
North
Br.South
River
Roseau
River
Clearwater
RiverLost
R.
Hill Ruffy B
r.
Br.
Mud River
Riv
er
Thie
f
HiddenIslandCoulee
CypressCreek
GrandMaraisRiver
Rice
de
Cr.
Beaver
Cr
LittleS Pembina
CyrCr.
Toad
R.
MANITOBA
NORTH DAKOTA
MINNESOTA
SOUTH DAKOTA
CANADA
UNITED STATES
98˚
98˚
47˚
46˚
47˚
48˚
48˚
97˚ 96˚100˚
95˚
96˚
46˚
49˚
99˚
49˚99˚
95˚
100˚
97˚
0 10 20 30 40 MILES
Figure 3. Surface-water sampling sites in the Red River of the North Basin, 1990-2004.
Base from U.S. Geological Survey1:2,000,000, 1972
SEE INSET
INSET
DEVILS LAKE BASIN
Red River of the North Basin boundary
Devils Lake Basin boundary
U.S. Geological Survey sites (table 3)
U.S. Environmental Protection Agency STOrage and RETrieval sites—S indicates Storet (table 4)
EXPLANATION
S
SweetwaterLake
Starkweather Coulee Channel A
Mau
vais
Cou
lee
Cou
lee
Edmore
DEVILS LAKE BASIN
Devils Lake
Devils Lake
13
14
15
16
1718
19
20
21
20 30 40 MILES 100
S1
S2
S3
S4
S5
S6
S7
S8
S9
S10S11
S12
S13
S14
S15
S16
S17
S18
S19
S20
S23S22 S21
1
23
45
67
8
9
10
11
12
22
23
24
2526
27
28
2930
31
3233
3435
3637
38
3940
41 42
43 44 4546
47 48
CD 65CD 72
CD 140
JD 66JD 64
Nutrients, Suspended Sediment, and Pesticides in Water of the Red River Basin 17

18 Nutrients, Suspended Sediment, and Pesticides in Water of the Red River of the North Basin, 1990–2004
Figure 4. Distribution of mean annual streamflow for 22 U.S. Geological Survey sites with continuous streamflow record in the Red River of the North Basin, 1990–2004.
of of of of of of of of of of of of of of of of of of of of of of15 15 15 15 15 15 15 15 8 10 15 15 15 15 15 14 15 15 12 9 15 15
11 12 11 13 12 14 13 11 7 9 12 12 12 12 13 11 12 11 9 8 13 11
STRE
AMFL
OW, I
N C
UBIC
FEE
T PE
R SE
CON
D
100,000
10,000
1,000
100
10
1
0.1
10th/90th and total values
90th percentile
75th percentile
Median
Long-term average streamflow
25th percentile
10th percentile
12of15
6 O
tter T
ail R
iver
bel
ow O
rwel
l Dam
nea
r Fer
gus
Falls
, Min
n.
7 B
ois
de S
ioux
Riv
er n
ear D
oran
, Min
n.
9 R
ed R
iver
of t
he N
orth
at H
icks
on, N
. Dak
.
10 R
ed R
iver
of t
he N
orth
at F
argo
, N. D
ak.
12 S
heye
nne
Rive
r nea
r War
wic
k, N
. Dak
.
13 M
auva
is C
oule
e ne
ar C
ando
, N. D
ak.
14 E
dmor
e Co
ulee
nea
r Edm
ore,
N. D
ak.
16 S
tark
wea
ther
Cou
lee
near
Web
ster
, N. D
ak.
18 B
ig C
oule
e ne
ar C
hurc
hs F
erry
, N. D
ak.
21 C
hann
el A
nea
r Pen
n, N
. Dak
.
22 S
heye
nne
Rive
r at L
isbo
n, N
. Dak
.
23 S
heye
nne
Rive
r nea
r Kin
dred
, N. D
ak.
25 W
ild R
ice
Rive
r at T
win
Val
ley,
Min
n.
26 W
ild R
ice
Rive
r at H
endr
um, M
inn.
27 R
ed R
iver
of t
he N
orth
at H
alst
ad, M
inn.
28 B
eave
r Cre
ek n
ear F
inle
y, N
. Dak
.
33 R
ed L
ake
Rive
r at C
rook
ston
, Min
n.
36 R
ed R
iver
of t
he N
orth
at G
rand
For
ks, N
. Dak
.
37 T
urtle
Riv
er a
t Tur
tle R
iver
Sta
te P
ark
near
Arv
illa,
N. D
ak.
40 P
embi
na R
iver
at W
alha
lla, N
. Dak
.
46 T
ongu
e Ri
ver a
t Akr
a, N
. Dak
.
48 R
osea
u Ri
ver b
elow
Sta
te D
itch
51 n
ear C
arib
ou, M
inn.
Figure 4. Distribution of mean annual streamflow for 22 U.S. Geological Survey sites with continuous streamflow record in the Red River of the North Basin, 1990-2004. (Long-term average streamflow is the average annual streamflow for the entire period of record for each site.)
(Gray plots are Red River ofthe North sites.)
EXPLANATION

Figure 5. Distribution of (A) nitrite plus nitrate nitrogen, (B) total Kjeldahl nitrogen, (C) total phosphorus, and (D) dissolved phosphorus concentrations for 23 selected U.S. Geological Survey stream sites in the Red River of the North Basin, 1990–2004.
1 O
tter T
ail R
iver
nea
r Per
ham
, Min
n.
6 O
tter T
ail R
iver
bel
ow O
rwel
l Dam
nea
r Fer
gus
Falls
, Min
n.
7 B
ois
de S
ioux
Riv
er n
ear D
oran
, Min
n.
12 S
heye
nne
Rive
r nea
r War
wic
k, N
. Dak
.
23 S
heye
nne
Rive
r nea
r Kin
dred
, N. D
ak.
25 W
ild R
ice
Rive
r at T
win
Val
ley,
Min
n.
27 R
ed R
iver
of t
he N
orth
at H
alst
ad, M
inn.
28 B
eave
r Cre
ek n
ear F
inle
y, N
. Dak
.
29 J
udic
ial D
itch
64 n
ear M
ento
r, M
inn.
30 C
yr C
reek
nea
r Mar
coux
Cor
ners
, Min
n.
31 C
ount
y Di
tch
140
near
Ben
oit,
Min
n.
32 J
udic
ial D
itch
66 n
ear M
arco
ux C
orne
rs, M
inn.
33 R
ed L
ake
Rive
r at C
rook
ston
, Min
n.
34 C
ount
y Di
tch
72 (B
urnh
am C
reek
) nea
r Map
le B
ay, M
inn.
35 C
ount
y Di
tch
65 n
ear M
aple
Bay
, Min
n.
36 R
ed R
iver
of t
he N
orth
at G
rand
For
ks, N
. Dak
.
37 T
urtle
Riv
er a
t Tur
tle R
iver
Sta
te P
ark
near
Arv
illa,
N. D
ak.
38 S
nake
Riv
er a
bove
Alv
arad
o, M
inn.
39 L
ittle
Sou
th P
embi
na R
iver
nea
r Wal
halla
, N. D
ak.
40 P
embi
na R
iver
at W
alha
lla, N
. Dak
.
41 P
embi
na R
iver
abo
ve N
eche
, N. D
ak.
42 P
embi
na R
iver
bel
ow N
eche
, N. D
ak.
48 R
osea
u Ri
ver b
elow
Sta
te D
itch
51 n
ear C
arib
ou, M
inn.
Figure 5. Distribution of (A) nitrite plus nitrate nitrogen, (B) total Kjeldahl nitrogen, (C) total phosphorus, and (D) dissolved phosphorus concentrations for 23 selected U.S. Geological Survey stream sites in the Red River of the North Basin, 1990-2004.
(A) Nitrite plus Nitrate Nitrogen
(B) Total Kjeldahl Nitrogen
(C) Total Phosphorus
(D) Dissolved Phosphorus
CON
CEN
TRAT
ION
S, IN
MIL
LIGR
AMS
PER
LITE
R
3.5
3.0
2.5
2.0
1.5
1.0
0.5
0
5
4
3
2
1
0
1.61.4
1.01.2
0.60.8
0.40.2
0
1
0.50
0.25
0.75
0
(Gray box plots are Red River of the North sites.)
10th/90th and total values
90th percentile
75th percentile
Median
25th percentile
10th percentile
12of15
EXPLANATION
of of of of of of of of of of of of of of of of of of of of of of of50 29 26 9 46 48 43 18 20 15 16 22 49 19 21 34 82 28 11 35 10 10 35
45 27 24 9 41 44 35 17 18 14 15 19 45 17 18 28 76 26 10 32 10 10 32
of of of of of of of of of of of of of of of of of of of of of of of24 25 26 9 48 48 44 18 20 15 16 22 48 19 21 33 85 33 11 35 10 10 35
23 23 22 9 41 40 38 18 16 13 14 18 42 17 18 28 73 28 9 29 9 8 29
of of of of of of of of of of of of of of of of of of of of of of of50 29 26 9 48 48 44 18 20 15 16 22 48 19 21 35 84 34 11 35 10 10 35
42 27 22 9 40 45 36 16 16 13 14 18 41 17 17 29 71 28 10 29 8 9 32
of of of of of of of of of of of of of of of of of of of of of of of24 26 26 9 46 43 48 18 20 15 16 22 49 19 21 36 82 28 11 35 10 10 35
22 22 25 9 39 36 46 16 17 13 14 18 46 17 18 31 73 26 9 31 8 8 32
Nutrients, Suspended Sediment, and Pesticides in Water of the Red River Basin 19
20 Nutrients, Suspended Sediment, and Pesticides in Water of the Red River of the North Basin, 1990–2004
The most noticeable pattern in nitrite plus nitrate concen-trations across the basin is the high concentrations in samples from the Little South Pembina and Pembina River (sites 39, 40, 41, and 42, fig. 3) compared to concentrations in samples from other Red River Basin sites (fig. 5A). Although these sites are located in the Drift Prairie and Red River Valley Lake Plain, they mainly drain the Drift Prairie physiographic area. Tornes and others (1997) found that streams draining the Drift Prairie had much higher concentrations of nitrate than other streams in the basin. The Drift Prairie physiographic area drains some of the steepest agricultural land in the basin, which probably contributed to more rapid runoff of nutrients (Tornes and Brigham, 1994). The Bois de Sioux River (site 7, fig. 3), the Red River at Halstad (site 27, fig. 3), and Judicial Ditch 66 near Marcoux Corners (site 32, fig. 3) had slightly higher concentrations than nearby sites. The main-stem site at Halstad probably is influenced by municipal and indus-trial wastes from the cities of Fargo and Moorhead (Tornes and Brigham, 1994). All nitrite plus nitrate concentrations in samples from USGS stream sites between 1990–2004 were less than the drinking water standard of 10 mg/L (U.S. Environmental Protection Agency, 1996). Nitrite plus nitrate concentrations less than 10 mg/L are not considered a threat to human health.
Ammonia concentrations typically were low at most sites where data were available; therefore the TKN results likely are mostly organic nitrogen. TKN concentrations in samples from USGS sites meeting selection criteria ranged from 0.1 to 7.5 mg/L; concentrations between the 10th and 90th percentile are shown in figure 5B. Median TKN concentrations in samples from USGS sites ranged from 0.61 to 1.4 mg/L; TKN concen-trations were highest at Bois de Sioux (site 7), Beaver Creek near Finley (site 28), County Ditch 140 near Benoit (site 31), and Snake River at Alvarado (site 38). No regional pattern is apparent with these TKN concentrations, which were found in samples from different areas of the basin. Excessive organic nitrogen in water may indicate contamination from human and animal waste.
Total phosphorus concentrations in water samples from USGS stream sites ranged from less than 0.005 to 4.14 mg/L; concentrations between the 10th and 90th percentile are shown in figure 5C. Median total phosphorus concentrations ranged from 0.018 to 0.345 and were highest at the Bois de Sioux (site 7, fig. 3), Sheyenne River (site 12, fig. 3), Red River (sites 27 and 36, fig. 3), Little South Pembina River (site 39, fig. 3), and Pembina River (sites 40, 41, and 42, fig. 3) sites. Some Red River sites are near or downstream from wastewater effluent, which may explain high total phosphorus concentrations compared to those in samples from sites further upstream.
Samples from the Pembina River sites had higher total phosphorus concentrations than those from nearby sites. Soil characteristics or agricultural practices and steep topogra-phy most likely cause more phosphorus to be transported to the stream. In addition, Pembina River sites drain the Drift
Prairie physiographic area, an area that had higher phosphorus concentrations than other Red River Basin sites in a previous study (Tornes and others, 1997).
Dissolved phosphorus concentrations at the USGS stream sites ranged from 0.003 to 4.13 mg/L; concentrations between the 10th and 90th percentile are shown in figure 5D. Median dissolved phosphorus concentrations ranged from 0.01 to 0.28 mg/L. Samples with high median dissolved phosphorus concentrations were from the Sheyenne River near Warwick, N. Dak. (site 12, fig. 3), Little South Pembina (site 39, fig. 3), and Pembina River sites (sites 40, 41, and 42, fig. 3). Because no large urban areas are located upstream from these sites, it is suspected that agricultural practices, such as livestock opera-tions, are affecting water quality at some of the sites.
Data for nutrients in stream water from STORET were available for many sites. Results from 23 of these sites are shown in figure 6 and are discussed below. Nitrite plus nitrate concentrations for selected STORET sites ranged from less than 0.005 to 7.7 mg/L; concentrations between the 10th and 90th percentile are displayed in figure 6A. The highest median concentration occurred at the Red River of the North near Har-wood, N. Dak. (site S11, fig. 3). This site is downstream from Fargo and Moorhead wastewater treatment plants, which may explain the higher nitrite plus nitrate concentrations.
For the STORET sites, TKN concentrations ranged from 0.234 to 2.38 mg/L; concentrations between the 10th and 90th percentile are shown in figure 6B. Median TKN concentra-tions ranged from 0.57 to 1.0 mg/L. TKN concentrations were highest at Mustinka River (site S1), Rabbit River (site S2), and Two Rivers (site S21). Relatively low TKN concentrations were found in samples from the Otter Tail River (site S5), Red River (sites S6, S11, S16, and S23), and Pembina River (site S22). Low concentrations of TKN occurred at all Red River sites except at the Bridge on Main Avenue at 3rd Street in Moorhead, Minn. (site S10). This pattern of low concen-trations on the mainstem sites was not expected and was not observed from 1970–90 (Tornes and Brigham, 1994). The data for the Red River of the North Bridge on Main Avenue at 3rd Street was analyzed by a different lab during 1990–2004 than the other Red River sites in the graph (fig. 6B). This emphasizes the importance of documenting quality assurance procedures and considering these when evaluating data from numerous sources, such as those from STORET.
Total phosphorus concentrations in samples from selected STORET stream sites ranged from 0.018 to 1.44 mg/L; con-centrations between the 10th and 90th percentile are shown in figure 6C. The range in median total phosphorus concentra-tions was 0.05 to 0.30 mg/L. The highest median concentra-tions were detected at the Pembina River site S22. Concentra-tions at Pelican River (site S4) were substantially lower than at other STORET sites (fig. 5C). A large number of samples (149) were analyzed at this site and, therefore, this is prob-ably a valid difference and not an artifact of different sampling schemes.

Figure 6. Distribution of (A) nitrite plus nitrate nitrogen, (B) total Kjeldahl nitrogen, and (C) total phosphorus concentrations for selected U.S. Environmental Protection Agency STOrage and RETrieval stream sites in the Red River of the North Basin, 1990–2004.
Figure 6. Distribution of (A) nitrite plus nitrate nitrogen, (B) total Kjeldahl nitrogen, and (C) total phosphorus concentrations for selected U.S. Envirnonmental Protection Agency STOrage and RETrieval stream sites in the Red River of the North Basin,1990-2004.
(A) Nitrite plus Nitrate Nitrogen
(B) Total Kjeldahl Nitrogen
(C) Total Phosphorus
CON
CEN
TRAT
ION
S, IN
MIL
LIGR
AMS
PER
LITE
R
3.5
3.0
2.5
1.5
2.0
1.0
0
0.5
5
4
3
2
1
0
1.6
1.4
1.0
1.2
0.6
0.8
0.4
0.2
0
S1 M
ustin
ka R
iver
at C
SAH-
9 Br
idge
,1.3
mile
s N
W o
f Nor
cros
s, M
inn.
S2 R
abbi
t Riv
er a
t CSA
H-4
right
ban
k of
brid
ge, 0
.1 o
f a m
ile S
W o
f Cam
pbel
l, M
inn.
S3 B
ois
de S
ioux
Riv
er a
t Wah
peto
n, N
. Dak
.
S4 P
elic
an R
iver
at L
ong
Aven
ue in
Det
roit
Lake
s, M
inn.
S5 O
tter T
ail R
iver
Brid
ge o
n CS
AH-1
5 w
est o
f Fer
gus
Falls
, Min
n.
S6 R
ed R
iver
of t
he N
orth
at B
rush
ville
, Min
n.
S7 R
ed R
iver
of t
he N
orth
on
CR-8
, 9 m
iles
sout
h of
Moo
rhea
d, M
inn.
S8 W
ild R
ice
Rive
r, N
. Dak
.
S9 R
ed R
iver
of t
he N
orth
, sou
th o
f Far
go, N
. Dak
.
S10
Red
Riv
er o
f the
Nor
th B
ridge
on
Mai
n Av
enue
at 3
rd S
treet
, Moo
rhea
d, M
inn.
S11
Red
Riv
er o
f the
Nor
th n
ear H
arw
ood,
N. D
ak.
S12
Bal
d Hi
ll Cr
eek
at D
azey
, N. D
ak.
S13
She
yenn
e Ri
ver s
outh
wes
t of H
arve
y, N
. Dak
.
S14
Map
le R
iver
at M
aple
ton,
N. D
ak.
S15
Goo
se R
iver
at H
illsb
oro,
N. D
ak.
S16
Red
Riv
er o
f the
Nor
th a
t Gra
nd F
orks
, N. D
ak.
S17
Tur
tle R
iver
nor
th o
f Man
vel,
N. D
ak.
S18
For
est R
iver
eas
t of M
into
, N. D
ak.
S19
Par
k Ri
ver a
t Hig
hway
I-29
, N. D
ak.
S20
Red
Riv
er o
f the
Nor
th a
t Dra
yton
, N. D
ak.
S21
Tw
o Ri
vers
, Nor
th B
ranc
h at
US-
75 a
t Nor
thco
te, M
inn.
S22
Pem
bina
Riv
er a
t Wal
halla
, N. D
ak.
S23
Red
Rive
r of t
he N
orth
at P
embi
na, N
. Dak
.
of of of of of of of of of of of of of of of of of of of of of of of35 0 17 0 85 41 0 51 16 90 33 41 147 28 56 46 37 19 17 15 19 32 52
32 0 16 0 76 36 0 46 14 73 27 36 132 26 47 38 32 18 16 13 18 29 42
(Gray box plots are Red River of the North sites.)
10th/90th and total values
90th percentile
75th percentile
Median
25th percentile
10th percentile
12of15
EXPLANATION
of of of of of of of of of of of of of of of of of of of of of of of33 15 0 0 39 34 0 51 0 47 33 39 147 28 0 46 35 0 0 0 31 32 52
27 13 0 0 33 28 0 41 0 39 27 34 119 24 0 38 29 0 0 0 25 26 42
of of of of of of of of of of of of of of of of of of of of17 149 0 41 43 51 16 86 33 59 147 28 0 44 37 19 17 15 32 50
15 122 0 33 35 41 14 70 28 49 119 24 0of0
0of0
036 31 17 15 13 26 4029of35
of0
0
Nutrients, Suspended Sediment, and Pesticides in Water of the Red River Basin 21
22 Nutrients, Suspended Sediment, and Pesticides in Water of the Red River of the North Basin, 1990–2004
Ground WaterThe form of nitrogen most frequently analyzed in ground
water samples was nitrate; there were several reasons for this. Nitrate is a dissolved form, the analysis is reasonably easy, and there is the Maximum Contaminant Level of 10 mg/L, to which concentration values can be compared. Bacterially mediated reactions can reduce nitrate to other forms of nitro-gen under anoxic conditions, but these forms are not typically analyzed. Therefore, nitrogen contamination in ground water may affect a wider area, but this would not be apparent when water samples are analyzed for only nitrate.
Reported nitrate concentrations (as nitrogen) in ground water from North Dakota counties ranged from less than 0.023 to 113 mg/L (fig. 8) from 1990 through 2004. About 15,000 samples from North Dakota counties from 1990 through 2004 were analyzed for nitrate. Samples from Sheridan County had the highest median nitrate concentrations, whereas samples from Rolette County had the lowest median concentrations. Sheridan County is located on the far western side of the basin in the Drift Prairie physiographic area and the land use is mainly cropland and grazing (fig. 2). Rolette County is in the far northwestern part of the basin and also is located in the Drift Prairie physiographic area, however, the land use is mixed with some woodland and cropland (fig. 2).
Nitrate concentrations in 613 samples from ground-water wells in Minnesota counties ranged from less than 0.005 to 133 mg/L (fig. 9). The highest concentrations were detected in Marshall and Otter Tail Counties. Very low median concentra-tions (most values were non-detectable) occurred in Itasca, Kittson, Norman, Stevens, and Wilkin counties. Ground-water nitrate data was not available for Big Stone, Clay, Lake of the Woods, and Roseau Counties. The samples with the highest median ground-water nitrate concentrations were collected from wells in Marshall, Otter Tail, and Polk Counties (fig. 9).
Fertilizer applications (table 1) were examined to determine if there was a correlation between these and nitrate concentrations in ground water (figs. 8 and 9). With the excep-tion of Cavalier County, the North Dakota counties that had the highest fertilizer applications (Barnes, Cass, Richland) as shown by acres treated did not correspond to the North Dakota counties that had the highest ground-water nitrate concentra-tions (Ransom, Sheridan, and Traill). There appears to be little correlation between fertilizer applications (table 1) and nitrate concentrations in ground water in North Dakota Counties (fig. 8).
For Minnesota counties, Marshall, Norman, and Polk had the highest fertilizer applications as shown by acres treated with commercial fertilizers in table 1. Otter Tail County had considerably more acres treated with manure (table 1) than other Minnesota counties. Marshall, Otter Tail, and Polk counties also had the highest nitrate concentrations in ground-water wells when compared to other counties in the basin (fig. 9). Norman County did not have high ground-water nitrate
concentrations, but only three wells were sampled in Norman County and it is possible that these wells were not representa-tive of the general water quality of ground water in Norman County.
The lack of correlation for some counties between fertil-izer applications and ground water nitrate concentrations in wells may be because the nitrate comes from another source. High nitrate concentrations in ground water also may be an indication of contamination by sewage or agricultural wastes (Drever, 1988, p. 70). Most investigators have attributed high nitrate concentrations in rural wells to drainage from nearby barnyards or septic systems (Hem, 1992).
The lack of correlation for some counties between fertil-izer applications and ground water nitrate concentrations in wells also may be due to differences in surficial geology. Much of the ground water in Otter Tail and Becker Counties is in unconfined, shallow aquifers and susceptible to contamina-tion (Tornes and Brigham, 1994). Shallow ground water is at risk for nitrate contamination because nitrate ions are highly soluble in water, susceptible to leaching, and move freely through soil along with water (Campbell and others, 2004, p. 152). Areas with the highest risk for nitrate contamination generally have high nitrogen inputs, well-drained soils, and a high ratio of cropland to woodland (U.S. Geological Survey, 1999). Contamination of shallow ground water may be a warn-ing to alert populations of potential future risks from con-sumption of water from deeper wells in these aquifers (U.S. Geological Survey, 1999).
Three additional sources of ground-water quality data were reviewed for this report. These data were collected through the MDNR, MDA, and MPCA’s GWMAP. The MDNR collected ground-water samples in the Red River Basin in Minnesota. These samples were collected during 1992 and 1993 and analyzed for phosphorus, phosphate, nitrite, and nitrate. Data were not available by county. Nitrate values for 178 samples collected ranged from less than 0.10 to 14.7 mg/L. The MDA also collected some ground-water samples in Minnesota in 2004. Electronic files for these data were provided to the MPCA from MDA (Catherine O’Dell, Minnesota Pollution Control Agency, written commun., 2006). Nitrite plus nitrate concentrations ranged from zero to 6.27 mg/L for samples collected from 18 wells. The MPCA collected large amounts of ground-water quality data through GWMAP. Baseline data were collected from 1992–1996 and included metals, major ions, field properties, nitrate, and total phosphorus. Of the 124 wells sampled in the Red River Basin, 7 had water with detectible concentrations of nitrate. The detected concentrations generally were from water collected from wells in the buried Quaternary aquifers and concentra-tions for these seven wells ranged from 0.5 mg/L to 2.6 mg/L. More information on the GWMAP data is available at http://www.pca.state.mn.us/water/groundwater/gwmap/gwbaseline.html.

Figure 7. Numbers of wells sampled, by county, during 1990–2004 in the Red River of the North Basin.
CAVALIER KITTSONROLETTE
MARSHALL
TOWNER
RAMSEY
BENSON
POLK
ITASCA
NELSON
EDDY
WELLS
GRIGGS
SHERIDAN
STEELE
BECKERBARNES
RANSOM
OTTER TAIL
RICHLAND
TRAVERSE
STUTSMAN
MCHENRY
PIERCE
PENNINGTON
RED LAKEGRANDFORKS
TRAILL
CASS
NORMAN MAHNOMEN
CLAY
SARGENT
BIG STONE
STEVENS
GRANT
WILKIN
CLEAR-WATER
BELTRAMI
LAKE OF
THE WOODS
KOOCHI-
CHING
ROSEAUPEMBINA
WALSH
FOSTER
RockLake
RE
DR
IVE
R
OF
TH
E
NO
RTH
MANITOBA
NORTH DAKOTA
MINNESOTA
SOUTH DAKOTA
CANADA
UNITED STATES
EastGrand ForksGrand
Forks
MoorheadFargo
0 10 20 30 40 MILES
Figure 7. Number of wells sampled, by county, during 1990-2004 in the Red River of the North Basin.
Base from U.S. Geological Survey1:2,000,000, 1972
NUMBER OF WELLS SAMPLED
0 TO 9
10 TO 49
50 TO 99
100 TO 199
200 TO 299
300 AND OVER
EXPLANATION
RED RIVER OF THE NORTH BASIN BOUNDARY
DEVILS LAKE BASIN BOUNDARY
Nutrients, Suspended Sediment, and Pesticides in Water of the Red River Basin 23
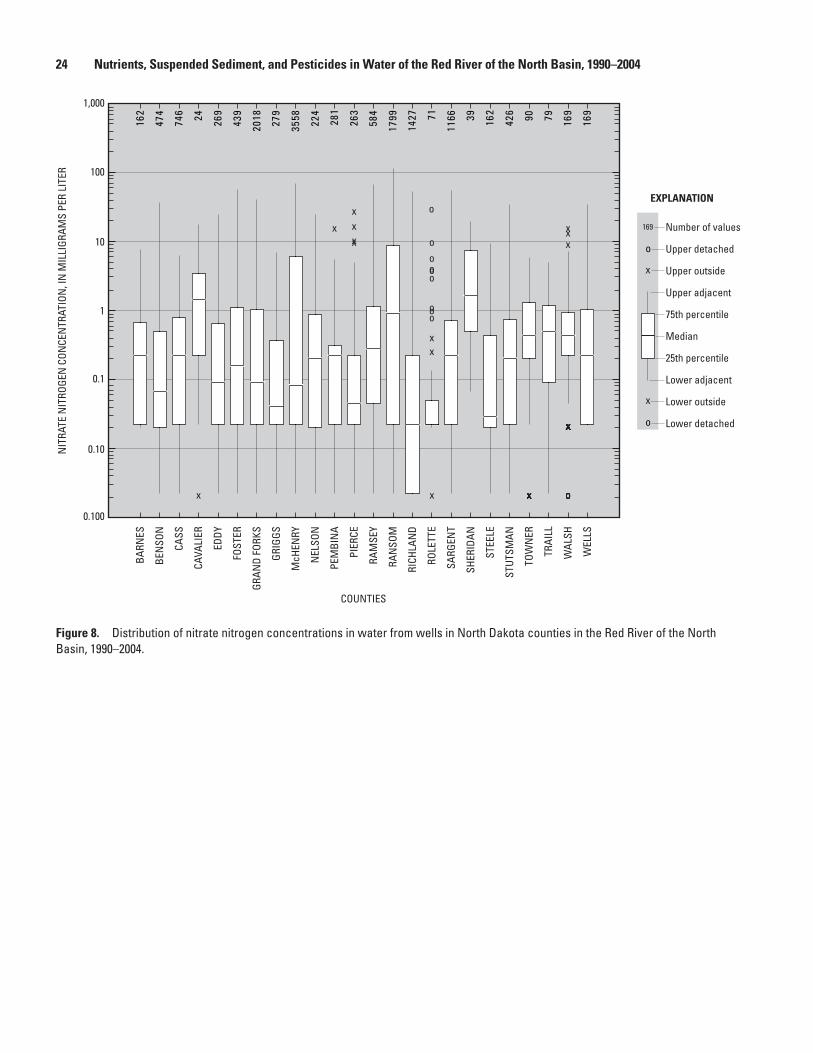
24 Nutrients, Suspended Sediment, and Pesticides in Water of the Red River of the North Basin, 1990–2004
Figure 8. Distribution of nitrate nitrogen concentrations in water from wells in North Dakota counties in the Red River of the North Basin, 1990–2004.
NIT
RATE
NIT
ROGE
N C
ONCE
NTR
ATIO
N, I
N M
ILLI
GRAM
S PE
R LI
TER
1,000
100
10
1
0.1
0.10
0.100
Figure 8. Distribution of nitrate nitrogren concentrations in water from wells in North Dakota counties in the Red River of the North Basin, 1990-2004. (North Dakota State Water Commission data.)
162
474
746 24 269
439
2018 27
9
3558 22
4
281
263
584
1799
1427 71
1166 39 16
2
426 90 79 169
169
x
x
x
xxx
xx
o
o
ooo
o
o
oo
x xxxxxxx
xxx
xxxxxxxxxxxxxxxxxxx
ooooooo
Number of values
Upper detached
Upper outside
Upper adjacent
75th percentile
Median
25th percentile
Lower adjacent
Lower outside
Lower detached
169
x
x
o
o
EXPLANATION
BARN
ES
BEN
SON
CASS
CAVA
LIER
EDDY
FOST
ER
GRAN
D FO
RKS
GRIG
GS
McH
ENRY
NEL
SON
PEM
BIN
A
PIER
CE
RAM
SEY
RAN
SOM
RICH
LAN
D
ROLE
TTE
SARG
ENT
SHER
IDAN
STEE
LE
STUT
SMAN
TOW
NER
TRAI
LL
WAL
SH
WEL
LSCOUNTIES

Figure 9. Distribution of nitrate nitrogen concentrations in water from wells in Minnesota counties in the Red River of the North Basin, 1990–2004.
NIT
RATE
NIT
ROGE
N C
ONCE
NTR
ATIO
N, I
N M
ILLI
GRAM
S PE
R LI
TER
1,000
100
10
1
0.1
0.10
0.100
Figure 9. Distribution of nitrate nitrogren concentrations in water from wells in Minnesota counties in the Red River of the North Basin, 1990-2004. (U.S. Geological Survey data.)
Number of values
Upper detached
Upper outside
Upper adjacent
75th percentile
Median
25th percentile
Lower adjacent
Lower outside
Lower detached
25
x
x
o
o
EXPLANATION
COUNTIES
25 48 0 0 16 4 7 2 4 0 4 6 3 318 5 148 7 0 7 4 1
ooooooooo
ooo ooooooo o
BECK
ER
BELT
RAM
I
BIG
STON
E
CLAY
CLEA
RWAT
ER
GRAN
T
ITAS
CA
KITT
SON
KOOC
HICH
ING
LAKE
OF
THE
WOO
DS
MAH
NOM
EN
MAR
SHAL
L
NOR
MAN
OTTE
R TA
IL
PEN
NIN
GTON
POLK
RED
LAKE
ROSE
AU
STEV
ENS
TRAV
ERSE
WIL
KIN
Nutrients, Suspended Sediment, and Pesticides in Water of the Red River Basin 25
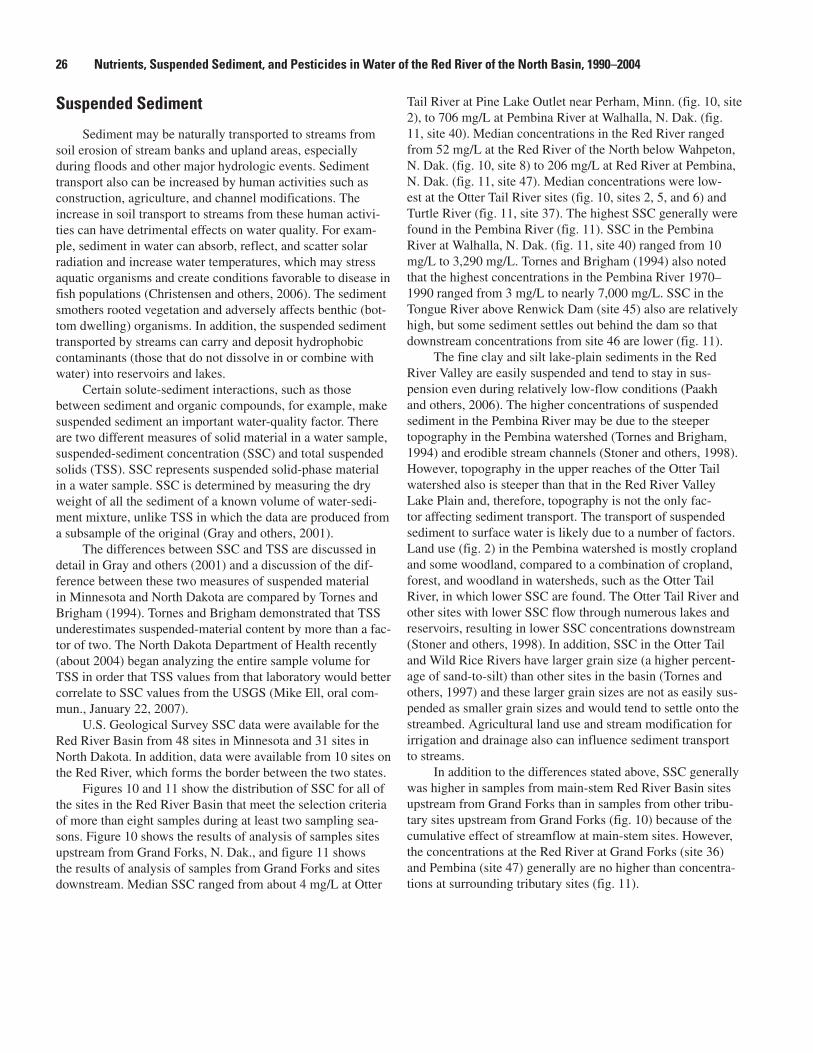
26 Nutrients, Suspended Sediment, and Pesticides in Water of the Red River of the North Basin, 1990–2004
Suspended Sediment
Sediment may be naturally transported to streams from soil erosion of stream banks and upland areas, especially during floods and other major hydrologic events. Sediment transport also can be increased by human activities such as construction, agriculture, and channel modifications. The increase in soil transport to streams from these human activi-ties can have detrimental effects on water quality. For exam-ple, sediment in water can absorb, reflect, and scatter solar radiation and increase water temperatures, which may stress aquatic organisms and create conditions favorable to disease in fish populations (Christensen and others, 2006). The sediment smothers rooted vegetation and adversely affects benthic (bot-tom dwelling) organisms. In addition, the suspended sediment transported by streams can carry and deposit hydrophobic contaminants (those that do not dissolve in or combine with water) into reservoirs and lakes.
Certain solute-sediment interactions, such as those between sediment and organic compounds, for example, make suspended sediment an important water-quality factor. There are two different measures of solid material in a water sample, suspended-sediment concentration (SSC) and total suspended solids (TSS). SSC represents suspended solid-phase material in a water sample. SSC is determined by measuring the dry weight of all the sediment of a known volume of water-sedi-ment mixture, unlike TSS in which the data are produced from a subsample of the original (Gray and others, 2001).
The differences between SSC and TSS are discussed in detail in Gray and others (2001) and a discussion of the dif-ference between these two measures of suspended material in Minnesota and North Dakota are compared by Tornes and Brigham (1994). Tornes and Brigham demonstrated that TSS underestimates suspended-material content by more than a fac-tor of two. The North Dakota Department of Health recently (about 2004) began analyzing the entire sample volume for TSS in order that TSS values from that laboratory would better correlate to SSC values from the USGS (Mike Ell, oral com-mun., January 22, 2007).
U.S. Geological Survey SSC data were available for the Red River Basin from 48 sites in Minnesota and 31 sites in North Dakota. In addition, data were available from 10 sites on the Red River, which forms the border between the two states.
Figures 10 and 11 show the distribution of SSC for all of the sites in the Red River Basin that meet the selection criteria of more than eight samples during at least two sampling sea-sons. Figure 10 shows the results of analysis of samples sites upstream from Grand Forks, N. Dak., and figure 11 shows the results of analysis of samples from Grand Forks and sites downstream. Median SSC ranged from about 4 mg/L at Otter
Tail River at Pine Lake Outlet near Perham, Minn. (fig. 10, site 2), to 706 mg/L at Pembina River at Walhalla, N. Dak. (fig. 11, site 40). Median concentrations in the Red River ranged from 52 mg/L at the Red River of the North below Wahpeton, N. Dak. (fig. 10, site 8) to 206 mg/L at Red River at Pembina, N. Dak. (fig. 11, site 47). Median concentrations were low-est at the Otter Tail River sites (fig. 10, sites 2, 5, and 6) and Turtle River (fig. 11, site 37). The highest SSC generally were found in the Pembina River (fig. 11). SSC in the Pembina River at Walhalla, N. Dak. (fig. 11, site 40) ranged from 10 mg/L to 3,290 mg/L. Tornes and Brigham (1994) also noted that the highest concentrations in the Pembina River 1970–1990 ranged from 3 mg/L to nearly 7,000 mg/L. SSC in the Tongue River above Renwick Dam (site 45) also are relatively high, but some sediment settles out behind the dam so that downstream concentrations from site 46 are lower (fig. 11).
The fine clay and silt lake-plain sediments in the Red River Valley are easily suspended and tend to stay in sus-pension even during relatively low-flow conditions (Paakh and others, 2006). The higher concentrations of suspended sediment in the Pembina River may be due to the steeper topography in the Pembina watershed (Tornes and Brigham, 1994) and erodible stream channels (Stoner and others, 1998). However, topography in the upper reaches of the Otter Tail watershed also is steeper than that in the Red River Valley Lake Plain and, therefore, topography is not the only fac-tor affecting sediment transport. The transport of suspended sediment to surface water is likely due to a number of factors. Land use (fig. 2) in the Pembina watershed is mostly cropland and some woodland, compared to a combination of cropland, forest, and woodland in watersheds, such as the Otter Tail River, in which lower SSC are found. The Otter Tail River and other sites with lower SSC flow through numerous lakes and reservoirs, resulting in lower SSC concentrations downstream (Stoner and others, 1998). In addition, SSC in the Otter Tail and Wild Rice Rivers have larger grain size (a higher percent-age of sand-to-silt) than other sites in the basin (Tornes and others, 1997) and these larger grain sizes are not as easily sus-pended as smaller grain sizes and would tend to settle onto the streambed. Agricultural land use and stream modification for irrigation and drainage also can influence sediment transport to streams.
In addition to the differences stated above, SSC generally was higher in samples from main-stem Red River Basin sites upstream from Grand Forks than in samples from other tribu-tary sites upstream from Grand Forks (fig. 10) because of the cumulative effect of streamflow at main-stem sites. However, the concentrations at the Red River at Grand Forks (site 36) and Pembina (site 47) generally are no higher than concentra-tions at surrounding tributary sites (fig. 11).
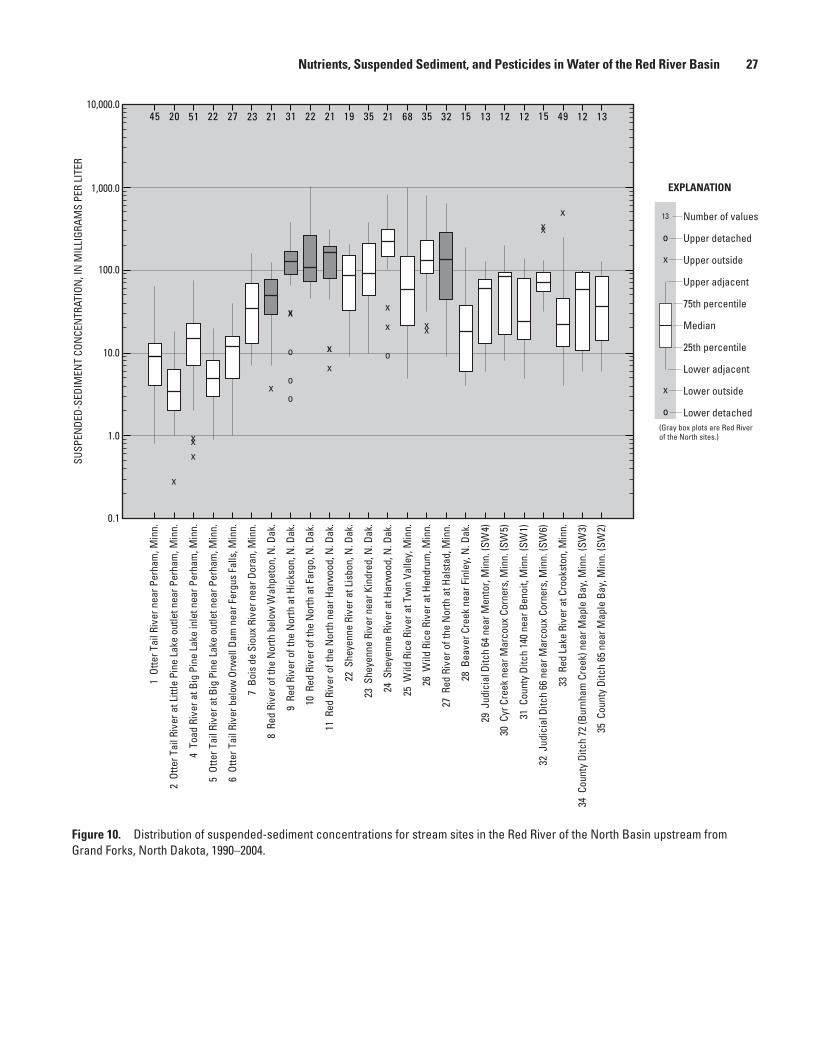
Figure 10. Distribution of suspended-sediment concentrations for stream sites in the Red River of the North Basin upstream from Grand Forks, North Dakota, 1990–2004.
x
xx
x
x
x
x
x
x
x
o
xx
xxx
45 20 51 22 27 23 21 31 22 21 19 35 21 68 35 32 15 13 12 12 15 49 12 13
SUSP
ENDE
D-SE
DIM
ENT
CON
CEN
TRAT
ION
, IN
MIL
LIGR
AMS
PER
LITE
R
10,000.0
1,000.0
100.0
10.0
1.0
0.1
1 O
tter T
ail R
iver
nea
r Per
ham
, Min
n.
2 O
tter T
ail R
iver
at L
ittle
Pin
e La
ke o
utle
t nea
r Per
ham
, Min
n.
4 T
oad
Rive
r at B
ig P
ine
Lake
inle
t nea
r Per
ham
, Min
n.
5 O
tter T
ail R
iver
at B
ig P
ine
Lake
out
let n
ear P
erha
m, M
inn.
6 O
tter T
ail R
iver
bel
ow O
rwel
l Dam
nea
r Fer
gus
Falls
, Min
n.
7 B
ois
de S
ioux
Riv
er n
ear D
oran
, Min
n.
8 R
ed R
iver
of t
he N
orth
bel
ow W
ahpe
ton,
N. D
ak.
9 R
ed R
iver
of t
he N
orth
at H
icks
on, N
. Dak
.
10 R
ed R
iver
of t
he N
orth
at F
argo
, N. D
ak.
11 R
ed R
iver
of t
he N
orth
nea
r Har
woo
d, N
. Dak
.
22 S
heye
nne
Rive
r at L
isbo
n, N
. Dak
.
23 S
heye
nne
Rive
r nea
r Kin
dred
, N. D
ak.
24 S
heye
nne
Rive
r at H
arw
ood,
N. D
ak.
25 W
ild R
ice
Rive
r at T
win
Val
ley,
Min
n.
26 W
ild R
ice
Rive
r at H
endr
um, M
inn.
27 R
ed R
iver
of t
he N
orth
at H
alst
ad, M
inn.
28 B
eave
r Cre
ek n
ear F
inle
y, N
. Dak
.
29 J
udic
ial D
itch
64 n
ear M
ento
r, M
inn.
(SW
4)
30 C
yr C
reek
nea
r Mar
coux
Cor
ners
, Min
n. (S
W5)
31 C
ount
y Di
tch
140
near
Ben
oit,
Min
n. (S
W1)
32 J
udic
ial D
itch
66 n
ear M
arco
ux C
orne
rs, M
inn.
(SW
6)
33 R
ed L
ake
Rive
r at C
rook
ston
, Min
n.
34 C
ount
y Di
tch
72 (B
urnh
am C
reek
) nea
r Map
le B
ay, M
inn.
(SW
3)
35 C
ount
y Di
tch
65 n
ear M
aple
Bay
, Min
n. (S
W2)
STREAM SITES
Figure 10. Distribution of suspended-sediment concentrations for stream sites in the Red River of the North Basin upstream fromGrand Forks, North Dakota, 1990-2004. (U.S. Geological Survey data.)
xx
o
o
o
Number of values
Upper detached
Upper outside
Upper adjacent
75th percentile
Median
25th percentile
Lower adjacent
Lower outside
Lower detached
13
x
x
o
o
EXPLANATION
(Gray box plots are Red River of the North sites.)
Nutrients, Suspended Sediment, and Pesticides in Water of the Red River Basin 27
28 Nutrients, Suspended Sediment, and Pesticides in Water of the Red River of the North Basin, 1990–2004
Figure 11. Distribution of suspended-sediment concentrations for stream sites in the Red River of the North Basin at Grand Forks, North Dakota and downstream, 1990–2004.
SUSP
ENDE
D-SE
DIM
ENT
CON
CEN
TRAT
ION
, IN
MIL
LIGR
AMS
PER
LITE
R
100,000.0
10,000.0
1,000.0
100.0
10.0
1.0
STREAM SITES
Figure 11. Distribution of suspended-sediment concentrations for stream sites in the Red River of the North Basin at Grand Forks, North Dakota and downstream, 1990-2004. (U.S. Geological Survey data.)
20 68 29 10 129 10 10 12 14 16 16 46 33
xx
x
xxxxxxx
x
o
ooo
x
x
xx
x
x
36 R
ed R
iver
of t
he N
orth
at G
rand
For
ks, N
. Dak
.
37 T
urtle
Riv
er a
t Tur
tle S
tate
Par
k ne
ar A
rvill
a, N
. Dak
.
38 S
nake
Riv
er a
bove
Alv
arad
o, M
inn.
39 L
ittle
Sou
th P
embi
na R
iver
at W
alha
lla, N
. Dak
.
40 P
embi
na R
iver
at W
alha
lla, N
. Dak
.
41 P
embi
na R
iver
abo
ve N
eche
, N. D
ak.
42 P
embi
na R
iver
bel
ow N
eche
, N. D
ak.
43 T
ongu
e Ri
ver n
ear O
lga,
N. D
ak.
44 T
ongu
e Ri
ver b
elow
You
ng D
am n
ear C
oncr
ete,
N. D
ak.
45 T
ongu
e Ri
ver a
bove
Ren
wic
k Da
m n
ear A
kra,
N. D
ak.
46 T
ongu
e Ri
ver a
t Akr
a, N
. Dak
.
47 R
ed R
iver
of t
he N
orth
at P
embi
na, N
. Dak
.
48 R
osea
u Ri
ver b
elow
Sta
te D
itch
51 n
ear C
arib
ou, M
inn.
Number of values
Upper detached
Upper outside
Upper adjacent
75th percentile
Median
25th percentile
Lower adjacent
Lower outside
Lower detached
16
x
x
o
o
EXPLANATION
(Gray box plots are Red River of the North sites.)
Pesticides
Pesticides include many chemicals that are commonly used to control weeds, insects, and other pests. The use of pesticides has many benefits, including increased food produc-tion, but also has adverse effects, including the adverse effect on water quality. Although pesticides seldom are detected in water at concentrations greater than human health guidelines, the likelihood of pesticide concentrations exceeding a human-health benchmark in streams is greatest for those streams draining urban or agricultural watersheds (Gilliom and others, 2006).
The occurrence of pesticides in aquatic systems may result from past or present uses in the watershed from agricul-tural land; golf courses; lawn and garden pest control in urban areas; forest management; maintenance of rights-of-way, for example, to control weeds on railroads; or atmospheric trans-port from other areas. The movement of pesticides through the aquatic system can be affected by aqueous solubility and adsorption to soils; vapor pressure; lipophilicity or the tendency of a chemical to dissolve in lipids; loss mechanisms, such as biological or chemical degradation and volatilization; and environmental factors, such as runoff events and topogra-phy (Tornes and Brigham, 1994). The transport of chemicals to surface water also is affected by some agricultural best management practices, such as vegetated buffers, and other conservation practices.
Pesticide data available for the Red River Basin is the result of several different studies and sampling programs. These studies and programs were designed for specific purposes and may be site specific; therefore, data for certain pesticides are available for only a few sites. This is not an indi-cation that a particular pesticide was not used in other areas of the basin, but that there was no sampling program in those other areas. There is considerable difference in the sampling schemes between agencies in Minnesota and North Dakota. Pesticide data for surface water in the STORET data base are available for more sites in North Dakota than in Minnesota, but many of the North Dakota sites have fewer samples. The data in this report are limited to synthetic organic pesticides. Inorganic compounds used as pesticides, such as copper, are not included.
Surface-water and ground-water pesticide data are discussed separately. Red River Basin ground-water sites in NWIS or STORET from 1990 through 2004 do not have enough pesticide data to perform statistical analyses for trends and none of the sites met selection criteria. Most of the pesticide data available for the Red River Basin are from programs in which many sites over a large geographic area are sampled only once and this especially is true for ground-water surveys. Although these data cannot be used to detect trends at a particular site, they can be examined to determine which pes-ticides have been detected in surface and ground water and to assess potential contamination of water in the basin. Analyses in which pesticides are not detected because concentrations
are below the reporting levels also are important in assessing contamination of water in the basin.
Surface WaterThe NWIS data base was searched for all pesticide data
collected from surface water during 1990–2004 in the Red River Basin. More than 120 different pesticides or metabo-lites were present in the data base. Pesticide data that met the selection criteria established in the Methods section of at least 8 samples over 2 years were found for 12 sites—2 sites on the Red River, 3 sites in Minnesota, and 7 sites in North Dakota. Among these 12 sites, 118 different pesticides met the selection criteria. Much of these data were collected between 1993 and 1995 as part of the Red River National Water Qual-ity Assessment (NAWQA) study. Results from that study are presented in Tornes and others (1997). Of the 118 different pesticides, for the 12 sites that met the selection criteria, only 37 pesticides had concentrations that exceeded their respective reporting levels. Twenty-five of the 37 pesticides had more than 90 percent of their data censored at the highest reporting level. The 11 pesticides detected most often are listed in table 5.
Of the pesticides in table 5, de-ethylatrazine, metolachlor, and triallate were detected most frequently in surface water in the Red River Basin based on results in the USGS NWIS data base. The pesticide metabolite de-ethylatrazine was measured at concentrations greater than the reporting level 62 percent of the time (89 of 144 samples, table 5). Metolachlor and triallate were measured at concentrations greater than the reporting level 57 and 47 percent of the time, respectively.
Of the 12 sites that met selection criteria for any pes-ticide, 5 sites met the selection criteria for de-ethylatrazine, metolachlor, and triallate; 1 site was on the Red River, 2 sites were in Minnesota, and 2 sites were in North Dakota. All of the samples were collected between 1993 and 2000. The highest de-ethylatrazine and metolachlor concentrations were detected at Red River at Pembina (site 47, fig. 3). The highest triallate concentrations, however, were in samples from the Wild Rice River at Twin Valley (site 25, fig. 3). The Wild Rice River drains areas of woodland and cropland in the Moraine (fig. 2). Triallate is a pesticide that is typically used on barley, flax, and wheat (table 2) and it is applied more extensively in North Dakota than in Minnesota. Therefore, the high concen-trations in the Wild Rice watershed were not expected.
The five USGS sites that met selection criteria were combined to determine if concentrations of de-ethylatrazine, atrazine, metolachlor, and triallate showed seasonal patterns. Atrazine was included for comparison to its metabolite, de-ethylatrazine. Most pesticides are detected during the spring, with the exception of atrazine, which had the highest concen-trations during summer and early fall (fig. 12). Atrazine is typ-ically applied in spring when crops are planted (Christensen and Ziegler, 1998). Because atrazine is applied mostly to corn, the timing and method of application is likely different than
Nutrients, Suspended Sediment, and Pesticides in Water of the Red River Basin 29

30 Nutrients, Suspended Sediment, and Pesticides in Water of the Red River of the North Basin, 1990–2004
Table 5. Summary of the most frequently detected pesticides from 12 surface-water sites in the Red River of the North Basin, 1990–2004.
[U.S. Geological Survey data from National Water Information System; µg/L, micrograms per liter; <, less than]
PesticideConcentration range
(µg/L)
Median reported concentration
(µg/L)
Number of observations greater than reporting level
Number of observations
Acetochlor <0.002–0.585 <0.002 14 90
Alachlor <0.002–0.284 <0.002 16 145
Atrazine <0.001–0.54 0.016 19 145
Cyanazine <0.004–0.25 <0.004 47 144
De-ethylatrazine <0.002–0.056 0.004 89 144
EPTC <0.002–0.488 <0.002 54 143
Metolachlor <0.002–0.103 0.004 83 145
Simazine <0.005–0.07 <0.005 18 144
Triallate <0.001–0.21 <0.001 67 143
Triazine1 <0.1–0.7 <0.1 13 67
Trifluralin <0.002–0.132 <0.002 54 143
1Triazines are a group of pesticides, which include atrazine, cyanazine, and simazine.
Figure 12. Monthly distribution of pesticide concentrations for five selected U.S. Geological Survey stream sites (1990–2004): (A) de-ethylatrazine, (B) atrazine, (C) metolachlor, and (D) triallate.
DE-E
THYL
ATRA
ZIN
ECO
NCE
NTR
ATIO
N,
IN M
ICRO
GRAM
S PE
R LI
TER
ATRA
ZIN
E CO
NCE
NTR
ATIO
N,
IN M
ICRO
GRAM
S PE
R LI
TER
MET
OLAC
HLOR
CON
CEN
TRAT
ION
, IN
MIC
ROGR
AMS
PER
LITE
R
TRIA
LLAT
E CO
NCE
NTR
ATIO
N,
IN M
ICRO
GRAM
S PE
R LI
TER
0.6
0.5
0.4
0.3
0.2
0.1
0
0.06
0.05
0.04
0.03
0.02
0.01
0
0.12
0.1
0.08
0.06
0.04
0.02
0
0.25
0.2
0.15
0.1
0.05
0
Repo
rting
leve
lRe
porti
ng le
vel
Repo
rting
leve
lRe
porti
ng le
vel
JAN
UARY
FEBR
UARY
MAR
CH
APRI
L
MAY
JUN
E
JULY
AUGU
ST
SEPT
EMBE
R
OCTO
BER
NOV
EMBE
R
DECE
MBE
R
JAN
UARY
FEBR
UARY
MAR
CH
APRI
L
MAY
JUN
E
JULY
AUGU
ST
SEPT
EMBE
R
OCTO
BER
NOV
EMBE
R
DECE
MBE
R
Figure 12. Monthly distribution of pesticide concentrations for five selected U.S. Geological Survey stream sites (1990-2004): (A) de-ethylatrazine, (B) atrazine, (C) metolachlor, and (D) triallate.
1
4128
26
23
24
17
23
51
1412826
23
2517
23
5
1
1412
10
26
20
26
17
2351
1412826
2324
17
22
5
1
A B
C D
Number of observations
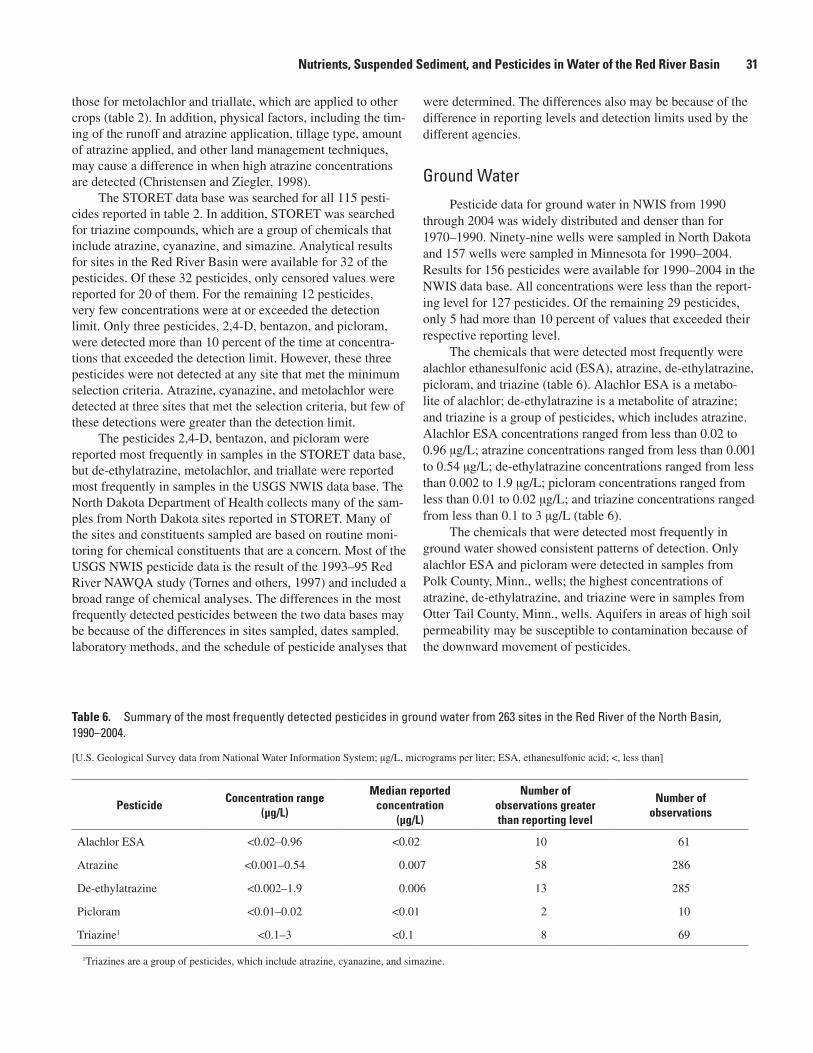
those for metolachlor and triallate, which are applied to other crops (table 2). In addition, physical factors, including the tim-ing of the runoff and atrazine application, tillage type, amount of atrazine applied, and other land management techniques, may cause a difference in when high atrazine concentrations are detected (Christensen and Ziegler, 1998).
The STORET data base was searched for all 115 pesti-cides reported in table 2. In addition, STORET was searched for triazine compounds, which are a group of chemicals that include atrazine, cyanazine, and simazine. Analytical results for sites in the Red River Basin were available for 32 of the pesticides. Of these 32 pesticides, only censored values were reported for 20 of them. For the remaining 12 pesticides, very few concentrations were at or exceeded the detection limit. Only three pesticides, 2,4-D, bentazon, and picloram, were detected more than 10 percent of the time at concentra-tions that exceeded the detection limit. However, these three pesticides were not detected at any site that met the minimum selection criteria. Atrazine, cyanazine, and metolachlor were detected at three sites that met the selection criteria, but few of these detections were greater than the detection limit.
The pesticides 2,4-D, bentazon, and picloram were reported most frequently in samples in the STORET data base, but de-ethylatrazine, metolachlor, and triallate were reported most frequently in samples in the USGS NWIS data base. The North Dakota Department of Health collects many of the sam-ples from North Dakota sites reported in STORET. Many of the sites and constituents sampled are based on routine moni-toring for chemical constituents that are a concern. Most of the USGS NWIS pesticide data is the result of the 1993–95 Red River NAWQA study (Tornes and others, 1997) and included a broad range of chemical analyses. The differences in the most frequently detected pesticides between the two data bases may be because of the differences in sites sampled, dates sampled, laboratory methods, and the schedule of pesticide analyses that
were determined. The differences also may be because of the difference in reporting levels and detection limits used by the different agencies.
Ground Water
Pesticide data for ground water in NWIS from 1990 through 2004 was widely distributed and denser than for 1970–1990. Ninety-nine wells were sampled in North Dakota and 157 wells were sampled in Minnesota for 1990–2004. Results for 156 pesticides were available for 1990–2004 in the NWIS data base. All concentrations were less than the report-ing level for 127 pesticides. Of the remaining 29 pesticides, only 5 had more than 10 percent of values that exceeded their respective reporting level.
The chemicals that were detected most frequently were alachlor ethanesulfonic acid (ESA), atrazine, de-ethylatrazine, picloram, and triazine (table 6). Alachlor ESA is a metabo-lite of alachlor; de-ethylatrazine is a metabolite of atrazine; and triazine is a group of pesticides, which includes atrazine. Alachlor ESA concentrations ranged from less than 0.02 to 0.96 µg/L; atrazine concentrations ranged from less than 0.001 to 0.54 µg/L; de-ethylatrazine concentrations ranged from less than 0.002 to 1.9 µg/L; picloram concentrations ranged from less than 0.01 to 0.02 µg/L; and triazine concentrations ranged from less than 0.1 to 3 µg/L (table 6).
The chemicals that were detected most frequently in ground water showed consistent patterns of detection. Only alachlor ESA and picloram were detected in samples from Polk County, Minn., wells; the highest concentrations of atrazine, de-ethylatrazine, and triazine were in samples from Otter Tail County, Minn., wells. Aquifers in areas of high soil permeability may be susceptible to contamination because of the downward movement of pesticides.
Table 6. Summary of the most frequently detected pesticides in ground water from 263 sites in the Red River of the North Basin, 1990–2004.
[U.S. Geological Survey data from National Water Information System; µg/L, micrograms per liter; ESA, ethanesulfonic acid; <, less than]
PesticideConcentration range
(µg/L)
Median reported concentration
(µg/L)
Number of observations greater than reporting level
Number of observations
Alachlor ESA <0.02–0.96 <0.02 10 61
Atrazine <0.001–0.54 0.007 58 286
De-ethylatrazine <0.002–1.9 0.006 13 285
Picloram <0.01–0.02 <0.01 2 10
Triazine1 <0.1–3 <0.1 8 69
1Triazines are a group of pesticides, which include atrazine, cyanazine, and simazine.
Nutrients, Suspended Sediment, and Pesticides in Water of the Red River Basin 31
32 Nutrients, Suspended Sediment, and Pesticides in Water of the Red River of the North Basin, 1990–2004
Of the pesticides most frequently detected, only atrazine and picloram have MCLs established by the USEPA (U.S. Environmental Protection Agency, 1996). One of 285 samples exceeded the atrazine MCL of 3 µg/L. None of the 11 piclo-ram samples exceeded the MCL of 0.5 µg/L.
There are few similarities between the most applied pes-ticides in Minnesota and North Dakota (table 2) and the most detected pesticides in the Red River Basin. This may be par-tially because table 2 includes all of the treated acreage, and thus, all of the basins in Minnesota and North Dakota, whereas tables 5 and 6 include only the Red River Basin. Crops grown and pesticides used in the Red River Basin are different than in the two States as a whole. Additionally, some pesticides, such as glyphosate, that were applied were not analyzed during 1990–2004 in the Red River Basin by the agencies that report data in NWIS or STORET.
Aside from the USGS NWIS data base, very little data existed for pesticides in ground water. STORET did not have ground-water data for most pesticides and the ND SWC also did not have ground-water pesticide data in their on-line data base. The MDA tested 18 ground water wells across Min-nesota during 2004 for 21 pesticides or pesticide metabolites (electronic data from Catherine O’Dell, Minnesota Pollution Control Agency, August 30, 2006). Fourteen of the 21 pesti-cides were not detected in any well. Acetochlor oxanilic acid (OXA) and atrazine were each detected in one well. Aceto-chlor ESA, de-ethylatrazine, and metolachlor OXA each were detected in two wells. Alachlor ESA was detected in 5 of 18 wells with an average concentration of 0.14 µg/L, and meto-lachlor ESA was detected in 4 of 18 wells with an average concentration of 0.19 µg/L.
Comparison to Historical DataBecause this report is an update of the 1994 report by
Tornes and Brigham, an attempt is made here to compare data from the 1970–1990 reporting period to that from the 1990–2004 reporting period. However, sampling schemes, methods, and sites sampled and median annual streamflow are different between the two reporting periods; therefore, a comparison of water-quality is difficult. Generally, however, a few consisten-cies and differences were evident.
For nitrogen compounds, samples from Pembina River surface-water sites had the highest nitrite plus nitrate con-centrations during both reporting periods. However, TKN concentrations also were high at these sites when compared to other Red River Basin sites during 1970–90; whereas TKN
concentrations at Pembina River sites during 1990–2004 were not substantially different than concentrations at other sites in the basin. During 1970–90 total phosphorus concentrations generally were highest at Red River sites, whereas during 1990–2004 total phosphorus concentrations generally were highest at Pembina River sites.
During 1970–90, three counties in North Dakota, Barnes, Griggs, and Steele, and only Otter Tail County in Minnesota had wells with nitrate concentrations greater than the 10 mg/L MCL. During 1990–2004, 18 counties in North Dakota and five counties in Minnesota had wells with nitrate concentra-tions greater than the MCL. However, considerably more sam-ples were collected during 1990–2004 than during 1970–90, thus making the probability of detecting concentrations that exceeded the MCL greater during 1990–2004.
For SSC, only 13 sites had sufficient data during 1970–90 (Tornes and Brigham, 1994, fig. 20), whereas data were avail-able for 43 sites during 1990–2004 (figs. 10 and 11). Pembina River sites had high SSC relative to other sites during both reporting periods.
The most notable differences between the two report-ing periods were for pesticides. This is because samples were analyzed for different pesticides during the two reporting periods and because different pesticides were detected. Differ-ent pesticides were in the data bases for a number of reasons, including changes in the crops grown, the availability and use of newly developed pesticides, the banning of some pesticides, and the loss of favor of some pesticides among farmers. Of the pesticides that were analyzed during both reporting periods, different pesticides were detected, in part, because of changes in analytical methods and reporting levels.
When research supports the negative effects of certain pesticides on human health and wildlife, the USEPA acts to ban the pesticides. Since the Federal Environmental Pesticide Control Act was implemented in 1972, certain pesticides have continued to be added to the list beginning with the banning of DDT in 1972. The banning of certain pesticides affects what chemicals are detected in water and also affects the differences between the historical data (Tornes and Brigham, 1994) and the data presented in this report.
None of the most frequently detected pesticides for which water samples were collected and analyzed by the USGS during 1970–90 were detected frequently during 1990–2004. Only one pesticide, 2,4-D, was detected in more than 10 per-cent of surface-water samples that were analyzed during the 1970–90 reporting period, compared to 11 pesticides, shown in table 5, that were detected in more than 10 percent of the samples analyzed during 1990–2004.
SummaryNutrient, suspended sediment, and pesticide data from
1990–2004 from the Red River of the North was compiled and summarized in this report, which serves as an update to the report, Nutrients, suspended sediment, and pesticides in waters of the Red River of the North Basin, Minnesota, North Dakota, and South Dakota, 1970–90. Water quality continues to be a concern for this mainly agricultural basin, and, therefore, the U.S. Geological Survey (USGS) and the Minnesota Pollution Control Agency (MPCA) cooperated to provide this update.
The Red River Basin is divided into the four physio-graphic areas, the Drift Prairie, Red River Valley Lake Plain, Lake-Washed Till Plain, and Moraine, based on topography and soils. These physiographic areas have some bearing on land use and, therefore, may be related to water quality. Sixty-six percent of the agricultural land in the basin is cropland. Nutrients and pesticides are applied to most of the crops in an effort to maximize production.
Fertilizer applications are greatest in Polk County, Minn. and Cass County, N. Dak., both of which border the main stem of the Red River. Manure application is greatest in Otter Tail County, Minn. Pesticides applied in the greatest abundance in Minnesota and North Dakota are 2,4-D, MCPA, and dicamba.
Streamflow varied widely throughout the basin during the 1990–2004 study period. For 19 of 22 streamflow sites, median annual streamflow during the study period exceeded the long-term average streamflow for the period of record at those sites. Streamflow at all four main-stem Red River sites exceeded long term average streamflows. High streamflows have substantial effect on water quality, especially in the spring when agricultural chemicals are applied and when there is no crop cover to hold the soil in place.
Although nutrients occur naturally in the environment, agricultural practices can increase their transport to natural waters, and transport may increase during storms. Nitrite plus nitrate concentrations ranged from 0.02 to 5.2 milligrams per liter at 23 USGS stream sampling sites and from less than 0.005 to 7.7 milligrams per liter at 23 USEPA STORET stream sites. Stream sites on the Pembina River, that drain a water-shed mainly in the Drift Prairie physiographic area, had the highest nitrite plus nitrate concentrations compared to other Red River Basin sites. All nitrite plus nitrate concentrations at USGS stream sites included in this report during 1990 through 2004 were less than the USEPA drinking water standard of 10 milligrams per liter. Total Kjeldahl nitrogen concentrations at USGS stream sites ranged from 0.1 to 7.5 milligrams per liter, whereas STORET stream sites had total Kjeldahl nitrogen concentrations ranging from 0.234 to 2.38 milligrams per liter.
Total phosphorus concentrations ranged from less than 0.005 to 4.14 milligrams per liter for USGS stream sites and from less than 0.018 to 1.44 mg/L for STORET stream sites. Pembina River sites had higher total phosphorus concentra-tions than surrounding sites. Soil characteristics or agricultural practices may cause more phosphorus to be transported to the
streams in the Drift Prairie physiographic area than to other streams. Dissolved phosphorus data were presented for USGS sites only, and concentrations ranged from 0.003 to 4.13 mil-ligrams per liter; dissolved phosphorus concentrations were highest in samples from the Bois de Sioux and Pembina River sites.
Ground-water samples for nutrients also were collected and measured by a number of agencies in the basin and are compiled and summarized in this report. The number of wells sampled in each county varied greatly and ranged from zero to more than 300.
Reported nitrate concentrations in ground water from North Dakota counties ranged from less than 0.023 to 113 milligrams per liter during 1990–2004. Sheridan County, in the Drift Prairie physiographic area, had the highest ground-water nitrate concentrations when compared to other well sites on the North Dakota side of the basin. Nitrate concentrations in ground water from Minnesota counties ranged from less than 0.005 to 133 milligrams per liter. The highest concentra-tions were in samples from in the Lake-Washed Till Plain and Moraine physiographic areas. Marshall and Otter Tail Counties in Minnesota had high fertilizer applications relative to other Minnesota counties in 2002, which may explain high nitrate concentrations in ground water; however, Sheridan County in North Dakota did not have high fertilizer application rates in 2002 compared to other North Dakota and Minnesota coun-ties. Although there appeared to be a correlation between fertilizer applications and ground water nitrate concentrations in Minnesota counties, there appeared to be little correlation between fertilizer applications and nitrate concentrations in ground water in North Dakota counties.
Suspended-sediment data were available for 48 surface-water sites in Minnesota, 31 sites in North Dakota, and 10 main-stem Red River sites. Median suspended-sediment concentrations ranged from about 4 to 706 milligrams per liter. The highest concentrations occurred in samples from the Pembina River, which is located in northern North Dakota in the Red River Valley Lake Plain and drains part of the Drift Prairie.
Pesticide data from 12 USGS stream sites in the Red River Basin were examined. Most of the 118 chemicals for which analyses were performed were either not detected in any sample or occurred below their respective reporting limits. De-ethylatrazine, which is a metabolite of atrazine, metolachlor, and triallate were detected most frequently at USGS stream sites. The highest de-ethylatrazine and metolachlor concentra-tions were detected at the Red River at Pembina. The highest triallate concentrations were detected at Wild Rice River at Twin Valley. The highest concentrations of these three pesti-cides were detected during the spring, in contrast to atrazine, for which the highest concentrations were detected during summer and early fall.
Some surface-water pesticide data were available in STORET. The most frequently detected pesticides for Red
Summary 33

34 Nutrients, Suspended Sediment, and Pesticides in Water of the Red River of the North Basin, 1990–2004
River Basin sites in the STORET data base were 2,4-D, benta-zon, and picloram.
The pesticide compounds detected most frequently in ground water were alachlor ESA, atrazine, de-ethylatrazine, picloram, and triazine at USGS-sampled well sites. Very little ground-water data were available from STORET. The USEPA has established MCLs for atrazine and picloram in drinking water of 0.003 and 0.5 milligrams per liter, respectively. None of the 11 picloram results exceeded this level, and one of the 285 ground-water atrazine samples exceeded the MCL.
When a comparison was made with the data presented in this report for 1990–2004 and the historical data during 1970–90, a few similarities as well as differences are evident. Pembina River surface-water sites continued to have the high-est nitrite plus nitrate and suspended-sediment concentrations during the 1990–2004 time period. However, the Pembina River also had the highest total phosphorus concentrations for 1990–2004, in contrast to 1970–90, when Red River sites generally had the higher total phosphorus concentrations than Pembina River sites.
The most notable differences between the two reporting periods were seen in the pesticides, partly because different pesticides were analyzed during 1970–90 and 1990–2004. None of the most frequently detected pesticides or metabolites sampled and analyzed by the U.S. Geological Survey or avail-able in STORET during 1990–2004 were detected frequently during 1970–90, with the exception of 2,4-D.
References Cited
Anderson, J.R., 1967, Major land uses in the United States, in National Atlas of the United States of America, U.S. Geo-logical Survey, 1970: Washington, D.C., variously paged.
Bourne, Alexandra, Armstrong, Nicole, and Jones, Geoff, 2002, A preliminary estimate of total nitrogen and total phosphorus loading to streams in Manitoba, Canada: Water Quality Management Section, Manitoba Conservation Report No. 2002–04, 49 p.
Campbell, Neil, D’Arcy, B.J., Frost, Alan, Novotny, Vladimir, and Sansom, Anne, 2004, Diffuse Pollution—An Introduc-tion to the Problems and Solutions: London, IWA Publish-ing, 322 p.
Caraco, N.F., 1995, Influence of human populations on P transfers to aquatic systems: a regional scale study using large rivers in Tiessen, Holm, ed., Phosphorus in the Global Environment: New York, John Wiley and Sons, Ltd, p. 235–244.
Christensen, V.G., Graham, J.L., Milligan, C.R., Pope, L.M., and Ziegler, A.C., 2006, Water quality and relation to taste-and-odor compounds in the North Fork Ninnescah River and Cheney Reservoir, south-central Kansas, 1997–2003: U.S. Geological Survey Scientific Investigations Report 2006–5095, 43 p.
Christensen, V.G., and Pope, L.M., 1997, Occurrence of dis-solved solids, nutrients, atrazine, and fecal coliform bacteria during low flow in the Cheney Reservoir Watershed, south-central Kansas, 1996: U.S. Geological Survey Water-Resources Investigations Report 97–4153, 13 p.
Christensen, V.G., and Ziegler, A.C., 1998, Atrazine in source water intended for artificial ground-water recharge, south-central Kansas: U.S. Geological Survey Fact Sheet FS–074–098, 4 p.
Cowdery, T.K., 1995, Similar agricultural areas, different ground-water quality: Red River of the North Basin, 1993–95: U.S. Geological Survey Open-File Report 95–441, 4 p.
Devils Lake Basin Joint Water Resources Board and North Dakota State Water Commission, 2006, 2006 Devils Lake Basin Water Management Plan: Devils Lake, N. Dak., 48 p.
Drever, J.I., 1988, The geochemistry of natural waters: Engle-wood Cliffs, New Jersey, Prentice Hall, Inc., 437 p.
Edwards, T.K., and Glysson, G.D., eds., 1988, Field methods for measurement of fluvial sediment: U.S. Geological Sur-vey Open-File Report 86–531, 118 p.
Enz, J.W., 2003, North Dakota topographic, climatic, and agricultural overview: University of North Dakota, accessed June 9, 2006 at http://www.soilsci.ndsu.nodak.edu/ndawn/Reports/ndclimatedescription.pdf.
Flegal, A.R., and Cole, K.H., 1989, Discussion on “Trends in lead concentrations in major U.S. rivers and their relation to historical changes in gasoline-lead consumption,” by Rich-ard B. Alexander and Richard A. Smith: Water Resources Bulletin, v. 25, no. 6, p. 1275–1277.
Gianessi, L.P., and Marcelli, M.B., 2000, Pesticide use in U.S. crop production—1997: Washington, D.C., National Center for Food and Agricultural Policy, 101 p.
Gilliom, R.J., Barbash, J.E., Crawford, C.G., Hamilton, P.A., Martin, J.D., Nakagaki, Naomi, Howel, L.H., Scott, J.C., Stackelberg, P.E., Thelin, G.P., and Wolock, D.M., 2006, The quality of our Nation’s waters—Pesticides in the Nation’s streams and ground water:1992–2001: U.S. Geo-logical Survey Circular 1291, 172 p.

Godon, Vincent, and Godon, Nancy, 2002, Fargo, North Dakota Climate: Grand Forks, N. Dak., National Weather Service, 165 p.
Gray, J.R., Glysson, G.D., Turcios, L.M., and Schwartz, G.E., 2000, Comparability of suspended sediment concentration and total suspended solids data: U.S. Geological Survey Water-Resources Investigations Report 00–4191, 14 p.
Helsel, D.R., and Hirsch, R.M., 1992, Statistical methods in water resources: New York, Elsevier, 4th Impression, 522 p.
Hem, J.D., 1992, Study and interpretation of chemical char-acteristics of natural water: U.S. Geological Survey Water Supply Paper 2254, 263 p.
Horowitz, A.J., Demas, C.R., Fitzgerald, K.K., Miller, T. L., and Rickert, D.A., 1994, U.S. Geological Survey protocol for the collection and processing of surface-water samples for the subsequent determination of inorganic constituents in filtered water: U.S. Geological Survey Open-File Report 94–539, 57 p.
Macek-Rowland, K.M., 2001, 2001 floods in the Red River of the North Basin in Eastern North Dakota and Western Min-nesota: U.S. Geological Survey Open-File Report 01–169, 8 p.
Minnesota Department of Agriculture and Minnesota Agricul-tural Statistics Service, 2005, 2003 Pesticide usage on four major Minnesota crops: Minnesota Department of Agricul-ture, accessed June 12, 2007, at http://www.mda.state.mn.us/news/publications/chemfert/pesticideuse.2003.pdf, 142 p.
Minnesota, State of, 2005, Phosphorus turf fertilizer use restrictions: Office of the Revisor of Statutes, State of Min-nesota, Ch. 18, Art. C, Sec. 60.
Owenby, James, Heim, Richard, Jr., Burgin, Michael, Ezell, Devoyd, 1992, Climatography of the U.S. No. 81—Supple-ment #3—Maps of annual 1961–1990 normal temperature, precipitation, and degree days: National Oceanic and Atmo-spheric Administration, various pagination.
Paakh, Bruce, Goeken, Wayne, and Halvorson, Danni, 2006, State of the Red River of the North—Assessment of the 2003 and 2004 water quality data for the Red River and its major Minnesota tributaries: Minnesota Pollution Control Agency and Red River Watershed Management Board, 104 p.
Pritt, J.W., and Raese, J.W., eds., 1995, Quality assurance/quality control manual—National Water Quality Labora-tory: U.S. Geological Survey Open-File Report 95–443, 35 p.
Red River Basin Board, 2001, Inventory Team Report—Water Quality: Moorhead, Minn., Red River Basin Board, 86 p.
Reid, G.K., and Wood, R.D., 1976, Ecology of inland waters and estuaries: New York, D. Van Nostrand Co., 485 p.
River Keepers, 2003, Red River Basin Water Quality Moni-toring Volunteer Manual, 38 p., available at http://www.riverkeepers.org/pdf/water_quality_manual01.pdf and http://www.riverkeepers.org/pdf/water_quality_manual02.pdf accessed October 6, 2006.
Stoner, J.D., Lorenz, D.L., Wiche, G.J., and Goldstein, R.M., 1993, Red River of the North Basin, Minnesota, North Dakota, and South Dakota: Water Resources Bulletin, vol. 29, no. 4, pp. 575–615.
Stoner, J.D., Lorenz, D.L., Goldstein, R.M., Brigham, M.E., and Cowdery, T.K., 1998, Water quality of the Red River of the North Basin, Minnesota, North Dakota, and South Dakota, 1992–95: U.S. Geological Survey Circular 1169, 33 p.
Timme, P.J., 1995, National Water Quality Laboratory 1995 services catalog: U.S. Geological Survey Open-File Report 95–352, 120 p.
Tornes, L.H., and Brigham, M.E., 1994, Nutrients, suspended sediment, and pesticides in waters of the Red River of the North Basin, Minnesota, North Dakota, and South Dakota, 1970-90: U.S. Geological Survey Water-Resources Investi-gations Report 93–4231, 62 p.
Tornes, L.H., and Brigham, M.E., 1995, Pesticide amounts are small in streams in the Red River of the North Basin, 1993-94: U.S. Geological Survey Open-File Report 95–283, 2 p.
Tornes, L.H., Brigham, M.E., and Lorenz, D.L., 1997, Nutri-ents, suspended sediment, and pesticides in streams in the Red River of the North Basin, Minnesota, North Dakota, and South Dakota, 1993–95: U.S. Geological Survey Water-Resources Investigations Report 97–4053, 70 p.
U.S. Department of Agriculture, National Agricultural Statis-tics Service, 2002, 2002 Census of Agriculture: U.S. Bureau of Census, accessed January 16, 2006 at http://www.nass.usda.gov/Census_of_Agriculture/index.asp
U.S. Environmental Protection Agency, 1986, Quality criteria for water, 1986: U.S. Environmental Protection Agency Report 440/5–86–0001, unnumbered pages.
U.S. Environmental Protection Agency, 1996, Drinking water regulations and health advisories: U.S. Environmental Pro-tection Agency, various pagination.
References Cited 35

36 Nutrients, Suspended Sediment, and Pesticides in Water of the Red River of the North Basin, 1990–2004
U.S. Environmental Protection Agency, 1997, Guidelines establishing test procedures for the analysis of pollut-ants (App. B, Part 136, Definition and procedures for the determination of the method detection limit): U.S. Code of Regulations, Title 40, revised July 1, 1997, p. 265–267.
U.S. Environmental Protection Agency, 2000, Nutrient criteria technical guidance manual—rivers and streams: U.S. Environmental Protection Agency Report 822/B–00–0002, various pagination.
U.S. Geological Survey, 1999, The quality of our Nation’s waters—Nutrients and pesticides: U.S. Geological Survey Circular 1225, 82 p.
U.S. Geological Survey, 2001, 2001 Floods in the Red River of the North Basin in eastern North Dakota and western Minnesota: U.S. Geological Survey Open-File Report 01–169, 7 p.
Vecchia, A.V., 2005, Water-quality trend analysis and sam-pling design for streams in the Red River of the North Basin, Minnesota, North Dakota, and South Dakota, 1970–2001: U.S. Geological Survey Scientific Investiga-tions Report 2005–5224, 54 p.
Ward, J.R., and Harr, C.A., eds., 1990, Methods for collection and processing of surface-water and bed-material samples for physical and chemical analysis: U.S. Geological Survey Open-File Report 90–140, 71 p.
Wershaw, R.L., Fishman, M.J., Grabbe, R.R., and Lowe, L.E., eds., 1987, Methods for determination of organic substances in water and fluvial sediments: U.S. Geological Survey Techniques of Water Resources Investigations, book 5, chap. A3, 80 p.
Zollinger, R.K., Glogoza, P., McMullen, M.P., Bradley, C.A., Dexter, A.G., Knopf, David, Wilson, Eric, DeJong, Thomas, and Meyer, William, 2006, Pesticide use and pest manage-ment practices in North Dakota 2004: Fargo, N. Dak., North Dakota State University, 39 p.

Christensen, V.G.—N
utrients, Suspended Sediment, and Pesticides in W
ater of the Red River of the North B
asin, Minnesota and N
orth Dakota, 1990–2004—
Scientific Investigations Report 2007–5065
Printed on recycled paper