Embed Size (px)
Citation preview
NutritionChallenges in thePreschool Years
Alice Lenihan, MPH, RD, LDN
Branch Head
Nutrition Services Branch
Division of Public Health
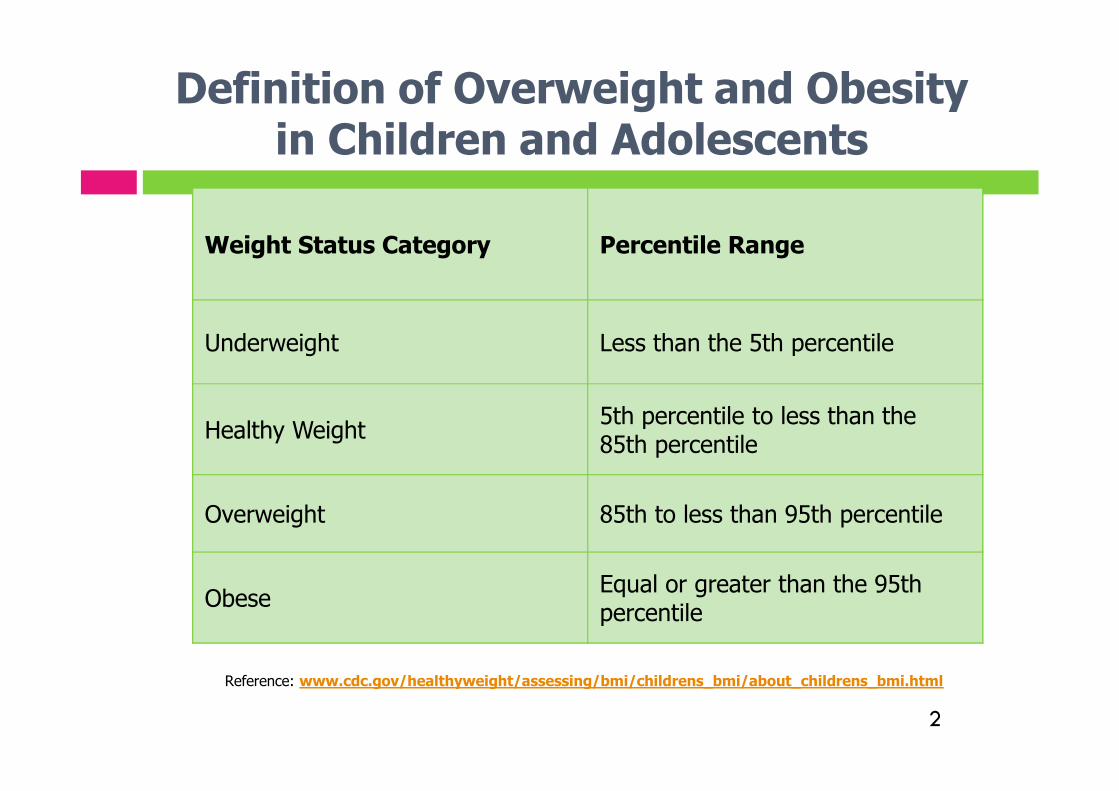
Definition of Overweight and Obesityin Children and Adolescents
Weight Status Category Percentile Range
Underweight Less than the 5th percentile
Healthy Weight5th percentile to less than the85th percentile
Overweight 85th to less than 95th percentile
ObeseEqual or greater than the 95thpercentile
Reference: www.cdc.gov/healthyweight/assessing/bmi/childrens_bmi/about_childrens_bmi.html
2
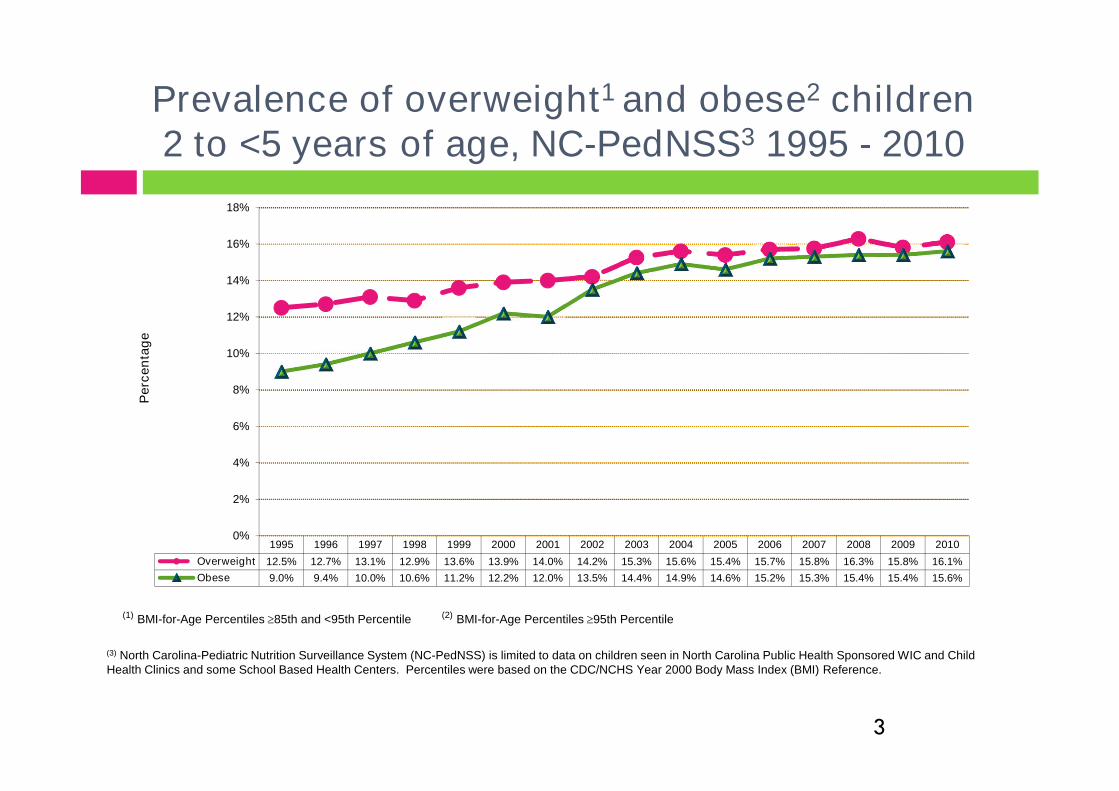
Prevalence of overweight1 and obese2 children2 to <5 years of age, NC-PedNSS3 1995 - 2010
1995 1996 1997 1998 1999 2000 2001 2002 2003 2004 2005 2006 2007 2008 2009 2010
Overweight 12.5% 12.7% 13.1% 12.9% 13.6% 13.9% 14.0% 14.2% 15.3% 15.6% 15.4% 15.7% 15.8% 16.3% 15.8% 16.1%
Obese 9.0% 9.4% 10.0% 10.6% 11.2% 12.2% 12.0% 13.5% 14.4% 14.9% 14.6% 15.2% 15.3% 15.4% 15.4% 15.6%
0%
2%
4%
6%
8%
10%
12%
14%
16%
18%
Pe
rce
nta
ge
(3) North Carolina-Pediatric Nutrition Surveillance System (NC-PedNSS) is limited to data on children seen in North Carolina Public Health Sponsored WIC and ChildHealth Clinics and some School Based Health Centers. Percentiles were based on the CDC/NCHS Year 2000 Body Mass Index (BMI) Reference.
(2) BMI-for-Age Percentiles 95th Percentile(1) BMI-for-Age Percentiles 85th and <95th Percentile
3
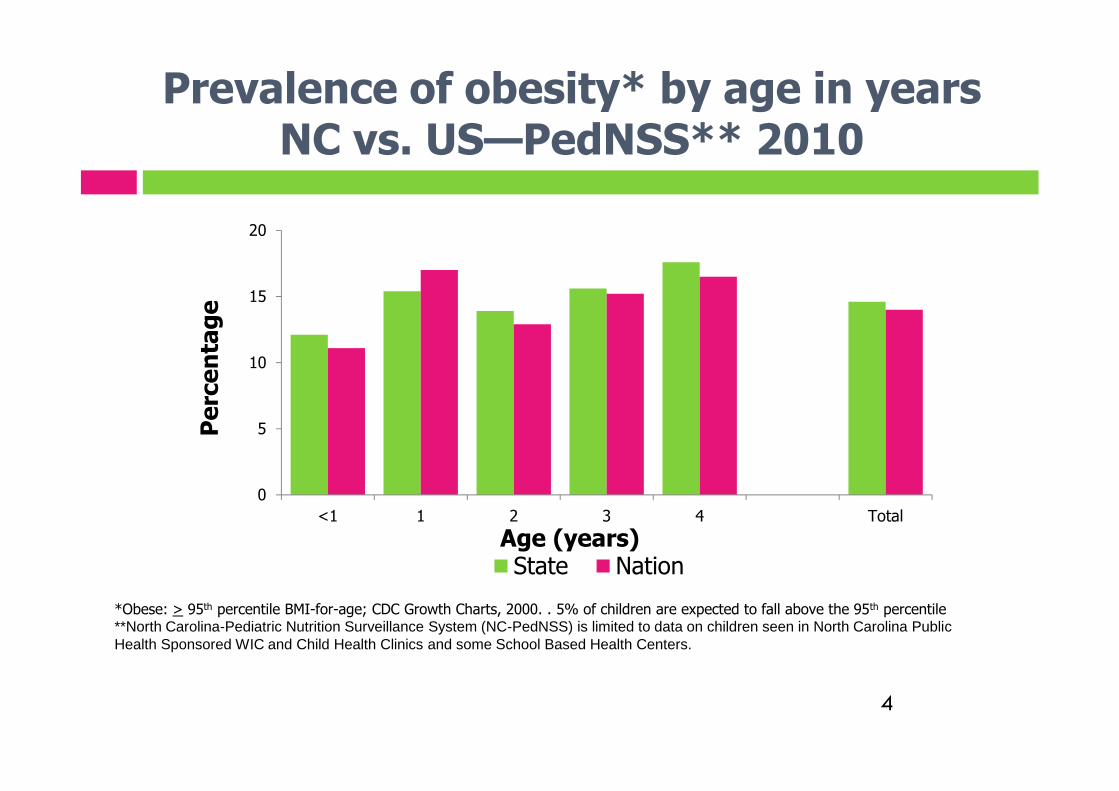
Prevalence of obesity* by age in yearsNC vs. US—PedNSS** 2010
0
5
10
15
20
<1 1 2 3 4 Total
Pe
rce
nta
ge
Age (years)State Nation
*Obese: > 95th percentile BMI-for-age; CDC Growth Charts, 2000. . 5% of children are expected to fall above the 95th percentile**North Carolina-Pediatric Nutrition Surveillance System (NC-PedNSS) is limited to data on children seen in North Carolina PublicHealth Sponsored WIC and Child Health Clinics and some School Based Health Centers.
4
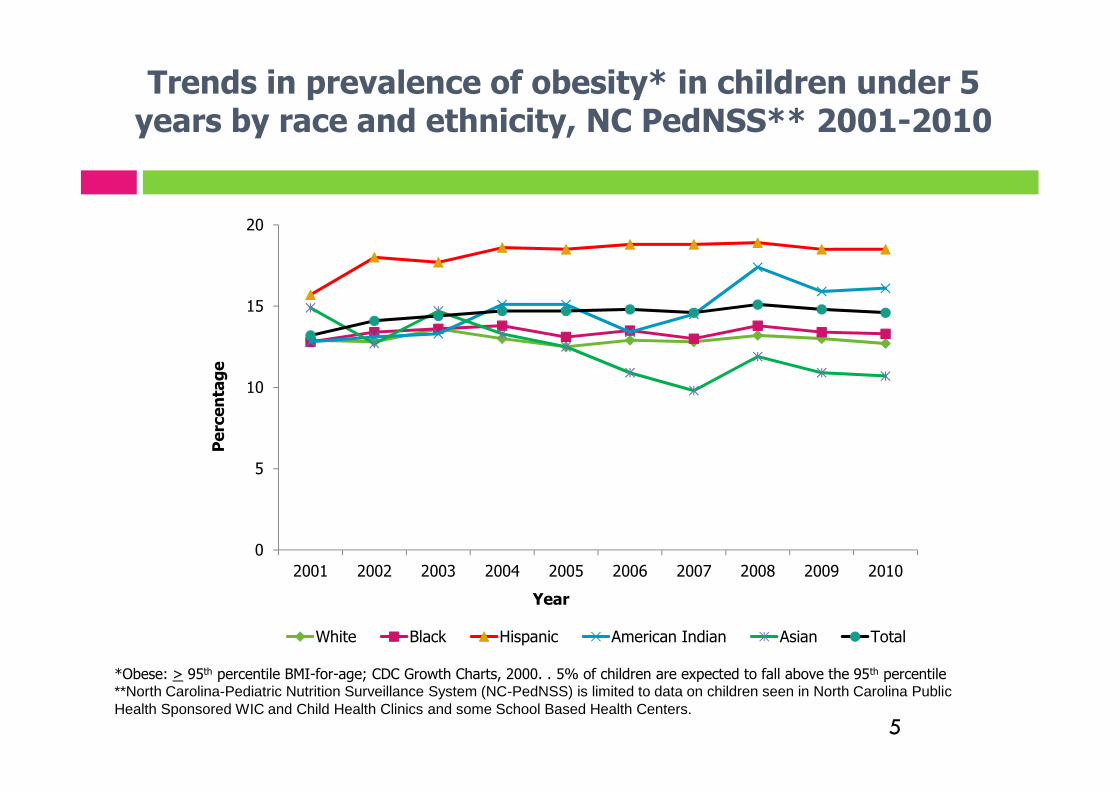
Trends in prevalence of obesity* in children under 5years by race and ethnicity, NC PedNSS** 2001-2010
0
5
10
15
20
2001 2002 2003 2004 2005 2006 2007 2008 2009 2010
Pe
rce
nta
ge
Year
White Black Hispanic American Indian Asian Total
*Obese: > 95th percentile BMI-for-age; CDC Growth Charts, 2000. . 5% of children are expected to fall above the 95th percentile**North Carolina-Pediatric Nutrition Surveillance System (NC-PedNSS) is limited to data on children seen in North Carolina PublicHealth Sponsored WIC and Child Health Clinics and some School Based Health Centers.
5
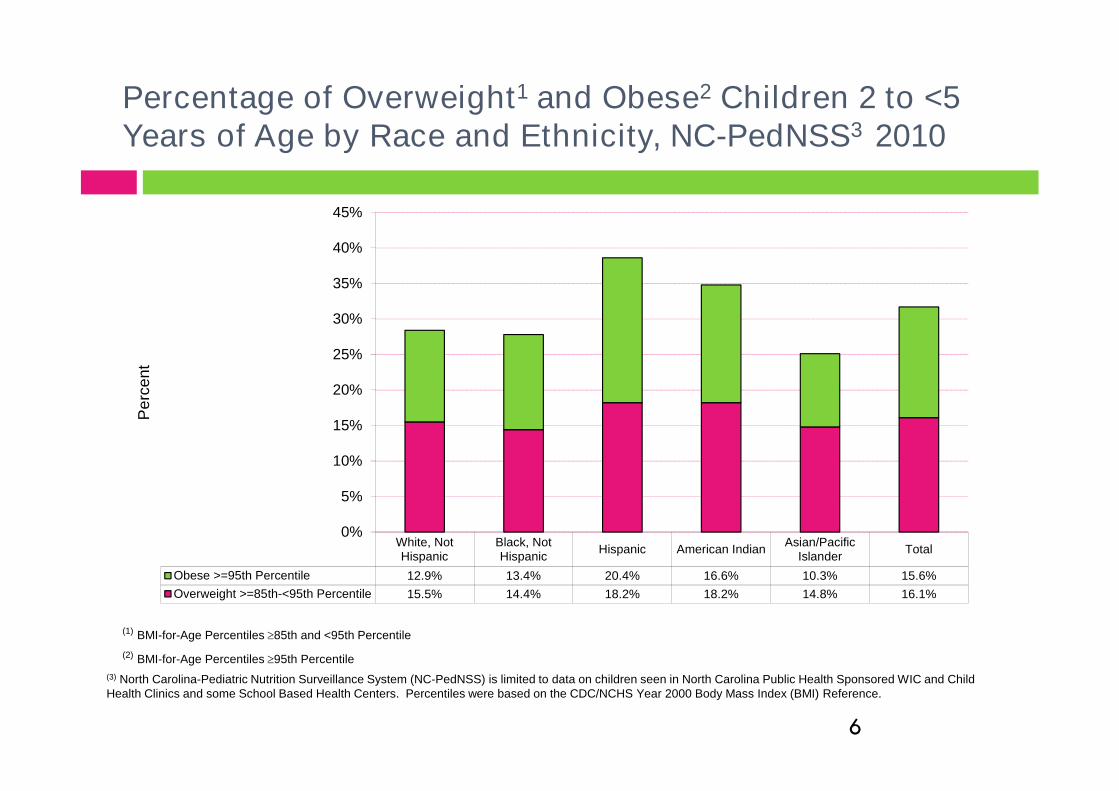
Percentage of Overweight1 and Obese2 Children 2 to <5Years of Age by Race and Ethnicity, NC-PedNSS3 2010
White, NotHispanic
Black, NotHispanic
Hispanic American IndianAsian/Pacific
IslanderTotal
Obese >=95th Percentile 12.9% 13.4% 20.4% 16.6% 10.3% 15.6%
Overweight >=85th-<95th Percentile 15.5% 14.4% 18.2% 18.2% 14.8% 16.1%
0%
5%
10%
15%
20%
25%
30%
35%
40%
45%
Pe
rce
nt
(3) North Carolina-Pediatric Nutrition Surveillance System (NC-PedNSS) is limited to data on children seen in North Carolina Public Health Sponsored WIC and ChildHealth Clinics and some School Based Health Centers. Percentiles were based on the CDC/NCHS Year 2000 Body Mass Index (BMI) Reference.
(2) BMI-for-Age Percentiles 95th Percentile
(1) BMI-for-Age Percentiles 85th and <95th Percentile
6
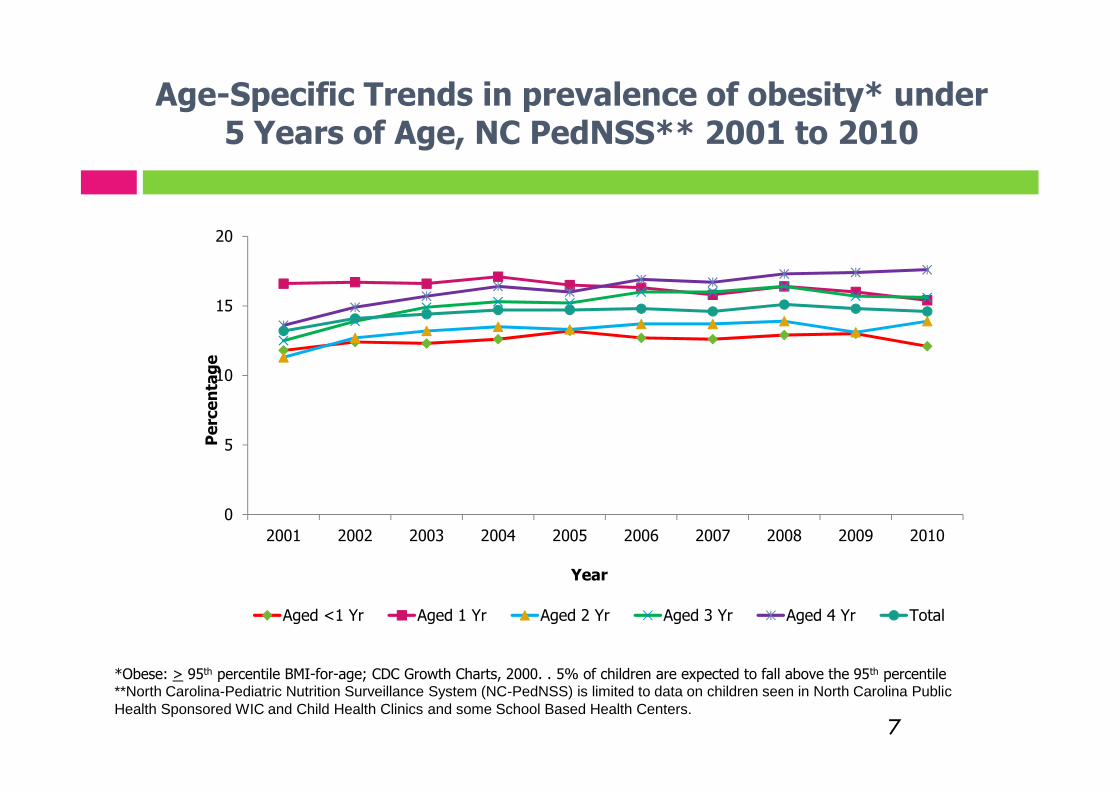
Age-Specific Trends in prevalence of obesity* under5 Years of Age, NC PedNSS** 2001 to 2010
0
5
10
15
20
2001 2002 2003 2004 2005 2006 2007 2008 2009 2010
Pe
rce
nta
ge
Year
Aged <1 Yr Aged 1 Yr Aged 2 Yr Aged 3 Yr Aged 4 Yr Total
*Obese: > 95th percentile BMI-for-age; CDC Growth Charts, 2000. . 5% of children are expected to fall above the 95th percentile**North Carolina-Pediatric Nutrition Surveillance System (NC-PedNSS) is limited to data on children seen in North Carolina PublicHealth Sponsored WIC and Child Health Clinics and some School Based Health Centers.
7
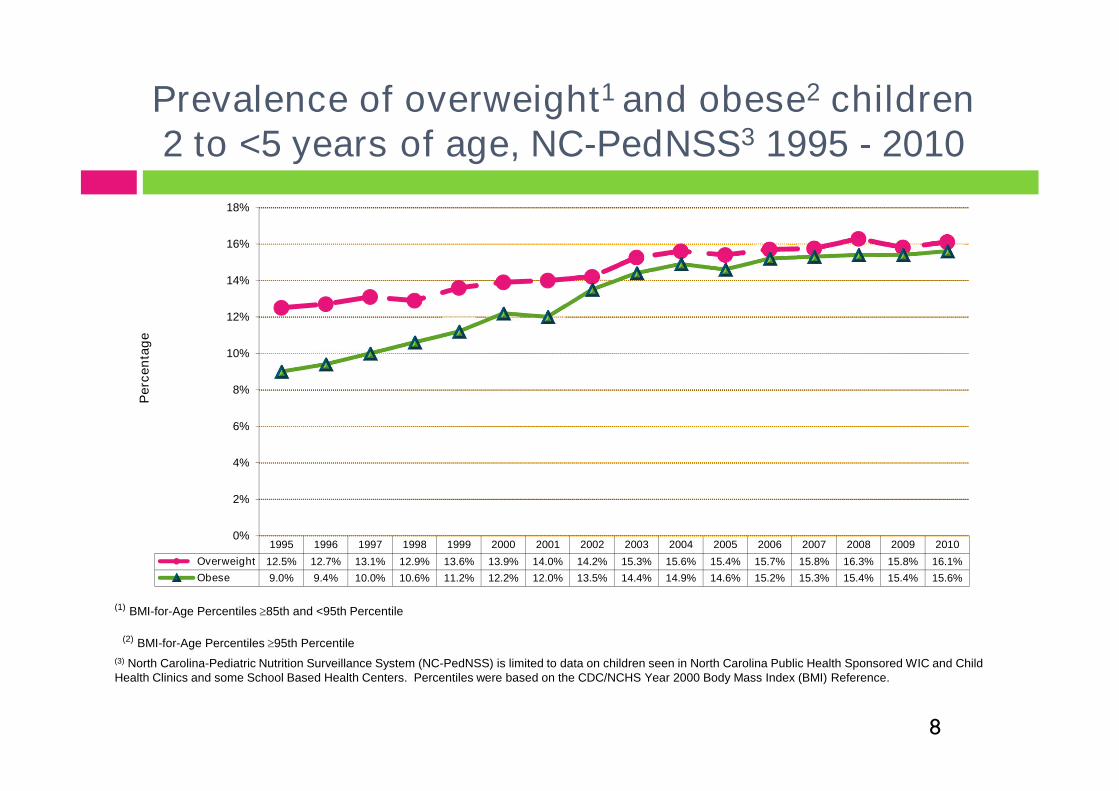
Prevalence of overweight1 and obese2 children2 to <5 years of age, NC-PedNSS3 1995 - 2010
1995 1996 1997 1998 1999 2000 2001 2002 2003 2004 2005 2006 2007 2008 2009 2010
Overweight 12.5% 12.7% 13.1% 12.9% 13.6% 13.9% 14.0% 14.2% 15.3% 15.6% 15.4% 15.7% 15.8% 16.3% 15.8% 16.1%
Obese 9.0% 9.4% 10.0% 10.6% 11.2% 12.2% 12.0% 13.5% 14.4% 14.9% 14.6% 15.2% 15.3% 15.4% 15.4% 15.6%
0%
2%
4%
6%
8%
10%
12%
14%
16%
18%
Pe
rce
nta
ge
(3) North Carolina-Pediatric Nutrition Surveillance System (NC-PedNSS) is limited to data on children seen in North Carolina Public Health Sponsored WIC and ChildHealth Clinics and some School Based Health Centers. Percentiles were based on the CDC/NCHS Year 2000 Body Mass Index (BMI) Reference.
(2) BMI-for-Age Percentiles 95th Percentile
(1) BMI-for-Age Percentiles 85th and <95th Percentile
8

Opportunities for NC to ImpactPreschool Nutrition and Obesity
9
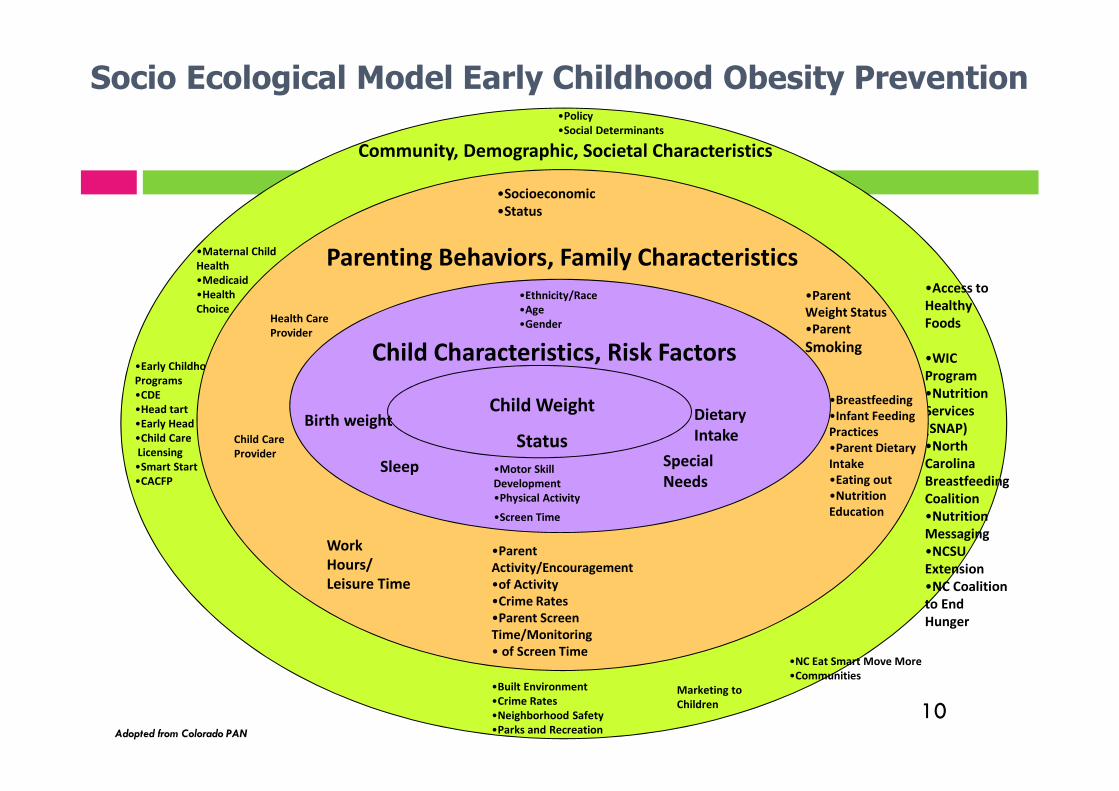
•Built Environment•Crime Rates•Neighborhood Safety•Parks and Recreation
Marketing toChildren
•NC Eat Smart Move More•Communities
•Access toHealthyFoods
•WICProgram•NutritionServices(SNAP)•NorthCarolinaBreastfeedingCoalition•NutritionMessaging•NCSUExtension•NC Coalitionto EndHunger
•Early ChildhoodPrograms•CDE•Head tart•Early Head Start•Child CareLicensing
•Smart Start•CACFP
•Maternal ChildHealth•Medicaid•HealthChoice
•Policy•Social Determinants
Community, Demographic, Societal Characteristics
•ParentActivity/Encouragement•of Activity•Crime Rates•Parent ScreenTime/Monitoring• of Screen Time
WorkHours/Leisure Time
Child CareProvider
Health CareProvider
•Breastfeeding•Infant FeedingPractices•Parent DietaryIntake•Eating out•NutritionEducation
•ParentWeight Status•Parent
Smoking
•Socioeconomic•Status
Parenting Behaviors, Family Characteristics
•Motor SkillDevelopment•Physical Activity
•Screen Time
SpecialNeeds
DietaryIntake
Birth weight
•Ethnicity/Race•Age•Gender
Sleep
Child Weight
Status
Child Characteristics, Risk Factors
Adopted from Colorado PAN
Socio Ecological Model Early Childhood Obesity Prevention
10
Child and Adult Care FoodProgram (CACFP)
Child Care Centers- 2,100+ Centers
Family Day Care Homes- 2,700+ homes
On going staff training and support of physicalactivity licensing requirements.
11
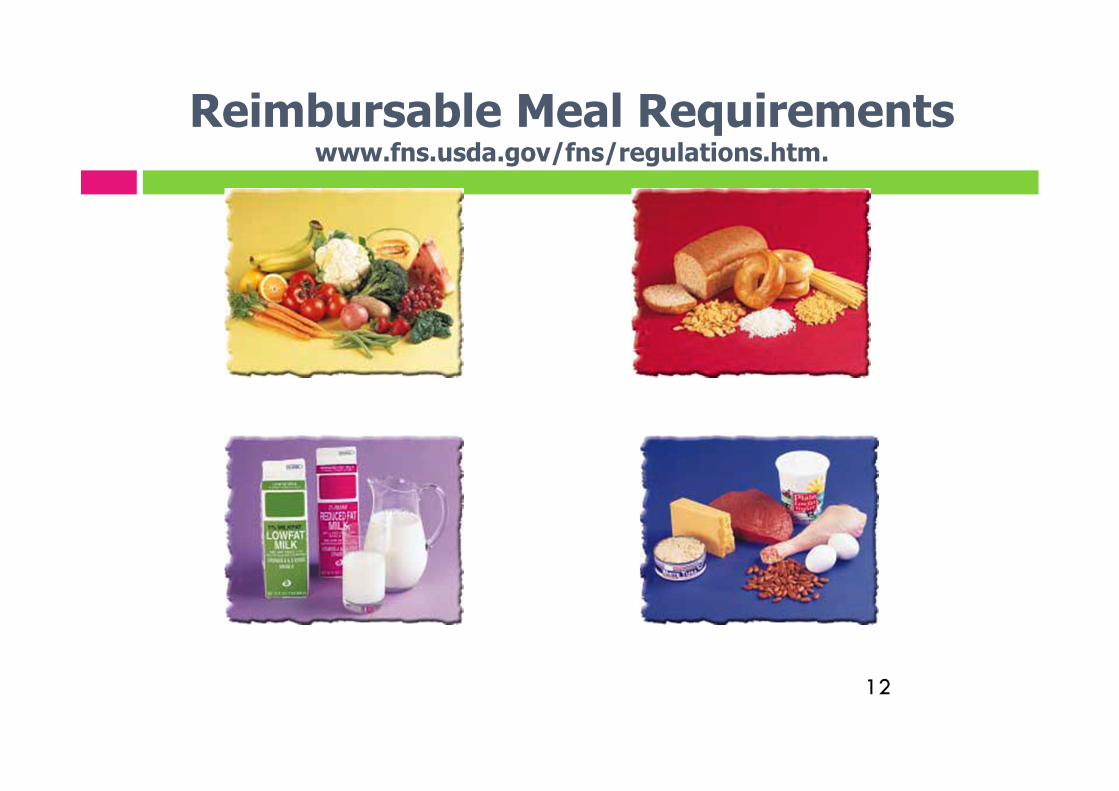
Reimbursable Meal Requirementswww.fns.usda.gov/fns/regulations.htm.
12
CACFP Nutrition Requirements
CACFP nutrition requirements are food basednot nutrient based
Daily requirement for food categories andamounts
Established by the U.S. Department ofAgriculture
13
General Assembly Obesity Task ForceRecommendations
HB 1726
Division of Child Development shall consider anumber of nutrition standards.
Division of Public Health will examine currentstandards and report to the General Assembly.
Limit or prohibit serving of sweetenedbeverages, other than 100% fruit juice tochildren of any age.
15
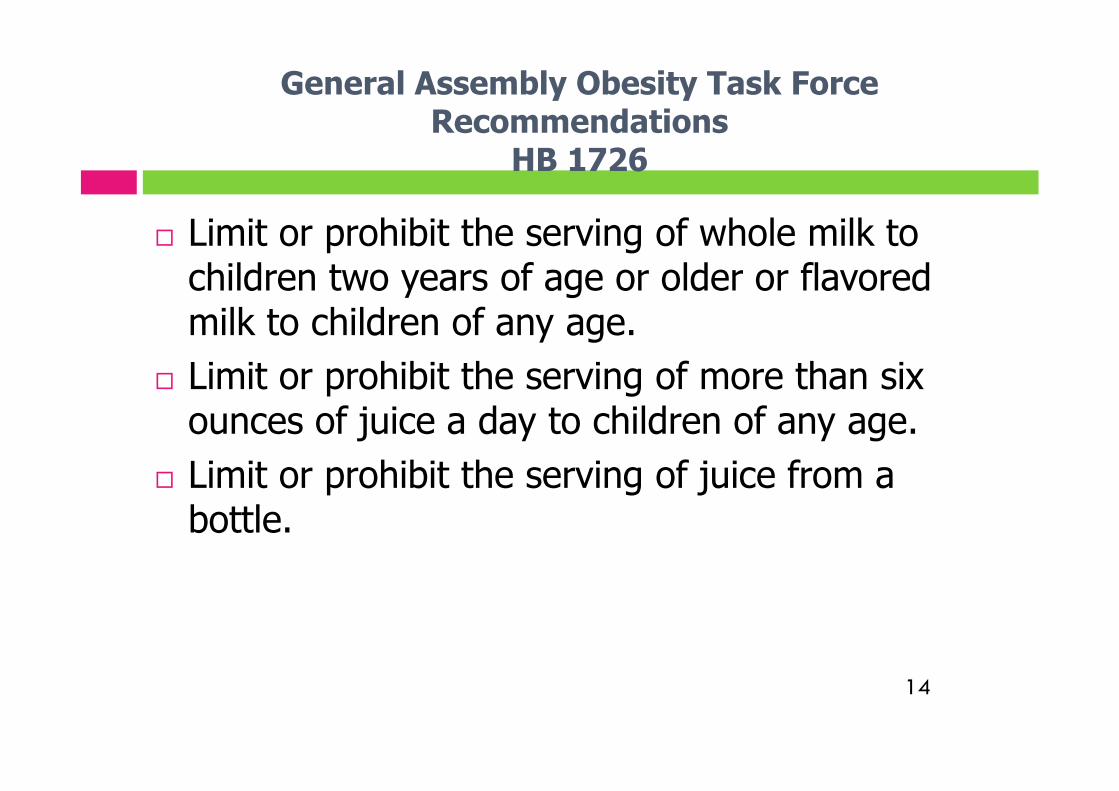
General Assembly Obesity Task ForceRecommendations
HB 1726
Limit or prohibit the serving of whole milk tochildren two years of age or older or flavoredmilk to children of any age.
Limit or prohibit the serving of more than sixounces of juice a day to children of any age.
Limit or prohibit the serving of juice from abottle.
14
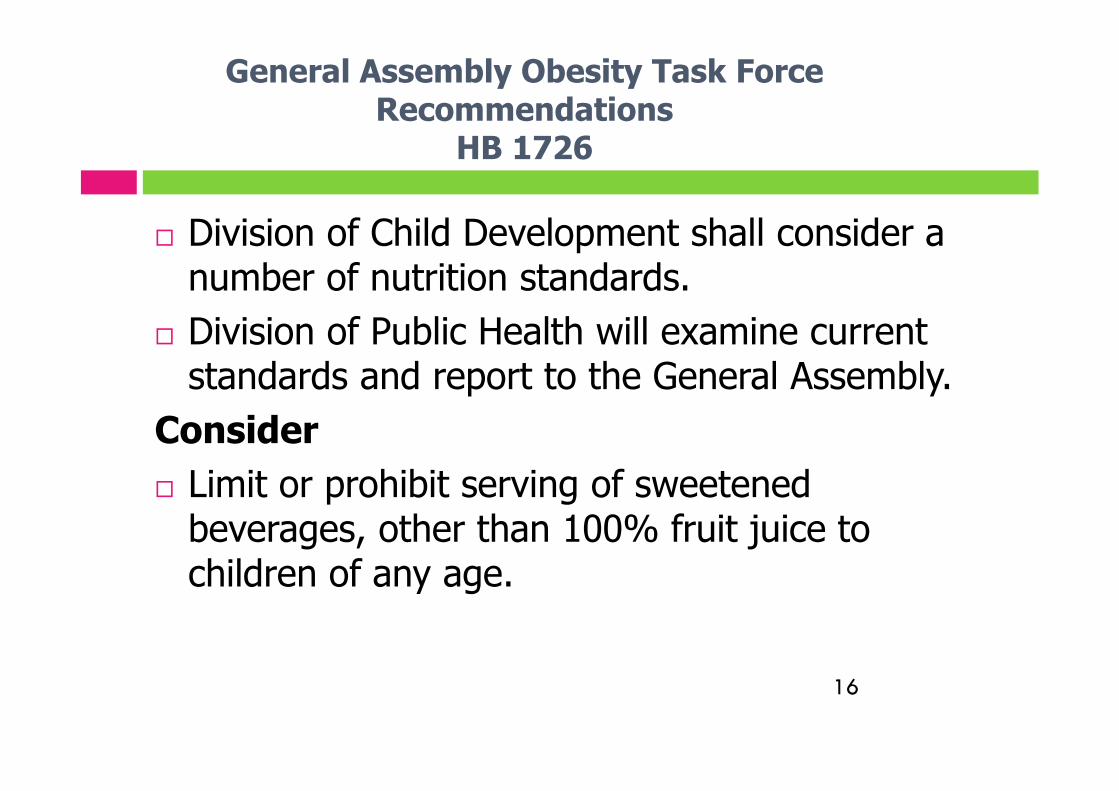
General Assembly Obesity Task ForceRecommendations
HB 1726
Division of Child Development shall consider anumber of nutrition standards.
Division of Public Health will examine currentstandards and report to the General Assembly.
Consider
Limit or prohibit serving of sweetenedbeverages, other than 100% fruit juice tochildren of any age.
16
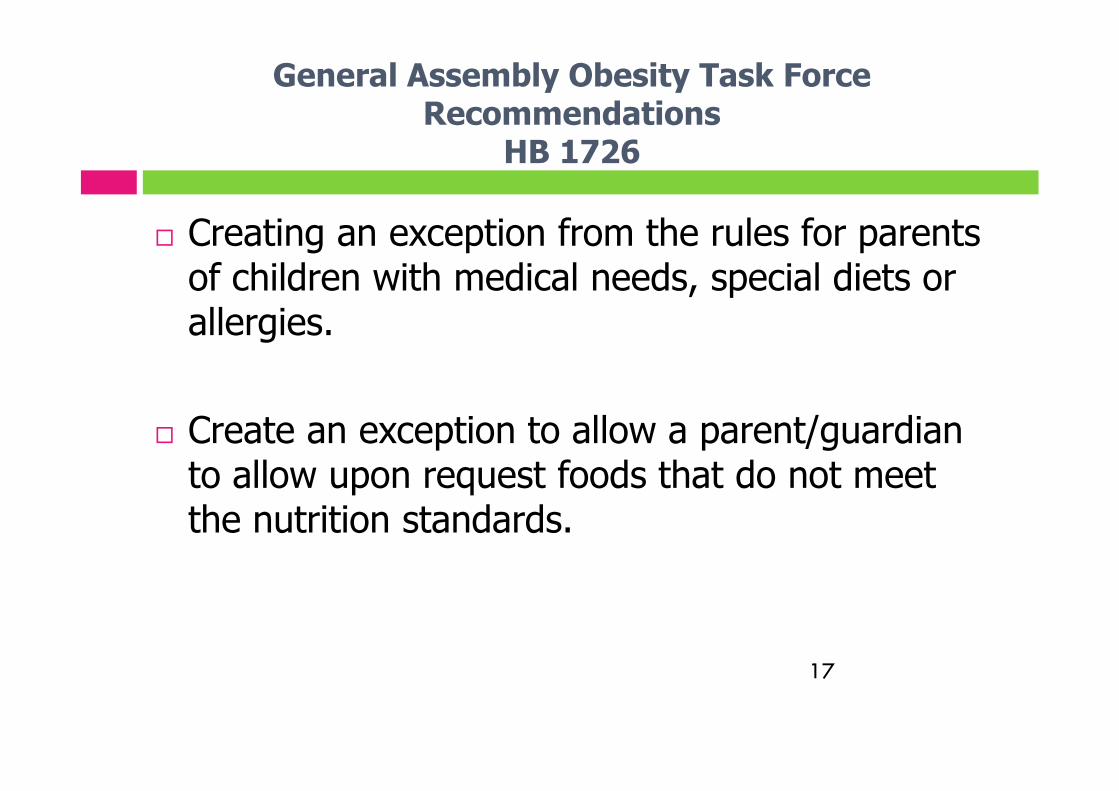
General Assembly Obesity Task ForceRecommendations
HB 1726
Creating an exception from the rules for parentsof children with medical needs, special diets orallergies.
Create an exception to allow a parent/guardianto allow upon request foods that do not meetthe nutrition standards.
17
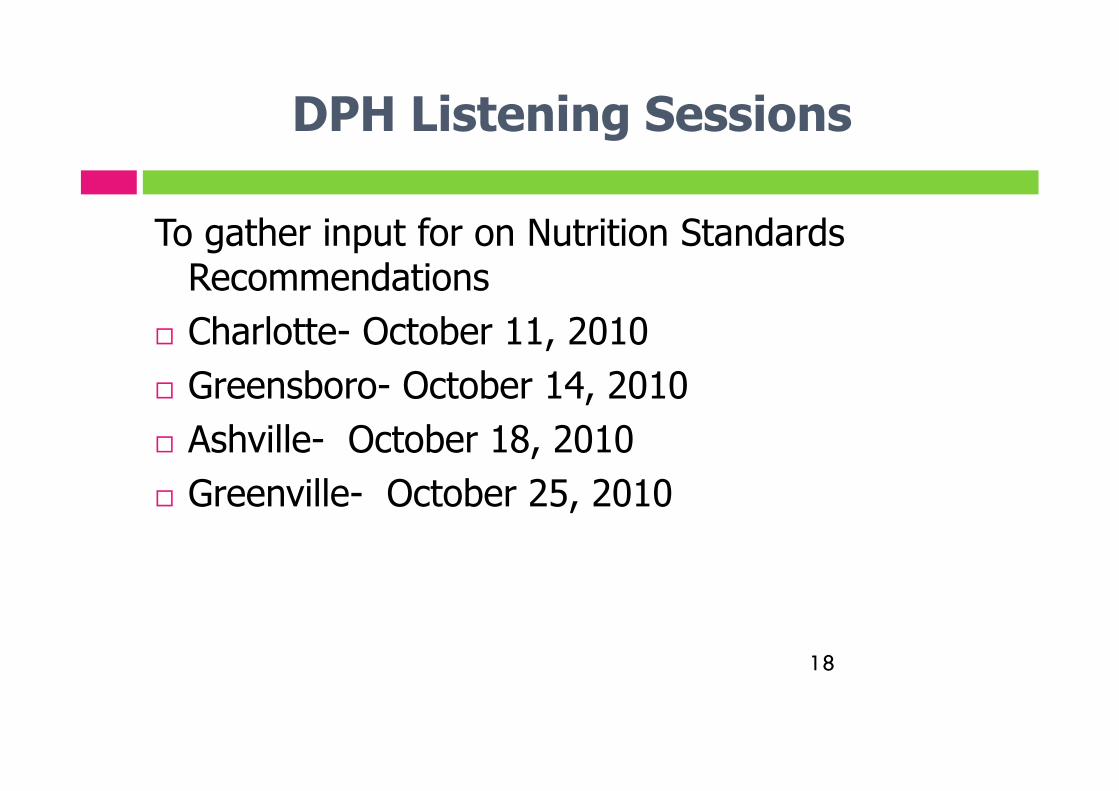
DPH Listening Sessions
To gather input for on Nutrition StandardsRecommendations
Charlotte- October 11, 2010
Greensboro- October 14, 2010
Ashville- October 18, 2010
Greenville- October 25, 2010
18
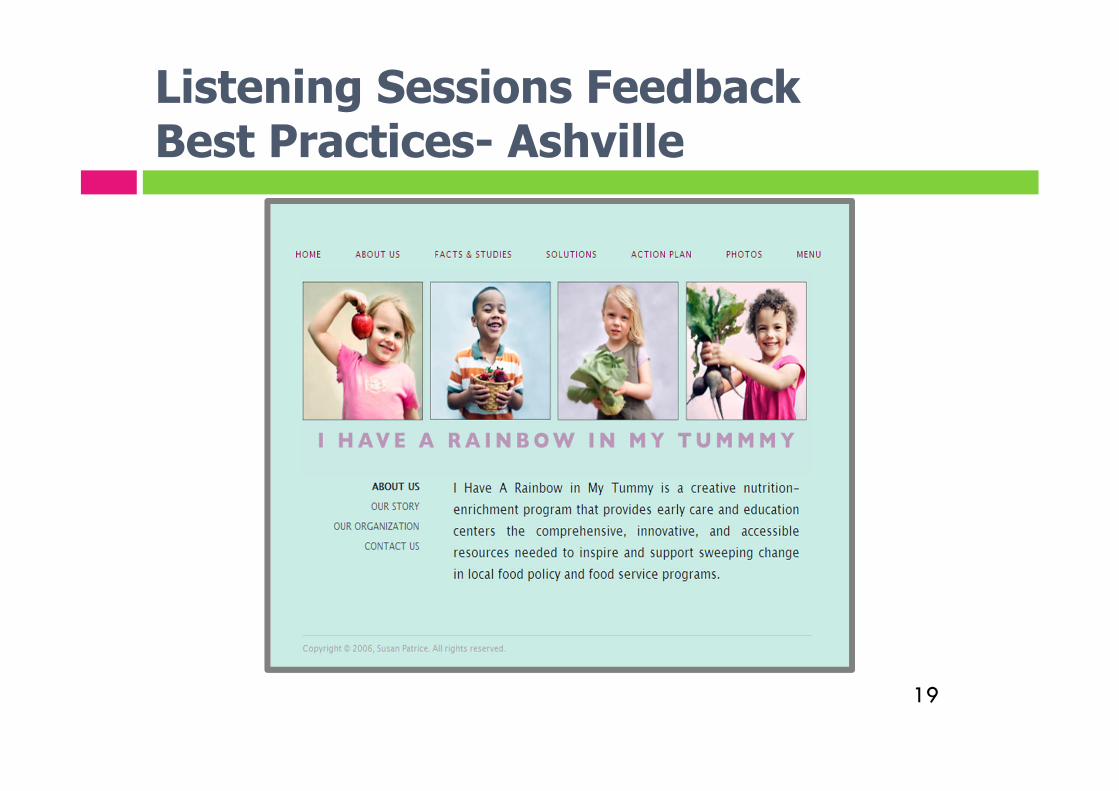
Listening Sessions FeedbackBest Practices- Ashville
19
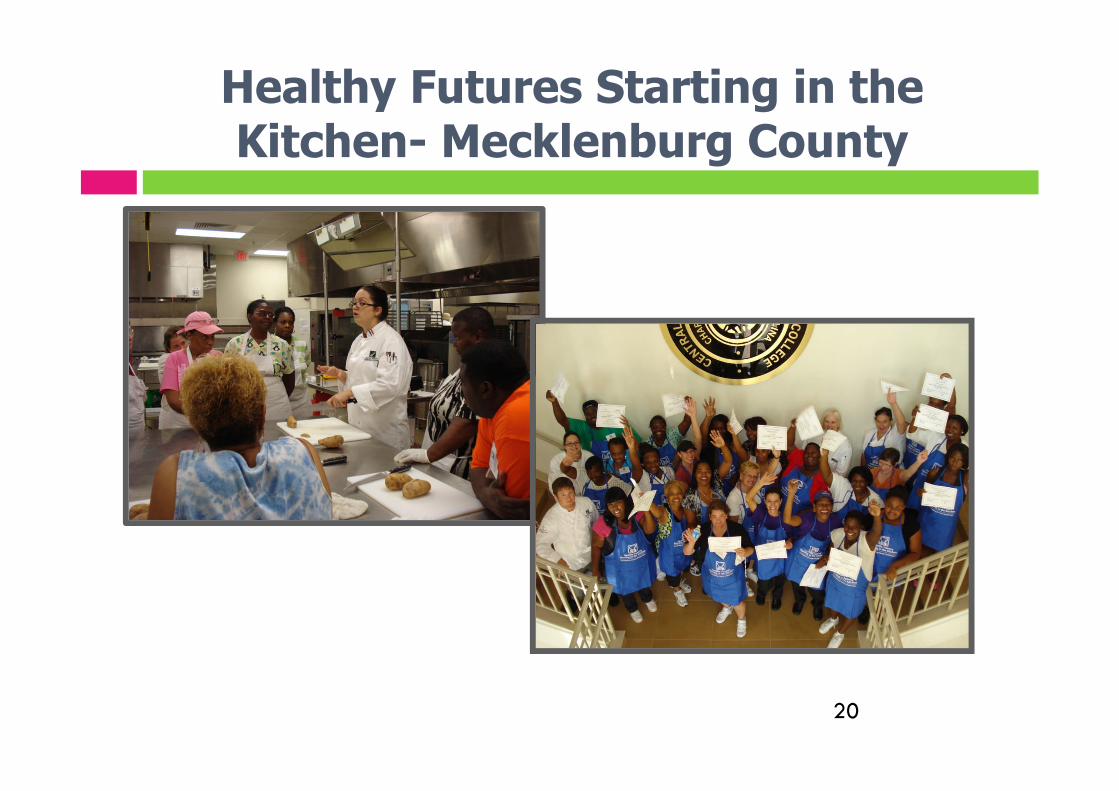
Healthy Futures Starting in theKitchen- Mecklenburg County
20
Nutrition and Physical Activity Assessment forChild Care (NAP-SACC)- Guilford County Model
•Child Care Health Consultants
•Smart Start Partnership withLocal Health Departments
21
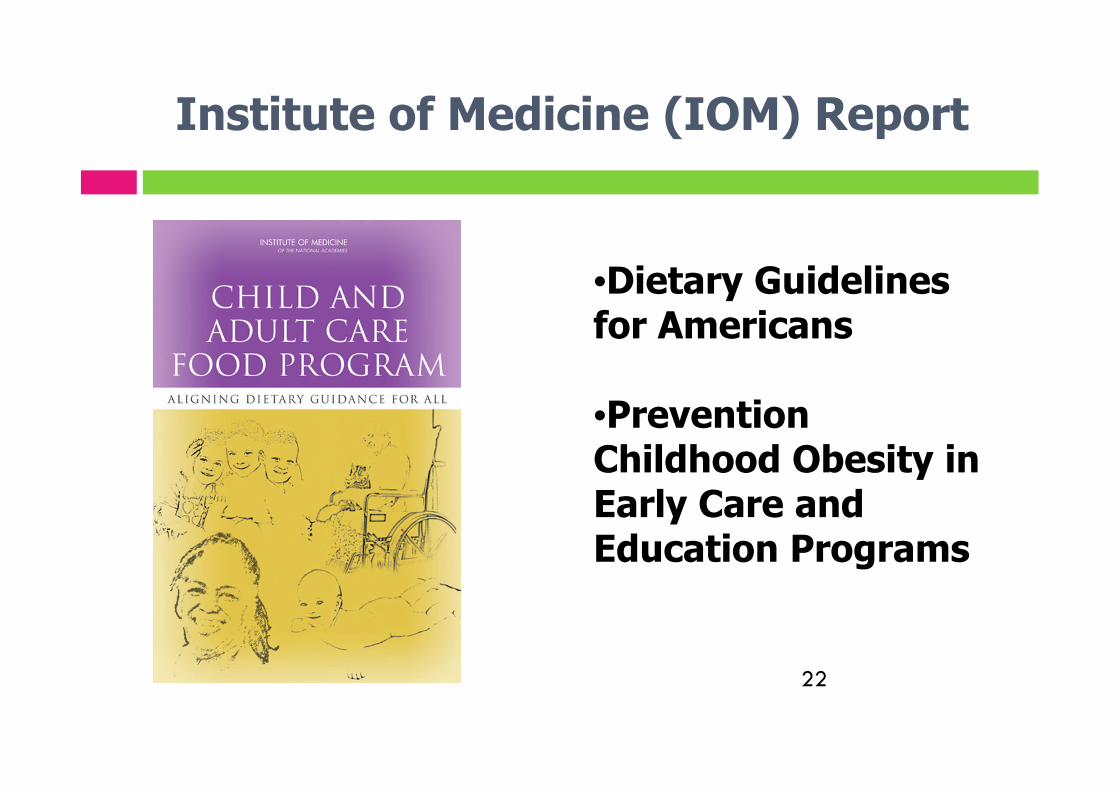
Institute of Medicine (IOM) Report
•Dietary Guidelinesfor Americans
•PreventionChildhood Obesity inEarly Care andEducation Programs
22
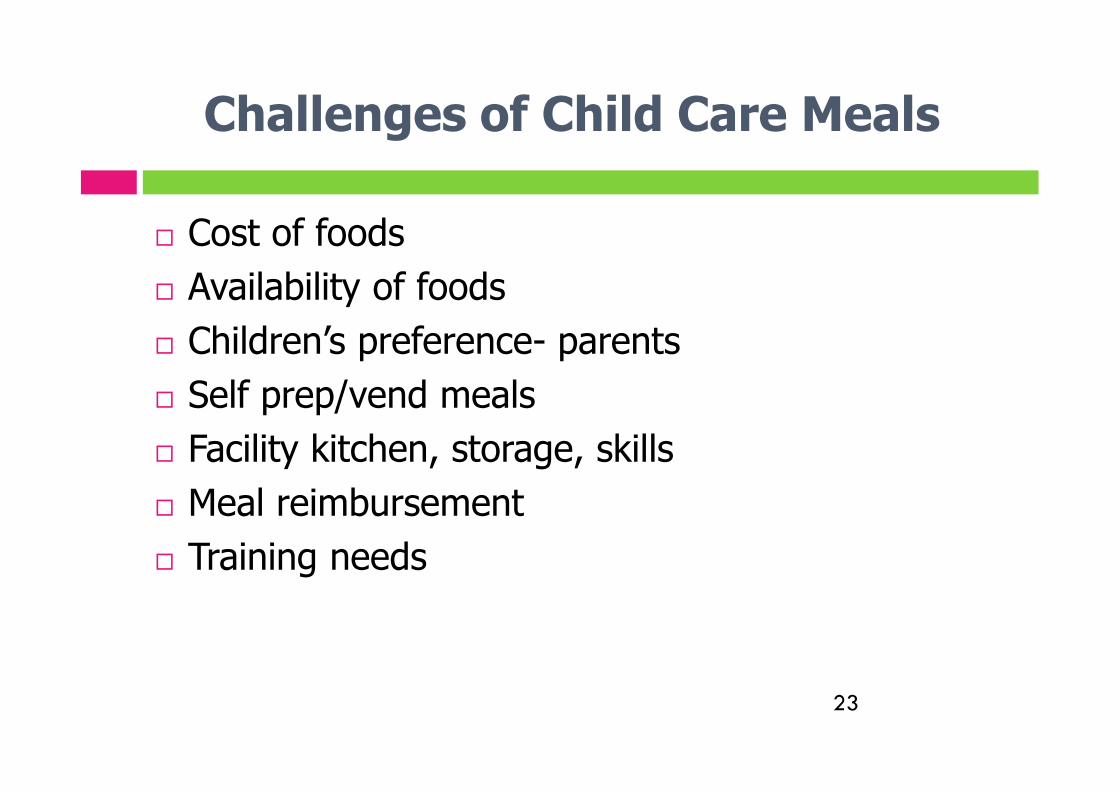
Challenges of Child Care Meals
Cost of foods
Availability of foods
Children’s preference- parents
Self prep/vend meals
Facility kitchen, storage, skills
Meal reimbursement
Training needs
23
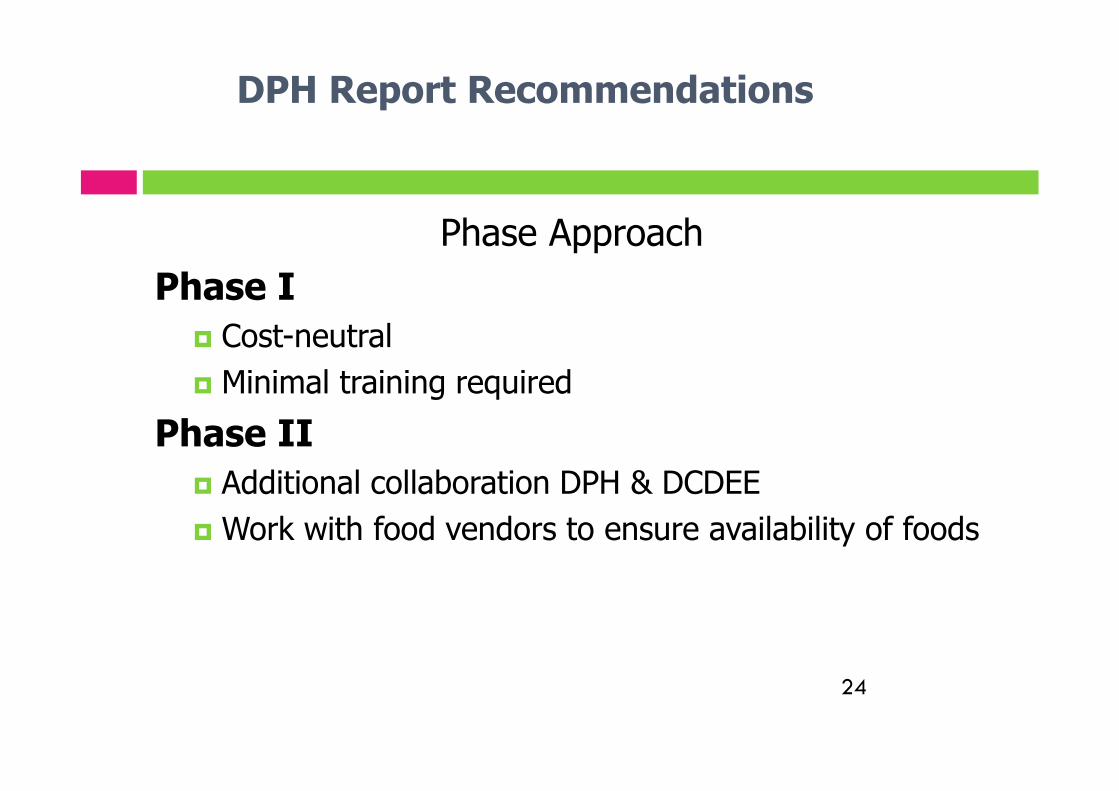
DPH Report Recommendations
Phase Approach
Phase I
Cost-neutral
Minimal training required
Phase II
Additional collaboration DPH & DCDEE
Work with food vendors to ensure availability of foods
24

DPH Report Recommendations
Phase II Prohibit the serving of sweetened beverages, other than
100% fruit juice, to children of any age.
Prohibit the serving of more than six ounces of juice perday to children of any age.
Prohibit the serving of juice from a bottle.
Prohibit the serving of whole milk to children two yearsof age or older.
Prohibit the serving of flavored milk to children of anyage.
Create an exception from the rules for parents ofchildren who have medical needs, special diets, or foodallergies.
25
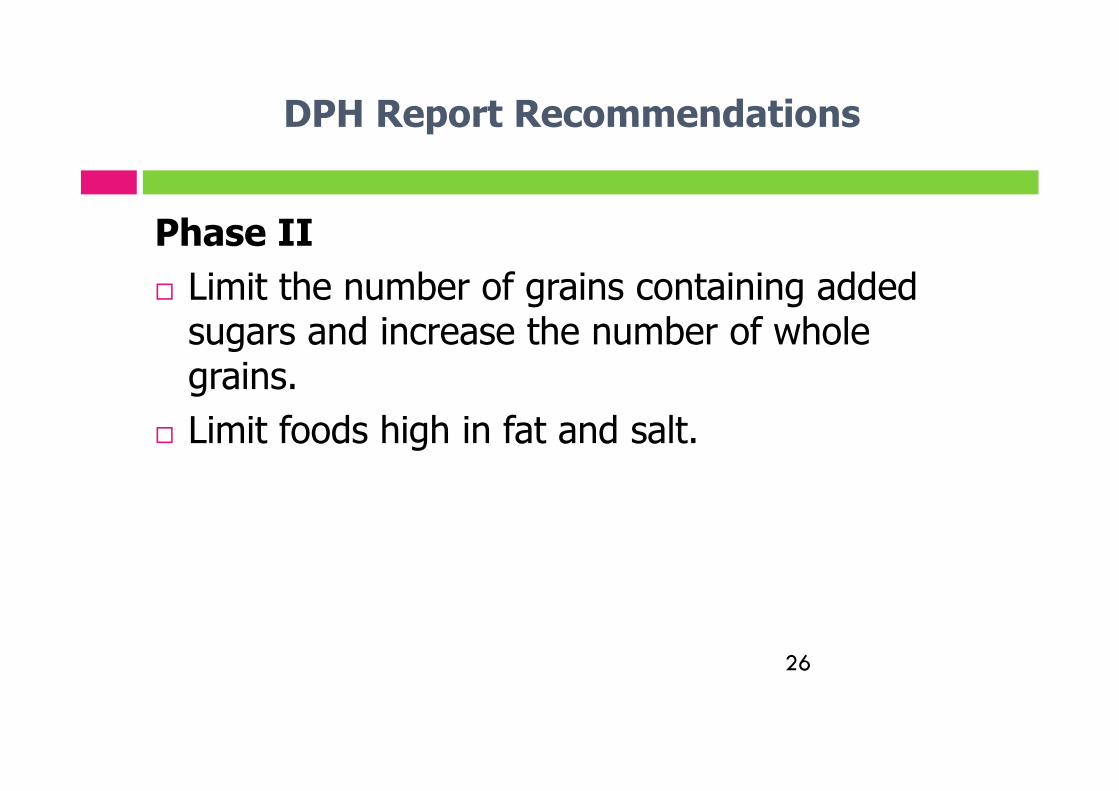
DPH Report Recommendations
Phase II
Limit the number of grains containing addedsugars and increase the number of wholegrains.
Limit foods high in fat and salt.
26
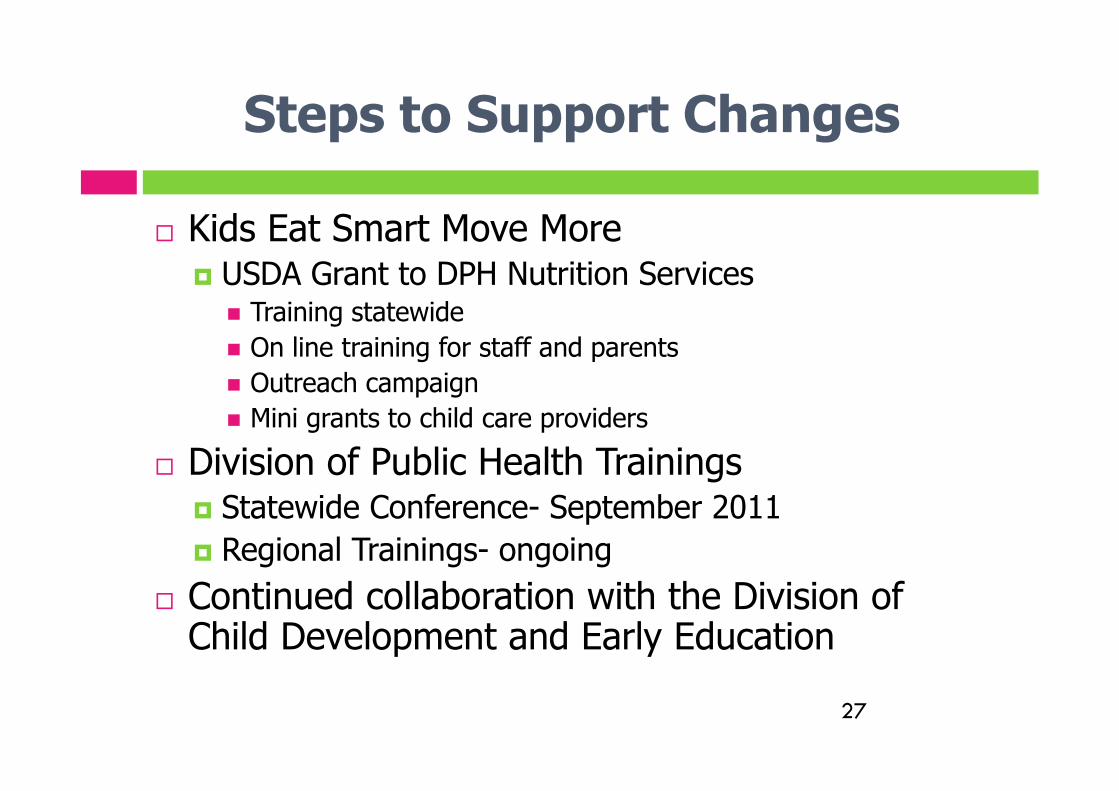
Steps to Support Changes
Kids Eat Smart Move More USDA Grant to DPH Nutrition Services Training statewide
On line training for staff and parents
Outreach campaign
Mini grants to child care providers
Division of Public Health Trainings Statewide Conference- September 2011
Regional Trainings- ongoing
Continued collaboration with the Division ofChild Development and Early Education
27