Embed Size (px)
Citation preview
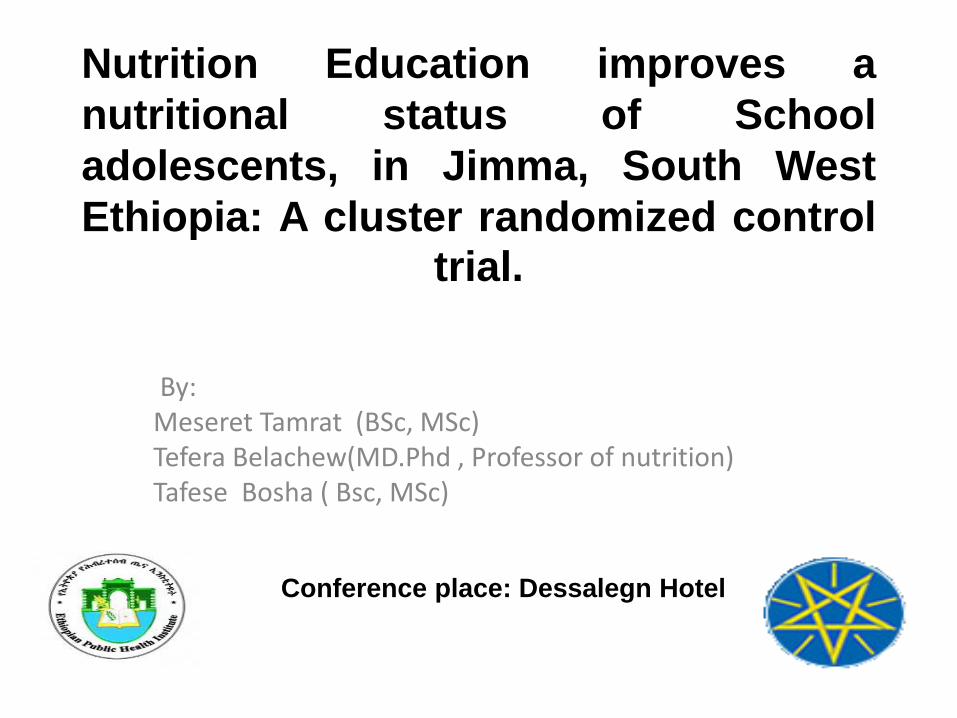
Nutrition Education improves a
nutritional status of School
adolescents, in Jimma, South West
Ethiopia: A cluster randomized controltrial.
By:Meseret Tamrat (BSc, MSc)Tefera Belachew(MD.Phd , Professor of nutrition)Tafese Bosha ( Bsc, MSc)
Conference place: Dessalegn Hotel
Content
1. Introduction
2. Objective
3. Methodology
4. Methods and material
5. Result and discussion
6. Conclusion and Recommendation
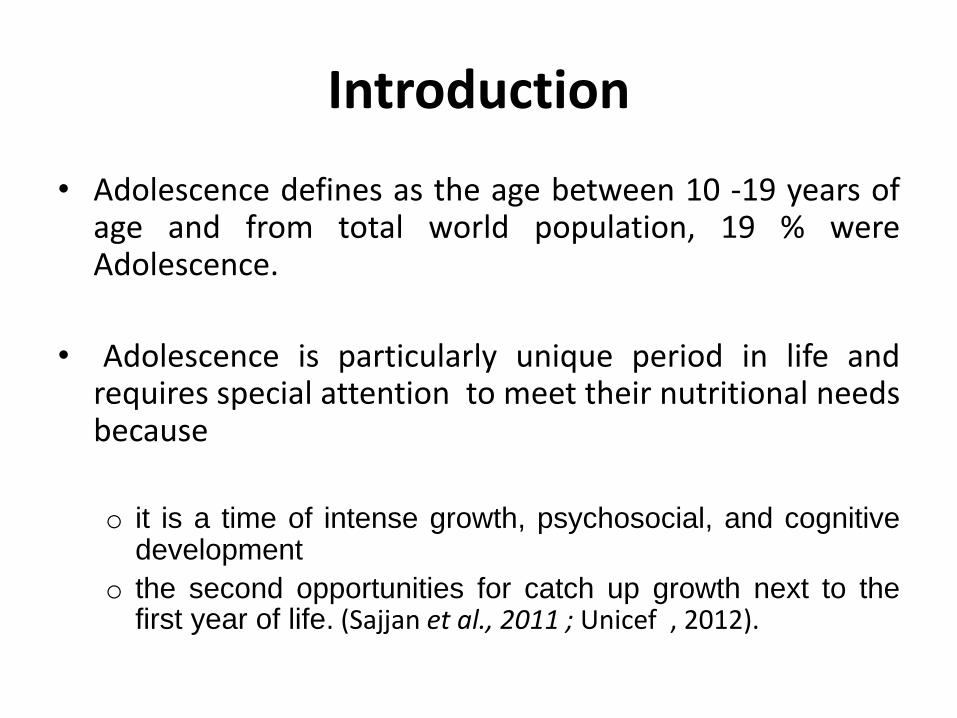
Introduction
• Adolescence defines as the age between 10 -19 years ofage and from total world population, 19 % wereAdolescence.
• Adolescence is particularly unique period in life andrequires special attention to meet their nutritional needsbecause
o it is a time of intense growth, psychosocial, and cognitivedevelopment
o the second opportunities for catch up growth next to thefirst year of life. (Sajjan et al., 2011 ; Unicef , 2012).
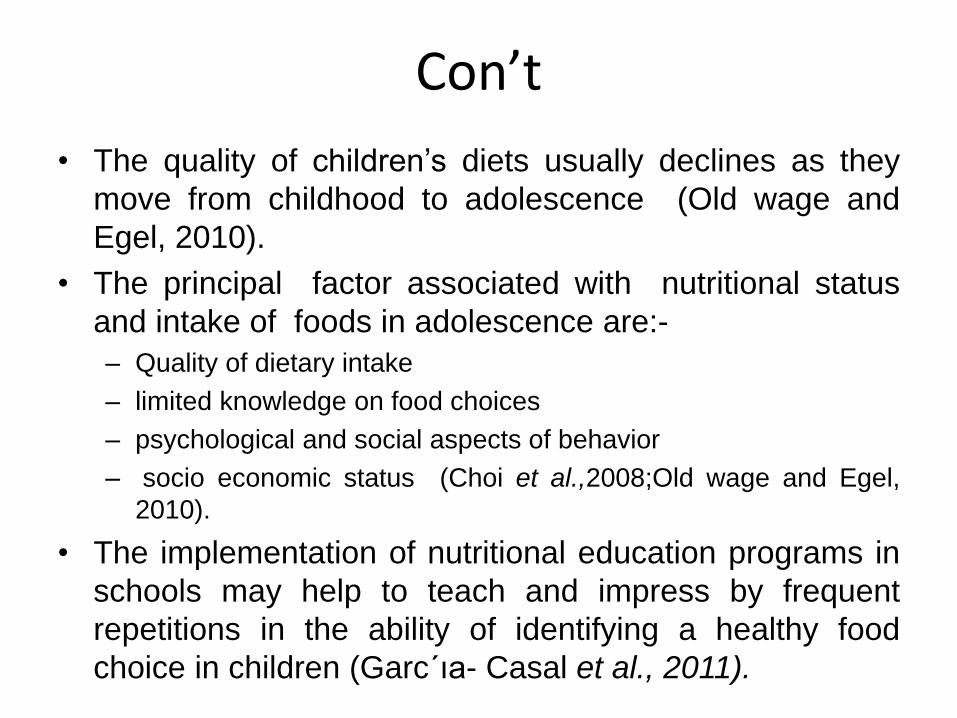
Con’t
• The quality of children’s diets usually declines as they
move from childhood to adolescence (Old wage and
Egel, 2010).
• The principal factor associated with nutritional status
and intake of foods in adolescence are:-
– Quality of dietary intake
– limited knowledge on food choices
– psychological and social aspects of behavior
– socio economic status (Choi et al.,2008;Old wage and Egel,
2010).
• The implementation of nutritional education programs in
schools may help to teach and impress by frequent
repetitions in the ability of identifying a healthy food
choice in children (Garc´ıa- Casal et al., 2011).
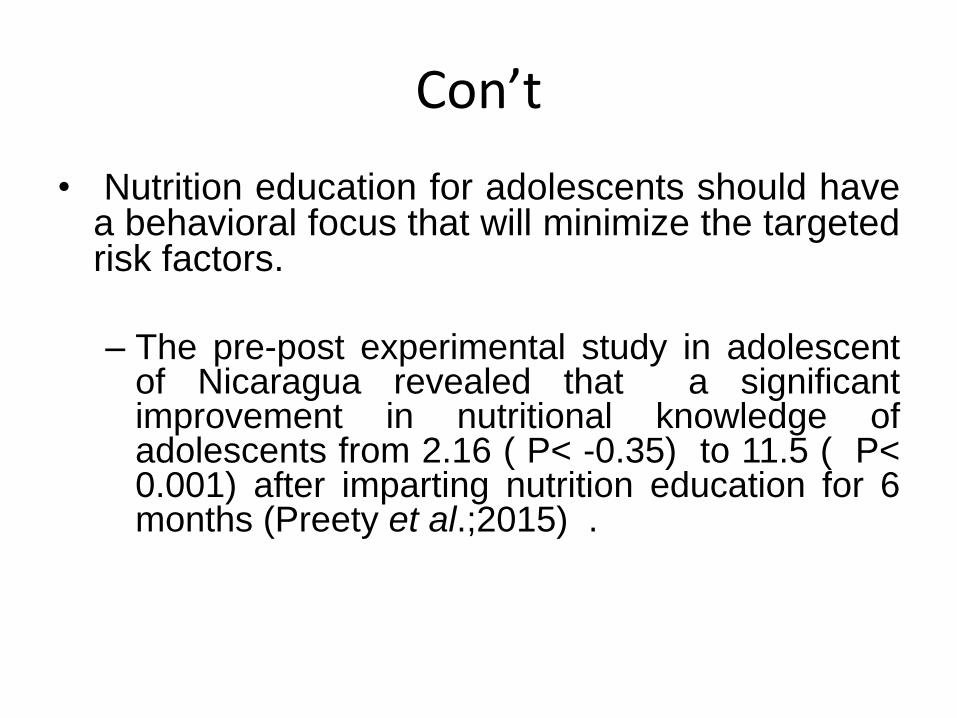
Con’t
• Nutrition education for adolescents should havea behavioral focus that will minimize the targetedrisk factors.
– The pre-post experimental study in adolescentof Nicaragua revealed that a significantimprovement in nutritional knowledge ofadolescents from 2.16 ( P< -0.35) to 11.5 ( P<0.001) after imparting nutrition education for 6months (Preety et al.;2015) .
Con’t
• It is hoped that, nutrition education interventions
are considered to reduce the level of
malnutrition by improving the knowledge of
adolescents on dietary choices.
• However in Ethiopia, there is no data weather
nutrition education improves the knowledge and
nutritional status of adolescents.
Con’t
• Therefore, this research intended to assess the:-
– Nutritional status and nutritional knowledge
– provided nutritional education
– evaluated its impact on the nutritional status of
adolescent school children in Serbo Schools, Kersa
woreda, Jimma, and South West Ethiopia.
Objectives
General objective
o To determine the impact of nutrition educationintervention on nutritional status of schooladolescents in Kersa Woreda, Jimma Zone,and South West Ethiopia.
Specific objective
o To assess the nutritional status of school adolescent.
o To assess the nutritional knowledge of schooladolescent.
o To determine the effect of nutrition education on thenutritional status of adolescent
Hypothesis
• The nutritional status of adolescent school
children would be improved in those who
received nutrition education than those
who had not received.
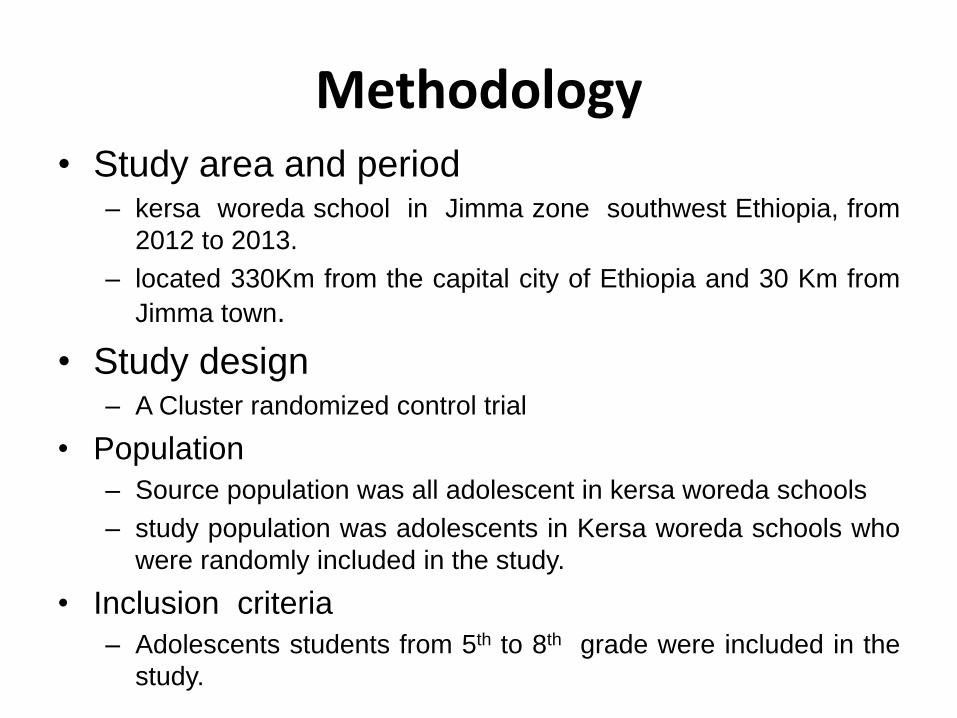
Methodology• Study area and period
– kersa woreda school in Jimma zone southwest Ethiopia, from
2012 to 2013.
– located 330Km from the capital city of Ethiopia and 30 Km from
Jimma town.
• Study design– A Cluster randomized control trial
• Population
– Source population was all adolescent in kersa woreda schools
– study population was adolescents in Kersa woreda schools who
were randomly included in the study.
• Inclusion criteria
– Adolescents students from 5th to 8th grade were included in the
study.
Con’t
• Exclusion criteria
– Students who had history of current illness .
– Those children who attended less than 25 % of the
nutrition education session, were excluded from the
study.
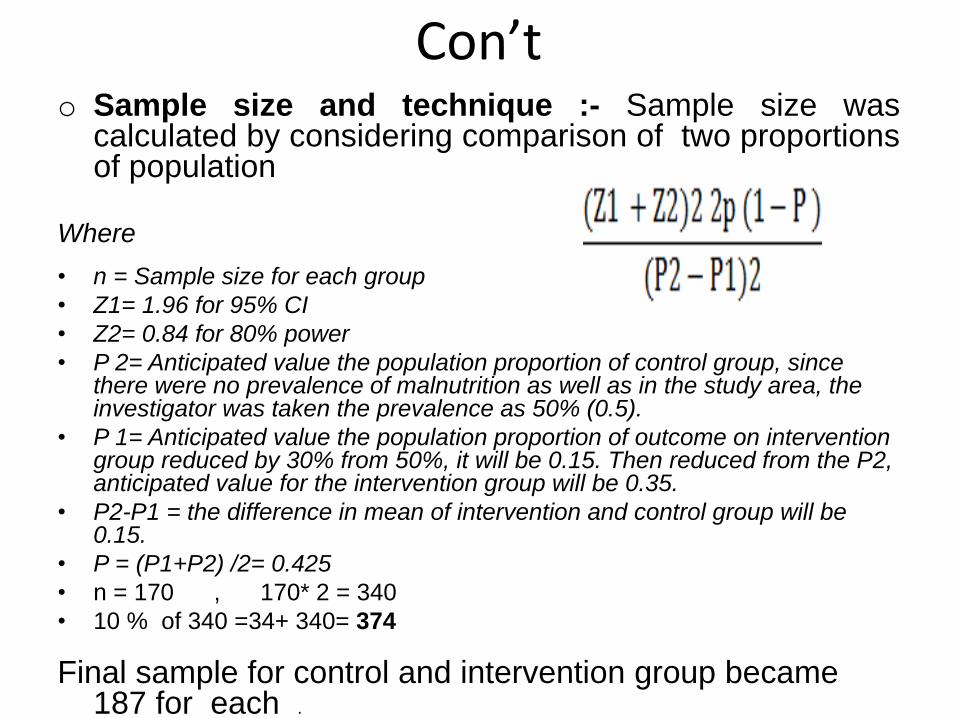
Con’to Sample size and technique :- Sample size was
calculated by considering comparison of two proportionsof population
Where
• n = Sample size for each group
• Z1= 1.96 for 95% CI
• Z2= 0.84 for 80% power
• P 2= Anticipated value the population proportion of control group, since there were no prevalence of malnutrition as well as in the study area, the investigator was taken the prevalence as 50% (0.5).
• P 1= Anticipated value the population proportion of outcome on intervention group reduced by 30% from 50%, it will be 0.15. Then reduced from the P2, anticipated value for the intervention group will be 0.35.
• P2-P1 = the difference in mean of intervention and control group will be 0.15.
• P = (P1+P2) /2= 0.425
• n = 170 , 170* 2 = 340
• 10 % of 340 =34+ 340= 374
Final sample for control and intervention group became 187 for each .
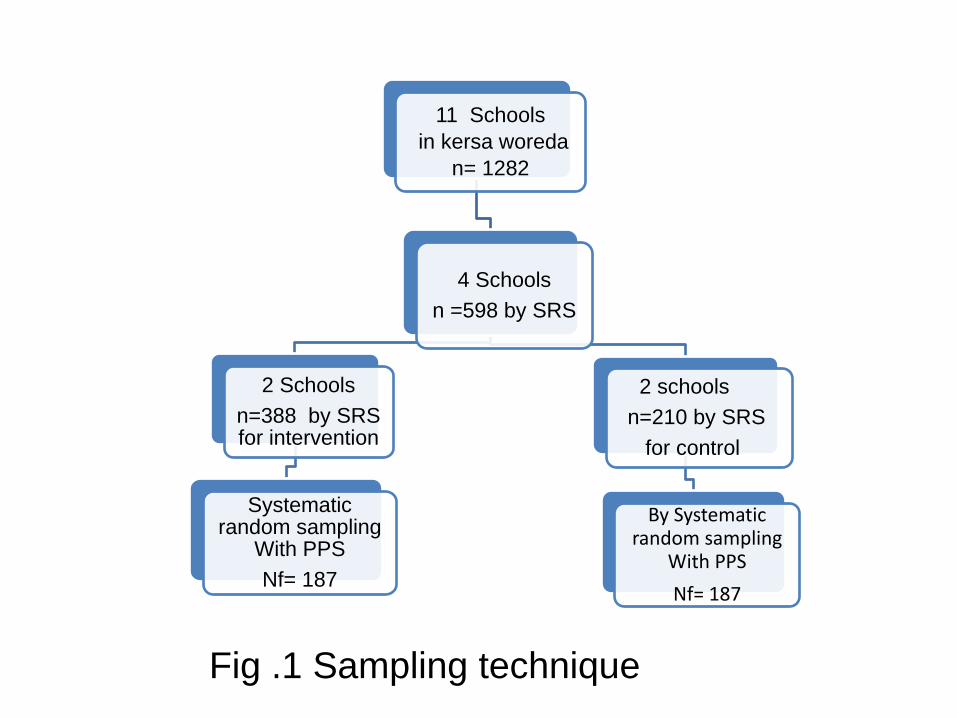
11 Schools
in kersa woreda
n= 1282
4 Schools
n =598 by SRS
2 Schools
n=388 by SRS for intervention
Systematic random sampling
With PPS
Nf= 187
2 schools
n=210 by SRS
for control
By Systematic random sampling
With PPS
Nf= 187
Fig .1 Sampling technique
Con’t
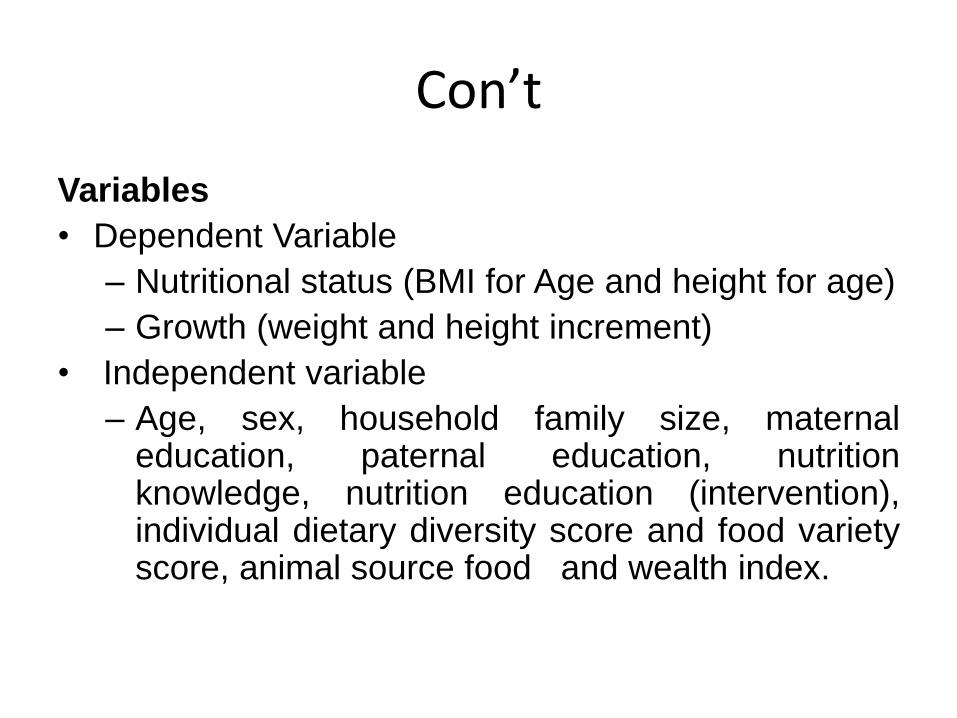
Variables
• Dependent Variable
– Nutritional status (BMI for Age and height for age)
– Growth (weight and height increment)
• Independent variable
– Age, sex, household family size, maternaleducation, paternal education, nutritionknowledge, nutrition education (intervention),individual dietary diversity score and food varietyscore, animal source food and wealth index.
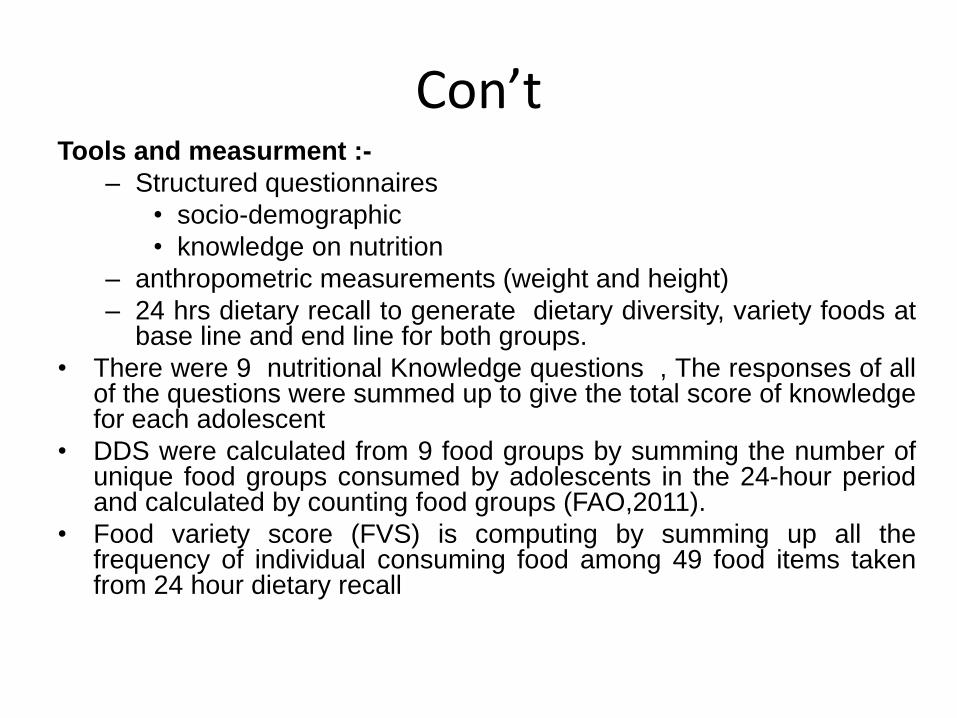
Con’tTools and measurment :-
– Structured questionnaires
• socio-demographic
• knowledge on nutrition
– anthropometric measurements (weight and height)
– 24 hrs dietary recall to generate dietary diversity, variety foods atbase line and end line for both groups.
• There were 9 nutritional Knowledge questions , The responses of allof the questions were summed up to give the total score of knowledgefor each adolescent
• DDS were calculated from 9 food groups by summing the number ofunique food groups consumed by adolescents in the 24-hour periodand calculated by counting food groups (FAO,2011).
• Food variety score (FVS) is computing by summing up all thefrequency of individual consuming food among 49 food items takenfrom 24 hour dietary recall
Con’t
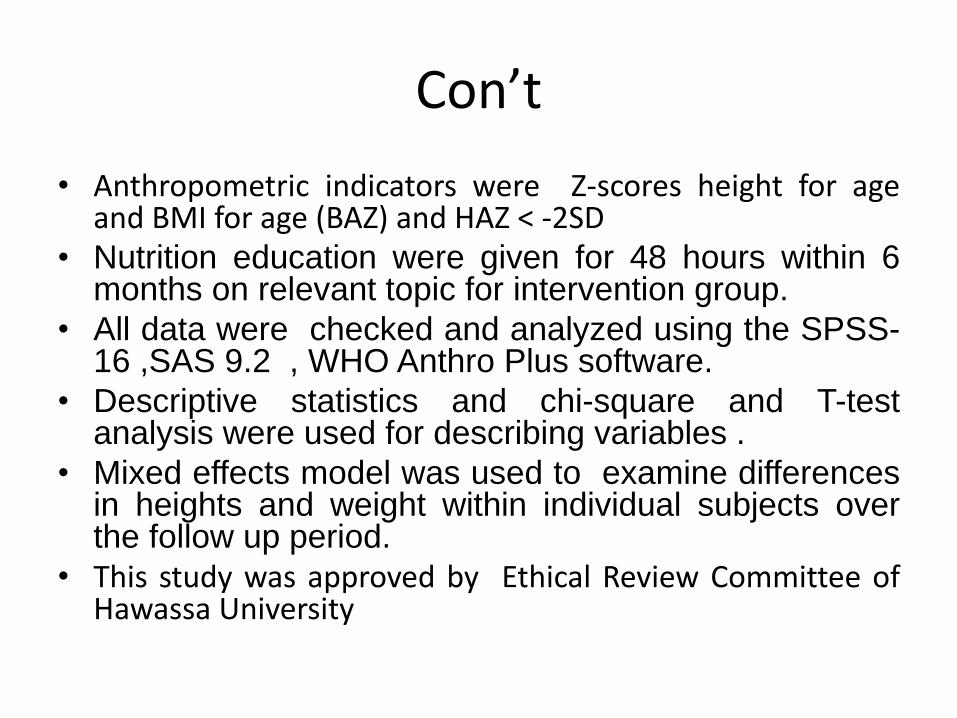
• Anthropometric indicators were Z-scores height for ageand BMI for age (BAZ) and HAZ < -2SD
• Nutrition education were given for 48 hours within 6months on relevant topic for intervention group.
• All data were checked and analyzed using the SPSS-16 ,SAS 9.2 , WHO Anthro Plus software.
• Descriptive statistics and chi-square and T-testanalysis were used for describing variables .
• Mixed effects model was used to examine differencesin heights and weight within individual subjects overthe follow up period.
• This study was approved by Ethical Review Committee ofHawassa University
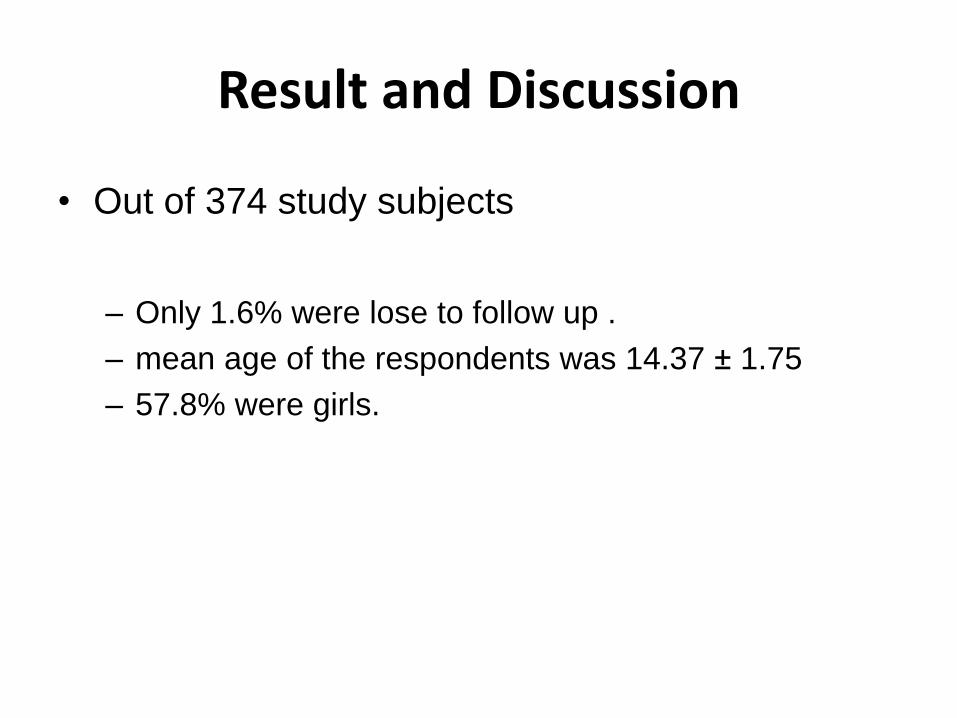
Result and Discussion
• Out of 374 study subjects
– Only 1.6% were lose to follow up .
– mean age of the respondents was 14.37 ± 1.75
– 57.8% were girls.
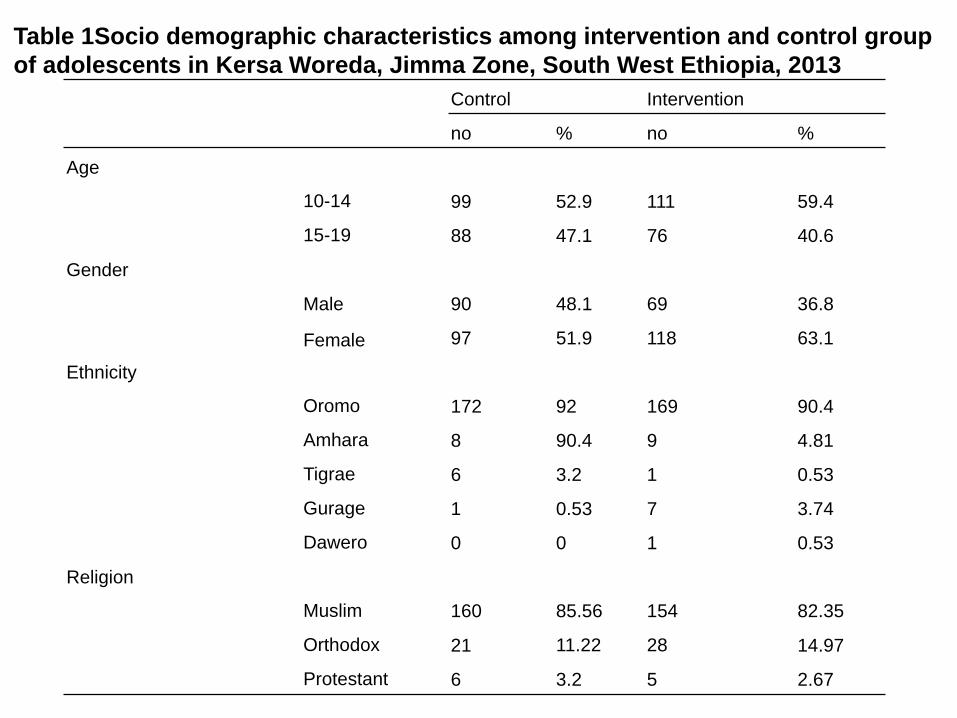
Table 1Socio demographic characteristics among intervention and control group
of adolescents in Kersa Woreda, Jimma Zone, South West Ethiopia, 2013
Control Intervention
no % no %
Age
10-14 99 52.9 111 59.4
15-19 88 47.1 76 40.6
Gender
Male 90 48.1 69 36.8
Female 97 51.9 118 63.1
Ethnicity
Oromo 172 92 169 90.4
Amhara 8 90.4 9 4.81
Tigrae 6 3.2 1 0.53
Gurage 1 0.53 7 3.74
Dawero 0 0 1 0.53
Religion
Muslim 160 85.56 154 82.35
Orthodox 21 11.22 28 14.97
Protestant 6 3.2 5 2.67
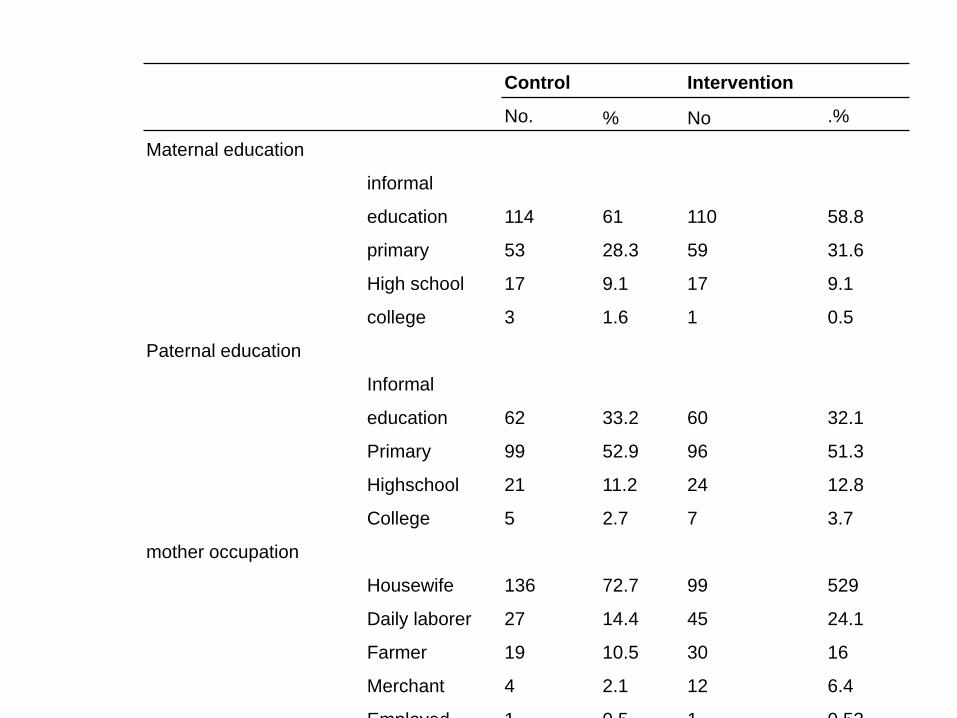
Control Intervention
No. % No .%
Maternal education
informal
education 114 61 110 58.8
primary 53 28.3 59 31.6
High school 17 9.1 17 9.1
college 3 1.6 1 0.5
Paternal education
Informal
education 62 33.2 60 32.1
Primary 99 52.9 96 51.3
Highschool 21 11.2 24 12.8
College 5 2.7 7 3.7
mother occupation
Housewife 136 72.7 99 529
Daily laborer 27 14.4 45 24.1
Farmer 19 10.5 30 16
Merchant 4 2.1 12 6.4
Employed 1 0.5 1 0.53
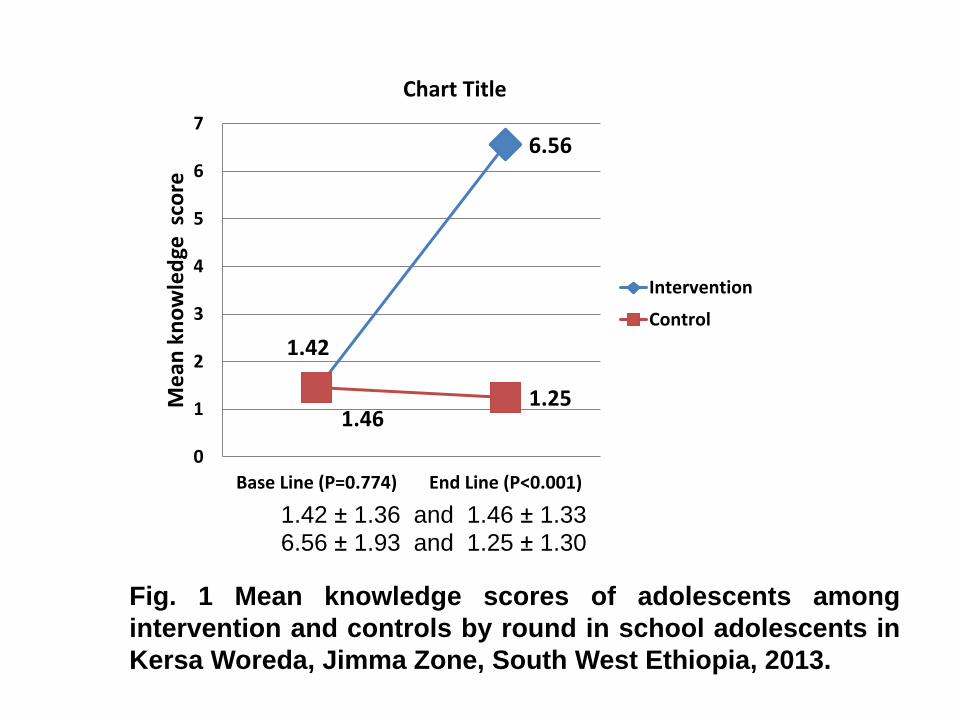
1.42
6.56
1.461.25
0
1
2
3
4
5
6
7
Base Line (P=0.774) End Line (P<0.001)
Me
an k
no
wle
dge
sco
re
Chart Title
Intervention
Control
Fig. 1 Mean knowledge scores of adolescents among
intervention and controls by round in school adolescents in
Kersa Woreda, Jimma Zone, South West Ethiopia, 2013.
1.42 ± 1.36 and 1.46 ± 1.336.56 ± 1.93 and 1.25 ± 1.30
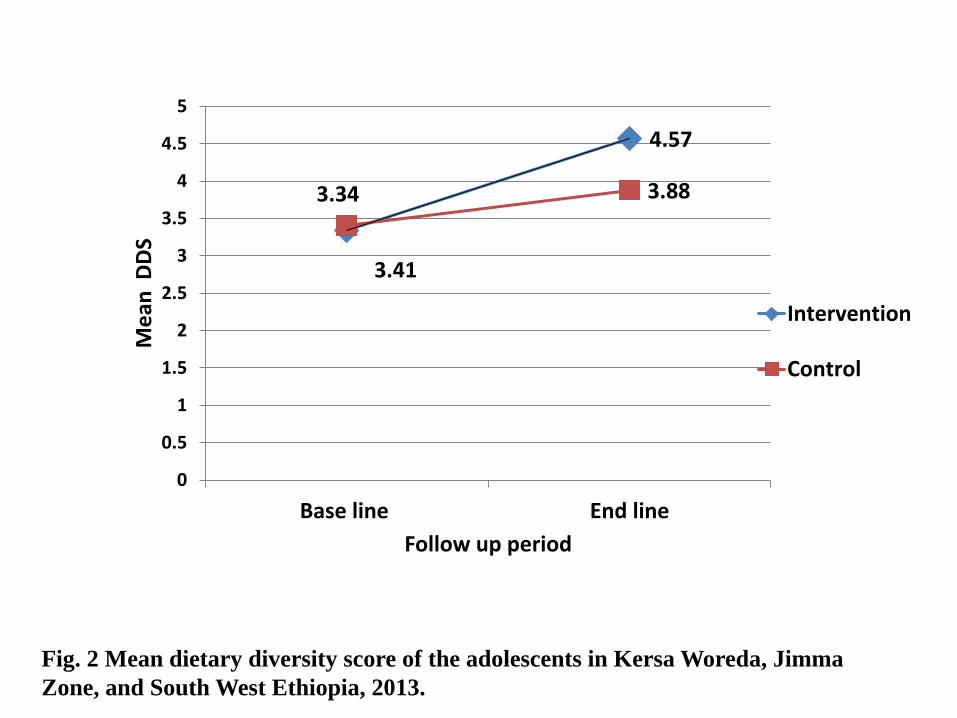
3.34
4.57
3.41
3.88
0
0.5
1
1.5
2
2.5
3
3.5
4
4.5
5
Base line End line
Me
an D
DS
Follow up period
Intervention
Control
Fig. 2 Mean dietary diversity score of the adolescents in Kersa Woreda, Jimma
Zone, and South West Ethiopia, 2013.
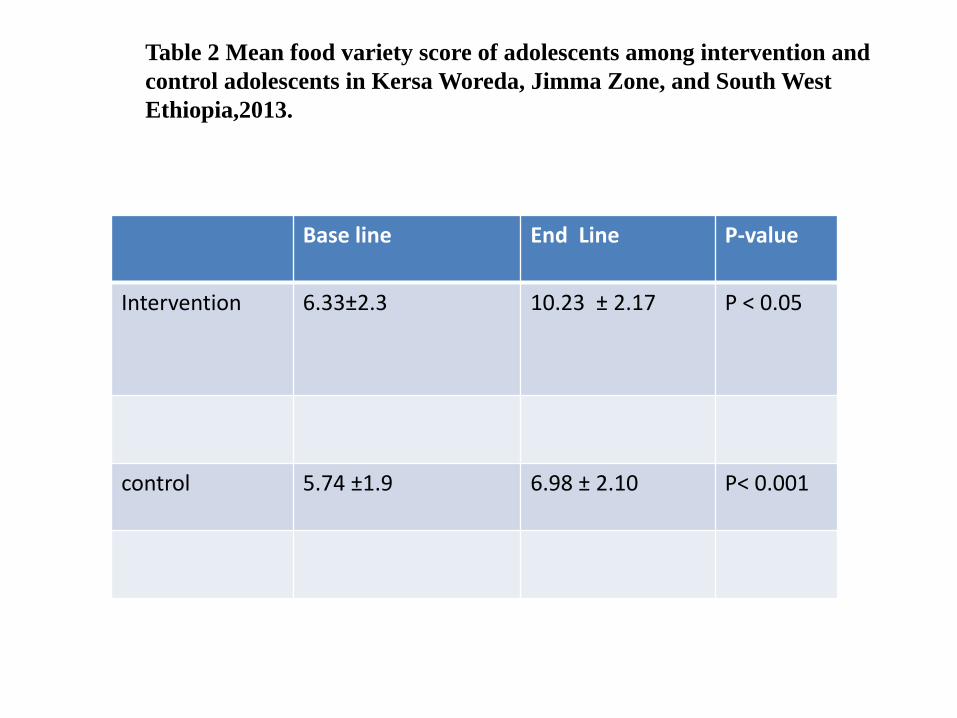
Base line End Line P-value
Intervention 6.33±2.3 10.23 ± 2.17 P < 0.05
control 5.74 ±1.9 6.98 ± 2.10 P< 0.001
Table 2 Mean food variety score of adolescents among intervention and
control adolescents in Kersa Woreda, Jimma Zone, and South West
Ethiopia,2013.
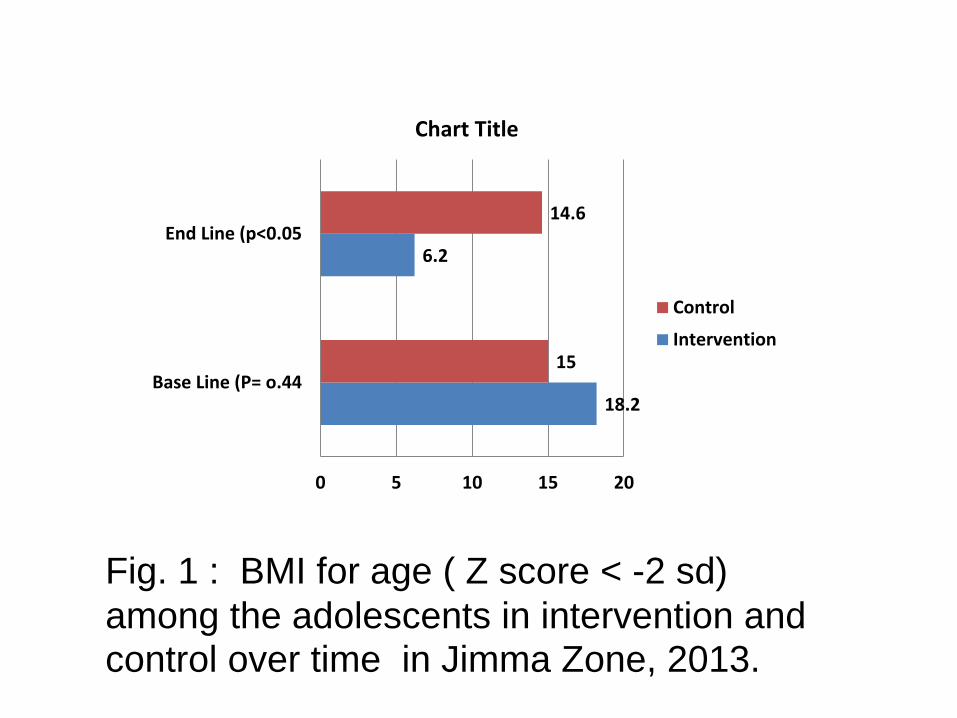
18.2
6.2
15
14.6
0 5 10 15 20
Base Line (P= o.44
End Line (p<0.05
Chart Title
Control
Intervention
Fig. 1 : BMI for age ( Z score < -2 sd)
among the adolescents in intervention and control over time in Jimma Zone, 2013.
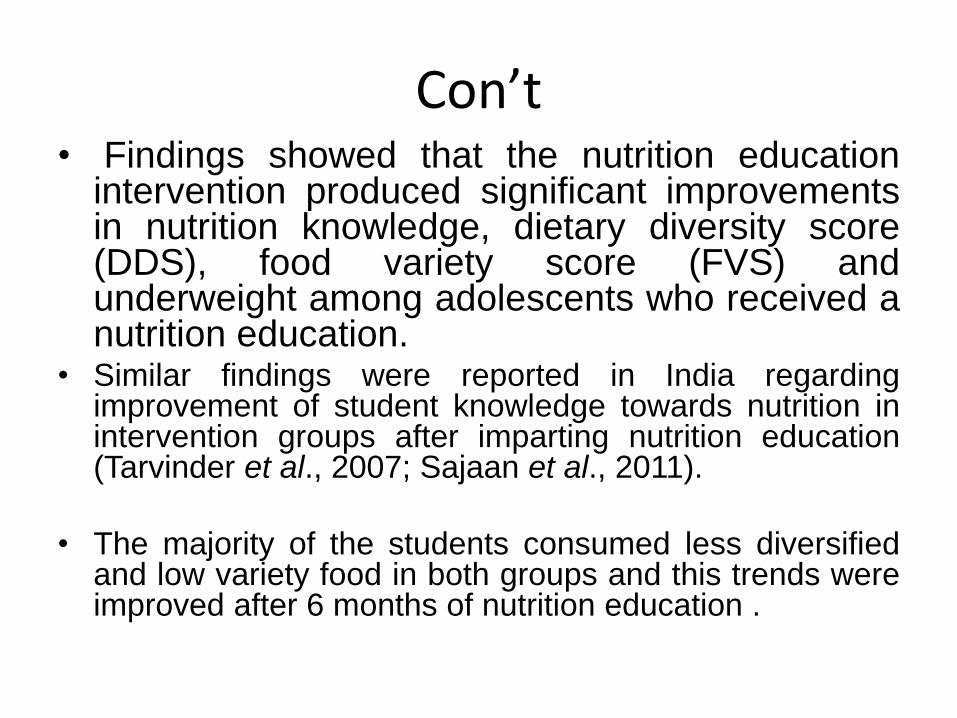
Con’t• Findings showed that the nutrition education
intervention produced significant improvementsin nutrition knowledge, dietary diversity score(DDS), food variety score (FVS) andunderweight among adolescents who received anutrition education.
• Similar findings were reported in India regardingimprovement of student knowledge towards nutrition inintervention groups after imparting nutrition education(Tarvinder et al., 2007; Sajaan et al., 2011).
• The majority of the students consumed less diversifiedand low variety food in both groups and this trends wereimproved after 6 months of nutrition education .
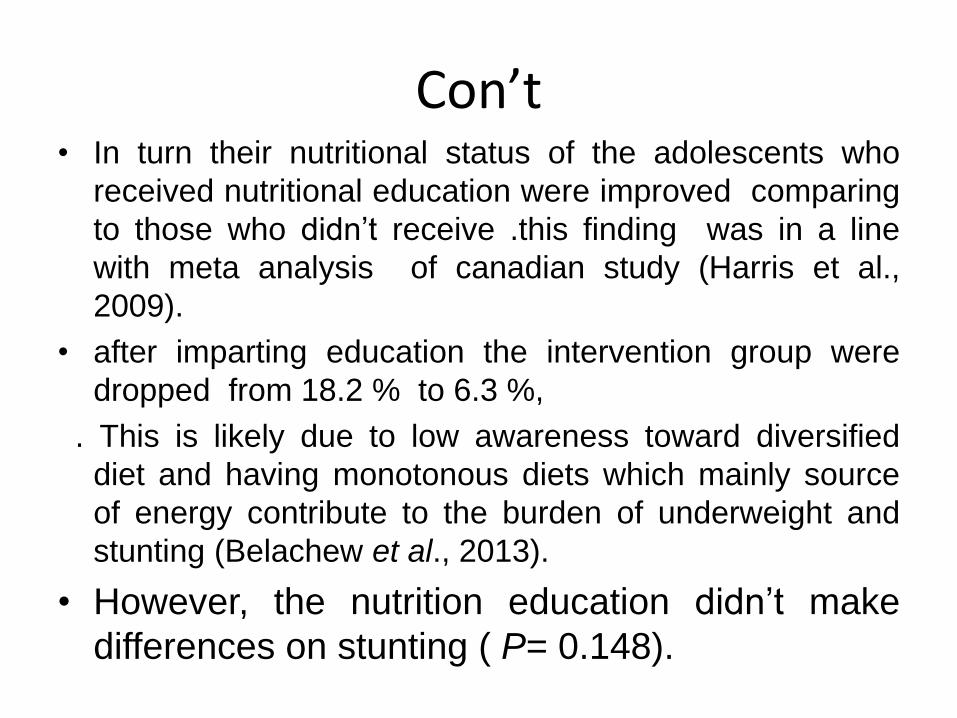
Con’t• In turn their nutritional status of the adolescents who
received nutritional education were improved comparing
to those who didn’t receive .this finding was in a line
with meta analysis of canadian study (Harris et al.,
2009).
• after imparting education the intervention group were
dropped from 18.2 % to 6.3 %,
. This is likely due to low awareness toward diversified
diet and having monotonous diets which mainly source
of energy contribute to the burden of underweight and
stunting (Belachew et al., 2013).
• However, the nutrition education didn’t make
differences on stunting ( P= 0.148).
Con’t
• In current study, a significant difference was
seen in thinness at end line survey within six
months education in intervention and control
groups (P<0.017).
• This shows that the nutritional education has
impacts directly to nutritional status as the
retained knowledge changes in to practice.
Con’t
• The linear mixed models predicted that
weight of boy increased by 2.79 times in the
intervention group during the follow up period
(β=2.79, P=0.0005) .
• The height of boys and girls increased by
2.88cm (β=2.88, p<0.0001) and 1.61 cm (β=
1.61, p<0.001) for a unit increase in the
following year respectively in those
adolescents height was normal at base line .
Conclusion and Recommendation
• This study showed that the nutrition educationintervention conducted over a period of 6 month has apositive impact on nutritional status, knowledge andhabits dietary quality.
• Based on this study findings, we suggested that :-
– Encourage and motivate the study on adolescentsnutritional status and knowledge related to dietary practice
– Identified and strengthened existing skills on good dietarypractices in adolescents and communities
– The school curriculum should need modification and addnutrition education.
Acknowledgement
First of all thanks for almighty God.
Hawassa and jimma universities,
Supervisors and data collectors
the study subject
This thesis work is made possible by the support of the
American people through the United States Agency for
International Development (USAID) under Agreement
No. AID-663-A-11-00017.
my beloved family.
Reference• Choi D S, Shin N R, Jung R I, Park HR, Lee H M and Song K H. 2008. A study on nutrition knowledge
and dietary behavior of elementary School children in Seoul 2(4): 308-316
• García-Casal M, Puche R, Leets I, Carvajal Z, E Patiño, and IbarraLandaeta-Jiménez MIbarra C 2011. A Program of Nutritional Education in SchoolsReduced the Prevalence of Iron Deficiency in Students. Hindawi PublishingCorporation Anemia Article ID 284050, 6 pages. doi:10.1155/2011/284050
• FAO(Food and Agricultural Organization).2011. Guidelines for Measuring Householdand Individual Dietary Diversity. Nutrition and Consumer Protection Division, Foodand Agriculture Organization of the United Nations.Eur.Union.Italy,Rome, PP5.
• Oldwage_Thereon WH and Egel AA. 2010. Nutrition knowledge and nutritional statusof primary school children in QwaQwa. South Africa. J Clin. Nutr. 23(3):149-154.
• Preety and Uma s. Hiremath.2015. Impact of nutrition and health education intervention on rural high school students. Karnataka J. Agric. Sci., 28(1): (92-95) .
• Sajaan J, kasturiba B, Rama k. N and Pushpa .C, Bharati. 2011. Impact of child tochild nutrition education intervention on nutrition knowledge scores and hemoglobin
status of rural adolescent girls’ .Karnataka J. Agric. Sci. 24 (4): 513-515.
• Tarvinder J. and Kochar GK Taru. Aarwal T. 2007. Impact of Nutrition Education onNutrient Adequacy of Adolescent Girls. Stud. Home Comm. Sci. 1(1): 51-55.
• Unicef, 2012. adolescent database