Embed Size (px)
Citation preview
NATIONAL CENTER FOR EDUCATION STATISTICS
Statistical Analysis Report February 2000
Nutrition Education inPublic Elementary SchoolClassrooms, K-5
.
U.S. Department of EducationOffice of Educational Research and Improvement NCES 2000-040
NATIONAL CENTER FOR EDUCATION STATISTICS
Statistical Analysis Report February 2000
Nutrition Education inPublic Elementary SchoolClassrooms, K-5
Carin CelebuskiElizabeth FarrisWestat, Inc.
Shelley BurnsProject OfficerNational Center for Education Statistics
U.S. Department of EducationOffice of Educational Research and Improvement NCES 2000-040
U.S. Department of EducationRichard W. RileySecretary
U.S. Department of AgricultureDan GlickmanSecretary
Office of Educational Research and ImprovementC. Kent McGuireAssistant Secretary
Food, Nutrition, and Consumer ServiceShirley R. WatkinsUnder Secretary
National Center for Education StatisticsGary W. PhillipsActing Commissioner
Food and Nutrition ServiceSamuel Chambers, Jr.Administrator
Office of Analysis and EvaluationAlberta C. FrostDirector
The National Center for Education Statistics (NCES) is the primary federal entity for collecting, analyzing,and reporting data related to education in the United States and other nations. It fulfills a congressionalmandate to collect, collate, analyze, and report full and complete statistics on the condition of education inthe United States; conduct and publish reports and specialized analyses of the meaning and significanceof such statistics; assist state and local education agencies in improving their statistical systems; andreview and report on education activities in foreign countries.
NCES activities are designed to address high priority education data needs; provide consistent, reliable,complete, and accurate indicators of education status and trends; and report timely, useful, and highquality data to the U.S. Department of Education, the Congress, the states, other education policymakers,practitioners, data users, and the general public.
We strive to make our products available in a variety of formats and in language that is appropriate to avariety of audiences. You, as our customer, are the best judge of our success in communicatinginformation effectively. If you have any comments or suggestions about this or any other NCES product orreport, we would like to hear from you. Please direct your comments to:
National Center for Education StatisticsOffice of Educational Research and ImprovementU.S. Department of Education555 New Jersey Avenue NWWashington, DC 20208-5574
February 2000
The NCES World Wide Web Home Page is:http://nces.ed.gov
Suggested CitationU.S. Department of Education, National Center for Education Statistics. Nutrition Education in PublicElementary School Classrooms, NCES 2000-040, by Carin Celebuski and Elizabeth Farris. ShelleyBurns, project officer. Washington, DC: 2000.
Contact:Shelley Burns(202) 219-1463
For sale by the U.S. Government Printing Office
Superintendent of Documents, Mail Stop: SSOP, Washington, DC 20402-9328
iii
Highlights • About half of elementary school teachers (52 percent) have had formaltraining to teach about nutrition (figure 2).
• With a few exceptions, teachers generally reported high availability ofresources in support of nutrition education, including healthy cafeteriameals (82 percent), reference materials (74 percent), support for use ofinstructional time (70 percent), and a written policy or guidelines(57 percent) (table 3). Fewer teachers reported availability of high-quality inservice training in nutrition education (27 percent) and acoordinated school nutrition policy (37 percent). By region, teachersfrom the Southeast reported greater availability of both these resourcesthan teachers from other regions.
• Despite research indicating the importance of the resources noted above,teachers do not view access to these resources as the only thing neededto improve nutrition education (table 4). About 30 percent of teachersindicated that healthy school cafeteria meals, support for use ofinstructional time, and reference materials at school would improvenutrition education to a great extent. About one-fifth indicated that high-quality inservice training would improve it to a great extent.
• Eighty-eight percent of elementary school teachers reported that theytaught lessons about nutrition to their students in the 1996-97 schoolyear (table 5). More kindergarten through second-grade teachers(92 percent) taught nutrition than did third- through fifth-grade teachers(83 percent).
• Approximately one-third of teachers (35 percent) who taught nutritiontaught it as a separate subject, and about the same proportion integratednutrition lessons to a great extent into health and physical education (39percent) and science (33 percent) (tables 6 and 7). Fewer of theseteachers integrated nutrition lessons to a great extent into reading andlanguage arts (14 percent), history and social studies, and mathematics(4 and 5 percent, respectively).
• The mean number of hours spent in a school year on nutrition educationby elementary school teachers who taught nutrition was 13, below theminimum of 50 hours thought to be necessary for impact on behavior(table 5).
• Teachers reported they employed active learning strategies and did notrely exclusively on traditional lecturing methods for nutrition education.Active learning strategies, such as active discussion (57 percent), hands-on learning (29 percent), and collaborative work (27 percent), were usedto a great extent by the most teachers (table 8). Teachers of grades K-2,teachers with higher levels of support for nutrition education from theirschools, and teachers with college training in nutrition education wereall more likely to use some active learning strategies to a moderate orgreat extent in their nutrition instruction (table 9).
iv
• While about half (48 percent) of elementary school teachers who teachnutrition reported no barriers to cooperation with their school mealsprogram staff in providing nutrition education (table 12), those who didreport barriers tended to focus on the following: lack of instructionaltime and time on the part of the meals program staff, being unsure ofwhat activities are possible, and difficulty of schedule coordinationbetween teachers and meals program staff.
• Teachers with higher levels of support from their schools, and teacherswith college training in nutrition education utilized family involvementstrategies for nutrition education more often than teachers with lowerlevels of support and those with no training, respectively (table 14). Forexample, teachers with high levels of support were more likely toinclude parents in nutrition homework assignments (85 percent)compared to teaches with low levels of support (66 percent); andteachers with college coursework in nutrition education were more likelyto include parents in nutrition homework assignments (22 percent)compared to teaches with no training (48 percent).
• When teachers who taught nutrition were asked whether the instructionalmaterials they used were of high quality, about one in four said theywere up to date to a great extent (24 percent), 41 percent said that theywere age appropriate to a great extent, and 23 percent said that they wereappealing to students to a great extent (table 15). About one in fivereported having enough materials for all their students to a great extent(21 percent), and about the same proportion (19 percent) reported thatthey did not have enough materials for all students.
v
Table of Contents
Page
Highlights.............................................................................................................................. iii
Introduction ........................................................................................................................... 1Training to Teach Nutrition .................................................................................................. 5Resources in Support of Nutrition Education ....................................................................... 7Nutrition Education in the Classroom................................................................................... 9
Amount of Nutrition Instruction..................................................................................... 9Placement in the Curriculum .......................................................................................... 10Teaching Strategies ........................................................................................................ 13Working with the School Meals Program Staff.............................................................. 16
Working with Parents............................................................................................................ 18Instructional Material for Nutrition Education ..................................................................... 21Topics for Inservice Training in Nutrition Education........................................................... 26Comparison Between School and Teacher Results............................................................... 26Summary ............................................................................................................................... 27
List of Appendices
A. Survey Methodology and Data Reliability...................................................................... 29B. Tables of Standard Errors................................................................................................ 37C. Survey Form .................................................................................................................... 59
vi
Table of Contents (continued)
List of Figures
Figure Page
1 Source of training to teach nutrition reported by public elementary school teachers,K-5: 1997.......................................................................................................................... 5
2 Most formal method used by public elementary school teachers, K-5, to preparethem to teach nutrition: 1997 ........................................................................................... 6
3 Percent of public elementary school teachers, K-5, who taught nutrition, by theplacement of nutrition instruction in the curriculum: 1997 ............................................. 10
4 Percent of public elementary school teachers, K-5, who taught nutrition but did notintegrate it into history and social studies and mathematics, by variouscharacteristics: 1997......................................................................................................... 12
5 Percent of public elementary school teachers, K-5, who taught nutrition, whoreported their nutrition education instructional materials were high quality, by levelof support at the school for nutrition education: 1997 ..................................................... 22
6 Percent of public elementary school teachers, K-5, who taught nutrition, whoreported their nutrition education instructional materials were high quality, by levelof training to teach about nutrition: 1997......................................................................... 22
7 Percent of public elementary school teachers, K-5, by preferred method for havingnutrition education materials distributed to them: 1997 .................................................. 25
8 Percent of public elementary school teachers, K-5, who would like to receiveinservice training on various nutrition topics: 1997......................................................... 26
vii
Table of Contents (continued)
List of Tables
Tables Page
1 Mean years teaching and grades taught by public elementary school teachers, K-5,who taught self-contained classes: 1997 .......................................................................... 3
2 Mean number of hours or courses taken by public elementary school teachers, K-5,to prepare them to teach about nutrition, by type of training: 1997................................. 6
3 Percent of public elementary school teachers, K-5, who reported the availability attheir school of various resources in support of nutrition education, by geographicregion: 1997...................................................................................................................... 7
4 Percent of public elementary school teachers, K-5, who reported the potential ofvarious resources to improve nutrition education: 1997 .................................................. 8
5 Percent of public elementary school teachers, K-5, who taught nutrition in schoolyear 1996-97, and for those who taught nutrition, the mean number of total hourstaught, by instructional level: 1997 .................................................................................. 9
6 Percent of public elementary school teachers, K-5, who taught nutrition, by theextent to which they integrated lessons about nutrition into various subjects: 1997....... 10
7 Percent of public elementary school teachers, K-5, who taught nutrition as a separatesubject and who integrated lessons into other subjects to a great extent, by variouscharacteristics: 1997......................................................................................................... 11
8 Percent of public elementary school teachers, K-5, who taught nutrition, by extent ofuse of various teaching strategies for nutrition lessons: 1997.......................................... 13
9 Percent of public elementary school teachers, K-5, who taught nutrition, who usedvarious teaching strategies to a moderate or great extent, by various characteristics:1997 ................................................................................................................................... 14
10 Percent of public elementary school teachers, K-5, who taught nutrition, who usedvarious teaching strategies, to any extent, by various characteristics: 1997.................... 15
11 Percent of public elementary school teachers, K-5, who taught nutrition, whoreported various barriers to cooperation with their school meals program staff inproviding nutrition education: 1997................................................................................. 16
12 Percent of public elementary school teachers, K-5, who taught nutrition, whoreported no barriers to cooperation with their school meals program in providingnutrition education, and percent who reported barriers to a great extent, by variouscharacteristics: 1997......................................................................................................... 17
13 Percent of public elementary school teachers, K-5, who reported they or theirschools used various strategies to involve parents in the nutrition education of theirchildren: 1997................................................................................................................... 19
viii
Table of Contents (continued)
List of Tables (continued)
Tables Page
14 Percent of public elementary school teachers, K-5, who reported they or theirschools used various strategies to any extent to involve parents in the nutritioneducation of their children, by various characteristics: 1997........................................... 20
15 Percent of public elementary school teachers, K-5, who taught nutrition, by thequality of instructional materials currently in use for nutrition education: 1997 ............ 21
16 Percent of public elementary school teachers, K-5, who taught nutrition, by theextent to which they used nutrition education materials they found or developed ontheir own, by various characteristics: 1997...................................................................... 23
17 Percent of public elementary school teachers, K-5, by the extent to which variousinstructional materials would be useful to them in nutrition education, byinstructional level: 1997 ................................................................................................... 24
ix
Table of Contents (continued)
List of Tables of Standard Errors
Tables Page
1a Standard errors of mean years of teaching and grades taught by public elementaryschool teachers, K-5, who taught self-contained classes:: 1997 ...................................... 39
2a Standard errors of mean number of hours or courses taken by public elementaryschool teachers, K-5, to prepare them to teach about nutrition, by type of training:1997 ................................................................................................................................... 40
3a Standard errors of percent of public elementary school teachers, K-5, who reportedthe availability at their school of various resources in support of nutrition education,by geographic region: 1997 .............................................................................................. 41
4a Standard errors of percent of public elementary school teachers, K-5, who reportedthe potential of various resources to improve nutrition education: 1997......................... 42
5a Standard errors of percent of public elementary school teachers, K-5, who taughtnutrition in school year 1996-97, and for those who taught nutrition, the standarderrors of the mean number of total hours taught, by instructional level: 1997 ................ 43
6a Standard errors of percent of public elementary school teachers, K-5, who taughtnutrition, by the extent to which they integrated lessons about nutrition into varioussubjects: 1997................................................................................................................... 44
7a Standard errors of percent of public elementary school teachers, K-5, who taughtnutrition as a separate subject and who integrated lessons into other subjects to agreat extent, by various characteristics: 1997 .................................................................. 45
8a Standard errors of percent of public elementary school teachers, K-5, who taughtnutrition, by extent of use of various teaching strategies for nutrition lessons: 1997...... 46
9a Standard errors of percent of public elementary school teachers, K-5, who taughtnutrition, who used various teaching strategies to a moderate or great extent, byvarious characteristics: 1997 ............................................................................................ 47
10a Standard errors of percent of public elementary school teachers, K-5, who taughtnutrition, who used various teaching strategies to any extent, by variouscharacteristics: 1997......................................................................................................... 48
11a Standard errors of percent of public elementary school teachers, K-5, who taughtnutrition, who reported various barriers to cooperation with their school mealsprogram staff in providing nutrition education: 1997 ...................................................... 49
12a Standard errors of percent of public elementary school teachers, K-5, who taughtnutrition, who reported no barriers to cooperation with their school meals program inproviding nutrition education, and percent who reported barriers to a great extent,by various characteristics: 1997 ....................................................................................... 50
x
Table of Contents (continued)
List of Tables of Standard Errors (continued)
Tables Page
13a Standard errors of percent of public elementary school teachers, K-5, who reportedthey or their schools used various strategies to involve parents in the nutritioneducation of their children: 1997 ..................................................................................... 51
14a Standard errors of percent of public elementary school teachers, K-5, who reportedthey or their schools used various strategies to any extent to involve parents in thenutrition education of their children, by various characteristics: 1997............................ 52
15a Standard errors of percent of public elementary school teachers, K-5, who taughtnutrition, by the quality of instructional materials currently in use for nutritioneducation: 1997 ................................................................................................................ 53
16a Standard errors of percent of public elementary school teachers, K-5, who taughtnutrition, by the extent to which they used nutrition education materials they foundor developed on their own, by various characteristics: 1997 ........................................... 54
17a Standard errors of percent of public elementary school teachers, K-5, by the extent towhich various instructional materials would be useful to them in nutrition education,by instructional level: 1997 .............................................................................................. 55
18a Standard errors for figures................................................................................................. 56
1
Introduction The impact of diet on health has been described and documented innumerous studies and reports. Dietary recommendations and long-termhealth objectives, including the Dietary Guidelines for Americans1 and theYear 2000 Health Objectives for the Nation,2 call for Americans to reduceintake of total fat, saturated fat, and cholesterol; increase intake of fruits,vegetables, grain products, and foods rich in calcium; and moderate intake ofsugars, salt, and alcohol.
Many Americans consume excess calories for their level of activity, andhave diets inconsistent with the Dietary Guidelines for Americans—too highin fat, sodium, and sugar, with not enough grains, fruits, and vegetables.These unhealthy eating patterns may contribute to illness and prematuredeath in the long term.3 Because eating habits developed in childhood havethe potential to last a lifetime, it is important for children to learn thebenefits of good nutrition. Healthy People 2000 states as a national healthobjective that by the year 2000, at least 75 percent of the nation’s schoolswill provide nutrition education from preschool through 12th grade.
Thus far, there has been little national-level information available about thequantity and quality of nutrition education in schools. In 1996, the NationalCenter for Education Statistics (NCES) published results from the FastResponse Survey System (FRSS) study Nutrition Education in U.S. PublicSchools, K-12.4 That study provided information from a nationallyrepresentative sample of public schools about the placement of nutritioneducation in the curriculum, the content of nutrition instruction, thecoordination of nutrition education within the school, and the need forresources for nutrition education. Still, there was a need for data to addressquestions concerning the amount of nutrition instruction in classrooms andthe potential effectiveness of that instruction.
This report presents findings from the survey Nutrition Education in U.S.Public Schools, Elementary Teacher Survey, K-5, requested by the Food andNutrition Service of the U.S. Department of Agriculture (USDA). It wasdesigned as a followup to the 1996 school study to obtain data on nutritioneducation in elementary school classrooms to inform current and futureUSDA initiatives, including the School Meals Initiative for HealthyChildren.5 This initiative, begun in 1995, adds requirements for schools toserve meals that meet federal dietary guidelines and encourages schools to
1 U.S. Department of Agriculture and U.S. Department of Health and Human Services. Dietary
Guidelines for Americans. Home and Garden Bulletin No. 232. Fourth Edition, 1995.2 U.S. Department of Health and Human Services. Public Health Service. Healthy People 2000:
National Health Promotion and Disease Prevention Objectives. (PHS) 91-50212, 1991.3 Ibid, p. 112.4 U.S. Department of Education, National Center for Education Statistics. Nutrition Education in U.S.
Public Elementary and Secondary Schools, NCES 96-852, by Carin Celebuski and Elizabeth Farris,Judi Carpenter, project officer. 1996.
5 Part of the implementation of the National School Lunch Program. 7CFR Parts 210 and 220.
2
teach children about nutrition so they are motivated to make healthy foodchoices. A pilot program for schools, called Team Nutrition, aims toimprove nutrition education in classrooms. The self-administered mailsurvey requested information about the following issues:
• Resources and policies for nutrition education,
• Nutrition education in the classroom,
• Working with the school meals program staff,
• Working with parents,
• Instructional materials for nutrition education, and
• Training in nutrition education.
The goal of this study was to provide a national picture of the quantity andquality of nutrition education in public elementary school classrooms.
Previous research in nutrition education was used to inform our analysis. Inreviews of research about nutrition education published in a special issue ofthe Journal of Nutrition Education,6 several of the major researchers in thisfield describe both characteristics of high-quality nutrition education (i.e.,effective at changing knowledge, attitudes, and behaviors) for school-agedchildren and the effects of training in nutrition education on teachers.According to the authors, the following elements appear to contribute to theeffectiveness of nutrition education:
• Instruction with a behavioral focus, or a focus on changing specificbehaviors rather than on learning general facts about nutrition;7
• Employment of active learning strategies instead of relying exclusivelyon information dissemination and didactic teaching methods; 8
• Devotion of adequate time and intensity to nutrition education (itappears to take 50 hours per year to impact attitudes and behavior);9
• A family involvement component;10
• A meals program and food-related policies that reinforce classroomnutrition education;11 and
6 Journal of Nutrition Education. (Special Issue) “The Effectiveness of Nutrition Education and
Implications for Nutrition Education Policy, Programs, and Research: A Review of Research.” 27(6)(November-December 1995).
7 Leslie A. Lytle, “Nutrition Education for School-aged Children.” Journal of Nutrition Education, 27(6)(November-December 1995):306.
8 Ibid., 306.9 Ibid, 307.10 Ibid, 307.
11 Ibid, 308.
3
• Teachers with adequate training in nutrition education12 (trainingappears to have a positive effect on the quality of nutrition education,but less so on the quantity13).
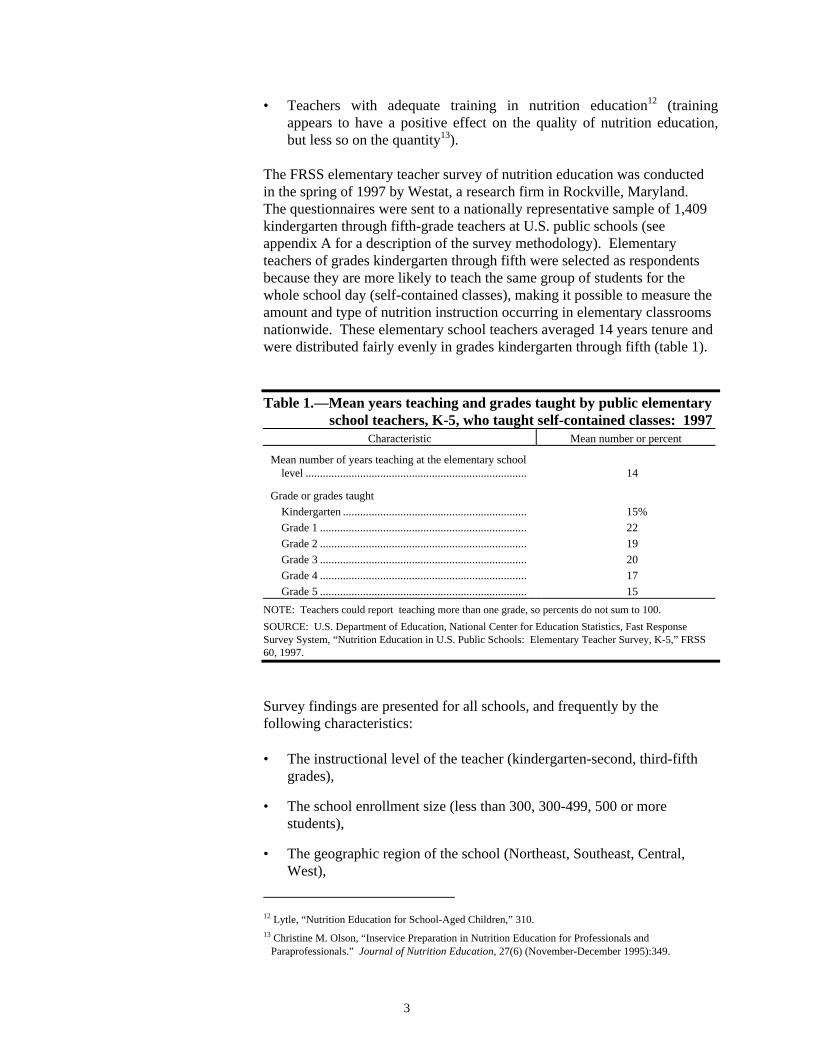
The FRSS elementary teacher survey of nutrition education was conductedin the spring of 1997 by Westat, a research firm in Rockville, Maryland.The questionnaires were sent to a nationally representative sample of 1,409kindergarten through fifth-grade teachers at U.S. public schools (seeappendix A for a description of the survey methodology). Elementaryteachers of grades kindergarten through fifth were selected as respondentsbecause they are more likely to teach the same group of students for thewhole school day (self-contained classes), making it possible to measure theamount and type of nutrition instruction occurring in elementary classroomsnationwide. These elementary school teachers averaged 14 years tenure andwere distributed fairly evenly in grades kindergarten through fifth (table 1).
Table 1.—Mean years teaching and grades taught by public elementaryschool teachers, K-5, who taught self-contained classes: 1997
Characteristic Mean number or percent
Mean number of years teaching at the elementary schoollevel ............................................................................. 14
Grade or grades taught
Kindergarten ................................................................ 15%
Grade 1 ........................................................................ 22
Grade 2 ........................................................................ 19
Grade 3 ........................................................................ 20
Grade 4 ........................................................................ 17
Grade 5 ........................................................................ 15
NOTE: Teachers could report teaching more than one grade, so percents do not sum to 100.
SOURCE: U.S. Department of Education, National Center for Education Statistics, Fast ResponseSurvey System, “Nutrition Education in U.S. Public Schools: Elementary Teacher Survey, K-5,” FRSS60, 1997.
Survey findings are presented for all schools, and frequently by thefollowing characteristics:
• The instructional level of the teacher (kindergarten-second, third-fifthgrades),
• The school enrollment size (less than 300, 300-499, 500 or morestudents),
• The geographic region of the school (Northeast, Southeast, Central,West),
12 Lytle, “Nutrition Education for School-Aged Children,” 310.13 Christine M. Olson, “Inservice Preparation in Nutrition Education for Professionals and
Paraprofessionals.” Journal of Nutrition Education, 27(6) (November-December 1995):349.
4
• The level of support for nutrition education at the school (0-3 resources,4-6 resources), and
• The type of nutrition education training the teacher has received (none,research on own, inservice, college coursework).
The classification variables “level of support for nutrition education at theschool” and “type of nutrition education training the teacher has received”were constructed from information reported by teachers on theirquestionnaires. The level of support variable was constructed fromresponses to six questions asking about the availability of specific resourcesand policies in support of nutrition education at the school. Teachersreporting zero to three resources available to them were categorized as beingin low-support schools; those reporting four to six resources were in high-support schools.14 The training variable was constructed from responses tofour questions asking about participation in various types of training.Teachers could report participation in more than one type of training whenresponding to the question. Responses were recoded to the most formal typeof training. From most to least formal, the categories used are collegecoursework, inservice/professional development training, research andreading on own, and none of these types.
Data have been weighted to national estimates of public elementary schoolteachers. All comparative statements made in this report have been testedfor statistical significance through chi-square tests or t-tests adjusted formultiple comparisons using Bonferroni adjustments and are significant at the0.05 level or better. However, not all statistically significant comparisonshave been presented.
14 These categories were determined from examining the distribution of total resources available.
Approximately half of teachers reported 0-3 resources and approximately half reported 4-6 resources.
5
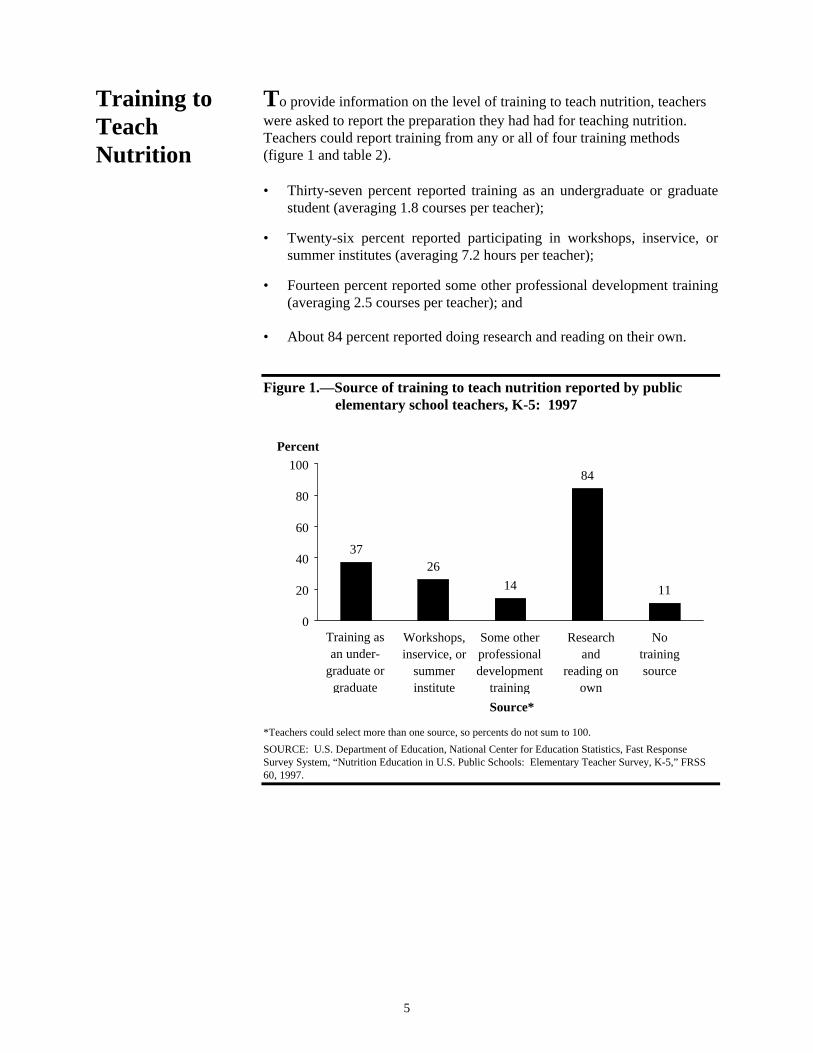
Training toTeachNutrition
To provide information on the level of training to teach nutrition, teacherswere asked to report the preparation they had had for teaching nutrition.Teachers could report training from any or all of four training methods(figure 1 and table 2).
• Thirty-seven percent reported training as an undergraduate or graduatestudent (averaging 1.8 courses per teacher);
• Twenty-six percent reported participating in workshops, inservice, orsummer institutes (averaging 7.2 hours per teacher);
• Fourteen percent reported some other professional development training(averaging 2.5 courses per teacher); and
• About 84 percent reported doing research and reading on their own.
Figure 1.—Source of training to teach nutrition reported by publicelementary school teachers, K-5: 1997
11
3726
14
84
0
20
40
60
80
100
Source*
Percent
Training as an under-
graduate or graduate
Workshops, inservice, or
summer institute training
Some other professional development
training
Notrainingsource
Research and
reading on own
*Teachers could select more than one source, so percents do not sum to 100.
SOURCE: U.S. Department of Education, National Center for Education Statistics, Fast ResponseSurvey System, “Nutrition Education in U.S. Public Schools: Elementary Teacher Survey, K-5,” FRSS60, 1997.
6
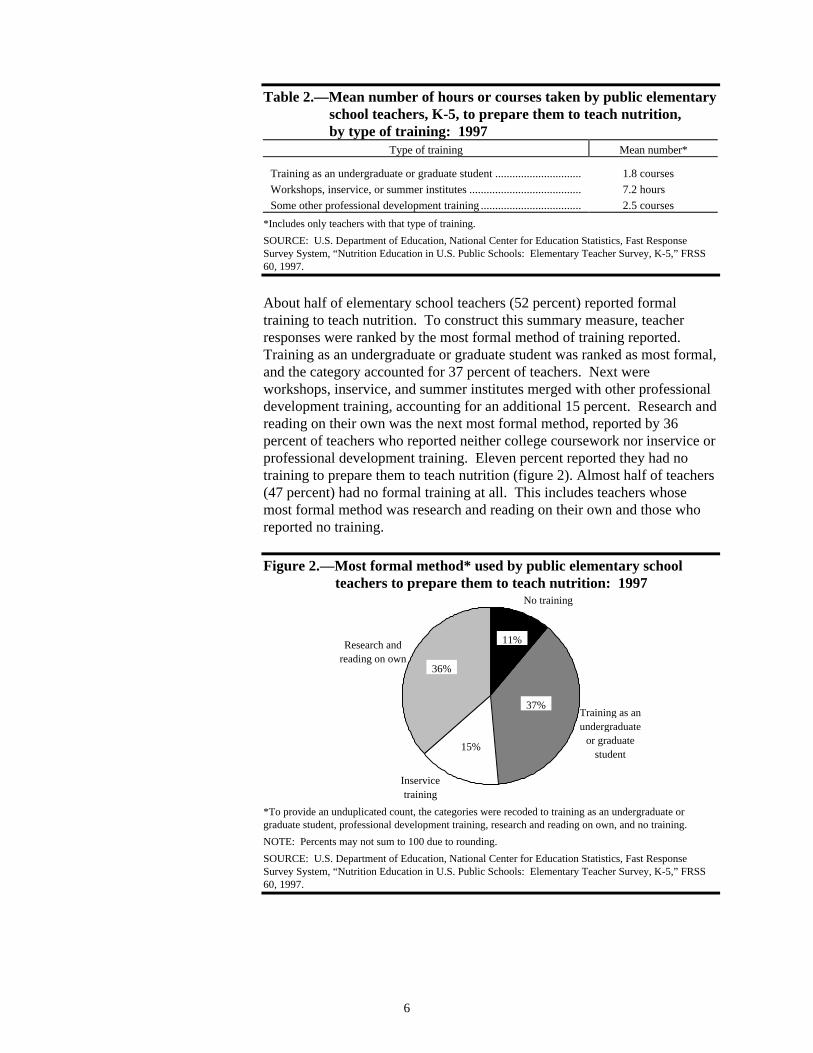
Table 2.—Mean number of hours or courses taken by public elementaryschool teachers, K-5, to prepare them to teach nutrition,by type of training: 1997
Type of training Mean number*
Training as an undergraduate or graduate student .............................. 1.8 courses
Workshops, inservice, or summer institutes ....................................... 7.2 hours
Some other professional development training ................................... 2.5 courses
*Includes only teachers with that type of training.
SOURCE: U.S. Department of Education, National Center for Education Statistics, Fast ResponseSurvey System, “Nutrition Education in U.S. Public Schools: Elementary Teacher Survey, K-5,” FRSS60, 1997.
About half of elementary school teachers (52 percent) reported formaltraining to teach nutrition. To construct this summary measure, teacherresponses were ranked by the most formal method of training reported.Training as an undergraduate or graduate student was ranked as most formal,and the category accounted for 37 percent of teachers. Next wereworkshops, inservice, and summer institutes merged with other professionaldevelopment training, accounting for an additional 15 percent. Research andreading on their own was the next most formal method, reported by 36percent of teachers who reported neither college coursework nor inservice orprofessional development training. Eleven percent reported they had notraining to prepare them to teach nutrition (figure 2). Almost half of teachers(47 percent) had no formal training at all. This includes teachers whosemost formal method was research and reading on their own and those whoreported no training.
Figure 2.—Most formal method* used by public elementary schoolteachers to prepare them to teach nutrition: 1997
No training
Training as an undergraduate
or graduate student
Research and reading on own
Inservice training
36%
11%
37%
15%
*To provide an unduplicated count, the categories were recoded to training as an undergraduate orgraduate student, professional development training, research and reading on own, and no training.
NOTE: Percents may not sum to 100 due to rounding.
SOURCE: U.S. Department of Education, National Center for Education Statistics, Fast ResponseSurvey System, “Nutrition Education in U.S. Public Schools: Elementary Teacher Survey, K-5,” FRSS60, 1997.
7
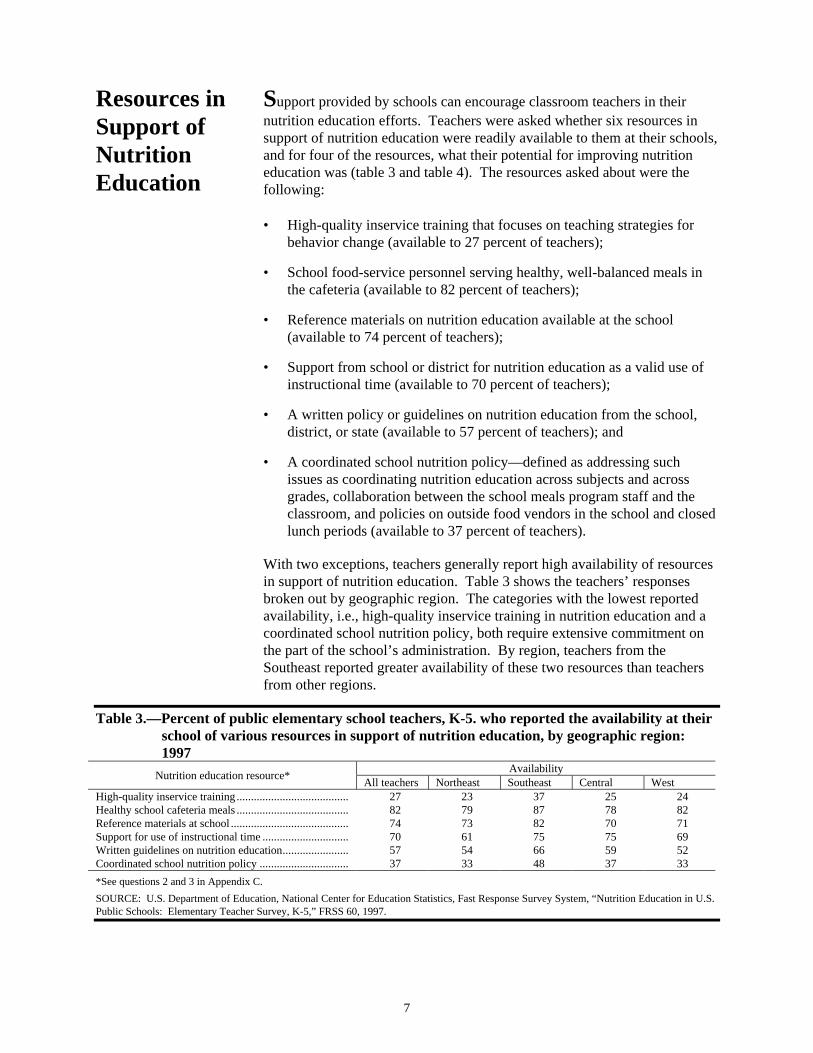
Resources inSupport ofNutritionEducation
Support provided by schools can encourage classroom teachers in theirnutrition education efforts. Teachers were asked whether six resources insupport of nutrition education were readily available to them at their schools,and for four of the resources, what their potential for improving nutritioneducation was (table 3 and table 4). The resources asked about were thefollowing:
• High-quality inservice training that focuses on teaching strategies forbehavior change (available to 27 percent of teachers);
• School food-service personnel serving healthy, well-balanced meals inthe cafeteria (available to 82 percent of teachers);
• Reference materials on nutrition education available at the school(available to 74 percent of teachers);
• Support from school or district for nutrition education as a valid use ofinstructional time (available to 70 percent of teachers);
• A written policy or guidelines on nutrition education from the school,district, or state (available to 57 percent of teachers); and
• A coordinated school nutrition policy—defined as addressing suchissues as coordinating nutrition education across subjects and acrossgrades, collaboration between the school meals program staff and theclassroom, and policies on outside food vendors in the school and closedlunch periods (available to 37 percent of teachers).
With two exceptions, teachers generally report high availability of resourcesin support of nutrition education. Table 3 shows the teachers’ responsesbroken out by geographic region. The categories with the lowest reportedavailability, i.e., high-quality inservice training in nutrition education and acoordinated school nutrition policy, both require extensive commitment onthe part of the school’s administration. By region, teachers from theSoutheast reported greater availability of these two resources than teachersfrom other regions.
Table 3.—Percent of public elementary school teachers, K-5. who reported the availability at theirschool of various resources in support of nutrition education, by geographic region:1997
AvailabilityNutrition education resource*
All teachers Northeast Southeast Central WestHigh-quality inservice training ....................................... 27 23 37 25 24Healthy school cafeteria meals ....................................... 82 79 87 78 82Reference materials at school ......................................... 74 73 82 70 71Support for use of instructional time .............................. 70 61 75 75 69Written guidelines on nutrition education....................... 57 54 66 59 52Coordinated school nutrition policy ............................... 37 33 48 37 33
*See questions 2 and 3 in Appendix C.
SOURCE: U.S. Department of Education, National Center for Education Statistics, Fast Response Survey System, “Nutrition Education in U.S.Public Schools: Elementary Teacher Survey, K-5,” FRSS 60, 1997.
8
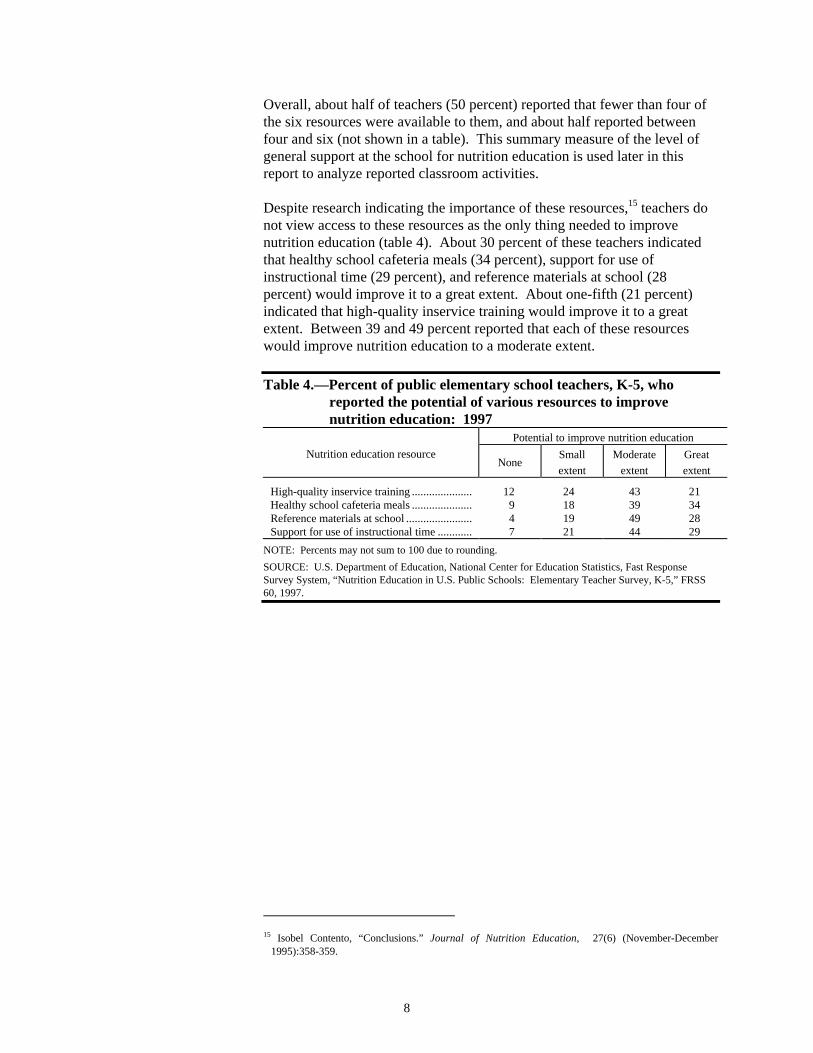
Overall, about half of teachers (50 percent) reported that fewer than four ofthe six resources were available to them, and about half reported betweenfour and six (not shown in a table). This summary measure of the level ofgeneral support at the school for nutrition education is used later in thisreport to analyze reported classroom activities.
Despite research indicating the importance of these resources,15 teachers donot view access to these resources as the only thing needed to improvenutrition education (table 4). About 30 percent of these teachers indicatedthat healthy school cafeteria meals (34 percent), support for use ofinstructional time (29 percent), and reference materials at school (28percent) would improve it to a great extent. About one-fifth (21 percent)indicated that high-quality inservice training would improve it to a greatextent. Between 39 and 49 percent reported that each of these resourceswould improve nutrition education to a moderate extent.
Table 4.—Percent of public elementary school teachers, K-5, whoreported the potential of various resources to improvenutrition education: 1997
Potential to improve nutrition education
Nutrition education resourceNone
Small
extent
Moderate
extent
Great
extent
High-quality inservice training ..................... 12 24 43 21Healthy school cafeteria meals ..................... 9 18 39 34Reference materials at school ....................... 4 19 49 28Support for use of instructional time ............ 7 21 44 29
NOTE: Percents may not sum to 100 due to rounding.
SOURCE: U.S. Department of Education, National Center for Education Statistics, Fast ResponseSurvey System, “Nutrition Education in U.S. Public Schools: Elementary Teacher Survey, K-5,” FRSS60, 1997.
15 Isobel Contento, “Conclusions.” Journal of Nutrition Education, 27(6) (November-December
1995):358-359.
9
NutritionEducationin theClassroom
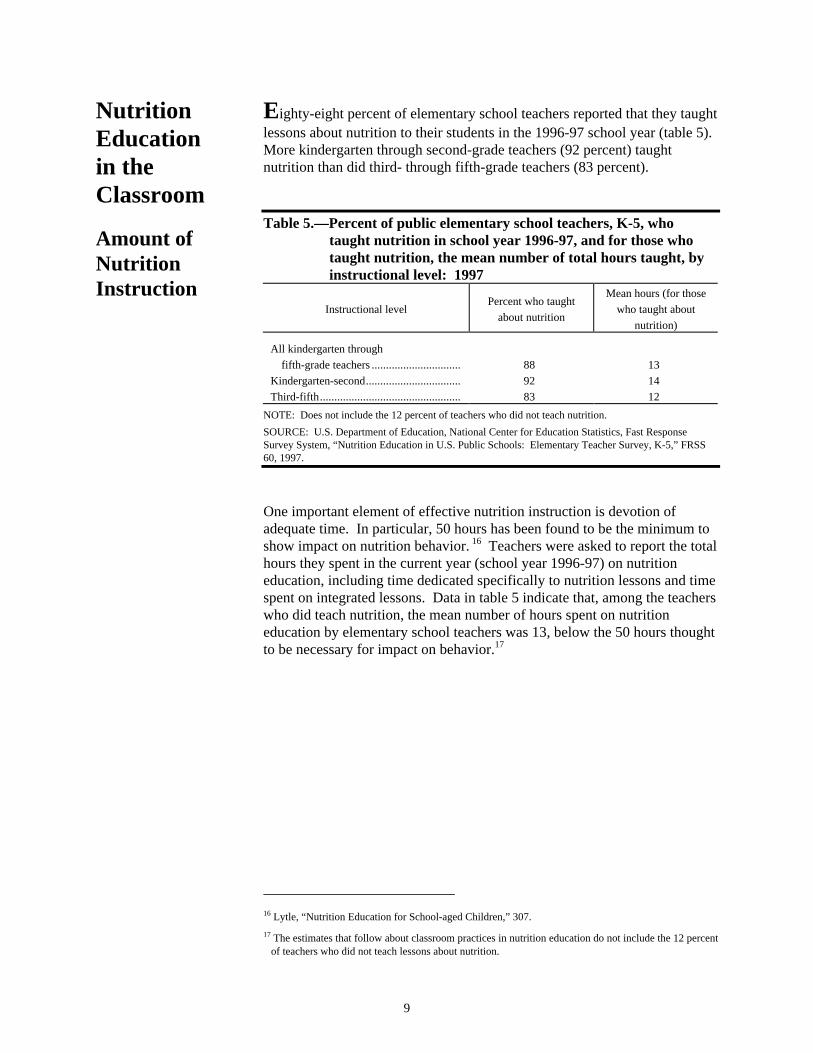
Amount ofNutritionInstruction
Eighty-eight percent of elementary school teachers reported that they taughtlessons about nutrition to their students in the 1996-97 school year (table 5).More kindergarten through second-grade teachers (92 percent) taughtnutrition than did third- through fifth-grade teachers (83 percent).
Table 5.—Percent of public elementary school teachers, K-5, whotaught nutrition in school year 1996-97, and for those whotaught nutrition, the mean number of total hours taught, byinstructional level: 1997
Instructional levelPercent who taught
about nutrition
Mean hours (for those
who taught about
nutrition)
All kindergarten through
fifth-grade teachers ............................... 88 13
Kindergarten-second................................. 92 14
Third-fifth................................................. 83 12
NOTE: Does not include the 12 percent of teachers who did not teach nutrition.
SOURCE: U.S. Department of Education, National Center for Education Statistics, Fast ResponseSurvey System, “Nutrition Education in U.S. Public Schools: Elementary Teacher Survey, K-5,” FRSS60, 1997.
One important element of effective nutrition instruction is devotion ofadequate time. In particular, 50 hours has been found to be the minimum toshow impact on nutrition behavior. 16 Teachers were asked to report the totalhours they spent in the current year (school year 1996-97) on nutritioneducation, including time dedicated specifically to nutrition lessons and timespent on integrated lessons. Data in table 5 indicate that, among the teacherswho did teach nutrition, the mean number of hours spent on nutritioneducation by elementary school teachers was 13, below the 50 hours thoughtto be necessary for impact on behavior.17
16 Lytle, “Nutrition Education for School-aged Children,” 307.
17 The estimates that follow about classroom practices in nutrition education do not include the 12 percentof teachers who did not teach lessons about nutrition.
10
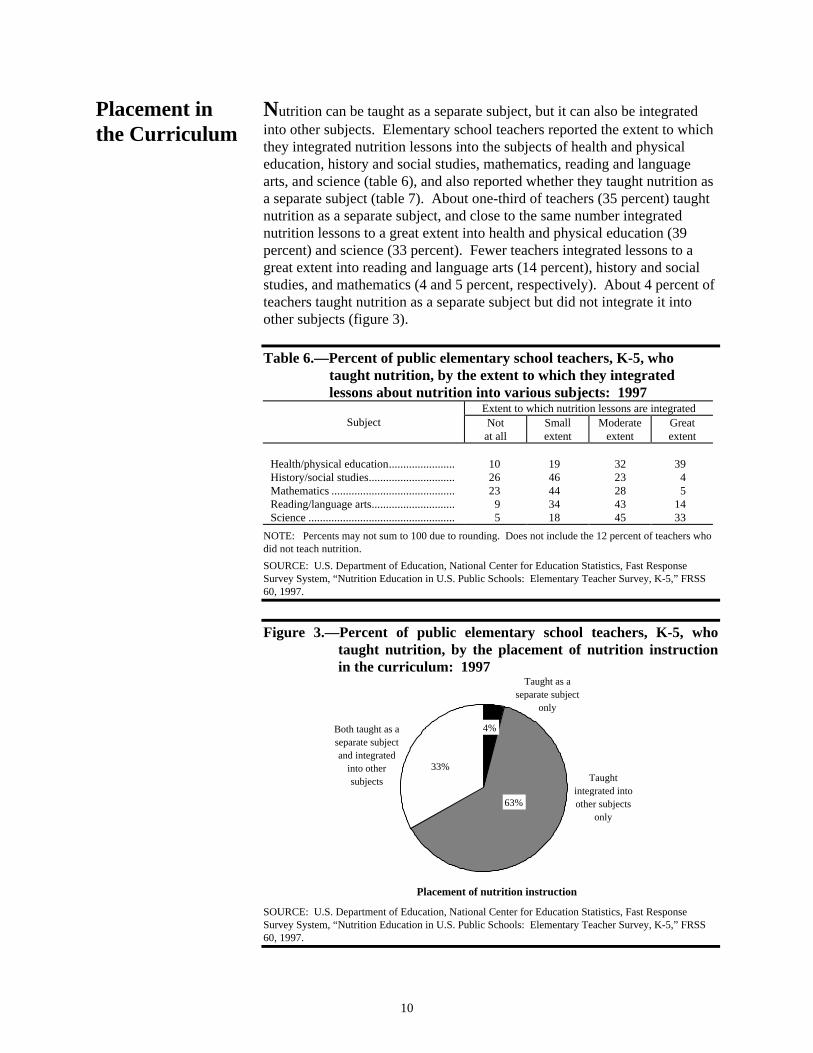
Placement inthe Curriculum
Nutrition can be taught as a separate subject, but it can also be integratedinto other subjects. Elementary school teachers reported the extent to whichthey integrated nutrition lessons into the subjects of health and physicaleducation, history and social studies, mathematics, reading and languagearts, and science (table 6), and also reported whether they taught nutrition asa separate subject (table 7). About one-third of teachers (35 percent) taughtnutrition as a separate subject, and close to the same number integratednutrition lessons to a great extent into health and physical education (39percent) and science (33 percent). Fewer teachers integrated lessons to agreat extent into reading and language arts (14 percent), history and socialstudies, and mathematics (4 and 5 percent, respectively). About 4 percent ofteachers taught nutrition as a separate subject but did not integrate it intoother subjects (figure 3).
Table 6.—Percent of public elementary school teachers, K-5, whotaught nutrition, by the extent to which they integratedlessons about nutrition into various subjects: 1997
Extent to which nutrition lessons are integratedSubject Not
at allSmallextent
Moderateextent
Greatextent
Health/physical education....................... 10 19 32 39History/social studies.............................. 26 46 23 4Mathematics ........................................... 23 44 28 5Reading/language arts............................. 9 34 43 14Science ................................................... 5 18 45 33
NOTE: Percents may not sum to 100 due to rounding. Does not include the 12 percent of teachers whodid not teach nutrition.
SOURCE: U.S. Department of Education, National Center for Education Statistics, Fast ResponseSurvey System, “Nutrition Education in U.S. Public Schools: Elementary Teacher Survey, K-5,” FRSS60, 1997.
Figure 3.—Percent of public elementary school teachers, K-5, whotaught nutrition, by the placement of nutrition instructionin the curriculum: 1997
Both taught as a separate subject and integrated
into other subjects
Taught as a separate subject
only
Taught integrated into other subjects
only
33%
4%
63%
Placement of nutrition instruction
SOURCE: U.S. Department of Education, National Center for Education Statistics, Fast ResponseSurvey System, “Nutrition Education in U.S. Public Schools: Elementary Teacher Survey, K-5,” FRSS60, 1997.
11
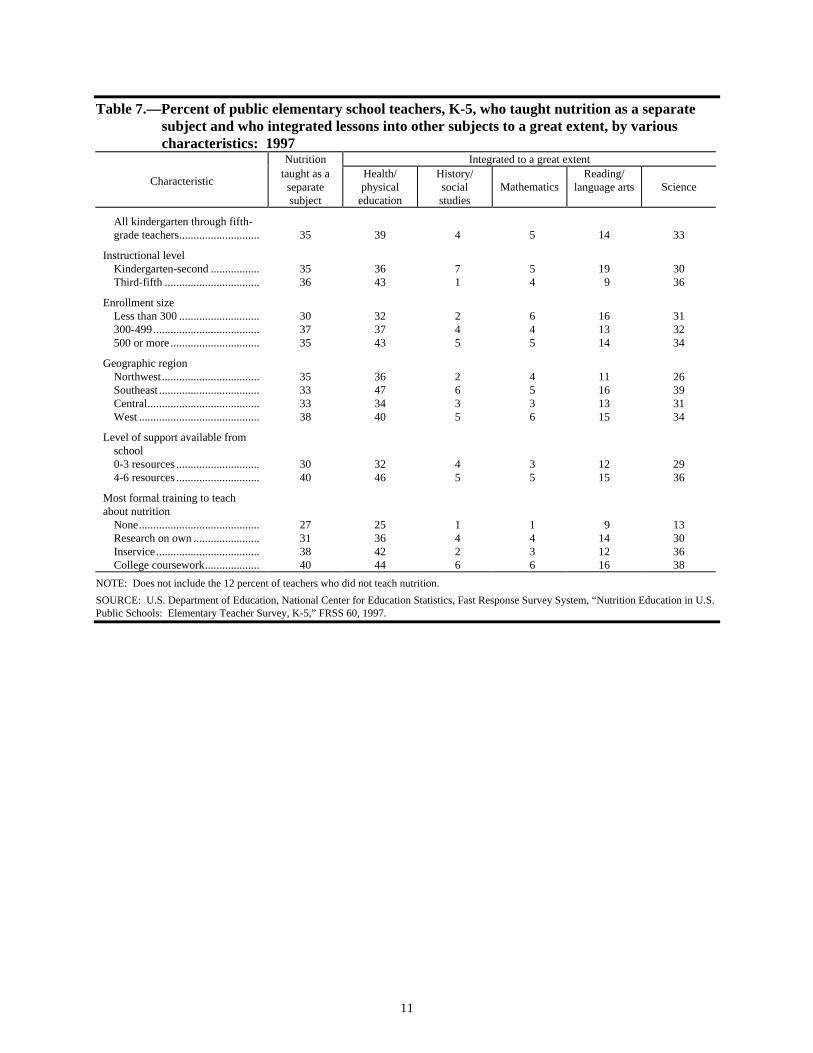
Table 7.—Percent of public elementary school teachers, K-5, who taught nutrition as a separatesubject and who integrated lessons into other subjects to a great extent, by variouscharacteristics: 1997
Nutrition Integrated to a great extent
Characteristictaught as a
separatesubject
Health/physical
education
History/socialstudies
MathematicsReading/
language arts Science
All kindergarten through fifth-grade teachers............................ 35 39 4 5 14 33
Instructional levelKindergarten-second ................. 35 36 7 5 19 30Third-fifth ................................. 36 43 1 4 9 36
Enrollment sizeLess than 300 ............................ 30 32 2 6 16 31300-499..................................... 37 37 4 4 13 32500 or more ............................... 35 43 5 5 14 34
Geographic regionNorthwest.................................. 35 36 2 4 11 26Southeast ................................... 33 47 6 5 16 39Central....................................... 33 34 3 3 13 31West .......................................... 38 40 5 6 15 34
Level of support available fromschool0-3 resources ............................. 30 32 4 3 12 294-6 resources ............................. 40 46 5 5 15 36
Most formal training to teachabout nutrition
None.......................................... 27 25 1 1 9 13Research on own ....................... 31 36 4 4 14 30Inservice.................................... 38 42 2 3 12 36College coursework................... 40 44 6 6 16 38
NOTE: Does not include the 12 percent of teachers who did not teach nutrition.
SOURCE: U.S. Department of Education, National Center for Education Statistics, Fast Response Survey System, “Nutrition Education in U.S.Public Schools: Elementary Teacher Survey, K-5,” FRSS 60, 1997.
12
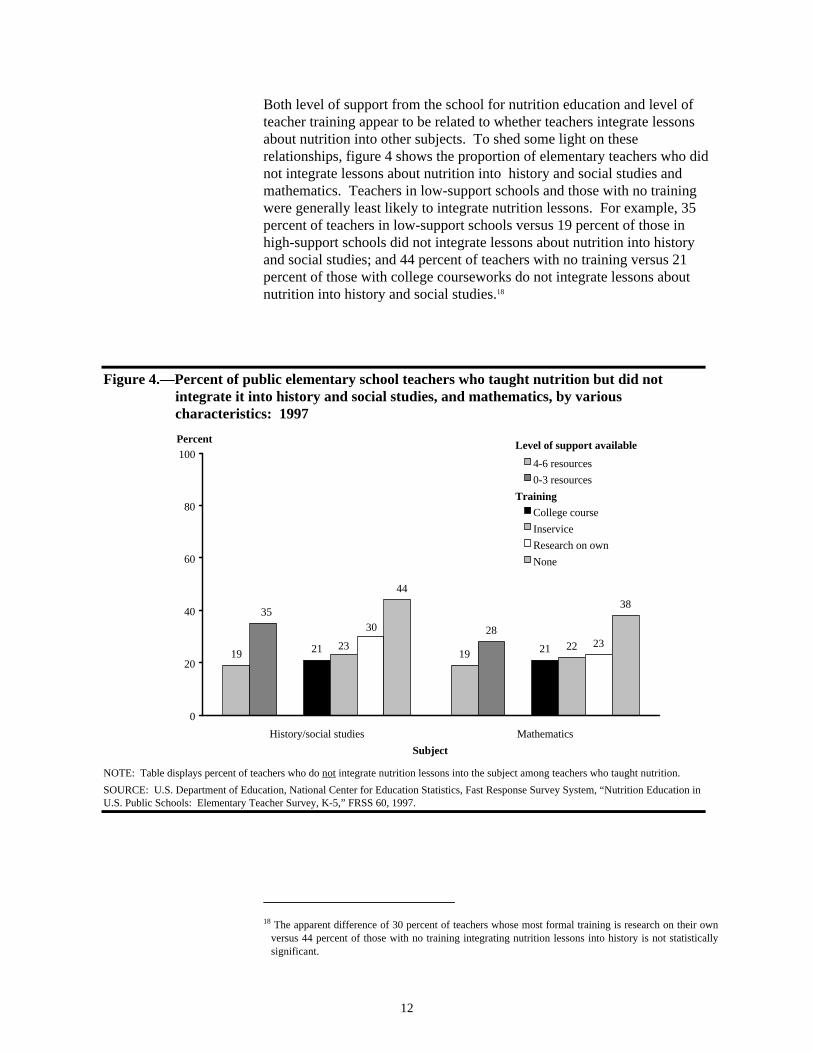
Both level of support from the school for nutrition education and level ofteacher training appear to be related to whether teachers integrate lessonsabout nutrition into other subjects. To shed some light on theserelationships, figure 4 shows the proportion of elementary teachers who didnot integrate lessons about nutrition into history and social studies andmathematics. Teachers in low-support schools and those with no trainingwere generally least likely to integrate nutrition lessons. For example, 35percent of teachers in low-support schools versus 19 percent of those inhigh-support schools did not integrate lessons about nutrition into historyand social studies; and 44 percent of teachers with no training versus 21percent of those with college courseworks do not integrate lessons aboutnutrition into history and social studies.18
18 The apparent difference of 30 percent of teachers whose most formal training is research on their own
versus 44 percent of those with no training integrating nutrition lessons into history is not statisticallysignificant.
Figure 4.—Percent of public elementary school teachers who taught nutrition but did notintegrate it into history and social studies, and mathematics, by variouscharacteristics: 1997
19 19
28
21 21 22 23
3835
23
30
44
0
20
40
60
80
100
History/social studies Mathematics
4-6 resources
0-3 resources
College course
Inservice
Research on own
None
Level of support available
Training
Subject
Percent
NOTE: Table displays percent of teachers who do not integrate nutrition lessons into the subject among teachers who taught nutrition.
SOURCE: U.S. Department of Education, National Center for Education Statistics, Fast Response Survey System, “Nutrition Education inU.S. Public Schools: Elementary Teacher Survey, K-5,” FRSS 60, 1997.
13
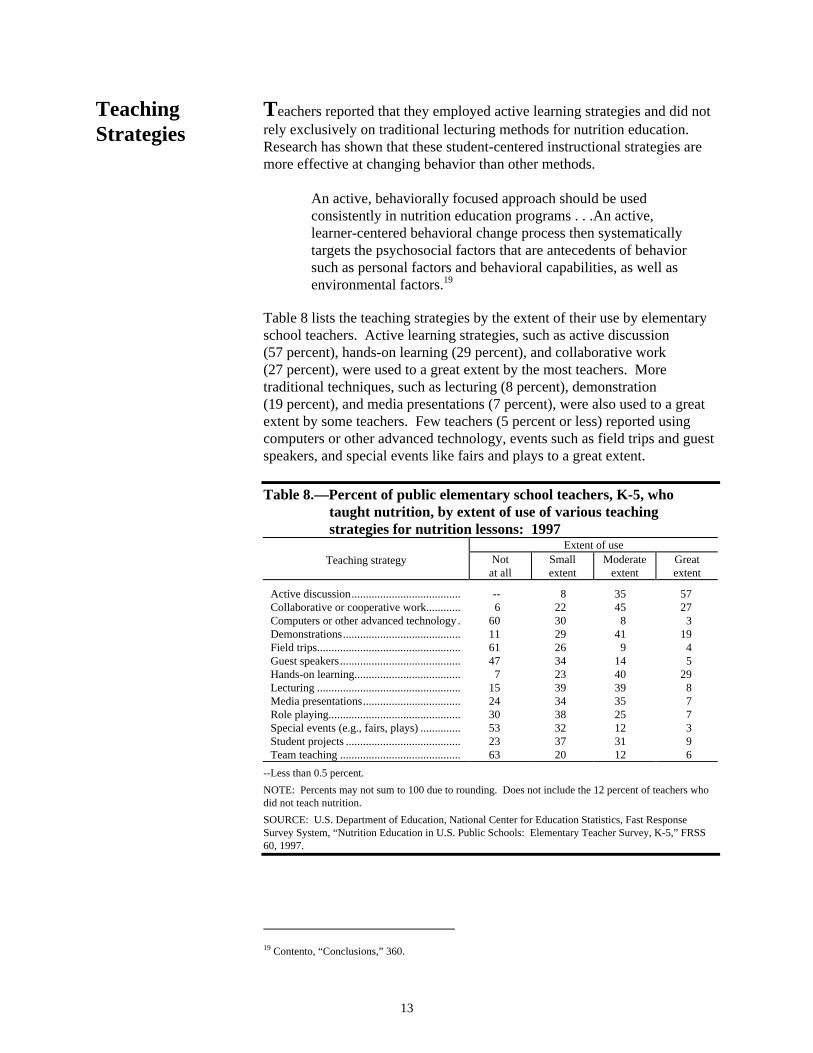
TeachingStrategies
Teachers reported that they employed active learning strategies and did notrely exclusively on traditional lecturing methods for nutrition education.Research has shown that these student-centered instructional strategies aremore effective at changing behavior than other methods.
An active, behaviorally focused approach should be usedconsistently in nutrition education programs . . .An active,learner-centered behavioral change process then systematicallytargets the psychosocial factors that are antecedents of behaviorsuch as personal factors and behavioral capabilities, as well asenvironmental factors.19
Table 8 lists the teaching strategies by the extent of their use by elementaryschool teachers. Active learning strategies, such as active discussion(57 percent), hands-on learning (29 percent), and collaborative work(27 percent), were used to a great extent by the most teachers. Moretraditional techniques, such as lecturing (8 percent), demonstration(19 percent), and media presentations (7 percent), were also used to a greatextent by some teachers. Few teachers (5 percent or less) reported usingcomputers or other advanced technology, events such as field trips and guestspeakers, and special events like fairs and plays to a great extent.
Table 8.—Percent of public elementary school teachers, K-5, whotaught nutrition, by extent of use of various teachingstrategies for nutrition lessons: 1997
Extent of useTeaching strategy Not
at allSmallextent
Moderateextent
Greatextent
Active discussion...................................... -- 8 35 57Collaborative or cooperative work............ 6 22 45 27Computers or other advanced technology . 60 30 8 3Demonstrations......................................... 11 29 41 19Field trips.................................................. 61 26 9 4Guest speakers.......................................... 47 34 14 5Hands-on learning..................................... 7 23 40 29Lecturing .................................................. 15 39 39 8Media presentations.................................. 24 34 35 7Role playing.............................................. 30 38 25 7Special events (e.g., fairs, plays) .............. 53 32 12 3Student projects ........................................ 23 37 31 9Team teaching .......................................... 63 20 12 6
--Less than 0.5 percent.
NOTE: Percents may not sum to 100 due to rounding. Does not include the 12 percent of teachers whodid not teach nutrition.
SOURCE: U.S. Department of Education, National Center for Education Statistics, Fast ResponseSurvey System, “Nutrition Education in U.S. Public Schools: Elementary Teacher Survey, K-5,” FRSS60, 1997.
19 Contento, “Conclusions,” 360.
14
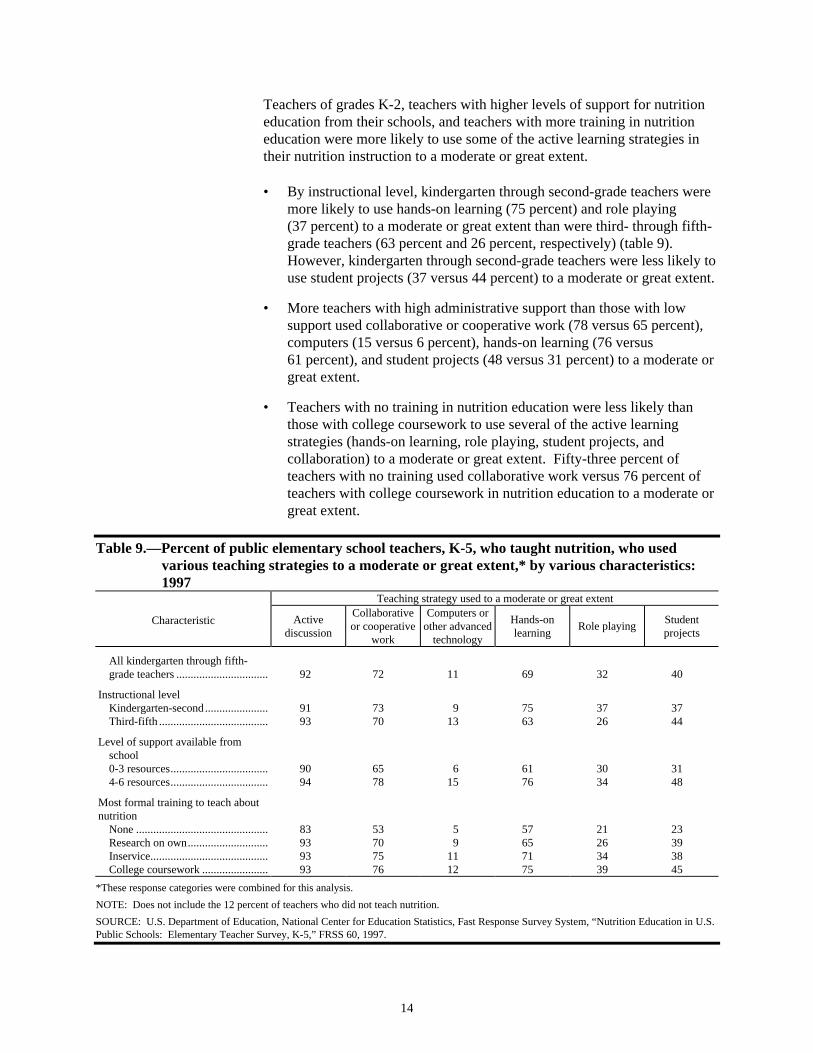
Teachers of grades K-2, teachers with higher levels of support for nutritioneducation from their schools, and teachers with more training in nutritioneducation were more likely to use some of the active learning strategies intheir nutrition instruction to a moderate or great extent.
• By instructional level, kindergarten through second-grade teachers weremore likely to use hands-on learning (75 percent) and role playing(37 percent) to a moderate or great extent than were third- through fifth-grade teachers (63 percent and 26 percent, respectively) (table 9).However, kindergarten through second-grade teachers were less likely touse student projects (37 versus 44 percent) to a moderate or great extent.
• More teachers with high administrative support than those with lowsupport used collaborative or cooperative work (78 versus 65 percent),computers (15 versus 6 percent), hands-on learning (76 versus61 percent), and student projects (48 versus 31 percent) to a moderate orgreat extent.
• Teachers with no training in nutrition education were less likely thanthose with college coursework to use several of the active learningstrategies (hands-on learning, role playing, student projects, andcollaboration) to a moderate or great extent. Fifty-three percent ofteachers with no training used collaborative work versus 76 percent ofteachers with college coursework in nutrition education to a moderate orgreat extent.
Table 9.—Percent of public elementary school teachers, K-5, who taught nutrition, who usedvarious teaching strategies to a moderate or great extent,* by various characteristics:1997
Teaching strategy used to a moderate or great extent
Characteristic Activediscussion
Collaborativeor cooperative
work
Computers orother advanced
technology
Hands-onlearning
Role playingStudentprojects
All kindergarten through fifth-grade teachers ................................ 92 72 11 69 32 40
Instructional levelKindergarten-second...................... 91 73 9 75 37 37Third-fifth ...................................... 93 70 13 63 26 44
Level of support available fromschool0-3 resources.................................. 90 65 6 61 30 314-6 resources.................................. 94 78 15 76 34 48
Most formal training to teach aboutnutrition
None .............................................. 83 53 5 57 21 23Research on own............................ 93 70 9 65 26 39Inservice......................................... 93 75 11 71 34 38College coursework ....................... 93 76 12 75 39 45
*These response categories were combined for this analysis.
NOTE: Does not include the 12 percent of teachers who did not teach nutrition.
SOURCE: U.S. Department of Education, National Center for Education Statistics, Fast Response Survey System, “Nutrition Education in U.S.Public Schools: Elementary Teacher Survey, K-5,” FRSS 60, 1997.
15
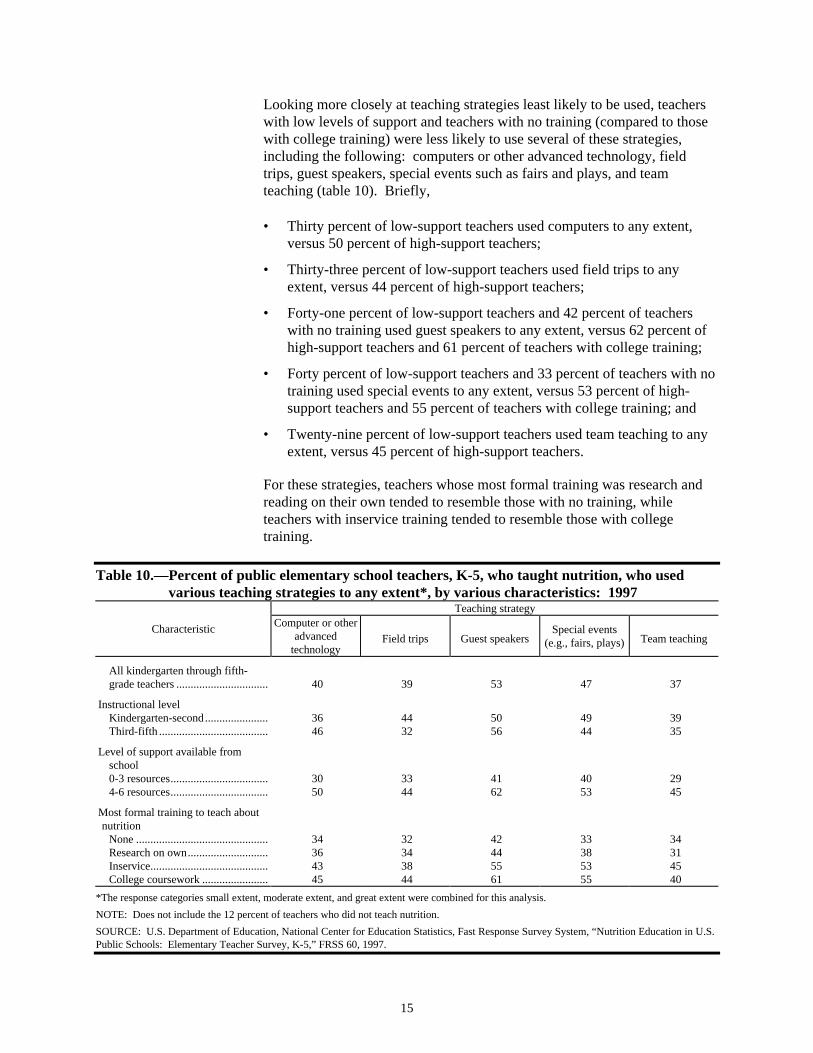
Looking more closely at teaching strategies least likely to be used, teacherswith low levels of support and teachers with no training (compared to thosewith college training) were less likely to use several of these strategies,including the following: computers or other advanced technology, fieldtrips, guest speakers, special events such as fairs and plays, and teamteaching (table 10). Briefly,
• Thirty percent of low-support teachers used computers to any extent,versus 50 percent of high-support teachers;
• Thirty-three percent of low-support teachers used field trips to anyextent, versus 44 percent of high-support teachers;
• Forty-one percent of low-support teachers and 42 percent of teacherswith no training used guest speakers to any extent, versus 62 percent ofhigh-support teachers and 61 percent of teachers with college training;
• Forty percent of low-support teachers and 33 percent of teachers with notraining used special events to any extent, versus 53 percent of high-support teachers and 55 percent of teachers with college training; and
• Twenty-nine percent of low-support teachers used team teaching to anyextent, versus 45 percent of high-support teachers.
For these strategies, teachers whose most formal training was research andreading on their own tended to resemble those with no training, whileteachers with inservice training tended to resemble those with collegetraining.
Table 10.—Percent of public elementary school teachers, K-5, who taught nutrition, who usedvarious teaching strategies to any extent*, by various characteristics: 1997
Teaching strategy
Characteristic Computer or otheradvanced
technologyField trips Guest speakers
Special events(e.g., fairs, plays) Team teaching
All kindergarten through fifth-grade teachers ................................ 40 39 53 47 37
Instructional levelKindergarten-second...................... 36 44 50 49 39Third-fifth ...................................... 46 32 56 44 35
Level of support available fromschool0-3 resources.................................. 30 33 41 40 294-6 resources.................................. 50 44 62 53 45
Most formal training to teach aboutnutrition
None .............................................. 34 32 42 33 34Research on own............................ 36 34 44 38 31Inservice......................................... 43 38 55 53 45College coursework ....................... 45 44 61 55 40
*The response categories small extent, moderate extent, and great extent were combined for this analysis.
NOTE: Does not include the 12 percent of teachers who did not teach nutrition.
SOURCE: U.S. Department of Education, National Center for Education Statistics, Fast Response Survey System, “Nutrition Education in U.S.Public Schools: Elementary Teacher Survey, K-5,” FRSS 60, 1997.
16
Working withthe SchoolMeals ProgramStaff
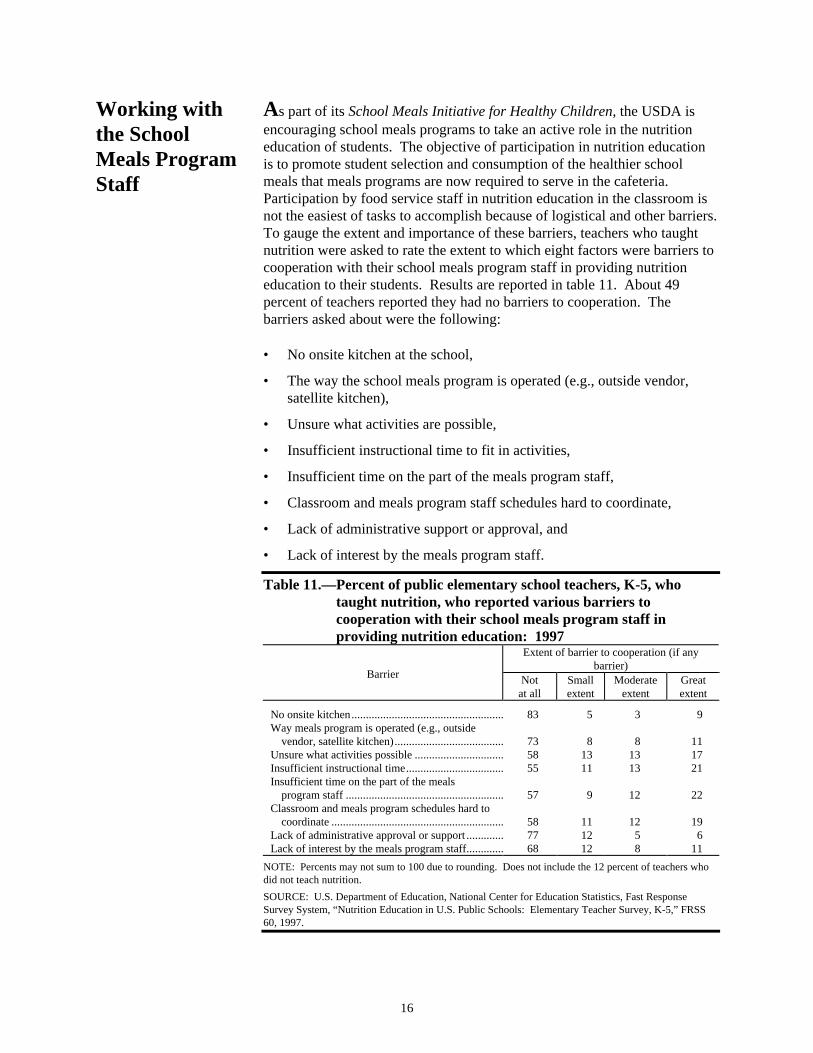
As part of its School Meals Initiative for Healthy Children, the USDA isencouraging school meals programs to take an active role in the nutritioneducation of students. The objective of participation in nutrition educationis to promote student selection and consumption of the healthier schoolmeals that meals programs are now required to serve in the cafeteria.Participation by food service staff in nutrition education in the classroom isnot the easiest of tasks to accomplish because of logistical and other barriers.To gauge the extent and importance of these barriers, teachers who taughtnutrition were asked to rate the extent to which eight factors were barriers tocooperation with their school meals program staff in providing nutritioneducation to their students. Results are reported in table 11. About 49percent of teachers reported they had no barriers to cooperation. Thebarriers asked about were the following:
• No onsite kitchen at the school,
• The way the school meals program is operated (e.g., outside vendor,satellite kitchen),
• Unsure what activities are possible,
• Insufficient instructional time to fit in activities,
• Insufficient time on the part of the meals program staff,
• Classroom and meals program staff schedules hard to coordinate,
• Lack of administrative support or approval, and
• Lack of interest by the meals program staff.
Table 11.—Percent of public elementary school teachers, K-5, whotaught nutrition, who reported various barriers tocooperation with their school meals program staff inproviding nutrition education: 1997
Extent of barrier to cooperation (if anybarrier)
Barrier Notat all
Smallextent
Moderateextent
Greatextent
No onsite kitchen..................................................... 83 5 3 9Way meals program is operated (e.g., outside
vendor, satellite kitchen)...................................... 73 8 8 11Unsure what activities possible ............................... 58 13 13 17Insufficient instructional time.................................. 55 11 13 21Insufficient time on the part of the meals
program staff ....................................................... 57 9 12 22Classroom and meals program schedules hard to
coordinate ............................................................ 58 11 12 19Lack of administrative approval or support ............. 77 12 5 6Lack of interest by the meals program staff............. 68 12 8 11
NOTE: Percents may not sum to 100 due to rounding. Does not include the 12 percent of teachers whodid not teach nutrition.
SOURCE: U.S. Department of Education, National Center for Education Statistics, Fast ResponseSurvey System, “Nutrition Education in U.S. Public Schools: Elementary Teacher Survey, K-5,” FRSS60, 1997.
17
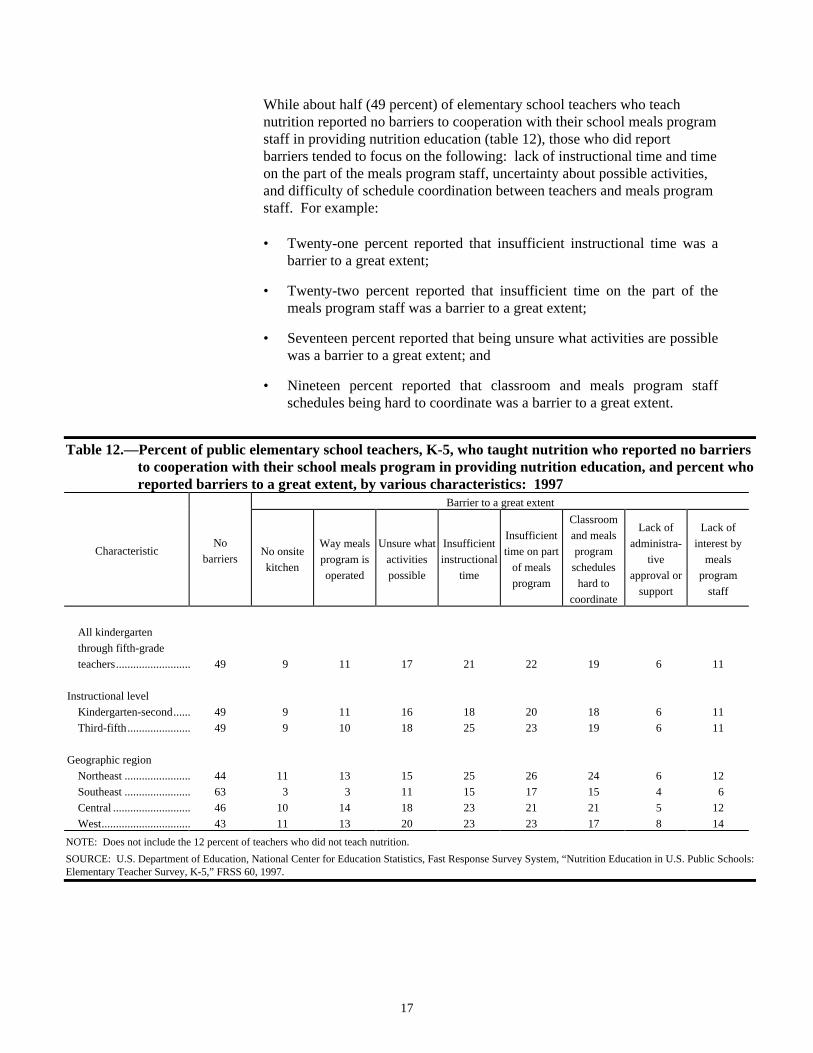
While about half (49 percent) of elementary school teachers who teachnutrition reported no barriers to cooperation with their school meals programstaff in providing nutrition education (table 12), those who did reportbarriers tended to focus on the following: lack of instructional time and timeon the part of the meals program staff, uncertainty about possible activities,and difficulty of schedule coordination between teachers and meals programstaff. For example:
• Twenty-one percent reported that insufficient instructional time was abarrier to a great extent;
• Twenty-two percent reported that insufficient time on the part of themeals program staff was a barrier to a great extent;
• Seventeen percent reported that being unsure what activities are possiblewas a barrier to a great extent; and
• Nineteen percent reported that classroom and meals program staffschedules being hard to coordinate was a barrier to a great extent.
Table 12.—Percent of public elementary school teachers, K-5, who taught nutrition who reported no barriersto cooperation with their school meals program in providing nutrition education, and percent whoreported barriers to a great extent, by various characteristics: 1997
Barrier to a great extent
CharacteristicNo
barriersNo onsite
kitchen
Way meals
program is
operated
Unsure what
activities
possible
Insufficient
instructional
time
Insufficient
time on part
of meals
program
Classroom
and meals
program
schedules
hard to
coordinate
Lack of
administra-
tive
approval or
support
Lack of
interest by
meals
program
staff
All kindergarten
through fifth-grade
teachers.......................... 49 9 11 17 21 22 19 6 11
Instructional level
Kindergarten-second...... 49 9 11 16 18 20 18 6 11
Third-fifth...................... 49 9 10 18 25 23 19 6 11
Geographic region
Northeast ....................... 44 11 13 15 25 26 24 6 12
Southeast ....................... 63 3 3 11 15 17 15 4 6
Central ........................... 46 10 14 18 23 21 21 5 12
West............................... 43 11 13 20 23 23 17 8 14
NOTE: Does not include the 12 percent of teachers who did not teach nutrition.
SOURCE: U.S. Department of Education, National Center for Education Statistics, Fast Response Survey System, “Nutrition Education in U.S. Public Schools:Elementary Teacher Survey, K-5,” FRSS 60, 1997.
18
Cited less frequently as barriers to a great extent were the lack of an onsitekitchen (9 percent), the way the meals program is operated (11 percent), andlack of interest on the part of the meals program staff (11 percent). (Theway the meals program is operated includes arrangements such as outsidevendors and satellite kitchens.) Six percent reported that lack ofadministrative approval or support was a great barrier to cooperation withthe meals program staff.
Table 12 shows the reported barriers broken out by instructional level andgeographic region. There are some differences in barriers cited betweenteachers in different geographic regions. Teachers in the Southeast weremore likely to report having no barriers to cooperation (63 percent, versus44 percent for the Northeast, 46 percent for the Central, and 43 percent forthe West). Southeast teachers were also less likely to report the way themeals program is operated as a barrier (3 percent, versus 13 percent,14 percent, and 13 percent, respectively).
Working withParents
Family involvement is an important element in effective nutrition educationfor elementary school students.20 All surveyed teachers were asked theextent to which they or their schools used any of following eight strategies toinvolve parents in the nutrition education of their children:
• Including parents in homework assignments;
• Sending home educational materials to help parents learn about nutritionor teach their children about nutrition;
• Inviting parents to attend nutrition classes;
• Inviting parents to attend special events, such as School Lunch Week ortasting parties;
• Inviting parents in nutrition-related careers to speak to the class;
• Asking parents to give in-class demonstrations;
• Asking parents to send healthful snacks to school; and
• Offering nutrition workshops or screening services for parents.
With the exception of asking parents to send healthful snacks (with37 percent “great extent” and 25 percent “moderate extent”), a majority ofteachers reported that they or their schools used these strategies to a smallextent or not at all (table 13).
20 Lytle, “Nutrition Education for School-Aged Children,” 307.
19
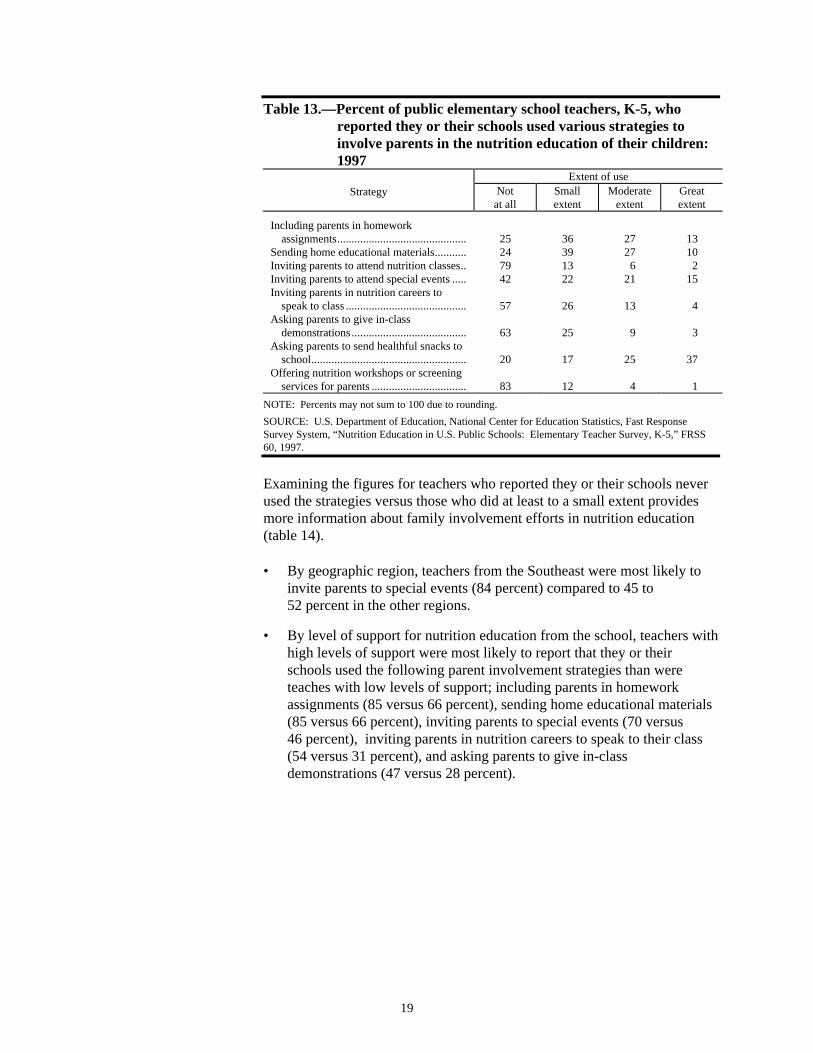
Table 13.—Percent of public elementary school teachers, K-5, whoreported they or their schools used various strategies toinvolve parents in the nutrition education of their children:1997
Extent of useStrategy Not
at allSmallextent
Moderateextent
Greatextent
Including parents in homeworkassignments............................................. 25 36 27 13
Sending home educational materials........... 24 39 27 10Inviting parents to attend nutrition classes.. 79 13 6 2Inviting parents to attend special events ..... 42 22 21 15Inviting parents in nutrition careers to
speak to class .......................................... 57 26 13 4Asking parents to give in-class
demonstrations........................................ 63 25 9 3Asking parents to send healthful snacks to
school...................................................... 20 17 25 37Offering nutrition workshops or screening
services for parents ................................. 83 12 4 1
NOTE: Percents may not sum to 100 due to rounding.
SOURCE: U.S. Department of Education, National Center for Education Statistics, Fast ResponseSurvey System, “Nutrition Education in U.S. Public Schools: Elementary Teacher Survey, K-5,” FRSS60, 1997.
Examining the figures for teachers who reported they or their schools neverused the strategies versus those who did at least to a small extent providesmore information about family involvement efforts in nutrition education(table 14).
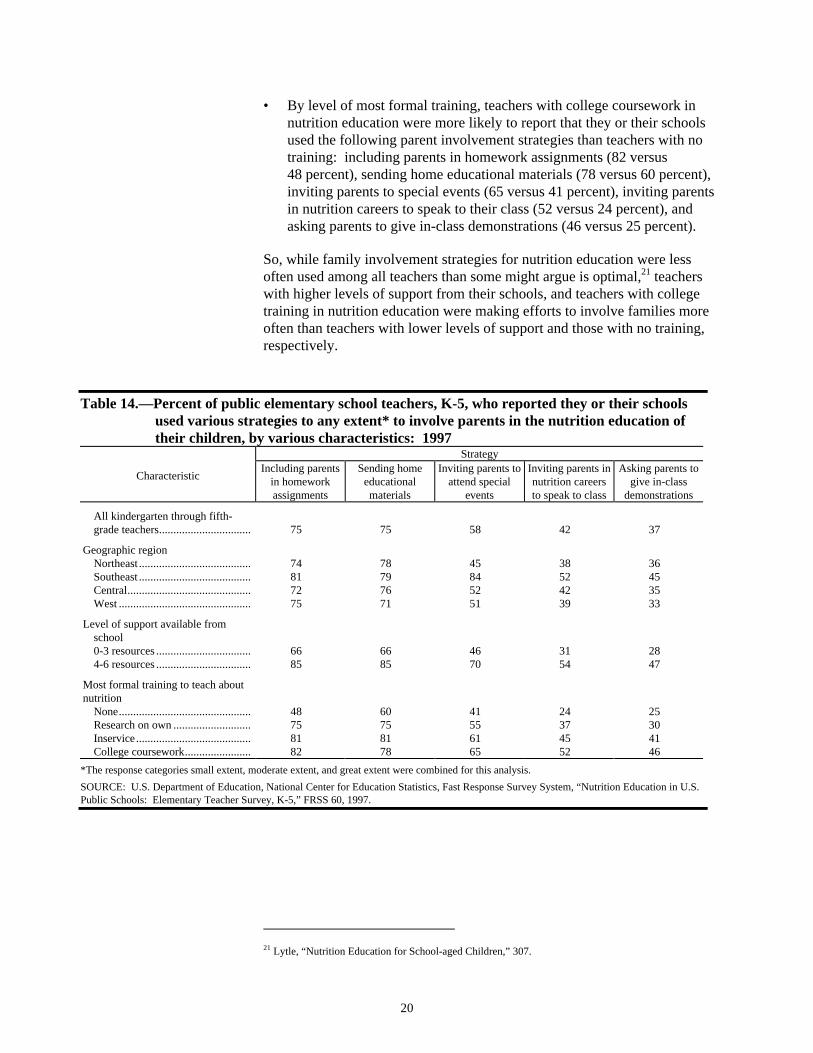
• By geographic region, teachers from the Southeast were most likely toinvite parents to special events (84 percent) compared to 45 to52 percent in the other regions.
• By level of support for nutrition education from the school, teachers withhigh levels of support were most likely to report that they or theirschools used the following parent involvement strategies than wereteaches with low levels of support; including parents in homeworkassignments (85 versus 66 percent), sending home educational materials(85 versus 66 percent), inviting parents to special events (70 versus46 percent), inviting parents in nutrition careers to speak to their class(54 versus 31 percent), and asking parents to give in-classdemonstrations (47 versus 28 percent).
20
• By level of most formal training, teachers with college coursework innutrition education were more likely to report that they or their schoolsused the following parent involvement strategies than teachers with notraining: including parents in homework assignments (82 versus48 percent), sending home educational materials (78 versus 60 percent),inviting parents to special events (65 versus 41 percent), inviting parentsin nutrition careers to speak to their class (52 versus 24 percent), andasking parents to give in-class demonstrations (46 versus 25 percent).
So, while family involvement strategies for nutrition education were lessoften used among all teachers than some might argue is optimal,21 teacherswith higher levels of support from their schools, and teachers with collegetraining in nutrition education were making efforts to involve families moreoften than teachers with lower levels of support and those with no training,respectively.
21 Lytle, “Nutrition Education for School-aged Children,” 307.
Table 14.—Percent of public elementary school teachers, K-5, who reported they or their schoolsused various strategies to any extent* to involve parents in the nutrition education oftheir children, by various characteristics: 1997
Strategy
CharacteristicIncluding parents
in homeworkassignments
Sending homeeducationalmaterials
Inviting parents toattend special
events
Inviting parents innutrition careersto speak to class
Asking parents togive in-class
demonstrations
All kindergarten through fifth-grade teachers................................ 75 75 58 42 37
Geographic regionNortheast ....................................... 74 78 45 38 36Southeast ....................................... 81 79 84 52 45Central........................................... 72 76 52 42 35West .............................................. 75 71 51 39 33
Level of support available fromschool0-3 resources ................................. 66 66 46 31 284-6 resources ................................. 85 85 70 54 47
Most formal training to teach aboutnutrition
None.............................................. 48 60 41 24 25Research on own ........................... 75 75 55 37 30Inservice........................................ 81 81 61 45 41College coursework....................... 82 78 65 52 46
*The response categories small extent, moderate extent, and great extent were combined for this analysis.
SOURCE: U.S. Department of Education, National Center for Education Statistics, Fast Response Survey System, “Nutrition Education in U.S.Public Schools: Elementary Teacher Survey, K-5,” FRSS 60, 1997.
21
InstructionalMaterial forNutritionEducation
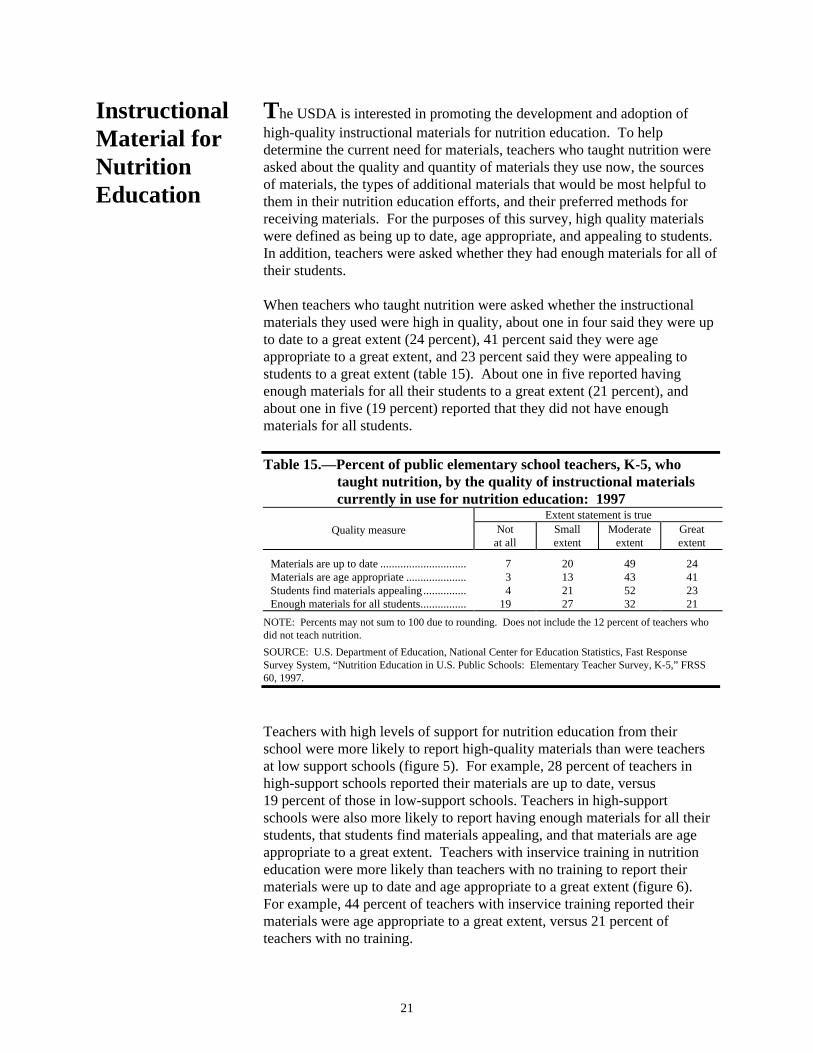
The USDA is interested in promoting the development and adoption ofhigh-quality instructional materials for nutrition education. To helpdetermine the current need for materials, teachers who taught nutrition wereasked about the quality and quantity of materials they use now, the sourcesof materials, the types of additional materials that would be most helpful tothem in their nutrition education efforts, and their preferred methods forreceiving materials. For the purposes of this survey, high quality materialswere defined as being up to date, age appropriate, and appealing to students.In addition, teachers were asked whether they had enough materials for all oftheir students.
When teachers who taught nutrition were asked whether the instructionalmaterials they used were high in quality, about one in four said they were upto date to a great extent (24 percent), 41 percent said they were ageappropriate to a great extent, and 23 percent said they were appealing tostudents to a great extent (table 15). About one in five reported havingenough materials for all their students to a great extent (21 percent), andabout one in five (19 percent) reported that they did not have enoughmaterials for all students.
Table 15.—Percent of public elementary school teachers, K-5, whotaught nutrition, by the quality of instructional materialscurrently in use for nutrition education: 1997
Extent statement is trueQuality measure Not
at allSmallextent
Moderateextent
Greatextent
Materials are up to date .............................. 7 20 49 24Materials are age appropriate ..................... 3 13 43 41Students find materials appealing ............... 4 21 52 23Enough materials for all students................ 19 27 32 21
NOTE: Percents may not sum to 100 due to rounding. Does not include the 12 percent of teachers whodid not teach nutrition.
SOURCE: U.S. Department of Education, National Center for Education Statistics, Fast ResponseSurvey System, “Nutrition Education in U.S. Public Schools: Elementary Teacher Survey, K-5,” FRSS60, 1997.
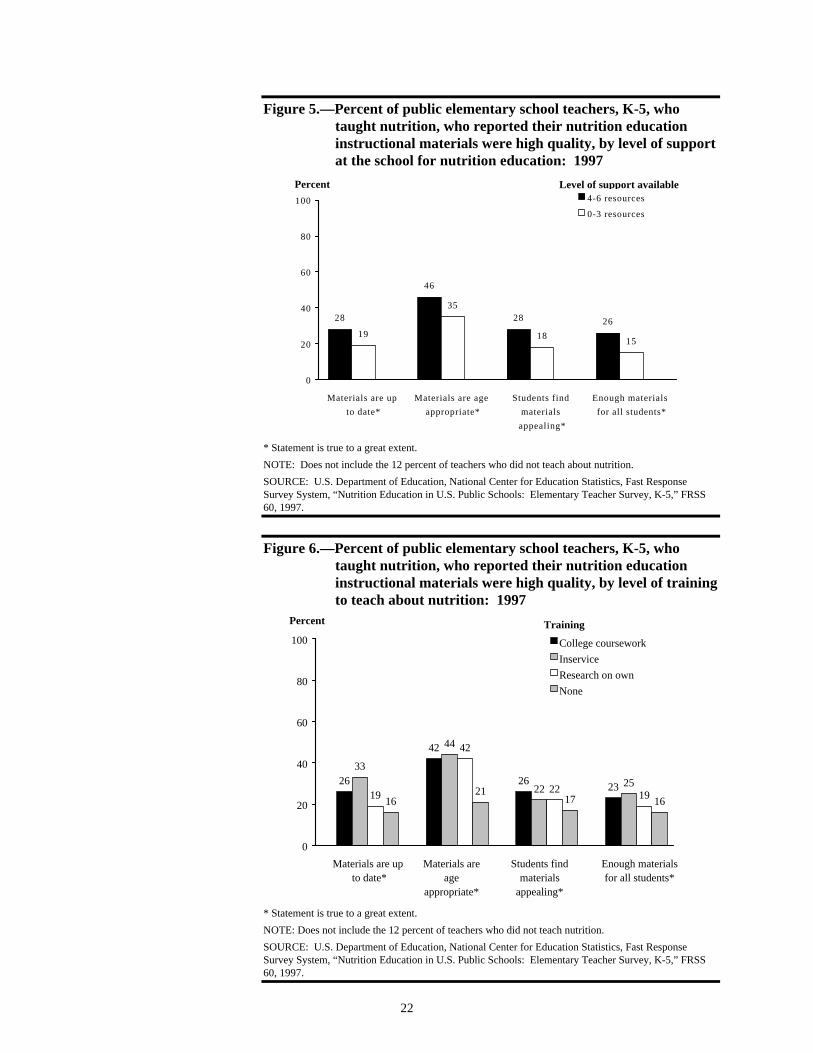
Teachers with high levels of support for nutrition education from theirschool were more likely to report high-quality materials than were teachersat low support schools (figure 5). For example, 28 percent of teachers inhigh-support schools reported their materials are up to date, versus19 percent of those in low-support schools. Teachers in high-supportschools were also more likely to report having enough materials for all theirstudents, that students find materials appealing, and that materials are ageappropriate to a great extent. Teachers with inservice training in nutritioneducation were more likely than teachers with no training to report theirmaterials were up to date and age appropriate to a great extent (figure 6).For example, 44 percent of teachers with inservice training reported theirmaterials were age appropriate to a great extent, versus 21 percent ofteachers with no training.
22
Figure 5.—Percent of public elementary school teachers, K-5, whotaught nutrition, who reported their nutrition educationinstructional materials were high quality, by level of supportat the school for nutrition education: 1997
28
46
28 2619
35
1815
0
20
40
60
80
100
Materials are up
to date*
Materials are age
appropriate*
Students find
materials
appealing*
Enough materials
for all students*
4-6 resources
0-3 resources
Level of support availablePercent
* Statement is true to a great extent.
NOTE: Does not include the 12 percent of teachers who did not teach about nutrition.
SOURCE: U.S. Department of Education, National Center for Education Statistics, Fast ResponseSurvey System, “Nutrition Education in U.S. Public Schools: Elementary Teacher Survey, K-5,” FRSS60, 1997.
Figure 6.—Percent of public elementary school teachers, K-5, whotaught nutrition, who reported their nutrition educationinstructional materials were high quality, by level of trainingto teach about nutrition: 1997
26
42
2623
33
44
2225
19
42
2219
1621
17 16
0
20
40
60
80
100 College coursework
Inservice
Research on own
None
Training
Materials are up to date*
Materials areage
appropriate*
Students findmaterials
appealing*
Enough materialsfor all students*
Percent
* Statement is true to a great extent.
NOTE: Does not include the 12 percent of teachers who did not teach nutrition.
SOURCE: U.S. Department of Education, National Center for Education Statistics, Fast ResponseSurvey System, “Nutrition Education in U.S. Public Schools: Elementary Teacher Survey, K-5,” FRSS60, 1997.
23
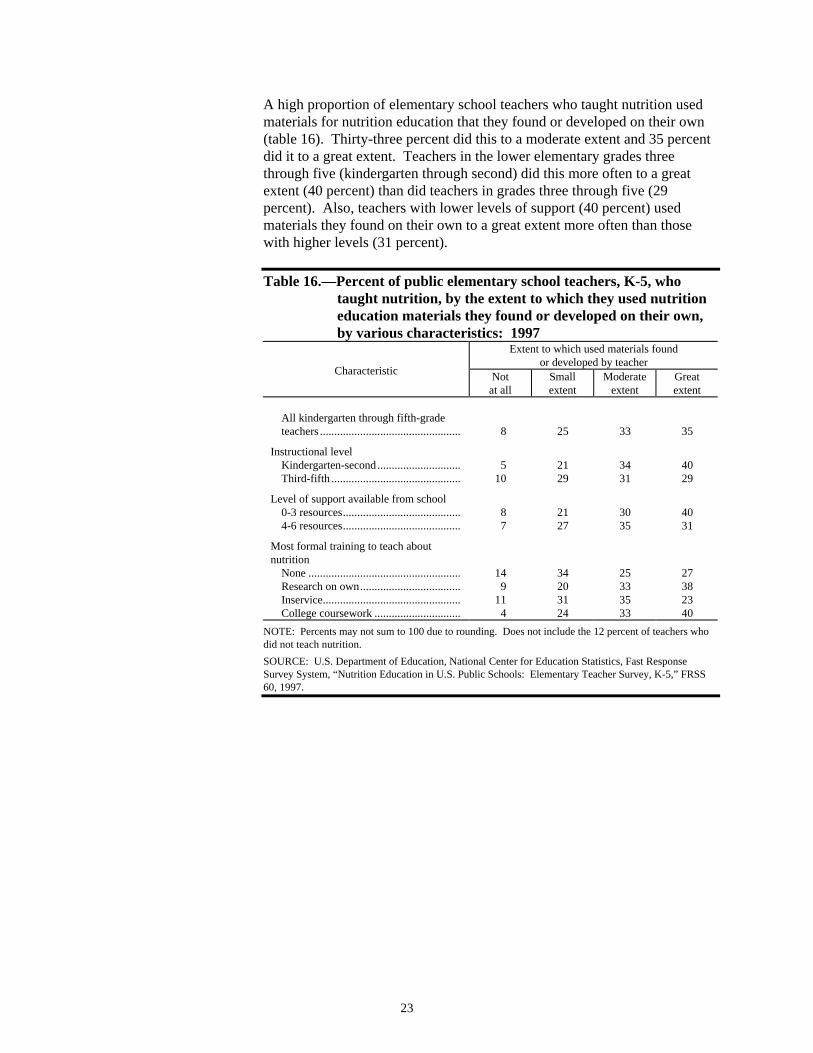
A high proportion of elementary school teachers who taught nutrition usedmaterials for nutrition education that they found or developed on their own(table 16). Thirty-three percent did this to a moderate extent and 35 percentdid it to a great extent. Teachers in the lower elementary grades threethrough five (kindergarten through second) did this more often to a greatextent (40 percent) than did teachers in grades three through five (29percent). Also, teachers with lower levels of support (40 percent) usedmaterials they found on their own to a great extent more often than thosewith higher levels (31 percent).
Table 16.—Percent of public elementary school teachers, K-5, whotaught nutrition, by the extent to which they used nutritioneducation materials they found or developed on their own,by various characteristics: 1997
Extent to which used materials foundor developed by teacher
Characteristic Notat all
Smallextent
Moderateextent
Greatextent
All kindergarten through fifth-gradeteachers ................................................. 8 25 33 35
Instructional levelKindergarten-second............................. 5 21 34 40Third-fifth ............................................. 10 29 31 29
Level of support available from school0-3 resources......................................... 8 21 30 404-6 resources......................................... 7 27 35 31
Most formal training to teach aboutnutrition
None ..................................................... 14 34 25 27Research on own................................... 9 20 33 38Inservice................................................ 11 31 35 23College coursework .............................. 4 24 33 40
NOTE: Percents may not sum to 100 due to rounding. Does not include the 12 percent of teachers whodid not teach nutrition.
SOURCE: U.S. Department of Education, National Center for Education Statistics, Fast ResponseSurvey System, “Nutrition Education in U.S. Public Schools: Elementary Teacher Survey, K-5,” FRSS60, 1997.
24
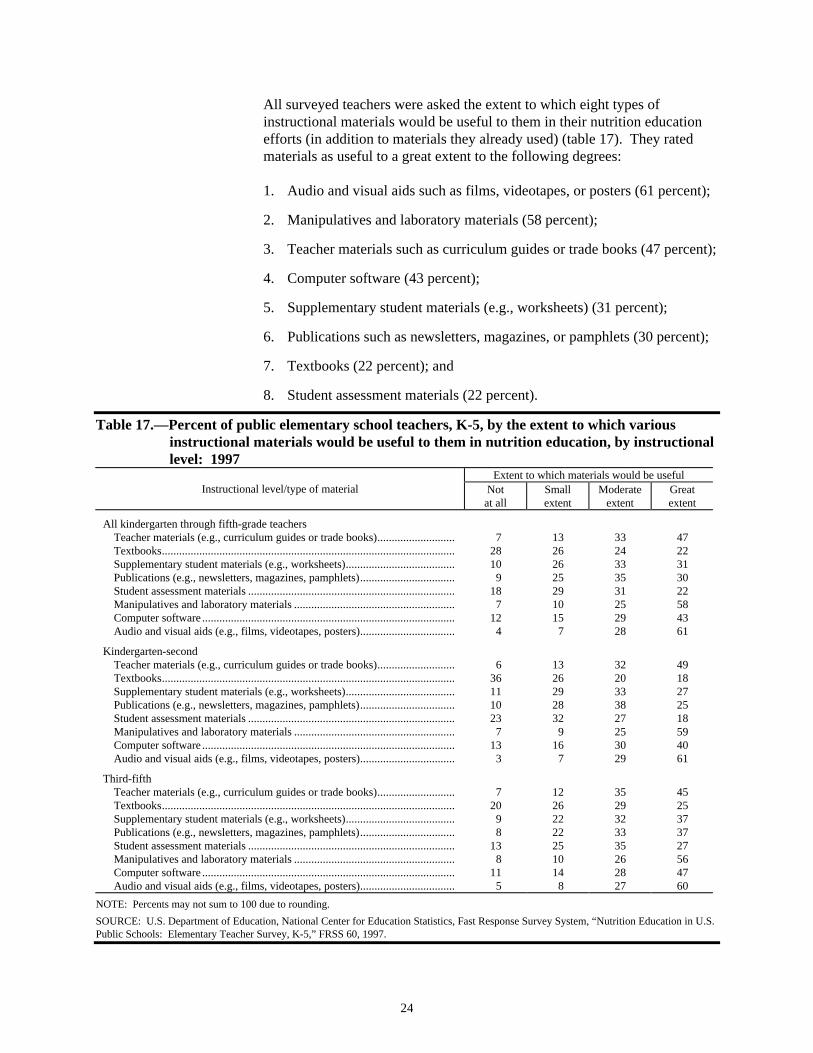
All surveyed teachers were asked the extent to which eight types ofinstructional materials would be useful to them in their nutrition educationefforts (in addition to materials they already used) (table 17). They ratedmaterials as useful to a great extent to the following degrees:
1. Audio and visual aids such as films, videotapes, or posters (61 percent);
2. Manipulatives and laboratory materials (58 percent);
3. Teacher materials such as curriculum guides or trade books (47 percent);
4. Computer software (43 percent);
5. Supplementary student materials (e.g., worksheets) (31 percent);
6. Publications such as newsletters, magazines, or pamphlets (30 percent);
7. Textbooks (22 percent); and
8. Student assessment materials (22 percent).
Table 17.—Percent of public elementary school teachers, K-5, by the extent to which variousinstructional materials would be useful to them in nutrition education, by instructionallevel: 1997
Extent to which materials would be usefulInstructional level/type of material Not
at allSmallextent
Moderateextent
Greatextent
All kindergarten through fifth-grade teachersTeacher materials (e.g., curriculum guides or trade books)........................... 7 13 33 47Textbooks...................................................................................................... 28 26 24 22Supplementary student materials (e.g., worksheets)...................................... 10 26 33 31Publications (e.g., newsletters, magazines, pamphlets)................................. 9 25 35 30Student assessment materials ........................................................................ 18 29 31 22Manipulatives and laboratory materials ........................................................ 7 10 25 58Computer software ........................................................................................ 12 15 29 43Audio and visual aids (e.g., films, videotapes, posters)................................. 4 7 28 61
Kindergarten-secondTeacher materials (e.g., curriculum guides or trade books)........................... 6 13 32 49Textbooks...................................................................................................... 36 26 20 18Supplementary student materials (e.g., worksheets)...................................... 11 29 33 27Publications (e.g., newsletters, magazines, pamphlets)................................. 10 28 38 25Student assessment materials ........................................................................ 23 32 27 18Manipulatives and laboratory materials ........................................................ 7 9 25 59Computer software ........................................................................................ 13 16 30 40Audio and visual aids (e.g., films, videotapes, posters)................................. 3 7 29 61
Third-fifthTeacher materials (e.g., curriculum guides or trade books)........................... 7 12 35 45Textbooks...................................................................................................... 20 26 29 25Supplementary student materials (e.g., worksheets)...................................... 9 22 32 37Publications (e.g., newsletters, magazines, pamphlets)................................. 8 22 33 37Student assessment materials ........................................................................ 13 25 35 27Manipulatives and laboratory materials ........................................................ 8 10 26 56Computer software ........................................................................................ 11 14 28 47Audio and visual aids (e.g., films, videotapes, posters)................................. 5 8 27 60
NOTE: Percents may not sum to 100 due to rounding.
SOURCE: U.S. Department of Education, National Center for Education Statistics, Fast Response Survey System, “Nutrition Education in U.S.Public Schools: Elementary Teacher Survey, K-5,” FRSS 60, 1997.
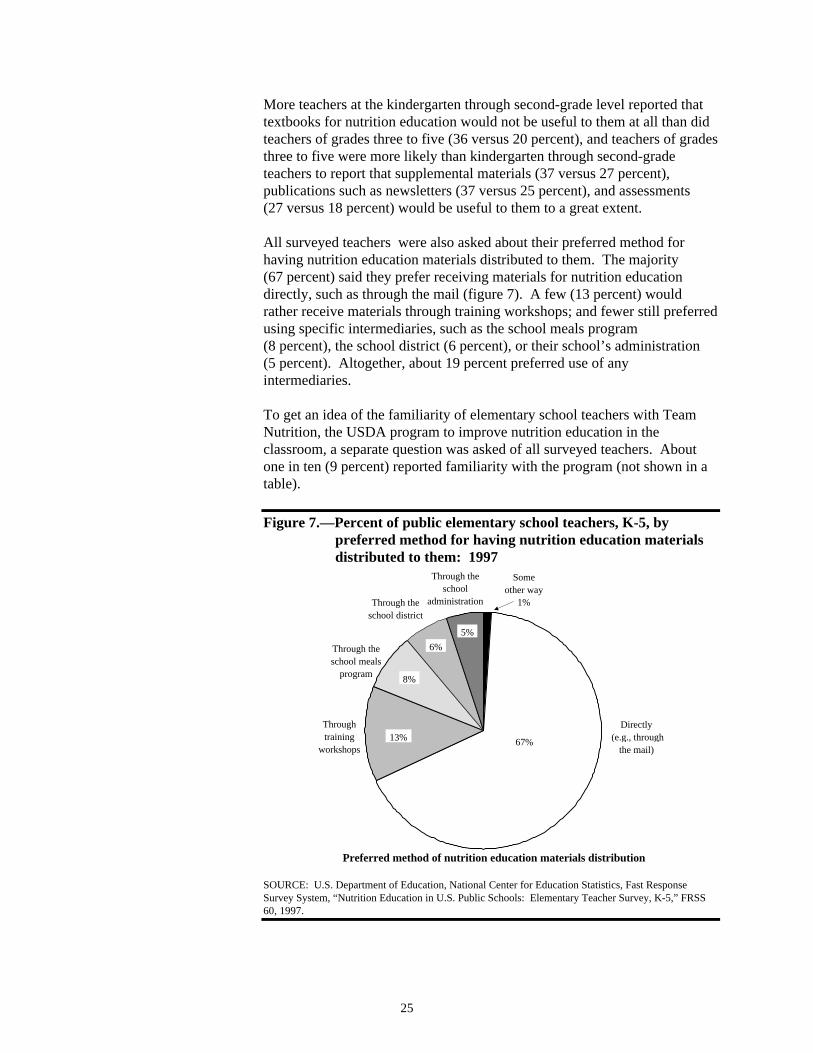
25
More teachers at the kindergarten through second-grade level reported thattextbooks for nutrition education would not be useful to them at all than didteachers of grades three to five (36 versus 20 percent), and teachers of gradesthree to five were more likely than kindergarten through second-gradeteachers to report that supplemental materials (37 versus 27 percent),publications such as newsletters (37 versus 25 percent), and assessments(27 versus 18 percent) would be useful to them to a great extent.
All surveyed teachers were also asked about their preferred method forhaving nutrition education materials distributed to them. The majority(67 percent) said they prefer receiving materials for nutrition educationdirectly, such as through the mail (figure 7). A few (13 percent) wouldrather receive materials through training workshops; and fewer still preferredusing specific intermediaries, such as the school meals program(8 percent), the school district (6 percent), or their school’s administration(5 percent). Altogether, about 19 percent preferred use of anyintermediaries.
To get an idea of the familiarity of elementary school teachers with TeamNutrition, the USDA program to improve nutrition education in theclassroom, a separate question was asked of all surveyed teachers. Aboutone in ten (9 percent) reported familiarity with the program (not shown in atable).
Figure 7.—Percent of public elementary school teachers, K-5, bypreferred method for having nutrition education materialsdistributed to them: 1997
Through training
workshops
Through the school meals
program
Through the school district
Directly (e.g., through
the mail)
Some other way
1%
Through the school
administration
5%
6%
8%
13% 67%
Preferred method of nutrition education materials distribution
SOURCE: U.S. Department of Education, National Center for Education Statistics, Fast ResponseSurvey System, “Nutrition Education in U.S. Public Schools: Elementary Teacher Survey, K-5,” FRSS60, 1997.
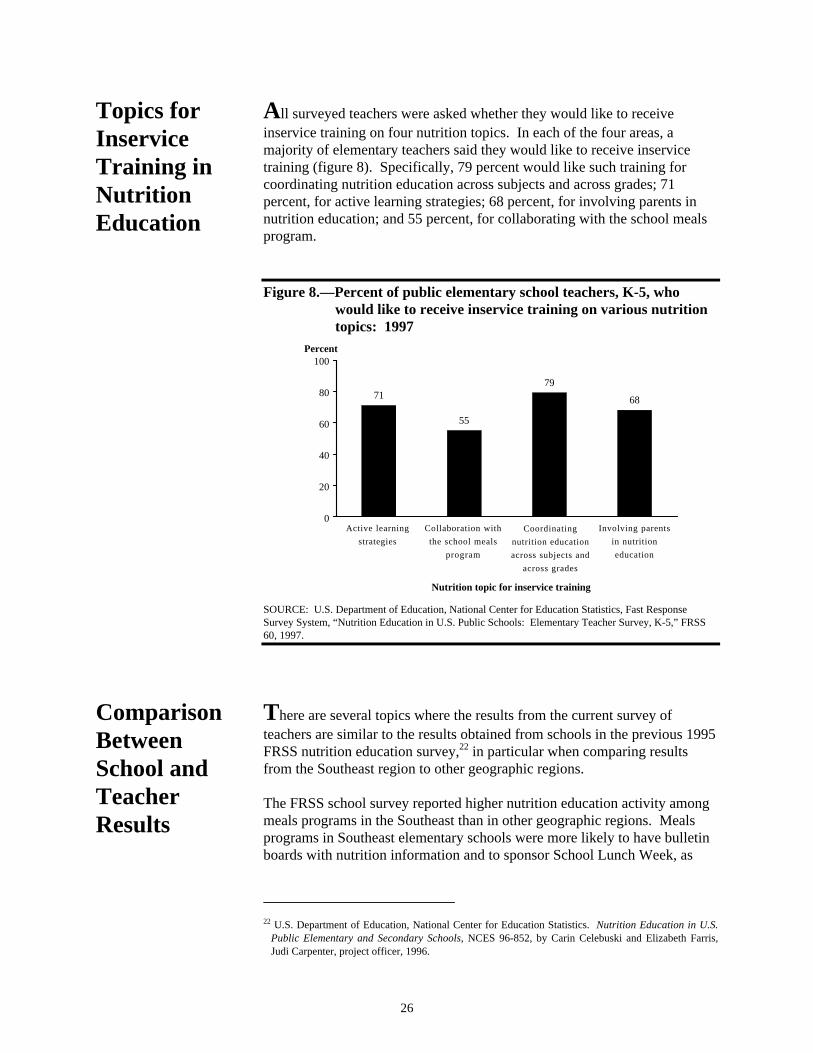
26
Topics forInserviceTraining inNutritionEducation
All surveyed teachers were asked whether they would like to receiveinservice training on four nutrition topics. In each of the four areas, amajority of elementary teachers said they would like to receive inservicetraining (figure 8). Specifically, 79 percent would like such training forcoordinating nutrition education across subjects and across grades; 71percent, for active learning strategies; 68 percent, for involving parents innutrition education; and 55 percent, for collaborating with the school mealsprogram.
Figure 8.—Percent of public elementary school teachers, K-5, whowould like to receive inservice training on various nutritiontopics: 1997
71
55
79
68
0
20
40
60
80
100
Nutrition topic for inservice training
Percent
Coordinating
nutrition education
across subjects and
across grades
Active learning
strategies
Collaboration with
the school meals
program
Involving parents
in nutrition
education
SOURCE: U.S. Department of Education, National Center for Education Statistics, Fast ResponseSurvey System, “Nutrition Education in U.S. Public Schools: Elementary Teacher Survey, K-5,” FRSS60, 1997.
ComparisonBetweenSchool andTeacherResults
There are several topics where the results from the current survey ofteachers are similar to the results obtained from schools in the previous 1995FRSS nutrition education survey,22 in particular when comparing resultsfrom the Southeast region to other geographic regions.
The FRSS school survey reported higher nutrition education activity amongmeals programs in the Southeast than in other geographic regions. Mealsprograms in Southeast elementary schools were more likely to have bulletinboards with nutrition information and to sponsor School Lunch Week, as
22 U.S. Department of Education, National Center for Education Statistics. Nutrition Education in U.S.
Public Elementary and Secondary Schools, NCES 96-852, by Carin Celebuski and Elizabeth Farris,Judi Carpenter, project officer, 1996.
27
well as to provide nutrition education in the classroom and to solicit studentand parent input than meals programs in other geographic regions. Theteacher survey found that teachers in the Southeast were more likely toreport a greater availability of high-quality inservice training and acoordinated school nutrition policy. They were also least likely to reportbarriers to cooperation with the meals program staff compared to teachersfrom other regions.
Summary The results of this survey show that nutrition education is going on inelementary school classrooms, and that many of the instructional materialsand techniques used are those that research indicates may be effective.However, the classroom time currently devoted to this topic may not besufficient to change eating behaviors in students. Research cited earlier inthis report suggests that nutrition instruction might be improved throughinservice training focusing on the following:
• Use of active learning strategies,
• Ways to integrate nutrition lessons into other subjects, and
• Ways to involve families in nutrition education.
Teachers reported that they were interested in receiving inservice trainingabout these topics. Those who received high support or had some types oftraining were more likely to do some of these things than teachers with lowsupport or with no training, respectively. In addition, teachers with inservicetraining were more likely to use instructional materials that were up to dateand age appropriate than teachers with no training.

28
29
Appendix A:
Survey Methodology and Data Reliability

30
31
SurveyMethodologyand DataReliability
SampleSelection
The sampling frame of schools for the FRSS nutrition education teachersurvey was constructed from the 1993-94 NCES Common Core of Data(CCD) public school universe file and included over 61,000 regularelementary schools. For the purposes of the survey, elementary schoolswere defined to be those with a beginning grade of sixth or lower and nograde higher than eighth. Excluded from the frame were special education,vocational, and alternative/other schools, schools in the U.S. territories, andschools with a highest grade lower than grade one.
Samples were selected in two stages, first elementary schools, and thenteachers within the sampled schools. The CCD frame was stratified bylocale (city, urban fringe, town, rural), crossed by enrollment size (less than300, 300 to 499, and 500 or more). Within each primary stratum, schoolswere sorted by geographic region (Northeast, Southeast, Central, West) anda measure of poverty status (based on the percentage of students eligible forfree or reduced-price lunch) prior to sample selection to induce additionalimplicit stratification. A sample of 750 schools was then selected from thesorted frame with probabilities proportionate to size (PPS), where themeasure of size was the estimated number of full-time-equivalent (FTE)teachers in the school. It should be noted that FTE teacher counts weremissing for about 2 percent of the schools in the CCD file. For these, therequired measure of size was imputed by applying the average enrollment-to-FTE teacher ratio for schools in the same locale and enrollment size classcategory to the enrollment of the school with the missing FTE teacher count.
To facilitate the selection of teachers, each sampled school was requested toprovide a comprehensive list of their teachers of grades kindergarten throughfive who taught self-contained classes. Lists were obtained from 96 percentof the selected elementary schools, yielding 705 participating schools. Anaverage of about two elementary school teachers (fewer for schools with asmaller number of eligible teachers and more for schools with a largernumber of eligible teaches) was then selected from each participating school,for a total initial sample size of 1,409.
Respondentsand ResponseRates
In February 1997, questionnaires (see appendix C) were mailed to 1,409public elementary school teachers. Of the teachers sampled, 62 were foundto be out of scope (no longer at the school, or not assigned to a self-contained class), leaving 1,347 eligible teachers in the sample. Telephonefollowup was initiated in March, and data collection was completed on July3, with 1,180 respondents. The teacher response rate was 88 percent. Thisfigure combines with the response rate from the list collection for a finalresponse rate of 84 percent. Item nonresponse rates ranged from 0.0 to 1.0percent.
32
Sampling andNonsamplingErrors
The responses were weighted to produce national estimates. The weightswere designed to adjust for the variable probabilities of selection anddifferential nonresponse. The findings in this report are estimates based onthe sample selected and, consequently, are subject to sampling variability.
The survey estimates are also subject to nonsampling errors that can arisebecause of nonobservation (nonresponse or noncoverage) errors, errors ofreporting, and errors made in the collection of the data. These errors cansometimes bias the data. Nonsampling errors may include such problems asthe differences in the respondents’ interpretations of the meaning of thequestions; memory effects; misrecording of responses; incorrect editing,coding, and data entry; differences related to the particular time the surveywas conducted; or errors in data preparation. While general sampling theorycan be used in part to determine how to estimate the sampling variability of astatistic, nonsampling errors are not easy to measure and, for measurementpurposes, usually require that an experiment be conducted as part of the datacollection procedures or that data external to the study be used.
To minimize the potential for nonsampling errors, the questionnaire waspretested with knowledgeable respondents like those who completed thesurvey. During the design of the survey and the survey pretest, an effort wasmade to check for consistency of interpretation of questions and to eliminateambiguous terms. The questionnaire and instructions were extensivelyreviewed by the Food and Nutrition Service and the National Center forEducation Statistics. Manual and machine editing of the questionnaireresponses were conducted to check the data for accuracy and consistency.Cases with missing or inconsistent items were recontacted by telephone.Imputations for item nonresponse were not implemented, as itemnonresponse rates were very low. Data were keyed with 100 percentverification.
Variances The standard error is a measure of the variability of an estimate due tosampling. It indicates the variability of a sample estimate that would beobtained from all possible samples of a given design and size. Standarderrors are used as a measure of the precision expected from a particularsample. If all possible samples were surveyed under similar conditions,intervals of 1.96 standard errors below to 1.96 standard errors above aparticular statistic would include the true population parameter beingestimated in about 95 percent of the samples. This is what is referred to as a95 percent confidence interval. For example, the estimated percentage ofteachers who taught about nutrition in school year 1996-97 is 88 percent andthe estimated standard error is 1.1 percent. The 95 percent confidenceinterval for this statistic extends from 88 – (1.96 * 1.1) to 88 + (1.96 * 1.1),or from 85.8 to 90.2.
33
Estimates of standard errors were computed using a technique known asjackknife replication. As with any replication method, jackknife replicationinvolves constructing a number of subsamples (replicates) from the fullsample and computing the statistic of interest for each replicate. The meansquare error of the replicate estimates around the full sample estimateprovides an estimate of the variance of the statistic. To construct thereplicates, 50 stratified subsamples of the full sample were created and thendropped, one at a time, to define 50 jackknife replicates. A proprietarycomputer program (WESVAR), available at Westat, was used to calculatethe estimates of standard errors.
BackgroundInformation
The survey was conducted under contract with Westat, using the NCES FastResponse Survey System (FRSS). Westat’s project director was ElizabethFarris, and the survey manager was Carin Celebuski. Shelley Burns and JudiCarpenter were the NCES project officers. The data were requested byLeslie Christovich and Marie Mitchell from the Food and Nutrition Serviceof the USDA. Marie Mitchell coordinated the project for the USDA.
The survey instrument was developed with input from several persons in thefield of nutrition education, including individuals from the USDA’sNutrition and Technical Services Division and Team Nutrition.
The report was reviewed by the following individuals:
Outside NCES
• Marie Mitchell, CDC
• Leslie Lytle, University of Minnesota
Inside NCES
• Marilyn McMillen
• Kathryn Chandler
• Larry Bobbitt
• Jonaki Bose
For more information about the Fast Response Survey System or thenutrition education teacher survey, contact Shelley Burns, Elementary/Secondary Statistics Division, Office of Educational Research andImprovement, National Center for Education Statistics, 555 New JerseyAvenue, NW, Washington, DC 20208-5651, telephone (202) 219-1463.
34
Terms Definedon the SurveyQuestionnaire
Collaborative or cooperative work - students work together in smallgroups to solve problems or do projects.
Coordinated school nutrition policy - may address such issues ascoordinating nutrition education across subjects and across grades,collaboration between the school meals program and the classroom, andpolicies on outside food vendors and closed lunch periods.
Coordinating nutrition education across subjects and across grades -refers to the integration of nutrition lessons into subjects such as math andscience, and the integration across grades so the lessons at each grade levelbuild on the previous year’s lessons.
Hands-on learning - students engage in direct learning experiences byapplying their learning to real-life situations or everyday issues and events.
Nutrition education materials - lesson plans, curriculum guides, posters,pamphlets, multimedia, etc., designed to improve health, achieve positivechange in dietary habits, and emphasize the relationship between diet andhealth.
Nutrition education - refers to curricula, courses, lesson plans and units,and activities designed to provide instruction with regard to the nutritionalvalue of foods and the relationship between food and human health.
ClassificationVariables
Instructional level of the teacher
Kindergarten through second-grade teachers.
Third through fifth-grade teachers.
School enrollment size
Less than 300 students in the school.
Between 300-499 students in the school.
500 or more students in the school.
Geographic region of the school
Northeast - Connecticut, Delaware, District of Columbia, Maine, Maryland,Massachusetts, New Hampshire, New Jersey, New York, Pennsylvania,Rhode Island, and Vermont.
Southeast - Alabama, Arkansas, Florida, Georgia, Kentucky, Louisiana,Mississippi, North Carolina, South Carolina, Tennessee, Virginia, and WestVirginia.
Central - Illinois, Indiana, Iowa, Kansas, Michigan, Minnesota, Missouri,Nebraska, North Dakota, Ohio, South Dakota, and Wisconsin.
35
West - Alaska, Arizona, California, Colorado, Hawaii, Idaho, Montana,Nevada, New Mexico, Oklahoma, Oregon, Texas, Utah, Washington, andWyoming.
Level of support for nutrition education at the school - constructed frominformation reported by teachers on their questionnaires (questions 2 and 3).Affirmative responses to six questions asking about the availability ofspecific resources and policies in support of nutrition education at the schoolwere summed. The six resources were ongoing inservice training thatfocuses on teaching strategies for behavioral change; school food servicepersonnel serving healthy, well-balanced meals in the cafeteria; referencematerials on nutrition education available at your school; support from yourschool or district for nutrition education as a valid use of instructional time;a written policy or guidelines on nutrition education from your school,district, or state; and a coordinated school nutrition policy.
Low - teachers reporting 0-3 resources available to them.
High - teachers reporting 4-6 resources available to them.
Type of nutrition education training the teacher has received -constructed from information reported by teachers on their questionnaires(question 17). Teachers were recoded to their most formal type of training,although they may have participated in other types of training as well.
None - teachers reported not participating in any training forteaching students about nutrition.
Research on own - teachers reported that they did research on theirown, but did not participate in any formal training.
Inservice - teachers reported that they participated in inservice orother professional development training, but did not participate intraining as an undergraduate or graduate student.
College coursework - teachers reported that they participated intraining as an undergraduate or graduate student.

36

37
Appendix B
Tables of Standard Errors

38
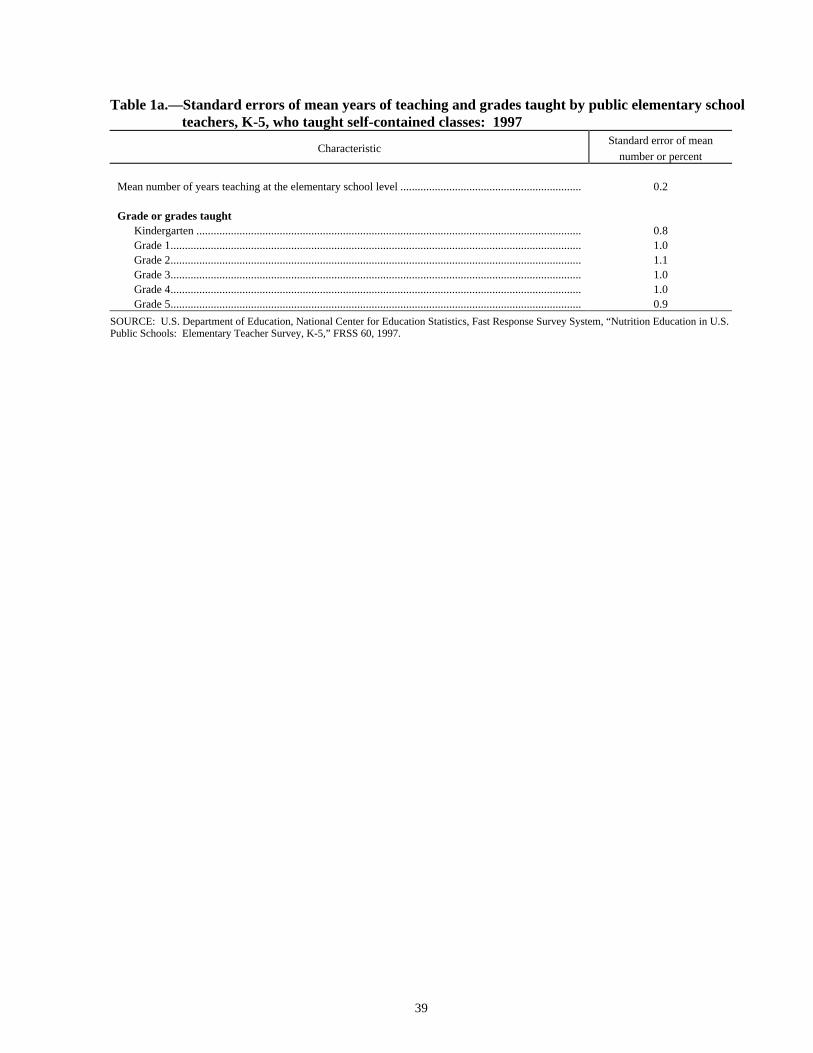
39
Table 1a.—Standard errors of mean years of teaching and grades taught by public elementary schoolteachers, K-5, who taught self-contained classes: 1997
CharacteristicStandard error of mean
number or percent
Mean number of years teaching at the elementary school level ............................................................... 0.2
Grade or grades taughtKindergarten ...................................................................................................................................... 0.8Grade 1............................................................................................................................................... 1.0Grade 2............................................................................................................................................... 1.1Grade 3............................................................................................................................................... 1.0Grade 4............................................................................................................................................... 1.0Grade 5............................................................................................................................................... 0.9
SOURCE: U.S. Department of Education, National Center for Education Statistics, Fast Response Survey System, “Nutrition Education in U.S.Public Schools: Elementary Teacher Survey, K-5,” FRSS 60, 1997.
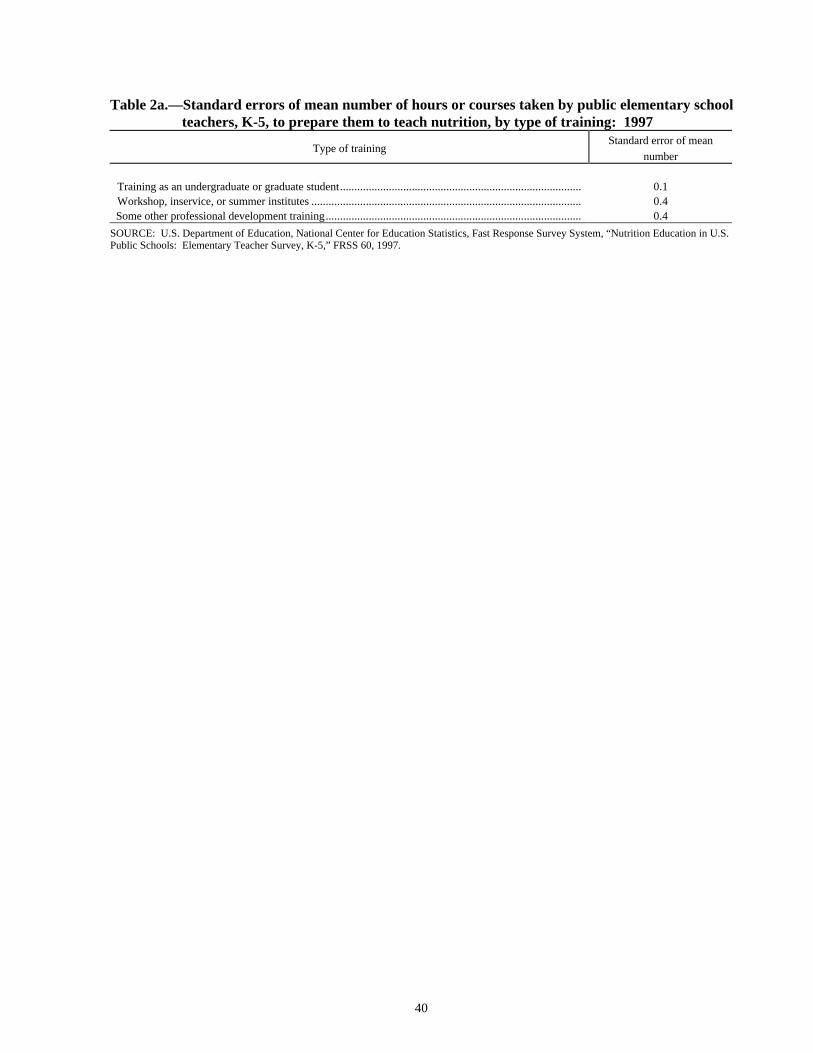
40
Table 2a.—Standard errors of mean number of hours or courses taken by public elementary schoolteachers, K-5, to prepare them to teach nutrition, by type of training: 1997
Type of trainingStandard error of mean
number
Training as an undergraduate or graduate student.................................................................................... 0.1Workshop, inservice, or summer institutes .............................................................................................. 0.4Some other professional development training......................................................................................... 0.4
SOURCE: U.S. Department of Education, National Center for Education Statistics, Fast Response Survey System, “Nutrition Education in U.S.Public Schools: Elementary Teacher Survey, K-5,” FRSS 60, 1997.
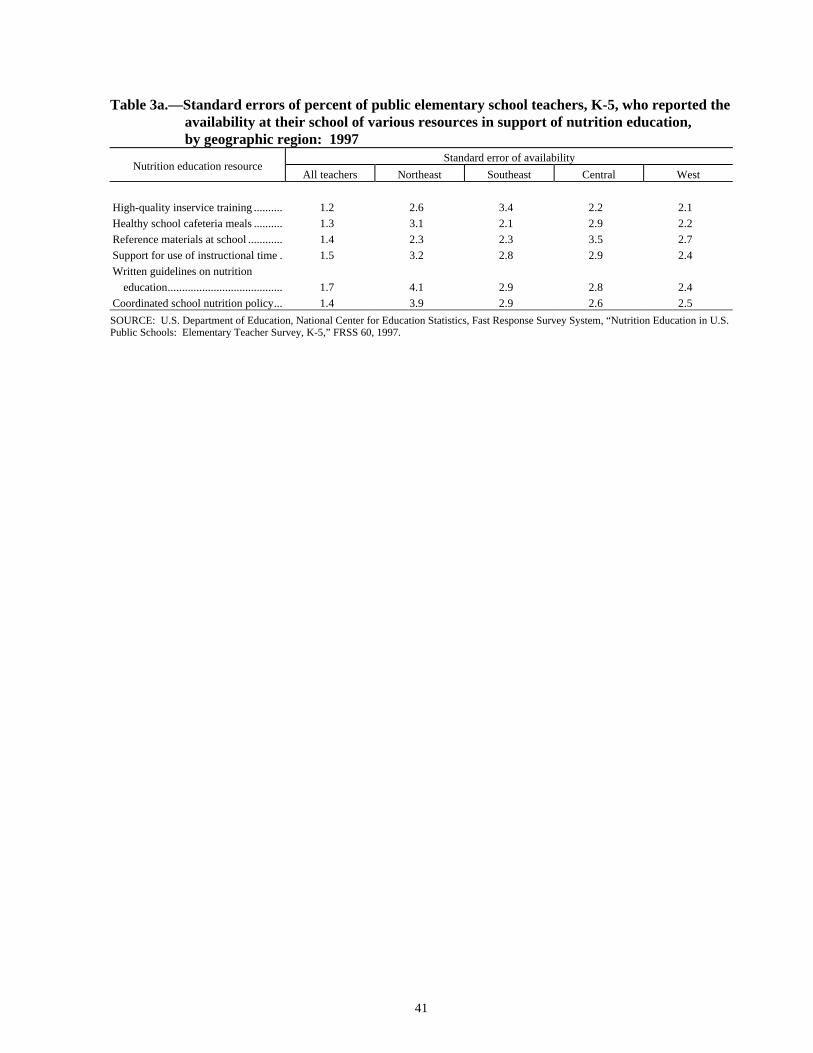
41
Table 3a.—Standard errors of percent of public elementary school teachers, K-5, who reported theavailability at their school of various resources in support of nutrition education,by geographic region: 1997
Standard error of availabilityNutrition education resource
All teachers Northeast Southeast Central West
High-quality inservice training .......... 1.2 2.6 3.4 2.2 2.1
Healthy school cafeteria meals .......... 1.3 3.1 2.1 2.9 2.2
Reference materials at school ............ 1.4 2.3 2.3 3.5 2.7
Support for use of instructional time . 1.5 3.2 2.8 2.9 2.4
Written guidelines on nutrition
education........................................ 1.7 4.1 2.9 2.8 2.4
Coordinated school nutrition policy... 1.4 3.9 2.9 2.6 2.5
SOURCE: U.S. Department of Education, National Center for Education Statistics, Fast Response Survey System, “Nutrition Education in U.S.Public Schools: Elementary Teacher Survey, K-5,” FRSS 60, 1997.
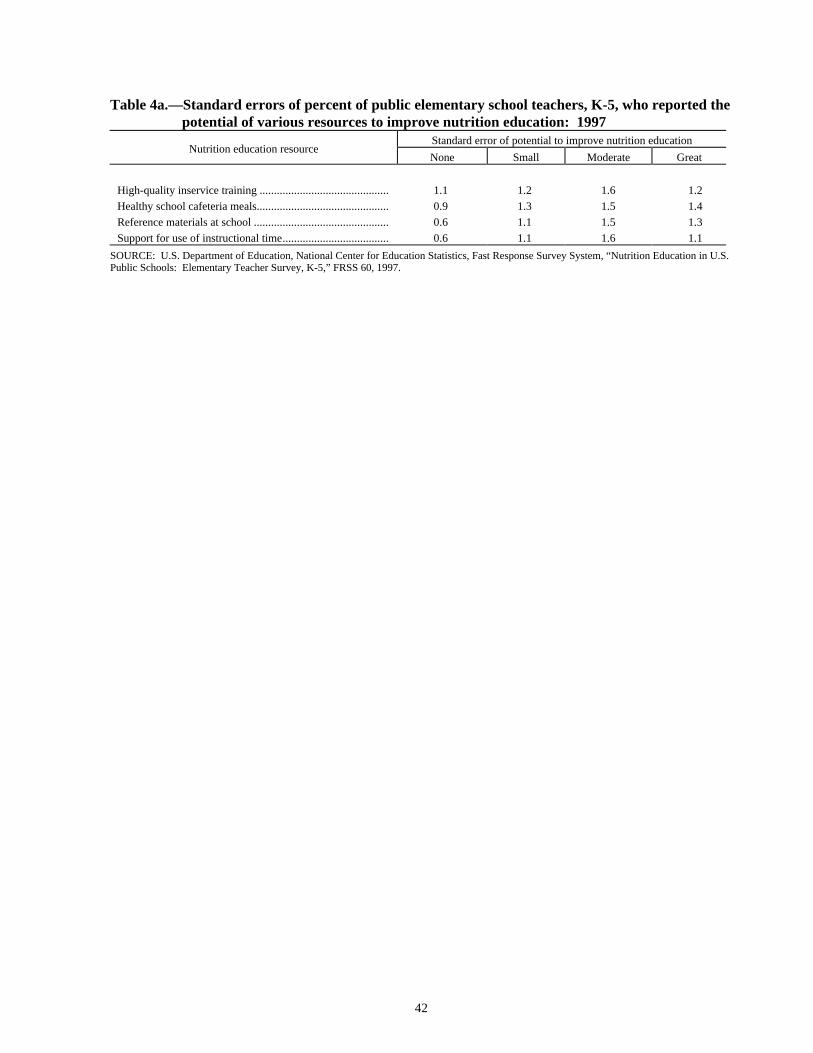
42
Table 4a.—Standard errors of percent of public elementary school teachers, K-5, who reported thepotential of various resources to improve nutrition education: 1997
Standard error of potential to improve nutrition educationNutrition education resource
None Small Moderate Great
High-quality inservice training ............................................. 1.1 1.2 1.6 1.2
Healthy school cafeteria meals.............................................. 0.9 1.3 1.5 1.4
Reference materials at school ............................................... 0.6 1.1 1.5 1.3
Support for use of instructional time..................................... 0.6 1.1 1.6 1.1
SOURCE: U.S. Department of Education, National Center for Education Statistics, Fast Response Survey System, “Nutrition Education in U.S.Public Schools: Elementary Teacher Survey, K-5,” FRSS 60, 1997.
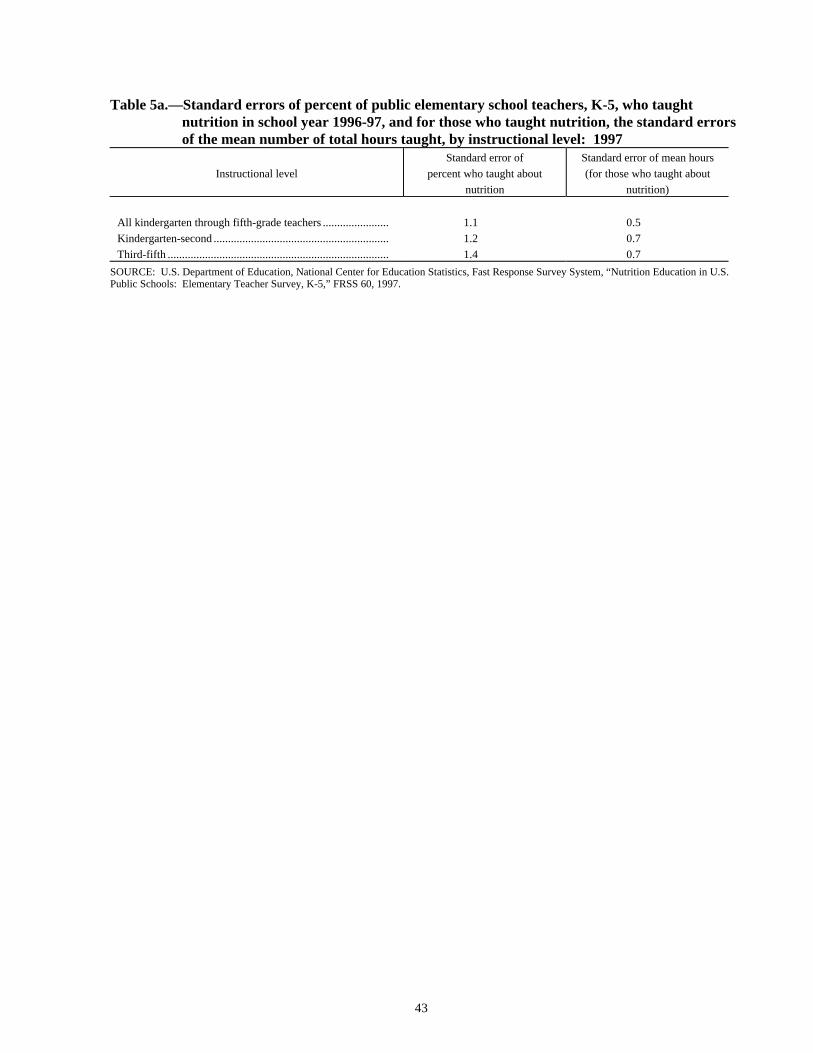
43
Table 5a.—Standard errors of percent of public elementary school teachers, K-5, who taughtnutrition in school year 1996-97, and for those who taught nutrition, the standard errorsof the mean number of total hours taught, by instructional level: 1997
Instructional level
Standard error of
percent who taught about
nutrition
Standard error of mean hours
(for those who taught about
nutrition)
All kindergarten through fifth-grade teachers ....................... 1.1 0.5
Kindergarten-second ............................................................. 1.2 0.7
Third-fifth ............................................................................. 1.4 0.7
SOURCE: U.S. Department of Education, National Center for Education Statistics, Fast Response Survey System, “Nutrition Education in U.S.Public Schools: Elementary Teacher Survey, K-5,” FRSS 60, 1997.
44
Table 6a.—Standard errors of percent of public elementary school teachers, K-5, who taughtnutrition, by the extent to which they integrated lessons about nutrition into varioussubjects: 1997
Standard error of extent to which nutrition lessons are integratedSubject
Not at all Small extent Moderate extent Great extent
Health/physical education ........................................ 1.0 1.0 1.2 1.2
History/social studies ............................................... 1.3 1.5 1.6 0.6
Mathematics............................................................. 1.2 1.5 1.6 0.7
Reading/language arts .............................................. 0.9 1.7 1.6 1.3
Science..................................................................... 0.7 1.3 1.7 1.5
SOURCE: U.S. Department of Education, National Center for Education Statistics, Fast Response Survey System, “Nutrition Education in U.S.Public Schools: Elementary Teacher Survey, K-5,” FRSS 60, 1997.
45
Table 7a.—Standard errors of percent of public elementary school teachers, K-5, who taughtnutrition as a separate subject and who integrated lessons into other subjects to a greatextent, by various characteristics: 1997
Nutrition Standard error of percent integrated to a great extent
Characteristictaught as a
separate
subject (s.e.)
Health/
physical
education
History/
social
studies
MathematicsReading/
language arts Science
All kindergarten through
fifth-grade teachers ................... 1.3 1.2 0.6 0.7 1.3 1.5
Instructional level
Kindergarten-second ................. 1.7 2.0 1.1 0.9 1.8 2.0
Third-fifth ................................. 2.0 1.9 0.6 0.9 1.5 2.4
Enrollment size
Less than 300 ............................ 3.7 4.8 1.2 2.3 3.6 4.9
300-499..................................... 2.7 2.6 1.1 1.0 2.1 2.6
500 or more ............................... 1.8 1.9 0.9 1.1 1.7 2.1
Geographic region
Northwest.................................. 3.7 4.0 0.9 1.3 2.8 3.7
Southeast ................................... 2.7 3.6 1.6 1.4 3.0 3.5
Central....................................... 3.2 3.7 1.2 1.0 2.7 2.7
West .......................................... 2.8 2.2 1.0 1.4 2.0 2.4
Level of support available from
school
0-3 resources ............................. 2.0 2.0 0.8 0.8 1.6 2.0
4-6 resources ............................. 2.1 2.1 0.9 0.9 1.7 2.2
Most formal training to teach
about nutrition
None.......................................... 4.7 4.9 1.4 1.2 3.2 3.5
Research on own ....................... 2.3 2.9 1.1 1.1 1.9 2.0
Inservice.................................... 3.7 4.0 1.1 1.5 3.0 3.7
College coursework................... 2.2 2.4 1.1 1.3 1.7 2.4
SOURCE: U.S. Department of Education, National Center for Education Statistics, Fast Response Survey System, “Nutrition Education in U.S.Public Schools: Elementary Teacher Survey, K-5,” FRSS 60, 1997.
46
Table 8a.—Standard errors of percent of public elementary school teachers, K-5, who taughtnutrition, by extent of use of various teaching strategies for nutrition lessons: 1997
Standard error of extent of useTeaching strategy
Not at all Small extent Moderate extent Great extent
Active discussion .................................................... 0.1 0.9 1.3 1.3
Collaborative or cooperative work.......................... 0.6 1.7 1.6 1.5
Computers or other advanced technology ............... 1.7 1.5 1.0 0.4
Demonstrations ....................................................... 0.9 1.7 1.3 1.3
Field trips................................................................ 1.3 1.2 0.9 0.7
Guest speakers ........................................................ 1.9 1.5 1.1 0.6
Hands-on learning................................................... 0.9 1.6 1.5 1.5
Lecturing................................................................. 1.1 1.4 1.5 0.8
Media presentations ................................................ 1.5 1.5 1.3 0.8
Role playing............................................................ 1.4 1.4 1.1 0.9
Special events (e.g., fairs, plays)............................. 1.6 1.3 0.9 0.5
Student projects....................................................... 1.1 1.5 1.3 0.9
Team teaching......................................................... 1.7 1.5 1.1 0.9
SOURCE: U.S. Department of Education, National Center for Education Statistics, Fast Response Survey System, “Nutrition Education in U.S.Public Schools: Elementary Teacher Survey, K-5,” FRSS 60, 1997.
47
Table 9a.—Standard errors of percent of public elementary school teachers, K-5, who taughtnutrition, who used various teaching strategies to a moderate or great extent,* by variouscharacteristics: 1997
Standard error of teaching strategy used to a moderate or great extent
Characteristic Active
discussion
Collaborative
or cooperative
work
Computers or
other advanced
technology
Hands-on
learningRole playing
Student
projects
All kindergarten through fifth-
grade teachers ................................
0.9 1.6 1.1 1.7 1.6 1.4
Instructional level
Kindergarten-second...................... 1.2 1.9 1.1 2.0 2.3 2.0
Third-fifth ...................................... 1.2 2.4 1.5 2.5 2.3 2.3
Level of support available from
school
0-3 resources.................................. 1.5 2.1 1.2 2.4 2.8 2.3
4-6 resources.................................. 1.1 2.0 1.5 1.7 2.2 2.0
Most formal training to teach about
nutrition
None .............................................. 4.2 5.5 2.4 6.4 5.0 4.0
Research on own............................ 1.4 2.0 1.7 3.0 2.4 2.7
Inservice......................................... 1.8 4.1 2.6 4.1 2.9 3.7
College coursework ....................... 1.4 2.5 1.6 2.3 2.7 2.5
*These response categories were combined for this analysis.
SOURCE: U.S. Department of Education, National Center for Education Statistics, Fast Response Survey System, “Nutrition Education in U.S.Public Schools: Elementary Teacher Survey, K-5,” FRSS 60, 1997.
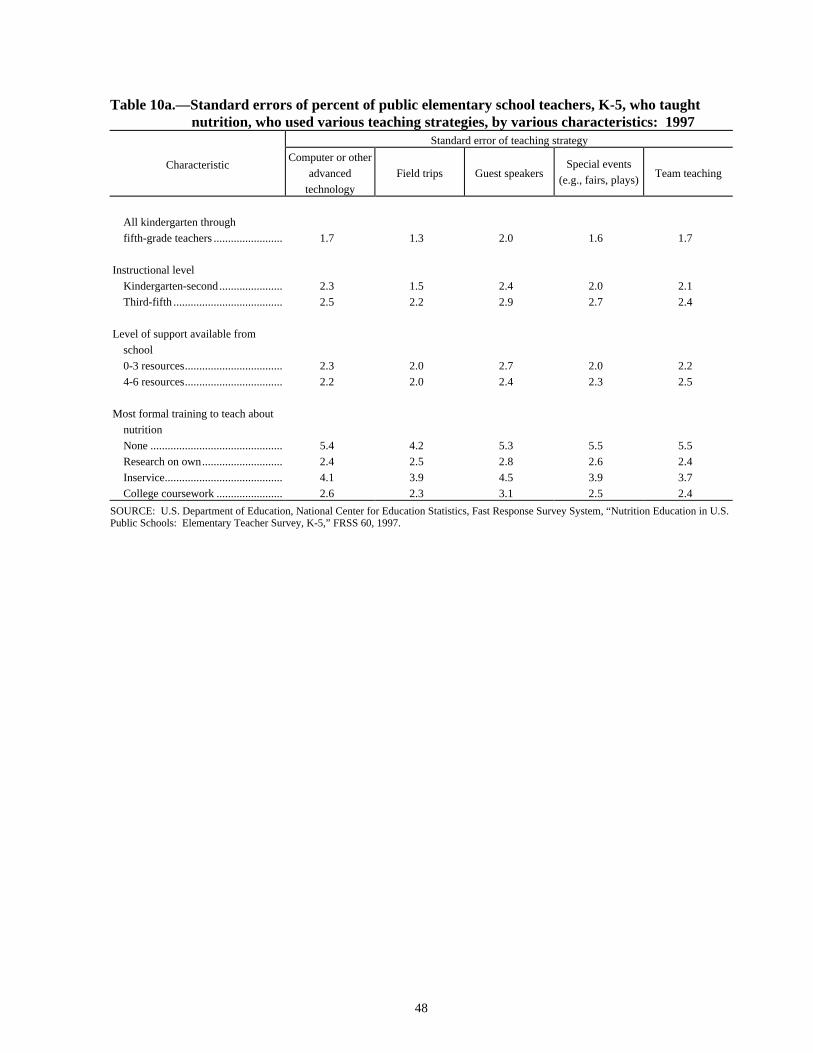
48
Table 10a.—Standard errors of percent of public elementary school teachers, K-5, who taughtnutrition, who used various teaching strategies, by various characteristics: 1997
Standard error of teaching strategy
CharacteristicComputer or other
advanced
technology
Field trips Guest speakersSpecial events
(e.g., fairs, plays)Team teaching
All kindergarten through
fifth-grade teachers ........................ 1.7 1.3 2.0 1.6 1.7
Instructional level
Kindergarten-second...................... 2.3 1.5 2.4 2.0 2.1
Third-fifth ...................................... 2.5 2.2 2.9 2.7 2.4
Level of support available from
school
0-3 resources.................................. 2.3 2.0 2.7 2.0 2.2
4-6 resources.................................. 2.2 2.0 2.4 2.3 2.5
Most formal training to teach about
nutrition
None .............................................. 5.4 4.2 5.3 5.5 5.5
Research on own............................ 2.4 2.5 2.8 2.6 2.4
Inservice......................................... 4.1 3.9 4.5 3.9 3.7
College coursework ....................... 2.6 2.3 3.1 2.5 2.4
SOURCE: U.S. Department of Education, National Center for Education Statistics, Fast Response Survey System, “Nutrition Education in U.S.Public Schools: Elementary Teacher Survey, K-5,” FRSS 60, 1997.
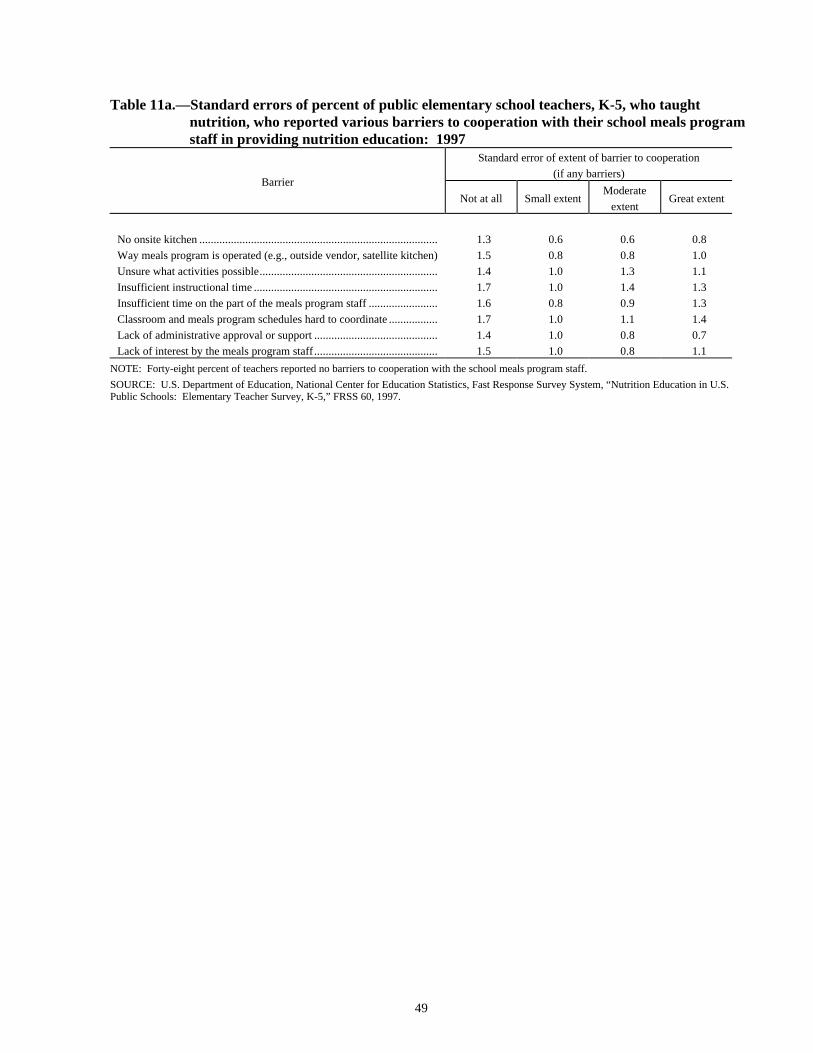
49
Table 11a.—Standard errors of percent of public elementary school teachers, K-5, who taughtnutrition, who reported various barriers to cooperation with their school meals programstaff in providing nutrition education: 1997
Standard error of extent of barrier to cooperation
(if any barriers)Barrier
Not at all Small extentModerate
extentGreat extent
No onsite kitchen ................................................................................... 1.3 0.6 0.6 0.8
Way meals program is operated (e.g., outside vendor, satellite kitchen) 1.5 0.8 0.8 1.0
Unsure what activities possible.............................................................. 1.4 1.0 1.3 1.1
Insufficient instructional time ................................................................ 1.7 1.0 1.4 1.3
Insufficient time on the part of the meals program staff ........................ 1.6 0.8 0.9 1.3
Classroom and meals program schedules hard to coordinate ................. 1.7 1.0 1.1 1.4
Lack of administrative approval or support ........................................... 1.4 1.0 0.8 0.7
Lack of interest by the meals program staff ........................................... 1.5 1.0 0.8 1.1
NOTE: Forty-eight percent of teachers reported no barriers to cooperation with the school meals program staff.
SOURCE: U.S. Department of Education, National Center for Education Statistics, Fast Response Survey System, “Nutrition Education in U.S.Public Schools: Elementary Teacher Survey, K-5,” FRSS 60, 1997.
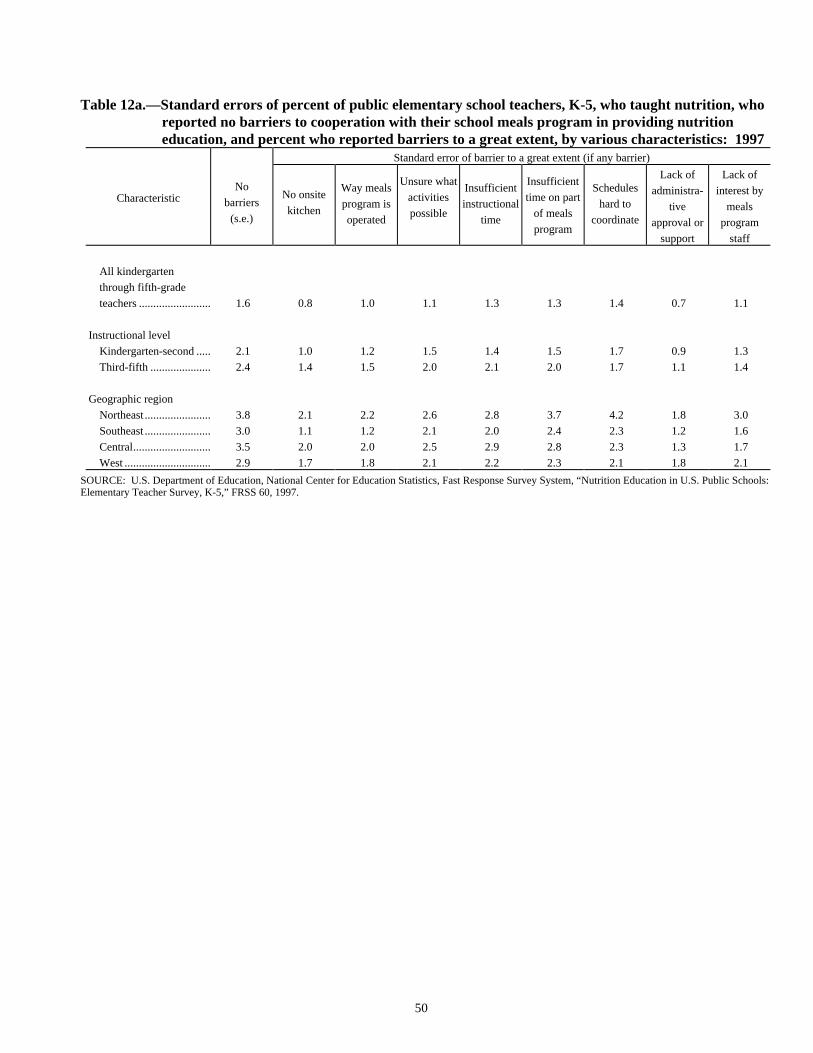
50
Table 12a.—Standard errors of percent of public elementary school teachers, K-5, who taught nutrition, whoreported no barriers to cooperation with their school meals program in providing nutritioneducation, and percent who reported barriers to a great extent, by various characteristics: 1997
Standard error of barrier to a great extent (if any barrier)
CharacteristicNo
barriers
(s.e.)
No onsite
kitchen
Way meals
program is
operated
Unsure what
activities
possible
Insufficient
instructional
time
Insufficient
time on part
of meals
program
Schedules
hard to
coordinate
Lack of
administra-
tive
approval or
support
Lack of
interest by
meals
program
staff
All kindergarten
through fifth-grade
teachers ......................... 1.6 0.8 1.0 1.1 1.3 1.3 1.4 0.7 1.1
Instructional level
Kindergarten-second ..... 2.1 1.0 1.2 1.5 1.4 1.5 1.7 0.9 1.3
Third-fifth ..................... 2.4 1.4 1.5 2.0 2.1 2.0 1.7 1.1 1.4
Geographic region
Northeast ....................... 3.8 2.1 2.2 2.6 2.8 3.7 4.2 1.8 3.0
Southeast ....................... 3.0 1.1 1.2 2.1 2.0 2.4 2.3 1.2 1.6
Central........................... 3.5 2.0 2.0 2.5 2.9 2.8 2.3 1.3 1.7
West .............................. 2.9 1.7 1.8 2.1 2.2 2.3 2.1 1.8 2.1
SOURCE: U.S. Department of Education, National Center for Education Statistics, Fast Response Survey System, “Nutrition Education in U.S. Public Schools:Elementary Teacher Survey, K-5,” FRSS 60, 1997.
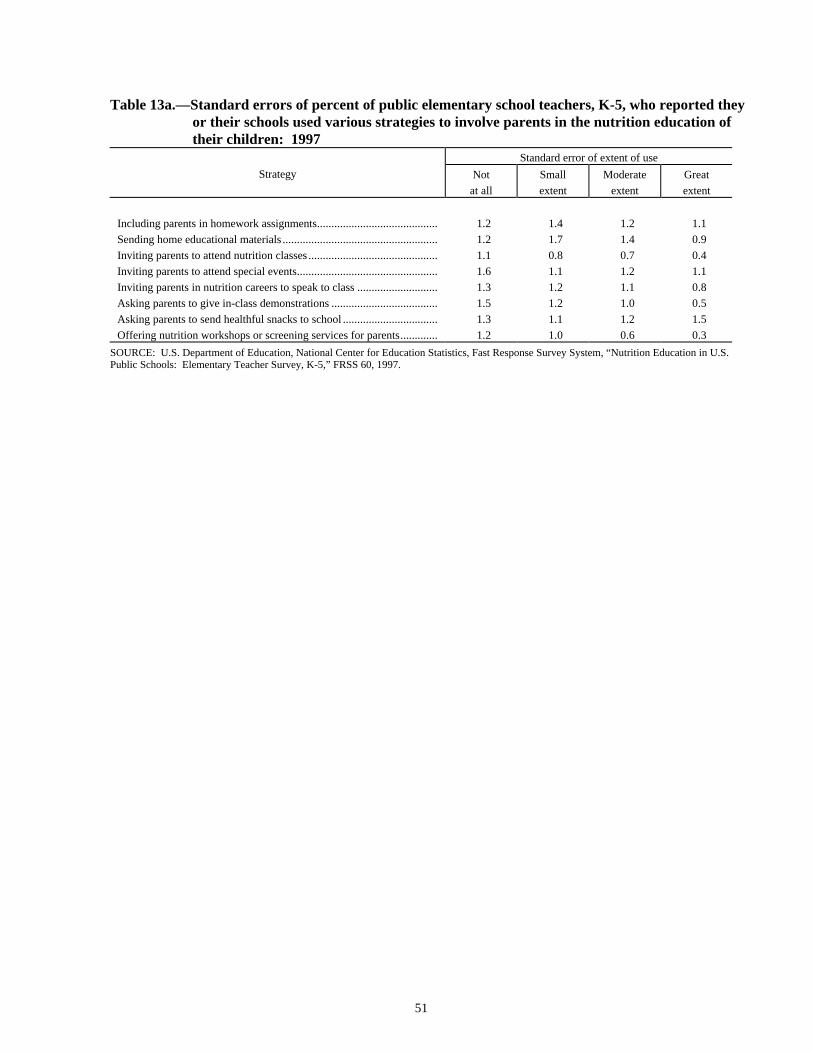
51
Table 13a.—Standard errors of percent of public elementary school teachers, K-5, who reported theyor their schools used various strategies to involve parents in the nutrition education oftheir children: 1997
Standard error of extent of use
Strategy Not
at all
Small
extent
Moderate
extent
Great
extent
Including parents in homework assignments.......................................... 1.2 1.4 1.2 1.1
Sending home educational materials ...................................................... 1.2 1.7 1.4 0.9
Inviting parents to attend nutrition classes ............................................. 1.1 0.8 0.7 0.4
Inviting parents to attend special events................................................. 1.6 1.1 1.2 1.1
Inviting parents in nutrition careers to speak to class ............................ 1.3 1.2 1.1 0.8
Asking parents to give in-class demonstrations ..................................... 1.5 1.2 1.0 0.5
Asking parents to send healthful snacks to school ................................. 1.3 1.1 1.2 1.5
Offering nutrition workshops or screening services for parents............. 1.2 1.0 0.6 0.3
SOURCE: U.S. Department of Education, National Center for Education Statistics, Fast Response Survey System, “Nutrition Education in U.S.Public Schools: Elementary Teacher Survey, K-5,” FRSS 60, 1997.
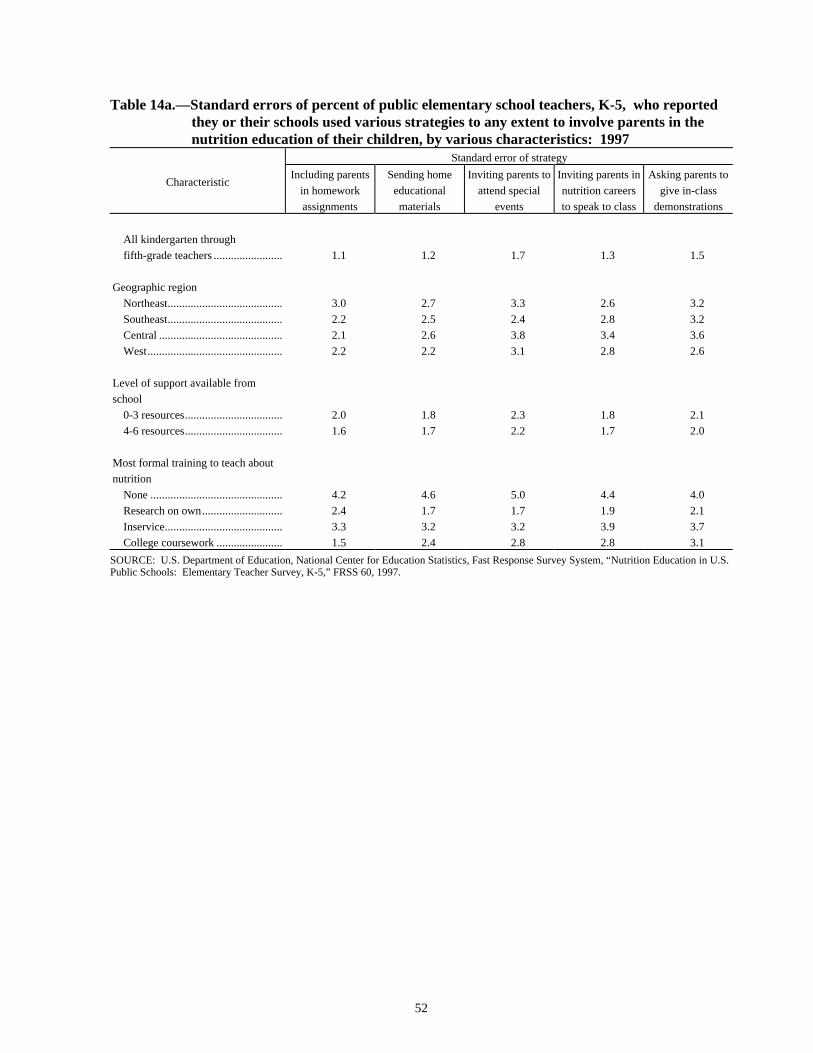
52
Table 14a.—Standard errors of percent of public elementary school teachers, K-5, who reportedthey or their schools used various strategies to any extent to involve parents in thenutrition education of their children, by various characteristics: 1997
Standard error of strategy
CharacteristicIncluding parents
in homework
assignments
Sending home
educational
materials
Inviting parents to
attend special
events
Inviting parents in
nutrition careers
to speak to class
Asking parents to
give in-class
demonstrations
All kindergarten through
fifth-grade teachers ........................ 1.1 1.2 1.7 1.3 1.5
Geographic region
Northeast........................................ 3.0 2.7 3.3 2.6 3.2
Southeast........................................ 2.2 2.5 2.4 2.8 3.2
Central ........................................... 2.1 2.6 3.8 3.4 3.6
West............................................... 2.2 2.2 3.1 2.8 2.6
Level of support available from
school
0-3 resources.................................. 2.0 1.8 2.3 1.8 2.1
4-6 resources.................................. 1.6 1.7 2.2 1.7 2.0
Most formal training to teach about
nutrition
None .............................................. 4.2 4.6 5.0 4.4 4.0
Research on own............................ 2.4 1.7 1.7 1.9 2.1
Inservice......................................... 3.3 3.2 3.2 3.9 3.7
College coursework ....................... 1.5 2.4 2.8 2.8 3.1
SOURCE: U.S. Department of Education, National Center for Education Statistics, Fast Response Survey System, “Nutrition Education in U.S.Public Schools: Elementary Teacher Survey, K-5,” FRSS 60, 1997.
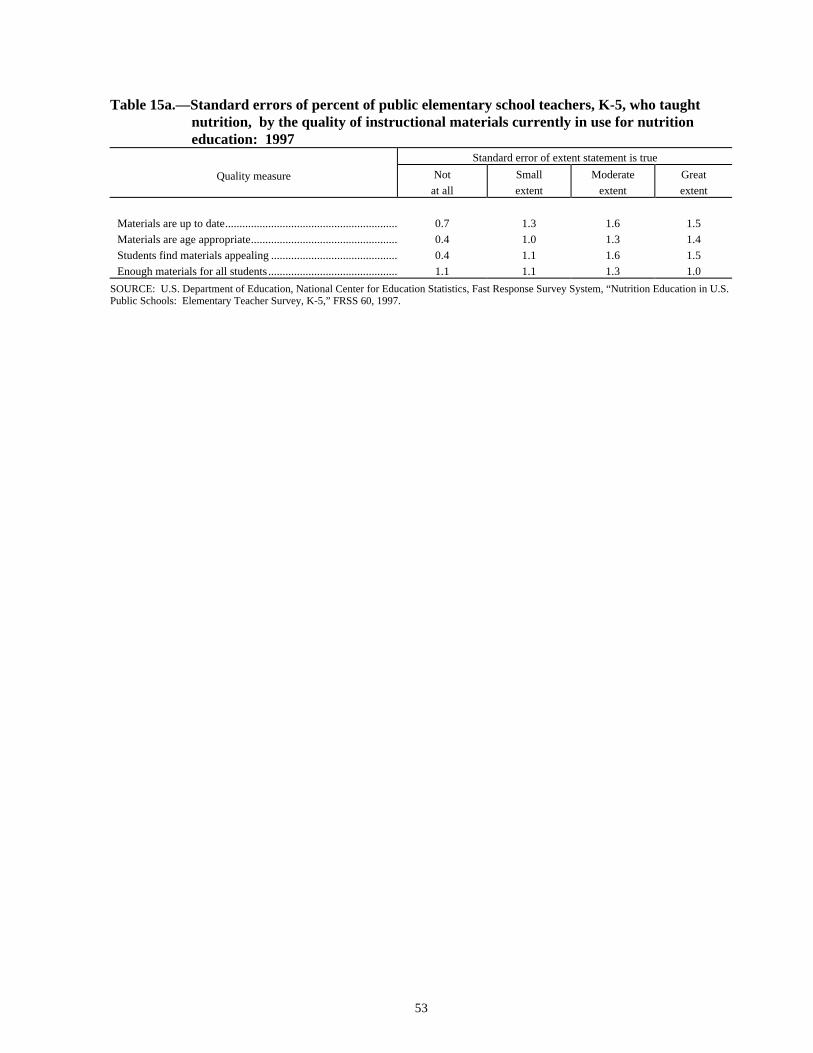
53
Table 15a.—Standard errors of percent of public elementary school teachers, K-5, who taughtnutrition, by the quality of instructional materials currently in use for nutritioneducation: 1997
Standard error of extent statement is true
Quality measure Not
at all
Small
extent
Moderate
extent
Great
extent
Materials are up to date............................................................ 0.7 1.3 1.6 1.5
Materials are age appropriate................................................... 0.4 1.0 1.3 1.4
Students find materials appealing ............................................ 0.4 1.1 1.6 1.5
Enough materials for all students ............................................. 1.1 1.1 1.3 1.0
SOURCE: U.S. Department of Education, National Center for Education Statistics, Fast Response Survey System, “Nutrition Education in U.S.Public Schools: Elementary Teacher Survey, K-5,” FRSS 60, 1997.
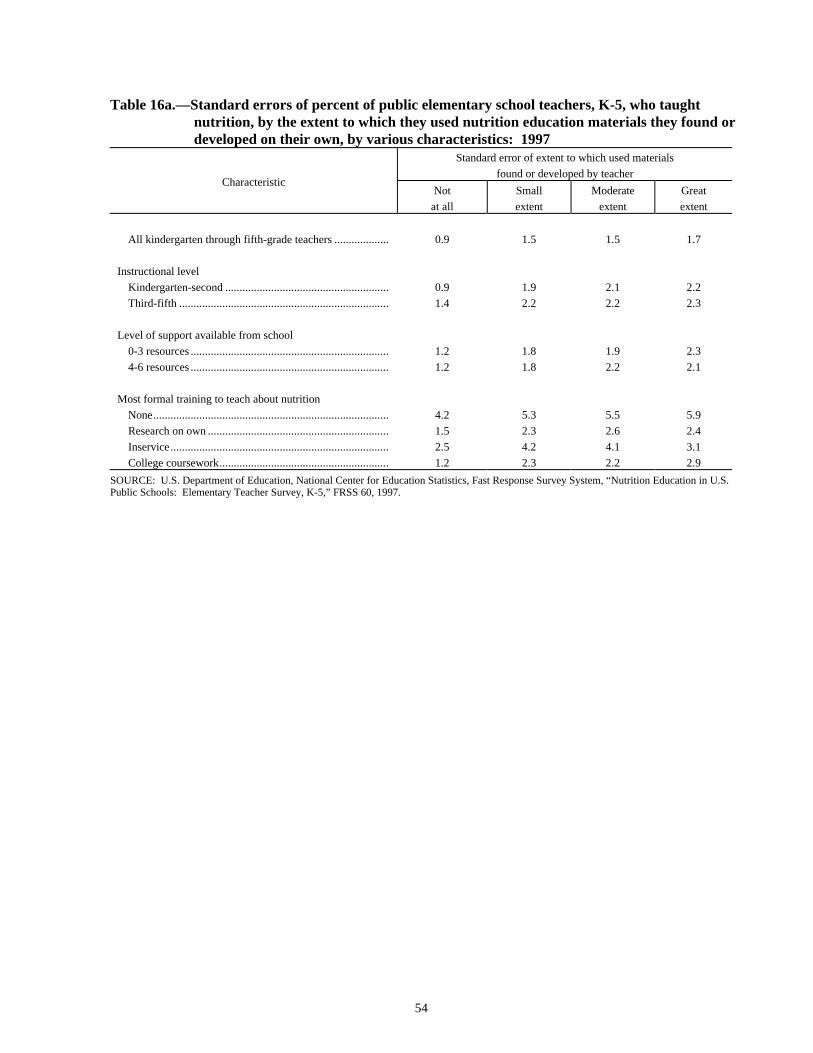
54
Table 16a.—Standard errors of percent of public elementary school teachers, K-5, who taughtnutrition, by the extent to which they used nutrition education materials they found ordeveloped on their own, by various characteristics: 1997
Standard error of extent to which used materials
found or developed by teacherCharacteristic
Not
at all
Small
extent
Moderate
extent
Great
extent
All kindergarten through fifth-grade teachers ................... 0.9 1.5 1.5 1.7
Instructional level
Kindergarten-second ......................................................... 0.9 1.9 2.1 2.2
Third-fifth ......................................................................... 1.4 2.2 2.2 2.3
Level of support available from school
0-3 resources ..................................................................... 1.2 1.8 1.9 2.3
4-6 resources ..................................................................... 1.2 1.8 2.2 2.1
Most formal training to teach about nutrition
None.................................................................................. 4.2 5.3 5.5 5.9
Research on own ............................................................... 1.5 2.3 2.6 2.4
Inservice............................................................................ 2.5 4.2 4.1 3.1
College coursework........................................................... 1.2 2.3 2.2 2.9
SOURCE: U.S. Department of Education, National Center for Education Statistics, Fast Response Survey System, “Nutrition Education in U.S.Public Schools: Elementary Teacher Survey, K-5,” FRSS 60, 1997.
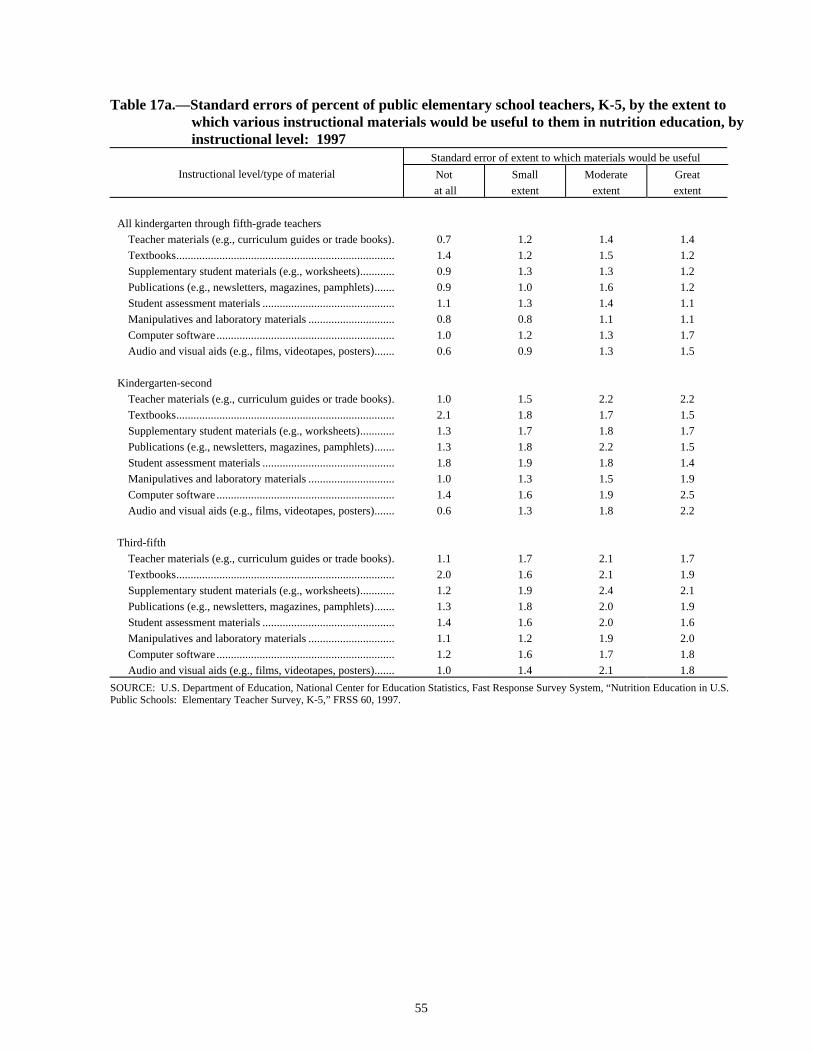
55
Table 17a.—Standard errors of percent of public elementary school teachers, K-5, by the extent towhich various instructional materials would be useful to them in nutrition education, byinstructional level: 1997
Standard error of extent to which materials would be useful
Instructional level/type of material Not
at all
Small
extent
Moderate
extent
Great
extent
All kindergarten through fifth-grade teachers
Teacher materials (e.g., curriculum guides or trade books). 0.7 1.2 1.4 1.4
Textbooks............................................................................ 1.4 1.2 1.5 1.2
Supplementary student materials (e.g., worksheets)............ 0.9 1.3 1.3 1.2
Publications (e.g., newsletters, magazines, pamphlets)....... 0.9 1.0 1.6 1.2
Student assessment materials .............................................. 1.1 1.3 1.4 1.1
Manipulatives and laboratory materials .............................. 0.8 0.8 1.1 1.1
Computer software .............................................................. 1.0 1.2 1.3 1.7
Audio and visual aids (e.g., films, videotapes, posters)....... 0.6 0.9 1.3 1.5
Kindergarten-second
Teacher materials (e.g., curriculum guides or trade books). 1.0 1.5 2.2 2.2
Textbooks............................................................................ 2.1 1.8 1.7 1.5
Supplementary student materials (e.g., worksheets)............ 1.3 1.7 1.8 1.7
Publications (e.g., newsletters, magazines, pamphlets)....... 1.3 1.8 2.2 1.5
Student assessment materials .............................................. 1.8 1.9 1.8 1.4
Manipulatives and laboratory materials .............................. 1.0 1.3 1.5 1.9
Computer software .............................................................. 1.4 1.6 1.9 2.5
Audio and visual aids (e.g., films, videotapes, posters)....... 0.6 1.3 1.8 2.2
Third-fifth
Teacher materials (e.g., curriculum guides or trade books). 1.1 1.7 2.1 1.7
Textbooks............................................................................ 2.0 1.6 2.1 1.9
Supplementary student materials (e.g., worksheets)............ 1.2 1.9 2.4 2.1
Publications (e.g., newsletters, magazines, pamphlets)....... 1.3 1.8 2.0 1.9
Student assessment materials .............................................. 1.4 1.6 2.0 1.6
Manipulatives and laboratory materials .............................. 1.1 1.2 1.9 2.0
Computer software .............................................................. 1.2 1.6 1.7 1.8
Audio and visual aids (e.g., films, videotapes, posters)....... 1.0 1.4 2.1 1.8
SOURCE: U.S. Department of Education, National Center for Education Statistics, Fast Response Survey System, “Nutrition Education in U.S.Public Schools: Elementary Teacher Survey, K-5,” FRSS 60, 1997.
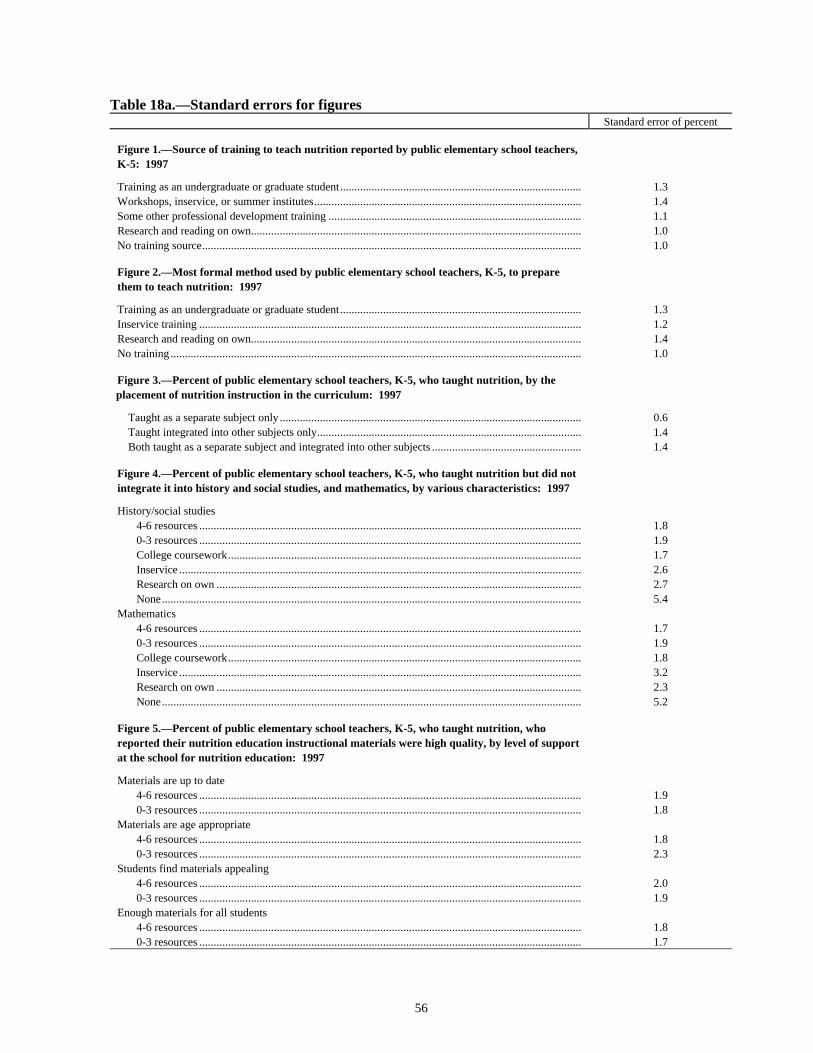
56
Table 18a.—Standard errors for figuresStandard error of percent
Figure 1.—Source of training to teach nutrition reported by public elementary school teachers,K-5: 1997
Training as an undergraduate or graduate student.................................................................................... 1.3Workshops, inservice, or summer institutes............................................................................................. 1.4Some other professional development training ........................................................................................ 1.1Research and reading on own................................................................................................................... 1.0No training source.................................................................................................................................... 1.0
Figure 2.—Most formal method used by public elementary school teachers, K-5, to preparethem to teach nutrition: 1997
Training as an undergraduate or graduate student.................................................................................... 1.3Inservice training ..................................................................................................................................... 1.2Research and reading on own................................................................................................................... 1.4No training ............................................................................................................................................... 1.0
Figure 3.—Percent of public elementary school teachers, K-5, who taught nutrition, by theplacement of nutrition instruction in the curriculum: 1997
Taught as a separate subject only......................................................................................................... 0.6Taught integrated into other subjects only............................................................................................ 1.4Both taught as a separate subject and integrated into other subjects .................................................... 1.4
Figure 4.—Percent of public elementary school teachers, K-5, who taught nutrition but did notintegrate it into history and social studies, and mathematics, by various characteristics: 1997
History/social studies4-6 resources ..................................................................................................................................... 1.80-3 resources ..................................................................................................................................... 1.9College coursework........................................................................................................................... 1.7Inservice ............................................................................................................................................ 2.6Research on own ............................................................................................................................... 2.7None.................................................................................................................................................. 5.4
Mathematics4-6 resources ..................................................................................................................................... 1.70-3 resources ..................................................................................................................................... 1.9College coursework........................................................................................................................... 1.8Inservice ............................................................................................................................................ 3.2Research on own ............................................................................................................................... 2.3None.................................................................................................................................................. 5.2
Figure 5.—Percent of public elementary school teachers, K-5, who taught nutrition, whoreported their nutrition education instructional materials were high quality, by level of supportat the school for nutrition education: 1997
Materials are up to date4-6 resources ..................................................................................................................................... 1.90-3 resources ..................................................................................................................................... 1.8
Materials are age appropriate4-6 resources ..................................................................................................................................... 1.80-3 resources ..................................................................................................................................... 2.3
Students find materials appealing4-6 resources ..................................................................................................................................... 2.00-3 resources ..................................................................................................................................... 1.9
Enough materials for all students4-6 resources ..................................................................................................................................... 1.80-3 resources ..................................................................................................................................... 1.7
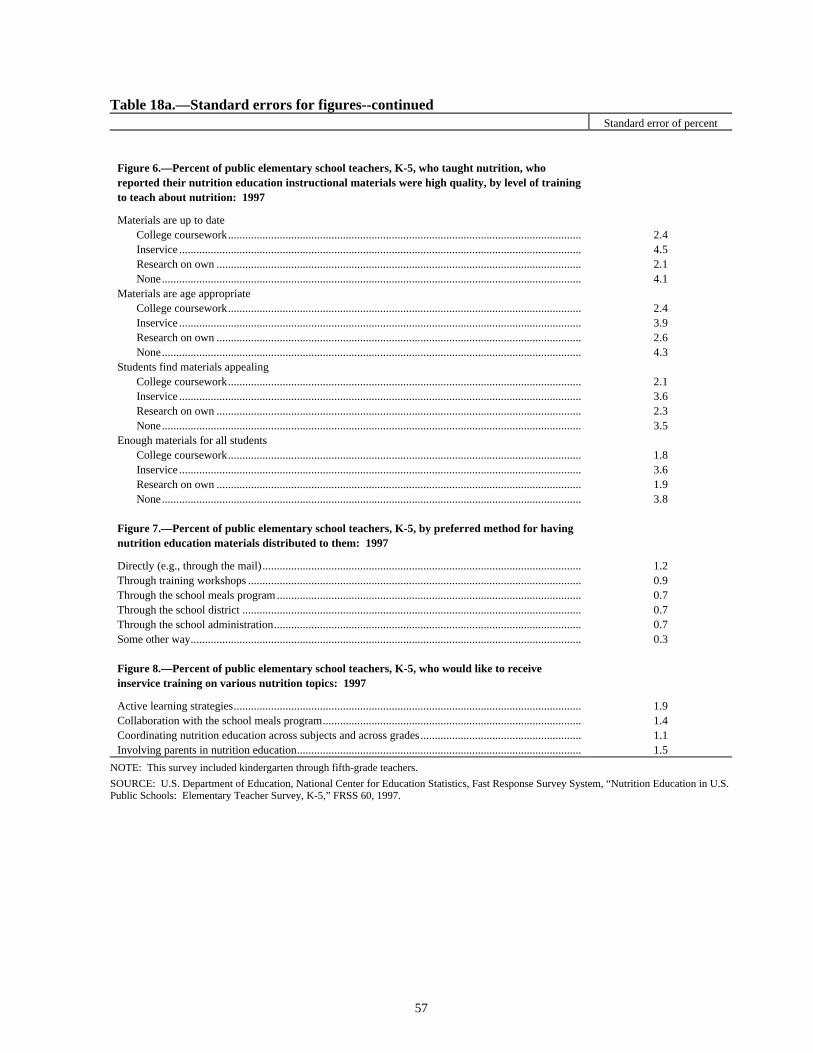
57
Table 18a.—Standard errors for figures--continuedStandard error of percent
Figure 6.—Percent of public elementary school teachers, K-5, who taught nutrition, whoreported their nutrition education instructional materials were high quality, by level of trainingto teach about nutrition: 1997
Materials are up to dateCollege coursework........................................................................................................................... 2.4Inservice ............................................................................................................................................ 4.5Research on own ............................................................................................................................... 2.1None.................................................................................................................................................. 4.1
Materials are age appropriateCollege coursework........................................................................................................................... 2.4Inservice ............................................................................................................................................ 3.9Research on own ............................................................................................................................... 2.6None.................................................................................................................................................. 4.3
Students find materials appealingCollege coursework........................................................................................................................... 2.1Inservice ............................................................................................................................................ 3.6Research on own ............................................................................................................................... 2.3None.................................................................................................................................................. 3.5
Enough materials for all studentsCollege coursework........................................................................................................................... 1.8Inservice ............................................................................................................................................ 3.6Research on own ............................................................................................................................... 1.9None.................................................................................................................................................. 3.8
Figure 7.—Percent of public elementary school teachers, K-5, by preferred method for havingnutrition education materials distributed to them: 1997
Directly (e.g., through the mail)............................................................................................................... 1.2Through training workshops .................................................................................................................... 0.9Through the school meals program.......................................................................................................... 0.7Through the school district ...................................................................................................................... 0.7Through the school administration........................................................................................................... 0.7Some other way........................................................................................................................................ 0.3
Figure 8.—Percent of public elementary school teachers, K-5, who would like to receiveinservice training on various nutrition topics: 1997
Active learning strategies......................................................................................................................... 1.9Collaboration with the school meals program.......................................................................................... 1.4Coordinating nutrition education across subjects and across grades........................................................ 1.1Involving parents in nutrition education................................................................................................... 1.5
NOTE: This survey included kindergarten through fifth-grade teachers.
SOURCE: U.S. Department of Education, National Center for Education Statistics, Fast Response Survey System, “Nutrition Education in U.S.Public Schools: Elementary Teacher Survey, K-5,” FRSS 60, 1997.

58

59
Appendix C
Survey Form

60

61
Info
rmat
ion
Copy
Do
not c
ompl
ete
U.S. DEPARTMENT OF EDUCATION O.M.B. NO.: 1850-0733NATIONAL CENTER FOR EDUCATION STATISTICS EXPIRATION DATE: 1/31/98
WASHINGTON, D.C. 20208-5651
NUTRITION EDUCATION IN U.S. PUBLIC SCHOOLS:ELEMENTARY TEACHER SURVEY, K-5
FAST RESPONSE SURVEY SYSTEM
This survey is authorized by law (P.L. 103382). While you are not required to respond, your cooperation is neededto make the results of this survey comprehensive, accurate, and timely.
DEFINITIONS FOR THIS SURVEY:
Collaborative or cooperative work - students work together in small groups to solve problems or do projects.
Coordinated school nutrition policy - may address such issues as coordinating nutrition education acrosssubjects and across grades, collaboration between the school meals program and the classroom, and policies onoutside food vendors in the school and closed lunch periods.
Coordinating nutrition education across subjects and across grades - refers to the integration of nutritionlessons into subjects such as math and science, and the integration across grades so the lessons at each gradelevel build on the previous year’s lessons.
Hands-on learning - students engage in direct learning experiences by applying their learning to real-life situationsor everyday issues and events.
Nutrition education materials - lesson plans, curriculum guides, posters, pamphlets, multimedia, etc., designed toimprove health, achieve positive change in dietary habits, and emphasize the relationship between diet and health.
Nutrition education - refers to curricula, courses, lesson plans and units, and activities designed to provideinstruction with regard to the nutritional value of foods and the relationship between food and human health.
LABEL
IF ABOVE INFORMATION IS INCORRECT, PLEASE MAKE CORRECTIONS DIRECTLY ON LABEL.
Name of person completing form: _______________________________ Title: __________________________
Telephone:____________________ Fax:_________________________ E-mail: _____________________
Best days and times to reach you (in case of questions): ______________________________________________
PLEASE RETURN COMPLETED FORM TO:
WESTAT1650 Research BoulevardRockville, Maryland 20850
According to the Paperwork Reduction Act of 1995, no persons are required to respond to a collection of information unless it displays a validOMB control number. The valid OMB control number for this information collection is 1850-0733. The time required to complete thisinformation collection is estimated to average 30 minutes per response, including the time to review instructions, search existing dataresources, gather the data needed, and complete and review the information collected. If you have any comments concerning the accuracy ofthe time estimate(s) or suggestions for improving this form, please write to: U.S. Department of Education, Washington, D.C. 20202-4651. Ifyou have comments or concerns regarding the status of your individual submission of this form, write directly to: National Center for EducationStatistics, 555 New Jersey Avenue, N.W., Washington, D.C. 20208.FRSS Form No. 60, 2/97
Please refer to definitions on the front cover for words in boldface.
Info
rmat
ion
Copy
Do
not c
ompl
ete
1. This school year (1996-97), have you taught or will you teach lessons about nutrition to your students? (Includelessons taught by invited speakers.)
Yes ..................... 1 No........................ 2
2. Which of the following resources would help improve nutrition education in your classroom? For column A,indicate whether each resource is already available to you. For column B, indicate how much potential eachresource has to improve nutrition education.
A.Resource B. Potential to improvealready nutrition education
available?Yes No None Small Moderate Great
a. Ongoing inservice training that focuseson teaching strategies for behavior change....... 1 2 1 2 3 4
b. School food service personnel serving healthy,well-balanced meals in the cafeteria ................. 1 2 1 2 3 4
c. Reference materials on nutrition educationavailable at your school ..................................... 1 2 1 2 3 4
d. Support from your school or district for nutritioneducation as a valid use of instructional time .... 1 2 1 2 3 4
3. Do you have the following policies readily available to you at school?
Yes Noa. A written policy or guidelines on nutrition education from your
school, district, or state................................................................ 1 2b. A coordinated school nutrition policy ..................................... 1 2
Check your answer to question 1. If you answered “no” to question 1, skip now to question 10. If you answered“yes” to question 1, continue with question 4.
4. About how many total hours will you have spent teaching about nutrition to your students by the end of this schoolyear (1996-97)? (Include both time dedicated specifically to nutrition lessons and time spent on integratedlessons.) _______ hours
5. To what extent do you integrate lessons about nutrition into the following subject areas? (Kindergarten teachersmay skip this question.)
Not at Small Moderate Greatall extent extent extent
a. Health/physical education............................................................ 1 2 3 4b. History/social studies ................................................................... 1 2 3 4c. Mathematics ................................................................................ 1 2 3 4d. Reading/language arts................................................................. 1 2 3 4e. Science........................................................................................ 1 2 3 4f. Some other subject (specify ________________________ ) .... 1 2 3 4
6. Do you teach nutrition as a separate subject?
Yes ..................... 1 No........................ 2
7. To what extent are the following things true of the nutrition education materials you use?
Not at Small Moderate Greatall extent extent extent
a. The materials are up to date........................................................ 1 2 3 4b. The materials are age appropriate .............................................. 1 2 3 4c. My students find the materials appealing .................................... 1 2 3 4d. I have enough materials for all my students to use ..................... 1 2 3 4e. Most of the materials are ones I found or developed on my own 1 2 3 4
Please refer to definitions on the front cover for words in boldface.
Info
rmat
ion
Copy
Do
not c
ompl
ete
8. To what extent do you use the following teaching strategies for nutrition lessons?Not at Small Moderate Great
all extent extent extenta. Active discussion ......................................................................... 1 2 3 4b. Collaborative or cooperative work .......................................... 1 2 3 4c. Computers or other advanced technology................................... 1 2 3 4d. Demonstrations ........................................................................... 1 2 3 4e. Field trips ..................................................................................... 1 2 3 4f. Guest speakers ........................................................................... 1 2 3 4g. Hands-on learning ..................................................................... 1 2 3 4h. Lecturing ...................................................................................... 1 2 3 4i. Media presentations .................................................................... 1 2 3 4j. Role playing ................................................................................. 1 2 3 4k. Special events (e.g., fairs, plays)................................................. 1 2 3 4l. Student projects........................................................................... 1 2 3 4m. Team teaching............................................................................. 1 2 3 4n. Some other strategy (specify ________________________ ).... 1 2 3 4
9. To what extent are the following factors barriers to cooperation with your school’s meals program in providingnutrition education to your students? If you feel there are no barriers, check here and skip to Question 10.
Not at Small Moderate Greatall extent extent extent
a. No onsite kitchen at this school ................................................... 1 2 3 4b. The way the school meals program is operated (e.g., outside
vendor, satellite kitchen) .............................................................. 1 2 3 4c. Unsure what activities are possible ............................................ 1 2 3 4d. Insufficient instructional time to fit in activities ............................. 1 2 3 4e. Insufficient time on the part of the meals program staff .............. 1 2 3 4f. Classroom and meals program schedules hard to coordinate.... 1 2 3 4g. Lack of administrative support or approval.................................. 1 2 3 4h. Lack of interest by the meals program staff ................................ 1 2 3 4i. Other barrier (specify_____________________________)........ 1 2 3 4
10. In this school year (1996-97), to what extent have you or your school used, or do you plan to use, the followingstrategies to involve parents in the nutrition education of their children?
Not at Small Moderate Greatall extent extent extent
a. Including parents in homework assignments .............................. 1 2 3 4b. Sending home educational materials to help parents learn
about nutrition or teach their children about nutrition................... 1 2 3 4c. Inviting parents to attend nutrition classes................................... 1 2 3 4d. Inviting parents to attend special events, such as School
Lunch Week or tasting parties..................................................... 1 2 3 4e. Inviting parents in nutrition-related careers to speak
to the class................................................................................... 1 2 3 4f. Asking parents to give in-class demonstrations .......................... 1 2 3 4g. Asking parents to send healthful snacks to school...................... 1 2 3 4h. Offering nutrition workshops or screening services for parents .. 1 2 3 4
11. What types of instructional materials (in addition to any you already use) would be useful to you in your nutritioneducation efforts? Mark the extent to which the following types of nutrition education materials would be useful.
Not at Small Moderate Greatall extent extent extent
a. Teacher materials such as curriculum guides or trade books..... 1 2 3 4b. Textbooks .................................................................................... 1 2 3 4c. Supplementary student materials such as worksheets ............... 1 2 3 4d. Publications such as newsletters, magazines, or pamphlets ...... 1 2 3 4e. Student assessment materials .................................................... 1 2 3 4f. Manipulatives and laboratory materials ....................................... 1 2 3 4g. Computer software ...................................................................... 1 2 3 4h. Audio and visual aids such as films, videotapes, or posters ....... 1 2 3 4i. Other materials (specify ________________________ ) ........... 1 2 3 4

Please refer to definitions on the front cover for words in boldface.
Info
rmat
ion
Copy
Do
not c
ompl
ete
12. How would you prefer to have nutrition education materials distributed to you? Please rank the following inorder of your preference from 1 to 6, with 1 = 1st choice, 2 = 2nd choice, etc.
Ranka. Through the school meals program................................................... _____b. Through your school’s administration................................................ _____c. Through your school district............................................................... _____d. Through training workshops .............................................................. _____e. Directly to you (e.g., through the mail) ............................................... _____f. Some other way (specify ________________________ ) ................ _____
13. Are you familiar with Team Nutrition, the U.S. Department of Agriculture initiative to improve the health ofstudents?
Yes ..................... 1 No........................ 2
Teacher information
14. What grade or grades do you teach this school year (1996-97)?
Pre-K K 1 2 3 4 5 6 7 8 Ungraded
15. Do you teach a self-contained classroom (i.e., are you responsible for teaching multiple subjects to the same classof students all or most of the day)?
Yes ..................... 1 No........................ 2
16. Including this school year (1996-97), how many years have you been teaching at the elementary school level?________
17. Have you used any of the following methods to learn how to teach students about nutrition?
Yes No If yes:a. Workshop, inservice, or summer institute training ............................ 1 2 #hours______b. Training as an undergraduate or graduate student ........................... 1 2 #courses____c. Some other professional development training ................................. 1 2 #courses____d. Research and reading on your own................................................... 1 2
18. On which of the following nutrition topics would you like to receive inservice training?
Yes Noa. Active learning strategies................................................................... 1 2b. Collaboration with the school meals program.................................... 1 2c. Coordinating nutrition education across subjects and across
grades ............................................................................................... 1 2d. Involving parents in nutrition education ............................................. 1 2e. Some other topic (specify ________________________ ).............. 1 2
19. In your view, what could be done to encourage cooperation and collaboration between classroom teachers andyour school meals program in providing nutrition education to students?
______________________________________________________________________________________
______________________________________________________________________________________
______________________________________________________________________________________
______________________________________________________________________________________
______________________________________________________________________________________
______________________________________________________________________________________
______________________________________________________________________________________
______________________________________________________________________________________
______________________________________________________________________________________