Embed Size (px)
Citation preview

Clinical practice review Nutrition in the Critically Ill Patient: Part I. Essential Physiology and Pathophysiology
M. ATKINSON, L. I. G. WORTHLEY Department of Critical Care Medicine, Flinders Medical Centre, Adelaide, SOUTH AUSTRALIA
ABSTRACT Objective: To review the human nutrition in the critically ill patient in a three-part presentation. Data sources: Articles and published peer-review abstracts and a review of studies reported and identified through a MEDLINE search of the English language literature on parenteral nutrition. Summary of review: In a healthy individual, nutrition involves an alternating system of feeding and fasting, with periods of fasting longer than 72 hr inducing a state of starvation. The hormonal response to nutrition is substrate controlled with glucose and amino acids, during the fed state, stimulating insulin secretion and decreasing glucagon secretion. Glycogen reserves and protein synthesis increase and the excess carbohydrate, amino acids and fats are stored as lipid. During the fasted state, plasma levels of glucose and amino acids fall, reducing insulin secretion and increasing glucagon secretion, stimulating gluconeogenesis and glycogenolysis. A further reduction in insulin and increase in glucagon secretion occurs during starvation and mild sympathetic activation stimulates hormone-sensitive lipoprotein lipase to increase the release of free fatty acids (FFAs) from adipose tissue. Much of the excess FFAs are converted by the liver to ketone bodies.
During injury and sepsis the nutritional hormones are no longer substrate controlled. For example, during injury, to maintain haemodynamic homeostasis, an increase in sympathetic tone and catecholamine (i.e. adrenaline and noradrenaline) secretion occurs, and in the septic state, in addition to the hormonal stress response, polypeptide mediators of tumour necrosis factor (TNF-α) and interleukin-1 are liberated, causing an increase in glucose intolerance and an increase in skeletal muscle protein catabolism.
Optimal nutritional support in the critically ill patient can only be achieved when the patient is in the convalescent phase of injury, as nutritional supplementation will not reverse the factors causing proteolysis, gluconeogenesis or lipolysis associated with stress or sepsis. Therapy should therefore focus upon decreasing or reducing the factors causing the acute illness before nutritional supplementation can be given with benefit. Conclusions: In the critically ill patient nutritional hormones are no longer substrate controlled with glucose, amino acid and lipid intolerance often occurring when given to excess. While nutritional supplementation is often required, particularly during a prolonged illness, the influence of stress and sepsis should be minimised while the nutritional substrates are being provided. (Critical Care and Resuscitation 2003; 5: 109-120)
Key words: Nutrition, parenteral nutrition, enteral nutrition, critically ill
Correspondence to: Dr. M. Atkinson, Department of Critical Care Medicine, Flinders Medical Centre, Bedford Park, South Australia 5042
109

M. ATKINSON, ET AL Critical Care and Resuscitation 2003; 5: 109-120
Normal individuals will adapt to periods of starvation up to 30 days, due to body fuel reserves (table 1), without demonstrating any adverse effects on wound healing, immunity or organ function.1 Periods of starvat-ion in excess of this will lead to nutritional depletion causing respiratory muscle weakness,2 diminished host defence and poor wound healing,3 with death often occurring at about 60 days.4 In disease and in malnouri-shed states, starvation is poorly tolerated and a correla-tion often exists between the degree of starvation and the patient’s outcome.5 Therefore, a patient’s diet should always be reviewed and nutrition prescribed as a routine part of therapy. The adult diet normally contains approximately 220 g of carbohydrate (880 kcal), 90 g fat (810 kcal), and 80 g of protein (320 kcal), along with water, electrolytes, vitamins, trace elements and fibre. The recommended daily allowance (RDA) for an adult ranges from 1800 - 2800 kcal for energy and 44 - 56 g for protein. During feeding, fasting and starvation, the nutritional hormone status is substrate controlled (table 2). The percentages of substrate used to provide energy in the various nutritional states are listed in table 3. Table 1. Body fuel reserves for 70 kg man Substrate Organ Weight (g) kcal Triglyceride Adipose tissue 15 000 140 000 Carbohydrate Glycogen Skeletal muscle 350 1 400 Liver 100 400 Glucose Extracellular fluid 20 80 Protein Skeletal muscle 6 000 24 000
NORMAL NUTRITION Normal nutrition involves an alternating system of feeding and fasting, with periods of fasting longer than 72 hr inducing a state of starvation. Feeding. During the fed state, plasma glucose and amino acid levels increase, stimulating insulin secretion and decreasing glucagon secretion. Glycogen reserves and protein synthesis increase and the excess carbohyd-rate, amino acids and fats are stored as lipid. Fasting. During the fasted state, plasma levels of glucose and amino acids fall, reducing insulin secretion and increasing glucagon secretion, stimulating gluconeo-genesis and glycogenolysis. After 24 hr of fasting, the hepatic glycogen is largely depleted, thereafter body protein is utilised to meet the obligatory demand for glucose. The reduction in insulin levels permit an increase in release of amino acids (mainly alanine and glutamine) from skeletal muscle (a processes which is inhibited by insulin), which are transported to the splanchnic bed and kidney to undergo gluconeogenesis.6 The increase in glucagon enhances gluconeogenesis and inhibits the formation of malonyl coenzyme A (CoA). The latter inhibits carnitine acyl-transferase I, thereby inhibiting the initial step in the long chain free fatty acid oxidative sequence. Thus, low levels of malonyl CoA releases the inhibition of carnitine acyltransferase I, which in turn augments hepatic oxidation of long chain free fatty acids (FFAs) and stimulates ketogenesis.7 Ketogenesis will only occur if there is also a reduction in plasma insulin levels.8
Starvation. During the starved state (i.e. fasting for longer than 72 hr), a further reduction in insulin and increase in glucagon secretion occurs. Mild sympathetic activation stimulates hormone-sensitive lipoprotein lipase (HS-LPL) increasing the release of FFAs from adipose tissue.
Table 2. Hormonal control and effects on nutrition
Hormone Secretion stimulated by Stimulates Inhibits Insulin Hyperglycaemia Glycogenesis Gluconeogenesis Amino acids Lipogenesis Ketogenesis (e.g. arginine, leucine) Protein synthesis Proteolysis Lipolysis Glucagon Hypoglycaemia Gluconeogenesis Glycogenesis Sympathetic stimulation Ketogenesis Lipogenesis Alanine Glycogenolysis Catecholamines Sympathetic stimulation Glycogenolysis Insulin release Hypoglycaemia Glucagon release Insulin effect Lipolysis
110

Critical Care and Resuscitation 2003; 5: 109-120 M. ATKINSON, ET AL
Table 3. Percentage of substrate used and energy required for the various nutritional states
Optimal nutritional support can only be achieved when the patient is in the convalescent phase of injury, as intravenous nutrition will not reverse the factors causing proteolysis, gluconeogenesis or lipolysis assoc-iated with sepsis or stress.18 Therapy should therefore focus upon decreasing catecholamine secretion by corre-cting hypotension, hypoxia and pain, and decreasing the levels of the catabolic polypeptide mediators by treating sepsis (e.g. antibiotics, drainage of pus, removal of infarcted tissue).
Nutritional CHO Lipid Protein Ket kcals/24 hr state Fed/fasted 45 40 15 2000 Starved 70 5 25 1600 Stress/sepsis 80 20 2500 CHO = carbohydrate, Ket = ketones
Nevertheless, while nutrition may not reverse the catabolic response, it enhances protein synthesis19 and may retard protein catabolism,20 and therefore may reduce the total burden of body protein loss if introduced early in the management of the acutely ill patient.
Much of the excess FFAs are converted by the liver to ketone bodies, which substitute for glucose as energy substrates in brain and other organs.9 Ketosis decreases skeletal muscle protein breakdown and amino acid release by reducing the obligatory demand for glucose from 150 to 50 g/day, reducing protein breakdown from 75 to 20 g/day.10 With chronic starvation, glucagon levels return to their post absorptive levels and catecholamine levels decrease. The decrease in protein catabolism is reflected by a reduction in urinary nitrogen excretion by 75% (i.e. 400 to 100 mmol/24 hr). The basal metabolic rate (BMR) decreases due to a reduction in peripheral conversion of thyroxine (T4) to triiodothyronine (T3).
NUTRITIONAL ASSESSMENT Malnutrition is defined as a pathological state resulting from a relative or absolute deficiency of one or more essential nutrients. History, physical examination and nutritional indices are often used to assess the patients skeletal muscle mass, visceral protein mass, fat stores and immune status, to identify patients who are most likely to benefit from nutritional supplementation and to monitor nutritional requirements. However, the commonly used nutritional indices lack sensitivity and specificity. For example,
NUTRITION DURING SEPSIS During sepsis and injury the nutritional hormones are no longer substrate controlled. Anthropometric measurements. The anthropometric
measurements of arm muscle circumference and triceps skin-fold thickness overestimate by 10 - 40% arm muscle plus bone cross-sectional area and underestimate the fat cross-sectional area.21 They are based on the assumption that bone area can be neglected, arm fat is of a linear thickness and arm muscle is circular. The measurements are also prone to large observer variation errors.22
Stress. To maintain haemodynamic homeostasis during acute injury, an increase in sympathetic tone and catecholamine (i.e. adrenaline and noradrenaline) secret-ion occurs. The catecholamine stimulation of glycogeno-lysis and hormone sensitive lipoprotein lipase (HS-LPL) increases the plasma levels of FFAs, glucose and insulin. The high insulin levels inhibit ketogenesis and the increase in sympathetic tone increases peripheral tissue resistance to insulin. Protein catabolism reaches a maximum of 70 - 150 g/day, 4 - 8 days after injury,11 the magnitude being related to the severity of the injury as well as the patient’s protein intake prior to injury.12 In the uncomplicated postoperative patient, the loss of body protein is due to a reduction in protein synthesis with little change in the breakdown rate of body protein.13
Plasma protein levels (e.g. plasma albumin, prealbumin or transferrin). When using plasma protein levels to assess nutrition, the assumption is made that a decrease in plasma protein concentration is a consequence of decreased hepatic biosynthesis, which in turn is due to a limited supply of nutritional substrate. However, this assumption is often incorrect. Albumin, for example, has a large extravascular pool, and plasma levels are more often influenced by the effects of redistribution to the extravascular compartment with recumbency23 and increase in severity of illness.24-26 Furthermore, reduction in albumin synthesis occurs as an acute-phase response.27,28 Also albumin loss, rather than undernutrition, may decrease plasma albumin levels.29 Patients who have marasmus (i.e. malnutrition with an extreme wasting of fat and muscle due to a reduced intake of carbohydrate, fat and protein) often
Sepsis. In patients who are septic, in addition to the hormonal stress response, polypeptide mediators of tumour necrosis factor (TNF-α)14 and interleukin-115 are liberated, causing functional hepatic abnormalities, an increase in glucose intolerance and an increase in skeletal muscle protein catabolism13,16 (by accelerating ubiquitin-conjugation of skeletal muscle proteins which are then degraded by an ATP dependent proteasome).17
111

M. ATKINSON, ET AL Critical Care and Resuscitation 2003; 5: 109-120
have normal plasma albumin levels30 (due to a decrease in albumin degradation and a transfer of extravascular albumin to the intravascular compartment),27 although in patients with kwashiorkor (i.e. malnutrition due to a reduced intake of protein without a similar reduction in carbohydrate) severe hypoalbuminaemia usually exists with ascites and pitting oedema. As hypoalbuminaemia is not a sensitive or specific marker of malnutrition, plasma albumin levels should not be used as a nutritional marker in humans.31 Plasma transferrin levels have also been shown to be a poor measure of nutritional status.32 Delayed hypersensitivity. While delayed hyper-sensitivity skin testing (to assess the patients immune status) has been used to assess the patients nutritional status, the patient’s immune status is often altered by the underlying disease rather than nutritional status.33 Immu-nity is only impaired slightly in marasmus,34 supporting the concept that immunologic capability has a high biological priority in starvation.35 Skeletal muscle function. Following electrical stimulation of the ulnar nerve, the force of isometric contraction of the adductor pollicis muscle, recovery time and relaxation rate have been used as an assessment of nutrition.36 However, the mechanical characteristics of skeletal muscle are influenced more by the availability of energy stores within the muscle and ability to regenerate them from the available substrate, rather than by loss of muscle mass with malnutrition.37 In practice, when assessing the absence or presence and extent of malnutrition, clinical judgement of the patient’s nutritional status, which takes into consider-ation symptoms of recent weight loss (e.g. > 10% of the usual body weight in less than 6 months),38 reduction in dietary intake, anorexia, vomiting and diarrhoea and signs of weight loss (e.g. muscle wasting of deltoids, temporalis, small muscles of hands, loss of subcutaneous fat over triceps or chest) and nutritional deficiency (e.g. glossitis, dermatitis, stomatitis), have been found to be as reliable as any biochemical test.39,40 NUTRITIONAL REQUIREMENTS CALORIC Energy expenditure, and therefore caloric requirement in the critically ill patient, depends on the type of injury (e.g. trauma, sepsis, burns),41,42 activity of the patient (e.g. energy expenditure increases with spontaneous respiratory activity compared with controlled or assisted breathing),43,44 stage of the illness (e.g. the thermogenic ‘stress’ response falls rapidly after 2 - 5 days)45 and the patients previous nutritional status (e.g. a patient who was previously on a low protein diet
and had a decreased body mass, has a reduced thermogenic response to trauma or sepsis).46 Measurement of energy expenditure Equations. Numerous equations (e.g. Harris-Benedict equations)47 and nomograms48-50 have been used to predict the patients metabolic rate. However, in the malnourished or critically ill patient these equations are often unreliable48,51,52 and usually overestimate the caloric requirement.49,53-55 They have been found to be no more accurate than simpler equations using weight or surface area49,56 (e.g. caloric requirement = weight in kg x 30), or even an empirical clinical assessment ranging from 1500 - 2500 kcal/day (i.e. 6300 - 10,500 kJ/day, or 1 - 1.75 cal/min),54 as very few adult patients lie outside this range.57,58 Indirect calorimetry. To accurately determine the energy expenditure in a critically ill patient, metabolic monitoring systems have been used to calculate caloric requirements by indirect calorimetry from oxygen uptake and carbon dioxide excretion.59 The assumptions are that all the oxygen uptake is used to oxidise degradable fuels and all carbon dioxide thereby evolved is recovered. However, the stability and accuracy of the recordings may be altered by numerous factors. For example, a. any procedure that causes, stimulation, anxiety or
pain (because they result in an increase in energy expenditure of up to 20% - 40%53 due to an increase in catecholamine release lasting for 5 - 20 minutes).53,60,61 To determine baseline recordings, measurements should be performed 30 - 60 minutes after a disruptive influence. To determine the total energy expenditure, measurements over the 24 hr period should be performed.62
b. an alteration in the patient’s ventilation. The body’s carbon dioxide store, which is 800 mmol or 15 - 20 L (with a carbon dioxide production of 9 mmol/min in an adult),63 inhibits a new carbon dioxide ‘stable point’ being reached rapidly after an alteration in ventilation.64 Therefore, measurements should be delayed for 90 minutes following changes to the patient’s ventilation (although it may take up to 120 minutes,65 or even longer in the critically ill patient who has acute or chronic ventilatory failure).66 On the other hand, equilibrium with oxygen stores following a change in FIO2 only requires 15 - 30 minutes.66
c. an acute infusion of sodium bicarbonate, or an acute metabolic acidosis, which artefactually increases the carbon dioxide output.
d. an acute alteration in the administration of thermogenic agents (e.g. intravenous or inhaled sympathomimetic agents).67-69 Alpha and beta
112

Critical Care and Resuscitation 2003; 5: 109-120 M. ATKINSON, ET AL
adrenergic agonists can increase oxygen consumption and carbon dioxide excretion therefore metabolic measurements should be delayed for up to 2 hours after their inhalation or altering their intravenous dose.
e. airway system leaks from pleural drains or loose endotracheal connections, or an acute reduction in cardiac output or an acute pulmonary embolism (e.g. thrombo- fat or air embolism), all of which may artefactually reduce carbon dioxide excretion.53
f. the FIO2 level. Because the accuracy of oxygen consumption measurement in many systems is inversely proportional to the FIO2, errors greater than 6% often occur when an FIO2 of more than 60% is used.53,70,71
There have been many formulae proposed for the calculation of metabolic expenditure from gas-exchange measurements. For clinical purposes, any of the commonly used formulae can be used, as the difference between their values are clinically insignificant,72 and consideration of urinary nitrogen is clinically unimportant.72 One of the commonly used equations is.73,74 EE = (3.796 x V O2 + 1.214 x CO2) x 1.44 & V& Where EE = energy expenditure (kcal/day) O2 = oxygen uptake (mL/min) V&
CO2 = carbon dioxide excretion (mL/min) V& Substrate oxidation. The rates of substrate oxidation in the fasting state may be calculated from oxygen uptake, carbon dioxide output and urinary nitrogen excretion using the equations listed in Table 4.72 Table 4. Rates of oxidation of substrate (g/24 hr) from O2, V CO2 and urinary nitrogen excretion V& &
Substrate rate of oxidation (g/24 hr) CHO = 4.12 x V CO2 - 2.91 x O2 - 2.56 x N & V&
Fat = 1.69 x ( V O2 - CO2) - 1.94 x N & V&Protein = 6.25 x N CHO = carbohydrates, N = 24 hr urinary urea nitrogen (g) excretion However, these calculations do not take into consideration the processes of gluconeogenesis, ketoge-nesis or lipogenesis which occur in the post absorptive, starved or energy excess states, and therefore they do not predict accurately the metabolic fate of carbohy-drate, fat or protein.75,76 The calculated rate of carbo-
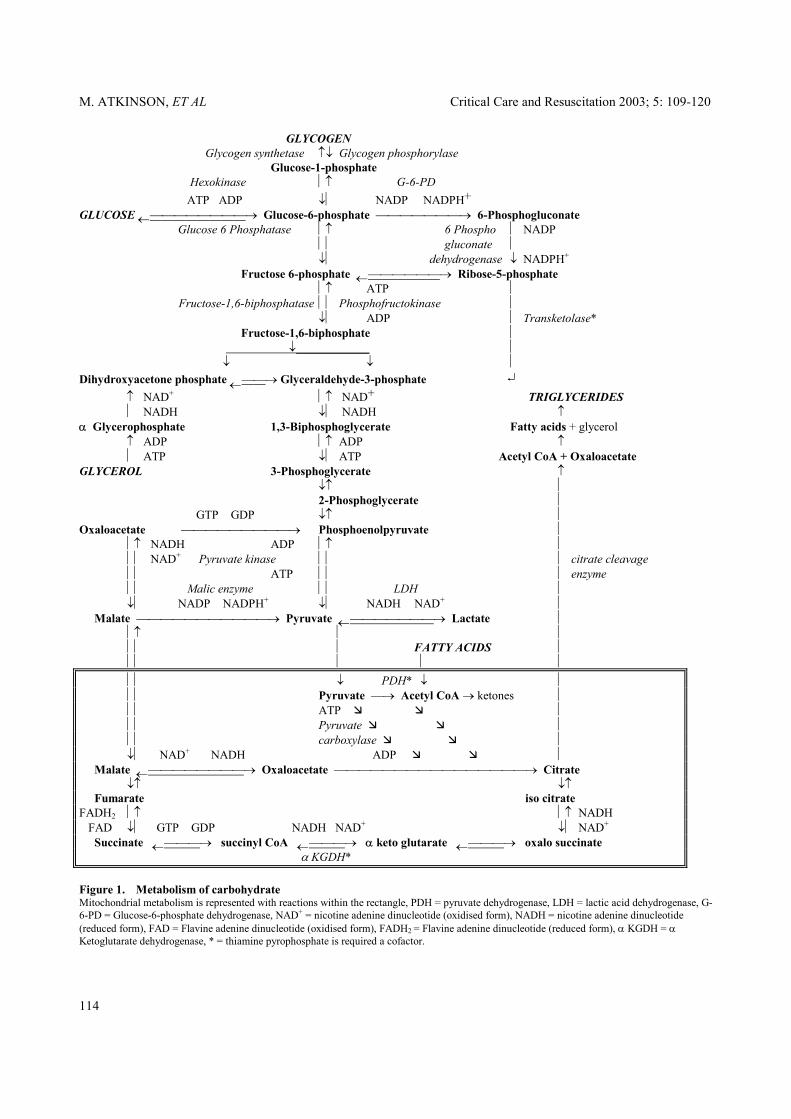
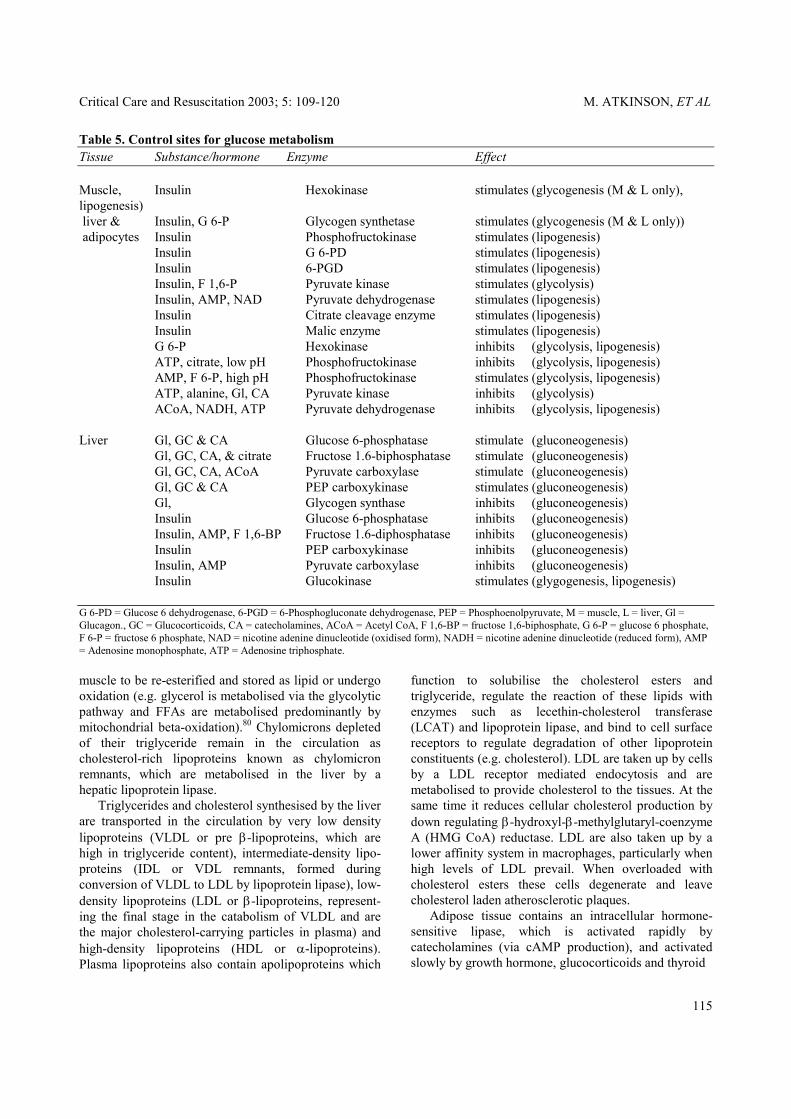
hydrate oxidation represents both true carbohydrate oxidation and the rate of conversion to fat minus the rate of carbohydrate synthesis from gluconeogenesis.77 The calculated rate of fat oxidation represents true fat oxidation minus the rate of fat synthesis from carbohydrate.77 Energy substrates Carbohydrates. Polysaccharides (starches), disacch-arides (lactose, fructose) and monosaccharides (dextr-ose) are the main dietary sources of carbohydrates. Salivary and pancreatic α-amylase initially split starch into oligosaccharides. The intestinal oligosaccharidases cleave these products further to produce disaccharides which are finally hydrolysed by α-limit dextrinase, maltase, lactase and sucrase on the luminal surface of mucosal cells to produce the monosaccharides of glucose, fructose and galactose which are absorbed. All body cells have the capacity to oxidise glucose to yield energy, either partially by glycolysis to lactate (which is then returned to the liver to be recycled as glucose), or completely to carbon dioxide and water by the citric acid cycle (Figure 1). The metabolism of glucose is controlled largely through regulation of the enzyme phosphofructokinase, although other sites of regulation are also present (Table 5). When completely oxidised and measured by in vitro calorimetry, dextrose (D-glucose) provides 4.182 kcal/g (17.5 kJ/g). However, in vivo, anhydrous glucose yields only 3.75 kcal/g (15.7 kJ/g)78 utilising 746 mL of oxygen and producing 741 mL of carbon dioxide (RQ 1.00).77 Lipogenesis of 1 g of glucose produces 0.346 g of fat, which requires 45 mL of oxygen and produces 250 mL of carbon dioxide.77 When the fasting individual is given glucose alone, the lowest level of negative nitrogen balance attained is approximately 1.8 g of nitrogen/m2 per day, or 20 g of protein in a normal adult.79
Lipid. Dietary lipid is acted upon by pancreatic lipase forming fatty acids and monoglycerides which, in the presence of bile salts, form spherical aggregates known as micelles. Micelles liberate fatty acids and monoglycerides at the brush border of the intestinal mucosal cell which enter the cell by passive diffusion. Fatty acids containing less than 10 - 12 carbon atoms pass from the mucosal cell directly into portal blood, where they are transported as free fatty acids bound largely to albumin. Fatty acids containing more than 10 - 12 carbon atoms are re-esterified to triglycerides, and are coated with lipoprotein, cholesterol and phosphor-lipid to form chylomicrons which leave the cell and enter the lymphatic system. The triglyceride component of chylomicrons is cleared from the circulation by an endothelial lipoprotein lipase to form free fatty acids and glycerol, which may enter adipose tissue, liver or
113
M. ATKINSON, ET AL Critical Care and Resuscitation 2003; 5: 109-120
GLYCOGEN Glycogen synthetase ↑↓ Glycogen phosphorylase Glucose-1-phosphate Hexokinase ↑ G-6-PD ATP ADP ↓ NADP NADPH+ GLUCOSE ←→ Glucose-6-phosphate → 6-Phosphogluconate Glucose 6 Phosphatase ↑ 6 Phospho NADP gluconate ↓ dehydrogenase ↓ NADPH+ Fructose 6-phosphate ←→ Ribose-5-phosphate ↑ ATP Fructose-1,6-biphosphatase Phosphofructokinase ↓ ADP Transketolase* Fructose-1,6-biphosphate ↓ ↓ ↓ Dihydroxyacetone phosphate ←→ Glyceraldehyde-3-phosphate ↵ ↑ NAD+ ↑ NAD+ TRIGLYCERIDES NADH ↓ NADH ↑ α Glycerophosphate 1,3-Biphosphoglycerate Fatty acids + glycerol ↑ ADP ↑ ADP ↑ ATP ↓ ATP Acetyl CoA + Oxaloacetate GLYCEROL 3-Phosphoglycerate ↑ ↓↑ 2-Phosphoglycerate GTP GDP ↓↑ Oxaloacetate → Phosphoenolpyruvate ↑ NADH ADP ↑ NAD+ Pyruvate kinase citrate cleavage ATP enzyme Malic enzyme LDH ↓ NADP NADPH+ ↓ NADH NAD+ Malate → Pyruvate ←→ Lactate ↑ FATTY ACIDS ↓ PDH* ↓ Pyruvate → Acetyl CoA → ketones ATP Pyruvate carboxylase ↓ NAD+ NADH ADP Malate ←→ Oxaloacetate → Citrate ↓↑ ↓↑ Fumarate iso citrate FADH2 ↑ ↑ NADH FAD ↓ GTP GDP NADH NAD+ ↓ NAD+ Succinate ←→ succinyl CoA ←→ α keto glutarate ←→ oxalo succinate α KGDH* Figure 1. Metabolism of carbohydrate Mitochondrial metabolism is represented with reactions within the rectangle, PDH = pyruvate dehydrogenase, LDH = lactic acid dehydrogenase, G-6-PD = Glucose-6-phosphate dehydrogenase, NAD+ = nicotine adenine dinucleotide (oxidised form), NADH = nicotine adenine dinucleotide (reduced form), FAD = Flavine adenine dinucleotide (oxidised form), FADH2 = Flavine adenine dinucleotide (reduced form), α KGDH = α Ketoglutarate dehydrogenase, * = thiamine pyrophosphate is required a cofactor.
114
Critical Care and Resuscitation 2003; 5: 109-120 M. ATKINSON, ET AL
Table 5. Control sites for glucose metabolism Tissue Substance/hormone Enzyme Effect Muscle, Insulin Hexokinase stimulates (glycogenesis (M & L only), lipogenesis) liver & Insulin, G 6-P Glycogen synthetase stimulates (glycogenesis (M & L only)) adipocytes Insulin Phosphofructokinase stimulates (lipogenesis) Insulin G 6-PD stimulates (lipogenesis) Insulin 6-PGD stimulates (lipogenesis) Insulin, F 1,6-P Pyruvate kinase stimulates (glycolysis) Insulin, AMP, NAD Pyruvate dehydrogenase stimulates (lipogenesis) Insulin Citrate cleavage enzyme stimulates (lipogenesis) Insulin Malic enzyme stimulates (lipogenesis) G 6-P Hexokinase inhibits (glycolysis, lipogenesis) ATP, citrate, low pH Phosphofructokinase inhibits (glycolysis, lipogenesis) AMP, F 6-P, high pH Phosphofructokinase stimulates (glycolysis, lipogenesis) ATP, alanine, Gl, CA Pyruvate kinase inhibits (glycolysis) ACoA, NADH, ATP Pyruvate dehydrogenase inhibits (glycolysis, lipogenesis) Liver Gl, GC & CA Glucose 6-phosphatase stimulate (gluconeogenesis) Gl, GC, CA, & citrate Fructose 1.6-biphosphatase stimulate (gluconeogenesis) Gl, GC, CA, ACoA Pyruvate carboxylase stimulate (gluconeogenesis) Gl, GC & CA PEP carboxykinase stimulates (gluconeogenesis) Gl, Glycogen synthase inhibits (gluconeogenesis) Insulin Glucose 6-phosphatase inhibits (gluconeogenesis) Insulin, AMP, F 1,6-BP Fructose 1.6-diphosphatase inhibits (gluconeogenesis) Insulin PEP carboxykinase inhibits (gluconeogenesis) Insulin, AMP Pyruvate carboxylase inhibits (gluconeogenesis) Insulin Glucokinase stimulates (glygogenesis, lipogenesis) G 6-PD = Glucose 6 dehydrogenase, 6-PGD = 6-Phosphogluconate dehydrogenase, PEP = Phosphoenolpyruvate, M = muscle, L = liver, Gl = Glucagon., GC = Glucocorticoids, CA = catecholamines, ACoA = Acetyl CoA, F 1,6-BP = fructose 1,6-biphosphate, G 6-P = glucose 6 phosphate, F 6-P = fructose 6 phosphate, NAD = nicotine adenine dinucleotide (oxidised form), NADH = nicotine adenine dinucleotide (reduced form), AMP = Adenosine monophosphate, ATP = Adenosine triphosphate. muscle to be re-esterified and stored as lipid or undergo oxidation (e.g. glycerol is metabolised via the glycolytic pathway and FFAs are metabolised predominantly by mitochondrial beta-oxidation).80 Chylomicrons depleted of their triglyceride remain in the circulation as cholesterol-rich lipoproteins known as chylomicron remnants, which are metabolised in the liver by a hepatic lipoprotein lipase. Triglycerides and cholesterol synthesised by the liver are transported in the circulation by very low density lipoproteins (VLDL or pre β-lipoproteins, which are high in triglyceride content), intermediate-density lipo-proteins (IDL or VDL remnants, formed during conversion of VLDL to LDL by lipoprotein lipase), low-density lipoproteins (LDL or β-lipoproteins, represent-ing the final stage in the catabolism of VLDL and are the major cholesterol-carrying particles in plasma) and high-density lipoproteins (HDL or α-lipoproteins). Plasma lipoproteins also contain apolipoproteins which
function to solubilise the cholesterol esters and triglyceride, regulate the reaction of these lipids with enzymes such as lecethin-cholesterol transferase (LCAT) and lipoprotein lipase, and bind to cell surface receptors to regulate degradation of other lipoprotein constituents (e.g. cholesterol). LDL are taken up by cells by a LDL receptor mediated endocytosis and are metabolised to provide cholesterol to the tissues. At the same time it reduces cellular cholesterol production by down regulating β-hydroxyl-β-methylglutaryl-coenzyme A (HMG CoA) reductase. LDL are also taken up by a lower affinity system in macrophages, particularly when high levels of LDL prevail. When overloaded with cholesterol esters these cells degenerate and leave cholesterol laden atherosclerotic plaques. Adipose tissue contains an intracellular hormone-sensitive lipase, which is activated rapidly by catecholamines (via cAMP production), and activated slowly by growth hormone, glucocorticoids and thyroid
115

M. ATKINSON, ET AL Critical Care and Resuscitation 2003; 5: 109-120
hormone (via synthesis of new protein), to break down stored triglyceride to FFAs and glycerol.80,81 The free fatty acid concentration in plasma normally ranges from 0.4 to 0.8 mmol/L (most of which is bound to albumin) and seldom rise to more than 1 mmol/L. The turnover of the plasma FFAs is extremely rapid (20% - 40% of the FFAs entering plasma per minute undergo oxidation - usually by skeletal or myocardial muscle, re-esterification - usually by liver, or conversion to other FFAs) Amino acids. In an individual ingesting a normal western diet containing approximately 80 g of protein (320 kcal)/day, approximately 20 g/day is required for protein. The remaining undergoes gluconeogenesis with the nitrogen being excreted as urea. If excess protein is ingested it is stored as glycogen or fat. PROTEIN While daily protein requirement during health varies little in the critically ill patient it depends on the type of injury (e.g. trauma, sepsis, burns), stage of the illness and the patients previous nutritional status. Measurement of nitrogen requirements Normally, an effective nitrogen intake is prescribed by estimating the patient’s caloric requirements, and administering an amino acid nitrogen increment so that the calorie:nitrogen (kcal:g) ratio is between 135:182 to 150:183 (i.e. approximately 1 g of protein per kilogram weight).84 The nitrogen requirement has sometimes been performed by measuring the 24 hr urinary urea excretion and administering a ‘nitrogen’ intake of 1.25 x this amount (i.e. the urinary loss is assumed to represent 80% of the total urinary nitrogen loss). However, the accuracy of such an estimation is poor, particularly in critically ill patients.85,86 Furthermore, the daily urea load may not be excreted in patients who have renal failure and other body protein losses (gastrointestinal, urine, body cavity drains) are not accounted for.86,87 Protein substrates Protein digestion begins in the stomach where acid activated pepsinogens form pepsins and cleave some of the protein peptide linkages to form polypeptides. In the small intestine polypeptides are acted upon by the pancreatic proteolytic enzymes of trypsin, chymotrypsin and the aminopeptidases of the brush border of the intestine further hydrolysing polypeptides to form tri- and di-peptides (which are converted to amino acids by intracellular peptidases) as well as free amino acids which enter the portal circulation. Because many of the amino acids released from body protein catabolism are recycled, the normal adult needs an oral intake of only 20 g of protein with high
biological value to meet the daily protein requirements.88 Protein ingested in excess of this is stored or used as energy. In the acutely ill patient, the minimal quantity of protein required is unknown, although it is unlikely to exceed 50 - 60 g/day, in patients who have no external protein loss. During the catabolic phase of disease, skeletal muscle tissue serves as a protein reservoir which is mobilised (due to circulating IL-1, TNF-α, catechol-amines and glucocorticoids)89,90 to meet the specific metabolic needs of the body. Approximately 40% of the amino acids released are glutamine and alanine (from the free glutamate pool and formed from transamination reactions involving branched-chain amino acids and α-ketoglutarate or pyruvate) providing the skeletal muscle with energy, the body with glucose (alanine is converted in the liver to pyruvate and in turn to glucose by gluconeogenesis) and an abundant supply of amino acids to the liver for production of acute phase reactants. Amino acids. Normal adults require twenty L-amino acids for protein synthesis, although only leucine, isoleucine, valine, lysine, threonine, phenylalanine, methionine and tryptophan can not be synthesised and so are essential (Table 6). The minimal daily requirement in a normal adult is 0.25 g/day of tryptophan and approximately 1 g/day for all other essential amino acids, although the safe recommended intake is probably double this.91 The branched-chain amino acids (BCAA) of leucine, isoleucine and valine are unique in that they bypass the liver and are metabolised almost exclusively by the skeletal muscle. Leucine also stimulates skeletal muscle protein synthesis and inhibits muscle proteolysis (even during sepsis).92 The BCAA requirements may be increased by a factor of two (i.e. 2 - 4 g/day of each) during surgical convale-scence93 and in patients who have sepsis,94 trauma95 or acute/chronic liver failure.96,97 During disease, other amino acids are also essential (e.g. histidine, cystine/cysteine, glutamine, arginine and tyrosine). Histidine is essential in infants98 and in patients who have renal failure.99-101 Cysteine is essential in premature infants,102 and in critically ill patients. Glutamine is a precursor for renal ammonia production and a crucial substrate for the rapidly dividing cells of both the gastrointestinal mucosa and the immune system.103-105 It is also required for the production of the major cellular antioxidant glutathione, a requirement which is increased in the critically ill patient.106 Parenteral glutamine also increases protein synthesis and decreases protein breakdown in skeletal muscle,103,107 and preserves gastrointestinal mucosal structure and permeability.108 Arginine is required in sufficient amounts to convert ammonia to urea and is the precursor
116

Critical Care and Resuscitation 2003; 5: 109-120 M. ATKINSON, ET AL
for endothelium derived relaxing factor (i.e., nitric oxide); it may also enhance cell mediated immunity.109
3. Haydock DA, Hill GL. Impaired wound healing in surgical patients with varying degrees of malnutrition. J Parenter Enteral Nutr 1986;10:550-554.
4. Korcok M. Hunger strikers may have died of fat, not protein, loss. JAMA 1981;246:1878-1879. Table 6. Protein L-amino acid requirements in
adults 5. Buzby GP, Mullen JL, Matthews DC, Hobbs CL, Rosato EF. Prognostic nutritional index in gastrointestinal surgery. Am J Surg 1980;139:160-167.
Indispensable Dispensable Essential 6. Cahill GF Jr. Protein and amino acid metabolism in
man. Circ Res 1976;38 (suppl 1):109-111. Valine Alanine 7. McGarry JD, Foster DW. Regulation of hepatic fatty
acid oxidation and ketone body production. Ann Rev Biochem 1980;49:395-420.
Isoleucine Asparagine Leucine Aspartic acid Lysine Glutamic acid 8. Baruh S, Sherman L, Markowitz S. Diabetic
ketoacidosis and coma. Med Clin N Amer 1981;65:117-132.
Methionine Glycine Phenylalanine Proline Threonine Serine 9. Saudek CD, Felig P. The metabolic effects of starvation.
Am J Med 1976;60:117-126. Tryptophan Essential 10. Cahill GF Jr. Starvation in man. N Engl J Med
1970;282:668-675. during disease 11. Cuthbertson DP. The metabolic response to injury and
its nutritional implications: retrospect and prospect. J Parenter Enteral Nutr 1979;3:108-129.
Histidine Arginine Cysteine 12. Lemoyne M, Jeejeebhoy KN. Total parenteral nutrition
in the critically ill patient. Chest 1986;89:568-575. Tyrosine Glutamine 13. Munro HN. Hormones and the metabolic response to
injury. N Engl J Med 1979;300:41-42. 14. Beutler B, Cerami A. Cachectin: more than a tumor
necrosis factor. N Engl J Med 1987;316:379-385. WATER, ELECTROLYTES, VITAMINS, TRACE ELEMENTS AND ESSENTIAL FATTY ACIDS 15. Dinarello CA. Interleukin-1 and the pathogenesis of the
acute-phase response. N Engl J Med 1984;311:1413-1418.
The estimation of water and electrolytes requirements are performed daily using parameters that determine their balance in critically ill patients, including cardiovascular, renal hepatic and plasma biochemical tests. The daily vitamin, trace elements and essential fatty acid requirements are estimated using the recommended daily allowance with an added amount suggested in the acutely ill patient (see part II).
16. Cerra FB, Siegel JH, Coleman B, Border JR, McMenamy RR. Septic autocannabalism: a failure of exogenous nutritional support. Ann Surg 1980;192:570-580.
17. Mitch WE, Goldberg AL. Mechanisms of muscle wasting. The role of the ubiquitin-proteasome pathway. N Engl J Med 1996;335:1897-1905.
18. Long CL, Kinney JM, Geiger JW. Nonsuppressability of gluconeogenesis by glucose in septic patients. Metabolism 1976;25:193-200.
NUTRITIONAL DELIVERY Nutritional support in the critically ill patient may be intravenous or enteral or both. However, while the enteral route is commonly held as the method of choice, in practice (due to gastrointestinal dysmotility with gastroparesis or diarrhoea) it is often suboptimal110 and often fails to deliver the desired daily requirements.111
19. Neuhauser M, Bergstrom J, Chao L, et al. Urinary excretion of 3-methylhistidine as an index of muscle protein catabolism in postoperative trauma: the effect of parenteral nutrition. Metabolism 1980;29:1206-1213.
20. Leverve X, Guignier M, Carpentier F, Serre JC, Caravel JP. Effect of parenteral nutrition on muscle amino acid output and 3-methylhistidine excretion in septic patients. Metabolism 1984;33:471-477.
21. Forbes GB, Brown MR, Griffiths HJL. Arm muscle plus bone area: anthropometry and CAT scan compared. Am J Clin Nutr 1988;47:929-931.
Received: 30 April 2003 Accepted: 30 May 2003
22. Heymsfield SB, Casper K. Anthropometric assessment of the adult hospitalized patient. J Parenter Enteral Nutr 1987;11:36S-41S.
REFERENCES 1. Benedict FG. A study of prolonged fasting. Washington,
D.C., Carnegie Institute, 1915 (Publication No. 203). 23. Courtney ME, Greene HL, Folk CC, Helinek GL,
Dmitruk A. Rapidly declining serum albumin values in newly hospitalized patients: prevalence, severity, and
2. Arora NS, Rochester DF. Respiratory muscle strength and maximal voluntary ventilation in undernourished patients. Am Rev Resp Dis 1982;126:5-8.
117
M. ATKINSON, ET AL Critical Care and Resuscitation 2003; 5: 109-120
43. Prakash O, Meij SH. Oxygen consumption and blood gas exchange during controlled and intermittent mandatory ventilation after cardiac surgery. Crit Care Med 1985;13:556-559.
contributory factors. J Parenter Enteral Nutr 1982;6:143-145.
24. Fleck A. Raines G, Hawker F, et al. Increased vascular permeability: a major cause of hypoalbuminaemia in disease and injury. Lancet 1985;i:781-784. 44. Kanak R, Fahey PJ, Vanderwarf C. Oxygen cost of
breathing: changes dependent upon mode of mechanical ventilation. Chest 1985;87:126-127.
25. O'Keefe SJD, Dicker J. Is the plasma albumin concentration useful in the assessment of nutritional status of hospital patients? Eur J Clin Nutr 1988;42:41-45.
45. Quebbeman EJ, Ausman RK, Schneider TC. A re-evaluation of energy expenditure during parenteral nutrition. Ann Surg 1982;195:282-286. 26. Boosalis MG, Ott L, Levine AS, et al. Relationship of
visceral proteins to nutritional status in chronic and acute stress. Crit Care Med 1989;17:741-747.
46. Munro HN. General aspects of the regulation of protein metabolism by diet and hormones. In: Mamalian protein metabolism (vol 1), Munro HN, Allison JB, eds. New York: Academic press, 1964;381-481.
27. Klein S. The myth of serum albumin as a measure of nutritional status. Gastroenterology 1990;99:1845-1846.
47. Harris JA, Benedict FG. A biometric study of basal metabolism in man. Carnegie Institute of Washington, Washington, D.C. 1919; Publication no 279.
28. Soeters PB, von Meyenfeldt MF, Meijerink WJHJ, Fredrix EWHM, Wouters EFM, Schols AMWJ. Serum albumin and mortality. Lancet 1990;335:348.
48. Long CL, Schaffel N, Geiger JW, Schiller WR, Blakemore WS. Metabolic response to injury and illness: estimation of energy and protein needs from indirect caloimetry and nitrogen balance. J Parenter Enteral Nutr 1979;3:452-456.
29. Starker PM, Gump FE, Askanazi J, Elwyn DH, Kinney JM. Serum albumin levels as an index of nutritional support. Surgery 1982;91:194-199.
30. McLaren DS. A fresh look at protein-energy malnutrition in the hospitalized patient. Nutrition 1988;4:1-6. 49. Quebbeman EJ, Ausman RK. Estimating energy
requirements in patients receiving parenteral nutrition. Arch Surg 1982;117:1281-1284.
31. Jeejeebhoy KN. Nutrition and serum albumin levels. Nutrition 1994;10:353.
50. Rainey-Macdonald CG, Holliday RL, Wells GA. Nomograms for predicting resting energy expenditure of hospitalised patients. J Parenter Enteral Nutr 1982;6:59-60.
32. Roza AM, Tuitt D, Shizgal HM. Transferrin - a poor measure of nutritional status. J Parenter Enteral Nutr 1984;8:523-528.
33. Twomey P, Ziegler D, Rombeau J. Utility of skin testing in nutritional assessment: a critical review. J Parenter Enteral Nutr 1982;6:50-58.
51. Weissman C, Kemper M, Damask MC, Askanazi J, Hyman AI, Kinney JM. Metabolic rate in the post operative critical care patient. Crit Care Med 1985;13:280.
34. Bistran BR, Sherman M, Blackburn GL, et al. Cellular imunity in adult marasmus. Arch Intern Med 1977;137:1408-1411. 52. Roza AM, Shizgal HM. The Harris Benedict equation
reevaluated: resting energy requirements and the body cell mass. Am J Clin Nutr 1984;40:168-182.
35. Moore FD. Delayed scientific hypersensitivity. J Parenter Enteral Nutr 1982;6:1-2.
53. Swinamer DL, Phang PT, Jones RL, Grace M, King EG. Twenty-four hour energy expenditure in critically ill patients. Crit Care Med 1987;15:637-643.
36. Pichard C, Jeejeebhoy KN. Muscle dysfunction in malnourished patients. QJM 1988;69:1021-1045.
37. Shizgal HM, Vasilevsky CA, Gardiner PF, Wang W, Tuitt DAQ, Brabant GV. Nutritional assessment and skeletal muscle function. Am J Clin Nutr 1986;44:761-771.
54. Mann S, Westenskow DR, Houtchens BA. Measured and predicted caloric expenditure in the acutely ill. Crit Care Med 1985;13:173-177.
55. Weissman C, Kemper M, Askanazi J, Hyman AI, Kinney JM. Resting metabolic rate of the critically ill patient: measured versus predicted. Anesthesiology 1986;64:673-679.
38. Sitzmann JV, Pitt HA, and the Patient Care Committee of the American Gastroenterological Association. Statement on guidelines for total parenteral nutrition. Dig Dis Sci 1989;34:489-496.
56. Pellett PL. Food and energy requirements in humans. Am J Clin Nutr 1990;51:711-722.
39. Baker JP, Detsky AS, Wesson DE, et al. Nutritional assessment: a comparison of clinical judgement and objective measurements. N Engl J Med 1982;306:969-972.
57. Macfie J. Energy requirements of surgical patients requiring intravenous nutrition. Ann R Coll Surg Eng 1984;66:39-42. 40. Jeejeebhoy KN, Detsky AS, Baker JP. Assessment of
nutritional status. J Parenter Enteral Nutr 1990;14 (suppl):193S-196S.
58. Soop M, Forsberg E, Thorne A, Alvestrand A. Energy expenditure in postoperative multiple organ failure with acute renal failure. Clin Nephrol 1989;31:139-145. 41. Kinney JM. The application of indirect calorimetry to
clinical studies. In: Assessment of energy metabolism in health and disease. Ross Laboratories Publications, Columbus, Ohio, 1980, pp42-48.
59. van Lanschot JJB, Feenstra BWA, Vermeij CG, Bruining HA. Accuracy of intermittent metabolic gas exchange recordings extrapolated for diurnal variation. Crit Care Med 1988;16:737-742. 42. Jequier E. Measurment of energy expenditure in clinical
nutritional assessment. J Parenter Enteral Nutr 1987;11:86S-89S.
118
Critical Care and Resuscitation 2003; 5: 109-120 M. ATKINSON, ET AL 60. Damask MC, Askanazi J, Weissman C, Elwyn DH,
Kinney JM. Artifacts in measurement of resting energy expenditure. Crit Care Med 1983;11:750-752.
61. Weissman C, Kemper M, Damask MC, Askanazi J, Hyman AI, Kinney JM. Effect of routine intensive care interactions on metabolic rate. Chest 1984;86:815-818.
62. Doisey EA. Micronutrient controls on biosynthesis of clotting proteins and cholesterol. In Hemphill DD (ed) Trace Substances in Environmental Health VI, Columbia: University of Missouri. 1978:p193.
63. Ferrannini E, The theoretical basis of indirect calorimetry: a review. Metabolism 1988;37:287-301.
64. Henneberg S, Soderberg D, Groth T, Stjernstrom H, Wiklund L. Carbon dioxide production during mechanical ventilation. Crit Care Med 1987;15:8-13.
65. Henneberg S, Soderberg D, Groth T, Stjernstrom H, Wiklund L. Carbon dioxide production during mechanical ventilation. Crit Care Med 1987;15:8-13.
66. Brandi LS, Bertolini R, Santini L, Cavani S. Effects of ventilator resetting on indirect calorimetry measurement in the critically ill surgical patient. Crit Care Med 1999;27:531-539.
67. Mansell PI, Fellows IW, Birmingham AT, Macdonald IA. Metabolic and cardiovascular effects of infusions of low doses of isoprenaline in man. Clin Sci 1988;75:285-291.
68. Green CJ, Frazer RS, Underhill S, Maycock P, Fairhurst JA, Campbell IT. Metabolic effects of dobutamine in normal man. Clin Sci 1992;82:77-83.
69. Tattersfield AE, Wilding P. Agonists and ventilation. Thorax 1993;48:877-878.
70. Eccles RC, Swinamer DL, Jones RL, King EG. Validation of a compact system for measuring gas exchange. Crit Care Med 1986;14:807-811.
71. Westenskow DR, Cutler CA, Wallace WD. Instrumentation for monitoring gas exchange and metabolic rate in critically ill patients. Crit Care Med 1984;12:183-187.
72. Westenskow DR, Schipke CA, Raymond JL, et al. Calculation of metabolic expenditure and substrate utilization from gas exchange measurements. J Parenter Enteral Nutr 1988;12:20-24.
73. de V Weir JB. New methods for calculating the metabolic rate with special reference to protein metabolism. J Physio 1949;109:1-9.
74. Kleiber M. Energy. In: The fire of life. New York: John Wiley and Sons Inc, 1961;105-128.
75. Elia M, Livesey G. Theory and validity of indirect calorimetry during net lipid synthesis. Am J Clin Nutr 1988;47:591-607.
76. Livesey G, Elia M. Estimation of energy expenditure, net carbohydrate utilization, and net fat oxidation and synthesis by indirect calorimetry: evaluation of errors with special reference to the detailed composition of fuels. Am J Clin Nutr 1988;47:608-628.
77. Frayn KN. Calculation of substrate oxidation rates in vivo from gaseous exchange. J Appl Physiol 1983;55:628-634.
78. Kopple JD, Blumenkrantz MJ. Total parenteral nutrition and parenteral fluid therapy. In: Clinical disorders of
fluid and electrolyte metabolism. Maxwell MH, Kleeman CR, eds. New York. McGraw-Hill Book Co, 1980;413-458.
79. Moore FD. Energy and the maintenance of body cell mass. J Parenter Enteral Nutr 1980;4:228-260.
80. Eckel RH. Lipoprotein lipase. N Engl J Med 1989;320:1060-1068.
81. Stout RW. The physiology of triglyceride metabolism. Br J Hosp Med 1975;14:309-316.
82. Smith RC, Burkinshaw L, Hill GL. Optimal energy and nitrogen intake for gastroenterological patients requiring intravenous nutrition. Gastroenterology. 1982;82:445-452.
83. Rutten P, Blackburn GL, Flatt JP, Hallowell E, Cochran D. Determination of optimal hyperalimentation infusion rate. J Surg Res 1975;18:477-483.
84. Pellett PL. Protein requirements in humans. Am J Clin Nutr 1990;51:723-737.
85. Loder PB, Kee AJ, Horsburgh R, Jones M, Smith RC. Validity of urinary urea nitrogen as a measure of total urinary nitrogen in adult patients requiring parenteral nutrition. Crit Care Med 1989;17:309-312.
86. Konstantinides FN, Konstantinides NN, Li JC, Myaya ME, Cerra FB. Urinary urea nitrogen: too insensitive for calculating nitrogen balance studies in surgical clinical nutrition. J Parenter Enteral Nutr 1991;15:189-193.
87. Berger R, Adams L. Nutritional support in the critical care setting (Part 1). Chest 1989;96:139-150.
88. Giovannetti S, Maggiore Q. A low-nitrogen diet with proteins of high biological value for severe chronic uraemia. Lancet 1964;i:1000-1003.
89. Hasselgren P-O, Pedersen P, Sax HC, Warner BW, Fischer JE. Current concepts of protein turnover and amino acid transport in liver and skeletal muscle during sepsis. Arch Surg 1988;123:992-999.
90. Clowes GHA Jr, George BC, Villee CA, Saravis CA. Muscle proteolysis in sepsis or trauma. N Engl J Med 1983;309:494.
91. Rose WC, Wixom RL, Lockhart HB, Lambert GF. Amino acid requirements of man; valine requirement; summary and final observations. J Biol Chem 1955;217:987-995.
92. Lindberg BO, Clowes GHA Jr. The effects of hyperalimentation and infused lucine on the amino acid metabolism in sepsis: an experimental study in vivo. Surgery 1981;90:278-290.
93. Freund HR, Yoshimura N, Lunetta L, Fischer JE. The role of the branched chain amino acids in decreasing muscle catabolism in vivo. Surgery 1978;83:611-618.
94. Freund HR, Ryan JA Jr, Fischer JE. Amino acid derangements in patients with sepsis. Treatment with branched chain amino acid rich solutions. Ann Surg 1978;188:423-439.
95. Askanazi J, Carpentier YA, Michelsen CB, et al. Muscle and plasma amino acids following injury. Ann Surg 1980;192:78-85.
96. Eriksson S, Hagenfeldt L, Wahren J. A comparison of the effects of intravenous infusion of individual branched chain amino acids on blood amino acid levels in man. Clin Sci 1981;60:95-100.
119

M. ATKINSON, ET AL Critical Care and Resuscitation 2003; 5: 109-120
106. Wernerman J, Luo JL, Hammarqvist F. Glutathione status in critically-ill patients: possibility of modulation by antioxidants. Proc Nutr Soc 1999;58:677-680.
97. Fischer JE. Amino acids in hepatic failure. Dig Dis Sci 1982;27:97-99.
98. Holt LE Jr, Snyderman SE. The amino acid requirements of infants. JAMA 1961;175:100-103. 107. Hammarqvist F, Wernerman J, Ali R, von der Decken A,
Vinnars E. Addition of glutamine to total parenteral nutrition after elective abdominal surgery spares free glutamine in muscle, counteracts the fall in muscle protein synthesis, and improves nitrogen balance. Ann Surg 1989;209:455-461.
99. Wretlind A. Complete intravenous nutrition. Theoretical and experimental background. Nutr Metabol 1972;14:1-57.
100. Bergstrom J, Bucht H, Furst P, et al. Intravenous nutrition with amino acid solutions in patients with chronic uraemia. Acta Med Scand 1972;191:359-367. 108. van der Hulst RRWJ, van Kreel BK, von Meyenfeldt
MF, et al. Glutamine and the preservation of gut integrity. Lancet 1993;334:1363-1365.
101. Kopple JD, Swindseid ME. Evidence that histidine is an essential amino acid in normal and chronically uraemic man. J Clin Invest 1975;55:881-891. 109. Barbul A. Arginine and immune function. Nutrition
1990;6:53-58. 102. Sturman JA, Gaull G, Raiha NRC. Absence of cystathionase in human fetal liver: is cysteine essential? Science 1970;169:74-76.
110. De Beaux I, Chapman M, Fraser R, et al. Enteral nutrition in the critically ill: a prospective survey in an Australian intensive care unit. Anaesth Intensive Care 2001;29:619-622.
103. Smith RJ. Glutamine metabolism and its physiologic importance. J Parenter Enteral Nutr 1990;14(suppl):40S-44S. 111. Heyland D, Cook DJ, Winder B, Brylowski L, Van
deMark H, Guyatt G.Enteral nutrition in the critically ill patient: a prospective survey. Crit Care Med 1995;23:1055-1060.
104. Bulus N, Cersosimo E, Ghishan F, Abumrad NN. Physiologic importance of glutamine. Metabolism 1989;38(suppl 1):1-5.
105. Editorial. Nutrition and the metabolic response to injury. Lancet 1989;i:995-997.
120


![Renal Failure Critically Ill[1]](https://img.pdfslide.net/doc/110x75/577d26df1a28ab4e1ea26f52/renal-failure-critically-ill1.jpg)