Embed Size (px)
Citation preview

Nutrition of pigs kept under low
and high sanitary conditions
Effects on amino acid and energy
metabolism and damaging behaviour
Yvonne van der Meer
Nutrition of pigs kept under low and high
sanitary conditions
Effects on amino acid and energy metabolism and
damaging behaviour
Yvonne van der Meer
Thesis committee
Promotor
Prof Dr W J J Gerrits
Personal chair at the Animal Nutrition Group
Wageningen University amp Research
Co-promotors
Dr A J M Jansman
Senior researcher Animal Nutrition
Wageningen University amp Research
Dr A Lammers
Researcher Adaptation Physiology Group
Wageningen University amp Research
Other members
Prof Dr J Keijer Wageningen University amp Research
Dr E Labussiegravere INRA Rennes France
Prof Dr CM Nyachoti University of Manitoba Canada
Prof Dr SA Edwards University of Newcastle United Kingdom
This research was conducted under the auspices of the Graduate School of Wageningen
Institute of Animal Science (WIAS)
Nutrition of pigs kept under low and high
sanitary conditions
Effects on amino acid and energy metabolism and
damaging behaviour
Yvonne van der Meer
Thesis
submitted in fulfilment of the requirements for the degree of doctor
at Wageningen University
by the authority of the Rector Magnificus
Prof Dr A P J Mol
in the presence of the
Thesis Committee appointed by the Academic Board
to be defended in public
on Friday 7 July 2017
at 4 pm in the Aula
Yvonne van der Meer
Nutrition of pigs kept under low and high sanitary conditions
Effects on amino acid and energy metabolism and damaging behaviour
182 pages
PhD thesis Wageningen University Wageningen the Netherlands (2017)
With references with summary in English
ISBN 978-94-6343-197-2
DOI httpdxdoiorg1018174413888
Table of contents
Chapter 1 General introduction 9 Chapter 2 Performance of pigs kept under different sanitary
conditions affected by protein intake and amino acid supplementation
25
Chapter 3 A link between damaging behaviour in pigs sanitary conditions and dietary protein and amino acid supply
57
Chapter 4 Low sanitary conditions increase maintenance energy expenditure and decrease incremental protein efficiency in growing pigs
85
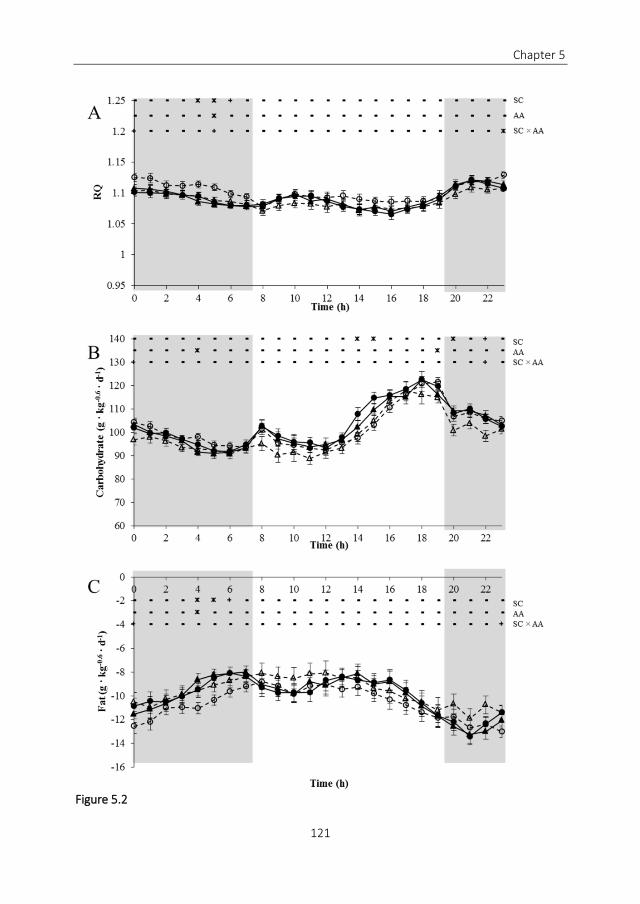
Chapter 5 Diurnal patterns of heat production and oxidation of carbohydrate and fat in pigs kept under different sanitary conditions
111
Chapter 6 General discussion 131 List of abbreviations 165 Summary 167 Acknowledgements 171 About the author
Curriculum vitae List of publications Training and supervision plan
175
Colophon 182
Chapter 1
General introduction
Chapter 1
10
DIETARY REQUIREMENTS OF GROWING PIGS
Feed costs are a large proportion of the total costs for pig production It is therefore of
economic importance to match the dietary nutrient supply to the nutrient requirements of
a pig as closely as possible Recommendations for nutrient requirements of a pig are
presented using several nutrient and energy evaluation systems (ARC 1981 Whittemore et
al 2003 Santioga Rostagno et al 2011 NRC 2012 CVB 2016) Mostly a concept is used
that splits requirements for growing pigs in a part for maintenance and production (growth)
purposes The definition of maintenance is the level of feeding at which the requirements
for nutrients are just met to ensure the continuity of vital processes so that there is no net
gain or loss of nutrients in tissue and animal products (ARC 1981) Requirements for
maintenance and growth are both measured under experimental conditions
Protein requirements of growing pigs In practice the dietary protein level of growing pigs
typically decreases during the life of a pig when phase feeding is used This reduction in
dietary protein level follows the efficiency of a pig to use dietary protein for depositing
protein tissue in the body In Figure 11 is indicated how efficient the dietary protein is used
by the pig to deposit protein during its life This 3-dimensional representation by van
Milgen and Noblet (2003) illustrates that the efficiency of a growing pigs reduces when it
becomes more heavyaged and is also depending on the intake of metabolizable energy
(ME)
Figure 11 The response of protein deposition as a function of ME intake and body weight (BW) The connected
points indicate the feed intake capacity (ad libitum intake) of a Large white barrow and corresponding protein
deposition Mem = ME intake for maintenance Source van Milgen and Noblet (2003)
Chapter 1
11
Requirement values for dietary protein do not exist in the evaluation systems Instead
recommendations for dietary amino acid (AA) intake are published (NRC 2012 CVB 2016)
These AA requirements are determined in pig experiments that use a titration set up or are
calculated from experiments with a factorial approach In titration studies typically the
response in performance of pigs to a stepwise increasing or decreasing dietary dose of AA
is evaluated using different treatment groups or within the same individual pig in time For
studies with a factorial approach nutrient requirements for maintenance and protein
deposition in the body can be calculated by using data obtained in pig experiments
The ileal digestibility of AA is measured in AA requirement studies to evaluate the bio-
availability of AA for the pig There are different expressions for Ileal digestibility namely
apparent true and standardized ileal digestibility (AID TID and SID respectively) The
expression used is depending on which proportion of AA outflow is used in the digestibility
calculation (Stein et al 2007) The AID is calculated by subtracting the AA inflow by the
total AA outflow including endogenous losses The endogenous losses can be split into
basal (not influenced by feed ingredient composition) and specific (influenced by ingredient
composition) endogenous losses Correcting for total endogenous losses results in the TID
and correcting digestibility for basal endogenous losses only results in the SID (Stein et al
2007)
The AA and nitrogen (N) requirements for maintenance were described by Moughan (2003)
as requirements for turnover of body protein skin and hair AA losses basal endogenous
intestinal AA losses synthesis of non-protein N-containing compounds and urinary AA
losses The first three processes are considered to be quantitatively important for
requirements for maintenance The AA composition of the whole body protein can be used
as the basis for an ideal AA profile for protein deposition as was suggested by Whittemore
(1983) Several pig growth models have been developed which simulate the AA uptake
metabolism and nutrient partitioning for growing pigs (Whittemore and Fawcett 1974
Moughan 1981 Whittemore 1983) To estimate the biological maximal rate of body
protein retention (Pdmax) net rates of body protein retention are determined under
optimal dietary and environmental conditions (Moughan 2003) Under practical farming
conditions which can be less optimal this Pdmax is not that commonly reached due to
factors such as subclinical disease thermal environment and social conditions (Burrin et
al 2001)
Energy requirements of growing pigs The energy that is ingested by an animal as feed is
deposited as fat or protein excreted in faeces and urine or dissipated as heat The
dissipation of heat by a pig might represent more than 50 of the ingested energy (van
Milgen and Noblet 2000) which can be seen as the major part of inefficiency It is
therefore of major importance to better understand and quantify the energy requirements
of pigs Quantification of heat production helps to better understand the daily energy
Chapter 1
12
balance of an animal The dissipation of heat or the heat production of a pig can be
measured by indirect calorimetry When nutrients are oxidized O2 is consumed and CO2
produced Heat production can be calculated from the combination of O2 consumption CO2
production (and urinary N and CH4 production) according to Brouwer (1965) These
components can be measured by placing the animals in respiration chambers were the gas
exchanges can be measured and used for calculation of heat production The total heat
production of an animal can be split in heat production due to physical activity thermic
effect of feeding (TEF) and fasting heat production
production (Figure 12) The TEF can be split in a short and a long TEF The short TEF is the
heat production associated with a meal related to nutrient digestion and absorption (van
Milgen et al 1998 van Milgen and Noblet 2000) and the long TEF is the heat production
due to ldquolong-termrdquo metabolic processes including protein and lipid synthesis (van Milgen
et al 1998 van Milgen and Noblet 2000) The fasting heat production (FHP) also called
lsquobasalrsquo metabolism is defined as the rate of energy expenditure of a non-reproductive
healthy fasting and a resting adult in thermo-neutral zone in an inactive phase of the day
(McNab 1997 Labussiegravere et al 2008) The FHP is used as a proxy for energy requirement
for maintenance Overall it remains difficult to measure FHP in growing animals
Figure 12 Heat production of a group of restricted fed growing pigs partitioned in different components of heat Feed was offered in two different meals at 730 and 1530 TEF = thermic effect of feeding Based on own data
There is already a lot of knowledge about the requirements for AA and energy in growing
pigs This information is based on pig experiments were pigs are kept under experimental
conditions for the mentioned measurements which means a clean environment low
animal density and high attention of caretakers These experimental conditions can
therefore be considered as optimal conditions for a pig There is not much known
however about nutrient requirements of pigs kept in suboptimal conditions In practice
0
500
1000
1500
2000
2500
20
0
40
0
60
0
08
00
10
00
12
00
14
00
16
00
18
00
20
00
22
00
He
at p
rod
uct
ion
(kJ
B
W -
06
d
-1)
Time (h)
physical activity
short term TEF
long term TEF
fasting heat production
Chapter 1
13
the environmental and management conditions are not always optimal There is a large
variation in pig performance on growing-finishing pig farms (Figure 13) The range in
average daily gain (ADG) of 654 growing-finishing pig farms in the Netherlands was 630
until 1050 g ∙ pig-1 ∙ day-1 A part of this variation might be affected by the health status
conditions (Textbox 11) of the farm (van der Peet-Schwering and Jansman 2007 Pastorelli
et al 2012a) It is therefore of major importance to determine the effect of sub-optimal
conditions on AA and energy requirements in growing pigs
IMMUNE SYSTEM STIMULATION AND THE EFFECT ON NUTRIENT
REQUIREMENTS
Pigs housed in sub-optimal conditions have an increased frequency of exposure to antigens
resulting in a stimulation of their immune system Immune system stimulation (ISS) in
general leads to a series of responses in the body such as production of cytokines acute
phase proteins (APP) blood cells fever increased muscle protein catabolism alterations in
sleep patterns and reduction in feed intake (Heegaard et al 2011)
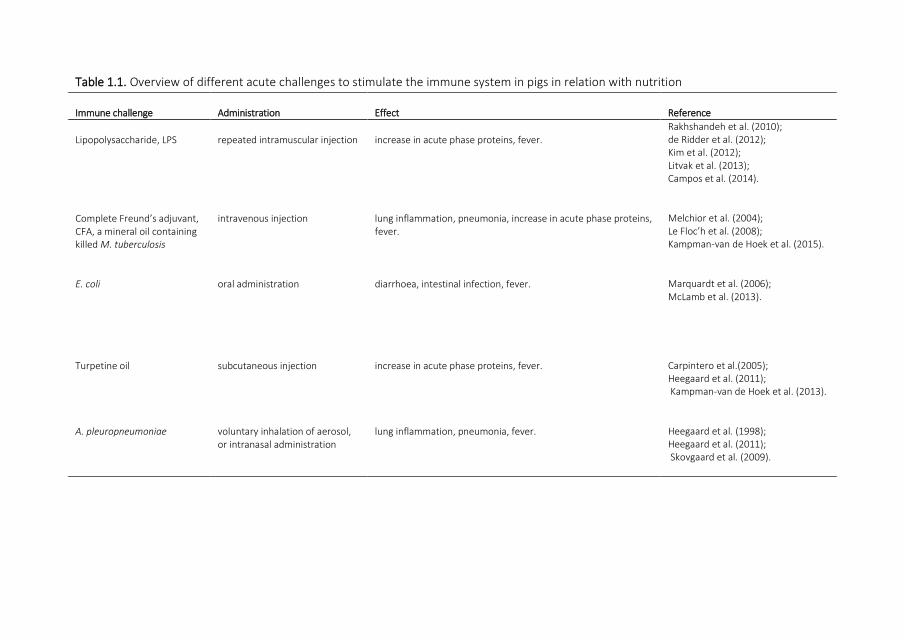
Immune system stimulation by challenge studies Several challenge studies have been
performed to evaluate the effects of clinical immune system stimulation on nutrient
metabolism An overview of several acute challenge studies in pigs in this context is shown
in Table 11 These acute challenge models are often used to stimulate the immune system
or to mimic an infection in a specific part of the body A model using E coli results for
instance in intestinal inflammation whereas a challenge with Complete Freundrsquos Adjuvant
is leading to chronic lung inflammation As a consequence these ISS models have very
different effects in the animal and the challenge should therefore be chosen carefully
based on the objective of the study
Reduction in feed intake Reasons for a reduction in feed intake during ISS are not
completely understood Some studies describe an effect of cytokines (produced as a
consequence of immune stimulation) on the nervous system causing a reducing effect on
feed intake (Johnson 1997 Langhans 2000) Langhans (2000) reported that anorexia and
consequent behavioural changes during infections have several beneficial short term
effects for the mammal host Suppression of hunger results in saved energy and reduced
heat loss as the need for searching food is reduced In addition lower nutrient intake leads
to less nutrients available for the growth of pathogens involved in clinical or subclinical
disease Although reduced feed intake in response to ISS seems beneficial for an animal in
the short term chronic anorexia can delay recovery and inhibits host defence (Langhans
2000) Sandberg et al (2006) described that the origin and level of infection affect the rate
and duration of the reduced feed intake The length of the recovery phase after infection
Chapter 1
14
Figure 13 The average daily gain (ADG) of 654 growing-finishing pigs farms in The Netherlands from July 2015-June 2016 having pigs in a weight range of 25 ndash 119 kg Each grey bar represents 20 of the farms and the bars are categorised at ADG level The line bars represent the minima and maxima for each category Whit permission of Agrovision (2016)
can be influenced by diet composition (Sandberg et al 2006) Causal relationships between
the composition of the diet and the rate of feed intake recovery after ISS are however not
clearly described
Immune stimulation and AA requirements Studies carried out over the past years in pigs
already showed that the requirement of tryptophan (Trp) (Melchior et al 2004 Le Flocrsquoh
et al 2008 Le Floch et al 2012) methionine (Met) + cysteine (Rakhshandeh et al 2010)
and threonine (Thr) (Li et al 2007 Ren et al 2014) were increased in case of ISS by acute
challenge models (Table 11) Increased muscle protein metabolism and increased
production of several immune related metabolites such as APP (Murata et al 2004
Heegaard et al 2011) during ISS result in a redirection of protein or AA from development
and tissue growth to immune related tissues in the body (Le Flocrsquoh et al 2009) thereby
negatively influencing pig performance (Klasing and Johnstone 1991 Pastorelli et al
2012a) Besides the costs of AA as substrate for several immune related proteins in the pig
associated costs such as increased cell turnover for tissue repair and influence on
metabolism due to effects of ISS on hormonal regulations might be even higher in case of
ISS Amino acids can also have a modulating effect on the immune system Arginine for
example was described in a study of Bruins et al (2002) to upregulate the immune system
while catabolism of glutamine seems to provide precursors for DNA and RNA synthesis of
immune cells (Le Floch et al 2004) These interactions between AA (metabolites) and the
immune system are hitherto not fully understood Although involvement of particular AA in
the immune system is proven many of these studies do not allow a conclusion whether or
500
600
700
800
900
1000
1100
0-20 20-40 40-60 60-80 80-100
AD
G (g
∙p
ig -1
∙ day
-1)
Percentage of pig farms
Chapter 1
15
not supplying additional quantities of the AA concerned is actually beneficial for the animal
The former hampers practical application of this research
TEXTBOX 11 DEFENITIONS HEALTH STATUS AND SANITARY
CONDITIONS
To characterize the health of an animal two definitions are commonly used The first
one ldquoThe absence of disease determined by clinical examinations combined with
various diagnostic testsrdquo (Petersen et al 2004 CVB 2016) The second one is more
precise and is used by the World Health Organisation ldquoA state of complete physical
mental and social well-being and not merely the absence of disease or infirmityrdquo (ARC
1981 Santioga Rostagno et al 2011 WHO 2017)
Measurement of immune system activity alone is therefore not sufficient to evaluate
animal health Behavioural measurements to judge the animals mental and social well-
being (Ullman-Cullere and Charmaine 1999) should be included as well
The definition health status is commonly used to characterize a herd of animals Health
status refers to the presence or the absence of infectious pathogens regardless
whether animals are clinically healthy or not Hence a low health status herd can be
clinically healthy and productive To avoid this apparent contradiction the term
sanitary conditions is used throughout this thesis instead of health status The term
sanitary conditions is chosen to cover a combination of factors affecting health of the
pigs The word sanitary directly links to hygiene level but can also cover other factors
affecting health such as application of vaccinations medication management
housing and animal density
Table 11 Overview of different acute challenges to stimulate the immune system in pigs in relation with nutrition
Immune challenge Administration Effect Reference
Lipopolysaccharide LPS repeated intramuscular injection increase in acute phase proteins fever Rakhshandeh et al (2010) de Ridder et al (2012) Kim et al (2012) Litvak et al (2013) Campos et al (2014)
Complete Freundrsquos adjuvant CFA a mineral oil containing killed M tuberculosis
intravenous injection lung inflammation pneumonia increase in acute phase proteins fever
Melchior et al (2004) Le Flocrsquoh et al (2008) Kampman-van de Hoek et al (2015)
E coli oral administration diarrhoea intestinal infection fever Marquardt et al (2006) McLamb et al (2013)
Turpetine oil subcutaneous injection increase in acute phase proteins fever Carpintero et al(2005) Heegaard et al (2011) Kampman-van de Hoek et al (2013)
A pleuropneumoniae voluntary inhalation of aerosol or intranasal administration
lung inflammation pneumonia fever
Heegaard et al (1998) Heegaard et al (2011) Skovgaard et al (2009)
Chapter 1
17
Immune stimulation and energy requirements Apart from the effect of ISS on AA
metabolism energy metabolism is also found to be influenced during ISS (Benson et al
1993 Humphrey and Klasing 2004) Processes like fever and APP production in response to
ISS consume energy (Lochmiller and Deerenberg 2000 Parmentier et al 2002) Immune
challenge studies often result in reduced ADG for ISS treatment groups compared with
control groups which cannot be completely explained by the related decreased average
daily feed intake (ADFI) as reported in a meta-analysis by Pastorelli et al (2012b)
Depending on the nature of the challenge a substantial portion of the decrease in ADG is
caused by changes in the energetic efficiency in these animals (Pastorelli et al 2012b) A
lower energetic efficiency might show that the animal has an increased energy requirement
in the case of ISS (Williams et al 1997 Le Floch et al 2006) The change in energy
efficiency during ISS might be due to an increased energy expenditure for the immune
system reflected in an increase in the FHP Alternatively ISS may reduce the maximum rate
of protein deposition or change the priority of the animal for depositing protein and fat in
the body For example Parmentier et al (2002) found an increased fat deposition in
broilers repeatedly challenged with lipopolysaccharide (LPS)
Acute challenge studies versus a method mimicking on farm situations Most evidence for
increased AA requirements is obtained in studies in which pigs were repeatedly challenged
with LPS (eg Kim et al 2012 de Ridder et al 2012 Rakhshandeh et al 2010 Table 11)
Complete Freundrsquos Adjuvant (Le Flocrsquoh et al 2008 Kampman-van de Hoek et al 2015) or
turpentine oil (Kampman-van de Hoek et al 2013) and it can be questioned to what
extent these results can be extrapolated to pigs in commercial conditions (Pastorelli et al
2012b) Instead studies with a more practical approach mimicking farm situations are
needed to quantify the nutrient costs of suboptimal conditions This approach should not
focus on acute challenges and clinical infections but on factors that are encountered on
farms in practice and influence the immune system of the pig without inducing severe
clinical signs of disease or mortality The needed model might for instance create a low-
grade contrast in immune system stimulation by exposing pigs to different hygiene levels
medication ventilation and animal density Use of such a model has the advantage that
translation of the results to a farm situation is more easy than for a model with clinical
infection It might be a challenge though to maintain a similar standardized effect of the
factors in the model on the pigs
REDUCTION IN DIETARY PROTEIN A RISK FOR PIG PRODUCTION
Due to environmental issues and a growing world population there is a renewed focus to
increase efficiency of livestock farming In pig nutrition reduction of the dietary crude
protein (CP) level can contribute to this goal as generally protein intake is inversely related
to protein efficiency (Batterham et al 1990)
Chapter 1
18
It is generally perceived that dietary deficiencies due to this CP reduction can be
compensated for by supplementing essential AA to the diet thus restoring normal growth
at lower N intake (Kerr and Easter 1995 Gloaguen et al 2014) However the ideal dietary
AA profile differs depending on animal and environmental conditions which can change
the optimal AA profile (Le Floch et al 2004) Suboptimal conditions may be an increasing
challenge for future pig production due to the restricted use of antibiotics in food animals
(Cogliani et al 2011)
Risk for behavioural problems A reduction in dietary protein supply for pigs housed under
suboptimal conditions may increase the risk on behavioural problems It is known from
literature that dietary AA deficiencies increase the risk of tail- and ear biting outbreaks
(Jericho and Church 1972 Taylor et al 2010) Therefore considering the large variation in
conditions on todayrsquos pig farms the challenge for an increasing protein efficiency on farms
coincides with a lack of understanding of the dietary optimal AA profile and optimal dietary
protein-energy ratio of pigs on these farms which may aggravate behavioural problems
Behavioural characteristics are considered to be important indicators of animal health Tail
biting behaviour constitutes a large economical and welfare problem in the pig industry
(Schroslashder-Petersen and Simonsen 2001 Moinard et al 2003) The level of disease has
already been identified as one of the multifactorial reasons influencing this behaviour
(Schroslashder-Petersen and Simonsen 2001 Taylor et al 2010) Respiratory disease and tail
biting for example seem to have an association with each other as found by Kritas and
Morrison (2007) and Moinard et al (2003) The background of the relationship between
healthdisease and biting behaviour is not completely understood This relation might be
influenced by the effect of ISS and the consequential change of nutrient requirements in
the body If some nutrients are limiting for pig performance or immune functioning pigs
might further increase their rooting behaviour to satisfy their nutritional needs As biting
behaviour is considered to be redirected rooting behaviour consequently there can be an
increased risk for biting behaviour in case of immune stimulation (Taylor et al 2010)
Serotonin might play a key role in the effect of dietary nutrient deficiencies and ISS on
biting behaviour Serotonin is a neurotransmitter synthesised from Trp and is known to
influence pig behaviour (Le Floch and Seve 2007) Trp is one of the essential AA that might
become limiting in case of ISS (Le Flocrsquoh et al 2009) and can therefore indirectly
influence pig behaviour Aggressive behaviour and stress have been shown to be related to
the concentration of dietary Trp and brain serotonin in several animal and human studies
(Gibbons et al 1979 Chamberlain et al 1987 Salomon et al 1994 Winberg et al 2001
Lepage et al 2002) It is very likely that Trp and serotonin play also a role in biting
behaviour however a direct link between optimal or suboptimal health conditions dietary
Trp serotonin and biting behaviour has not yet been demonstrated Ursinus et al (2014)
recently found that pigs that perform tail biting behaviour had lowered blood serotonin
Chapter 1
19
levels This can be due to the direct effect of serotonin on tail biting however it can also be
an indirect effect due to lowered AA level or lowered health status Additionally a reduced
growth in case of low sanitary conditions can have a direct effect on biting behaviour Low
growth rate due to poor health often results in a larger variation in size of animals within
the same pen influencing biting behaviour negatively (Taylor et al 2010)
Overall striving for a reduction in dietary protein content may increase the risk on health
performance and behavioural problems particularly so in pigs housed under low sanitary
conditions
In summary AA metabolism and energy metabolism is altered in case of ISS As the
frequency of ISS is related to the sanitary conditions of the pig altered protein and energy
metabolism results in altered nutrient requirements of these pigs when housed in optimal
or suboptimal situations Interactions between AA and energy metabolism the immune
system and dietary AA and energy supply are not fully understood and require further
research Future feeding strategies taking into account sanitary conditions of the farm
might help to make pig production more efficient specifically when striving for a reduction
in dietary protein content and zero use of antibiotics Development of such feeding
strategies is only possible when nutritional needs affected by sanitary status are quantified
and the interactions between health performance behaviour and sanitary conditions are
better understood
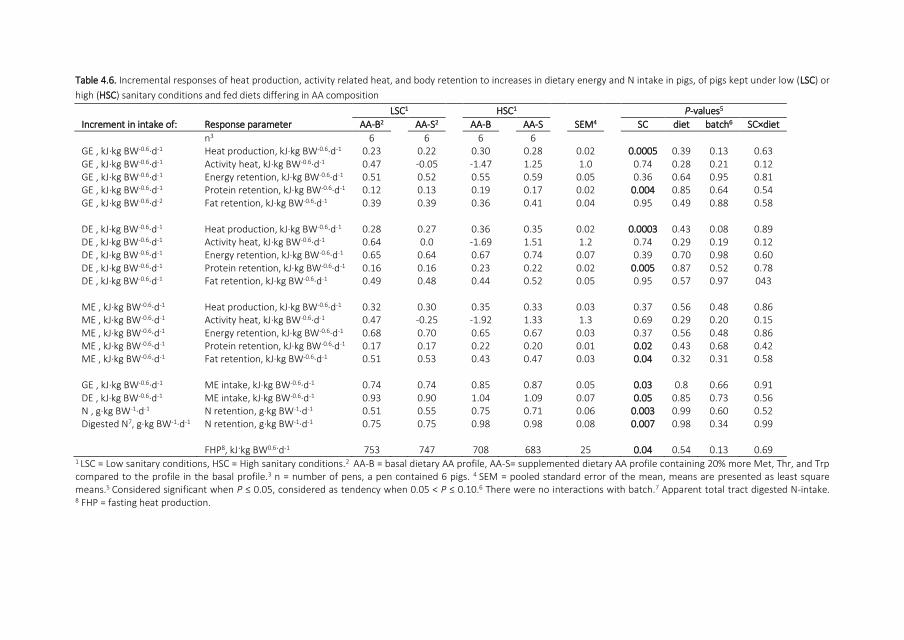
Figure 14 Schematic overview of the outline of this thesis The light grey area represents a pig The small squares represent pools or events The arrows having a symbol represent effects The question marks indicate likely effects The arrows without symbols represent fluxes
Chapter 1
20
OBJECTIVES AND OUTLINES
The objective of the research in this thesis was to study the effects of low and high sanitary
conditions on AA and energy metabolism in pigs Also interactions between the immune
system metabolism and damaging behaviour were taken into account in this thesis The
relationships between low sanitary conditions the immune system AA and energy pool
feed intake protein and fat deposition and damaging behaviour are shown in a schematic
overview in Figure 14
In Chapter 2 an experiment is described revealing the effects of dietary protein level and
dietary AA supplementation on the growth performance of pigs kept under different
sanitary conditions In Chapter 3 the effects of dietary protein level in combination with
dietary AA supplementation on the damage behaviour of pigs kept under different sanitary
conditions are evaluated Chapter 4 describes the effects of different sanitary conditions
on the energy requirement for maintenance and on the incremental efficiencies for
retention of dietary energy and protein in the body in the pig In Chapter 5 diurnal patterns
of heat production and carbohydrate and fat oxidation of pigs kept under different sanitary
conditions are presented Chapter 6 includes a general discussion with emphasis on
different experimental models and methodologies used for immune stimulation studies
and measurement of AA and energy metabolism At the end of this general discussion the
implications of the results found in this thesis for current feed industry are provided
Finally general conclusions are presented
Chapter 1
21
REFERENCES
AgroVision 2016 Kengetallenspiegel juli 2015 - juni 2016 Agrovision BV The Netherlands
ARC 1981 The nutrient requirements of pigs Commonwealth agricultural bureaux LondonUK
Batterham E L Andersen D Baigent and E White 1990 Utilization of ileal digestible amino acids by growing pigs effect of
dietary lysine concentration on efficiency of lysine retention Br J Nutr 64 81-94
Benson B N C C Calvert E Roura and K C Klasing 1993 Dietary energy source and density modulate the expression of
immunologic stress in chicks J Nutr 123 1714-1723
Bruins M J P B Soeters W H Lamers A J Meijer and N E Deutz 2002 l-Arginine supplementation in hyperdynamic
endotoxemic pigs Effect on nitric oxide synthesis by the different organs Crit Care Med 30 508-517
Burrin D B Stoll J van Goudoever and P Reeds 2001 Nutrient requirements for intestinal growth and metabolism in the
developing pig In J E Lindberg and B Ogle editors Digestive physiology of pigs Proceedings of the 8th symposium
Swedish University of agricultural science Uppsala Sweden p 75-88
Campos P H E Merlot M Damon J Noblet and N Le Floch 2014 High ambient temperature alleviates the inflammatory
response and growth depression in pigs challenged with Escherichia coli lipopolysaccharide Vet J 200 404-409
Carpintero R M Pintildeeiro M Andreacutes M Iturralde M A Alava P M H Heegaard J L Jobert F Madec and F Lampreave 2005
The concentration of apolipoprotein A-I decreases during experimentally induced acute-phase processes in pigs
Infect Immun 73 3184-3187
Chamberlain B F R Ervin R O Pihl and S N Young 1987 The effect of raising or lowering tryptophan levels on aggression in
vervet monkeys Pharmacol Biochem Be 28 503-510
Cogliani C H Goossens and C Greko 2011 Restricting antimicrobial use in food animals lessons from Europe Microbe 6 274
Centraal Veevoeder Bureau (CVB) 2016 Tabellenboek Veevoeding Voedernormen varkens en voederwaarden voedermiddelen
voor varkens CVB Lelystad The Netherlands
de Ridder K C L Levesque J K Htoo and C F M de Lange 2012 Immune system stimulation reduces the efficiency of
tryptophan utilization for body protein deposition in growing pigs J Anim Sci 90 3485-3491
Gibbons J L G A Barr W H Bridger and S F Liebowitz 1979 Manipulations of dietary tryptophan Effects on mouse killing and
brain serotonin in the rat Brain Res 169 139-153
Gloaguen M N Le Flocrsquoh E Corrent Y Primot and J van Milgen 2014 The use of free amino acids allows formulating very low
crude protein diets for piglets J Anim Sci 92 637-644
Heegaard P M H A Stockmarr M Pintildeeiro R Carpintero F Lampreave F M Campbell D P Eckersall M J M Toussaint E
Gruys and S N Sorensen 2011 Optimal combinations of acute phase proteins for detecting infectious disease in
pigs Vet Res 42 1-13
Heegaard P M H J Klausen J P Nielsen N Gonzaacutelez-Ramoumln M Pintildeeiro F Lampreave and M A Alava 1998 The Porcine
Acute Phase response to infection with actinobacillus pleuropneumoniae haptoglobin C-reactive protein major
acute phase protein and serum amyloid A protein are sensitive indicators of infection Comp Biochem Phys B 119
365-373
Humphrey B D and K C Klasing 2004 Modulation of nutrient metabolism and homeostasis by the immune system World Poult
Sci J 60 90-100
Jayaraman B J Htoo and C M Nyachoti 2015 Effects of dietary threoninelysine ratioes and sanitary conditions on
performance plasma urea nitrogen plasma-free threonine and lysine of weaned pigs Anim Nutr 1 283-288
Jericho K and T Church 1972 Cannibalism in pigs Can Vet J 13 156
Johnson R W 1997 Inhibition of growth by pro-inflammatory cytokines an integrated view J Anim Sci 75 1244-1255
Kampman-van de Hoek E W J J Gerrits C M C van der Peet-Schwering A J M Jansman and J J G C van den Borne 2013 A
simple amino acid dosendashresponse method to quantify amino acid requirements of individual meal-fed pigs J Anim Sci
91 4788-4796
Kampman-van de Hoek E P sakkas W J J Gerrits J J G C van den Borne C M C van der Peet-Schwering and A J M
Jansman 2015 Induced lung inflammation and dietary protein supply affect nitrogen retention and amino acid
metabolism in growing pigs Brit J Nutr 113 414-425
Kerr B J and R A Easter 1995 Effect of feeding reduced protein amino acid-supplemented diets on nitrogen and energy
balance in grower pigs J Anim Sci 73 3000-3008
Kim J C B P Mullan B Frey H G Payne and J R Pluske 2012 Whole body protein deposition and plasma amino acid profiles
in growing andor finishing pigs fed increasing levels of sulfur amino acids with and without Escherichia coli
lipopolysaccharide challenge J Anim Sci 90 362-365
Klasing K C and B J Johnstone 1991 Monokines in Growth and Development Poult Sci 70 1781-1789
Chapter 1
22
Kritas S M and R B Morrison 2007 Relationships between tail biting in pigs and disease lesions and condemnations at
slaughter Vet Rec 160
Labussiegravere E S Dubois J van Milgen G Bertrand and J Noblet 2008 Fasting heat production and energy cost of standing
activity in veal calves Brit J Nutr 100 1315-1324
Langhans W 2000 Anorexia of infection current prospects Nutr 16 996-1005
Le Floch N F Gondret J J Matte and H Quesnel 2012 Towards amino acid recommendations for specific physiological and
patho-physiological states in pigs Proc Nutr Soc 71 425-432
Le Floch N C Jondreville J J Matte and B Seve 2006 Importance of sanitary environment for growth performance and plasma
nutrient homeostasis during the post-weaning period in piglets Arch Anim Nutr 60 23-34
Le Floch N D Melchior and C Obled 2004 Modifications of protein and amino acid metabolism during inflammation and
immune system activation Livest Prod Sci 87 37-45
Le Floch N and B Seve 2007 Biological roles of tryptophan and its metabolism Potential implications for pig feeding Livest Sci
112 23-32
Le Flocrsquoh N L LeBellego J J Matte D Melchior and B Segraveve 2009 The effect of sanitary status degradation and dietary
tryptophan content on growth rate and tryptophan metabolism in weaning pigs J Anim Sci 87 1686-1694
Le Flocrsquoh N D Melchior and B Segraveve 2008 Dietary tryptophan helps to preserve tryptophan homeostasis in pigs suffering from
lung inflammation J Anim Sci 86 3473-3479
Lepage O O Tottmar and S Winberg 2002 Elevated dietary intake of L-tryptophan counteracts the stress-induced elevation of
plasma cortisol in rainbow trout (Oncorhynchus mykiss) J Exp Bio 205 3679-3687
Li P Y-L Yin D Li S Woo Kim and G Wu 2007 Amino acids and immune function Brit J Nutr 98 237-252
Litvak N A Rakhshandeh J Htoo and C de Lange 2013 Immune system stimulation increases the optimal dietary methionine to
methionine plus cysteine ratio in growing pigs J Anim Sci 91 4188-4196
Lochmiller R L and C Deerenberg 2000 Trade-offs in evolutionary immunology Just what is the cost of immunity Oikos 88 87-
98
Marquardt R R L Z Jin J W Kim L Fang A A Frohlich and S K Baidoo 2006 Passive protective effect of egg-yolk antibodies
against enterotoxigenic Escherichia coli K88+ infection in neonatal and early-weaned piglets FEMS Immunol Med
Microbio 23 283-288
McLamb B L A J Gibson E L Overman C Stahl and A J Moeser 2013 Early weaning stress in pigs impairs innate mucosal
immune responses to enterotoxigenic E coli challenge and exacerbates intestinal injury and clinical disease PLOS
ONE 8 e59838
McNab B K 1997 On the utility of uniformity in the definition of basal rate of metabolism Physiol Zoo 70 718-720
Melchior D B Segraveve and N Le Flocrsquoh 2004 Chronic lung inflammation affects plasma amino acid concentrations in pigs J Anim
Sci 82 1091-1099
Moinard C M Mendl C J Nicol and L E Green 2003 A case control study of on-farm risk factors for tail biting Appl Anim
Behav Sci 81
Moughan P J 1981 A model to simulate the utilisation of dietary amino acids by the growing pig (20ndash100 kg) Massey University
Palmerston North New Zealand
Moughan P J 2003 Simulating the partitioning of dietary amino acids New directions J Anim Sci 81 E60-E67
Murata H N Shimada and M Yoshioka 2004 Current research on acute phase proteins in veterinary diagnosis an overview Vet
J 168 28-40
NRC 2012 Nutrient Requirements of Swine 11th ed Natl Acad Press Washington DC
Parmentier H k S Bronkhorst M G Nieuwland G V Reilingh J M van der Linden M J Heetkamp B kemp J W Schrama M
W Verstegen and H an den Brand 2002 Increased fat deposition after repeated immunization in growing chickens
Poult Sci 81 1308-1316
Pastorelli H N Le Floch E merlot M C Meunier-Salauumln J van Milgen and L Montagne 2012a Sanitary housing conditions
modify the performance and behavioural response of weaned pigs to feed- and housing-related stressors Anim 6
1811-1820
Pastorelli H J van Milgen P Lovatto and L Montagne 2012b Meta-analysis of feed intake and growth responses of growing
pigs after a sanitary challenge Anim 6 952-961
Petersen H H J P Nielsen and P M H Heegaard 2004 Application of acute phase protein measurements in veterinary clinical
chemistry Vet Res 35 163-187
Rakhshandeh A J K Htoo and C F M de Lange 2010 Immune system stimulation of growing pigs does not alter apparent ileal
amino acid digestibility but reduces the ratio between whole body nitrogen and sulfur retention Livest Sci 134 21-23
Ren M X T Liu X Wang G J Zhang S Y Qiao and X F Zeng 2014 Increased levels of standardized ileal digestible threonine
attenuate intestinal damage and immune responses in Escherichia coli K88+ challenged weaned piglets Anim Feed Sci
Tech 195 67-75
Chapter 1
23
Salomon R M C M Mazure P L Delgado P Mendia and D S Charney 1994 Serotonin function in aggression The effect of
acute plasma tryptophan depletion in aggressive patients Biol Psych 35 570-572
Sandberg F B G C Emmans and I Kyriazakis 2006 A model for predicting feed intake of growing animals during exposure to
pathogens J Anim Sci 84 1552-1566
Santioga Rostagno H L F Teixeira Albino J Lopes Donzele P Cezar Gomes R Flaacutevia de Oliveira D Clementino Lopes A Soares
Fereira S L de Toledo Barreto and R F Euclides 2011 Brazililian tables for poultry and swine Composition of
feedstuffs and nutritional requirements 3rd edition Universidade fedral de Viccedilosa Brazil
Schroslashder-Petersen D L and H B Simonsen 2001 Tail biting in pigs Vet J 162 196-210
Skovgaard K S Mortensen M Boye K T Poulsen F M Campbell P D Eckersall and P M H Heegaard 2009 Rapid and widely
disseminated acute phase protein response after experimental bacterial infection of pigs Vet Res 40 23
Stein H H M F Fuller P J Moughan B Segraveve R Mosenhthin A J M Jansman J A Fernaacutendez and C F M de Lange 2007
Definition of apparent true and standardized ileal digestibility of amino acids in pigs Livest Sci 109 282-285
Taylor N R D C J Main M Mendl and S A Edwards 2010 Tail-biting a new perspective Vet J 186 137-147
Ullman-Cullere M H and J F Charmaine 1999 Body condition scoring A rapid and accurate method for assessing health status
in mice Lab Anim Sci 49 319-323
Ursinus W W C G Van Reenen I Reimert and J E Bolhuis 2014 Tail biting in pigs blood serotonin and fearfulness as pieces of
the puzzle PLOS ONE 9 e107040
van der Peet-Schwering C M C and A J M Jansman 2007 Nutrieumlntbehoefte van varkens onder suboptimale omstandigheden
NL rapport no 68 WUR Livestock Research Lelystad The Netherlands
van Milgen J J Bernier Y Lecozler S Dubois and J Noblet 1998 Major determinants of fasting heat production and energetic
cost of activity in growing pigs of different body weight and breedcastration combination Brit J Nutr 79 509-517
van Milgen J and J Noblet 2000 Modelling energy expenditure in pigs In JP McNamara J France D E Beever editors
Modelling nutrient utilization in farm animals University of Cape Town Cape Town South Africa p 103-114
van Milgen J and J Noblet 2003 Partitioning of energy intake to heat protein and fat in growing pigs J Anim Sci 81 E86-E93
Whittemore C T 1983 Development of recommended energy and protein allowances for growing pigs Agricult Sys 47 415-425
Whittemore C T and R H Fawcett 1974 Model responses of the growing pig to the dietary intake of energy and protein Anim
Prod 19 221ndash231
Whittemore C T M J Hazzledine and W H Close 2003 Nutrient requirement standards for pigs BSAS Penicuik UK
WHO 2017 A state of complete physical mental and social well-being and not merely the absence of disease or infirmity World
Health Organization httpwwwwhointaboutmissionen (Accessed 20 January 2017)
Williams N H T S Stahly and D R Zimmerman 1997 Effect of level of chronic immune system activation on the growth and
dietary lysine needs of pigs fed from 6 to 112 kg J Anim Sci 75 2481-2496
Winberg S Oslash Oslashverli and O Lepage 2001 Suppression of aggression in rainbow trout (Oncorhynchus mykiss) by dietary l -
tryptophan J Exp Bio 204 3867-3876
Chapter 2
Performance of pigs kept under different sanitary
conditions affected by protein intake and amino acid
supplementation
Y van der Meer12 A Lammers3 AJM Jansman4 MMJA Rijnen2 WH Hendriks1 and WJJ
Gerrits1
Journal of Animal Science 2016 94 (11) 4704-4719
1Animal Nutrition Group Wageningen University Wageningen 6708 WD The Netherlands
2De Heus Animal Nutrition Ede 6717 VE The Netherlands 3Adaptation Physiology Group Wageningen University Wageningen 6708 WD The
Netherlands 4Wageningen UR Livestock Research Wageningen 6708 WD The Netherlands
Chapter 2
26
ABSTRACT
There is growing evidence that requirements for particular amino acids (AA) increase when
pigs are kept under low sanitary conditions The extent to which reduction in growth
performance is related to these increased requirements is unclear To evaluate this
relationship an experiment (2 times 2 times 2 factorial arrangement) was performed with 612 male
pigs (9 per pen) kept under low sanitary conditions (LSC) or high sanitary conditions (HSC)
and offered ad libitum access to either a normal crude protein (CP) concentration diet (NP
17 15 and 15 CP for the starter grower and finisher phase respectively) or a low CP
concentration diet (LP 20 CP reduced relative to NP for each phase) each of which
containing a basal AA profile (AA-B) or a supplemented AA profile (AA-S) The
supplemented diet type contained 20 more methionine (Met) threonine (Thr) and
tryptophan (Trp) relative to Lys on an apparent ileal digestible basis compared with the
basal diet type Pigs were followed for a complete fattening period and slaughtered at a
targeted pen weight of 110 kg Haptoglobin concentrations in serum (092 gL for LSC and
078 gL for HSC) and IgG antibody titers against keyhole limpet hemocyanin (353 for LSC
and 308 for HSC) collected in the starter grower and finisher phases and pleuritis scores
at slaughter (051 for LSC and 020 for HSC) were greater for LSC pigs compared with HSC
pigs (P le 001) illustrating that sanitary conditions affected health conditions The average
daily gain (ADG) and gain to feed (GF) ratio were greater for HSC pigs compared with LSC
pigs (P le 001) The number of white blood cells (WBC) was higher in (AA-S)ndashfed pigs
compared with (AA-B)ndashfed pigs when kept at LSC but not at HSC (sanitary conditions (SC) times
AA interaction P = 004) Pigs fed NP had a lower number of WBC compared with pigs fed
LP (P = 002) The number of platelets in pigs fed AA-S diets was higher compared with pigs
fed AA-B diets (P le 001) A 20 reduction in dietary supplementation of Met Thr and Trp
relative to Lys decreased GF more in LSC pigs than in HSC pigs (interaction P = 003)
illustrating that dietary requirements for these AA differ depending on sanitary conditions
This study performed under practical conditions shows that AA requirements are
dependent on sanitary conditions Furthermore supplementation of diets with particular
AA may improve performance especially under poor hygienic conditions Dietary protein
concentration as well as Met Thr and Trp supplementation can modify immune status
which may influence resistance to subclinical and clinical diseases
Keywords amino acid immune system performance pig protein sanitary conditions
Chapter 2
27
INTRODUCTION
A potential growth reduction with decreasing dietary protein intake can be ameliorated
through the supplementation of limiting amino acids (AA) in the diet thereby restoring
growth at a lower CP intake (Kerr and Easter 1995 Gloaguen et al 2014) The optimal AA
profile however differs depending on animal and environmental conditions (Le Flocrsquoh et
al 2004) Activating the immune system can increase the requirements for nutrients such
as AA If the enhanced requirements are not compensated for by greater intake
repartitioning of dietary protein or AA away from development and growth tissues occurs
(Le Flocrsquoh et al 2009) toward use by the immune processes This shift of nutrients
together with an often-observed reduction in feed intake in case of immune stimulation
reduces pig performance (Klasing and Johnstone 1991 Pastorelli et al 2012a) Despite the
growing evidence that particular AA requirements are dependent on immune system
activation it remains unclear to what extent reduced performance during (subclinical)
infections is related to changes in AA requirements and whether dietary supplementation
of these AA can reverse the performance loss Moreover most evidence for increased AA
requirements is obtained in studies in which pigs were repeatedly challenged with
lipopolysaccharide (LPS eg Kim et al 2012 de Ridder et al 2012 Rakhshandeh et al
2010) or Complete Freundrsquos Adjuvant (Kampman-van de Hoek et al 2015 Le Flocrsquoh et al
2008) and it can be questioned to what extent these results can be extrapolated to pigs in
commercial conditions (Pastorelli et al 2012b) Therefore we studied under practical
conditions if the performance and immune status of pigs kept under different sanitary
conditions is influenced by protein intake and AA supplementation We hypothesized that
increased provision of Met Thr and Trp would increase performance of pigs particularly
when kept under low sanitary conditions and low dietary protein intake
MATERIAL AND METHODS
The experimental protocol was approved by the Animal Care and Use Committee of
Wageningen University the Netherlands
Experimental Design In a 2 times 2 times 2 factorial arrangement groups of pigs were allocated to
either high sanitary conditions (HSC) or low sanitary conditions (LSC) and were offered ad
libitum access to 2 different diets a normal CP concentration diet (NP) or a low CP
concentration diet (LP) each having either a basal dietary AA profile (AA-B) or
supplemented dietary AA profile containing 20 more Met Thr and Trp compared with
the basal profile (AA-S)
Chapter 2
28
Animals and Treatments In total 612 (Topigs 20 times Tempo Topigs Helvoirt The
Netherlands) newborn boar piglets were selected on a commercial nursery farm in the
Netherlands and allocated to either the LSC or HSC treatment Per nursery room half of the
boar piglets were selected for LSC and the other half for HSC treatment Only HSC piglets
received vaccinations in the first 9 wk of age The HSC piglets were vaccinated at 1 to 2 wk
of age against Mycoplasma hyopneumoniae (Porcilis M Hyo MSD Animal Health Boxmeer
the Netherlands) at 4 to 5 wk of age against M hyopneumoniae porcine circovirus type 2
(PCV2) and porcine reproductive and respiratory syndrome (PRRS Porcilis M Hyo Porcilis
Circo and Porcilis PRRS respectively MSD Animal Health) and Lawsonia intracellularis
(Enterisol Ileitis Boehringer Ingelheim BV Alkmaar the Netherlands) at 6 to 7 wk of age
against Actinobacillus pleuropneumoniae (APP Porcilis APP MSD Animal Health) and
influenza A virus (Gripovac3 Merial BV Velserbroek the Netherlands) and at 8 to 9 wk of
age against APP and influenza A virus (Porcilis APP and Gripovac3 respectively) by
subcutaneous injection in the neck or in the case of Enterisol by oral drench Piglets of
both LSC and HSC treatments were housed in the same rooms until weaning (plusmn24 d of age)
After weaning LSC and HSC pigs were group housed in different rooms to prevent cross-
vaccination by the 2 living vaccines used in the HSC piglets (Enterisol Ileitis and Porcilis
PRRS) The HSC and LSC pigs were separately transported to the experimental farm
(Vlierbos VOF Neerloon the Netherlands) As it was not possible to obtain all
measurements during the study on 612 pigs on a single day the LSC and HSC groups were
split into 2 batches of 324 (180 from the LSC treatment and 144 from the HSC treatment)
and 288 pigs (144 from the LSC treatment and 144 from the HSC treatment) arriving 1 wk
apart Therefore pigs of batch 1 and 2 arrived at the experimental farm at an age of 10 and
11 wk respectively
Upon arrival all pigs were individually weighed and within sanitary condition treatment
and batch allocated to their pen based on BW to minimize variation between pens and
within pens (173 plusmn 006 kg for LSC batch 1 181 plusmn 007 kg for LSC batch 2 159 plusmn 007 kg for
HSC batch 1 and 174 plusmn 007 kg for HSC batch 2) The LSC pigs of each batch were housed
in 5 LSC rooms and the HSC pigs were housed in 4 HSC rooms located in the same building
Each room had separate manure pits and separate ventilation regulation and contained 8
pens with 9 pigs per pen (08 m2 spacepig) except for 1 LSC room where 4 out of 8 pens
were left empty In addition the HSC and LSC rooms were separated by a wall in the central
corridor High sanitary condition rooms were intensively cleaned in 4 steps before arrival of
the pigs twice with foam (MS Topfoam LC Alk MS Schippers Bladel the Netherlands) and
high pressure washing and then treated twice with a disinfectant (MS Megades and MS
Oxydes MS Schippers) In addition a strict hygiene protocol was adhered to when entering
the HSC rooms which included showering change of clothes and use of a hairnet and face
mask People were not allowed to have access to a pig farm 48 h before entering HSC
rooms High sanitary condition animals received a preventative antibiotic injection (Fenflor
AUV Veterinary Services BV Cuijk the Netherlands 1 mLpig intramuscular at Day 1 and
Chapter 2
29
3 of the experiment) and were dewormed every 5 wk during the experiment starting at
arrival (Flutelmium 06 premix AUV Veterinary Services BV topdressing 15 mg
Flubendazolkg BW for 5 subsequent days) Rooms for the LSC pigs were not cleaned after
a previous batch of commercial finisher pigs left the facility 2 d before and no hygiene
protocol was applied Starting at 5 wk after arrival fresh manure of another commercial pig
farm was spread in the LSC pens every 2 wk until end of the experiment to enhance
antigenic pressure Low sanitary condition pigs did not receive any medication or
preventive treatment The experimental period lasted from December 11 2013 until April
16 2014 Animals were monitored for the complete fattening period divided in 3 phases
that is starter (0ndash34 d) grower (35ndash49 d) and finisher phases (from Day 50 until a target
average pen weight of 110 kg BW) At the end of each phase pigs were individually
weighed
Diets and Feeding Pigs were allocated to 2 diets NP (17 15 and 15 CP for the starter
grower and finisher phases respectively) or LP (20 CP reduced relative to NP for each
phase) each of which contained a basal or a supplemented AA profile This resulted in 4
dietary treatments Low protein - basal amino acid diet low protein- supplemented amino
acid diet normal protein - basal amino acid die and normal protein - supplemented amino
acid diet Each diet was fed to the pigs in both sanitary regimes resulting in 8 treatment
groups The apparent ileal digestible (AID) Lys to NE ratio of the diets was reduced in each
subsequent phase of the experiment to follow a 3-phase feeding system For the NP the
ratio was based on the Lys to net energy (NE) requirements for boars according to the NRC
(2012) The values for Lys to NE requirements were multiplied by 095 to make sure that
the dietary energy concentration was not limiting the growth performance of the pigs This
resulted in diets for the starter grower and finisher phases containing 090 081 and 075
g AID LysMJ of NE For the LP the inclusion level of all protein-containing ingredients was
decreased by 20 relative to the NP and replaced by maize starch and Opticell (Agromed
Austria GmbH Kremsmuumlnster Austria) resulting in 072 065 and 060 g AID Lys MJ of
NE The basal AA profile (AA-B) was designed based on a factorial approach to cover the
requirements for body protein deposition based on results from Bikker et al (1994) Le
Bellego and Noblet (2002) and the NRC (2012) and to cover losses associated with basal
endogenous AA in ileal digesta based on results from Jansman et al (2002) and the NRC
(2012) related to losses of AA in skin and hair based on results from the NRC (2012) and
AA losses related to cell turnover based on results from Moughan (1998) All values were
expressed in the same units for a pig of 50 kg BW with an assumed protein deposition of
138 gd The Met + Cys (45 of AID Lys) and Trp (15 of AID Lys) concentrations in AA-B
diets obtained in this manner were adjusted to 51 Met + Cys and 18 Trp based on
results from Knowles et al (1998) and Jansman et al (2010) as we considered these to be
far below the requirement values (CVB 2011 NRC 2012) The supplemented AA profile
(AA-S) was derived from the AA-B profile by increasing the Met Thr and Trp ratio relative
Chapter 2
30
to Lys by 20 These AA were increased in particular as they are believed to be important
as building blocks for proteins for example acute-phase proteins synthesized in case of
immune system activation (Melchior et al 2004 Le Flocrsquoh et al 2008 2012 Rakhshandeh
et al 2010) because of their function as precursors for important immune related
components and antioxidants and also because of their effects on several immune
processes Methionine is known to be an important methyl donor (Burke et al 1951) and
antioxidant (Wu 2009) Thr plays an important role in mucus synthesis for gut integrity and
immune function (Wu 2009) and Trp is known as a precursor of melatonin and serotonin
both known to inhibit inflammatory cytokines (Wu 2009) The ingredient and nutrient
composition of the diets is shown in Tables 21 22 and 23 All diets were isocaloric on a
NE basis and contained TiO2 as an indigestible marker Diets were analyzed for AA
composition by acid hydrolysis at 110degC for 23 h and ion-exchange chromatography with
postcolumn derivatization with ninhydrin (ISO 2005b) and Trp by alkaline hydrolysis at
110degC for 20 h ion-exchange chromatography with fluorescence detection (MOD0094
version G ISO 2005c) Per pen (9 pigs) 1 feeder was used and feed and water were
offered ad libitum The feed was provided as pellets via a computerized automatic system
(Fancom Multiphase Fancom BV Panningen the Netherlands) which registered the mass
of feed delivered per pen per day At the end of each phase (starter grower and finisher)
remainders of the diet per pen were collected and weighed to determine the feed intake
per pen per phase The computerized feeding system was calibrated before the trial started
and after each phase
Digestion of dry matter and nitrogen At wk 13 18 and 24 of age pigs in 4 pens per room
and 4 rooms per sanitary treatment were sampled for feces by rectal stimulation In 3
subsequent days 1 sample per pig was collected and samples were pooled per pen and
stored at minus20degC Sampling pens were equally distributed over dietary treatments Frozen
feces samples were dried at 103degC in an oven for 24 h to determine DM content (method
93015 AOAC ISO 1999) and were analyzed for nitrogen (N) by the Kjeldahl method (ISO
5983 ISO 2005a) Before Ti analysis (Short et al 1996 Myers et al 2004) samples were
freeze-dried and ground to pass a 1-mm screen using a Retsch ZM 100 mill (Retsch GmbH
Haan Germany) Apparent total tract digestibility (ATTD) for dry matter (DM) and N was
calculated using TiO2 as an indigestible marker (Kotb and Luckey 1972)
Blood Sampling At the start of the experiment 2 pigs with an average weight per pen were
selected for blood sampling at 13 18 and 24 wk of age from the vena cava Selected pigs
were sampled during each of the 3 phases Per sampling moment two 9-mL tubes per
animal were filled 1 EDTA tube for blood cell counts (Vacuette Greiner Bio-One
Kremsmuumlnster Austria) and 1 serum tube for acute-phase protein and natural antibody
(Nab) analysis (Vacuette) Blood samples collected in EDTA tubes were immediately stored
on ice and transported to the lab where blood cell counts were performed using a Microcell
Chapter 2
31
counter Sysmex pocH- iV Diff Toa Medical Electronics Co Ltd Kobe Japan) Blood
samples in serum tubes were allowed to clot for 1 h at room temperature after which
serum was collected after centrifugation for 10 min at 5251 times g at room temperature and
stored at minus20degC pending analysis of haptoglobin (Tridelta Phase Haptoglobin Assay catalog
number TP-801 Tridelta Development Ltd Maynooth Ireland) pig major acute-phase
protein (Cusabio Pig-MAP ELISA catalog number CSB-E13425p Cusabio Biotech Co Ltd
Wuhan Hubei Province China) and Nab titers against keyhole limpet hemocyanin (KLH)
types IgG and IgM using ELISA
Chapter 2
32
Table 21 Ingredients and nutrient composition of the starter diets
LP1 NP1
Item AA-B2 AA-S2 AA-B AA-S
Ingredient gkg of feed
Maize 32000 32000 40000 40000 Soybean meal 18202 18200 22754 22754 Barley 16000 16000 20000 20000 Wheat 4553 4553 5691 5691 Maize starch 20679 20464 4065 3790 Sugarcane molasses 2000 2000 2000 2000 Limestone 1394 1394 1411 1411 Monocalcium phosphate 999 999 893 893 Soybean oil 1065 1098 1598 1638 Vitamin + mineral mix3 500 500 500 500 Salt 319 319 383 383 L-lysine HCl 195 194 235 235 Titanium dioxide 250 250 250 250 Sodium bicarbonate 258 258 134 134 L-threonine 060 146 063 171 L-tryptophan 003 031 000 037
DL-methionine 023 094 023 113
Cellulose4 1500 1500 000 000
Nutrients calculated gkg
NE MJkg5 980 980 980 980
DM 88960 88980 89320 88490
Crude protein 13800 13600 16800 16700
Starch4 47410 47230 41000 40770 Lys6 860 860 1050 1050 Thr6 540 620 660 740 Trp6 170 190 200 230 Met + Cys6 430 480 520 590 Ile6 560 560 690 680 Arg6 830 840 1050 1030 Phe6 660 660 820 810 His6 340 340 420 420 Leu6 109 1100 1360 1340 Tyr6 440 450 570 570 Val6 640 640 790 770 1 LP = low CP concentration diet NP = normal CP concentration diet
2 AA-B = basal dietary AA profile AA-S= supplemented dietary AA profile containing 20 more Met Thr and Trp compared with the basal profile 3 Supplied the following per kilogram of diet 30 mg riboflavin 20 mg niacine 20 mg d-pantothenic acid 10 mg choline chloride 0015 mg cyanocobalamin 40 mg dl-α-tocopheryl acetate 15 mg menadione 6000 IU retinyl acetate 1200 IU cholecalciferol 02 mg folic acid 10 mg thiamin 10 mg pyridoxine HCl 50 mg manganese oxide 267 mg iron SO4middotH2O 60 mg copper SO4middot5H2O 140 mg zinc SO4middotH2O 044 mg disodium selenium trioxide10 mg potassium iodate 4 Opticell (Agromed Austri GmbH Kremsmuumlnster Austria)
5 Based on chemical composition digestibility and energy value for pigs from the Centraal Veevoeder Bureau livestock feed table (CVB 2011) 6 Analyzed values
Chapter 2
33
Table 22 Ingredients and nutrient composition of the grower diets
LP1 NP1
Item AA-B2 AA-S2 AA-B AA-S
Ingredient gkg of feed
Maize 40000 40000 50000 50000
Soybean meal 13815 13815 17269 17269
Barley 17136 17136 21419 21419
Maize starch 19919 19724 4334 4086
Wheat 2000 2000 2000 2000
Sugarcane molasses 1311 1311 1333 1333
Limestone 862 862 767 767
Monocalcium phosphate 919 948 1020 1057
Soybean oil 500 500 500 500
Vitamin + mineral mix3 395 395 361 361
Salt 245 245 292 292
L-lysine HCl 250 250 250 250
Titanium dioxide 156 156 200 200
Sodium bicarbonate 387 387 152 152
L-threonine 072 149 074 172
L-tryptophan 021 046 022 055
DL-methionine 012 076 007 087
Cellulose4 2000 2000 000 000
Nutrients calculated gkg
NE MJkg4 984 984 984 984
DM 88370 88590 88280 88770
Crude protein 12400 12400 15200 15200
Starch5 49710 49550 44890 44690
Lys6 800 790 970 1000
Thr6 510 590 590 700
Trp6 156 175 191 216
Met + Cys6 398 452 476 558
Ile6 480 470 590 580
Arg6 720 700 900 900
Phe6 580 570 710 710
His6 300 300 370 360
Leu6 100 990 123 123
Tyr6 380 390 500 500
Val6 570 580 690 690 1 LP = low CP concentration diet NP = normal CP concentration diet
2 AA-B = basal dietary AA profile AA-S= supplemented dietary AA profile containing 20 more Met Thr and Trp compared with the basal profile 3 Supplied the following per kilopgram of diet 30 mg riboflavin 20 mg niacine 20 mg d-pantothenic acid 10 mg choline chloride 0015 mg cyanocobalamin 40 mg dl-α-tocopheryl acetate 15 mg menadione 6000 IU retinyl acetate 1200 IU cholecalciferol 02 mg folic acid 10 mg thiamin 10 mg pyridoxine HCl 50 mg manganese oxide 267 mg iron SO4middotH2O 60 mg copper SO4middot5H2O 140 mg zinc SO4middotH2O 044 mg disodium selenium trioxide10 mg potassium iodate 4 Opticell (Agromed Austri GmbH Kremsmuumlnster Austria)
5 Based on chemical composition digestibility and energy value for pigs from the Centraal Veevoeder Bureau livestock feed table (CVB 2011) 6 Analyzed values
Chapter 2
34
Table 23 Ingredients and nutrient composition of the finisher diets
LP1 NP1
Item AA-B2 AA-S2 AA-B AA-S
Ingredient gkg of feed
Maize 36010 36010 45010 45010 Soybean meal 11570 11570 14460 14460 Barley 24000 24000 30000 30000 Maize starch 18720 18530 3640 3410 Wheat 2000 2000 2000 2000 Sugarcane molasses 1220 1220 1250 1250 Limestone 740 740 650 650 Monocalcium phosphate 1400 1430 1320 1360 Soybean oil 500 500 500 500 Vitamin + mineral mix3 230 230 260 260 Salt 240 240 280 280 L-lysine HCl 250 250 250 250 Titanium dioxide 530 530 300 300 Sodium bicarbonate 000 060 000 070 L-threonine 070 140 070 160 L-tryptophan 010 040 010 040
DL-methionine 010 010 000 000
Cellulose4 2500 2500 000 000
Nutrients calculated gkg
NE MJkg5 984 984 984 984
DM 88590 88650 88160 88770
Crude protein 13200 12600 15100 14800
Starch5 54170 50940 54170 54020 Lys6 800 760 890 890 Thr6 530 560 590 650 Trp6 151 162 168 191 Met + Cys6 403 422 468 504 Ile6 490 460 570 560 Arg6 730 680 820 820 Phe6 600 560 680 680 His6 310 290 350 350 Leu6 1010 960 1190 1130 Tyr6 400 370 470 470 Val6 600 570 660 660 1 LP = low CP concentration diet NP = normal CP concentration diet
2 AA-B = basal dietary AA profile AA-S= supplemented dietary AA profile containing 20 more Met Thr and Trp compared with the basal profile 3 Supplied the following per kilopgram of diet 30 mg riboflavin 20 mg niacine 20 mg d-pantothenic acid 10 mg choline chloride 0015 mg cyanocobalamin 40 mg dl-α-tocopheryl acetate 15 mg menadione 6000 IU retinyl acetate 1200 IU cholecalciferol 02 mg folic acid 10 mg thiamin 10 mg pyridoxine HCl 50 mg manganese oxide 267 mg iron SO4middotH2O 60 mg copper SO4middot5H2O 140 mg zinc SO4middotH2O 044 mg disodium selenium trioxide10 mg potassium iodate 4 Opticell (Agromed Austri GmbH Kremsmuumlnster Austria)
5 Based on chemical composition digestibility and energy value for pigs from the Centraal Veevoeder Bureau livestock feed table (CVB 2011) 6 Analyzed values
Chapter 2
35
Oral Fluid Sampling for Presence of Respiratory Pathogens In each room with 8 pens of pigs
2 pens with the normal protein - basal amino acid diet were selected for oral fluid sampling
by using a swine oral fluid test kit (Tego oral fluids kit ITL Corporation Melbourne
Australia) At wk 14 20 and 24 of age (1 time point per phase) a clean rope was hanged in
the pen at pigsrsquo shoulder height and securely tied Pigs were allowed to chew on the rope
for 30 min Subsequently the rope was removed from the pen (by wearing gloves) and
placed in a clean pouch bag The bag was closed and the fluid was extracted from the rope
by squeezing the rope through the bag Oral fluid was collected from the bag in a clean
sample tube after the corner of the bag was torn off Oral fluid was refrigerated until
further analysis Oral samples were analyzed with multiplex PCR for presence of
Mycoplasma hyorhinis porcine respiratory corona virus PRRS virus M hyopneumoniae
influenza A virus porcine cytomegalo virus and PCV2 (IVD GmbH Hannover Germany)
Anti-Keyhole Limpet Hemocyanin IgM and IgG Assessment Antibody titers were determined
as described by de Koning et al (2015) with the minor modification that a 4-step dilution
(40 160 640 2560 times diluted) of the sera was made instead of a 3-step dilution
Observations at Slaughter All pigs per pen were slaughtered in the week in which the
average BW of the pigs in that pen was close to the target weight of 110 kg In the
slaughterhouse lungs were collected examined and scored by a pathologist for pleuritis (0
to 2 scale in which 0 = absence of pleuritis 1 = adhesion of lung tissue with film-like tissue
and 2 = lung tissue completely grown together) and pneumonia lesions (0 to 3 scale in
which 0 = absence of pneumonia 1 = one spot of pneumonia 2 = a few spots of
pneumonia and 3 = diffuse deviation of pneumonia spots) Carcass weight backfat
thickness and muscle thickness were measured in the slaughterhouse Both fat and muscle
thickness were measured at 6 cm from the back midline between the third and fourth last
rib Lean meat and dressing percentages were calculated per pig from the parameters
obtained at slaughter using the following formulas
lean meat () = 6686 minus 06549 times (fat mm) + 00207 times (muscle mm) (Engel et al 2012)
and dressing () = (carcass weightlive weight) times 100 (Watkins et al1990)
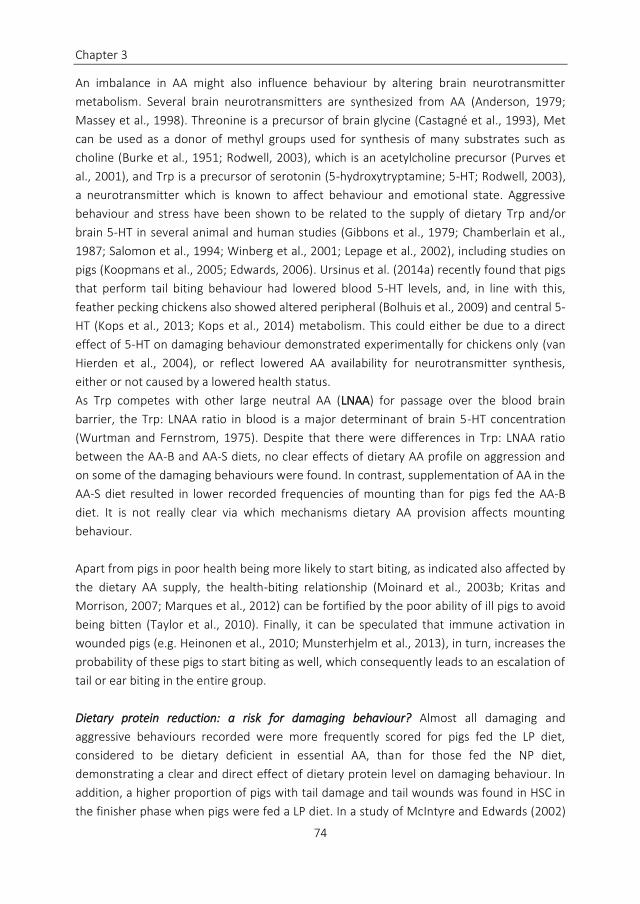
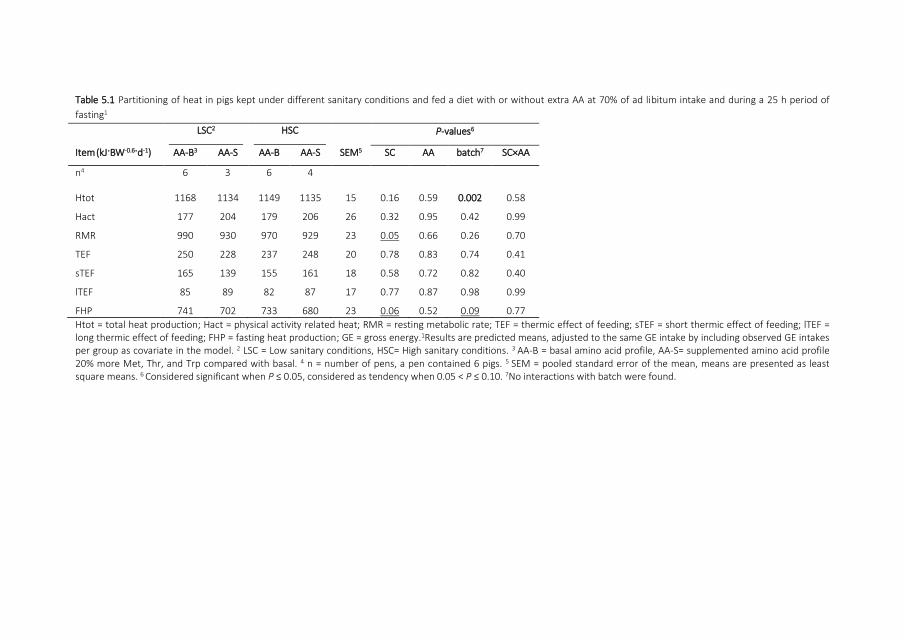
Table 24 Performance parameters of growing pigs kept under different sanitary conditions and fed diets differing in protein content and amino acid supplementation (bold P-values are significant and underlined P-values are considered as tendency)
1LSC = low sanitary conditions HSC = high sanitary conditions 2LP = low CP concentration diet NP = normal CP concentration diet 3AA-B = basal dietary AA profile AA-S = supplemented ietary AA profile containing 20 more Met Thr and Trp compared with basal profile 4SEM = pooled SEM Means are presented as least square means 5SC = sanitary conditions Considered significant when P le 005 considered as tendency when 005 lt P le 010 6A pen contained 9 pigs
LSC1 HSC1
P-values5 LP2 NP2 LP NP
Item AA-B3 AA-S3 AA-B AA-S AA-B AA-S AA-B AA-S SEM4 SC CP AA SCtimesCP SCtimesAA CPtimesAA SCtimesCPtimesAA
No of pens6 9 9 9 9 8 8 8 8
Start kg BW 176 180 176 176 166 166 167 166 01 lt0001 023 043 015 021 010 041
ADG gd
0-34 d 602 591 655 652 618 660 697 724 16 001 lt0001 022 053 006 086 060
35-49 d 962 992 1023 1088 979 1024 1113 1132 33 025 lt0001 002 022 065 089 039
17-110 kg
BW
825 846 864 884 860 886 925 969 18 003 lt0001 001 010 049 066 065
ADFI gd
0-34 d 1246 1225 1218 1198 1201 1280 1230 1259 20 017 039 021 027 001 042 040
35-49 d 2122 2123 2120 2070 2100 2222 2220 2244 51 011 045 049 017 017 027 069
17-110 kg
BW
1950 1924 1901 1890 1910 1989 1940 1998 37 025 066 024 013 004 090 063
GF gg
0-34 d 048 048 054 054 052 052 057 057 0009 0003 lt0001 062 075 094 059 096
35-49 d 046 047 048 052 047 046 05 051 0013 093 lt0001 011 091 009 060 081
17-110 kg
BW
042 044 046 048 045 044 048 048 0004 0002 lt0001 001 070 003 032 015
Chapter 2
37
Statistical Analysis Data were analyzed as a 2 times 2 times 2 factorial arrangement using the GLM
procedure for parameters measured at slaughter and the Mixed Model procedure for other
performance parameters and serum and blood data (SAS 93 SAS Inst Inc Cary NC) with
pen as experimental unit for all parameters For all data the normality of the distribution of
Studentized residuals was assessed by the ShapirondashWilk statistic If required
transformation of data was performed to obtain normal distribution of residuals Values are
presented as least squares means plusmn SEM and effects were considered significant at P le
005 and a trend was defined as 005 lt P le 010 Sanitary condition dietary CP level and AA
profile batch and their interactions were used as fixed effects Phase was added in the
model as a fixed effect and phase times sanitary condition as an interaction for all blood
parameters and ATTD of N and DM The effect of room within sanitary status was used as a
random effect to correct for differences between rooms The KenwardndashRoger statement
was used to correct for the degrees of freedom for batch The difference between
individual start BW and average BW of the treatment group (sanitary conditions and batch)
was used as covariate in the model in the first statistical evaluations but finally omitted
because of absence of statistical significance
RESULTS
Two pigs selected for blood sampling died during the grower phase and as such the data
of these pigs are missing for the finisher phase Data of another pig selected for blood
sampling was omitted from the data set as this pig was treated with antibiotics in the
starter phase due to lung problems No other clinical signs of illness were observed during
the experiment All results are presented in Tables 24 through 28 For clarity selected
treatment interactions are represented in Fig 21A through 21I
Performance Mean BW at start of the experiment was greater for LSC pigs (177 plusmn 01 kg)
compared with HSC pigs (166 plusmn 01 kg P le 001 Table 24) The ADG was (52 gd) lower for
LSC pigs compared with HSC pigs for the starter phase (P le 005) and (55 gd) during the
complete fattening period (P le 001) but not during the grower phase (P gt 010) The LP pigs
had (56 gd) lower ADG in the complete fattening period compared with NP pigs (all P le
005) The AA-B pigs tended to have (28 gd) lower ADG compared with AA-S pigs in the
starter phase when kept under HSC but not under LSC [sanitary conditions (SC) times AA P le
010]
For ADFI an interaction was present for SC times AA in the starter phase (P le 001) and over the
complete fattening period (P le 005 Fig 21A) but not in the grower phase (P gt 010) The
AA-B pigs had (54 gd in the starter phase and 69 gd over the complete fattening period)
lower ADFI compared with AA-S pigs when kept under HSC but not under LSC The GF was
(0035 gg) lower for pigs kept under LSC compared with HSC for the starter phase (P le
Chapter 2
38
001) and (0013 gg) for the entire growerndashfinisher period (P le 001) but not for the grower
phase (P gt 010)
The GF was 0038 gg lower for LP pigs compared with NP pigs in all phases (all P le 001)
The AA-B pigs had a (0008 gg) lower GF compared with AA-S pigs in the entire growerndash
finisher period (P le 001) but not for the grower phase (P gt 010) The GF was 0038 gg
lower for LP pigs compared with NP pigs in all phases (all P le 001) The AA-B pigs had a
(0008 gg) lower GF compared with AA-S pigs in the entire growerndashfinisher period (P le
001) The greater GF for AA-B pigs compared with AA-S pigs for the entire experimental
period was (0025 gg) greater for LSC pigs compared with HSC pigs (SC times AA P le 005 Fig
21B) A tendency for a similar interaction was found for the GF in the grower phase (P le
010)
Acute-Phase Proteins and Natural Antibodies against Keyhole Limpet Hemocyanin in Serum
In LSC pigs but not HSC pigs reduction of dietary CP concentration reduced serum
haptoglobin by 024 gL (CP times SC P le 001 Table 25 Fig 21I) The LSC pigs showed lower
haptoglobin concentrations over time whereas HSC pigs had lower concentrations during
the grower phase compared with the starter phase and showed greater concentrations
again in finisher phase (SC times phase P le 005 Fig 21E) The LSC pigs had (029 gL) greater
serum haptoglobin concentrations compared with the HSC pigs (P le 001) The LSC pigs had
(003 gL) lower PigMAP concentrations in the grower phase compared with the starter
phase and (009 gL) greater concentrations again in the finisher phase compared with the
grower phase whereas the HSC pigs had (009 gL) lower concentrations in the grower
phase compared with the starter phase (SC times phase P le 005 Fig 21F) Keyhole limpet
hemocyaninndashspecific IgM antibody titers in serum tended to be (004) lower for AA-Sndashfed
pigs compared with AA-Bndashfed pigs (P le 010) Keyhole limpet hemocyaninndashspecific IgG
antibody titers were (045) greater for LSC pigs compared with HSC pigs (P le 005)
Blood Cell Counts The number of white blood cells (WBC) was (18 times 109L) greater (Table
26) in AA-Sndashfed pigs compared with AA-Bndashfed pigs when kept under LSC but not under HSC
(SC times AA P le 005 Fig 21C) Over time the concentration of WBC in pigs decreased (by 41
times 109L) but the number of red blood cells consistently increased (with 05 times 1012L) in all
treatment groups (P le 001) Pigs fed the NP had a (31) lower number of WBC compared
with pigs fed the LP (P le 005) Hemoglobin concentration was (01 mmolL) lower in AA-Sndash
fed pigs compared with AA-Bndashfed pigs particularly under HSC (SC times AA P le 005 and P le
005 for AA) Hemoglobin concentrations increased with age in all treatment groups (074
mmolL) however this increase was greater in HSC pigs compared with LSC pigs (SC times
phase P le 005) Pigs fed NP had a (01 mmolL) greater hemoglobin concentration than
pigs fed LP (P le 005) Mean cell volume was (07 times 1015L) greater for AA-Sndashfed pigs
compared with AA-Bndashfed pigs in LSC but this was reversed in HSC (SC times AA P le 001 Fig
21D) The mean cell volume was (04 times 1015L) greater in pigs fed NP compared with pigs
Chapter 2
39
fed LP (P le 005) The number of platelets decreased (by 258 times 109L) in pigs over time for
all treatments but the decrease was (60) greater in HSC pigs compared with LSC pigs
(interaction P le 005) The concentration of platelets in pigs fed AA-S diets was (121 times
109L) greater compared with pigs fed AA-B diets (P le 001)
Figure 21 Interactions between low sanitary condition (LSC) and high sanitary condition (HSC) pigs and a basal dietary AA profile (AA-B) or a supplemented dietary AA profile containing 20 more Met Thr and Trp compared with the basal profile (AA-S) for ADFI (A) GF (B) white blood cell (WBC) number (C) and mean cell volume (MCV D) SC = sanitary conditions Interactions between LSC and HSC pigs and phase (Ph) for serum haptoglobin concentration (E) serum PigMAP concentration (F) plasma granulocyte number (G) and plasma monocyte number (H) Interaction between LSC and HSC pigs and a low CP concentration diet (LP) or a normal CP concentration diet (NP) for serum haptoglobin concentration (I) The open bars represent the LSC treatment and the filled bars represent the HSC treatment Bars represent least squares means plusmn SEM P-values were considered significant when P le 005
20
21
22
23
24
25
26
AA-B AA-S
WB
C p
lasm
a co
nce
ntr
atio
n 1
09L
04
05
AA-B AA-S
GF
kg
kg
SC times AA P = 003SC P = 0002AA P = 001
50
55
60
AA-B AA-S
MC
V in
pla
sma
SC times AA P = 004
SC times AA P lt0001
00
03
06
09
12
15
LP NP
Hap
togl
ob
in s
eru
m
con
cen
trat
ion
gL
ser
um
00
03
06
09
12
15
starter grower finisher
Hap
togl
ob
in in
gL
ser
um
SC times Ph P = 0019SC P = 0004
15
20
25
AA-B AA-S
AD
FI k
g (
pig
bull d
)
SC times AA P = 004
00
03
starter grower finisher
PigM
AP
in s
eru
m g
L
SC times Ph P = 0038
000
005
010
starter grower finisher
Gra
nu
locy
te p
lasm
a co
nce
ntr
atio
n 1
09L
SC times Ph P = 0014 SC P = 0007 Ph P = 0007
5
10
15
starter grower finisher
Mo
no
cyte
co
nce
ntr
atio
n
in p
lasm
a 10
9L
SC times Ph P = 0005 Ph P lt0001
SC times CP P = 001 SC P = 0004
Table 25 Concentrations of acute-phase protein and natural antibody titres against keyhole limpet hemocyanin (KLH) in serum of pigs kept under different sanitary conditions and fed 1 of 4 diets with a low or normal protein level and a basal or supplemented AA profile (bold P-values are significant and underlined P-values are considered as tendency)
1The experiment consisted of different phases starter grower and finisher 2LSC = low sanitary conditions HSC = high sanitary conditions 3LP = low CP concentration diet NP = normal CP concentration diet 4AA-B = basal dietary AA profile AA-S = supplemented dietary AA profile containing 20 more Met Thr and Trp compared with the basal profile 5SEM= pooled SEM Means are presented as least square means 6 SC = sanitary conditions Considered significant when P le 005 considered a tendency when 005 lt P le 010 7
All animals were group housed in pens with 9 animals per pen Two animals per pen were selected for blood sampling 8 Keyhole limpet hemocyanin is a protein produced by a sea snail Pigs have natural antibodies against this protein
LSC2 HSC2
LP2 NP2 LP NP P-values6
Item Phase1 AA-B4 AA-S4 AA-B AA-S AA-B AA-S AA-B AA-S SEM5 SC CP AA SCtimesPh7 SCtimesCP SCtimesAA CPtimesAA SCtimesCPtimesAA
Noof pens7 9 9 9 9 8 8 8 8
Haptoglobin Starter 115 075 136 137 091 079 086 098 016 0004 025 091 002 001 042 012 074 gL Grower 097 097 121 111 063 047 046 062
Finisher 083 073 085 095 085 095 058 069
PigMAP Starter 017 014 014 025 018 016 019 021 003 025 019 055 004 099 035 022 039
gL Grower 007 008 010 012 008 009 011 009
Finisher 019 019 016 017 011 010 009 011
KLH8-IgM Starter 659 629 668 660 640 678 659 642 020 068 047 007 032 092 032 047 020
Grower 750 727 747 709 706 703 731 699
Finisher 785 746 780 769 778 765 790 784
KLH-IgG7 starter 312 330 308 297 278 246 247 302 028 004 075 062 009 042 087 081 008
grower 364 413 367 375 310 298 315 299
finisher 362 370 382 352 346 359 336 359
Chapter 2
41
White blood cell distribution The AA-Sndashfed pigs had (07 times 109L) a greater number of blood
lymphocytes compared with AA-Bndash fed pigs when provided a LP but this was reversed
(minus05 times 109L) when pigs were provided a NP (CP times AA P le 005) The number of
lymphocytes increased (09 times 109L) with age for all treatment groups (P le 001) The
number of monocytes (29 times 109L) decreased over time for all treatment groups
particularly for LSC pigs (SC times phase P le 001 Fig 21H) The AA-Sndashfed pigs had a (06 times
109L) greater monocyte number compared with AA-Bndashfed pigs (P le 005) The NP-fed pigs
had a (08 times 109L) lower monocytes number compared with LP-fed pigs (P le 005) The
concentration of granulocytes increased (by 001 times 109L) over time for LSC pigs and in the
HSC pigs increased (002 times 109L) from the starter to the grower phases but decreased
(003 times 109L) again in the finisher phase (SC times phase P le 005 Fig 21G) The
concentration of granulocytes was (001 times 109L) greater for HSC pigs than for LSC pigs (P le
001)
Carcass observations at slaughter and lung scores Results obtained at slaughter are
presented in Table 27 Carcass weight was (38 kg) lower for LP pigs compared with NP pigs
but not dressing percentage (P le 001 and P gt 005 respectively) The LP pigs had (12 mm)
greater backfat thickness (P le 001) and (08) lower lean meat percentage (P le 001)
compared with NP pigs The AA-B pigs had (15 mm) lower muscle thickness (P le 001 05
mm) greater backfat thickness (P le 001) and a (04) lower lean meat percentage (P le
001) compared with AA-S pigs Pleuritis scores were (03) greater for LSC pigs compared
with HSC pigs (P le 001) Percentage of lung surface with pleuritis was also (12) greater
for LSC pigs compared with HSC pigs (P le 001) The AA-B pigs had a (1) greater
percentage of lung surface with pleuritis compared with AA-S pigs when kept in LSC but for
HSC pigs this was reversed (SC times AA P le 005) The LP pigs had (02) greater pneumonia
scores compared with NP pigs when kept under HSC however when kept under LSC this
was reversed (SC times CP P le 005) The AA-B pigs tended to have greater pneumonia scores
compared with the AA-S pigs in all cases except in LSC pigs fed a LP (CP times AA P le 001)
Dry matter and N digestion The effect of experimental treatments on the ATTD of DM and
N were consistent over the duration of the experiment and are presented averaged over all
phases (Table 28) In general treatment differences albeit significant were small
Apparent total tract digestibility for DM was (03) lower for LSC pigs compared with HSC
pigs during all phases (all P le 005) The AA-B pigs had (04) lower ATTD of DM compared
with AA-S pigs (P le 001) Apparent total tract digestibility for N was (098) greater for HSC
pigs compared with LSC pigs during all phases (all P le 001) regardless the dietary CP
content or AA profile Apparent total tract digestibility for N increased from 806 (starter
phase) to 839 (grower phase) and 847 finisher phase (P le 001) There were no
interactions between phase and other independent variables
Table 26 Cell count in fresh blood of pigs kept under different sanitary conditions and fed one of four diets with a low or normal protein level and a basal or supplemented AA profile (bold P-values are significant and underlined P-values are considered as tendency) LSC2 HSC2
LP3 NP3 LP NP P-values6
Item1 Phase AA-B3 AA-S3 AA-B AA-S AA-B AA-S AA-B AA-S SEM5 SC CP AA phase SCtimesPh SCtimesCP SCtimesAA CPtimesAA SCtimesCPtimesAA
No of pens7
9 9 9 9 8 8 8 8
WBC 109L Starter 243 266 208 250 260 250 251 234 13 089 002 015 lt0001 008 060 004 018 046
Grower 227 249 225 220 219 227 213 199
Finisher 194 212 195 200 196 214 214 208
Lymphocytes 109L Starter 107 113 94 103 110 113 112 104 07 043 010 069 0005 088 013 005 002 030
Grower 110 119 109 108 114 118 117 109
Finisher 112 125 112 111 111 116 132 109
Monocytes 109L Starter 136 153 113 148 150 139 139 130 09 034 001 005 lt0001 0005 055 013 069 056
Grower 117 131 116 113 104 108 95 88
Finisher 81 87 84 89 82 97 81 91
Granulocytes 109L Starter 002 001 001 003 002 003 004 003 00 0007 027 088 0007 001 039 061 074 010
Grower 002 002 001 003 005 007 005 004
Finisher 004 002 002 002 004 003 001 001
RBC 1012L Starter 57 56 56 55 54 60 55 54 01 083 083 095 lt0001 030 095 008 044 036
Grower 59 58 59 56 57 60 59 58
Finisher 60 59 60 61 61 61 60 63
Hb mmolL Starter 64 63 65 64 63 63 65 60 01 013 001 003 lt0001 005 062 005 018 007
Grower 66 66 68 66 68 67 72 67
Finisher 68 69 69 73 72 70 73 72
Ht Starter 478 309 314 309 303 310 310 293 37 049 045 028 064 023 041 040 048 029
Grower 316 316 323 312 319 323 330 316
Finisher 329 329 334 343 340 335 343 345
MCV 10-15L Starter 548 551 558 561 560 544 560 541 059 048 004 006 013 024 031 lt0001 052 095
Grower 540 547 548 553 560 543 564 549
Finisher 545 560 552 560 562 550 567 550
PTL 109 L
Starter 614 712 562 721 571 703 744 1219 948 092 023 0002 lt0001 002 014 046 060 078
Grower 522 606 520 652 438 551 439 559
Finisher 489 555 480 494 405 508 447 401
1 WBC = white blood cells RBC = red blood cells Hb = haemoglobin Ht = Haematocrit MCV = mean cell volume PTL = platelets 2 LSC = low sanitary status HSC = high sanitary status 3 LP = low CP concentration diet NP = normal CP concentration diet4 AA-B= basal dietary AA profile AA-S = supplemented dietary AA profile containing 20 more Met Thr and Trp compared with the basal profile 5SEM = pooled SEM Means are presented as least square means 6 SC=sanitary conditions Considered significant when 1 WBC = white blood cells RBC = red blood cells Hb = haemoglobin Ht = Haematocrit MCV = mean cell volume PTL = platelets 2 LSC = low sanitary status HSC = high sanitary status 3 LP = low CP concentration diet NP = normal CP concentration diet4 AA-B= basal dietary AA profile AA-S = supplemented dietary AA profile containing 20 more Met Thr and Trp compared with the basal profile 5SEM = pooled SEM Means are presented as least square means 6 SC=sanitary conditions Considered significant when P le 005 and considered a tendency when 005 lt P le 010 7All animals were group housed in pens with 9 animals in total Two animals per pen were selected for blood sampling
Chapter 2
44
Oral fluid samples Oral fluid samples of pigs in all sampled pens (18 pens in total) were
positive for M hyorhinis and negative for PRRS M hyopneumoniae influenza A virus and
porcine cytomegalo virus in all phases All pens were negative for porcine respiratory
corona virus in the starter and grower phases but in the finisher phase 4 out of 9 LSC pens
and 3 out of 9 HSC pens became positive All pens were negative for PCV2 in the starter
phase but LSC pigs became positive in grower phase (7 out of 9 pens) and finisher phase
(all 9 pens) Only 1 out of 9 HSC pens became positive for PCV2 in the grower phase and
was negative again in the finisher phase The rest of the sampled HSC pigs were negative
for PCV2 in all phases
Table 27 Slaughter results of fattening boars kept under different sanitary conditions and fed diets with 2 CP levels and 2 AA profiles (bold P-values are significant and underlined P-values are considered as tendency)
1LSC = low sanitary conditions HSC = high sanitary conditions 2LP= low CP concentration diet NP = normal CP concentration diet 3AA-B = basal dietary AA profile AA-S = supplemented dietary AA profile containing 20 more Met Thr and Trp compared with the basal profile 4SEM= pooled SEM means are presented as least square means 5SC = sanitary conditions Considered significant when P le 005 and considered as tendency when 005 lt P le 010 6A pen contained 9 pigs 7 Body weight expressed 1 d before slaughter day muscle backfat and lean meat expressed as corrected for carcass weight by including carcass weight as a covariate in the statistical model 8Pleurits was scored on a scale of 0 to 2 and pneumonia was scored on a scale of 0 to 3
LSC1 HSC1 P-values5
LP2 NP2 LP NP
Item AA-B3 AA-S3 AA-B AA-S AA-B AA-S AA-B AA-S SEM4 SC CP AA SCtimesCP SCtimesAA CPtimesAA SCtimesCPtimesAA
No of pens6 9 9 9 9
8 8 8 8
BW in kg7 1097 1080 1128 1143
1081 1119
1131 1163 185 040 00007 020 098 017 062 048
Carcass weight kg 847 823
864 882
820 857
863 888 155 078 0001 020 095 012 049 023
Muscle mm7 554 556
553 591
553 566
558 566 090 078 012 0008 019 042 018 007
Backfat mm7 153 139
133 129
147 143
134 137 033 045 lt0001 0047 025 007 008 088
Lean meat 7 581 589
593 597
584 587
592 591 023 053 lt0001 003 026 011 013 090
Dressing 771 762
766 772
759 766
763 764 035 018 051 063 073 025 032 002
Pleuritis score8 044 050
059 043
015 021
012 033 008 lt0001 043 051 096 010 087 009
Pleuritis lung 9 182 126
255 104
039 096
006 036 060 0004 039 077 083 049 066 058
Pneumonia score8 053 065
079 074
094 080
086 057 015 032 065 033 002 007 016 083
Pneumonia lung 9 142 126 317 214 181 193 248 070 140 078 022 015 012 027 016 046
Table 28 Apparent fecal digestibility () of DM and N in fattening boars kept under different sanitary conditions and fed 1 of 4 experimental diets with either a low or normal protein level and a basal or supplemented AA profile (bold P-values are significant)
1LSC = low sanitary conditions HSC = high sanitary conditions 2LP = low CP concentration diet NP = normal CP concentration diet 3AA-B = basal dietary AA profile AA-S = supplemented dietary AA profile containing 20 more Met Thr and Trp compared with the basal profile 4SEM = pooled SEM Means are presented as least square means 5 SC = sanitary conditions Considered significant when P le 005 6Results are presented as average values of measurement of digestibility at 3time points once in each of the 3 experimental phases 7A pen contained 9 pigs
LSC1 HSC1
LP2 NP2 LP NP P-values5
Item AA-B3 AA-S3 AA-B AA-S
AA-B AA-S
AA-B AA-S SEM4 SC CP AA Ph6 SCtimesCP SCtimesAA CPtimesAA SCtimesCPtimesAA
No of pens7 4 4
4 4
4 4
4 4
DM 881 885
879 886
888 889
883 885 016 005 010 003 lt0001 021 019 051 070
N 823 821 829 831
836 834
842 831 043 002 014 028 lt0001 031 030 062 031
Chapter 2
47
DISCUSSION
The main objective of the present experiment was to evaluate under practical conditions if
diets with low or normal CP level and basal or supplemented Met Thr and Trp have
differential effects on pig performance and immune status at different sanitary conditions
Effect of sanitary conditions on performance and immune status A contrast in sanitary
conditions was generated by imposing a combination of differences in hygiene antibiotic
treatment deworming and a vaccination protocol all applied to piglets originating from
the same farm Over the duration of the experiment HSC pigs showed greater ADG (50 gd)
and GF (0013 kgkg) than LSC pigs Low sanitary condition pigs had greater serum
haptoglobin levels and greater KLHndashIgG titers than HSC pigs This indicates that LSC pigs had
a more active immune system compared with HSC pigs In addition at slaughter higher
pleuritis scores were observed in LSC pigs compared with HSC pigs Taken together the
absence of clinical signs of illness of pigs in either treatment group and the lower ADG and
GF elevated haptoglobin concentrations increased KLH-specific IgG titers greater pleuritis
occurrence and oral fluid samples positive for PCV2 in the grower and finisher phases in
the LSC groups illustrate a difference in subclinical health status between the LSC and HSC
pigs (Le Flocrsquoh et al 2006 van den Berg et al 2007 Pintildeeiro et al 2009) We expected that
the sanitary regimes used in our study would affect PigMAP and haptoglobin
concentrations in a similar way as these are both considered to be positive acute-phase
proteins and are expected to increase in response to immune stimulation (Murata et al
2004) Haptoglobin appeared more responsive to the difference in sanitary conditions than
PigMAP which is in line with Heegaard et al (1998) and Kampman-van de Hoek et al
(2016) In addition PigMAP levels found here (014 gL serum) were low compared with the
values found by Pintildeeiro et al (2009) and Kampman-van de Hoek et al (2016 09 and 14
gL serum respectively) whereas the haptoglobin concentrations reported by these
authors were similar to values reported in the present study
The KLH antigen is a relevant antigen to measure Nab levels as pigs had no previous
exposure to KLH Natural antibodies are defined as antigen-specific antibodies that are
present in the absence of intentional immunization with specific antigens (KLH in this case
Star et al 2007) The IgG titer against KLH was greater for LSC pigs than for HSC pigs
Because Nab play a role in the first line of defense against pathogens the increase in Nab
levels might be an adaptive response of the pigs to the higher infection pressure at LSC
Keyhole limpet hemocyaninndashspecific antibodies were shown to be cross-reactive with
antigens of pathogens (Hamilton et al 1999) Therefore it can not be excluded that
antigen specific Nab are products of adaptive immune responses and cross-reactive with
structurally related antigens Specific memory B cells were shown to be activated in a
polyclonal but antigen-independent way (Lanzavecchia et al 2006) This way of activation
Chapter 2
48
is triggered by nonspecific microbial-associated molecular patterns such as
lipopolysaccharide or bacterial or viral nucleotide motifs This B cell activation mechanism is
likely responsible for the lifelong presence of circulating specific antibodies which forms an
important part of the first line of defense It can easily be envisaged that memory B cells of
pigs under LSC become more activated by microbial associated molecular patterns than
under HSC resulting in higher levels of KLH-specific IgG levels For IgM titers against KLH
there were no differences between LSC and HSC pigs In the study of Ploegaert et al
(2010) a similar result in IgM and IgG Nab was found Ploegaert et al (2010) studied
genetic and phenotypic correlation of Nab titers in dairy cattle and found greater estimates
for environmental variation in the IgG than in the IgM isotype of Nab Most probably the
LSC in the present study as an environmental factor stimulated KLH-specific IgG responses
Immunoglobulin M titers are believed to be influenced by genetic factors (Ploegaert et al
2010) which explains the absence of differences in IgM against KLH between sanitary
regimes
As the HSC pigs were vaccinated against several pathogens in their first 10 wk of life
vaccination and or antibiotic treatment might have modulated immune functions of these
animals Our results show that despite the vaccination of the HSC pigs LSC pigs had
significantly higher values for haptoglobin and IgG antibodies against KLH showed reduced
ADG and GF and had significant higher pleuritis scores indicating that the effects of the
LSC conditions outweighed the potential effects of the vaccinations or antibiotic treatment
of the HSC pigs However the vaccinations of the HSC pigs may have reduced the
immunological contrasts between the pigs kept under the different sanitary conditions If
this is the case the observed interactions between diet and sanitary conditions could even
be larger when vaccinations are omitted In addition vaccinations or antibiotic treatment
may have affected other (undetermined) immune parameters as well
Sanitary conditions and growth performance At start of the experiment the BW of LSC pigs
was 11 kg greater compared with that of HSC pigs likely related to the vaccination
program of the HSC pigs prior to arrival at the experimental farm During the starter phase
HSC pigs compensated for this lower starting weight or the ADG of the LSC pigs was
negatively influenced by the LSC
A lower ADG of LSC pigs was also found in other studies evaluating a contrast in sanitary
conditions (Williams et al 1997 Le Flocrsquoh et al 2009 Pastorelli et al 2012a) This
decreased ADG can be explained by the competition for use of nutrients between the
immune system and for use in deposition in organs and body tissues In general it is
perceived that use by the immune system has a high priority (Humphrey and Klasing 2004
Le Flocrsquoh et al 2004) From a meta-analysis Pastorelli et al (2012b) concluded that
themajor portion of the reduction in ADG (122 lower ADG of the total 163 lower ADG
in pigs in poor housing conditions compared with unchallenged animals) was related to a
Chapter 2
49
decreased feed efficiency (in Pastorelli et al (2012b) indicated as ldquomaintenancerdquo) rather
than to a decrease in feed intake This was also observed in the present experiment where
GF was affected but ADFI was not influenced by sanitary conditions The former indicates a
greater maintenance requirement or a lower growth efficiency for LSC pigs as suggested by
Pastorelli et al (2012b)
Signs of respiratory problems such as pleuritis or pneumonia are related to reduced
performance (Saco et al 2011) The LSC pigs had greater scores for pleuritis and greater
percentage of lung surface with pleuritis at slaughter compared with HSC pigs which might
have negatively affected growth and GF of LSC pigs From the meta-analysis of Pastorelli et
al (2012b) it appeared that a reduction in ADFI is the major contributor to reduced ADG in
case of respiratory problems In contrast in our study ADFI is not the major contributor to
reduced ADG indicating that respiratory problems are likely not the cause of the decrease
in GF in LSC pigs or that conclusions about the respiratory problems drawn by Pastorelli et
al (2012b) are not representative for our study Pastorelli et al (2012b) used many
different challenge studies for the meta-analysis differing from studies conducted under
more practical conditions such as the present study
The greater GF of the HSC pigs might partly be due to a greater apparent total N digestion
in these animals compared with LSC pigs When assuming similar postabsorptive
efficiencies for absorbed AA the observed increase in N digestibility would typically explain
approximately 20 of the observed increase in ADG hence leaving 80 unaccounted for
Differences in ATTD for N correspond with results by Kampman-van de Hoek et al (2016)
who found a reduction in ATTD for N of 37 in LSC growing pigs compared with HSC pigs
(P le 001) The reduced ATTD for N might be due to intestinal infections intestinal damage
or an increased digesta passage rate (Sandberg et al 2006 Pastorelli et al 2012b) The
small difference found in ATTD of DM might suggest that the ATTD of GE also differed to a
similar extent
Greater ADG and GF were expected for NP-fed pigs compared with the LP-fed pigs It is
well known that additional AA under conditions where AA are limiting but sufficient energy
is available lead to greater ADG and improved GF (Noblet et al 1987) Supplementation of
extra AA by increase in dietary CP (LP vs NP) or by specifically supplementing Met Thr and
Trp (AA-B vs AA-S diet type) resulted in increased ADG suggesting that one of these AA
was limiting The increased GF in AA-S pigs vs AA-B pigs particularly in LSC pigs (SC times AA
interaction Fig 21B) confirms our hypothesis that the dietary AA-S profile better matches
the AA requirements of pigs under LSC It should be noted however that this effect was
not yet present in the starter phase Our results are in accordance with other studies that
show that immune stimulation by different challenges lead to increased requirements for
specific AA compared with unchallenged pigs (Grimble and Grimble 1998 Le Flocrsquoh et al
2004 Klasing 2007 Rakhshandeh et al 2014) As a consequence these animals require
more AA for their immune system The increased demand for these AA (Met Thr and Trp)
Chapter 2
50
for LSC pigs was expected to be greater for pigs fed the LP This interaction however was
absent Therefore the results of our study do not confirm our hypothesis that at low levels
of protein intake the requirements for Thr Trp and Met relative to Lys are increased As
illustrated by the meta-analysis by Pastorelli et al (2012b) the type of challenge has a
major impact on the response of pigs The contrast in sanitary conditions as applied in our
study illustrates that also in absence of clinical disease requirements for Met Thr and Trp
are persistently affected over the entire weight range This is in agreement with
observations by Kim et al (2012) for Met using a repeated LPS model but not in a study by
de Ridder et al (2012) for Trp also using a repeated LPS model in which the response to
incremental intake of Trp was demonstrated to be transient Dietary protein concentration
did not affect ADFI in our study Apparently the exchange of protein for starch did not
affect the satiating potential of the diets This is in agreement with Le Bellego and Noblet
(2002) and Kerr et al (2003) however research in humans has indicated satiating effects
of dietary proteins to exceed that of carbohydrates and fats (Andersen and Moore 2004)
A remarkable result is the interaction between SC and AA profile in ADFI particularly
observed during the starter phase High sanitary condition AA-S pigs had greater ADFI
compared with HSC AA-B pigs whereas pigs in LSC ate the same amount regardless of AA
supplementation The greater ADFI for HSC AA-S pigs resulted in a tendency for ADG in the
same direction as the change in ADFI This result illustrates that pigs in HSC were probably
more limited in their growth by the AA-B profile than LSC pigs receiving the same profile
which was expected to be the other way around due to the effect of immune stimulation of
pigs housed in LSC We speculate that 1 of the 3 supplemented AA probably Met has
restricted growth particularly inhibiting HSC pigs to exploit their full ADG potential
following a period of restricted growth before the start of the trial Methionine is thought
to be the limiting AA because the MetLys ratio deviates most from recommended values
(eg CVB 2011) compared with Thr and Trp The growth restriction in HSC pigs before the
start of the trial was possibly caused by the vaccination strategy and illustrated by a lower
BW of HSC pigs at the onset of the trial The AA profile of the basal diets may not have been
sufficient to support compensatory growth following a period of growth restriction
Dietary protein effect on immune status Increasing the dietary protein concentration
increased serum haptoglobin concentrations in LSC pigs but not in HSC pigs The effect of
protein scarcity on total serum protein concentrations has been demonstrated in mice
(Cooper et al 1974) Houdijk et al (2007) found a reduced C-reactive protein and
haptoglobin response for infected pigs fed a low protein diet This may reflect a sensitive
response of acute-phase proteins to protein scarcity (Houdijk et al 2007) or a high priority
for the use of AA for protein gain in young pigs occurring at the expense of the synthesis of
haptoglobin It is unexpected that this interaction was not observed for WBC counts which
were consistently higher for LP pigs compared with NP pigs (P = 002) being unaffected by
Chapter 2
51
SC Possible differences in migration of WBC into the lymphatic system or tissues
complicates clear conclusions on this point (Ganusov and Auerbach 2014 Marelli-Berg et
al 2010)
Dietary AA effect on immune status Supplementation of AA in diets has been shown to
influence the immune system by increased variation of lymphocytes increased production
of antibodies and cytokines and activation of lymphocytes natural killer cells and
macrophages (Daly et al 1990 Li et al 2007 Negro et al 2008) Although increasing the
dietary protein concentration reduced monocyte counts supplementation of Met Thr and
Trp increased monocyte counts regardless of SC Elevated levels of Trp in the AA-Sndashfed pigs
might have stimulated production of monocytes as Trp is known to play a role in
functionality of monocytes and lymphocytes (Melchior et al 2004) The administration of
300 mg Trp to rats increased monocyte phagocytosis and the innate immune response
(Esteban et al 2004) Overall there was no clear interaction for sanitary conditions and AA
profile present on the measured blood parameters
In summary poor sanitary conditions imposed in our study in a practical setting reduced
ADG over the entire BW range of 17 to 110 kg Low sanitary conditions increased pleuritis
scores at slaughter and increased indicators for the innate immune response and serum
haptoglobin concentrations The vaccination strategy for the HSC pigs in early life may have
triggered a compensatory performance response (particularly ADFI) during the starter
phase Dietary supplementation of Met Thr and Trp improved the GF particularly under
LSC illustrating that dietary requirements for these AA are affected by sanitary conditions
Furthermore this study provides indications that dietary protein concentration and Met
Thr and Trp supplementation modify immune status Our study suggests that dietary
supplementation of Met Thr andor Trp in addition to provision of AA for covering basal
requirements for protein deposition is beneficial for animal performance particularly
under poor sanitary conditions Further research should focus on defining determinants of
sanitary status and identification of the requirement of individual AA to be supplemented
Acknowledgements Funding through Dutch Feed4Foodure consortium is gratefully
acknowledged The authors thank H van Diepen and J Kuipers for their advice and support
on formulation of the experimental diets The authors thank F van den Berg the staff of
Compaxo Zevenaar BV G de Vries Reilingh and the staff of Wageningen UR Livestock
Research for their contributions
Chapter 2
52
REFERENCES Andersen G H and S E Moore 2004 Dietary proteins in the regulation of food intake and body weight in humans J Nut
134974S-979S Batterham E S L M Andersen D R Baigent and E White 1990 Utilization of ileal digestible amino acids by growing pigs effect
of dietary lysine concentration on efficiency of lysine retention Br J Nutr 6481-94 Bikker P M W A Verstegen and M W Bosch 1994 Amino acid composition of growing pigs is affected by protein and energy
intake J Nutr 1241961-1969 Burke KA RF Nystrom and B C Johnson 1951 The role of methionine as methyl donor for choline synthesis in the chick J Bio
Chem188723-728 Cooper W C R A Good and T Mariani 1974 Effects of protein insufficiency on immune responsiveness Am J Clin Nutr 27647-
664 Centraal Veevoeder Bureau (CVB) 2011 Chemical compositions and nutritional values of feed ingredients CVB Lelystad The
Netherlands Daly J M J Reynolds R K Sigal J Shou and M D Liberman 1990 Effect of dietary protein and amino acids on immune
function Crit Care Med 18S85-S94 de Koning D B E P C W Damen M G B Nieuwland E M van Grevenhof W Hazeleger B Kemp and H K Parmentier 2015
Association of natural (auto-) antibodies in young gilts with osteochondrosis at slaughter Livest Sci 176152-160 de Ridder K C L Levesque J K Htoo and C F M de Lange 2012 Immune system stimulation reduces the efficiency of
tryptophan utilization for body protein deposition in growing pigs J Anim Sci 903485-3491 Engel B E Lambooij WG Buist and P Vereijken 2012 Lean meat prediction with HGP CGM CSB-Image-Meater with
prediction accuracy evaluated for different proportions of gilts boars and castrated boars in the pig population Meat Sci 90338-344
Esteban S C Nicolaus A Garmundi R Rial A Rodriacuteguez E Ortega and C Ibars 2004 Effect of orally administered l-tryptophan on serotonin melatonin and the innate immune response in the rat Mol Cell Biochem 26739-46
Figueroa J L AJ Lewis P S Miller R L Fischer R S Goacutemez and R M Diedrichsen 2002 Nitrogen metabolism and growth performance of gilts fed standard corn-soybean meal diets or low-crude protein amino acid-supplemented diets J Anim Sci 802911-2919
Ganusov VV and JA Auerbach 2014 Mathematical modelling reveals kinetics of lymphocyte recirculation in the whole organism PLOS Comput Biol 10 e1003586
Gloaguen M N Le Flocrsquoh E Corrent Y Primot and J van Milgen 2014 The use of free amino acids allows formulating very low crude protein diets for piglets J Anim Sci 92637-644
Grimble R F and G K Grimble 1998 Immunonutrition role of sulfur amino acids related amino acids and polyamines Nutr 14605-610
Hamilton JV PL Chiodini PG Fallon and MJ Doenhoff 1999 Periodate-sensitive immunological cross-reactivity between keyhole limpet haemocyanin (KLH) and serodiagnostic Schistosoma mansoni egg antigens Parasit 11883-89
Heegaard P M A Stockmarr M Pintildeeiro R Carpintero F Lampreave F M Campbell P D Eckersall M J Toussaint E Gruys and NS Sorensen 2011 Optimal combinations of acute phase proteins for detecting infectious disease in pigs Vet Res 1742-50
Houdijk J G M F M Campbell P D Fortomaris P D Eckersall and I Kyriazakis 2007 Effects of sub‐clinical post‐weaning colibacillosis and dietary protein on acute phase proteins in weaner pigs Livest Sci 108 182-185
Humphrey B D and K C Klasing 2004 Modulation of nutrient metabolism and homeostasis by the immune system Worlds Poult Sci J 6090-100
International organisation for standardisation (ISO) 1999 Animal feeding stuff-Determination of moisture and other volatile matter content ISO 6496 Int Organ Stand Geneve Switzerland
International Organization for Standardization (ISO) 2005a Animal feeding stuffs ndash Determination of nitrogen content and calculation of crude protein content ndash Part 1 Kjeldahl method ISO 5983 Int Organ Stand Geneve Switzerland
International Organization for Standardization (ISO) 2005b Animal feeding stuffs ndash Determination of amino acids content ISO 13903 Int Organ Stand Geneve Switzerland
International Organization for Standardization (ISO) 2005c Animal feeding stuffs ndash Determination of tryptophan content ISO 13903 Organ Stand Geneve Switzerland
Jansman A J M W Smink P van Leeuwen and M Rademacher 2002 Evaluation through literature data of the amount and amino acid composition of basal endogenous crude protein at the terminal ileum of pigs Anim Feed Sci Tech 9849-60
Jansman A J M J T M van Diepen and D Melchior 2010 The effect of diet composition on tryptophan requirement of young piglets J Anim Sci 881017-1027
Kampman-van de Hoek E P Sakkas W J J Gerrits J J G van den Borne AJM Jansman 2015 Induced lung inflammation and dietary protein supply affect nitrogen retention and amino acid metabolism in growing pigs Br J Nutr 113414-425
Kampman-van de Hoek E A J M Jansman J J G C van den Borne C M C van der Peet-Schwering H van Beers-Schreurs and W J J Gerrits 2016 Dietary amino acid deficiency reduces the utilization of amino acids for growth in growing pigs after a period of poor health J Nutr 14651-58
Kerr B J and R A Easter 1995 Effect of feeding reduced protein amino acid-supplemented diets on nitrogen and energy balance in grower pigs J Anim Sci733000-3008
Chapter 2
53
Kerr B J L L Southern T D Bidner K G Friesen and R A Easter 2003 Influence of dietary protein level amino acid supplementation and dietary energy levels on growing-finishing pig performance and carcass composition J Anim Sci 813075-3087
Kim J C B P Mullan B Frey H G Payne and J R Pluske 2012 Whole body protein depositions and plasma amino acid profiles in growing andor finishing pigs fed increasing levels of sulfur amino acids with and without Escherichia coli lipopolysaccharide challenge J Anim Sci 90362-365
Klasing K C 2007 Nutrition and the immune system Brit Poult Sci 48525-537 Klasing K C and B J Johnstone 1991 Monokines in growth and development Poultry Sci 701781-1789 Knowles T A L L
Southern and T D Bidner 1998 Ratio of total sulfur amino acids to lysine for finishing pigs J Anim Sci 761081-1090 Kotb A R and T D Luckey 1972 Markers in nutrition Nutr Abs Rev 42813-845 Lanzavecchia A N Bernasconi E Traggiai CR Ruprecht D Corti and F Sallusto 2006 Understanding and making use of human
memory cells Immunol Rev 211 303-309 Le Bellego L and J Noblet 2002 Performance and utilization of dietary energy and amino acids in piglets fed low protein diets
Livest Prod Sci 7645-58 Le Floch N F Gondret J J Matte and H Quesnel 2012 Towards amino acid recommendations for specific physiological and
patho-physiological states in pigs Proc Nutr Soc 71425-432 Le Floch N C Jondreville J J Matte and B Seve 2006 Importance of sanitary environment for growth performance and plasma
nutrient homeostasis during the post-weaning period in piglets Arch Anim Nutr 6023-34 Le Floch N D Melchior and C Obled 2004 Modifications of protein and amino acid metabolism during inflammation and
immune system activation Livest Prod Sci 8737-45 Le Flocrsquoh N L Le Bellego J J Matte D Melchior and B Segraveve 2009 The effect of sanitary status degradation and dietary
tryptophan content on growth rate and tryptophan metabolism in weaning pigs J Anim Sci 871686-1694 Le Flocrsquoh N D Melchior and B Segraveve 2008 Dietary tryptophan helps to preserve tryptophan homeostasis in pigs suffering from
lung inflammation J Anim Sci 863473-3479 Li P Y L Yin D Li S W Kim and G Wu 2007 Amino acids and immune function Br J Nutr 98237-252 Marelli-Berg F M H Fu F Vianello KTokoyoda and A Hamann 2010 Memory T-cell trafficking new directions for busy
commuters Immunol 130158-165 Melchior D B Segraveve and N Le Flocrsquoh 2004 Chronic lung inflammation affects plasma amino acid concentrations in pigs J Anim
Sci 821091-1099 Moughan P J 1998 Protein metabolism in the growing pig In Kyriazakis I Editors A Quantitative Biology of the Pig CABI
Publishing Oxon UK 13 299-331Murata H N Shimada and M Yoshioka 2004 Current research on acute phase proteins in veterinary diagnosis an overview Vet J 16828-40
Myers W D P A Ludden V Nayigihugu and B W Hess 2004 Technical note a procedure for the preparation and quantitative analysis of samples for titanium dioxide J Anim Sci 82(1)179-183
Negro M S Giardina B Marzani and F Marzatico 2008 Branched-chain amino acid supplementation does not enhance athletic performance but affects muscle recovery and the immune system J Sports Med Phys Fitness 48 347
Noblet J Y Henry and S Dubois 1987 Effect of protein and lysine levels in the diet on body gain composition and energy utilization in growing pigs J Anim Sci 65717-726
NRC 2012 Nutritional requirement of swine 11th rev ed Natl Acad Press Washington DC Pastorelli H N Le Floch E merlot M C Meunier-Salauumln J van Milgen and L Montagne 2012a Sanitary housing conditions
modify the performance and behavioural response of weaned pigs to feed- and housing-related stressors Anim 6
1811-1820
Pastorelli H J van Milgen P Lovatto and L Montagne 2012b Meta-analysis of feed intake and growth responses of growing
pigs after a sanitary challenge Anim 6 952-961
Pintildeeiro C M Pintildeeiro J Morales M Andreacutes E Lorenzo M del Pozo M A Alava and F Lampreave 2009 Pig-MAP and haptoglobin concentration reference values in swine from commercial farms Vet J 179 78-84
Ploegaert T C W S Wijga E Tijhaar J J van der Poel T J G M Lam H F J Savelkoul H K Parmentier and J A M van Arendonk 2010 Genetic variation of natural antibodies in milk of Dutch Holstein-Friesian cows J Dairy Sci 935467-5473
Rakhshandeh A J K Htoo and C F M de Lange 2010 Immune system stimulation of growing pigs does not alter apparent ileal amino acid digestibility but reduces the ratio between whole body nitrogen and sulfur retention Livest Sci 13421-23
Rakhshandeh A J K Htoo N Karrow S P Miller and C F M de Lange 2014 Impact of immune system stimulation on the ileal nutrient digestibility and utilisation of methionine plus cysteine intake for whole-body protein deposition in growing pigs Br J Nutr 111101-110
Saco Y L Fraile M Gimeacutenez A Alegre R Loacutepez-Jimenez M Cortey J Segaleacutes and A Bossols 2011 Serum acute phase proteins as biomarkers of pleuritis and cranio-ventral pulmonary consolidation in slaughter-aged pigs Res Vet Sci 9152-57
Sandberg F B G C Emmans and I Kyriazakis 2006 A model for predicting feed intake of growing animals during exposure to pathogens J Anim Sci 841552-1566
Short F J P Gorton J Wiseman and K N Boorman 1996 Determination of titanium dioxide added as an inert marker in chicken digestibility studies Anim Feed Sci Technol 59(4)215-221
Star L M G B Nieuwland B Kemp and H K Parmentier 2007 Effect of single or combined climatic and hygienic stress on natural and specific humoral immune competence in four layer lines Poult Sci 861894-1903
van den Berg A J Danuser J Frey and G Regula 2007 Evaluation of the acute phase protein haptoglobin as an indicator of herd health in slaughter pigs Anim Welfare 16157-159
Chapter 2
54
Watkins LE DJ Jones DH Mowrey DB Anderson and EL Veenhuizen 1990 The effect of various levels of ractopamine hydrochloride on the performance and carcass characteristics of finishing swine J Anim Sci 683588-3595
Williams N H T S Stahly and D R Zimmerman 1997 Effect of level of chronic immune system activation on the growth and dietary lysine needs of pigs fed from 6 to 112 kg J Anim Sci 75 2481-2496
Wu G 2009 Amino acids metabolism functions and nutrition Amino acids 371-17
Chapter 2
55
SUPPLEMENTAL TABLE Supplemental Table I Dietary amino acid profiles relative to lysine on apparent ileal digestible level fed in combination with different dietary protein levels to pigs kept under different sanitary conditions
Amino acid AA-B profile1 AA-S profile1
Lysine 100 100
Methionine + cysteine 51 61
Threonine 59 71
Tryptophan 18 22
Arginine 87 87
Histidine 43 43
Isoleucine 53 53
Leucine 101 101
Phenylalanine 54 54
Valine 69 69 1 AA-B= basal AA profile based on Bikker 1994 Moughan 1998 Jansman et al 2002 NRC 2012 AA-S profile =supplemented profile contains basal profile with 20 extra Met Thr and Trp in ratio to Lys
Chapter 3
A link between damaging behaviour in pigs sanitary
conditions and dietary protein and amino acid supply
Yvonne van der Meer12 Walter JJ Gerrits1 Alfons JM Jansman4 Bas Kemp3 J Elizabeth Bolhuis3
PLoS one 2017 12 (5) e0174688
1Animal Nutrition Group Wageningen University Wageningen 6708 WD The Netherlands 2De Heus Animal Nutrition Ede 6717 VE The Netherlands
3Adaptation Physiology Group Wageningen University Wageningen 6708 WD The Netherlands
4Wageningen UR Livestock Research Wageningen 6708 WD The Netherlands
Chapter 3
58
ABSTRACT
The tendency to reduce crude protein (CP) levels in pig diets to increase protein efficiency
may increase the occurrence of damaging behaviours such as ear and tail biting
particularly for pigs kept under suboptimal health conditions We studied in a 2times2times2
factorial design 576 tail-docked growing-finishing entire male pigs in 64 pens subjected to
low (LSC) vs high sanitary conditions (HSC) and fed a normal CP (NP) vs a low CP diet (LP
80 of NP) ad libitum with a basal amino acid (AA) profile or supplemented AA profile with
extra threonine tryptophan and methionine The HSC pigs were vaccinated in the first nine
weeks of life and received antibiotics at arrival at experimental farm at ten weeks after
which they were kept in a disinfected part of the farm with a strict hygiene protocol The
LSC pigs were kept on the same farm in non-disinfected pens to which manure from
another pig farm was introduced fortnightly At 15 18 and 24 weeks of age prevalence of
tail and ear damage and of tail and ear wounds was scored At 20 and 23 weeks of age
frequencies of biting behaviour and aggression were scored for 10times10 min per pen per
week The prevalence of ear damage during the finisher phase (47 vs 32 of pigs P lt
00001) and the frequency of ear biting (13 vs 12 times per hour P = 003) were increased
in LSC compared with HSC pigs This effect on ear biting was diet dependent however the
supplemented AA profile reduced ear biting only in LSC pigs by 18 (SC times AA profile P lt
001) The prevalence of tail wounds was lower for pigs in LSC (013 plusmn 002) than for pigs in
HSC (022 plusmn 003) in the grower phase (P lt 0007) Regardless of AA profile or sanitary
conditions LP pigs showed more ear biting (+20 P lt 005) tail biting (+25 P lt 010)
belly nosing (+152 P lt 001) other oral manipulation directed at pen mates (+13 P lt
005) and aggression (+30 P lt 001) than NP pigs with no effect on ear or tail damage In
conclusion both LSC and a reduction of dietary protein increase the occurrence of
damaging behaviours in pigs and therefore may negatively impact pig welfare Attention
should be paid to the impact of dietary nutrient composition on pig behaviour and welfare
particularly when pigs are kept under suboptimal (sanitary) conditions
Chapter 3
59
INTRODUCTION
In the pig industry reduction of dietary protein contributes to the goal of making livestock
farming more nutrient efficient Reducing dietary protein level seems possible without
compromising the growth performance of pigs if supplementary dietary essential amino
acids (AA) are provided (Kerr and Easter 1995 Gloaguen et al 2014) It has been
suggested however that feeding diets with low dietary protein levels may increase the
occurrence of damaging behaviours such as ear and tail biting (Jericho and Church 1972
Jensen et al 1993) If particular nutrients are limiting for growth or immune functioning
pigs might increase their foraging behaviour and alter their feed preferences to satisfy their
nutritional needs (Jensen et al 1993) Indeed pigs provided a low-protein diet although
fed ad libitum showed more foraging activities than pigs fed a diet with adequate protein
levels (Jensen et al 1993) Pigs may in turn redirect their natural foraging and exploratory
behaviour to pen mates particularly when suitable rooting substrates are not or only
sparsely available The nosing chewing rooting and sucking directed at the tails ears and
other body parts of conspecifics may culminate in vigorous biting and as a consequence
might lead to wounds (Beattie et al 2001 Zonderland et al 2008) Once wounds have
developed biting behaviour may escalate particularly in pigs fed low-protein diets which
are even more attracted to blood (Fraser et al 1991)
Dietary AA imbalances have also been associated with injurious biting behaviour Several
studies suggest that pigs respond to a shortage of specific essential AA including
methionine (Met) threonine (Thr) and tryptophan (Trp) by adjusting their feed selection
behaviour accordingly (Ettle and Roth 2004 2005 Roth et al 2006 Ettle and Roth 2009)
Due to a relative shortage in AA foraging behaviour and redirected biting behaviour might
increase and blood may become more attractive In line with the latter McIntyre and
Edwards (2002) found that the preference to chew on a blood-soaked rope as opposed to a
water-soaked rope increased when pigs were fed a diet low in Trp The increased
preference for blood in pigs fed low-Trp diets may consecutively influence injurious biting
In support of this weanling pigs fed diets supplemented with free Trp in excess to
requirement bit less on the tails and ears of their pen mates (Martiacutenez-Trejo et al 2009)
Dietary protein deficiencies or AA imbalances may influence behaviour through their
effects on brain neurotransmitters as many of these are synthesized from particular AA
The effects of dietary Trp concentration for instance on aggressive behaviour and stress as
reported in numerous species (Gibbons et al 1979 Chamberlain et al 1987 Salomon et
al 1994 Winberg et al 2001 Lepage et al 2002) have been linked to its role as a
precursor of serotonin (5-hydroxytryptamine 5-HT) Recent studies have provided evidence
for a link between damaging biting behaviour and 5-HT Pigs had lowered blood platelet 5-
HT storage and higher blood platelet 5-HT uptake velocities in phases of life during which
they were classified as tail biters (Ursinus et al 2014a) Additionally Valros and Heinonen
Chapter 3
60
(2015) reported that the Trp and central 5-HT metabolism of tail biters was different from
that of victims and non-biters
Apart from dietary influences on injurious biting behaviour a poor health status has been
identified as one of the risk factors for this multifactorial problem (Schroslashder-Petersen and
Simonsen 2001 Taylor et al 2010) Respiratory disease and tail biting for example seem
to be associated at animal level (Kritas and Morrison 2007) and at farm level (Moinard et
al 2003) The exact nature of the relationship between health and biting behaviour is not
completely understood On the one hand a low health statusF or poor sanitary conditions
could lead to increased requirements for specific nutrients particularly those involved in
immune system activation such as Trp and in this way contribute to biting behaviour On
the other hand biting can also cause health problems as it frequently leads to
inflammatory responses (Munsterhjelm et al 2013) as supported by Heinonen et al (2010)
who found higher acute phase concentrations in blood in tail bitten pigs compared with
non tail-bitten control pigs Finally poor health and injurious biting could also partly reflect
suboptimal management feed or climatic conditions all of which are known to exacerbate
both health and behavioural problems (Moinard et al 2003 Edwards 2006 Zonderland et
al 2010) without necessarily being causally related Cause and effect are thus difficult to
disentangle in the health-biting relationships reported so far and to the best of our
knowledge no studies have been executed on the topic in which health status was
experimentally manipulated rather than only assessed
Reducing dietary protein concentrations on pig farms with poor health conditions may
therefore aggravate behavioural problems Therefore we studied the combined effects of
diverging sanitary conditions dietary protein level and AA profile on redirected biting
behaviours and tail and ear damage of pigs Performance and health parameters of the pigs
in the present study have been published elsewhere (van der Meer et al 2016)
ANIMALS MATERIALS AND METHODS
The experiment was approved by the Animal Care and Use Committee of Wageningen
University
Experimental design A 2 times 2 times 2 factorial design was applied with sanitary conditions (high
HSC or low LSC) dietary crude protein level (low LP or normal NP) and dietary AA profile
(basal AA-B or supplemented AA-S) as experimental factors at pen level
Animals and treatments In total 576 entire male tail-docked Topigs 20 times Tempo (Topigs
Helvoirt The Netherlands) piglets were selected on a commercial farm Half of the piglets
involved were subjected to the LSC and the other half to the HSC treatment The piglets for
both LSC and HSC were selected from the same farrowing rooms and were allocated per
Chapter 3
61
litter all boar piglets of a sow were selected for either LSC or HSC After weaning (mean
age 24 d) LSC and HSC pigs were group-housed in different rooms to prevent cross-
vaccination The HSC piglets and not LSC piglets were vaccinated against Mycoplasma
hyopneumoniae porcine circovirus type 2 porcine reproductive and respiratory syndrome
Lawsonia intracellularis Actinobacillus pleuropneumoniae and influenza A virus in the first
nine weeks of age as specified in van der Meer et al (2016)
The HSC and LSC pigs were transported separately to another commercial farm where the
experiment was conducted (Vlierbos VOF Neerloon The Netherlands) with half of the
pigs at 10 weeks of age and the other half at 11 weeks of age (two batches of 288 LSC
144 HSC 144) Upon arrival pigs were allocated to their pen based on body weight (BW) in
order to minimize variation in BW between pens (mean BW plusmn standard error of the mean
LSC batch 1 173 plusmn 006 kg LSC batch 2 181 plusmn 007 kg HSC batch 1 159 plusmn 007 kg HSC
batch 2 174 plusmn 007 kg) In total 64 concrete pens were used each pen had a partly slatted
floor and contained nine pigs (08 m2 space per pig) All pens were distributed over eight
rooms four rooms we selected for LSC pigs and four rooms for HSC pigs Per room each
experimental diet was distributed to two pens resulting in one repetition of treatment
combination per room Distribution of experimental diet per room was done randomly Per
treatment combination there were eight replicates (pens) Each room had separate manure
pits and separate negative pressure mechanical ventilation regulation The temperature in
the rooms was set at 24degC at start of the experiment and was decreased to 20degC during the
experiment The LSC rooms were not cleaned after containing a previous batch of
commercial finisher pigs that left the facility two days before and no specific hygiene
protocol was applied to these rooms Starting at five weeks after arrival fresh manure of
another commercial pig farm was spread in the LSC pens every two weeks until end of the
experiment to enhance antigenic pressure The LSC pigs did not receive any preventative
medication In contrast HSC pigs received a dose of antibiotics (Fenflor AUV Veterinary
Services BV Cuijk the Netherlands 1 mLpig intramuscular at day 1 and 3 of the experi-
ment) after arrival at 10 weeks of age and were placed in four disinfected rooms in a
distinct part of the pig facility with a strict hygiene protocol see van der Meer et al (2016)
Animals were monitored for the complete fattening period divided in three phases ie
starter (0-34 d) grower (35-49 d) and finisher phase (from day 50 until a target average
pen BW of 110 kg)
Diets feeding and analysis Pens were allocated to a diet with either a low crude protein
(CP) level (LP) or a normal CP level (NP) each having either a basal AA-profile or a
supplemented AA-profile resulting in four different diets LP-AA-B LP-AA-S NP-AA-B NP-
AA-S The apparent ileal digestible (AID) Lys MJ NE ratio of the diets was reduced in each
subsequent phase of the experiment to follow a three phase feeding system For the NP
diet the lysine (Lys) MJ NE ratio was set to 95 of the requirement values for boars as
published by NRC (2012) to prevent dietary energy to be limiting for growth performance
Chapter 3
62
The respective diets contained 090 g AID Lys MJ net energy (NE) for the starter phase
081 g AID Lys MJ NE for the grower phase and 075 g AID Lys MJ NE for the finisher
phase The LP diets were created by decreasing the inclusion level of all protein-containing
ingredients by 20 in exchange for maize starch and cellulose resulting in diets with 072 g
AID Lys MJ NE for the starter phase 065 g AID Lys MJ NE for the grower phase and 060
g AID LysNE for the finisher phase
The basal AA-profile (AA-B) was designed to cover the AA requirements for body protein
deposition (Bikker 1994 Le Bellego and Noblet 2002 NRC 2012) and to cover AA losses
associated with basal endogenous proteins in ileal digesta (Jansman et al 2002 NRC
2012) AA losses in skin and hair (NRC 2012) and AA losses related to cell and tissue
turnover in the body (Moughan 1998) as specified in van der Meer et al (2016) The
supplemented AA-profile (AA-S) was derived from the AA-B profile by increasing the Met
Thr and Trp ratio relative to Lys on a AID basis by 20 These AA are believed to be
increasingly important as building blocks for synthesis of specific proteins such as acute
phase proteins synthesized in case of immune system activation (Melchior et al 2004 Le
Flocrsquoh et al 2008 Rakhshandeh et al 2010 Le Floch et al 2012) and effects on immune
processes (Wu 2009) The composition of the diets is shown in Table 25 and the AA-
profiles are shown in supplementary Table I All diets were isocaloric on a NE basis and
provided as pellets during the experiment Per pen one single space feeder and one nipple
drinker were present and feed and water were offered ad libitum
Diets were analyzed for AA composition by acid hydrolysis at 110degC for 23 h and ion-
exchange chromatography with post-column derivatization with ninhydrin (ISO 2005a) and
Trp by alkaline hydrolysis at 110degC for 20 h ion-exchange chromatography with
fluorescence detection (ISO 2005b)
Behavioural observations Pigs were observed at 20 (grower phase) and 23 (finisher phase)
weeks of age using behaviour sampling Frequencies of the behaviours described in Table
31 were recorded during live observations from 800-1220 h and 1400-1650 h during
two consecutive days In case of continuous biting for gt 30 sec after 30 sec a new
occurrence was scored Animals in each pen were observed 10 times 10 min resulting in 100
min of observations per pen per week of observation Distribution of the 10-min
observation blocks over the day and over the two observation days was balanced for
experimental treatments Observers were blind to the dietary treatments and divided over
the pens balanced for treatment All four observers were trained by the same person
before behavioural observations
Damage and wound scores Tail damage was recorded at 15 18 and 24 weeks of age as
indicator of being tail bitten using the following scores as described in Ursinus et al
(2014b) 1 No tail damage 2 Bite marks thin scratches The individual bite marks have the
size of a pinhead 3 Small wound clearly visible lesion with fresh or dried blood on the (top
Chapter 3
63
of the) tail but the tail retains its entire length 4 Medium wound clearly visible lesion with
fresh or dried blood on the tail and the tail is partly shortened 5 Severe wound lesion with
fresh or dried blood the tail is completely removed Ear damage was recorded together
with the tail damage scoring Only damage to the backside of the ears was recorded
Scoring was done as follows 1 No ear damage 2 Top or bottom lesions thin scratches 3
Top and bottom lesions thin scratches 4 Severe damage part of ear is missing These
scores were determined as described by Ursinus et al (2014b)
Table 31 Ethogram
Behaviour Description
Oral manipulation of group mates Tail biting Nibbling sucking or chewing the tail of a pen mate Ear biting Nibbling sucking or chewing the ear of a pen mate Manipulating other Nibbling sucking or chewing of another part of the body of a pen mate Aggression Fighting Ramming or pushing a pen mate with or without biting the other pen
mate Can be either mutual or unilateral Fighting at feeder Pushing head knocking or biting a pen mate at the feeder Belly nosing Rubbing the belly of a pen mate with up and down snout movements Mounting Standing on hind legs while having front legs on other pigs body Enrichment object biting Chewing on an enrichment object provided in the pen The enrichment
object was a chain with a hard plastic pipe fixed at the top of the pen wall
Cases of ear necrosis were given a score of 5 It is not fully known whether ear necrosis is a
result of ear biting Recent epidemiological studies point to a possible infection route for
ear necrosis through biting however the spread of ear necrosis in pig herds is difficult to
explain solely by opportunistic bacterial infections (Pringle et al 2009 Karlsson et al
2013) Damage scores of both ears were recorded and the average score of both ears was
used for further analysis resulting in one value per pig per recording week for further
analysis Pigs received a binary score for both tail and ear damage (0) no damage (score1)
vs (1) damage (score gt1) per phase Similarly pigs received a binary score for having (0) no
wound (score lt 3 for tails and score lt 4 for ears) vs (1) a wound (score gt 2 for tails and gt 3
for ears) per phase These scores were averaged per pen and phase and used for further
analysis In case of a score gt 4 for tail damage or ear damage pigs were individually treated
with a iodine spray and another wound spray to prevent bacterial infections (MS jodium
Chapter 3
64
bruin and MS protect verband spray MS Schippers BV Bladel The Netherlands) No pigs
were removed from the experiment
Statistical analysis Statistical analyses was performed using SAS (SAS 93 Institute Inc)
Behavioural frequencies were averaged per pen and phase (grower and finisher) before
analysis Residuals of the response variables were checked for normality and if needed
square root transformed All variables for behavioural frequencies were analyzed in a
Mixed Model that included sanitary condition dietary CP level dietary AA profile batch
phase sanitary condition times dietary CP level and sanitary conditions times dietary AA profile as
fixed effects Other interactions were deleted from the model when not significant The
effect of room nested within sanitary conditions was used as a random effect to correct for
differences between rooms
To analyze damage scores the prevalence of damage was analyzed by expressing damage
as a 0-1 variable (0 = no damage 1 = damage) per pig per phase The pen-averaged
prevalences were analyzed per phase by a Mixed model that included sanitary condition
dietary CP level dietary AA profile batch sanitary condition times dietary CP level and sanitary
conditions times dietary AA profile as fixed effects Other interactions were deleted from the
model when not significant The effect of room nested within sanitary condition was used
as a random effect to correct for differences between rooms The prevalence of wounds
was analyzed by expressing wounds as a 0-1 variable (0 = no wound 1 = wound) per pig per
phase and expressed as prevalence per pen per phase The pen-averaged wound
prevalences were analyzed per phase with the same model as the pen averaged damage
prevalences All values are presented as raw means plusmn standard error of the mean (SEM)
RESULTS
Behavioural observations Oral manipulation of group mates occurred more often (41 plusmn 04
times per pig per hour) than chewing on enrichment object (10 plusmn 02) and aggression (24 plusmn
03) Oral manipulation was less directed at tails (03 plusmn 01) than ears (15 plusmn 02) or body
parts other than tails or ears (23 plusmn 03) Frequency of belly nosing was rather low (01 plusmn
01) and the same held for mounting (04 plusmn 01)
Frequency of total oral manipulation of pen mates (chewing or nibbling tail ear or other
body parts) was higher for LSC than for HSC pigs (45 vs 38 times per pig per hour P le
005 Table 32) Ear biting was affected by the interaction between sanitary conditions and
dietary AA treatment (P le 005 Fig 32) Ear biting was more frequently recorded for LSC
pigs fed AA-B diets compared with LSC pigs fed AA-S diets (19 vs 15 times per hour)
whereas frequency of ear biting in HSC pigs was similar for pigs fed the AA-B diet and the
AA-S diets (12 vs 13 times per hour) For tail biting behaviour also an interaction between
sanitary conditions and dietary AA level was found (P le 005) Tail biting was more
Chapter 3
65
frequently recorded in HSC pigs fed AA-B diets compared with HSC pigs fed AA-S diets (04
plusmn 01 vs 03 plusmn 01 times per hour) whereas dietary AA level did not affect frequency of tail
biting in LSC pigs (04 plusmn 01 vs 04 plusmn 01 times per hour) Sanitary conditions dietary AA
profile or their interaction did not affect chewing on an enrichment object or aggressive
behaviour
Apart from sanitary conditions and dietary AA profile also dietary protein level affected the
pigsrsquo behaviour The LP fed pigs showed higher frequencies of total oral manipulation of
group mates (44 plusmn 04 vs 38 plusmn 04 times per hour) ear biting (16 plusmn 02 vs 13 plusmn 032 times
per hour) manipulation of other body parts (25 plusmn 03 vs 22 plusmn 03 times per hour)
enrichment object biting (12 plusmn 02 vs 08 plusmn 02 times per hour) total aggression (27 plusmn 03
vs 21 plusmn03 times per hour) fighting (13 plusmn 02 vs 09 plusmn 02 times per hour) belly nosing
(02 plusmn 01 vs 01 plusmn 00 times per hour) (All P le 005 Table 32 Fig 31) and a tendency for
higher frequencies of tail biting than the NP fed pigs (04 plusmn 01 vs 03 plusmn 01 times per hour
005 le P le 010)
Pigs fed with the AA-B diet had higher frequencies of mounting than pigs fed the AA-S diet
(04 plusmn 01 vs 03 plusmn 01 times per hour P le 005) Mounting was recorded more for LP than
NP fed pigs in LSC (05 plusmn 01 vs 04 plusmn 01 times per hour) but less for LP than NP fed pigs in
HSC (03 plusmn 01 vs 04 plusmn 01 times per hour) (sanitary conditions times dietary protein level
interaction P le 005)
Table 32 Frequencies of behaviours collected by behaviour sampling during the grower and finisher phase in pigs kept under low or high sanitary conditions and provided with diets containing either low or normal protein levels and either a basal or a supplemented amino acid profile
LSC2 HSC2
LP3 NP3 LP NP p-values5
Behaviour1 AA-B4 AA-S4 AA-B AA-S AA-B AA-S AA-B AA-S SC CP AA batch SCtimesCP SCtimesAA
n 8 8 8 8 8 8 8 8
Oral manipulation of group mates 50 plusmn 04 45 plusmn 04 43 plusmn 04 42 plusmn 05 43 plusmn 03 40 plusmn 03 35 plusmn 04 33 plusmn 04
002 0002 023 00004 054 089
Tail biting 04 plusmn 01 04 plusmn 01 03 plusmn 00 03 plusmn 01 04 plusmn 00 03 plusmn 01 04 plusmn 01 02 plusmn 00 059 006 023 009 058 002
Ear biting 20 plusmn 02 16 plusmn 02 17 plusmn 02 14 plusmn 02 13 plusmn 02 14 plusmn 02 10 plusmn 01 12 plusmn 02 003 002 038 095 099 003
Manipulating other 26 plusmn 03 25 plusmn 03 23 plusmn 02 24 plusmn 03 26 plusmn 02 23 plusmn 02 21 plusmn 03 19 plusmn 02 019 004 047 lt0001 030 041
Chewing enrichment object 13 plusmn 02 13 plusmn 03 08 plusmn 02 08 plusmn 02 10 plusmn 02 12 plusmn 02 08 plusmn 02 06 plusmn 02 054 0002 099 048 059 087
Aggression 28 plusmn 03 28 plusmn 03 23 plusmn 03 21 plusmn 02 27 plusmn 03 23 plusmn 03 22 plusmn 03 16 plusmn 03 037 0001 014 065 095 029
Fighting 14 plusmn 02 12 plusmn 02 08 plusmn 01 09 plusmn 02 14 plusmn 02 13 plusmn 02 12 plusmn 02 07 plusmn 01 084 0001 017 035 080 022
Feeder fighting 14 plusmn 02 16 plusmn 02 15 plusmn 02 12 plusmn 02 13 plusmn 02 11 plusmn 01 10 plusmn 02 09 plusmn 02 025 011 041 023 072 074
Belly nosing 02 plusmn 01 03 plusmn 01 01 plusmn 00 01 plusmn 00 01 plusmn 00 02 plusmn 01 01 plusmn 00 00 plusmn 00 039 00003 039 009 079 073
Mounting 05 plusmn 01 04 plusmn 01 04 plusmn 01 03 plusmn 01 03 plusmn 01 02 plusmn 01 05 plusmn 01 03 plusmn 01 054 059 001 016 003 064 1Behaviours are expressed in frequencies per pig per hour observed In case of continuous behaviour a new bout was scored when behaviour was gt 30 seconds 2LSC = low sanitary conditions SC = high sanitary conditions 3LP = low dietary crude protein level NP = normal dietary crude protein level 4AA-B = basal dietary amino acid profile AA-S = supplemented dietary amino acid profile containing 20 more Met Thr and Trp compared with the basal profile 5P-values for manipulating other and belly nosing were based on square root transformed data Significant P-values are indicated in bold and for a tendency values are underlined Means are presented as raw means plusmn standard error 6n = number of pens a pen contained nine pigs
Figure 31 Behaviour of pigs during the grower and finisher phase for pigs fed diets with low (LP) or normal (NP) crude protein level + P lt 010 P lt 005 P lt 001 P lt
0001
0
10
20
30
40
50
60
70
total oralmanipulation of
pen mates
tail biting ear biting manipulatingother
chewing toy total aggression fighting feeder fighting belly nosing
Freq
p
ig
ho
ur
LP NP
+
0
05
1
15
2
25
basal suppl basal suppl basal suppl basal suppl
LP NP LP NP
LSC HSC
Freq
p
ig
ho
ur
SC times AA P = 003 SC P = 003 CP P = 002
Figure 32 Frequency of ear biting in pigs kept under different sanitary conditions and fed a diet with either a low or normal dietary protein level and a basal or supplemented amino acid profile Ear biting was recorded during live ad libitum sampling for 100 min per pen in total The bars represent the raw means per treatment group plusmn standard error of the mean LSC = low sanitary conditions HSC = high sanitary conditions LP = low dietary crude protein level (white bars) NP = normal dietary crude protein level (grey bars) AA-B = basal dietary amino acid profile (striped bars) AA-S = supplemented dietary amino acid profile containing 20 more Met Thr and Trp compared with the basal profile (dotted bars) SC = sanitary conditions AA = amino acid profile
Chapter 3
69
Tail and ear damage scores When considering the prevalence of tail damage as a binary
score (tail damage vs no tail damage) almost all of the pigs had tail lesions with a score
higher than 1 ie at least bite marks in at least one phase during the experiment
Furthermore 39 of the pigs had a tail wound (score gt 2) in at least one of the phases
These proportions were not affected by sanitary conditions or diet
When averaging binary tail damage scores per pen and phase the proportion of pigs with
tail damage in LSC pens (080 plusmn 003) was higher than that in HSC pens (065 plusmn 003) in the
starter phase (P le 005 Table 33) In the grower phase the proportion of pigs with tail
damage in LSC (081 plusmn 004) was lower than that in HSC (092 plusmn 002 P le 005 Table 33)
An interaction for tail damage in the finisher phase was found for sanitary conditions (SC) times
CP P le 005 NP fed pigs in HSC (082 plusmn 004) had lower damage scores than LP fed pigs in
HSC (092 plusmn 002) whereas this score was not different for pigs in LSC (091 plusmn 002 vs 092 plusmn
002)
In total 78 of LSC and 58 of HSC pigs had at least in one phase an ear damage score
higher than 1 (P le 005) When averaging binary ear damage scores per pen and phase the
proportion of animals with ear damage was higher in pens fed AA-B diets (037 plusmn 004)
compared to those fed AA-S diets (025 plusmn 003) in the grower phase (P le 005) The
proportion of pigs with ear damage in the grower phase tended to be higher for LSC (033 plusmn
004) than for HSC pigs (028 plusmn 004) For the finisher phase the proportion of ear damage
was higher for LSC (092 plusmn 002) than for HSC pigs (087 plusmn 002 P le 005) The distribution of
LSC and HSC pigs over tail and ear damage scores are presented in Supplementary Table II
and III respectively
When considering the prevalence of tail wounds as a binary score (tail wound vs no tail
wound) in LSC a lower proportion of pigs had tail wounds (013 plusmn 002) than in HSC (022 plusmn
003) in the grower phase (P le 005 Table 34) The LP diet tended to result in a lower
proportion of pigs with tail wounds (032 plusmn 004) compared with the NP diet (038 plusmn 004)
in the grower phase (005 le P le 010) Proportion of pigs with a tail wound tended to be
lower for the AA-B diet (020 plusmn 003) than for the AA-S diet (014 plusmn 002) in the grower
phase (005 le P le 010) In the finisher phase an interaction was found for SC times CP for
proportion of pigs with tail wounds in LSC a lower proportion of pigs with wounds was
found when fed a LP diet (017 plusmn 003) instead of a NP diet (024 plusmn 003) whereas in HSC a
higher proportion of pigs had tail wounds when fed a LP diet (022 plusmn 004) instead of a NP
diet (015 plusmn 004) in the grower phase (P le 005)
When averaging binary ear wound scores (scores gt 3 for ear wounds vs scores lt 4) per pen
and phase many pens had a score 0 (no wound) Therefore no statistically test was
performed on ear wound scores The raw means are presented in Table 34
Table 33 Proportion of pigs (based on pen averages) with tail damage (score gt 1) and ear damage (score gt 1) observed for each treatment group low and high sanitary condition pigs both with diets containing either low or normal protein levels and basal or supplemented amino acid profiles
1LSC = low sanitary conditions HSC = high sanitary conditions 2LP = low crude protein level in diet NP = normal crude protein level in diet 3AA-B = basal dietary amino acid profile AA-S = supplemented dietary amino acid profile containing 20 more Met Thr and Trp than the basal profile 4 Significant P-values are indicated in bold and for a tendency values are underlined Means are presented as raw means plusmn standard error of the mean 5Damage scores were either 0 = no damage or 1= damage and were averaged per pen 6n = number of pens a pen contained nine pigs
LSC1 HSC1
LP2 NP2 LP NP P-values4
Damage score5 AA-B3 AA-S3 AA-B AA-S AA-B AA-S AA-B AA-S SC CP AA batch SCtimesAA SCtimesCP
n6 8 8 8 8 8 8 8 8
Tail
starter 080 plusmn 008 082 plusmn 004 076 plusmn 004 083 plusmn 008 064 plusmn 006 065 plusmn 006 078 plusmn 007 054 plusmn 004 lt0001 098 045 0002 006 070
grower 083 plusmn 007 075 plusmn 009 078 plusmn 008 088 plusmn 006 095 plusmn 003 094 plusmn 002 094 plusmn 004 085 plusmn 006 lt0001 076 052 047 037 021
finisher 092 plusmn 003 091 plusmn 004 093 plusmn 003 091 plusmn 004 095 plusmn 003 088 plusmn 003 081 plusmn 006 084 plusmn 004 068 007 054 lt0001 088 004
Ear
starter 052 plusmn 005 041 plusmn 008 030 plusmn 007 045 plusmn 006 047 plusmn 012 036 plusmn 008 043 plusmn 006 028 plusmn 006 050 013 030 002 017 078
grower 034 plusmn 012 032 plusmn 006 037 plusmn 005 031 plusmn 007 042 plusmn 010 020 plusmn 005 034 plusmn 008 016 plusmn 005 010 063 002 086 011 053
finisher 053 plusmn 008 040 plusmn 006 051 plusmn 010 045 plusmn 009 031 plusmn 012 029 plusmn 005 032 plusmn 007 035 plusmn 012 lt0001 062 032 076 031 090
Table 34 Proportion of pigs (based on pen averages) with tail wounds (score gt 2) and ear wounds (score gt 3) observed for each treatment group low and high sanitary condition pigs both with diets containing either low or normal protein levels and basal or supplemented amino acid profiles
1LSC = low sanitary conditions HSC = high sanitary conditions 2LP = low crude protein level in diet NP = normal crude protein level in diet 3AA-B = basal dietary amino acid profile AA-S = supplemented dietary amino acid profile containing 20 more Met Thr and Trp than the basal profile 4 Significant P-values are indicated in bold and for a tendency values are underlined Means are presented as raw means plusmn standard error of the mean For ear wounds no statistically test was done as there were too many pens without wounds 5Wound scores were either 0 = no wound or 1= wound and were averaged per pen 6n = number of pens a pen contained nine pigs
LSC1 HSC1
LP2 NP2 LP NP P-values4
Wound score5 AA-B3 AA-S3 AA-B AA-S AA-B AA-S AA-B AA-S SC CP AA batch SCtimesAA SCtimesCP
n6 8 8 8 8 8 8 8 8
Tail
Starter 008 plusmn 003 007 plusmn 003 011 plusmn 004 016 plusmn 005 007 plusmn 004 013 plusmn 005 013 plusmn 004 010 plusmn 003 010 017 050 043 099 038
Grower 015 plusmn 004 004 plusmn 002 022 plusmn 006 010 plusmn 003 018 plusmn 006 021 plusmn 006 027 plusmn 008 022 plusmn 005 0007 010 009 00003 014 080
Finisher 018 plusmn 003 015 plusmn 004 025 plusmn 005 023 plusmn 006 018 plusmn 006 026 plusmn 004 017 plusmn 006 012 plusmn 006 082 094 084 077 056 004
Ear
Starter 005 plusmn 003 004 plusmn 004 000 plusmn 0 006 plusmn 003 006 plusmn 003 001 plusmn 001 000 plusmn 0 000 plusmn 0
grower 005 plusmn 005 000 plusmn 0 000 plusmn 0 005 plusmn 003 017 plusmn 008 007 plusmn 003 000 plusmn 0 000 plusmn 0
finisher 006 plusmn 006 002 plusmn 002 000 plusmn 0 008 plusmn 004 008 plusmn 004 005 plusmn 002 000 plusmn 0 000 plusmn 0
Chapter 3
72
DISCUSSION
In this study we assessed the influence of sanitary conditions dietary protein
concentration and dietary AA profile on behaviour of pigs kept under practical conditions
To the best of our knowledge this is the first study on damaging behaviour in pigs that are
experimentally exposed to diverging sanitary conditions and receive different dietary
treatments in a commercial farm setting We demonstrate evidence for a causal
relationship between sanitary conditions and damaging behaviour indicating that biting
behaviour particularly ear biting in pigs is linked to health status in a diet-dependent
manner In addition low dietary protein levels clearly increased the frequencies of both
damaging biting behaviour and aggression Dietary supplementation of Thr Met and Trp
modified these behavioural responses in low sanitary conditions pigs or low dietary protein
fed pigs to some extent
In our study ear biting and manipulation of body parts other than ears and tails were
scored more frequently than tail biting Given the frequent occurrence of tail wounds tail
docking was applied on the experimental farm This is still common practice in the
Netherlands and many other countries It is known that ear biting occurs more frequently
on farms with docked tails likely because docked tails are not the most attractive body part
to bite in (Goossens et al 2007) Also in studies on pigs with intact (Camerlink et al 2015)
and half-docked tails (Ursinus et al 2014b) ear biting and manipulation of other body
parts was observed more frequently than tail biting Oral manipulation of pen mates
occurred far more frequent than biting of the enrichment object provided probably
because body parts of conspecifics better meet the requirements of pigs for suitable
chewing and rooting materials (Van de Weerd et al 2003) and more pen mates than
enrichment objects were available
Tail docking ie amputation of the tail or part of it in young pigs is still done in several EU
countries to prevent tail damage at later age (Sutherland et al 2011) The underlying
causes of tail biting are however not removed by this practice and tail wounds remain a
problem (Valros and Heinonen 2015) Our results with almost all of pigs showing at least
bite marks and 39 having a small or large tail wound in one of the production phases
confirm that tail docking is no guarantee for the absence of tail biting This is line with other
studies For instance in a study with Irish slaughter pigs 99 of the studied pigs were tail
docked and 725 of these pigs had tail lesions at slaughter (Harley et al 2014) In an
observation study with pigs with half-docked tails (Ursinus et al 2014b) frequency of ear
biting (17 plusmn 01 per hour) in pigs was higher than tail biting (06 plusmn 01 per hour) as was the
case in our study Overall the percentage of pigs with tail lesions was higher than the
percentage of pigs with ear lesions suggesting that in spite of its relatively lower
frequency tail biting was more severe than ear damage in our study
Chapter 3
73
Damaging behaviour and interactions with sanitary conditions and diet Pigs in LSC showed
more ear biting (+39) compared with HSC pigs Dietary supplementation with extra Met
Thr and Trp reduced the frequency of ear biting (-16) only in LSC pigs The proportion of
pigs with ear damage was higher in LSC than in HSC during the grower (tendency) and
finisher phase Similarly proportions of pigs with tail damage was higher in LSC during the
starter phase although the opposite was found for proportion of pigs with tail damage or
wounds in the grower phase The LSC pigs had higher haptoglobin concentrations in blood
and higher pleuritis scores for lungs at slaughter than HSC pigs (van der Meer et al 2016)
confirming a difference in health status The impact of LSC on both damaging behaviours
and the lesions and wounds they induce suggests a causal relationship between poor
health and the occurrence of behavioural problems
The increased propensity of pigs with a poor health status to start biting their pen mates
could be related to increased immune system activation In line with this in laying hens the
stimulation of immune reactivity by intra-tracheal exposure to human serum albumin
increased damaging feather pecking (Parmentier et al 2009) a redirected foraging
behaviour showing a strong similarity to tail biting in pigs (Rodenburg and Koene 2007)
Immune stimulation may lead to a change in the animalrsquos nutrient requirements
particularly also for AA Recent studies have shown indeed that the requirements for Trp
(Melchior et al 2004 Le Flocrsquoh et al 2008 Rakhshandeh et al 2010) Met + cysteine
(Rakhshandeh et al 2010) and Thr (Li et al 2007 Ren et al 2014) are increased in case of
immune system stimulation Increased immune system activity in growing animals may
redirect nutrients from growth to other processes that require AA Indeed the LSC pigs in
our study showed a lower body weight gain than the HSC pigs (van der Meer et al 2016)
Notably and unlike in most studies using model agents like lipopolysaccharide (LPS)
(Rakhshandeh et al 2010 de Ridder et al 2012 Kim et al 2012) Complete Freundrsquos
Adjuvant (CFA) (Le Floch et al 2012 Kampman-van de Hoek et al 2015) to stimulate the
immune system contrasts in sanitary status in this experiment occurred strictly without
pigs showing signs of clinical illness Pigs with suboptimal health may thus need more AA to
support the immune system whilst maintaining growth Indeed particularly in the pigs kept
under poor sanitary conditions the diets with supplemented Met Thr and Trp led to higher
gain-to-feed ratios and a higher body weight gain (van der Meer et al 2016) If particular
AA are limiting for optimal body functioning pigs might intensify their chewing and rooting
behaviour to satisfy their nutritional needs and under commercial conditions direct part
of their oral behaviours towards pen mates This is confirmed by the lower frequency of ear
biting recorded for AA-S compared with AA-B fed pigs in LSC The frequency of tail biting
and the ear and tail damage scores in LSC pigs were not always reduced by the
supplementary AA diet The former suggests that the link between health status AA
availability in metabolism and damaging behaviour is complex and possibly influenced by
multiple mechanisms
Chapter 3
74
An imbalance in AA might also influence behaviour by altering brain neurotransmitter
metabolism Several brain neurotransmitters are synthesized from AA (Anderson 1979
Massey et al 1998) Threonine is a precursor of brain glycine (Castagneacute et al 1993) Met
can be used as a donor of methyl groups used for synthesis of many substrates such as
choline (Burke et al 1951 Rodwell 2003) which is an acetylcholine precursor (Purves et
al 2001) and Trp is a precursor of serotonin (5-hydroxytryptamine 5-HT Rodwell 2003)
a neurotransmitter which is known to affect behaviour and emotional state Aggressive
behaviour and stress have been shown to be related to the supply of dietary Trp andor
brain 5-HT in several animal and human studies (Gibbons et al 1979 Chamberlain et al
1987 Salomon et al 1994 Winberg et al 2001 Lepage et al 2002) including studies on
pigs (Koopmans et al 2005 Edwards 2006) Ursinus et al (2014a) recently found that pigs
that perform tail biting behaviour had lowered blood 5-HT levels and in line with this
feather pecking chickens also showed altered peripheral (Bolhuis et al 2009) and central 5-
HT (Kops et al 2013 Kops et al 2014) metabolism This could either be due to a direct
effect of 5-HT on damaging behaviour demonstrated experimentally for chickens only (van
Hierden et al 2004) or reflect lowered AA availability for neurotransmitter synthesis
either or not caused by a lowered health status
As Trp competes with other large neutral AA (LNAA) for passage over the blood brain
barrier the Trp LNAA ratio in blood is a major determinant of brain 5-HT concentration
(Wurtman and Fernstrom 1975) Despite that there were differences in Trp LNAA ratio
between the AA-B and AA-S diets no clear effects of dietary AA profile on aggression and
on some of the damaging behaviours were found In contrast supplementation of AA in the
AA-S diet resulted in lower recorded frequencies of mounting than for pigs fed the AA-B
diet It is not really clear via which mechanisms dietary AA provision affects mounting
behaviour
Apart from pigs in poor health being more likely to start biting as indicated also affected by
the dietary AA supply the health-biting relationship (Moinard et al 2003b Kritas and
Morrison 2007 Marques et al 2012) can be fortified by the poor ability of ill pigs to avoid
being bitten (Taylor et al 2010) Finally it can be speculated that immune activation in
wounded pigs (eg Heinonen et al 2010 Munsterhjelm et al 2013) in turn increases the
probability of these pigs to start biting as well which consequently leads to an escalation of
tail or ear biting in the entire group
Dietary protein reduction a risk for damaging behaviour Almost all damaging and
aggressive behaviours recorded were more frequently scored for pigs fed the LP diet
considered to be dietary deficient in essential AA than for those fed the NP diet
demonstrating a clear and direct effect of dietary protein level on damaging behaviour In
addition a higher proportion of pigs with tail damage and tail wounds was found in HSC in
the finisher phase when pigs were fed a LP diet In a study of McIntyre and Edwards (2002)
Chapter 3
75
pigs had a higher preference for a wet blood-soaked tail model when fed a low protein diet
(98 g CPkg) compared to their preference when fed a control diet (189 g CPkg) These
results suggest that a diet deficient in essential AA increases preference for blood
However they used different protein sources in both diets (McIntyre and Edwards 2002)
Therefore an effect of protein source rather than CP level alone cannot be excluded in their
study In our study however the same protein sources at a different inclusion level were
used in the respective diets As average daily feed intake was not significantly different
between LP an NP diets we conclude that a the difference in AA uptake lead to more oral
manipulation of pen mates and more aggression
The LP diets might have led to a shortage or imbalance of AA resulting in restless pigs
searching for missing nutrients It might be that some brain neurotransmitters cannot be
synthesized from AA derived from dietary protein as was stated by Harper and Peters
(1989) simply because insufficient precursors were available Nutritional imbalance
probably due to an overall shortage in AA in this case can increase foraging activity and
redirected damaging behaviours
Apart from the effect on damaging behaviour an overall shortage of the dietary supply of
AA might also be responsible for the increase in aggressive behaviour in pigs fed the LP
diets The LP diets regardless of the AA profile were diets with a lower Trp concentration
compared with the NP diets A low Trp concentration in the brain due to a low
concentration of Trp in the diet might affect brain serotonin metabolism resulting in more
aggressive behaviour as found by Martinez-Trejo et al (2009) or might affect aggressive
behaviour via other hormones such as cortisol or noradrenaline as found by Koopmans et
al (2005) Also the effect of AA concentration on blood insulin concentration might have
played a role as blood insulin is known to play a role in Trp uptake in the brain as well
(Kritas and Morrison 2007)
Alternatively Fraser et al (1991) suggested that the effect of deficient dietary essential AA
level on biting behaviour is indirectly caused by a lower growth rate of these animals
rather than by the dietary composition as such In support of this McIntyre and Edwards
(2002) found a tendency for a correlation between body weight gain and preference for a
blood tail model vs water tail model Also Larsen (1983) found that tail biting pigs often
were slower growing animals In contrast Ursinus et al (2014b) reported a higher
phenotypic and genotypic growth in fanatic tail biters These authors suggested that fast
growing pigs and pigs with a low growth rate due to health problems may have a high
metabolic demand for protein synthesis for muscle tissue or immune processes in
common which could explain their increased biting tendencies A larger variation in size of
animals within the same pen has also been reported to negatively influence biting
behaviour (Taylor et al 2010) When calculating the standard error for body weight per
pen in our study the standard error was higher for LSC than HSC animals which means that
Chapter 3
76
variation in weight per pen was higher in LSC animals When calculating this standard error
for body weight with the measured behaviours no clear correlations were found
Even if growth rate is related to biting behaviour more research is needed to determine
cause and effect and to study the impact of a potential shared underlying factor such as
for instance an actual status or history of poor health A low protein diet with deficiencies
in essential AA should thus be considered as a risk factor for biting behaviour and
aggression in pigs which can only partly be counteracted by supplementation with specific
essential AA such as Met Thr and Trp
In conclusion this study shows a causal link between sanitary conditions dietary CP level
and damaging behaviours Both LSC and a reduction of dietary CP level increase the
occurrence of damaging behaviours in pigs and therefore may negatively impact pig
welfare These effects could only partly be counteracted by supplementation with specific
essential AA that are known to be increasingly required in case of immune system
activation
Tail and ear biting clearly are multifactorial problems and combating these requires a
multidisciplinary effort This study demonstrates that care should be taken in reducing
dietary protein concentrations to improve protein efficiency in pigs even when maintaining
the ratio of the most important essential AA relative to energy It incurs a risk to increased
damaging behaviours particularly when pigs are kept under poor sanitary conditions
Acknowledgements The authors would like to thank F van den Berg AC Bartels M
Ooms G De Vries-Reilingh and all students involved for their assistance during this
experiment The authors also thank H van Diepen and J Kuipers for their advice and
support on formulation of the experimental diets
Chapter 3
77
REFERENCES Anderson G H 1979 Control of protein and energy intake role of plasma amino acids and brain neurotransmitters Can J Phys
Pharm 57 1043-1057 Beattie V E I A S VE N Walker and R N Weatherup 2001 Environmental enrichment of intensive pig housing using spend
mushroom compost Anim Sci 71 35-42 Bikker P M W A Verstegen and M W Bosch 1994 Amino acid composition of growing pigs is affected by protein and energy
intake J Nutr 1241961-1969 Bolhuis J E ED Ellen C G van Reenen J de Groot J ten Napel R E Koopmanschap G de Vries-Reiligh K A Uitdehaag B
Kemp and T B Rodenburg 2009 Effects of genetic group selection against mortality on behavior and peripheral serotonin in domestic laying hens with trimmed and intact beaks Phys Beh 97 470-475
Burke K A R F Nystrom and B C Johnson 1951 the role of methionine as a methyl donor for choline synthesis in the chick J Bio Chem 188 723-728
Camerlink I W W Ursinus P Bijma B Kemp and J E Bolhuis 2015 Indirect genetic effects for growth rate in domestic pigs alter aggressive and manipulative biting behaviour Beh Gen 45 117-126
Castagneacute V D Moeumlnnoz P A Finot and J C Maire 1993 Effects of diet-induced hyperthreoninemia Amino acid levels in the central nervous system and peripheral tissues Life Sci 53 1803-1810
Chamberlain B F R Ervin R O Pihl and S N Young 1987 The effect of raising or lowering tryptophan levels on aggression in vervet monkeys Pharm Biochem Beh 28 503-510
Centraal Veevoeder Bureau (CVB) 2011 Chemical compositions and nutritional values of feed ingredients CVB Lelystad The Netherlands
de Ridder K C L Levesque J K Htoo and C F M de Lange 2012 Immune system stimulation reduces the efficiency of tryptophan utilization for body protein deposition in growing pigs J Anim Sci 90 3485-3491
Edwards S 2006 Tail biting in pigs Understanding the intractable problem Vet J 171198-199 Ettle T and F X Roth 2004 Specific dietary selection for tryptophan by the piglet J Anim Sci 82 1115-1121 Ettle T and F X Roth 2005 Dietary preferences for feeds varying in threonine concentration by the piglet Phys Beh 85 289-
295 Ettle T and F X Roth 2009 Dietary selection for lysine by piglets at differing feeding regimen Livest Sci 122 259-263 Fraser D D E Bernon and R O Ball 1991 Enhanced attraction to blood by pigs with inadequate dietary protein
supplementation Can J Anim Sci 71 611-619 Gibbons J L G A Barr W H Bridger and S F Liebowitz 1979 Manipulations of dietary tryptophan Effects on mouse killing and
brain serotonin in the rat Brain Res 169 139-153 Gloaguen M N Le Flocrsquoh E Corrent Y Primot and J van Milgen 2014 The use of free amino acids allows formulating very low
crude protein diets for piglets J Anim Sci 92 637-644 Goossens X L Sobry F Tuyttens D Maes S de Smet F Nevens G Opsomer F Lommelen and R Geers 2007 A population-
based on-farm evaluation protocol for comparing the welfare of pigs between farms Anim Welfare 17 35 Harley S L A Boyle N E OConnell S J More D L Teizeira and A Hanlon 2014 Docking the value of pigmeat Prevalence and
financial implications of welfare lesions in Irish slaughter pigs Anim Welfare 23 275-285 Harper A E and J C Peters 1989 Protein Intake Brain amino acid and serotonin concentrations and protein self-selection J
Nutr 119 677-689 Heinonen M T Orro T Kokkonen C Munsterhjelm O Peltoniemi and A Valros 2010 Tail biting induces a strong acute phase
response and tail-end inflammation in finishing pigs Vet J 184 303-307 International Organization for Standardization (ISO) 2005a Animal feeding stuffs ndash Determination of amino acids content ISO
13903 Int Organ Stand Geneve Switzerland International Organization for Standardization (ISO) 2005b Animal feeding stuffs ndash Determination of tryptophan content ISO
13903 Organ Stand Geneve Switzerland Jansman A J M W Smink P van Leeuwen and M Rademacher 2002 Evaluation through literature data of the amount and
amino acid composition of basal endogenous crude protein at the terminal ileum of pigs Anim Feed Sci Tech 98 49-60
Jensen M B I Kyriazakis and A B Lawrence 1993 The activity and straw directed behaviour of pigs offered foods with different crude protein content Appl Anim Beh Sci 37 211-221
Jericho K and T Church 1972 Cannibalism in pigs Can Vet J 13 156-159 Kampman-van de Hoek E P Sakkas W J J Gerrits J J G C van den Borne C M C van der Peet-Schwering and A J M
Jansman 2015 Induced lung inflammation and dietary protein supply affect nitrogen retention and amino acid metabolism in growing pigs Brit J Nutr 113 414-425
Karlsson F O Svartstroumlm K Belaacutek C Fellstroumlm and M Pringle 2013 Occurrence of Treponema spp in porcine skin ulcers and gingiva Vet microbio 165 402-409
Kerr B J and R A Easter 1995 Effect of feeding reduced protein amino acid-supplemented diets on nitrogen and energy balance in grower pigs J Anim Sci 73 3000-3008
Kim J C B P Mullan B Frey H G Payne and J R Pluske 2012 Whole body protein deposition and plasma amino acid profiles in growing andor finishing pigs fed increasing levels of sulfur amino acids with and without Escherichia coli lipopolysaccharide challenge J Anim Sci 90 362-365
Koopmans S J M Ruis R Dekker H van Diepen M Korte and Z Mroz 2005 Surplus dietary tryptophan reduces plasma cortisol and noradrenaline concentrations and enhances recovery after social stress in pigs Phys Beh 85 469-478
Chapter 3
78
Kops M S E N de Haas T B Rodenburg E D Ellen G A H Korte-Bouws B Olivier O Guumlntuumlrkuumln J E Bolhuis and S M Korte 2013 Effects of feather pecking phenotype (severe feather peckers victims and non-peckers) on serotonergic and dopaminergic activity in four brain areas of laying hens (Gallus gallus domesticus) Phys Beh 120 77-82
Kops M S J B Kjaer O GuumlntuumlrKuumln K G C Westphal G A H Korte-Bouws B Olivier J E Bolhuis and S M Korte 2014 Serotonin release in the caudal nidopallium of adult laying hens genetically selected for high and low feather pecking behavior An in vivo microdialysis study Beh Brain Res 268 81-87
Kritas S K and R B Morrison 2007 Relationships between tail biting in pigs and disease lesions and condemnations at slaughter Vet Rec 160 149-152
Larsen C 1983 Tail biting in pigs New Zeal Vet J 31105-106 Le Bellego L and J Noblet 2002 Performance and utilization of dietary energy and amino acids in piglets fed low protein diets
Livest Prod Sci 76 45-58 Le Floch N F Gondret J J Matte and H Quesnel 2012 Towards amino acid recommendations for specific physiological and
patho-physiological states in pigs Proc Nutr Soc 71 425-432 Le Flocrsquoh N D Melchior and B Segraveve 2008 Dietary tryptophan helps to preserve tryptophan homeostasis in pigs suffering from
lung inflammation J Anim Sci 86 3473-3479 Lepage O O Tottmar and S Winberg 2002 Elevated dietary intake of L-tryptophan counteracts the stress-induced elevation of
plasma cortisol in rainbow trout (Oncorhynchus mykiss) J Exp Bio 205 3679-3687 Li P Y-L Yin D Li S Woo Kim and G Wu 2007 Amino acids and immune function Brit J Nutr 98 237-252 Marques B M F P P et al 2012 Influence of tail biting on weight gain lesions and condemnations at slaughter of finishing pigs
Pesq Vet Bras 32 Martiacutenez-Trejo G et al 2009 Aggressiveness and productive performance of piglets supplemented with tryptophan J Anim Vet
Adv 8 608-611 Massey K A C H Blakeslee and H S Pitkow 1998 A review of physiological and metabolic effects of essential amino acids
Amino Acids 14 271-300 McIntyre J and S Edwards 2002 An investigation into the effect of different protein and energy intakes on model tail chewing
behaviour of growing pigs Appl Anim Beh Sci 77 93-104 Melchior D B Segraveve and N Le Flocrsquoh 2004 Chronic lung inflammation affects plasma amino acid concentrations in pigs J Anim
Sci 82 1091-1099 Moinard C M Mendl C J Nicol and L E Green 2003 A case control study of on-farm risk factors for tail biting in pigs Appl
Anim Behav Sci 81 333-355 Moughan P J 1998 Protein metabolism in the growing pig In Kyriazakis I editor A Quantitative Biology of the Pig CABI
Publishing Oxon UK 299-331 Munsterhjelm C O Simola L Keeling A Valros and M Heinonen 2013 Health parameters in tail biters and bitten pigs in a
casendashcontrol study Anim 7 814-821 NRC 2012 Nutrient Requirements of Swine 11th ed Natl Acad Press Washington DC Parmentier H K T B Rodenburg G De Vries Reilingh B Beerda and B Kemp 2009 Does enhancement of specific immune
responses predispose laying hens for feather pecking Poultr Sci 88 536-542 Pringle M A Backhans F Otman M Sjoumllund and C Fellstroumlm 2009 Isolation of spirochetes of genus Treponema from pigs with
ear necrosis Vet Microbio 139 279-283 Purves D G J Augustine D Fitzpatrick L C Katz A S LaMantia J O McNamara and S M Williams Neurotransmission in the
visceral motor system In M A Sunderland editor Neuroscience 2nd edition 2001 Sinauer associates Inc USA Rakhshandeh A J K Htoo and C F M de Lange 2010 Immune system stimulation of growing pigs does not alter apparent ileal
amino acid digestibility but reduces the ratio between whole body nitrogen and sulfur retention Livest Sci 134 21-23 Ren M X T Liu X Wang G J Zhang S Y Qiao and X F Zeng 2014 Increased levels of standardized ileal digestible threonine
attenuate intestinal damage and immune responses in Escherichia coli K88+ challenged weaned piglets Anim Feed Sci Tech 195 67-75
Rodenburg T B and P Koene 2007 The impact of group size on damaging behaviours aggression fear and stress in farm animals Appl Anim Beh Sci 103 205-214
Rodwell V W 2003 Conversion of amino acids to specialized products In Murray R K Granner D K Mayes P A and Rodwell V W editors Harperrsquos Illustrated Biochemistry 26th edition Mc Graw-Hill companies USA 264-269
Roth F X C Meindl and T Ettle 2006 Evidence of a dietary selection for methionine by the piglet J Anim Sci 84 379-386 Salomon R M C M Mazure P L Delgado P Mendia and D S Charney 1994 Serotonin function in aggression The effect of
acute plasma tryptophan depletion in aggressive patients Biol Psych 35 570-572 Schroslashder-Petersen D L and H B Simonsen 2001 Tail Biting in Pigs Vet J 162 196-210 Sutherland M A B L Davis and J J McGlone 2011 The effect of local or general anesthesia on the physiology and behavior of
tail docked pigs Anim 51237-1246 Taylor N R D C J Main M Mendl and S A Edwards 2010 Tail-biting A new perspective Vet J 186 137-147 Ursinus W W C G Van Reenen I Reimert and J E Bolhuis 2014a Tail biting in pigs blood serotonin and fearfulness as pieces
of the puzzle PLOS ONE 9 e107040 Ursinus W W H J Heinonen A C Bartels N Dijvesteijn C G van Reenen and J E Bolhuis 2014b Damaging biting behaviors in
intensively kept rearing gilts The effect of jute sacks and relations with production characteristics J Anim Sci 92 5193-5202
Valros A and M Heinonen 2015 Save the pig tail Porc Health Managem 1 1-7 Van de Weerd H A C M Docking J E L Day P J Avery and S A Edwards 2003 A systematic approach towards developing
environmental enrichment for pigs Appl Anim Beh Sci 84 101-118
Chapter 3
79
van der Meer Y A Lammers A J M Jansman M M J A Rijnen W H Hendriks and W J J Gerrits 2016 Performance of pigs kept under different sanitary conditions affected by protein intake and amino acid supplementation J Anim Sci 94 4704-4719
van Hierden Y M S F de Boer J M Koolhaas and S M Korte 2004 The control of feather pecking by serotonin Beh Neurosci 118 575
Winberg S Oslash Oslashverli and O Lepage 2001 Suppression of aggression in rainbow trout (Oncorhynchus mykiss) by dietary l-tryptophan J Exp Bio 204 3867-3876
Wu G 2009 Amino acids metabolism functions and nutrition Amino acids 37 1-17 Wurtman R J and J D Fernstrom 1975 Control of brain monoamine synthesis by diet and plasma amino acids Am J Clin Nutr
28 638-647 Zonderland J J M B M Bracke L A den Hartog B Kemp and H A M Spoolder 2010 Gender effects on tail damage
development in single- or mixed-sex groups of weaned piglets Livest Sci 129 Zonderland J J M Wolthuis-Fillerup C G van Reenen M B M Bracke B Kemp L A den Hartog and H A M Spoolder 2008
Prevention and treatment of tail biting in weaned piglets Appl Anim Behav Sci 110
Chapter 3
80
SUPPLEMENTAL TABLES
Supplemental table I Ingredient and nutrient composition of the starter diets
LP1 NP1
Item AA-B2 AA-S2 AA-B AA-S
Ingredient gkg of feed
Maize 32000 32000 40000 40000
Soybean meal 18202 18200 22754 22754
Barley 16000 16000 20000 20000
Wheat 4553 4553 5691 5691
Maize starch 20679 20464 4065 3790
Sugarcane molasses 2000 2000 2000 2000
Limestone 1394 1394 1411 1411
Monocalcium phosphate 999 999 893 893
Soybean oil 1065 1098 1598 1638
Vitamin + mineral mix3 500 500 500 500
Salt 319 319 383 383
L-lysine HCl 195 194 235 235
Titanium dioxide 250 250 250 250
Sodium bicarbonate 258 258 134 134
L-threonine 060 146 063 171
L-tryptophan 003 031 000 037
DL-methionine 023 094 023 113
Cellulose4 1500 1500 000 000
Nutrients calculated gkg
NE MJkg5 980 980 980 980
DM 8896 8898 8932 8849
Crude protein 1380 1360 1680 1670
Starch4 4741 4723 4100 4077
Lys6 860 860 1050 1050
Thr6 540 620 660 740
Trp6 170 190 200 230
Met + Cys6 430 480 520 590
Ile6 560 560 690 680
Arg6 830 840 1050 1030
Phe6 660 660 820 810
His6 340 340 420 420
Leu6 109 1100 1360 1340
Tyr6 440 450 570 570
Val6 640 640 790 770 1 LP = low CP concentration diet NP = normal CP concentration diet
2 AA-B = basal dietary AA profile AA-S= supplemented dietary AA profile containing 20 more Met Thr and Trp compared with the basal profile 3 Supplied the following per kilopgram of diet 30 mg riboflavin 20 mg niacine 20 mg d-pantothenic acid 10 mg choline chloride 0015 mg cyanocobalamin 40 mg dl-α-tocopheryl acetate 15 mg menadione 6000 IU retinyl acetate 1200 IU cholecalciferol 02 mg folic acid 10 mg thiamin 10 mg pyridoxine HCl 50 mg manganese oxide 267 mg iron SO4middotH2O 60 mg copper SO4middot5H2O 140 mg zinc SO4middotH2O 044 mg disodium selenium trioxide10 mg potassium iodate 4 Opticell (Agromed Austri GmbH Kremsmuumlnster Austria)
5 Based on chemical composition digestibility and energy value for pigs from the Centraal Veevoeder Bureau livestock feed table (CVB 2011) 6 Analyzed values
Chapter 3
81
Supplemental table II Ingredient and nutrient composition of the grower diets
LP1 NP1
Item AA-B2 AA-S2 AA-B AA-S
Ingredient gkg of feed
Maize 40000 40000 50000 50000
Soybean meal 13815 13815 17269 17269
Barley 17136 17136 21419 21419
Maize starch 19919 19724 4334 4086
Wheat 2000 2000 2000 2000
Sugarcane molasses 1311 1311 1333 1333
Limestone 862 862 767 767
Monocalcium phosphate 919 948 1020 1057
Soybean oil 500 500 500 500
Vitamin + mineral mix3 395 395 361 361
Salt 245 245 292 292
L-lysine HCl 250 250 250 250
Titanium dioxide 156 156 200 200
Sodium bicarbonate 387 387 152 152
L-threonine 072 149 074 172
L-tryptophan 021 046 022 055
DL-methionine 012 076 007 087
Cellulose4 2000 2000 000 000
Nutrients calculated gkg
NE MJkg5 984 984 984 984
DM 8837 8859 8828 8877
Crude protein 1240 1240 1520 1520
Starch5 4971 4955 4489 4469
Lys6 800 790 970 1000
Thr6 510 590 590 700
Trp6 156 175 191 216
Met + Cys6 398 452 476 558
Ile6 480 470 590 580
Arg6 720 700 900 900
Phe6 580 570 710 710
His6 300 300 370 360
Leu6 100 990 123 123
Tyr6 380 390 500 500
Val6 570 580 690 690 1 LP = low CP concentration diet NP = normal CP concentration diet
2 AA-B = basal dietary AA profile AA-S= supplemented dietary AA profile containing 20 more Met Thr and Trp compared with the basal profile 3 Supplied the following per kilogram of diet 30 mg riboflavin 20 mg niacine 20 mg d-pantothenic acid 10 mg choline chloride 0015 mg cyanocobalamin 40 mg dl-α-tocopheryl acetate 15 mg menadione 6000 IU retinyl acetate 1200 IU cholecalciferol 02 mg folic acid 10 mg thiamin 10 mg pyridoxine HCl 50 mg manganese oxide 267 mg iron SO4middotH2O 60 mg copper SO4middot5H2O 140 mg zinc SO4middotH2O 044 mg disodium selenium trioxide10 mg potassium iodate 4 Opticell (Agromed Austri GmbH Kremsmuumlnster Austria)
5 Based on chemical composition digestibility and energy value for pigs from the Centraal Veevoeder Bureau livestock feed table (CVB 2011) 6 Analyzed values
Chapter 3
82
Supplemental table III Ingredient and nutrient composition of the finisher diets LP1 NP1 Item AA-B2 AA-S2 AA-B AA-S
Ingredient gkg of feed
Maize 36010 36010 45010 45010 Soybean meal 11570 11570 14460 14460 Barley 24000 24000 30000 30000
Maize starch 18720 18530 3640 3410
Wheat 2000 2000 2000 2000
Sugarcane molasses 1220 1220 1250 1250
Limestone 740 740 650 650
Monocalcium phosphate 1400 1430 1320 1360
Soybean oil 500 500 500 500
Vitamin + mineral mix3 230 230 260 260
Salt 240 240 280 280
L-lysine HCl 250 250 250 250
Titanium dioxide 530 530 300 300
Sodium bicarbonate 000 060 000 070
L-threonine 070 140 070 160
L-tryptophan 010 040 010 040
DL-methionine 010 010 000 000
Cellulose4 2500 2500 000 000
Nutrients calculated gkg
NE MJkg5 984 984 984 984
DM 8859 8865 8816 8877
Crude protein 1320 1260 1510 1480
Starch5 5417 5094 5417 5402
Lys6 800 760 890 890
Thr6 530 560 590 650
Trp6 151 162 168 191
Met + Cys6 403 422 468 504
Ile6 490 460 570 560
Arg6 730 680 820 820
Phe6 600 560 680 680
His6 310 290 350 350
Leu6 1010 960 1190 1130
Tyr6 400 370 470 470
Val6 600 570 660 660 1 LP = low CP concentration diet NP = normal CP concentration diet 2 AA-B = basal dietary AA profile AA-S= supplemented dietary AA profile containing 20 more Met Thr and Trp compared with
the basal profile 3 Supplied the following per kilogram of diet 30 mg riboflavin 20 mg niacine 20 mg d-pantothenic acid 10 mg choline chloride
0015 mg cyanocobalamin 40 mg dl-α-tocopheryl acetate 15 mg menadione 6000 IU retinyl acetate 1200 IU cholecalciferol
02 mg folic acid 10 mg thiamin 10 mg pyridoxine HCl 50 mg manganese oxide 267 mg iron SO4middotH2O 60 mg copper SO4middot5H2O
140 mg zinc SO4middotH2O 044 mg disodium selenium trioxide10 mg potassium iodate 4 Opticell (Agromed Austri GmbH Kremsmuumlnster Austria)
5 Based on chemical composition digestibility and energy value for pigs from the Centraal Veevoeder Bureau livestock feed table
(CVB 2011) 6 Analyzed values
Chapter 3
83
Supplemental table IV Formulated dietary amino acid profiles relative to lysine on apparent ileal digestible level fed in combination with different dietary protein levels to pigs kept under different sanitary conditions
Amino acid AA-B profile1 AA-S profile1
Lysine 100 100
Methionine + cysteine 51 61
Threonine 59 71
Tryptophan 18 22
Arginine 87 87
Histidine 43 43
Isoleucine 53 53
Leucine 101 101
Phenylalanine 54 54
Valine 69 69 1 AA-B = basal dietary amino acid profile AA-S profile = supplemented dietary amino acid profile with 20 extra methionine threonine and tryptophan than basal profile
Supplemental table V The percentage of pigs in different tail damage score categories from observations taken across all phases for low and high sanitary conditions
Score LSC HSC
1 156 185
2 694 646
3 145 165
4 05 05
5 00 00
Score 1 No tail damage 2 Bite marks 3 Small wound 4 Medium wound part of tail missing and 5 Severe wound no tail is left LSC low sanitary condition pigs HSC high sanitary condition pigs Supplemental table VI The percentage of pigs in different ear damage score categories from observations taken across all phases for low and high sanitary conditions
Score LSC HSC
1 734 774
2 208 156
3 13 14
4 01 08
5 44 47
Score 1 No ear damage 2 Top or bottom lesions 3 Top and bottom lesions 4 Severe damage part of the ear is missing and 5 ear necrosis LSC low sanitary condition pigs HSC high sanitary condition pigs
Chapter 4
Low sanitary conditions increase maintenance energy
expenditure and decrease incremental protein efficiency
in growing pigs
Y van der Meer12 AJM Jansman3 and WJJ Gerrits1
To be submitted to Journal of Nutrition
1Animal Nutrition Group Wageningen University Wageningen 6708 WD The Netherlands
2De Heus Animal Nutrition Ede 6717 VE The Netherlands 3Wageningen UR Livestock Research Wageningen 6708 WD The Netherlands
Chapter 4
86
ABSTRACT
Background Requirements for energy as well as for some essential amino acids (EAA) are
known to be influenced by the nature and extent of immune system stimulation Most
studies on this topic use immune challenge models mimicking clinical conditions making
results of such studies difficult to extrapolate to practical conditions where subclinical
infections prevail Therefore a contrast in sanitary conditions was applied to study effects
of chronic low grade immune system activation on nutrient partitioning
Objective To quantify the difference in energy requirements for maintenance and in
incremental efficiencies for deposition of dietary energy and protein in the body of clinically
healthy pigs kept under low or high sanitary conditions fed a basal diet either or not
supplemented with additional methionine (Met) threonine (Thr) and tryptophan (Trp)
Methods In a 2 times 2 factorial arrangement 24 groups of 6 pigs each were allocated to either
a low sanitary condition (LSC) or high sanitary condition (HSC) and were offered two
different diets having either a basal or a dietary AA profile supplemented with Met Thr and
Trp For each group of pigs complete energy and nitrogen balances were determined
during two consecutive weeks during which feed was available ad libitum or at 70 of ad
libitum Following the second week the fasting heat production (FHP) was determined
after a 25 h period
Results Low SC conditions increased FHP from 696 to 750 kJ(kg BW06 d) regardless AA
supplementation The incremental efficiency of ingested N for retention was reduced in LSC
pigs from 73 to 53 but incremental efficiencies of DE for fat deposition were unaffected
by the experimental treatments
Conclusions Chronic low grade immune system stimulation by imposing low sanitary
conditions to pigs increases FHP Under such conditions the incremental efficiency of N
utilization for body protein deposition is reduced but the incremental efficiency of
absorbed energy for energy or fat deposition are unaffected Supplementation of Met Thr
and Trp did not affect any of the incremental efficiencies measured
Keywords efficiency pig energy sanitary conditions health amino acid
Chapter 4
87
INTRODUCTION
For developing concepts in clinical nutrition of animals changes in protein and energy
metabolism are often studied using models such as im or ip administered
lipopolysaccharide (LPS) (eg (Rakhshandeh et al 2010 de Ridder et al 2012 Kim et al
2012) or sc Complete Freundrsquos Adjuvant (CFA) (Melchior et al 2004 Le Flocrsquoh et al
2008 Kampman-van de Hoek et al 2015) provoking clinical symptoms It is questionable
whether results obtained from such models apply to conditions of low grade chronic
immune system stimulation (ISS) as often encountered in animal production systems
Under subclinical health conditions quantifying alterations in proteinAA and energy
requirements are important for developing targeted nutritional strategies
Clinical ISS has been shown to increase the metabolism and requirements of some essential
amino acids (EAA) such as methionine (Met) + cysteine (Rakhshandeh et al 2010 Litvak et
al 2013) and tryptophan (Trp) (Melchior et al 2004 Le Flocrsquoh et al 2008 Le Floch et al
2012) relative to lysine In a previous study (van der Meer et al 2016) 20 extra dietary
supplementation of Met threonine (Thr) and Trp relative to lysine (Lys) resulted in
increased growth and GF ratio for pig kept under either low or high sanitary conditions
The beneficial effect however was greater for LSC pigs indicating that low grade chronic
ISS increases the requirements for these AA
Apart from AA metabolism energy metabolism is also found to be influenced during ISS
(Benson et al 1993 Humphrey and Klasing 2004) Responses such as fever and acute
phase protein production in response to ISS consume energy (Lochmiller and Deerenberg
2000 Parmentier et al 2002) For example Lochmiller and Deerenburg (2000) described
that stimulated macrophages like other immune cells use energy to a level comparable to
a maximally functioning heart muscle Immune challenges in pigs often result in decreased
average daily gain (ADG) for ISS treatment groups which cannot be completely accounted
for by a related decreased average daily feed intake (ADFI) as reported in a meta-analysis
by Pastorelli et al (2012b) They estimated a 7 reduction of feed efficiency for respiratory
diseases 12 for poor housing conditions and 30 for bacterial infections of the gastro-
intestinal tract
The change in energy efficiency during ISS might be due to an increased energy
expenditure for the immune system reflected in an increase in the resting or fasting heat
production (FHP) Furthermore an the priority for fat deposition during ISS can be altered
as the consequence of a decreased priority for protein deposition (Lochmiller and
Deerenberg 2000) Alternatively it may be beneficial for the animal to have increased
body fat stores preparing for increased requirements for energy for the future under such
conditions For example Parmentier et al (2002) found an increased fat but not protein
deposition in chicken exposed to a repeated LPS challenge compared with unchallenged
chickens
Chapter 4
88
The effect of ISS on protein and fat deposition is the final result of altered requirements for
the use of nutrients for maintenance purposes and of changes in responses of nutrient
deposition to incremental intake of protein or energy via the diet Hence studying
relationships between ISS and nutrient partitioning requires estimates for nutrient
requirements for maintenance and values for incremental efficiencies of energy and
protein deposition in the body
In this study we measured incremental efficiencies for deposition of dietary energy and
protein in the body of clinically healthy pigs kept under low and high sanitary conditions
fed a basal diet either or not supplemented with additional MET Thr and Trp in ratio to
Lys and measured FHP as a proxy for maintenance energy expenditure Within-day
patterns of heat production and carbohydrate and fat oxidation are reported elsewhere
Chapter 4
89
MATERIALS AND METHODS
The present study was carried out at the experimental facilities of Wageningen University
the Netherlands The experimental protocol was approved by the Animal Care and Use
Committee of Wageningen University The Netherlands
Experimental design In a 2 times 2 factorial arrangement 24 groups of 6 pigs each were
allocated to either a low (LSC) or high sanitary condition (HSC) and were offered one of two
diets having either a basal (AA-B) or supplemented dietary AA profile (AA-S) Pigs were used
from week 3 till week 12 of age From week 3 until 8 pigs were adapted to the different
sanitary conditions after which the dietary treatments were introduced Energy balances
studies were performed from week 9 to 12 During week 9 pigs were allowed ad libitum
access to their diets During week 10 pigs were fed twice daily at 70 of the measured
feed intake during week 9 During week 12 pigs were allowed restricted access to their
diets for 2d prior to a 25h period of feed deprivation for the measurement of FHP These
three experimental weeks are referred to as the ad lib feeding period the restricted
feeding period and the fasting period
Animals and treatments In total 144 (Topigs 20 times Danish Duroc Topigs Helvoirt The
Netherlands Danbred International Herlev Denmark) newborn female piglets were
selected at one week of age in three subsequent batches of 48 pigs on a commercial farm
in The Netherlands and allocated to either the LSC or HSC treatment Per farrowing room
half of the female piglets were selected for LSC and the other half for HSC treatment Only
HSC piglets received vaccinations during the period of the first nine weeks of age At one
week of age HSC piglets were vaccinated against Mycoplasma hyopneumoniae (Porcilis M
Hyo MSD Animal Health Boxmeer The Netherlands by subcutaneous injection in the neck
Piglets of both LSC and HSC treatments were housed in the same rooms until weaning at 21
plusmn 02 d of age
At weaning (at 3 weeks of age) LSC and HSC piglets were transported to the research farm
in Wageningen (plusmn70 km) and housed in separate rooms (LSC and HSC room) Upon arrival
at the research farm all pigs were weighed and allocated to their pen within sanitary
condition (SC) treatment based on BW in order to minimize variation between pens (LSC
batch 1 57 kg LSC batch 2 59 kg LSC batch 3 59 kg HSC batch 1 55 kg HSC batch 2
52 kg HSC batch 3 59 kg) Upon arrival (plusmn 21 d of age) and 2 d thereafter HSC pigs
received an antibiotic injection (Fenflor AUV Cuijk The Netherlands 1 mL per pig im per
time) At the research facility the vaccination program for HSC pigs was continued In week
4 Mycoplasma hyopneumoniae Porcine circovirus type 2 Porcine Reproductive and
Respiratory Syndrome (PRRS) and Lawsonia intracellularis (Porcilis M Hyo Porcilis Circo
Porcilis PRRS all MSD Animal Health Boxmeer The Netherlands and Enterisol Ileitis
Chapter 4
90
Boehringer Ingelheim Alkmaar The Netherlands) at 6 weeks of age against Actinobacillus
pleuropneumoniae and Influenza A virus (Porcilis APP MSD Animal Health Boxmeer The
Netherlands and Gripovac3 Merial Velserbroek The Netherlands) and at 8 weeks of age
against Actinobacillus pleuropneumoniae and Influenza A virus (Porcilis APP MSD Animal
Health Boxmeer The Netherlands and Gripovac3 Merial Velserbroek The Netherlands)
by subcutaneous injection in the neck or in case of Enterisol by oral drench
Housing After arrival until 9 weeks of age pigs were housed in identical pens located in
either a room in which HSC or LSC conditions were applied The HSC room was intensively
cleaned before arrival of each batch of pigs once with high pressure washing and once
disinfected with a mixture of hydrogen peroxide and peracetic acid gas (Destbest 400
Frans Veugen Bedrijfshygiene BV Nederweert The Netherlands) with an ecofogger
(Coldfogger Frans Veugen Bedrijfshygiene BV Nederweert The Netherlands) for 2 h In
addition all people entering the HSC room were obliged to shower change clothes and
were a hairnet and face mask The manure in HSC pens was removed daily
The LSC room was not cleaned and no hygiene protocol was applied A mixture of fresh
manure of three commercial pig farms obtained fresh weekly was spread weekly in the
LSC pens to increase pathogenic pressure The LSC pigs were exposed to nylon bags
containing a mixture of pig manure and straw ground to pass a 1 mm screen as a model
for dust The bags were mounted on a chain above the LSC pens for pigs to play with The
LSC pigs did not receive any medication
During the measurement period (10 until 13 weeks of age) within each batch groups of six
pigs were housed in one of eight identical 40-m3 respiration chambers described by
Heetkamp et al (2015) Each chamber contained one pen of 175 times 285 meter with 40
slatted floor During this period pre-weighed quantities of fresh manure and dust were
introduced weekly in LSC chambers similar to their introduction in the pre-experimental
period The HSC chambers were cleaned and disinfected before start measurement at the
ad lib period (week 9 of age) as was done with the rooms for the pre-period During the
measurement period a strict hygiene protocol was adhered to when entering the HSC
chambers similar to the one described above Temperature in the chambers was
maintained at 20 degC relative humidity at 65 and air velocity at lt 02 ms Pigs were
exposed to artificial light from 0730 to 1930 h (420 lux) and to darkness (35 lux) during the
remainder of the day
Diets and feeding From arrival (start week 3) until week 5 (12 d post weaning) all pigs were
allowed ad libitum access to a commercial diet containing 164 gkg crude protein (CP) 180
kJg gross energy (GE) (Comfort 3 De Heus Animal Nutrition The Netherlands) and from
week 6 until week 9 containing 170 gkg CP and 178 kJg GE (Comfort 4 De Heus Animal
Nutrition The Netherlands) From week 9 onwards pigs were allocated to one of two
treatment diets either containing a basal or a supplemented AA-profile The diets were
Chapter 4
91
formulated to be slightly limiting in Lys (95 of the requirement value for lysine relative to
the dietary net energy value (NE) to prevent that the dietary energy concentration could
limit the growth performance of the pigs in the study (NRC 2012)
The AA-B diet was designed as described in van der Meer et al (2016) Briefly this was
developed by a factorial approach to cover AA requirements for maintenance (skin and hair
losses intestinal endogenous losses and cell turnover) and whole body protein deposition
The AA-S diet was derived from the AA-B profile by increasing the Met Thr and Trp ratio
relative to Lys by 20
The ingredient and nutrient composition of the experimental diets is shown in Table 1 The
diets were isocaloric on an NE basis and contained TiO2 as indigestible marker for
measuring fecal nutrient digestibility The diets were analyzed for AA composition by acid
hydrolysis at 110degC for 23 h and ion-exchange chromatography with post-column
derivatization with ninhydrin and Trp by alkaline hydrolysis at 110 degC for 20 h followed by
ion-exchange chromatography and fluorescence detection (ISO 2005b ISO 2005c) During
the ad libitum feeding period pigs were fed ad libitum from a single space feeder During
the restricted feeding period pigs were fed 70 of their ad libitum intake divided over two
meals at 0730 h and 1530 h fed from a through which allowed all 6 pigs to eat at the same
time Per meal pigs had 30 minutes to eat their meal after which the through was closed to
prevent contamination of feeding troughs with urine
Measurements During the ad libitum restricted feeding period and fasting period gas
exchange of each group of pigs was measured in the calorimetric chambers in 6-min
intervals by measuring exchange of O2 CO2 and CH4 as described by Heetkamp et al
(2015) A CO2 recovery test with the respiration chambers was performed immediately
prior to the start of the experiment according to procedures described by Heetkamp et al
(2015) In the eight chambers 99 964 979 1007 987 983 992 and 1005 of the
CO2 released was recovered A radar device was mounted above each chamber completely
covering the housing area of the pigs to measure physical activity continuously during the
ad libitum restricted and fasting period Complete energy and nitrogen (N) balances were
determined in for the ad libitum and the restricted period (Supplement tables I to IV)
Individual pigs were weighted before and after each balance week In each balance week
manure was collected quantitatively weighed mixed thoroughly and sampled for analysis
of GE DM ash and N Aerial NH3 was collected from a quantified sample of the outgoing
air after trapping in H2SO4 and NH4+ in water that condensed on the heat exchanger For
LSC pigs the contribution of the manure and dust introduced into the pens to the energy
and nitrogen balances was quantified
From each group of six pigs a representative rectal feces sample was obtained in each
balance week by sampling each pig once during 3 subsequent days Fecal samples of
individual pigs were pooled by weight per chamber and stored at -20 for later analysis of
GE DM neutral detergent fibre (NDF) and N and worms (coccidian parasite Ascaris
Chapter 4
92
TrichostrongulusStrongylus other endoparasites P217 De Gezondheidsdienst voor
Dieren Deventer The Netherlands) After the restricted feeding period pigs had restricted
feeding for 2 more days (01 kg diet ∙ kg BW-06∙ d-1) after which they were fasted for 25 h to
measure FHP
Dissection From the fasting heat measurement in the fasting heat period pigs were fed ad
libitum for 4-5 days until dissection At the dissection day three pigs per room were
euthanized on one day between 830 and 1500 h to collect blood samples for further
analysis and lungs for lesion scores The order of euthanizing was balanced per room and
treatment group Pigs were restrained and anaesthetized with an im injection in the neck
with in total 6 mg Zoletilkg BW (Zoletil Virbac Laboratories Carros France) After sedation
they were euthanized by an iv injection of 24 mgkg BW of sodium pentobarbital (Euthasol
20 AST Farma BV The Netherlands) in the ear vein and subsequently blooded by
incision in the neck Blood samples were collected during bleeding in two 9-mL tubes per
animal were filled 1 EDTA tube for blood cell counts (Vacuette Greiner Bio-One
Kremsmuumlnster Austria) and 1 serum tube (Vacuette) for acute-phase protein and natural
antibody (Nab) analysis Blood samples collected in EDTA tubes were immediately stored on
ice and transported to the lab where blood cell counts were performed using a Microcell
counter (Sysmex pocH- iV Diff Toa Medical Electronics Co Ltd Kobe Japan) Blood
samples in serum tubes were allowed to clot for 1 h at room temperature after which
serum was collected after centrifugation for 10 min at 5251 times g at room temperature and
stored at -80degC pending analysis of haptoglobin (Pig haptoglobin Elisa kit catalog number
ab205091 Abcam Cambridge UK) pig major acute-phase protein (Cusabio Pig-MAP ELISA
catalog number CSB-E13425p Cusabio Biotech Co Ltd Wuhan Hubei Province China) C-
reactive protein (CRP Pig CRP Elise kit catalog number ab205089 Abcam Cambridge UK)
and Nab titers against keyhole limpet hemocyanin (KLH) types IgG and IgM were
determined as described by de Koning et al (2015) with the minor modification that a 4-
step dilution (40 160 640 2560 times diluted) of the sera was made instead of a 3-step
dilution
Chemical analysis Samples of diets were pooled per batch of pigs and analysed for DM ash
N GE Ti and NDF content (ISO 1998 ISO 1999 ISO 2005a) Pooled fecal samples were
analysed for DM N GE Ti and NDF content For determination of DM content faeces
were freeze-dried and feces and diets were ground to pass a 1-mm screen before analysis
using a Retsch ZM 100 mill (Retsch GmbH Haan Germany) Dry matter content was
determined by drying at 103 degC Crude ash content was determined by combustion at 550
degC Nitrogen content was determined by kjeldahl in fresh material Neutral detergent fiber
content was analysed according to the method of van Soest et al (1991) with prior
amylase treatment The GE content was analysed using bomb calorimetry (model C7000
calorimeter IKA Werke GmbH amp Co KG Staufen Germany) Ti was analysed after
Chapter 4
93
hydrolysis with concentrated sulphuric acid in the presence of a copper catalyst at 420 degC
and subsequent addition of peroxide (Short et al 1996 Myers et al 2004) All analysis
were carried out in duplicate
Calculations Gross energy intake was calculated as feed intake (supply minus refusals)
multiplied by the GE content of the diet Intake of metabolizable energy (ME) was
determined by subtracting energy excretion in manure and CH4 from the gross energy
intake Heat production (HP) was calculated from consumed volumes of O2 produced
volumes of CO2 and CH4 and quantitative urinary N excretion (Brouwer 1965) and
physical activity of the pigs as measured by radar (Gerrits et al 2015) Energy retention
was calculated as the difference between ME intake and HP Nitrogen retention was
calculated as N intake minus N losses in manure aerial NH3 and NH4+ in water that
condensed on the heat exchanger Protein retained (N retention times 625) and energy
retained as protein (protein retained times 237 kJg) were calculated from N retention Energy
retained as fat was calculated from the difference between total energy retained and
energy retained as protein in the body Apparent total tract digestibility for DM GE NDF
and N was calculated using TiO2 as an indigestible marker (Kotb and Luckey 1972)
Incremental efficiencies and incremental digestion coefficients From data on parameters
related to energy and N utilization and deposition in the body measured in the ad lib and
restricted feeding period incremental energy and nutrient efficiencies were calculated as
the difference in a response parameter X divided by the difference in dietary intake
between the ad lib and restricted feeding period (Fig 41) The incremental efficiency of
energy retained in the body was thus calculated as the increase in energy retained (kJ∙kg
BW-06∙d-1) per extra unit of GE intake digestible energy (DE) or ME intake (kJ∙kg BW-
06∙d-1) Likewise the incremental efficiency of N retention was expressed as a percentage
of extra units of N retained (g N∙kg BW-1∙d-1) per extra unit of gross or digestible N intake
(g N∙kg BW-1∙d-1) Analogously incremental apparent total tract digestion coefficients for
all nutrients analysed were calculated as the difference in digestible nutrient intake
between the ad libitum and restricted feeding periods divided by the difference in gross
intake of that nutrient between both feeding periods (all in gkg BW) As incremental
efficiencies are dependent on the level of feeding (Labussiegravere et al 2011) we chose to
determine these values using feed intake levels close to the maximum voluntary intake ic
using first a period of ad lib feed intake followed by a period of restricted supply set at 70
of the voluntary feed intake
Chapter 4
94
Figure 41 Example for calculating incremental efficiency of intake converted to parameter X The difference in measured parameter X in the ad lib and restricted feeding period divided by the difference in intake between the ad lib and restricted feeding period The outcome is equal to the slope of the equation between the points in the graph and equals the incremental efficiency
Fasting heat production and resting metabolic rate Two days after termination of the
restricted feeding period pigs were fasted in the respiration chambers for measurement of
FHP for 25 h ic from after the morning meal provided at 0730 until 0900 am on the next
day For the ad libitum and the restricted feeding period and the FHP measurement
separately HP was partitioned between heat production related to physical activity and
resting metabolic rate (RMR) using penalised β-spline regression procedures developed
and described by van Klinken et al (2012) The FHP was calculated as the average RMR
during the last 2 h of feed deprivation By using this method there were three missing
values out of 24 observations in total Parameters related to heat production or energy
balance were scaled to BW060 according to Noblet et al (1999) Parameters related to
digestion or N retention were scaled to BW
Statistical analysis Data were analyzed using the GLM procedure of SAS (SAS 93 SAS Inst
Inc Cary NC) with pen as experimental unit for all parameters For all data the normality
of the distribution of studentized residuals was assessed by the ShapirondashWilk statistic If
required transformation of data was performed to obtain normal distribution of residuals
Sanitary conditions diet batch and their interactions were used as fixed effects Values are
presented as least squares means plusmn SEM Effects were considered significant at P le 005
and a trend was defined as 005 lt P le 010
Par
ame
ter
X
Intakerestricted feeding ad lib feeding
period
slope = incrementalefficiencyre
stri
cted
fee
din
g p
erio
dad
lib
fee
din
g p
erio
d
Chapter 4
95
RESULTS
One pig had a volvulus and died just before entering the respiration chambers Therefore
one pen had five instead of six animals in the experimental period No clinical signs of
illness were observed during the experiment in the other pigs All fecal samples were found
to be negative for Ascaris Eimeria spp Trichostrongylus and other endoparasites Five out
of 36 LSC pigs (13) and 8 out of 36 HSC pigs (22) had a small pneumonia lesion in the
lungs at dissection The remainder of the pigs had no lung lesions
In the restricted feeding period pigs were offered 70 of the feed intake of the ad libitum
feeding period supplied in two meals per day Not all groups consumed the feed supplied
within 30 min leading to a contrast in feed intake between periods slightly exceeding the
30 anticipated 39 for LSC and 31 for HSC Due to a technical problem in batch 2 and 3
with the device measuring physical activity in one chamber of the LSC treatment and one
chamber in the HSC treatment the activity measurements in these chambers were not
considered reliable and were therefore discarded
The results of the energy and nitrogen balances are presented as incremental efficiencies
The energy and nitrogen balances of the groups of pigs during the ad libitum and restricted
feeding period are presented in supplemental tables I-IV To facilitate interpretation of
treatment differences in these tables al parameters were standardized to the same level of
feed intake within period by including GE intake as a covariate in the statistical model
Performance Mean BW at weaning was greater for LSC pigs (58 plusmn 01 kg) compared with
HSC pigs (56 plusmn 01 kg P le 001 Table 42) The difference in mean BW at weaning between
sanitary conditions (SC) differed between batches (interaction batch SC P le 001) The
difference in BW for LSC and HSC pigs in batch 2 was greater (+07 plusmn 01 kg) than for batch
1 (+02 plusmn 01 kg) and batch 3 (00 plusmn 01 kg) Mean BW at weaning of batch 3 pigs (59 plusmn 01
kg) was greater compared with batch 1 and 2 pigs (56 plusmn 01 kg P le 001) A batch effect
was still observed for the mean BW at dissection (P le 001) The BW at the dissection day
was lower for LSC (284 plusmn 08 kg) compared with HSC pigs (380 plusmn 08 kg P le 005)
During the ad libitum feeding period ADFI ADG and GF were on average 9 22 and 10
higher in HSC pigs compared with LSC pigs for ADFI ADG and GF respectively (all P lt
001) depending on batch (SC times batch all P le 0001) Differences between SC for these
parameters were in the same direction for ADG (+6 +145 and +245 gd for batch 1 2 and
3 respectively) but not for ADFI (-77 +308 and +81 gd for batch 1 2 and 3 respectively)
and GF (+004 -003 and +016 gg for batch 1 2 and 3 respectively) In the restricted
feeding period pigs were restricted to the level of their intake in the ad libitum feeding
period Hence treatment effects during the ad lib feeding period for ADFI ADG and GF
ratio were sustained in the restricted week
Chapter 4
96
Acute-phase proteins natural antibodies against keyhole limpet hemocyanin in serum and
blood cell counts The LSC pigs showed greater (740 μgmL) haptoglobin and lower (54
μgmL) CRP concentrations in serum than HSC pigs (P le 005 Table 43) The LSC pigs had
(02 times 1012L) a lower RBC count and a (04 mmolL) lower haemoglobin concentration and
(1) lower haematocrit value in blood than HSC pigs (P le 005) For mean corpuscular
volume (MCV) an interaction was found between SC times batch (P le 001) caused by a positive
difference between LSC and HSC pigs in batch 1 but negative differences in batches 2 and
3
Apparent total tract digestion and incremental ATTD coefficients The average apparent total
tract digestibility (ATTD) of DM GE and N for the ad libitum and restricted feeding period
was lower for LSC than for HSC pigs (-3 -3 and -7 for DM GE and N respectively all P
le 00001) Incremental ATTD coefficients for DM GE NDF and N were not affected by SC (P
gt 005) The incremental ATTD coefficient for N was affected by batch (P le 005) being 69
77 and 74 for batch 1 2 and 3 respectively A tendency for SC times diet was found for the
ATTD coefficient for N (005 lt P le 010) the value being higher for the AA-S diet than for
the AA-B diet in LSC pigs while the opposite result was obtained in HSC pigs
Incremental efficiencies of energy and nitrogen retained as protein or fat and fasting heat
production Incremental responses of heat production to increased GE and DE but not ME
intake were 7 and 8 points higher for HSC than for LSC pigs respectively (P le 001)
Incremental responses of retained energy to increased GE DE and ME intake were
unaffected by experimental treatments (P gt 005) Incremental responses of protein
deposition to increased GE DE or ME intake and to increased N or digestible N intake were
substantially higher for HSC compared with LSC pigs (all P le 005) For example the
incremental N efficiency was nearly 20 points higher in HSC (73) compared with LSC
(53) pigs Conversely the incremental response in fat deposition to increased ME intake
but not to increased GE or DE intake was higher in LSC compared to HSC pigs (P le 005)
Surprisingly none of the incremental efficiencies were affected by dietary AA
supplementation
Fasting heat production was (55 kJ BW06 day-1) greater in LSC than HSC pigs (P le 005)
Chapter 4
97
Table 41 Ingredient and nutrient composition of the experimental diets
Item Ingredient gkg of feed
AA-B1 AA-S1
Wheat 3086 3086
Maize 2000 2000
Barley 2000 2000
Soybean meal 1845 1845
Maize starch 258 234
Sugarcane molasses 200 200
Limestone 147 147
Monocalcium phosphate 90 90
Soybean oil 192 192
Vitamin + mineral mix2 50 50
Salt 35 35
L-lysine HCl 34 34
Titanium dioxide 25 25
Sodium bicarbonate 21 21
L-threonine 10 21
L-tryptophan 00 04
DL-methionine 04 13
L-Valine 03 03
Analyzed nutrients composition gkg
NE MJkg3 98 98
DM 8896 8898
Crude protein4 166 167
Starch 474 472
Lys4 98 101
Thr4 66 78
Trp4 22 26
Met + Cys4 52 62
Ile4 82 83
Arg4 118 122
Phe4 94 99
His4 55 53
Leu4 150 153
Tyr4 62 62
Val4 96 98 1 AA-B = basal dietary AA profile AA-S= supplemented dietary AA profile containing 20 more Met Thr and Trp compared to the profile in the basal profile 2 Supplied the following per kilogram of diet 30 mg riboflavin 20 mg niacine 20 mg d-pantothenic acid 10 mg choline chloride 0015 mg cyanocobalamin 40 mg dl-α-tocopheryl acetate 15 mg menadione 6000 IU retinyl acetate 1200 IU cholecalciferol 02 mg folic acid 10 mg thiamin 10 mg pyridoxine HCl 50 mg manganese oxide 267 mg iron SO4middotH2O 60 mg copper SO4middot5H2O 140 mg zinc SO4middotH2O 044 mg disodium selenium trioxide10 mg potassium iodate 3 Based on chemical composition digestibility and energy values for pigs from CVB (2011)
Table 42 Performance data of pigs kept under low or high sanitary conditions and fed diets differing in AA composition
1 LSC= Low sanitary conditions HSC= High sanitary conditions 2 AA-B = basal dietary AA profile AA-S= supplemented dietary AA profile containing 20 more Met Thr and Trp compared to the profile in the basal profile3 n = number of pens a pen contained 6 pigs 4 SEM= pooled standard error of the mean means are presented as least square
means 5Considered significant when P le 005 considered as tendency when 005 lt P le 010
LSC1 HSC1 P-values5
Item AA-B2 AA-S2 AA-B AA-S SEM4 SC diet batch SCtimesdiet SCtimesbatch diettimesbatch
n3 6 6 6 6
BW week 1 kg 24 25 22 24 01 022 016 025 061 028 035
BW weaning (plusmn 21 d) kg 58 58 55 56 01 0001 082 001 080 0004 081
BW start ad lib feeding kg 178 190 242 245 05 lt0001 015 lt0001 042 021 042
BW start restricted feeding kg 216 234 293 295 06 lt0001 013 lt0001 020 083 074
ADFI g
ad lib feeding period 1136 1200 1292 1252 32 0006 072 0001 013 0001 046
restricted feeding period 743 797 973 923 29 lt0001 095 017 010 002 055
ADG g
ad lib feeding period 545 636 737 709 26 00002 025 083 004 0008 055
restricted feeding period 299 332 405 367 13 lt0001 088 003 002 lt0001 014
GF gg
ad lib feeding period 048 054 057 056 002 0007 019 00004 010 0001 087
restricted feeding period 040 042 042 039 001 084 078 002 014 00001 028
Table 43 Blood parameters of pig kept under low or high sanitary conditions and fed diets differing in AA composition
1 LSC = Low sanitary conditions HSC = High sanitary conditions 2 AA-B = basal dietary AA profile AA-S= supplemented dietary AA profile containing 20 more Met Thr and Trp compared to the profile in the basal profile 3 n = number of pens a pen contained 6 pigs and 3 pigs were sampled for blood 4 SEM = pooled standard error of the mean means are presented as least square means 5 Considered significant when P le 005 considered as tendency when 005 lt P le 010
LSC1 HSC1 P-values5
Item AA-B2 AA-S2 AA-B AA-S SEM4 SC diet batch SCtimesdiet SCtimesbatch diettimesbatch
n3 6 6 6 6
pigMAP microgmL 783 826 855 816 62 062 097 002 052 047 050
Haptoglobin microgmL 1884 1502 1156 750 326 004 009 006 071 052 045
CRP microgmL 170 167 251 194 23 003 022 080 025 067 090
IgG_KLH 45 47 47 40 03 021 035 099 007 074 054
IgM_KLH 48 51 49 49 02 078 033 073 038 023 049
WBC 109 L 126 139 137 133 07 076 057 016 024 073 062
RBC 1012L 57 57 58 60 01 002 014 007 025 012 077
Hb mmolL 65 64 68 68 01 0002 080 0003 029 042 011
Ht 320 316 324 332 04 001 061 001 012 050 034
MCV 10-15L 562 554 563 554 04 094 007 0003 094 0003 015
PTL 109L 405 409 420 427 21 046 080 061 094 034 023
Table 44 Apparent total tract digestibilities averaged over an ad libitum and restricted feeding period for pigs kept under low (LSC) or high (HSC) sanitary conditions and fed diets differing in AA composition
LSC
HSC P-values4
Item AA-B1 AA-S1 AA-B AA-S SEM3 SC diet Week batch SCtimesdiet SCtimesbatch
n2 6 6 6 6
DM 799 799 831 830 03 lt0001 096 068 024 074 046
GE 801 806 835 836 04 lt0001 046 038 024 067 041
NDF 392 415 415 415 15 015 096 075 029 094 007
N 699 709 777 773 06 lt0001 066 053 014 027 080 1 AA-B = basal dietary AA profile AA-S= supplemented dietary AA profile containing 20 more Met Thr and Trp compared to the profile in the basal profile 2 n = number of pens a pen contained 6 pigs 3 SEM = pooled standard error of the mean means are presented as least square means 4 Considered significant when P le 005 considered as tendency when 005 lt P le 010 Table 45 Incremental apparent total tract digestibility (ATTD) coefficients in pigs allowed ad libitum or 70 of ad libitum access to diets differing in AA composition and kept under low (LSC) or high (HSC) sanitary conditions
LSC
HSC
P-values4
Increment in intake of Response parameter AA-B1
AA-S1
AA-B
AA-S
SEM3
SC AA batch SCtimesAA
n2 6 6 6 6
DM gmiddotkg BWmiddotd-1 ATTD DM gmiddotkg BWmiddotd-1 82 84 84 82 2 086 084 013 026
GE gmiddotkg BWmiddotd-1 ATTD GE gmiddotkg BWmiddotd-1 80 82 82 80 2 096 084 017 032
NDF gmiddotkg BWmiddotd-1 ATTD NDF gmiddotkg BWmiddotd-1 42 45 35 34 7 022 085 070 076
N gmiddotkg BWmiddotd-1 ATTD N gmiddotkg BWmiddotd-1 70
74
77
72
2
021 089 003 010 1 AA-B = basal dietary AA profile AA-S= supplemented dietary AA profile containing 20 more Met Thr and Trp compared to the profile in the basal profile 2n = number of
pens a pen contained 6 pigs 3 SEM = pooled standard error of the mean means are presented as least square means 4 Considered significant when P le 005 considered as
tendency when 005 lt P le 010
Table 46 Incremental responses of heat production activity related heat and body retention to increases in dietary energy and N intake in pigs of pigs kept under low (LSC) or
high (HSC) sanitary conditions and fed diets differing in AA composition
LSC1 HSC1 P-values5
Increment in intake of Response parameter AA-B2 AA-S2 AA-B AA-S SEM4 SC diet batch6 SCtimesdiet
n3 6 6 6 6 GE kJmiddotkg BW-06middotd-1 Heat production kJmiddotkg BW-06middotd-1 023 022 030 028 002 00005 039 013 063 GE kJmiddotkg BW-06middotd-1 Activity heat kJmiddotkg BW-06middotd-1 047 -005 -147 125 10 074 028 021 012 GE kJmiddotkg BW-06middotd-1 Energy retention kJmiddotkg BW-06middotd-1 051 052 055 059 005 036 064 095 081 GE kJmiddotkg BW-06middotd-1 Protein retention kJmiddotkg BW-06middotd-1 012 013 019 017 002 0004 085 064 054 GE kJmiddotkg BW-06middotd-2 Fat retention kJmiddotkg BW-06middotd-1 039 039 036 041 004 095 049 088 058 DE kJmiddotkg BW-06middotd-1 Heat production kJmiddotkg BW-06middotd-1 028
027
036
035
002
00003 043 008 089
DE kJmiddotkg BW-06middotd-1 Activity heat kJmiddotkg BW-06middotd-1 064
00
-169
151
12
074 029 019 012 DE kJmiddotkg BW-06middotd-1 Energy retention kJmiddotkg BW-06middotd-1 065
064
067
074
007
039 070 098 060
DE kJmiddotkg BW-06middotd-1 Protein retention kJmiddotkg BW-06middotd-1 016
016
023
022
002
0005 087 052 078 DE kJmiddotkg BW-06middotd-1 Fat retention kJmiddotkg BW-06middotd-1 049
048
044
052
005
095 057 097 043
ME kJmiddotkg BW-06middotd-1 Heat production kJmiddotkg BW-06middotd-1 032 030 035 033 003 037 056 048 086 ME kJmiddotkg BW-06middotd-1 Activity heat kJmiddotkg BW-06middotd-1 047 -025 -192 133 13 069 029 020 015 ME kJmiddotkg BW-06middotd-1 Energy retention kJmiddotkg BW-06middotd-1 068 070 065 067 003 037 056 048 086 ME kJmiddotkg BW-06middotd-1 Protein retention kJmiddotkg BW-06middotd-1 017 017 022 020 001 002 043 068 042 ME kJmiddotkg BW-06middotd-1 Fat retention kJmiddotkg BW-06middotd-1 051 053 043 047 003 004 032 031 058 GE kJmiddotkg BW-06middotd-1 ME intake kJmiddotkg BW-06middotd-1 074 074 085 087 005 003 08 066 091 DE kJmiddotkg BW-06middotd-1 ME intake kJmiddotkg BW-06middotd-1 093 090 104 109 007 005 085 073 056 N gmiddotkg BW-1middotd-1 N retention gmiddotkg BW-1middotd-1 051 055 075 071 006 0003 099 060 052 Digested N7 gmiddotkg BW-1middotd-1 N retention gmiddotkg BW-1middotd-1 075 075 098 098 008 0007 098 034 099 FHP8 kJkg BW06d-1 753 747 708 683 25 004 054 013 069
1 LSC = Low sanitary conditions HSC = High sanitary conditions2 AA-B = basal dietary AA profile AA-S= supplemented dietary AA profile containing 20 more Met Thr and Trp compared to the profile in the basal profile3 n = number of pens a pen contained 6 pigs 4 SEM = pooled standard error of the mean means are presented as least square means5 Considered significant when P le 005 considered as tendency when 005 lt P le 0106 There were no interactions with batch7 Apparent total tract digested N-intake 8 FHP = fasting heat production
Chapter 4
102
DISCUSSION
The main objective of the present experiment was to quantify the difference in energy
requirements for maintenance and in incremental efficiencies for energy and protein
deposition of clinically healthy pigs kept under low or high sanitary conditions and fed a
diet with or without extra supplemented Met Thr and Trp The measured FHP was used as
a proxy for the energy requirement for maintenance Incremental efficiencies for energy
and N retention were derived from nutrient digestibility and retention values obtained with
animals fed ad libitum or at a level of 70 of ad libitum intake
Methodological issues There were several batch effects and interactions found for SC times
batch in this study which means that the treatment effects varied among batches The
batch effect was a composite effect of the batch of pigs originating from the same farm
but taken at a different point in time the effect of batches of manure and dust introduced
into the pens and the effect of time As housing conditions were well standardized we
assume that the batch effect is dominated by differences between batches of pigs and
batches of manure It should be noted that the direction of most observed effects
however was not affected by batch and that none of the incremental efficiencies were
affected by batch Variation in responses between experiments and between batches of
animals in the same experiment are commonly observed when imposing either challenges
with live micro-organisms and multifactorial challenges as used in the present study The
observed variation among batches illustrates the importance to carefully consider variation
among batches rather than reducing experimental variation by the use of a single batch as
often done in studies applying similar models (Williams et al 1997 Le Flocrsquoh et al 2009
Pastorelli et al 2012a)
In our study the contrast in feed intake allowing the determination of incremental nutrient
efficiencies was created within each group of pigs The advantages of this approach are
that the effect of feed intake is estimated using the same animals and that it enables the
incremental efficiencies to be estimated at levels of feed intake close to the maximum
voluntary feed intake level The disadvantage is that the restricted period inevitably follows
the ad libitum period and that it is conducted later in time Effects of the latter are
minimized by standardizing the experimental housing conditions (hygiene management
temperature relative humidity air velocity) To account for differences in BW between
weeks we expressed energy metabolism parameters relative to BW060 (Noblet et al 1999)
In addition we found our conclusions unaltered when expressing the results relative to the
traditionally used BW075
Contrast in sanitary conditions affecting pig performance and the immune system The
contrast in SC in the present study was created by a combination of factors vaccinations
Chapter 4
103
against specific pathogens a preventive antibiotic treatment application of a hygiene
protocol and weekly introduction of a mixture of manure and dust in pens The slightly
higher BW at weaning for LSC pigs likely results from the Mycoplasma vaccination that HSC
pigs received in the period just before weaning (Thacker et al 2000) After weaning until
the end of the experiment LSC pigs had substantially lower BW and BW gain than HSC pigs
At dissection day the difference in BW for LSC and HSC pigs was 10 kg The difference in
weight gain during the experiment was caused both by a reduction in ADFI and GF In
addition LSC pigs had a greater haptoglobin concentration in blood compared with HSC
pigs Taken together the lower BW lower ADFI lower ADG greater haptoglobin levels in
LSC pigs and the absence of clinical signs of illness in both SC treatment groups indicate a
contrast in subclinical health between LSC and HSC pigs slightly more severe than a
previous study using a similar model of ISS (van der Meer et al 2016)
Because pigMAP haptoglobin and CRP are all positive acute phase proteins the blood
concentrations of these acute phase proteins were expected to be greater for LSC pigs than
for HSC pigs The results did however not meet the expectations as only the haptoglobin
concentration was significantly greater in LSC pigs and CRP concentrations were even
lower The absence of an effect of subclinical ISS on pigMAP concentration was also found
in van der Meer et al (2016) and suggests a less sensitive response for pigMAP compared
with haptoglobin as found in a number of other studies as well (Heegaard et al 1998
Kampman-van de Hoek et al 2016 Saco et al 2016) We have no explanation for the
unexpected lower CRP level in blood in LSC compared with HSC pigs Haptoglobin and CRP
have different functions and may therefore respond differently to low grade inflammation
Chen et al (2003) who determined haptoglobin and CRP concentrations in pig blood at
different farms found also increased haptoglobin concentrations in subclinical ill pigs but
no differences in CRP concentrations Based on their observations it was concluded that
haptoglobin is a better indicator of inflammatory reactions in pig herds than serum CRP
Natural antibodies levels against KLH as measure of the response to low grade immune
stimulation were not significantly different which was in contrast with higher values found
for LSC compared with HSC pigs in a previous experiment (van der Meer et al 2016) In
that study the effect was most pronounced shortly after the transfer of the piglets to the
novel sanitary conditions In the current study KLH specific natural antibodies were
measured only 10 weeks after the time point at which the piglets were exposed to the
different sanitary conditions The increased infectious pressure that likely occurs at low
sanitary conditions might be the stimulus that causes a short term increase in NAb levels
These increased NAb levels may gradually disappear on the long term The period of
measurement might therefore have contributed to the lack of effect on the antibody
response against KLH in the current experiment Furthermore the SC to create a contrast in
ISS were different between the two experiments For example manure was introduced
more often and was a mixture of manure from more farms compared with the first
experiment introduction of dust in the pens was not applied in the previous experiment
Chapter 4
104
pigs were housed in groups of 6 instead of 9 and pigs were housed in experimental
facilities compared with a commercial pig farm in the previous experiment We cannot
exclude that these differences in sanitary conditions are responsible for the contradicting
observations
Dietary amino acid supplementation The basal AA profile was designed based on a factorial
estimate of the requirements for protein deposition basal endogenous losses cell
turnover and skin and hair losses slightly increasing Met and Trp (Knowles et al 1998
Jansman et al 2010) The rationale for this choice was that requirement estimates
originating from dose response studies will always include the requirements for meeting
increased needs associated with ISS under the conditions of that study Supplementing
Met Thr and Trp was based on studies in which increased requirements for these AA were
demonstrated mostly using clinical models (Melchior et al 2004 Le Flocrsquoh et al 2008
Litvak et al 2013 Rakhshandeh et al 2014) and the level of supplementation was
arbitrarily set to 20 In a previous study we showed that performance of LSC pigs was
increased by a similar supplementation strategy with Met Thr and Trp In the present
study however pig performance was not improved by supplementation of these AA
A reason for the lack of effect might be that pigs in the current study were exposed to the
contrast in SC at younger age (weaning age 21 d of age) than in the previous study (10
weeks of age van der Meer et al 2016) while the measurements in both studies started
at the same age (9-10 weeks of age) The effects of the extra supplemented AA in the
previous study was mainly expressed in the starter phase (week 10 until 15 of age) in HSC
pigs and may result from compensatory growth performance when introduced to the clean
environment after a period of reduced growth in the pre-experimental period as also
observed by Kampman-van de Hoek et al (2016) In our previous study the reduced
growth in the pre-experimental period was related to the administration of a number of
vaccinations in this period (van der Meer et al 2016) In the current study such an effect
might not have occurred as the period of measurements started 6 weeks later We find in
contrast to other published information using clinical models of ISS (Melchior et al 2004
Le Flocrsquoh et al 2008 Rakhshandeh et al 2014 Kampman-van de Hoek et al 2015) no
effects of AA supplementation on performance and on incremental efficiency of N
utilization Also our findings do not corroborate the effects of SC on Trp as was found by Le
Flocrsquoh et al (2009)
Use of dietary energy and protein We expected GF ratio to be reduced in case of ISS due to
the LSC treatment comparable to results from other ISS studies (Williams et al 1997 Le
Floch et al 2006) We found a higher FHP for LSC compared with HSC pigs which reflects a
lower energetic efficiency for LSC compared with HSC pigs due to an increased energy
expenditure for maintenance purposes of which eg functioning of the immune system is
Chapter 4
105
part of The extra energy required by LSC pigs compared with HSC pigs was estimated at 55
kJ kg BW06d-1 when considering a HSC pig as reference
The incremental efficiencies for ATTD of DM GE NDF and N were not influenced by the
different treatments however the average ATTD of DM GE and N were reduced for LSC
pigs compared with HSC pigs with 3 3 and 7 respectively for the ad libitum and restricted
period together A reduced ATTD of N and DM for LSC pigs was in line with van der Meer et
al (2016) and Kampman-van de Hoek (2016) where 1 and 4 reduced ATTD N values and
1 and 1 reduced ATTD DM values were reported for LSC pigs compared with HSC pigs
The reduced ATTD found for LSC pigs might be due to intestinal infections intestinal
damage or an increased digesta passage rate (Sandberg et al 2006 Pastorelli et al
2012b)
The incremental efficiencies for energy retention were not affected by the different
treatments however a substantial reduction in the utilization of dietary N for N retention
was found for LSC compared with HSC pigs The reduced incremental efficiency for N
retention of LSC pigs was due to a difference in the gross efficiency of retained N of 71
and 79 in the ad libitum feeding period while the gross efficiency for retained N in the
restricted feeding period was similar (71) for LSC and HSC pigs The difference found for
the incremental efficiency of retained N between LSC and HSC might be due to a reduced
maximal rate of protein deposition for LSC pigs compared with HSC pigs an increased rate
of AA oxidation due to increased protein turnover for LSC pigs or an imbalance of AA
available for protein retention in the body in LSC pigs The latter however is unlikely when
considering the lack of effect of dietary supplementation of Met Thr and Trp unless
another essential AA was limiting protein deposition in LSC pigs or the dietary protein
supply in general was limiting
The incremental efficiency of ingested energy for fat retention was greater for LSC pigs
than HSC pigs when calculated for ME intake retained as fat however this effect was
absent when calculated for GE or DE intake retained as fat The significant effect found for
the incremental efficiency of ME intake retained as fat was likely related to a higher urinary
energy excretion in LSC pigs compared with HSC pigs coinciding with an increased urinary
N output Hence it is unlikely that incremental efficiencies of DE for fat retention were
affected by SC
In conclusion a chronic low grade stimulation of the immune system by imposing low
sanitary conditions to pigs increases FHP by 8 and reduces apparent total tract nutrient
digestibility particularly of protein Under such conditions the incremental efficiency of
digestion is unaffected but the incremental N utilization for body protein deposition is
reduced by 20 points The incremental efficiency of digestible energy for fat deposition is
unaffected by sanitary conditions Dietary supplementation of Met Thr and Trp did not
affect incremental efficiencies for energy and protein deposition
Chapter 4
106
REFERENCES
Benson B N C C Calvert E Roura and K C Klasing 1993 Dietary energy source and density modulate the expression of
immunologic stress in chicks J Nutr 123 1714-1723 Chen H H J H Lin H P Fung L L Ho P C Yang W C Lee Y P Lee and R M Chu 2003 Serum acute phase proteins and
swine health status Can J Vet Res 67 283 de Ridder K C L Levesque J K Htoo and C F M de Lange 2012 Immune system stimulation reduces the efficiency of
tryptophan utilization for body protein deposition in growing pigs J Anim Sci 90 3485-3491 Gerrits W J J M J W Heetkamp E Labussiegravere and J B van Klinken 2015 Quantifying physical activity heat in farm animals In
W J J Gerrits and E Labussiegravere editors Indirect calorimetry Wageningen Academic Publishers Wageningen p 155-170
Heegaard P M H J Klausen J P Nielsen N Gonzaacutelez-Ramoumln M Pintildeeiro F Lampreave and M A Alava 1998 The Porcine Acute Phase response to infection with actinobacillus pleuropneumoniae haptoglobin C-reactive protein major acute phase protein and serum amyloid A protein are sensitive indicators of infection Comp Biochem Phys B 119 365-373
Heetkamp M J W S J J Alferink T Zandtra P Hendriks H van den Brand and W J J Gerrits 2015 Design of climate respiration chmabers adjustable to the metabolic mass of subjects In W J J Gerrits and E Labussiegraverre editors Indirect calorimetry Wageningen Academic Publishers Wageningen p 35-56
Humphrey B D and K C Klasing 2004 Modulation of nutrient metabolism and homeostasis by the immune system Worlds Poult Sci J 60 90-100
International organisation for standardisation (ISO) 1998 Animal feeding stuff-Determination of gross calorific value- Bomb calorimetry method ISO 9831 Int Organ Stand Geneve Switzerland
International organisation for standardisation (ISO) 1999 Animal feeding stuff-Determination of moisture and other volatile matter content ISO 6496 Int Organ Stand Geneve Switzerland
International organisation for standardisation (ISO) 2002 Animal feeding stuff-Determination of crude ash ISO 5984 Int Organ Stand Geneve Switzerland
International Organization for Standardization (ISO) 2005a Animal feeding stuffs ndash Determination of nitrogen content and calculation of crude protein content ndash Part 1 Kjeldahl method ISO 5983 Int Organ Stand Geneve Switzerland
International Organization for Standardization (ISO) 2005b Animal feeding stuffs ndash Determination of amino acids content ISO 13903 Int Organ Stand Geneve Switzerland
International Organization for Standardization (ISO) 2005c Animal feeding stuffs ndash Determination of tryptophan content ISO 13903 Int Organ Stand Geneve Switzerland
Jansman A J M J T M van Diepen and D Melchior 2010 The effect of diet composition on tryptophan requirement of young piglets J Anim Sci 88 1017-1027
Kampman-van de Hoek E A J M Jansman J J G C van den Borne C M C van der Peet-Schwering H van Beers-Schreur and W J J Gerrits 2016 Dietary amino acid deficiency reduces the utilization of amino acids for growth in growing pigs after a period of poor health J Nutr 146 51-58
Kampman-van de Hoek E P sakkas W J J Gerrits J J G C van den Borne C M C van der Peet-Schwering and A J M Jansman 2015 Induced lung inflammation and dietary protein supply affect nitrogen retention and amino acid metabolism in growing pigs Brit J Nutr 113 414-425
Kim J C B P Mullan B Frey H G Payne and J R Pluske 2012 Whole body protein deposition and plasma amino acid profiles in growing andor finishing pigs fed increasing levels of sulfur amino acids with and without Escherichia coli lipopolysaccharide challenge J Anim Sci 90 362-365
Knowles T L Southern and T Bidner 1998 Ratio of total sulfur amino acids to lysine for finishing pigs J Anim Sci 76 1081-1090 Kotb A and T Luckey 1972 Markers in nutrition Nutr Abstr Rev 42813-845 Labussiegravere E J van Milgen C F M de Lange and J Noblet 2011 Maintenance energy requirements of growing pigs and calves
are influenced by feeding level J Nutr 141 1855-1861 Le Floch N F Gondret J J Matte and H Quesnel 2012 Towards amino acid recommendations for specific physiological and
patho-physiological states in pigs Proc Nutr Soc 71 425-432 Le Floch N C Jondreville J J Matte and B Seve 2006 Importance of sanitary environment for growth performance and plasma
nutrient homeostasis during the post-weaning period in piglets Arch Anim Nutr 60 23-34 Le Flocrsquoh N L LeBellego J J Matte D Melchior and B Segraveve 2009 The effect of sanitary status degradation and dietary
tryptophan content on growth rate and tryptophan metabolism in weaning pigs J Anim Sci 87 1686-1694 Le Flocrsquoh N D Melchior and B Segraveve 2008 Dietary tryptophan helps to preserve tryptophan homeostasis in pigs suffering from
lung inflammation J Anim Sci 86 3473-3479 Litvak N A Rakhshandeh J Htoo and C de Lange 2013 Immune system stimulation increases the optimal dietary methionine to
methionine plus cysteine ratio in growing pigs J Anim Sci 91 4188-4196 Lochmiller R L and C Deerenberg 2000 Trade-offs in evolutionary immunology Just what is the cost of immunity Oikos 88 87-
98 Melchior D B Segraveve and N Le Flocrsquoh 2004 Chronic lung inflammation affects plasma amino acid concentrations in pigs J Anim
Sci 82 1091-1099 Myers W D P A Ludden V Nayigihugu and B W Hess 2004 Technical Note A procedure for the preparation and quantitative
analysis of samples for titanium dioxide J Anim Sci 82 179-183
Chapter 4
107
Noblet J C Karege S Dubois and J van Milgen 1999 Metabolic utilization of energy and maintenance requirements in growing pigs effects of sex and genotype J Anim Sci 77 1208-1216
NRC 2012 Nutrient Requirements of Swine 11th ed Natl Acad Press Washington DC
Parmentier H K S Bronkhorst M G Nieuwland G V Reilingh J M van der Linden M J Heetkamp B Kemp J W Schrama M
W Verstegen and H van den Brand 2002 Increased fat deposition after repeated immunization in growing chickens
Poult Sci 81 1308-1316
Pastorelli H N Le Floch E merlot M C Meunier-Salauumln J van Milgen and L Montagne 2012a Sanitary housing conditions
modify the performance and behavioural response of weaned pigs to feed- and housing-related stressors Anim 6
1811-1820
Pastorelli H J van Milgen P Lovatto and L Montagne 2012b Meta-analysis of feed intake and growth responses of growing
pigs after a sanitary challenge Anim 6 952-961
Rakhshandeh A J K Htoo and C F M de Lange 2010 Immune system stimulation of growing pigs does not alter apparent ileal amino acid digestibility but reduces the ratio between whole body nitrogen and sulfur retention Livest Sci 134 21-23
Rakhshandeh A J K Htoo N Karrow S P Miller and C F M de Lange 2014 Impact of immune system stimulation on the ileal nutrient digestibility and utilisation of methionine plus cysteine intake for whole-body protein deposition in growing pigs Brit J Nutr 111 101-110
Saco Y F Martiacutenez-Lobo M Cortey R Pato R Pentildea J Segaleacutes C Prieto and A Bossols 2016 C-reactive protein haptoglobin and Pig-Major acute phase protein profiles of pigs infected experimentally by different isolates of porcine reproductive and respiratory syndrome virus Vet Microbio 183 9-15
Sandberg F B G C Emmans and I Kyriazakis 2006 A model for predicting feed intake of growing animals during exposure to pathogens J Anim Sci 84 1552-1566
Short F J P Gorton J Wiseman and K N Boorman 1996 Determination of titanium dioxide added as an inert marker in chicken digestibility studies Anim Feed Sci Tech 59 215-221
Thacker E L B J Thacker M Kuhn P A Hawkins and W R Waters 2000 Evaluation of local and systemic immune responses induced by intramuscular injection of a Mycoplasma hyopneumoniae bacterin to pigs Am J Vet Res 61 1384-1389
van der Meer Y A Lammers A J M Jansman M M J A Rijnen W H Hendriks and W J J Gerrits 2016 Performance of pigs kept under different sanitary conditions affected by protein intake and amino acid supplementation J Anim Sci 94 4704-4719
van Soest P v J Robertson and B Lewis 1991 Methods for dietary fiber neutral detergent fiber and nonstarch polysaccharides in relation to animal nutrition J Dairy Sci 74 3583-3597
Williams N H T S Stahly and D R Zimmerman 1997 Effect of chronic immune system activation on the rate efficiency and composition of growth and lysine needs of pigs fed from 6 to 27 kg J Anim Sci 75 2463-2471
SUPPLEMENTAL TABLES Supplemental table I Least square means of energy balance parameters for ad libitum fed pigs kept under low or high sanitary conditions and fed diets containing basal or supplemented amino acid profiles All parameters except gross energy (GE) intake were adjusted to a similar level of feed intake by including GE intake as a covariate
LSC1 HSC1 P-values4
Item gkg BW060day
AA-B2
AA-S2
AA-B
AA-S
SEM3
SC diet batch SCtimesdiet SCtimesbatch diettimesbatch GE intake6
BW kg
178
190
242
245
06
lt0001 015 lt0001 042 021 042 - GE intake
2843
3007
2872
2843
56
0246 024 00008 010 lt0001 006 -
ME intake5 2285 2329 2449 2439 36 0002 064 044 049 023 015 0002 MEGE ratio 79 81 85 84 1 0003 068 052 044 022 018 030 Methane production 38 48 92 105 11 00002 028 026 089 096 080 026 Heat production 1373 1368 1429 1401 20 004 043 005 058 024 061 010 Energy retention total 912 961 1020 1039 47 007 048 013 077 036 049 005 Energy retention protein 358 376 440 421 11 lt0001 097 028 015 042 071 002 Energy retention fat 554 585 580 618 41 048 042 013 094 035 050 010
Supplemental table II Least square means of energy balance parameters restricted fed pigs kept under low or high sanitary conditions and fed diets containing basal or supplemented amino acid profiles All parameters except gross energy (GE) intake were adjusted to a similar level of feed intake by including GE intake as a covariate
LSC1 HSC1 P-values4
Item gkg BW060day AA-B2 AA-S2 AA-B AA-S SEM3 SC diet batch SCtimesdiet SCtimesbatch diettimesbatch GE intake6
BW kg
216
234
293
295
06
lt0001 013 lt0001 020 083 074 - GE intake
1819
1934
2035
1933
49
005 089 0007 004 0001 024 -
ME intake5 1592 1601 1636 1615 11 003 057 074 025 006 041 lt0001 MEGE ratio 82 83 85 84 1 004 065 075 026 009 033 052 Methane production 46 52 103 103 08 lt0001 061 062 074 067 046 071 Heat production 1162 1159 1153 1142 17 049 064 0008 083 077 097 002 Energy retention total 430 442 483 473 21 008 094 001 064 041 072 lt0001 Energy retention protein 244 249 261 254 6 011 082 008 039 021 006 lt0001 Energy retention fat 185 193 222 219 18 013 088 002 079 062 098 00002
1 LSC = Low sanitary conditions HSC = High sanitary conditions2 AA-B = basal dietary AA profile AA-S= supplemented dietary AA profile containing 20 more Met Thr and Trp compared to the profile in the basal profile3 SEM = pooled standard error of the mean means are presented as least square means4 Considered significant when P le 005 considered as tendency when 005 lt P le 010 5 ME = metabolizable energy 6 This value represents the significance of the covariable GE-intake
Supplemental table III Least square means of nitrogen (N) balance parameters for ad libitum fed pigs kept under low or high sanitary conditions and fed diets containing basal or supplemented amino acid profiles All parameters were adjusted to a similar level of feed intake by including gross energy (GE) intake as a covariate
Supplemental table IV Least square means of nitrogen (N) balance parameters for restricted fed pigs kept under low or high sanitary conditions and fed diets containing basal or supplemented amino acid profiles All parameters were adjusted to a similar level of feed intake by including gross energy (GE) intake as a covariate
LSC1 HSC1 P-values4
Item AA-B2 AA-S2 AA-B AA-S SEM3 SC diet batch SCtimesdiet SCtimesbatch diettimesbatch GE intake5
BW kg 216
234
293
295
06
lt0001 013 lt0001 020 083 074 -
N intake 089 086 081 079 000 lt0001 0002 lt0001 093 050 006 lt0001
N retention 046 047 045 044 001 015 064 0006 043 019 017 00007
N retentionN intake 052 054 056 055 001 011 048 009 035 026 002 015 1 LSC = Low sanitary conditions HSC = High sanitary conditions2 AA-B = basal dietary AA profile AA-S= supplemented dietary AA profile containing 20 more Met Thr and Trp compared to the profile in the basal profile3 SEM = pooled standard error of the mean means are presented as least square means4 Considered significant when P le 005 considered as tendency when 005 lt P le 010 5 GE = gross energy this value represents the significance of the covariable GE-intake
LSC1 HSC1 P-values4
Item AA-B2 AA-S2 AA-B AA-S SEM3 SC diet batch SCtimesdiet SCtimesbatch diettimesbatch GE intake5
BW kg 178
190
242
245
06
lt0001 015 lt0001 042 021 042 -
N intake 142 138 127 124 001 lt0001 002 lt0001 055 096 026 lt0001
N retention 073 075 080 076 002 009 081 002 021 038 053 005
N retentionN intake 051 055 063 061 002 00001 069 042 014 046 066 093
Chapter 5
Diurnal patterns of heat production and oxidation of
carbohydrate and fat in pigs kept under different
sanitary conditions
Y van der Meer12 AJM Jansman3 A Lammers4 and WJJ Gerrits1
To be submitted to Animal
1Animal Nutrition Group Wageningen University Wageningen 6708 WD The Netherlands
2De Heus Animal Nutrition Ede 6717 VE The Netherlands 3Wageningen UR Livestock Research Wageningen 6708 WD The Netherlands
4Adaptation Physiology Group Wageningen University Wageningen 6708 WD The
Netherlands
Chapter 5
112
ABSTRACT
In Chapter 4 we showed that low grade chronic inflammation imposed on pigs by keeping
them under low sanitary conditions (LSC) increased fasting heat production (FHP) by 8
and reduced incremental utilization of dietary protein by 20 points compared with high
sanitary conditions (HSC) Dietary supplementation of methionine (Met) threonine (Thr)
and tryptophan (Trp) affected neither the incremental utilization of dietary protein nor any
of the energy balance traits By studying diurnal patterns of heat production and substrate
oxidation rates we aimed to gain insight in the underlying mechanisms for increased energy
expenditure and reduced marginal protein efficiency in LSC pigs fed diets with either a
basal amino acid profile or supplemented with Met Thr and Trp In a 2 times 2 factorial
arrangement 24 groups of 6 pigs each were allocated to either LSC or HSC and were
offered one of two different diets having either a basal or supplemented dietary AA profile
For each group of pigs heat production and physical activity was measured in 6 min
intervals by indirect calorimetry during two consecutive weeks during which feed was
available ad libitum or at 70 of ad libitum The LSC pigs had reduced rates of body weight
gain feed intake gainfeed ratio and higher serum haptoglobin concentrations than HSC
pigs indicating that the contrast in sanitary conditions was reflected in physiological and
immunological parameters Supplementation of Met Thr and Trp did not affect any of the
traits measured When compared with HSC pigs LSC pigs reduced their energy expenditure
on physical activity and increased their resting metabolic rate in the restricted feeding
period compared with HSC pigs especially when lights were on This confirms our previous
observation that FHP was increased at LSC Within day patterns of net fat and carbohydrate
oxidation were not affected by sanitary conditions It is speculated that the reduction of the
incremental utilization of dietary protein under LSC is not restricted to particular periods
within the day
Keywords heat production pig energy expenditure sanitary conditions health amino
acid
Implications The results of this study indicate that sanitary conditions of pigs cause
variation in energy utilization and expenditure over the day The results help to understand
the effect of sanitary conditions on dietary requirements of pigs Providing diets that match
the requirements of the pig on the correct moment of the day might help to increase the
efficiency of pig production and to reduce the environmental pressure of the pig industry
Chapter 5
113
INTRODUCTION
Sanitary conditions (SC) have been shown to affect energy expenditure for fasting heat
production (FHP) and incremental efficiency for protein retention in pigs (In Chapter 4 we
showed that low grade chronic inflammation imposed on pigs by keeping them under low
sanitary conditions (LSC) increased fasting heat production (FHP) by 8 and reduced
incremental utilization of dietary protein by 20 points Dietary supplementation of
methionine (Met) threonine (Thr) and tryptophan (Trp) affected neither the incremental
utilization of dietary protein nor any of the energy balance traits measured in Chapter 4 In
the study described in Chapter 4 the low grade chronic inflammation was apparent from
reduced performance and increased serum haptoglobin concentrations Whereas immune
system stimulation in the clinical range is known to increase heat production (Lochmiller
and Deerenberg 2000 Parmentier et al 2002) little is known about the metabolic or
immunological processes underlying the increased FHP and reduced incremental protein
utilization at LSC As energy is also needed to deposit fat or protein in the body and the
requirements for specific amino acids (AA) Met Thr and Trp are also known to be affected
by immune system stimulation (Le Flocrsquoh et al 2008 Kampman-van de Hoek et al 2016
van der Meer et al 2016) an interaction between energy and AA metabolism affected by
immune stimulation was expected but was found to be absent in Chapter 4 Detailed
analysis of within day patterns of heat production activity related or resting and net rates
of substrate oxidation will allow to track the observed effects of SC and (absence of) effects
of AA supplementation (Chapter 4) to particular periods within the day Treatment
differences in heat production or net rates of substrate oxidation directly following a meal
would typically indicate altered metabolism of ingested nutrients indicating substantial
contribution of visceral tissues
To this end we explored the diurnal patterns of energy expenditure by partitioning total
heat production (Htot) into heat production related to physical activity (Hact) and resting
metabolic rate (RMR) of pigs kept under different sanitary conditions fed diets with or
without extra supplemented Met Thr and Trp In addition the diurnal patterns of the
respiratory quotient (RQ) and net rates of carbohydrate and fat oxidation of these pigs
were also evaluated
MATERIALS AND METHODS
In a 2 times 2 factorial arrangement 24 groups of six pigs were allocated to either LSC or HSC
and were offered two different diets having either a basal (AA-B) or supplemented dietary
AA profile (AA-S) Pigs were followed from week 3 until week 12 of age Pigs were used
from week 3 till week 12 of age From week 3 until 8 pigs were adapted to the different
sanitary conditions after which the dietary treatments were introduced Energy balances
Chapter 5
114
studies were performed from week 9 to 12 During week 9 pigs were allowed ad libitum
access to their diets During week 10 pigs were fed twice daily at 70 of the measured
feed intake during week 9 During week 12 pigs were allowed restricted access to their
diets for 2 d prior to a 25h period of feed deprivation for the measurement of FHP These
three experimental weeks are referred to as the ad lib feeding period the restricted
feeding period and the fasting period
Animals and treatments In total 144 (Topigs 20 times Danish Duroc Topigs Helvoirt The
Netherlands Danbred International Herlev Denmark) newborn female piglets were
selected at one week of age in three subsequent batches of 48 pigs on a commercial farm
in The Netherlands and allocated to either the LSC or HSC treatment as explained in
Chapter 4
In brief piglets were selected at the same farrowing rooms and HSC piglets received six
vaccinations (against Mycoplasma hyopneumoniae procine circovirus type 2 porcine
reproductive and respiratory disease Lawsonia intercellularis action bacillus
pleuropneumoniae and influenza A virus) during the period of the first nine weeks of age
Piglets of both LSC and HSC treatments were housed in the same rooms at the commercial
farm until weaning at 21 plusmn 02 d of age At weaning (start pre-period) LSC and HSC piglets
were transported to the research farm in Wageningen and housed in separate rooms (LSC
and HSC room) until nine weeks of age (end adaptation period)
The HSC room was intensively cleaned and disinfected before arrival of the pigs In
addition a strict hygiene protocol was adhered to when entering the HSC rooms The LSC
room was not cleaned and no hygiene protocol was applied A mixture of manure of three
commercial pig farms obtained fresh weekly was spread weekly in the LSC pens to
increase microbial pressure In addition the LSC pigs were exposed to nylon bags
containing a mixture of pig manure and straw ground to pass a 1 mm screen as a model
for dust The bags were mounted on a chain above the LSC pens for pigs to play with
Upon arrival at the research farm all pigs were individually weighed and allocated to their
pen within sanitary condition treatment based on BW in order to minimize variation
between pens (LSC batch 1 57 kg LSC batch 2 59 kg LSC batch 3 59 kg HSC batch 1 55
kg HSC batch 2 52 kg HSC batch 3 59 kg) At arrival day (plusmn 21 d of age) and 2 d
thereafter HSC pigs received an antibiotic injection (Fenflor AUV Cuijk The Netherlands 1
mL per pig sub muscular per time)
Housing experimental period During the experimental period (9 until 12 weeks of age)
groups of six pigs were housed in one of eight identical 40 m3 indirect calorimetric
chambers described by Heetkamp et al (2015) containing a pen of 175 times 285 m with 40
slatted floor During this period pre-weighed quantities of fresh manure and dust were
introduced weekly in LSC chambers similar to their introduction in the pre-experimental
period The HSC chambers were cleaned and disinfected before start measurement at week
Chapter 5
115
10 as was done with the rooms in the pre-period During the experiment period a strict
hygiene protocol was adhered to when entering the HSC chambers as was done in the pre-
period Temperature in the chambers was maintained at 20 degC relative humidity at 65
and air velocity at lt 02 ms Pigs were exposed to artificial light from 0730 to 1930 h (420
lux) and to darkness (35 lux) during the remainder of the day
Diets and feeding From arrival (start week 3) until week 5 (12 d post weaning) all pigs were
allowed ad libitum access to a commercial diet containing 164 gkg CP 180 kJg GE
(Comfort 3 De Heus Animal Nutrition The Netherlands) and from week 6 until week 9
containing 170 gkg CP and 178 kJg gross energy (GE) (Comfort 4 De Heus Animal
Nutrition The Netherlands) From week 9 onwards pigs were allocated to one of two
treatment diets either containing a basal or a supplemented AA-profile The diets were
formulated to be slightly limiting in lysine (95 of the requirement value for lysine relative
to the dietary net energy value (NE NRC 2012) to prevent that the dietary energy
concentration could limit the growth performance of the pigs in the study
The basal AA-profile (AA-B) was designed as described in van der Meer et al (2016) Briefly
this was developed by a factorial approach to cover AA requirements for maintenance (skin
and hair losses intestinal endogenous losses and cell turnover) and whole body protein
deposition The supplemented AA-profile (AA-S) was derived from the AA-B profile by
increasing the Met Thr and Trp ratio relative to Lys by 20
The ingredient and nutrient composition of the experimental diets is shown in
supplemental Table I The diets were isocaloric on an NE basis and contained TiO2 as
indigestible marker for measuring fecal nutrient digestibility The diets were analyzed for
AA composition by acid hydrolysis at 110degC for 23 h and ion-exchange chromatography
with post-column derivatization with ninhydrin (ISO 2005a) and Trp by alkaline hydrolysis
at 110 degC for 20 h followed by ion-exchange chromatography and fluorescence detection
(ISO 2005b) During the ad libitum feeding period pigs were fed ad libitum from a single
space feeder During the restricted feeding period pigs were fed 70 of their ad libitum
intake divided over two meals at 0730 h and 1530 h fed from a through which allowed all 6
pigs to eat at the same time Per meal pigs had 30 minutes to eat their meal after the
trough was closed to prevent contamination of the trough with urine
Feeding strategy during experimental period During the experimental period (week 10 until
12 of age) pigs were fed ad libitum for one week (week 10 of age) and restricted in the
second week (week 11 of age) Feed was provided ad libitum in a single feeder during the
ad libitum week and caretakers visited the chambers at 730 am and 330 pm In the
restricted week pigs were fed 70 of the ad libitum intake in two meals provided in a
trough at 730 am and 330 pm Water was available ad libitum in both weeks In week 12
of age the pigs were fed four more restricted meals and subsequently they were starved
Chapter 5
116
for 25 h for FHP measurement After FHP measurement the pigs were fed ad libitum until
the end of the experiment
Measurements in the experimental period During the ad libitum restricted feeding period
and fasting period gas exchange of each group of pigs was measured in the calorimetric
chambers in 6-min intervals by measuring exchange of O2 CO2 and CH4 as described by
Heetkamp et al (2015) A CO2 recovery test with the respiration chambers was performed
immediately prior to the start of the experiment according to procedures described by
Heetkamp et al (2015) In the eight chambers 99 964 979 1007 987 983 992 and
1005 of the released CO2 was recovered A radar device was mounted above each
chamber completely covering the housing area of the pigs to measure physical activity in 6-
min intervals during the three experimental weeks Changes in the frequency of the
reflected radar waves due to movement of the animals (Doppler effect) were converted
into electrical pulses and pulses were recorded Complete energy and nitrogen (N) balances
were determined in for the ad lib and the restricted period Individual pigs were weighted
before and after each balance week In each balance week manure was collected
quantitatively weighed mixed thoroughly and sampled for analysis of GE DM ash and N
Aerial NH3 was collected from a quantified sample of the outgoing air after trapping in
H2SO4 and NH4+ in water that condensed on the heat exchanger For LSC pigs the
contribution of the extra administered manure and dust to the energy and nitrogen
balances was quantified
The Htot was partitioned between Hact and RMR using a penalised β-spline regression
procedure developed and described by van Klinken et al (2012) The FHP was estimated as
the average RMR during the last 2 h of feed deprivation The thermic effect of feeding
(TEF) in the restricted week was calculated by subtracting the average RMR in the
restricted week by the FHP Short TEF (sTEF) was calculated by subtracting the average
RMR of the restricted by the lowest RMR value and long TEF (lTEF) was calculated by
subtracting the lowest RMR value in the restricted week by FHP The RQ was calculated as
the ratio between O2 consumption and CO2 production The carbohydrate and fat oxidation
(in g) were calculated from gas exchange (in L) as described by Brouwer (1958) ignoring
the contribution of methane production and protein oxidation (van den Borne et al 2015)
Carbohydrate oxidation in g = -2965 times VO2 + 4170 times VCO2
Fat oxidation in g = 1718 times VO2 ndash 1718 times VCO2
where VO2 = volume O2 consumption and VCO2 = volume CO2 produced
Chapter 5
117
Dissection From the fasting heat measurement in the fasting heat period pigs were fed ad
libitum for 4-5 days until dissection At the dissection day three pigs per room were
euthanized on one day between 830 and 1500 h to collect lungs for lesion scores The
order of euthanizing was balanced per room and treatment group Pigs were restrained
and anaesthetized with an im injection in the neck with in total 6 mg Zoletilkg BW (Zoletil
Virbac Laboratories Carros France) After sedation they were euthanized by an iv
injection of 24 mgkg BW of sodium pentobarbital (Euthasol 20 AST Farma BV The
Netherlands) in the ear vein and subsequently blooded by incision in the neck
Statistical analysis The experimental unit for all measurements was the group of 6 pigs ie
one pen of six pigs in each chamber Effects of sanitary conditions AA profile batch and
their interactions on the hourly means of Htot Hact RMR RQ carbohydrate oxidation and
fat oxidation were assessed by analysis of variance using the GLM procedure in SAS (v 93
SAS Institute Inc Cary NC USA) Non significant interactions with batch were deleted from
the model The partitioning of heat in Htot Hact and RMR in the restricted feeding period
was analysed with the same model as was used for the hourly means In addition GE intake
was included in the model for the partitioning of heat in the ad libitum and restricted
feeding period as a covariate to correct for feed intake P-values were considered
significant when P le 005 and considered as tendency when 005 lt P le 010 Results are
presented as least square means plusmn SEM
RESULTS
General One LSC pig fed the AA-S diet in the adaptation period had a volvulus and died just
before entering the respiration chambers Therefore one pen had five instead of six
animals in the experimental period Throughout the experiment no clinical signs of illness
were observed All fecal samples were negative for Ascaris coccidia Trichostrongylus and
other endoparasites Five out of 36 LSC pigs (13) and 8 out of 36 HSC pigs (22) had a
small pneumonia lesion in the lungs at dissection the remainder of the pigs had no lung
lesions
In the restricted feeding period pigs were offered 70 of the feed intake of the ad libitum
feeding period supplied in two meals per day Not all groups consumed the feed supplied
within 30 min leading to a contrast in feed intake between periods slightly exceeding the
30 anticipated 39 for LSC and 31 for HSC Due to a technical problem in batch 2 and 3
with the activity device in one chamber of LSC in and one chamber in HSC the activity
measurements of these chambers were not reliable and had to be discarded
Ad libitum feeding period During the ad libitium feeding period Htot peaked twice daily
This variation in Htot was almost completely accounted for by variation in Hact resulting in
Chapter 5
118
only minor within-day variation in RMR (Fig 51) There were no significant effects of
treatments at any point in time on RMR and only few on Hact and Htot
An interaction for sanitary conditions (SC) times AA was found for Htot at 800 am (P le 005)
the LSC pigs fed the AA-B diet had higher Htot than the LSC pigs fed the AA-S diet whereas
the HSC pigs had a similar Htot independent of the diet The HSC pigs had higher Htot at
000 400 800 am and 100 pm than LSC pigs (P le 005) The pigs fed the AA-B diet had
higher Htot at 700 pm
At 200 and 300 pm a tendency for an interaction between SC times AA was found for Hact
(005 lt P le 010) the Hact for LSC pigs fed the AA-B diet was lower than for LSC pigs fed the
AA-S diet whereas for HSC pigs fed the AA-B diet the Hact was higher compared with HSC
pigs fed the AA-S diet
The RQ exceeded unit 1 during the whole day (Fig 52) Positive values were found for
carbohydrate oxidation and negative values for fat oxidation indicating substantial
synthesis of fatty acids de novo
Restricted feeding period During the restricted feeding period Htot peaked twice daily This
variation in Htot was partly accounted for by variation in Hact and partly by within-day
variation in RMR (Fig 53) There were only a few significant effects of treatments at points
in time on Htot and Hact and RMR values were higher for LSC pigs from 800 am until 100
pm and from 300 pm until 700 pm (Fig 53C) An interaction for SC times AA was found for
Htot at 600 and 700 pm (P le 005) the LSC pigs fed the AA-B diet had higher Htot
production than the LSC pigs fed the AA-S diet whereas the HSC pigs had a similar Htot
production independent of the diet The HSC pigs had higher Htot production at 000 100
400 am and 600 800 900 and 1000 pm than LSC pigs (P le 005) and tended to have
higher Htot production at 200 and 700 am than LSC pigs (005 lt P le 010) At 800 pm an
interaction SC times AA was found for Hact (005 lt P le 010) The Hact was lower for LSC pigs at
900 and 1100 am (P le 005)
The RQ in the restricted feeding period values were below 1 between 1200 and 700 am
and between 200 and 300 pm Positive values were found for the net rate of carbohydrate
oxidation and negative values for fat oxidation were only found between 800 am to100
pm and 4 pm to 1 am indicating synthesis of fatty acids de novo only after consumption of
the meals (Fig 54)
Partitioning of heat in the restricted week Overall no treatment effects were found on
parameter of heat partitioning except for a SC tendency for RMR The LSC pigs tended to
have higher RMR values than the HSC pigs in the restricted feeding period (P = 005 Table
51) This tendency corresponded with a tendency for a higher estimate of FHP in LSC pigs
(P = 006)
Chapter 5
119
FIGURE CAPTIONS
Figure 51 Heat partitioning of pigs kept under different sanitary conditions (SC) and fed a diet (ad libitum) with or without extra supplemented amino acids (AA) Symbols are least square means of 6 groups of pigs adjusted to equal GE intake among treatments A Total heat production (Htot) B physical activity related heat (Hact) C resting metabolic rate (RMR) The dashed lines represent low sanitary condition pigs and the closed lines high sanitary condition pigs The circles represent pigs fed a basal AA profile diet and the triangles represent pigs fed a supplemented AA profile represent P le 005 + represents 005 lt P le 010 and ndash represents P gt 010 Figure 52 Respiration quotient (RQ) and net rates of carbohydrate and fat oxidation of pigs kept under different sanitary conditions (SC) and fed a diet (ad libitum) with or without extra supplemented amino acids (AA) A RQ B carbohydrate oxidation C fat oxidation The dashed lines represent low sanitary condition pigs and the closed lines high sanitary condition pigs The circles represent pigs fed a basal AA profile diet and the triangles represent pigs fed a supplemented AA profile represent P le 005 + represents 005 lt P le 010 and ndash represents P gt 010 Figure 53 Heat partitioning of pigs kept under different sanitary conditions (SC) and fed a diet (restricted 70 of ad libitum intake) with or without extra supplemented amino acids (AA) Symbols are least square means of 6 groups of pigs adjusted to equal GE intake among treatments A Total heat production (Htot) B physical activity related heat (Hact) C resting metabolic rate (RMR) The arrows represent the moments of meal feeding The dashed lines represent low sanitary condition pigs and the closed lines high sanitary condition pigs The circles represent pigs fed a basal AA profile diet and the triangles represent pigs fed a supplemented AA profile represent P le 005 + represents 005 lt P le 010 and ndash represents P gt 010 Figure 54 Respiration quotient (RQ) and net rates of carbohydrate and fat oxidation of pigs kept under different sanitary conditions (SC) and fed a diet (restricted 70 of ad libitum intake) with or without extra supplemented amino acids (AA) A RQ B carbohydrate oxidation C fat oxidation The arrows represent the moments of meal feeding The dashed lines represent low sanitary condition pigs and the closed lines high sanitary condition pigs The circles represent pigs fed a basal AA profile diet and the triangles represent pigs fed a supplemented AA profile represent P le 005 + represents 005 lt P le 010 and ndash represents P gt 010
Chapter 5
120
Figure 51
Chapter 5
121
Figure 52
Chapter 5
122
Figure 53
Chapter 5
123
Figure 54
Chapter 5
124
DISCUSSION
We explored the diurnal patterns of heat production RQ and net rates of carbohydrate
and fat oxidation of LSC and HSC pigs fed a diet with or without extra supplemented AA
with the objective to gain insight in underlying mechanisms of increased energy
expenditure and reduced incremental efficiency of protein retention for LSC pigs This was
determined by measurement of heat production RQ carbohydrate and fat oxidation in 6
min intervals and averaging these values per hour per day per ad libitum and restricted
feeding period Feed intakes differed among treatments during the ad libitum and
restricted feeding periods (Chapter 4) For the objective of this study we adjusted all
parameters to the same GE intake to ease interpretation of the effects of SC and AA
supplementation
Contrast in sanitary conditions The contrast in SC was created by a combination of
vaccination antibiotic treatment hygiene disinfecting and introducing manure and dust in
pens The LSC pigs had a lower rate of BW gain feed intake gainfeed ratio (Chapter 4) and
higher haptoglobin concentrations in serum than HSC pigs which is in accordance with a
previous study (van der Meer et al 2016) In addition no clinical signs of illness were
observed during the experiment Overall these results indicate that a contrast in SC is
reflected by the physiology of the pigs and illustrate the chronic low grade inflammation
that was induced which is detailed in Chapter 4
The LSC pigs had an 8 increased FHP 20 points reduced incremental efficiency for
protein deposition compared with HSC pigs The incremental efficiency for fat deposition
remained unaffected (Chapter 4) Supplementation of the basic AA profile with 20 Met
Thr and Trp did not affect any of the parameters measured
The difference in FHP seems to be present during the whole day as RMR values in the
diurnal pattern in the restricted feeding period were higher or tended to be higher for LSC
pigs compared with HSC pigs for almost all hours The difference between LSC and HSC pigs
was close to 50 kJ kg -06 d-1 which is similar to the difference in FHP (+55 kJ kg -06 d-1 )
found between the LSC and HSC pigs as described in Chapter 4 It is likely that the
difference found in FHP was causing the difference in RMR between the SC treatment
groups in the restricted feeding period The maximal difference in RMR of LSC and HSC pigs
in the restricted week however was higher than 50 kJ kg -06 d-1 namely 80 kJ kg -06 d-1
at max at 900 and 1000 am This greater difference was especially present during the
peak moments in RMR over the day Assuming that FHP stays constant over the day the
difference in RMR higher than the difference in FHP should be due to a difference in the
TEF post meal between LSC and HSC pigs but this could not be detected significantly
Interestingly the difference in RMR between SC was not present during the ad libitum
period during which RMR values were 300 kJ higher than during the restricted period
Chapter 5
125
Physical activity in ad libitum and restricted fed pigs The increase in energy expenditure for
physical activity with increasing feed intake was not affected by the experimental
treatments (Chapter3) Nonetheless differences were detected for physical activity during
the ad libitum and restricted periods and treatment effects were present during the
restricted period During the restricted but not during the ad libitum feeding period
activity of LSC pigs was lower after the morning meal and increasing in the beginning of the
night compared with the HSC pigs
The stable RQ found in the ad libitum week (Fig 52A) suggests that the ad libitum fed
animals ate several times during the 24 h period In a study of Souza da Silva et al (2014)
was reported that group housed control pigs that were fed ad libitum had 175 meals per
day and spend 815 min eating per 24 h period supporting that ad libitum fed animals eat
several times per day As the ad libitum pigs in our experiment did not eat only during the
moment of high Hact the two peaks found for Hact in the ad libitum fed pigs cannot be
explained by feeding activity alone The two similar Hact peaks for the restricted fed
animals might be largely affected by meal related behaviour though In the ad libitum week
caretakers visited the chambers at 730 am and 330 pm for taking rectal faecal samples
perhaps these events affected the activity pattern of the ad libitum fed pigs
At 200 and 300 pm in the ad libitum week and at 900 and 1100 am in the restricted week
the Hact was lower for LSC pigs than for HSC pigs In the ad libitum feeding period we also
observed a lower carbohydrate oxidation for LSC pigs at 200 and 300 pm than for HSC
pigs It might be that LSC pigs in the ad libitum feeding period were less active and
therefore used less energy for activity leading to lower carbohydrate oxidation for LSC pigs
than for HSC pigs In the restricted feeding period no effects on carbohydrate oxidation
were found at 900 and 1100 am For RMR there were differences found at these moments
in the 24 period with higher RMR for LSC pigs than for HSC pigs
It might be that the differences found for Hact in LSC and HSC pigs was related to
differences in satiety between LSC and HSC pigs It is known that in pigs activity patterns
reflect differences in satiety (Brouns et al 1994 Beattie and OConnellt 2002 de Leeuw et
al 2008) Lower Hact values might reflect higher satiety in LSC pigs than in HSC pigs When
comparing the feed intake per kg BW06 of the ad libitum and restricted feeding period for
both SC groups we see a larger reduction in intake between the two periods for LSC than
for HSC pigs The LSC pigs had more difficulty with consuming 70 of their ad libitum intake
in two meals of 30 min than HSC pigs even though the absolute reduction in gd was less
big for LSC pigs More feed refusals for the LSC pigs in the restricted feeding period led to a
stronger reduction in feed intake between the two periods for the LSC compared with the
HSC pigs Taking this into consideration the reduction in energy expenditure for physical
activity following the morning meal likely reflects increased satiety of these pigs suggesting
that feeding patterns over the day may be affected by SC
Chapter 5
126
The RQ for the oxidation of carbohydrates fats and proteins is approximately 1 07 and
08 respectively slightly depending on the type of substrate within each class An RQ
exceeding 1 indicates de novo fatty acid synthesis from carbohydrates (Kuhla et al 2015
van den Borne et al 2015) The RQ value for the ad libitum feeding period was
continuously exceeding 1 reflecting fat deposition from carbohydrates and corresponds
with the constant negative fat oxidation found during the day The diurnal pattern for the
RQ of pigs in the restricted feeding period was comparable to restricted fed pigs with a diet
containing pregelatinized starch in a study of Gerrits et al (2012) and to restricted fed pigs
with a pregelatinized or a native potato starch in a study of Bolhuis et al (2008) Hence the
diurnal pattern found for the restricted feeding period seems to be typical for restricted fed
pigs Diurnal patterns for carbohydrate and fat oxidation were unaffected by SC Hence
there are no indications that differences in the incremental efficiency of dietary protein for
protein deposition can be linked to particular differences in fat or carbohydrate oxidation at
particular times of the day It can be concluded from the present study that LSC pigs
reduced their energy expenditure on physical activity and increased their resting metabolic
rate in the restricted feeding period compared with HSC pigs especially when lights were
on Therefore the diurnal energy expenditure pattern of LSC and HSC pigs can be
considered as different Within day patterns of net fat and carbohydrate oxidation were not
affected by sanitary conditions Therefore It is speculated that the reduction of the
incremental utilization of dietary protein under low sanitary conditions is not restricted to
particular periods within the day
Acknowledgements Funding through Dutch BreedampFeed4Food consortium is gratefully
acknowledged The authors thank H Van Diepen for support on formulation of the
experimental diets The authors thank the staff of the experimental facility of Wageningen
University T Zandstra S Alferink M Heetkamp and the staff of Wageningen UR Livestock
Research for their contributions
Chapter 5
127
REFERENCES
Beattie V and N OConnellt 2002 Relationship between rooting behaviour and foraging in growing pigs Anim Welfare 11 295-
303 Bolhuis J E Van den Brand H Staals S Zandstra T Alferink S Heetkamp M and Gerrits W 2008 Effects of fermentable starch and
straw-enriched housing on energy partitioning of growing pigs Anim 21028-1036 Brouns F S A Edwards and P R English 1994 Effect of dietary fibre and feeding system on activity and oral behaviour of group
housed gilts Appl Anim Beh Sci 39 215-223 Brouwer E 1958 One simple formulae for calculating the heat expenditure and the quantities of carbohydrate and fat oxidized in
metabolism of men and animals from gaseous exchange (oxygen intake and carbon acid output) and urine-N Acta Physiolog Neerl 6 795-802
Centraal Veevoeder Bureau (CVB) 2011 Chemical compositions and nutritional values of feed ingredients CVB Lelystad The Netherlands
de Leeuw JA J E Bolhuis G Bosch and W J J Gerrits 2008 Effects of dietary fibre on behaviour and satiety in pigs Symposium on lsquoBehavioural nutrition and energy balance in the young Proc Nutr Soc 67 334-342
Gerrits W J J M W Bosch J J G C and van den Borne 2012 Quantifying resistant starch using novel in vivo methodology and the energetic utilization of fermented starch in pigs J Nutr 142 238-244
Heetkamp M J W S J J Alferink T Zandtra P Hendriks H van den Brand and W J J Gerrits 2015 Design of climate respiration chambers adjustable to the metabolic mass of subjects In W J J Gerrits and E Labussiegravere editors Indirect calorimetry Techniques computations and applications Wageningen Academic Publishers Wageningen p 35-56
International Organization for Standardization (ISO) 2005a Animal feeding stuffs ndash Determination of amino acids content ISO 13903 Int Organ Stand Geneve Switzerland
International Organization for Standardization (ISO) 2005b Animal feeding stuffs ndash Determination of tryptophan content ISO 13903 Organ Stand Geneve Switzerland
Kampman-van de Hoek E A J M Jansman J J G C van den Borne C M C van der Peet-Schwering H van Beers-Schreur and W J J Gerrits 2016 Dietary amino acid deficiency reduces the utilization of amino acids for growth in growing pigs after a period of poor health J Nutr 146 51-58
Kuhla B M Derno and C C Metges 2015 Indirect calorimetry for elucidating dynamics in energy metabolism of farm animals In W J J Gerrits and E Labussiegravere editors Indirect calorimetry Techniques computations and applications Wageningen Academic Publishers p 115-134
Le Flocrsquoh N D Melchior and B Segraveve 2008 Dietary tryptophan helps to preserve tryptophan homeostasis in pigs suffering from lung inflammation J Anim Sci 86 3473-3479
Lochmiller R L and C Deerenberg 2000 Trade-offs in evolutionary immunology Just what is the cost of immunity Oikos 88 87-98
NRC 2012 Nutrient Requirements of Swine 11th ed Natl Acad Press Washington DC
Parmentier H k S Bronkhorst M G Nieuwland G V Reilingh J M van der Linden M J Heetkamp B Kemp J W Schrama M
W Verstegen and H van den Brand 2002 Increased fat deposition after repeated immunization in growing chickens
Poult Sci 81 1308-1316
Souza da Silva C G Bosch J E Bolhuis L Stappers H van Hees W J J Gerrits and B Kemp 2014 Effects of alginate and resistant starch on feeding patterns behaviour and performance in ad libitum-fed growing pigs Anim 8 1917-1927
van der Meer Y A Lammers A J M Jansman M M J A Rijnen W H Hendriks and W J J Gerrits 2016 Performance of pigs kept under different sanitary conditions affected by protein intake and amino acid supplementation J Anim Sci 94 4704-4719
van den Borne J J G C M J W Heetkamp S JJ Alferink and W JJ Gerrits 2015 Moving from a complete energy balance towards substrate oxidation use of stable isotopes In W J J Gerrits and E Labussiegravere editors Indirect calorimetry Techniques computations and applications Wageningen Academic Publishers p 2907-2915
van Klinken J B S A van den Berg L M Havekes and K W van Dijk 2012 Estimation of activity related energy expenditure and resting metabolic rate in freely moving mice from indirect calorimetry data PLOS ONE 7 e36162
Table 51 Partitioning of heat in pigs kept under different sanitary conditions and fed a diet with or without extra AA at 70 of ad libitum intake and during a 25 h period of
fasting1
LSC2 HSC P-values6
Item (kJBW-06d-1) AA-B3 AA-S AA-B AA-S SEM5 SC AA batch7 SCtimesAA
n4 6 3 6 4
Htot 1168 1134 1149 1135 15 016 059 0002 058
Hact 177 204 179 206 26 032 095 042 099
RMR 990 930 970 929 23 005 066 026 070
TEF 250 228 237 248 20 078 083 074 041
sTEF 165 139 155 161 18 058 072 082 040
lTEF 85 89 82 87 17 077 087 098 099
FHP 741 702 733 680 23 006 052 009 077
Htot = total heat production Hact = physical activity related heat RMR = resting metabolic rate TEF = thermic effect of feeding sTEF = short thermic effect of feeding lTEF = long thermic effect of feeding FHP = fasting heat production GE = gross energy1Results are predicted means adjusted to the same GE intake by including observed GE intakes per group as covariate in the model 2 LSC = Low sanitary conditions HSC= High sanitary conditions 3 AA-B = basal amino acid profile AA-S= supplemented amino acid profile 20 more Met Thr and Trp compared with basal 4 n = number of pens a pen contained 6 pigs 5 SEM = pooled standard error of the mean means are presented as least square means 6 Considered significant when P le 005 considered as tendency when 005 lt P le 010 7No interactions with batch were found
Chapter 5
129
SUPPLEMENTAL TABLE Supplemental table I Ingredients and nutrient composition of the treatment diets
Item Ingredient gkg of feed
AA-B1 AA-S1
Wheat 3086 3086
Maize 2000 2000
Barley 2000 2000
Soybean meal 1845 1845
Maize starch 258 234
Sugarcane molasses 200 200
Limestone 147 147
Monocalcium phosphate 90 90
Soybean oil 192 192
Vitamin + mineral mix2 50 50
Salt 35 35
L-lysine HCl 34 34
Titanium dioxide 25 25
Sodium bicarbonate 21 21
L-threonine 10 21
L-tryptophan 00 04
DL-methionine 04 13
L-Valine 03 03
Nutrients calculated gkg
NE MJkg3 98 98
DM 8896 8898
Crude protein4 1660 1670
Starch 4741 4723
Lys4 98 101
Thr4 66 78
Trp4 22 26
Met + Cys4 52 62
Ile4 82 83
Arg4 118 122
Phe4 94 99
His4 55 53
Leu4 150 153
Tyr4 62 62
Val4 96 98 1 AA-B = basal dietary AA profile AA-S= supplemented dietary AA profile containing 20 more Met Thr and Trp compared with the basal profile 2 Supplied the following per kilogram of diet 30 mg riboflavin 20 mg niacine 20 mg d-pantothenic acid 10 mg choline chloride 0015 mg cyanocobalamin 40 mg dl-α-tocopheryl acetate 15 mg menadione 6000 IU retinyl acetate 1200 IU cholecalciferol 02 mg folic acid 10 mg thiamin 10 mg pyridoxine HCl 50 mg manganese oxide 267 mg iron SO4middotH2O 60 mg copper SO4middot5H2O 140 mg zinc SO4middotH2O 044 mg disodium selenium trioxide10 mg potassium iodate 3 Based on chemical composition digestibility and energy value for pigs from the Centraal Veevoeder Bureau livestock feed table (CVB 2011) 4 Analyzed values
Chapter 6
General discussion
Chapter 6
132
INTRODUCTION
It is economically and environmentally important to match the nutrient supply to the
nutrient requirements in pig production Until now the effects of different sanitary
conditions (SC) on energy and nutrient requirements are not implemented in
recommendations for nutrient requirement values (ARC 1981 Whittemore et al 2003
Santioga Rostagno et al 2011 NRC 2012 CVB 2016) The nutrient requirement data in
these tables are based on studies in with pigs are kept under conditions that can be
regarded as close to optimal Changes in nutrient requirements caused by differences in
sanitary conditions are poorly documented As in pig industry hygienic conditions are
variable it is of major importance to determine the effects of low sanitary conditions (LSC)
on amino acids (AA) and energy requirements in growing pigs Pigs under LSC have an
increased risk of (subclinical) infections resulting consequently in a more chronic
stimulation of their immune system Immune system stimulation is known to influence
energy and AA metabolism However most studies in pigs evaluating the relationship
between immune system stimulation and nutrient requirements use specific experimental
challenge models Whereas such models have the obvious advantage of reproducibility and
allow mechanistic insight in the effects of stimulating specific parts of the immune system
these models often are in the range of clinical illness and results from such models may
therefore be difficult to translate to practical situations
Therefore the objective of this thesis was to study the effects of low and high sanitary
conditions (HSC) on AA and energy metabolism in pigs In this chapter the different
experiments presented in this thesis are discussed with emphasis on the different models
used in comparison with other challenge studies Additional data are presented in text
boxes Methodological aspects related to measurements on AA and energy metabolism are
discussed and an overall summary of effects for LSC pigs compared with HSC pigs and
consequences for nutrient requirements is given with implication of the results for current
pig feed industry General conclusions are provided at the end of this chapter
Chapter 6
133
CHALLENGE STUDIES TO STIMULATE THE IMMUNE SYSTEM
To implement effects of SC on energy and nutrient requirements for growing pigs in feed
advise tables data on the effects of SC on energy and nutrient metabolism are needed
Sanitary conditions are known to influence the energy and nutrient requirements via the
immune system and therefore it is interesting to collect data of pigs with a contrast in
immune stimulation To study the effects of immune stimulation due to LSC a model is
needed that mimics chronic immune stimulation on a subclinical level and allows to study
the impact on nutrient requirements In literature several immune stimulating models have
been described and several porcine immune stimulation models used in relation to
nutrition or metabolism are listed in Table 61
Table 61 Overview of models used in pigs experiments to stimulate the immune system in relation with nutrition
challenge dose estimated BW1 response fever duration ΔADFI2 ΔADG2 ΔGF ratio2 references
Lipopolysaccharide (LPS)
LPS repeated increasing iv dose every 48 h for 7 d 21-25 kg haptoglobinuarr
fibrinogenuarr yes
7 days from start to end
-6 Rakhshandeh et al (2010)
LPS repeated iv dose every 48 h for 7 d initial
dose 20 μgkg BW +15 per dose 20-25 kg
haptoglobinuarr albumindarr
fibrinogenuarr white blood cell countuarr
yes 7 days from start to end
de Ridder et
al (2012)
LPS repeated iv dose every Monday and Thursday
for 6 weeks initial dose 30 microgkg BW +15 per dose
53-60 kg haptoglobinuarr
albumindarr neutrophilsuarr
yes 6 weeks
from start to end
Kim et al
(2012)
LPS repeated iv dose d1 every 48h until day 7
initial dose 50 microg kg BW +12 each dose and the last one +15
18-22 kg haptoglobinuarr
albumindarr fibrinogenuarr
yes
7 days from start to end
plusmn 12h of anorexia per
injection
Litvak et al
(2013)
LPS Repeated iv dose d1 3 5 7 9initial dose 30
microgkg BW +12 per dose 64-68 kg yes
10 days from start to
end -25 -67 -55
Campos et al (2014)
LPS single iv dose 2 microgkg BW 12-16 kg TNF-αuarr IFN-үuarr
yes plusmn 6 hours Clouard et al
(2015)
LPS single iv dose 25 microgkg BW
TNF-αuarr IL-1buarr IL-6uarr haptoglobinuarr
WBCuarr
plusmn 6 hours Williams et al (2009)
1 BW = body weight 2 Δ = the difference between challenged and unchallenged pigs ADFI = average daily feed intake ADG average daily gain GF = gain to feed 3 RBC = red
blood cells
1 BW = body weight 2 Δ = the difference between challenged and unchallenged pigs ADFI = average daily feed intake ADG average daily gain GF = gain to feed 3 RBC = red
blood cells
challenge dose estimated
BW1 response fever duration ΔADFI2 ΔADG2 ΔGF
ratio2 references
Complete Freundrsquos adjuvant (CFA)
CFA iv 3 mL per pig 11-16 kg haptoglobinuarr
respiratory rythmuarr Yes
7 days from start to end clinical sign seem to decrease
after 2 days
no
effect
Le Flocrsquoh et al (2008)
CFA iv 3 mL per pig 11-15 kg haptoglobinuarr
respiratory rythmuarr Yes
10 days from start to end clinical sign seem to decrease
after 2 days
-50 immediately after
no effect
Melchior et al (2004)
CFA iv 02 mLkg BW 28-35 kg haptoglobinuarr
CRPuarr PigMAPuarr
9 days from start to end
Kampman-van de Hoek et al
(2015)
CFA iv 02 mLkg BW 30-40 kg haptoglobinuarr
CRPuarr PigMAPuarr respiratory rythm uarr
Yes 9 days from start
to end
-30 immediately after no effect
from 2 d onwards -10
Kampman- van de Hoek et
al (2011) Turpetine oil (TO)
TO sc 10 mLkg BW every 72h 24-27 kg IL-1β uarr RBC3 darr skin
ulcersuarr Yes
10 days from start to end
plusmn-50 Rakhshandeh and de Lange
(2012)
TO sc 03 mLkg BW 20-25 kg haptoglobinuarr
CRPuarr PigMAPuarr plusmn 14 days
Carpintero et al (2005)
TO sc 03 mLkg BW 18-22 kg haptoglobinuarr
CRPuarr PigMAPuarr Yes plusmn 15 days
Heegaard et al (2011)
TO sc 03 mLkg BW 30-40 kg haptoglobinuarr
CRPuarr PigMAPuarr Yes
9 days from start to end
-17 immediately after no effect
from 2 d onwards
no effect
Kampman-van de Hoek et al
(2011)
challenge dose estimated
BW1 response fever duration ΔADFI2 ΔADG2 ΔGF
ratio2 references
A pleuropneumoniae
A pleu Serotype 5b biotype 1 28-35 kg haptoglobin uarrCRP uarr
MAP uarr yes
plusmn 15 days
Heegaard et al (1998)
A pleu inhalation with serotype 4 isolate 15-20 kg haptoglobin uarrCRP uarr
PigMAP uarr yes
plusmn 20 days
loss of appetite
direct after
Heegaard et al (2011)
A pleu intranasal with serotype 5b isolate
L20 15-20 kg CRP uarr IL-6 uarr Skovgaard et al (2009)
A pleu serotype 5b biotype 1 28-35 kg PigMAP uarr Apo A-1 darr
plusmn 12-15
days Carpintero et al (2005)
E coli (ETEC)
ETEC 5 ml of E coli K88+ dose of 1010
CFUml per piglet 5-10-kg
diarrhoeauarr mortalityuarr
2 days from
start to end
Marquardt et al (2006)
ETEC oral challenge of 2times109 CFU
comprised of two strains of F18 ETEC 6-10 kg
IL-6uarr IL-8uarr TNF-αuarr neutrophilsuarr
diarrheauarr villus lengthdarr mucosal mast
cellsuarr
4 days from
start to end
-30 Mclamb et al (2013)
ETEC orally dose of 10 ml PBS containing 1 times 108 CFU of ETEC K88 2 subsequent
days 8-10 kg
diarrhoeauarr gene expression IL-10 and
IL12auarr -35 -60 -30 Heim et al (2014)
S suis
Ssuis serotype 2 strain 93 30-35 kg PigMAPuarr ApoA-1darr
plusmn 12-15
days Carpintero et al (2005)
Ssuis sc serotype 2 ribotype I isolate 1
mL (1010 CFU) 10-15 kg
haptoglobinuarr CRPuarr PigMAPuarr
yes plusmn 20 days
loss of appetite at 1st day
p challenge
Heegaard et al (2011))
1 BW = body weight 2 Δ = the difference between challenged and unchallenged pigs ADFI = average daily feed intake ADG average daily gain GF = gain to feed
Chapter 6
137
The effects on the immune system andor pig performance are listed per model in Table
61 All described models stimulated the innate immune system of the pig which was
expected This means that cytokines produced by innate immune cells and acute phase
proteins in the blood and rectal temperature increase significantly in response to the
challenge The adaptive immune system was not evaluated in these studies which does not
mean that this part of the immune system was not influenced by these challenges
Administration of a single iv dose of lipopolysaccharide (LPS) leads to a short sickness
response of about 6 hours (Williams et al 2009 Clouard et al 2015) Injection with LPS
typically leads to an increase in proinflammatory cytokines (IL-6 TNF-α IFN-ү) body
temperature acute phase proteins (haptoglobin CRP pigMAP fibrinogen) and the number
of white blood cells (WBC) Attention should be paid to the effects of LPS injection between
individual pigs as the sickness response for some pigs might be very severe and even may
cause death (Williams et al 2009) By repeating the administration of LPS every two days
the immune system can be stimulated for a longer period than 6 hours (for example for 7-
10 days (Rakhshandeh et al 2010 de Ridder et al 2012 Kim et al 2012 Litvak et al
2013 Campos et al 2014) Pigs develop however rapidly tolerance to LPS To maintain a
similar immune stimulating effect an increased dosage of 12 or 15 should be given at
each subsequent injection (Table 61) Campos et al (2014) and Rakshandeh et al (2010)
reported a reducing effect on ADFI when pigs were repeatedly challenged with LPS
Campos et al (2014) also found a negative effect on ADG and GF ratio suggesting that the
lower ADG found for challenged pigs was not only due to the reduced feed intake but also
partly due to a different efficiency In contrast Pastorelli et al (2012b) showed in a meta-
analysis based on 12 studies with LPS challenged pigs that a reduction in ADG after this
challenge was associated with a reduction in feed intake rather than related to changes in
feed efficiency
Another model to stimulate the immune system of pigs is iv injection with Complete
Freundrsquos Adjuvant (CFA) (Melchior et al 2004 Le Flocrsquoh et al 2008 Kampman-van de
Hoek et al 2011) Complete Freundrsquos Adjuvant is a mineral oil containing 1 mg of dead
Mycobacterium tuberculosis cells per mL As CFA contains dead bacteria this challenge is
not infectious to other animals in the same room or pen After injection with CFA pigs will
develop a chronic lung inflammation and acute phase proteins like haptoglobin pigMAP
and CRP increase Pigs will become lethargic and the respiratory rhythm of the pig is
accelerated The clinical signs of illness are reported to decrease after 2 days post challenge
(Melchior et al 2004 Le Flocrsquoh et al 2008) and after dissection lung lesions can be found
which were found to be the most severe between 7 and 14 days post injection (Edwards
and Slauson 1983) Severity of the response to CFA challenge can be variable between
individual animals Kampman-van de Hoek et al (2015) reported that eight out of 16 pigs
responded clinically more severe than expected based on the response in a previous pilot
study with the same challenge
Chapter 6
138
Turpentine oil (TO) an oil from a coniferious tree (Pinus spp) is sc injected and is used in
pigs and also other animal as a model agent such as LPS and CFA to stimulate the immune
system Similar to LPS and CFA TO leads to increased acute phase protein concentrations in
blood and fever after injection most likely due to cytokine production (IL-6 TNF-α and IL-
1β) Kampman-van de Hoek et al (2016) found a greater within animal variation and a
lower magnitude of response for acute phase proteins of pigs challenged with TO
compared with CFA In a study of Rahkshandeh and de Lange (2012) an extreme reduction
in feed intake (50) and severe skin ulcerations were found in repeatedly TO injected pigs
which indicates that TO as a model leads to severe responses
Next to the non-pathogenic agents such as LPS CFA and TO there are models in which pigs
are exposed to live pathogenic bacteria such as Actinobacillus pleuropneumoniae
Escherichia coli and Streptococcus suis bacteria to stimulate the immune system These
bacteria are orally dosed or intranasal administered to the pig E coli is used for inducing an
intestinal infection leading to diarrhoea A pleuropneumoniae to induce a lung
inflammation and S suis challenge might lead to clinical signs of illness such as lameness
and meningitis The effects of these three experimental models using living pathogenic
bacteria can be managed by using a standard dosage of bacterial cells to infect the pigs It is
difficult to estimate how long the immune system remains stimulated after the described
bacterial challenges as in many studies pigs are dissected before responses were back to
baseline again Based on the references listed in Table 61 the effects of a challenge with E
coli last at least several days (plusmn 4 days McLamb et al 2013) and a challenge with A
pleuropneumoniae and S suis can result in a stimulated immune system up to 20 days
(Heegaard et al 2011)
In general models with agents such as LPS CFA and TO and living pathogens are suitable
for studies evaluating nutritional costs of disease or mechanistic relationships between
immune stimulation and nutrition These models already lead to valuable information
about the effects of immune stimulation on AA requirements in pigs and showed for
example that requirements for tryptophan and methionine were increased for immune
stimulated pigs The results of studies using such challenge models however are difficult
to translate to an on farm situation The models using live pathogens are associated with
variable responses high mortality rate and extreme loss of BW depending on the nature
and pathogenicity of the micro-organism (Wichterman et al 1980) When using living
pathogens in an immune stimulation model it should be taken into account that special
housing conditions should be available to prevent spreading of the pathogen to
unchallenged animals Models with non-pathogenic agents such as LPS CFA and TO are
sterile models which can be more easily controlled and can induce more reproducible
responses Administering these agents in a high concentration single dose however might
lead to severe clinical responses and it is not unusual that some of the challenged pigs die
(Williams et al 2009) Reduction of the concentration per dose gives less severe responses
Chapter 6
139
however shortens the recovery time to several hours and repeated or continuous
administration of LPS leads to tolerance
The natural challenges for a growing pig on a commercial farm are mostly less extreme and
more low-grade (often subclinical instead of clinical) than the immune stimulation models
presented in Table 61 Some examples of factors stimulating the innate immune system of
growing pigs on commercial farms are the presence of pathogenic bacteria viruses and
parasites that can spread via faeces dust feed water or low hygiene conditions in general
A sub-optimal climate (too cold or warm air flow too high or low) high animal density and
behavioural problems (biting behaviour aggressive behaviour) may aggravate this by
increasing transmission of pathogens causing stress and irritated tissue
Pigs on farm often have not to deal with one single immune stimulating factor such as LPS
or an infection with E coli but with a combination of the earlier mentioned factors To
measure the effects of these commercial farm factors on energy and AA requirements of
pigs these commercial farm conditions should be mimicked with a model in an
experimental setting or the measurements should be done on a farm having these
conditions The following criteria were set for an experimental model to study energy and
AA metabolism of growing pigs affected by sanitary conditions
- The experimental conditions should lead to a contrast in innate immune
stimulation however clinical signs of disease should be absent
- The contrast in innate immune stimulation should be created in a group of pigs
with the same origin and background
- Interaction with pen mates in group housing should be possible by using the
model
For the experiments described in Chapter 2 and 4 an experimental model based on these
criteria was used In both experiments pigs with clinical signs of illness were removed from
these studies (n = 1 and n = 0 for Chapter 2 and 4 respectively) The ADG of LSC pigs was
lower and LSC pigs had higher serum haptoglobin levels than HSC pigs In addition LSC pigs
of Chapter 2 had greater KLH-IgG titers than HSC pigs This indicates that in the absence of
clinical signs of illness a contrast in immune effector functions was found between LSC and
HSC pigs In addition after slaughter more lung lesions were observed in LSC than in HSC
pigs which is a sign of increased subclinical infections for LSC pigs
Kampman-van de Hoek et al (2016) selected pigs at a low and high health status farm
based on a contrast in serological monitoring program for the presence of antibodies
against several pathogens and moved these pigs to an experimental farm for
measurements Upon arrival at the experimental farm all pigs were housed on metabolism
cages Low health status pigs were housed in a clean but not disinfected area and were not
treated with antibiotics while high health pigs were housed in a cleaned and disinfected
area including HEPA filters and received an antibiotic treatment High health pig personnel
Chapter 6
140
had to follow a strict hygiene protocol Despite the contrast in conditions for low and high
health pigs low health pigs showed a greater ADG more efficient N digestion and greater
N retention during the experiment than high health pigs (Kampman-van de Hoek et al
2016) which was explained as possible compensatory effect due to improved health during
the experimental period for low health status pigs compared with the period on the farm of
origin before the experimental period The study of Kampman-Van de Hoek et al (2016)
shows that it is difficult to maintain the health status of pigs of a farm of origin in an
experimental setting particularly when housed in metabolism cages When a contrast in
health status is imposed to a group of pigs with the same original health status and are
obtained from the same farm as done in Chapter 2 and 4 low sanitary status could be
maintained more easily
For the studies described in Chapter 2 and 4 several batch effects were found for
performance and immunological parameters but not for parameters related to the
incremental efficiency of nutrient utilization which means that the response of pig batches
varied among treatments The batch effects might be caused by a combination of effect of
the batch of pigs originating from the same farm per experiment but obtained at a
different time point the effect of batches of manure and dust introduced to the pens and
the effect of time As the housing conditions during the experiments were standardised it
is assumed that the batch effects were due to pig batch and manure and dust batch Most
of the effects found for batch were not changing the direction of the observed effects
Reducing experimental variation by the use of a single batch as done by others using
similar models (Williams et al 1997 Le Flocrsquoh et al 2009 Pastorelli et al 2012a) should
be reconsidered as the observed variation among batches of Chapter 2 and 4 indicate the
importance of having more than a single batch in studies using a chronic low grade immune
stimulation approach
VARIATION IN CONDITIONS FOR DIFFERENT EXPERIMENTAL
MODELS
In literature several studies have been described that used a similar chronic low-grade
immune system stimulation model (Williams et al 1997 Lee et al 2005 Le Floch et al
2006 Le Flocrsquoh et al 2009 Pastorelli et al 2012a Jayaraman et al 2016) Each study uses
a combination of factors to create a contrast in immune system stimulation and was
compared with the studies described in Chapter 2 and 4 (Table 62) It is interesting to see
whether these models by using a different combination of factors result in a similar effect
as in our studies
Haptoglobin concentration When comparing the haptoglobin concentration in the blood of
pigs from these eight comparable studies (Fig 61) haptoglobin concentration was greater
Chapter 6
141
for LSC pigs compared with HSC pigs in four out of six studies that measured this
parameter Jayaraman et al (2016) found a tendency for higher haptoglobin concentration
for LSC compared with HSC pigs The haptoglobin values for Jayaraman et al (2016) were in
a higher range than in the other studies Perhaps this was due to more severe conditions
such as a high aerial ammonia concentration for both LSC and HSC pigs compared with the
other studies Pastorelli et al (2012a) did not find a significant difference for average
haptoglobin concentration between LSC and HSC pigs over the complete experimental
period Pastorelli et al (2012a) found a tendency for greater haptoglobin values in LSC
compared with HSC pigs in a period before the pigs were transferred from the weaner to
the grower unit which was an event meant as stressor in both LSC and HSC groups
Perhaps transfer from weaner to grower unit stimulated the immune system of both LSC
and HSC pigs resulting in similar haptoglobin values in blood
Table 62 Overview of factors used to create a contrast in immune stimulation for six comparable studies with pigs
Nr Reference n Housing m2 pig
Weaning age
Initial age contrast
Duration of experiment
1 experiment 1 (Chapter 2) 612 Group 08 24 d 70 d 16 wk
2 experiment 2 (Chapter 4) 144 Group 08 21 d 21 d 8 wk
3 le Floc h et al 2006 40 Individual 23 28 d 28 d plusmn65 wk
4 le Floc h et al 2009 80 Individual 28 d 28 d plusmn6 wk
5 Pastorelli et al 2012 20 Individual 05 28 d 28 d plusmn6 wk
6 Williams et al 1997 30 Individual 04 12 vs 19
d 12 vs 19 d plusmn 7 wk
7 Jayaraman et al 2016 180 Group 21 d 21 d 2 wk
8 Lee et al 2005 272 groupindividual 054 21 d 21 d 5 wk
low sanitary condition high sanitary condition
vaccination program 12 (6)a
clean and disinfected rooms 12345678
preventive antibiotics 12345
deworming 1
introduction of non-experimental pigs 346
spreading manure 127
spreading dust 2
hygiene protocol personnel 12
recycling air in room 8 a The number between brackets means that these pigs were the offspring of vaccinated sows instead of vaccinated
experimental pigs
Vaccination as part of the model Pastorelli et al (2012a) vaccinated both LSC and HSC pigs
against Influenza as controlled immunological challenge to compare the responses of both
LSC and HSC pigs The LSC pigs tended to have higher serum antibodies against influenza
virus than HSC pigs which suggest that LSC stimulated the antigen-specific humoral
response
Chapter 6
142
The studies described in Chapter 2 and 4 included a vaccination program as part of the
sanitary condition model It is debatable whether vaccination contributes to HSC It is
generally known that vaccination leads to initial innate immune activation as vaccines
contain a weak or dead pathogenic microorganism Vaccination might therefore cause loss
of appetite and fever andor adverse behaviour for a short period as side effect (Maes et
al 1999 Thacker et al 2000) The vaccination program used in the studies described in
Chapter 2 and 4 was not meant to challenge HSC pigs but to protect HSC pigs against
disease The vaccination program included administration of six vaccines during the first
nine weeks of age In the first experiment (Chapter 2) HSC pigs were 1 kg lighter than LSC
pigs at 10 weeks of age (after a complete vaccination program) and in the second
experiment (Chapter 4) HSC pigs were 03 kg lighter at weaning (plusmn 21 days of age after one
vaccination) than LSC pigs of the same age In both experiments this effect was in the
opposite direction during the experimental period The differences in BW at the beginning
of the experiments might be due to a negative effect immediately after vaccination on feed
intake and growth These negative effects on performance disappeared however within 2
weeks It can however not be excluded that vaccination of the HSC pigs reduced
unintentionally the immunological contrast between LSC and HSC pigs Inclusion of a
vaccination programme as a factor in the experimental model in this sense can be
controversial In the experiment described in Chapter 2 however the LSC pigs were tested
positive for porcine circo virus type 2 (PCV2) a virus HSC pigs were vaccinated against It is
likely that PCV2 vaccination protected the HSC pigs and consequently maintained a contrast
in immune stimulation between LSC and HSC pigs In this sense vaccination as part of an
experimental model for high sanitary conditions can be beneficial Vaccination of the
experimental pigs should therefore be considered based on the risks for disease during the
experiment When taking this into account vaccination of the HSC pigs in the experiment
described in Chapter 4 was probably not needed as this experiment was conducted under
(clean) experimental facilities with a low risk for pig diseases
Chapter 6
143
Figure 61 Comparison of haptoglobin concentration in blood of low (LSC) and high (HSC) sanitary condition pigs
for several references using a similar model to stimulate the immune system (Le Floch et al 2006 Le Flocrsquoh et al
2009 Pastorelli et al 2012a Jayaraman et al 2016) P le 005 + 005 lt P le 010
Performance and sanitary condition model When comparing performance data of the
previously mentioned eight studies the results for average daily gain (ADG) give a similar
picture (Fig 62) The difference in ADG between LSC and HSC treatments was significantly
different for all studies with HSC pigs having the highest ADG The proportion of the
difference in ADG when expressing the difference between LSC and HSC as a percentage of
HSC was variable between the studies (Fig 63) The lowest difference (6 reduction in ADG
for LSC compared with HSC) was found in the experiments described in Chapter 2 and for a
study of Le Flocrsquoh et al (2006) The highest difference was found in the experiment
described in Chapter 4 (26 difference in ADG) In all studies except for Jayaraman et al
(2016) the difference in ADG was due to both a difference in average daily feed intake
(ADFI) and gain to feed (GF) ratio for the LSC and HSC treatment groups In a meta-analysis
of Pastorelli et al (2012b) the reduction in ADG was reported for different immune
challenged pigs compared with control pigs For poor housing conditions a combination of
studies with poor hygiene conditions exposure to extreme temperatures and limiting
0
05
1
15
2
25
3
35
Hap
togl
ob
in g
LLSC
HSC
+
Chapter 6
144
Figure 62 Average daily gain (ADG) of low (LSC) and high (HSC) sanitary condition pigs for several references using
a similar model to stimulate the immune system (Williams et al 1997 Lee et al 2005 Le Floch et al 2006 Le
Flocrsquoh et al 2009 Pastorelli et al 2012a Jayaraman et al 2016) P le 005
space allowance a reduction of 15 in ADG was reported with 41 due to a reduction in
ADFI and 122 due to reduced efficiency or GF ratio Despite that all the eight studies (Fig
63) have a contrast in hygiene conditions the results of these studies are not completely in
line with Pastorelli et al (2012b) All studies represented in in Fig 63 differed in more
factors than only a contrast in hygiene conditions other factors were different which might
explain the difference in results with the previous mentioned meta-analysis The difference
in ADG was highest for the study described in Chapter 4 Williams et al (1997) and
Jayaraman et al (2016) In these studies piglets were weaned at 21 d of age or younger
(Table 61) and the contrast in sanitary conditions was created from weaning onwards for a
duration of 2 to 8 weeks The other studies except for Lee et al (2005) used pigs weaned at
24 d (Chapter 2) or 28 d of age (Le Floch et al 2006 Le Flocrsquoh et al 2009 Pastorelli et al
2012a) and the contrast in SC was created from weaning onwards or later in life (Chapter 2
initial age 70 d) and the experimental period lasted for 40 d to 16 weeks Pastorelli et al
(2012b) found that the difference in ADG decreased with increasing initial age and
0
200
400
600
800
1000
AD
G g
pig
day
LSC
HSC
Chapter 6
145
increased duration of the experimental period for models containing poor housing
conditions and digestive bacterial infections which is in line with the findings in Fig 63
The difference in initial age and duration of the study might explain the difference in ADG
contrast between the treatments of the studies described in Chapter 2 and 4 however the
experimental models used in both studies were not completely similar which might have
affected ADG as well In the study of Chapter 4 a manure mixture of 3 growing pigs farms
was spread weekly in the LSC pens whereas in the study of Chapter 2 manure of one sow
farm was spread every 2 weeks in the LSC pens from 5 weeks in experimental period
onwards In addition dust (ground pig manure and straw) was introduced in the study in
Chapter 4 which might have increased the contrast in SC compared with the study in
Chapter 2 Despite the differences in spreading manure or dust the composition of manure
is also variable in time which lowers the repeatability of such studies
Effect of aerial ammonia on performance When comparing the studies in which aerial
ammonia concentrations were reported there is variability in results (Table 63) Ammonia
is known to be irritating for respiratory tissues and eyes and will influence consequently
respiratory function (Urbain et al 1994 Groot Koerkamp et al 1998) The threshold for
ammonia was set on 20 ppm measured in the mean dwelling zone of animals by CIGR
(CIGR 1984) It is unclear where the value of the CIGR is based on In a study of Groot
Koerkamp et al (1998) was described that the labour inspectorate in several countries in
Europe has set the threshold limit for an 8 h working day on 25 ppm ammonia In a study of
Jones et al (1999) was reported that weaner pigs showed averse to ammonia
concentrations of more than 20 ppm in a choice study In this perspective ammonia
concentration was more severe in the study of Jayaraman et al (2016) compared with the
study in Chapter 2 and Lee et al (2005) Drummond et al (1980) found a negative effect of
high concentrations of aerial ammonia (50 ppm) on pig growth (-12 growth) This
negative effect of high ammonia concentrations on growth might partly explain the greater
difference in ADG between LSC and HSC pigs in the study of Jayaraman et al (2016)
compared with the study in Chapter 2 and Lee et al (2005)
Behaviour and sanitary conditions The relation between sanitary conditions and behaviour
of pigs is not often made In the experiment described in Chapter 3 LSC pigs were more
frequently biting in ears of pen mates than HSC pigs The mechanism behind the
relationship between LSC and redirected behaviour is not completely understood yet
Redirected behaviour might be a result of an increased drive for foraging behaviour as a
consequence of shortages of nutrients caused by immune stimulation In a study of
Pastorelli et al (2012a) individual housed LSC and HSC pigs were submitted to a diet change
from a starter to a weaner diet over a 3 day period (12 to 14 days post weaning) The HSC
pigs did not react on a change in diet whereas the LSC pigs increased their exploration
Chapter 6
146
behaviour towards the trough which included sniffing licking touching and chewing on the
trough The absence in the behavioural effect of HSC pigs was explained as a lower
reactivity for new situations associated with a more stable environment as described by
Greenberg (2003) and the redirected behaviour of LSC pigs was considered as a typical
signal of maladjustment as found by Wood-Gush and Vestergaard (1989) Despite that a
link between immune system stimulation due to LSC and a possibly consequential shortage
in nutrients and increased redirected behaviour was not made in the study of Pastorelli et
al (2012a) behavioural measurements showed that sanitary conditions and behaviour
were related Behaviour of pigs as an indicator for wellbeing can be considered as an
important parameter for immune stimulation studies The measurement of pig behaviour
in studies about sanitary conditions should therefore be considered more often
Figure 63 Difference in average daily gain (ADG) of low (LSC) and high (HSC) sanitary condition pigs for several references using a similar model to stimulate the immune system (Williams et al 1997 Le Floch et al 2006 Le Flocrsquoh et al 2009 Pastorelli et al 2012a Jayaraman et al 2016) The difference is expressed as a percentage relative to HSC
-6
-26
-6
-9
-11
-17-19
-10
-30
-25
-20
-15
-10
-5
0
Chapter 6
147
Table 63 Ammonia concentration for low and high sanitary condition pigs for several references using a similar model to stimulate the immune system
Estimated BW low sanitary condition high sanitary condition P-value
Chapter 2a 25-110 kg 171 plusmn 18 ppm 138 plusmn 13 ppm 014
Lee et al 2005 6-20 kg 130 plusmn 07 ppm 60 plusmn 05 ppm 0001
Jayaraman et al 2016 7-12 kg 267 plusmn 10 ppm 182 plusmn 11 ppm le 0001 a unpublished data measured weekly per room from 17 until 22 weeks of age
Immune system stimulation It is difficult to estimate the severity of the stimulation of the
innate immune system in pig studies Most of the studies about immune stimulation in
relation to nutrition and health report haptoglobin values some other acute phase proteins
and body temperature however often not many more parameters are presented
(Melchior et al 2004 Le Flocrsquoh et al 2009 Rakhshandeh et al 2010 Pastorelli et al
2012a) Acute phase proteins are relevant parameters as it is known that these proteins are
relatively stable in comparison to eg cytokines however more parameters are needed to
gain insight in the physiologicalmetabolic processes in the pig under different sanitary
conditions Analysis of natural antibodies in blood can for instance be such an additional
parameter Natural antibodies are defined as antigen-specific antibodies that are present in
the absence of intentional immunization with specific antigens (Star et al 2007) Because
natural antibodies play a role in the first line of defence against pathogens (Ochsenbein and
Zinkernagel 2000) an increase in natural antibody concentration might be an adaptive
response of pigs to the higher infection pressure for instance in the case of LSC The
experiment described in Chapter 4 showed higher KLH specific natural antibody levels in
LSC than in HSC pigs and this suggests together with the results presented in Textbox 61
that there was a contrast in immune system stimulation between LSC and HSC pigs
Measurement of white blood cell concentrations and blood cell differentiation might give
extra insight in the stimulation of the immune system For clinical infection studies this
might work as the results can be compared with reference values for clinically healthy
animals Results for blood cell counts as described in Chapter 2 and 4 however were more
difficult to interpret and gave variable results Partly the problems with interpreting these
blood cell counts were due to the fact that these values were within the reference values
for clinically healthy pigs
The pathogenic pressure on the immune system can be measured by testing the presence
of antigens against specific pathogens in the blood or the saliva of pigs A method to
analyse the presence of saliva was applied in the experiment described in Chapter 2
Collecting saliva of pigs is rather easy when using chewing ropes and the samples can
subsequently be analysed for the presence of pathogenic bacteria viruses and parasites
with PCR or culture techniques Saliva collection is not stressful for the pigs so it will not
influence other parameters measured in the experiment Moreover it is possible and easy
to sample a pen of pigs with one chewing rope to get a representative saliva sample The
collected saliva samples in the study described in Chapter 2 were only used for qualitative
Chapter 6
148
testing of the presence of antibodies against specific pathogens Other available analytical
methods allow to quantify antibody concentrations in saliva samples Collection and
analysis of saliva can therefore be of interest in studies evaluating the effects of sanitary
conditions
The pig performance and acute phase protein information reported in several studies
about sanitary conditions is too limited to conclude whether the innate immune system
was stimulated differently in LSC than in HSC pigs Additional measurements of natural
antibodies and antibodies against specific pathogens can give additional insight in the
infectious pressure however further research is needed develop a method or to evaluate
what combination of sanitary condition parameters are needed to get more insight into the
actual level of innate immune responses
It is interesting to investigate whether robustness of pigs is affected by different sanitary
conditions To this end we studied within the setting of the experiment described in
Chapters 2 and 3 the effect of sanitary conditions on the sickness response of pigs
provoked by a low iv dose of LPS This test is described in Textbox 61 From the results of
this study there are no indications that the sickness response of pigs is altered by sanitary
conditions
Chapter 6
149
Textbox 61 Effects of RGG and LPS challenge in pigs kept under low or high sanitary conditions
Aim To determine whether sanitary conditions (SC) affect the sickness response and antibody levels of pigs iv challenged with rabbit gamma globulin (RGG) and lipopolysaccharide (LPS) Materials and methods In Chapter 2 612 pigs (9 per pen) were subjected to one of 8 experimental treatments in a 2 times 2 times 2 factorial arrangement Pigs were kept under low (LSC) or high (HSC) sanitary conditions and offered ad libitum access to either a normal CP concentration diet or low CP concentration diet each of which containing a basal AA profile or a supplemented AA profile Pigs were followed for a complete fattening period and slaughtered at a targeted pen weight of 110 kg In total 68 pigs (40 kg BW) of Chapter 2 (one per pen) were iv challenged with LPS (Escherichia coli LPS serotype O111B4 Sigma Aldrich Zwijndrecht The Netherlands product code L4391) and RGG (ICN Biomedicals Inc code824551) LPS an endotoxin of E coli was used to induce a sickness response (Clouard et al 2015) and RGG protein was used to induce a specific humoral immune response The challenge solution was prepared the day prior to the injection by dissolving 1 mg RGG and 80 μg LPS in 1 ml sterile physiological saline and kept at 4 degC The average BW of the challenged animals was 40 kg at the day of challenge resulting in a challenge dose of about 2 μg of LPSkg BW similar to the dosage used by Clouard et al (2015) and a challenge dose of 0024 mg RGG kg BW One pig per pen was assigned to an iv injection with the challenge solution in the ear vein The challenge pigs were restrained the ear was cleaned with a gauze drained in alcohol and the vein at the ear base was clamped down by gently pressing it The solution was injected using 05 ml syringes with 29 gauge needles Rectal temperature of the challenged pigs was measured just before the challenge and 15 35 and 65 h after challenge In order to assess sickness behaviour a human approach test (HAT) was performed at 1 3 and 6 h after the challenge Although this test is normally used to assess fear and anxiety in pigs in the present study high latency in this test was considered indicative of sickness behaviour (Clouard et al 2016) During the test a person entered each pen and walked to a fixed position in the centre The latency of the challenged pig to approach or seek physical contact with the person was recorded with a maximum of 120 sec Blood was sampled from the jugular vein of the challenged pigs at 5 and 10 days post challenge and blood serum samples were analysed for antibody concentrations (both IgG and IgM against each LPS RGG and keyhole limpet hemocyanin (KLH) by ELISA Antibody titers were determined as described by de Koning et al (2015) with the minor modification that a 4-step dilution (40 160 640 2560 times diluted) of the sera was made instead of a 3-step dilution Rectal temperature at the 3 time points following the challenge and antibody titers at day 5 and 10 post-challenge were analysed by the proc MIXED procedure of SAS 93 (SAS 93 SAS Inst Inc Cary NC) with SC dietary protein level dietary AA-profile batch and their interactions as fixed effects Results The rectal temperature increased after a LPSRGG injection for all challenged pigs and was almost back to baseline at 65 h post challenge (Fig 64) This response in rectal temperature was similar to the response of pigs in a study of Clouard et al (2015) and shows a clear response on the LPS challenge for both treatments
Chapter 6
150
Measurement of energy and protein metabolism
Hoe meet je de kosten van energie en eiwit
Figure 64 Rectal temperature response of low (LSC) and high (HSC) sanitary condition pigs challenged with LPS and RGG P le 005
Figure 65 Antibody titers (type IgG and IgM) against keyhole limpet hymocyanin (KLH) rabbit gamma globulin (RGG) and lipopolysaccharide (LPS) in pigs measured at 5 and 10 days post iv challenge with LPS and RGG P le 005 + 005 lt P le 010 The open bars represent low sanitary condition pigs and the striped bars high sanitary condition pigs
00
05
10
15
20
0 1 2 3 4 5 6 7
Re
ctal
te
mp
era
ture
incr
eas
e
˚C
Time post challenge h
LSC
HSC
00
30
60
5 10
IgG
tit
er a
gain
st K
LH
days post challenge
00
30
60
90
5 10
IgM
tit
er a
gain
st K
LH
days post challenge
00
30
60
5 10
IgM
tit
er a
gain
st R
GG
days post challenge
00
30
60
90
5 10
IgM
tit
er a
gain
st L
PS
days post challenge
+
00
30
60
5 10
IgG
tit
er a
gain
st R
GG
days post challenge
00
30
60
5 10
IgG
tit
er a
gain
st L
PS
days post challenge
A B C
D E F
Chapter 6
151
TECHNIQUES TO MEAUSURE AMINO ACID AND ENERGY
METABOLISM
In several studies effects of sanitary conditions or acute immune stimulation on AA
metabolism were studied by using a titration method between pigs (Williams et al 1997
de Ridder et al 2012 Kim et al 2012 Kahindi et al 2014 Jayaraman et al 2015) or
within individual pigs (Kampman-van de Hoek et al 2013) In most of the studies using a
titration method between pigs different treatment groups with pigs were offered
treatment diets with a contrast in dietary AA concentration developed by supplementing
the AA in free form to a diet that is limiting in the AA of interest For example Kahindi et al
(2014) created a difference in lysine concentration in the treatment diets by addition of
increasing levels of free lysine to the diet in exchange for maize starch In a study of
Kampman-van de Hoek et al (2013) a within-animal titration approach was used in
individual meal-fed pigs The dietary Lys concentration was stepwise increased or
decreased with a step length of 3 days resulting in a minimum experimental time period of
21 days as 7 different Lys concentrations were evaluated The advantage of this titration
approach is that it results in the estimation of a requirement value for an individual animal
Nevertheless a minimum time period of 21 days was required in the study of Kampman-
van de Hoek (2013) and standardization of effects of ISS over a prolonged period of time
remains difficult particularly when housing the pigs on metabolism cages
Rectal temperature increase in relation to the rectal temperature before challenge did not differ between LSC and HSC pigs (P = 058) Latency time in the HAT did not differ between LSC pigs and HSC pigs (P = 019) Type IgG antibody titers against KLH RGG were higher in LSC pigs compared with HSC pigs (P le 005) at 5 days post challenge whereas LPS specific IgG titers although numerically higher were not significantly different between pigs of different sanitary conditions (Fig 65) In unchallenged pigs the KLH specific IgG titers were also higher for LSC pigs compared with HSC pigs (P le 005 Chapter 2) It might therefore be that the SC effect in IgG against KLH and maybe also against LPS and RGG in challenged pigs is due to the contrast in sanitary conditions rather than to the difference in response to the combined LPS and RGG challenge Unfortunately no blood sampling was done (to avoid stress due to blood sampling) before the LPS RGG challenge to distinguish between effects due to this challenge or SC effects Conclusion Low and high sanitary condition pigs do not respond differently to a HAT test and have very likely also no different rectal temperature or antibody response after a combined iv RGG and LPS challenge The effects found for antibody response are probably due to the SC effect rather than to the LPS RGG challenge effect
Chapter 6
152
In general the titration method is an easy and accurate method to quantify the effect of
sanitary conditions on the AA requirement of pigs Nevertheless by using the dose-
response method the focus is only on a single supplemented AA that is assumed to be
limiting
Using multiple AA in an alternative approach Kampman-van de Hoek et al (2016)
measured whole body fluxes of 9 essential AA simultaneously This flux referred to as the
irreversible loss rate from the plasma AA pool was measured in pigs assumed to be in a
steady state (ie hourly fed) following an iv bolus of a mixture of U-13C-labelled essential
AA after which the disappearance of 13C-labeled AA from the plasma pool was measured
for 60 min When assuming that the measurement is in physiological steady state
differences in ILR between treatments (sanitary conditions) and between individual AA are
assumed to reflect differences and changes in AA requirements and their metabolism
Unfortunately data on ILR of AA do not discriminate between use in oxidative metabolism
or protein synthesis (Kampman-van de Hoek et al 2016) In addition individual housing
and frequent blood sampling is required
The factorial method used in the experiments described in Chapter 2 and 4 was not meant
to determine quantitative AA requirements of the pigs but to determine whether the
requirements of LSC and HSC pigs were different The method used allowed to study the
effect of a diet with a basal AA profile compared with a supplemented AA profile containing
extra Met Thr and Trp in ratio to Lys compared with the basal diet in group housed pigs
By using this method it was possible to study the effect of supplementing more than one
AA at the same time In Chapter 2 the supplemented diet lead to greater ADG and GF ratio
than the basal diet in both LSC and HSC pigs The increase in GF was greater in LSC pigs
indicating that supplementing Met Thr and Trp were more beneficial for LSC pigs than HSC
pigs With the method used it is not possible to distinguish between the effects of the
individual AA supplemented so it remains unclear if one of the three AA or a combination
of AA was responsible for the observed effects Therefore results obtained with this
approach do not lead to knowledge on quantitative changes in requirements of the specific
AA but these results show whether requirements for the combination of the
supplemented AA were affected This method can therefore be very useful to determine if
there is a contrast in AA requirements for different groups of pigs To determine the exact
AA requirements the dose response approach might be useful
Methods to measure energy metabolism In Chapter 4 the effect of sanitary conditions on
energy metabolism was measured by indirect calorimetry By using this method the
exchange of O2 CO2 and CH4 per group of 6 pigs in climate respiration chambers was
measured in 6 minutes intervals as described by Heetkamp et al (2015) Heat production
per chamber was calculated from the measured consumed volumes of O2 produced
volumes of CO2 and CH4 This calculation was done by using an equation (Brouwer 1958)
with coefficients based on the stoichiometry of the complete oxidation of carbohydrates
Chapter 6
153
fat and protein The indirect calorimetry method is known to be an accurate method
however attention should be paid in situations where an animals is pushed with a diet
infusate or when using indirect calorimetry to estimate short term variation in heat
production (Gerrits et al 2015) as it is assumed that O2 and CO2 pools within the body do
not change within a measurement period The indirect calorimetry method has the
advantage that repeated measurements can be performed in group housed animals
Another method to measure energy metabolism in pigs is the slaughter technique (Kim et
al 2012) Despite that this technique is accurate and simple it is laborious and does not
allow repetitive measurements within one animal In a study of Kim et al (2012) the
slaughter technique was used to quantify the effects of immune system stimulation on AA
metabolism for an experimental period of 40 d When using the slaughter technique for
such a long experimental period this means that the contrast in sanitary conditions should
be standardized for at least 40 d It will be a challenge to create a standardized contrast in
extent of innate immune system activation over such a period Therefore the indirect
calorimetry method was preferred in Chapter 4 In the study described in this Chapter
fasting heat production (FHP) was measured as estimate for energy requirement for
maintenance This was done in pigs fasted over a period of 25 h To determine whether 25
h of fasting was enough to reach a plateau in resting metabolic rate (RMR) a part of the pigs
were fasted for a period of 32 h (Textbox 62) The results in this textbox indicate that the
RMR was not stable after 25 h of fasting yet however the conclusion that LSC pigs had
greater FHP compared with HSC pigs was the same for 25 h and 32 h fasted pigs From FHP
the energy requirement for maintenance (MEm) can be estimated by using the method of
Labussiegravere et al (2011) as illustrated in Textbox 63 The MEm was 7 greater for LSC pigs
compared with HSC pigs according to this method
Chapter 6
154
Textbox 62 Twenty-five vs thirty two hours measurement for determining fasting heat production in pigs
In Chapter 4 fasting heat production (FHP) was measured as the resting metabolic rate (RMR) until 25 h after the start of the fasting period in 24 groups with 6 pigs each In addition FHP of 16 of these groups was also measured until 32 h after initiation of fasting to determine whether 25 h of fasting was sufficient to reach a plateau in energy expenditure as measure for their RMR Materials and methods In a 2 times 2 factorial arrangement 16 groups of pigs housed in calorimetric chambers were allocated to either a low sanitary condition (LSC) or a high sanitary condition (HSC) and were offered either a diet with a basal AA profile (AA-B) or a diet with a supplemented AA profile (AA-S) as described in Chapter 4 At 12 weeks of age pigs were deprived from feed after the morning meal at 0730 am until 0330 pm the next day Gas exchange was measured in the calorimetric chambers in 6-min intervals by measuring exchange of O2 CO2 and CH4 as described by Heetkamp et al (2015) The FHP was measured as described in Chapter 4
Figure 66 Partitioned heat production of pigs kept under low (LSC) and high (HSC) sanitary conditions and fed a diet with (AA-S) or without (AA-B) extra AA A represents the total heat production B represents resting metabolic rate C represent heat related to physical activity The arrow indicates the moment of the last meal The grey area represents dark time and the white area light time The dotted area represents the measurement of energy expenditure after 25 h fasting Results are presented as least square mean plusmn SEM
Chapter 6
155
Results The RMR of the LSC pigs and the HSC pigs fed the AA-B diet was higher 25 h (LSC-AA-B 698 LSC-AA-S 743 HSC-AA-B690 kJBW-06d-1) than 32 h after the last meal (LSC-AA-B 668 LSC-AA-S 733 HSC-AA-B 648 kJBW-06d-1 Fig 66) The RMR of HSC pigs fed the AA-S diet did not differ using either a 25h or a 32 h period of feed deprivation
Figure 67 Respiration coefficient (RQ) and fat oxidation of pigs kept under low (LSC) and high (HSC) sanitary conditions and fed a diet with (AA-S) or without (AA-B) extra AA The arrow indicates the moment of the last meal The grey area represents dark time and the white area light time The dotted area represents the extra measurement after 25 hours of fasting Results are presented as least square mean plusmn SEM
These results indicate that RMR which is needed to estimate the energy was still decreasing after 25 h of fasting The respiration coefficient (RQ) was higher at 25 h (078 kJ kg -06 d-1) of fasting compared with 32 h (075 kJ kg -06 d-1) of fasting (Fig 67) indicating that fat oxidation still increased after 25 h of fasting Fat oxidation was lower at 25 h of fasting compared with 32 h of fasting probably partly due to higher physical activity after 32 h compared with 25 h of fasting (Fig 67) The FHP was still greater for LSC pigs compared with HSC pigs at 32 h after initiation of fasting (P le 005) as was found for 25 h after initiation of fasting (Chapter 4) Conclusion The length of the measurement period for estimating FHP influenced RMR RQ and fat oxidation A 32 h fasting measurement gave a lower RMR a lower RQ value and a higher fat oxidation than a period of 25 h of fasting
Chapter 6
156
Textbox 63 Energy requirements for maintenance for low and high sanitary condition pigs
Aim To estimate energy requirements for maintenance for low sanitary conditions (LSC) and high sanitary conditions (HSC) pigs by using data on fasting heat production (FHP) Materials and methods In a 2 times 2 factorial arrangement 24 groups of 6 pigs housed in calorimetric chambers were allocated to either a LSC or a HSC and were offered either a diet with a basal AA profile (AA-B) or a diet with a supplemented AA profile (AA-S) as described in Chapter 4 Heat production of these groups was calculated over an ad libitum and a restricted feeding period and fasting heat production was measured for the same groups (Chapter 4) Feed intake in ad libitum and restricted feeding periods was registered Metabolizable energy for maintenance (MEm) was calculated by using relationships between heat production (HP) or FHP and ME intake by adapting a method used by Labussiegravere et al (2011) A relationship between ME intake for the restricted and ad lib period was plotted (line A) and for the restricted and FHP and ad libitum and FHP two other lines were plotted (lines B Fig 68) The intercept between line A and the dashed line representing HP corrected for activity = ME gives the conventional MEm The MEm according to the method of Labussierre et al (2011) is represented by the intersection between lines B and HPcorrected = ME
Figure 68 Relationships between heat production corrected for activity (HPcorrected) fasting heat production (FHP) and ME intake for a restricted and ad libitum feeding period for calculating ME for maintenenance (MEm) This figure is based on data of a single experimental group of pigs
Results The MEm according to the conventional method was 808 kJ ∙ BW-06∙ d-1 for LSC and 617 kJ ∙ BW-06∙ d-1 for HSC (P = 013) This means on average an 30 higher MEm for LSC compared with HSC pigs according to this method which does not take feeding level into account MEm however is known to depend on feeding level The MEm calculated by using lines B varied from 885 to 930 kJ ∙ BW-06∙ d-1 for LSC pigs and from 818 to 875 kJ ∙ BW-06∙ d-1 for HSC pigs This means on average a 7 higher MEm for LSC compared with HSC pigs according to this method (P = 005) This estimate is preferred as the conventional method requires extrapolation too far outside the measured range Conclusion Consistent with the difference in FHP observed the MEm for LSC pigs was 7 higher than the MEm for HSC pigs
Chapter 6
157
NUTRIENT REQUIREMENTS OF LOW SANITARY CONDITION PIGS
To translate the findings of the studies in the present thesis to possible feeding strategies
under varying SC the main findings are summarized (Table 64) This summary of results
only focusses on data obtained in ad libitum fed pigs and excluded data of pigs fed low
protein diets (Chapter 2 and 3)
Table 64 Summary of parameters affected for ad libitum fed LSC compared with HSC pigs in Chapter 2 and 4
Itema Difference compared with HSC pigsb
ADFI -6
ADG -12
GF ratio -5
N-digestibility -6
Fasting heat production +8
Maintenance energy (Textbox 63) +7
Incremental efficiency nitrogen -20
Haptoglobin concentration serum +69
Ear biting behaviour +30 a ADFI = average daily feed intake ADG = average daily gain GF ratio = gain to feed ratio N = nitrogen FHP =
fasting heat production b Data are based on pigs fed ad libitum with adequate dietary crude protein level
Based on the summary of parameters affected by SC (Table 64) the impact of SC on
energy and AA requirements was estimated for a standard pig of 25 kg BW (Table 65)
Changes in energy requirements for maintenance N digestibility and incremental efficiency
of N for deposition in the body for a LSC compared with a HSC pig were taken into account
For this comparison differences in ADFI observed in Chapter 2 and 4 (75 and 110 gd
respectively) between LSC and HSC pigs are not taken into account and ADFI of LSC pigs
was set equal to the ADFI of HSC pigs A 10 weeks old HSC pig of 25 kg with an ADFI of
1256 g ∙ pig-1 ∙ d-1 was taken as reference The reference diet contained 1025 g Lyskg an
134 kJ of MEg diet and a dietary CP concentration of 165 gkg For the first 950 g of
ADFId nutrient digestibility efficiencies for protein and energy deposition in the body
observed for the restricted fed pigs were assumed (Chapter 4) and for the feed intake
above this level (ie 306 gd) the incremental energy and N efficiencies were assumed as
presented in Chapter 4 Other reference data were based on results presented in this
thesis
Chapter 6
158
Table 65 Calculation of the effects of low sanitary conditions (LSC) on Lys and ME requirements by using a high sanitary condition (HSC) pig of 25 kg BW as a reference
Item HSC LSC
Reference data BW1 kg 25 25
ADFI2 for ad libitum period gd 1256 1256
ADFI for restricted period gd 950 950
Dietary ME3 content kJg 134 134
Dietary CP4 content gkg 165 165
Dietary Lys5 content gkg 103 103
MEm6 kJBW06 847 908
ATTD7 coefficient for N8 080 075
Incremental ATTD coefficient for N 073 073
Feed needed for MEm gd 436 467
Feed left above maintenance gd 820 789
ME intake MJd 168 168
ATTD protein intake (ad lib) gd 166 156
ATTD protein intake (restricted) gd 125 118
Extra ATTD protein intake (ad lib - restricted) gd 37 37
Protein deposition for restricted intake gd 88 84
Incremental protein deposition (ad lib - restricted) gd 36 28
Total protein deposition in the body gd 124 111
Lys intake gd 129 129
ATTD Lys intake (ad lib) gd 101 96
Total Lys deposition gd 88 79
Incremental Lys deposition (ad lib - restricted) gd 26 20
LysME ratio and increased energy and Lys requirements for LSC pigs LysME ratio gMJ 076 076
Increased ME requirement to compensate for increased MEm MJd
042
Increased Lys requirement to compensate for reduced ATTD gd
045
Increased Lys requirement to compensate for reduced incremental efficiency gd
060
LysME ratio needed for total extra requirements g ATTD LysMJ
249 1BW = body weight 2 ADFI = average daily feed intake 3 ME = metabolizable energy 4 CP = crude protein 5 Lys = lysine 6 MEm = metabolizable energy for maintenance 7 ATTD = apparent total tract digestibility 8 N = nitrogen
Chapter 6
159
From these calculations it appeared that the LSC pig needed 042 extra MJ MEd to
compensate for increased MEm 045 g extra ATTD Lysd to compensate reduced total tract
N digestibility and 060 g extra ATTD Lysd to compensate for reduced incremental N
efficiency for LSC compared with HSC pigs Overall this means that the Lys ME ratio of the
extra feed required to maintain performance is 249 g ATTD LysMJ ME which is higher
than the ratio of the diet that was offered to the HSC pigs (076 g ATTD LysMJ ME) The
results described in the different Chapters in this thesis show that energy and AA
requirements are both increased for LSC compared with HSC pigs however this calculation
shows that the increase in AA requirement is proportionally more important than the
increase in energy requirement
The increase in energy for maintenance and the reduction of incremental protein efficiency
would have to be accounted for in increased requirement values of all AA per unit of
energy When expressing the total extra requirement for Lys (045 + 060 gd Table 65) as
a percentage of the ATTD Lys intake for HSC pigs a 10 increase in Lys would be needed to
compensate for reduced ATTD and reduced incremental N efficiency
Taking the reduction in ADFI that we observed in chapter 2 and 4 into account implies that
the increased energy and AA requirements for LSC pigs calculated should be concentrated
in a smaller quantity of feed For a reduction in ADFI of 6 (Table 64) this would mean that
the ME content of the diet would have to increase to 142 kJ of MEg diet without
considering the increased requirement for MEm as described in Table 65 The former
could be implemented in practical diet formulation by increasing the dietary fat content
This would only be feasible if the feed intake capacity of LSC pigs is not further reduced by
an increased dietary energy concentration Little is known about the background of satiety
regulation in LSC pigs but our observation that LSC pigs have increased feed refusals upon
a 30 feed restriction (Chapter 4) illustrate that LSC pigs tend to eat in smaller meals
When translating the results of these studies into practise it is an interesting debate
whether the decreased efficiency of nutrient utilization in LSC pigs should be reflected
either in the evaluation of feed ingredients or in altered nutrient requirements values As
the effects of SC on ATTD of nutrients appeared independent of the level of feeding it
would appear that effects on nutrient digestibility could be represented in lowering the
concentrations of SID AA in feed ingredients as compared to current values (CVB 2011
NRC 2012) It would require more information on the effects of LSC on nutrient
digestibility particularly considering low and high digestible feed ingredients
Regarding the low incremental efficiency of utilization of dietary protein in LSC pigs it is
questionable whether it is cost-effective to completely satisfy the increased AA
requirements As LSC pigs have a reduced incremental efficiency of dietary N for protein
retention in the body increases in dietary AA might lead to a relatively low increase in body
protein deposition It is known that the total efficiency of the use of protein for depositing
protein in pigs reduces when protein is fed in excess The reduced incremental efficiency
Chapter 6
160
found might be related to a lower maximal rate of protein deposition of LSC pigs compared
with HSC pigs a increased AA oxidation for LSC compared with HSC pigs or an imbalance in
AA In addition an excess of dietary protein in the gastro intestinal tract might lead to an
increase in fermentation of undigested protein and in risk for growth of intestinal
pathogens (Prohaacuteszka and Baron 1980 Nollet et al 1999)
In general the results presented in the chapters of the present thesis indicate that LSC and
HSC pigs have increased requirements for energy and AA In proportion the increase in AA
requirements seem more important than the increase in energy requirements for LSC pigs
The different requirements found for LSC and HSC pigs were especially present in early life
It might be beneficial to reduce nutrient digestibility values of feed ingredients for young
LSC pigs or to select highly digestible ingredients for diets of these pigs and to increase the
concentrations of AA in the diet for LSC pigs to a certain extent Results obtained in this
thesis help to understand the nutrient requirements of LSC compared with HSC pigs and
might be used for implementation in models predicting growth performance of pigs and for
targeted feeding strategies for LSC pigs To further implement the results obtained in LSC
and HSC pigs in more exact energy and AA recommendations for diet formulation in
practise additional studies are needed for validation
Chapter 6
161
CONCLUSIONS
In two large-scale experiments we studied the effect of a chronic low grade inflammation
by imposing low sanitary conditions on energy and AA metabolism in growing pigs The
results provide a scientific basis for developing targeted nutritional strategies for pigs kept
under various conditions In brief the following conclusions were drawn from this thesis
- Using low and high sanitary conditions to create a contrast in chronic low grade
immune stimulation as described in the present thesis leads to
o A 12 reduced body weight gain a 6 reduced ADFI and a 5 reduced
GF ratio in LSC compared with HSC pigs
o An increased occurrence of damaging behaviour for LSC compared with
HSC pigs
- The observed variation in pig performance and innate immune responses among
batches and between studies in the current thesis indicates the importance of
having more than a single batch in studies using our sanitary condition approach
- Extra dietary supplementation of Met Thr and Trp was beneficial for the growth
performance in HSC pigs and in particular for LSC pigs in the first study however
these effects were not observed in the second study
- Reduction of dietary protein increases the occurrence of damaging behaviours in
pigs
- The apparent total N digestibility of LSC pigs was 6 lower compared with HSC
pigs
- Based on measured rates of fasting heat production the energy requirement for
maintenance is estimated to be 7 greater in LSC than in HSC pigs
- The incremental efficiency for N intake retained as body protein was 53 for LSC
pigs and 73 for HSC pigs
Overall the results of this thesis indicate that both energy and AA requirements are greater
in LSC pigs compared with HSC pigs It is questionable however whether it is nutrient and
cost effective and biologically possible to satisfy these increased nutrient requirements in
LSC pigs as the incremental efficiency of N for retained protein is low and ADFI is reduced
for LSC pigs compared with HSC pigs The present thesis demonstrates that care should be
taken in reducing dietary protein concentrations to improve protein efficiency in pigs as it
incurs a risk to increased damaging behaviours particularly when pigs are kept under LSC
Chapter 6
162
REFERENCES
ARC 1981 The nutrient requirements of pigs Commonwealth agricultural bureaux London UK
Brouwer E 1958 One simple formulae for calculating the heat expenditure and the quantities of carbohydrate and fat oxidized in metabolism of men and animals from gaseous exchange (oxygen intake and carbon acid output) and urine-N Acta Physiolog Neerl 6 795-802
Campos P H E Merlot M Damon J Noblet and N Le Floch 2014 High ambient temperature alleviates the inflammatory response and growth depression in pigs challenged with Escherichia coli lipopolysaccharide Vet J 200 404-409
Carpintero R M Pintildeeiro M Andreacutes M Iturralde M A Alava P M H Heegaard J L Jobert F Madec and F Lampreave 2005 The concentration of apolipoprotein A-I decreases during experimentally induced acute-phase processes in pigs Infect Immun 73 3184-3187
CIGR Commision internationale de genie rural 1984 Report on working group on climatization of animal houses Craibstone Aberdeen UK
Clouard C A S Souza W J J Gerrits R Hovenier A Lammers and E J Bolhuis 2015 Maternal fish oil supplementation affects the social behavior brain FA profile and sickness response of piglets J Nutr 1452176-2184
Centraal Veevoeder Bureau (CVB) 2011 Chemical compositions and nutritional values of feed ingredients CVB Lelystad The Netherlands
Centraal Veevoeder Bureau (CVB) 2016 Tabellenboek Veevoeding Voedernormen varkens en voederwaarden voedermiddelen
voor varkens CVB Lelystad The Netherlands
de Ridder K C L Levesque J K Htoo and C F M de Lange 2012 Immune system stimulation reduces the efficiency of tryptophan utilization for body protein deposition in growing pigs J Anim Sci 90 3485-3491
Drummond J G S E Curtis J Simon and H W Norton 1980 Effects of aerial ammonia on growth and health of young pigs J Anim Sci 50 1085-1091
Edwards J F and D O Slauson 1983 Complete Freunds adjuvant-induced pneumonia in swine A model of interstitial lung disease J Comp Pathol 93 353-361
Gerrits W J J J J G C van den Borne and E Labussiegravere 2015 Deriving heat production from gaseous exchange validity of the approach In W J J Gerrits and E Labussiegravere editors Indirect calorimetry Techniques computations and applications Wageningen Academic Publishers Wageningen p 19-34
Greenberg R 2003 The role of neophobia and neophilia in the development of innovative behaviour of birds In M Simon and K N Laland editors Animal innovation Oxford University Press New York US p175-196
Groot Koerkamp P W G J H M Matz G H Uenk V R Plilips M R Holden R W Sneath J L Short R P P White J Hartung J Seedorf M Schroumlder K H Linkert S Pedersen H Takai J O Johnson and C M Wathes 1998 Concentrations and emissions of ammonia in livestock buildings in northern europe J Agric Engin Res 70 79-95
Heegaard P M H A Stockmarr M Pintildeeiro R Carpintero F Lampreave F M Campbell D P Eckersall M J M Toussaint E Gruys and S N Sorensen 2011 Optimal combinations of acute phase proteins for detecting infectious disease in pigs Vet Res 421-13
Heegaard P M H J Klausen J P Nielsen N Gonzaacutelez-Ramoumln M Pintildeeiro F Lampreave and M A Alava 1998 The Porcine Acute Phase response to infection with actinobacillus pleuropneumoniae haptoglobin C-reactive protein major acute phase protein and serum amyloid A protein are sensitive indicators of infection Comp Biochem Phys B 119 365-373
Heetkamp M J W S J J Alferink T Zandtra P Hendriks H van den Brand and W J J Gerrits 2015 Design of climate respiration chmabers adjustable to the metabolic mass of subjects In W J J Gerrits and E Labussiegravere editorsIndirect calorimetry Techniques computations and applications Wageningen Academic Publishers Wageningen p 35-56
Heim G T Sweeney C J OShea D N Doyle and J V ODoherty 2014 Effect of maternal supplementation with seaweed extracts on growth performance and aspects of gastrointestinal health of newly weaned piglets after challenge with enterotoxigenic Escherichia coli K88 Brit J Nutr 112 1955-1965
Jayaraman B J Htoo and C M Nyachoti 2015 Effects of dietary threoninelysine ratioes and sanitary conditions on performance plasma urea nitrogen plasma-free threonine and lysine of weaned pigs Anim Nutr 1 283-288
Jayaraman B J K Htoo and C M Nyachoti 2016 Effects of different dietary tryptophan lysine ratios and sanitary conditions on growth performance plasma urea nitrogen serum haptoglobin and ileal histomorphology of weaned pigs Anim Sci J
Jones J B A J F Webster and C M Wathes 1999 Trade-off between ammonia exposure and thermal comfort in pigs and the influence of social contact Anim Sci 68 387-398
Kahindi R J Htoo and C Nyachoti 2014 Short Communication Effect of dietary lysine content and sanitation conditions on performance of weaned pigs fed antibiotic-free diets Can J Anim Sci 94 115-118
Kampman-van de Hoek E W J J Gerrits J J G C van den Borne C M C van der Peet-Schwering H van Beers-Scheurs and A J M Jansman 2011 Selectie van een onderzoeksmodel voor het bestuderen van de invloed van immuunsysteem activatie op de aminozuurbehoefte van varkens WUR Livestock Research Lelystad The netherlands
Kampman-van de Hoek E W J J Gerrits C M C van der Peet-Schwering A J M Jansman and J J G C van den Borne 2013 A simple amino acid dosendashresponse method to quantify amino acid requirements of individual meal-fed pigs J Anim Sci 91 4788-4796
Chapter 6
163
Kampman-van de Hoek E A J M Jansman J J G C van den Borne C M C van der Peet-Schwering H van Beers-Schreur and W J J Gerrits 2016 Dietary amino acid deficiency reduces the utilization of amino acids for growth in growing pigs after a period of poor health J Nutr 146 51-58
Kampman-van de Hoek E P sakkas W J J Gerrits J J G C van den Borne C M C van der Peet-Schwering and A J M Jansman 2015 Induced lung inflammation and dietary protein supply affect nitrogen retention and amino acid metabolism in growing pigs Brit J Nutr 113 414-425
Kim J C B P Mullan B Frey H G Payne and J R Pluske 2012 Whole body protein deposition and plasma amino acid profiles in growing andor finishing pigs fed increasing levels of sulfur amino acids with and without Escherichia coli lipopolysaccharide challenge J Anim Sci 90 362-365
Labussiegravere E J van Milgen C F M de Lange and J Noblet 2011 Maintenance energy requirements of growing pigs and calves are influenced by feeding level J Nutr 141 1855-1861
Le Floch N C Jondreville J J Matte and B Seve 2006 Importance of sanitary environment for growth performance and plasma nutrient homeostasis during the post-weaning period in piglets Arch Anim Nutr 60 23-34
Le Flocrsquoh N L LeBellego J J Matte D Melchior and B Segraveve 2009 The effect of sanitary status degradation and dietary tryptophan content on growth rate and tryptophan metabolism in weaning pigs J Anim Sci 87 1686-1694
Le Flocrsquoh N D Melchior and B Segraveve 2008 Dietary tryptophan helps to preserve tryptophan homeostasis in pigs suffering from lung inflammation J Anim Sci 86 3473-3479
Lee C L R Giles W L Bryden J L Downing P C Owens A C Kirby and P C Wynn 2005 Performance and endocrine responses of group housed weaner pigs exposed to the air quality of a commercial environment Livest Prod Sci 93 255-262
Litvak N A Rakhshandeh J Htoo and C de Lange 2013 Immune system stimulation increases the optimal dietary methionine to methionine plus cysteine ratio in growing pigs J Anim Sci 91 4188-4196
Maes D H Deluyker M Verdonck F Castryck C Miry B Vrijens W Verbeke J Viaene and A de Kruif 1999 Effect of vaccination against Mycoplasma hyopneumoniae in pig herds with an all-inall-out production system Vaccine 17 1024-1034
Marquardt R R L Z Jin J W Kim L Fang A A Frohlich and S K Baidoo 2006 Passive protective effect of egg-yolk antibodies against enterotoxigenic Escherichia coli K88+ infection in neonatal and early-weaned piglets FEMS Immunol Med Microbio 23 283-288
McLamb B L A J Gibson E L Overman C Stahl and A J Moeser 2013 Early weaning stress in pigs impairs innate mucosal immune responses to enterotoxigenic E coli challenge and exacerbates intestinal injury and clinical disease PLOS ONE 8 e59838
Melchior D B Segraveve and N Le Flocrsquoh 2004 Chronic lung inflammation affects plasma amino acid concentrations in pigs J Anim Sci 82 1091-1099
Nollet H P Deprez E Van Driessche and E Muylle 1999 Protection of just weaned pigs against infection with F18+ Escherichia coli by non-immune plasma powder Vet Microbio 65 37-45
NRC 2012 Nutrient Requirements of Swine 11th ed Natl Acad Press Washington DC
Ochsenbein A F and R M Zinkernagel 2000 Natural antibodies and complement link innate and acquired immunity Immun Today 21 624-630
Pastorelli H N Le Floch E merlot M C Meunier-Salauumln J van Milgen and L Montagne 2012a Sanitary housing conditions
modify the performance and behavioural response of weaned pigs to feed- and housing-related stressors Anim 6
1811-1820
Pastorelli H J van Milgen P Lovatto and L Montagne 2012b Meta-analysis of feed intake and growth responses of growing
pigs after a sanitary challenge Anim 6 952-961
Prohaacuteszka L and F Baron 1980 The predisposing role of high dietary protein supplies in enteropathogenic E coli infections of weaned pigs Zentralblatt fuumlr Veterinaumlrmedizin Reihe B 27 222-232
Rakhshandeh A and C F M de Lange 2012 Evaluation of chronic immune system stimulation models in growing pigs Anim 6 305-310
Rakhshandeh A J K Htoo and C F M de Lange 2010 Immune system stimulation of growing pigs does not alter apparent ileal amino acid digestibility but reduces the ratio between whole body nitrogen and sulfur retention Livest Sci 134 21-23
Santioga Rostagno H L F Teixeira Albino J Lopes Donzele P Cezar Gomes R Flaacutevia de Oliveira D Clementino Lopes A Soares
Fereira S L de Toledo Barreto and R F Euclides 2011 Brazililian tables for poultry and swine Composition of
feedstuffs and nutritional requirements 3rd edition Universidade fedral de Viccedilosa Brazil
Skovgaard K S Mortensen M Boye K T Poulsen F M Campbell P D Eckersall P M H Heegaard 2009 Rapid and widely disseminated acute phase protein response after experimental bacterial infection of pigs Vet Res 40 23
Star L M G B Nieuwland B Kemp and H K Parmentier 2007 Effect of single or combined climatic and hygienic stress on natural and specific humoral immune competence in four layer lines Poult Sci 86 1894-1903
Thacker E L B J Thacker M Kuhn P A Hawkins and W R Waters 2000 Evaluation of local and systemic immune responses induced by intramuscular injection of a Mycoplasma hyopneumoniae bacterin to pigs Am J Vet Res 61 1384-1389
Urbain B P Gustin J Prouvost and M Ansay 1994 Quantitative assessment of aerial ammonia toxicity to the nasal mucosa by use of the nasal lavage method in pigs Am J Vet Res 55 1335-1340
Whittemore C T M J Hazzledine and W H Close 2003 Nutrient requirement standards for pigs BSAS Penicuik UK Wichterman K A A E Baue and I H Chaudry 1980 Sepsis and septic shockmdashA review of laboratory models and a proposal J
Surgl Res 29 189-201
Chapter 6
164
Williams N H T S Stahly and D R Zimmerman 1997 Effect of chronic immune system activation on the rate efficiency and composition of growth and lysine needs of pigs fed from 6 to 27 kg J Anim Sci 75 2463-2471
Williams P N C T Collier J A Carroll T H Welsh Jr and J C Laurenz 2009 Temporal pattern and effect of sex on lipopolysaccharide-induced stress hormone and cytokine response in pigs Dom Anim Endocrin 37 139-147
Wood-Gush D G M and K Vestergaard 1989 Exploratory behavior and the welfare of intensively kept animals J Agri Ethics 2 161-169
165
List of abbreviations
AA amino acids ADG average daily gain ADFI average daily feed intake AID apparent ileal digestibility APP acute phase proteins BW body weight CFA Complete Freundrsquos Adjuvant CP crude protein CRP C-reactive protein Cys cysteine DE digestible energy ECTS European Credit Transfer System ETEC E coli FHP fasting heat production GE gross energy GF gain to feed Hact physical activity related heat HP heat production HSC high sanitary condition Htot total heat production im intramuscular iv intravenous IL interleukin ILR irreversible loss rate ISS immune system stimulation KLH keyhole limpet hymocyanin LP low protein LPS lipopolysaccharide LSC low sanitary condition Lys lysine MCV mean cell volume ME metabolizable energy Met methionine N nitrogen Nab natural antibody NDF neutral detergent fibre NE net energy NP normal protein PCV2 porcine circovirus type 2 Pdmax maximal protein deposition Pig-MAP pig major acute-phase protein PTL platelets RBC red blood cells
166
PRRSV porcine reproductive and respiratory syndrome virus RMR resting metabolic rate SC sanitary conditions sc subcutaneous SEM standard error of the mean SID standardized ileal digestibility S suis Streptococcus suis TEF thermic effect of feeding Thr threonine Ti titanium TID true ileal digestibility TNF tumour necrosis factor TO turpentine oil Trp tryptophan WBC white blood cells
167
SUMMARY
It is economically and environmentally important to match the nutrient supply to the
nutrient requirements in pig production Until now the effects of different sanitary
conditions on energy and nutrient requirements are not implemented in recommendations
for nutrient composition of pig diets The current nutrient requirement data are based on
studies with pigs in experimental settings which can be regarded as rather optimal
Changes in nutrient requirements caused by differences in sanitary conditions are poorly
documented As in the pig production sector farm conditions are variable it is of major
importance to determine the effects of low sanitary conditions (LSC) on requirements for
amino acids and energy in growing pigs Pigs under LSC have an increased risk of clinical
and subclinical infections resulting in a chronic stimulation of their immune system
Immune system stimulation is known to influence energy and amino acid metabolism
However most studies in pigs evaluating the relationship between immune system
stimulation and nutrient requirements often use specific experimental challenge models
Whereas such models have the obvious advantage of reproducibility and allow mechanistic
insight in the effects of stimulating specific parts of the immune system these models
often induce clinical illness rather than subclinical infections Results obtained with such
models may therefore be difficult to translate to practical situations Therefore the
objective of the present thesis was to study the effect of low and high sanitary conditions
(HSC) on amino acids and energy metabolism in pigs Also interactions between the
immune system nutrient metabolism and damaging behaviour of pigs were considered in
this thesis
The experiment described in Chapter 2 was designed to study the effect of different dietary
crude protein levels and extra amino acid supplementation on the growth performance of
pigs kept under different sanitary conditions In a 2times2times2 factorial arrangement 68 groups
of 9 pigs were allocated to either LSC or HSC and were offered ad libitum access to two
different diets a normal crude protein concentration diet or a low crude protein
concentration diet each having either a basal dietary amino acid profile or supplemented
dietary amino acid profile containing 20 more methionine threonine and tryptophan
compared with the basal profile The pigs were followed from 10 weeks of age until
slaughter Haptoglobin concentrations in serum and IgG antibody titers against keyhole
limpet heamocyanin collected in the starter grower and finisher phases and pleuritis
scores at slaughter were greater for LSC pigs compared with HSC pigs illustrating that
sanitary conditions affected health conditions The average daily gain and gain to feed ratio
were greater for HSC pigs compared with LSC pigs A 20 increase in dietary
supplementation of methionine threonine and tryptophan relative to lysine increased gain
to feed ratio more in LSC than in HSC pigs The results therefore illustrated that dietary
168
requirements for methionine threonine and tryptophan were greater for LSC compared
with HSC pigs
In Chapter 3 the damaging behaviour of 576 pigs from the experiment in Chapter 2 was
evaluated At 15 18 and 24 weeks of age prevalence of tail and ear damage and of tail
and ear wounds was scored At 20 and 23 weeks of age frequencies of biting behaviour
and aggression were scored by behaviour sampling The prevalence of ear damage during
the finisher phase and the frequency of ear biting were increased in LSC compared with
HSC pigs The frequency of ear biting was increased in low protein fed pigs compared with
normal protein fed pigs The supplemented AA profile reduced ear biting only in LSC pigs
The prevalence of tail wounds was lower for pigs in LSC than for pigs in HSC in the grower
phase Regardless of dietary amino acid profile or sanitary status pigs fed low protein diets
showed more ear biting tail biting belly nosing other oral manipulation directed at pen
mates and aggression than pigs fed normal protein diets with no effect on ear or tail
damage In conclusion both LSC and a reduction of dietary protein increased the
occurrence of damaging behaviours in pigs and therefore may negatively impact pig
welfare
The experiment of Chapter 4 was designed to quantify the difference in energy
requirements for maintenance and in incremental efficiencies for deposition of dietary
energy and protein in the body of clinically healthy pigs kept under LSC or HSC fed a basal
diet either or not supplemented with additional methionine threonine and tryptophan
In a 2 times 2 factorial arrangement 24 groups of 6 pigs each were allocated to either a LSC or
HSC and were offered two different diets having either a basal or a dietary amino acid
profile supplemented with methionine threonine and tryptophan For each group of pigs
complete energy and nitrogen balances were determined during two consecutive weeks
during which feed was available ad libitum or at 70 of ad libitum Fasting heat production
was determined over a 25 h period of fasting after a period of restricted feeding Low
sanitary conditions increased fasting heat production from 696 to 750 kJ(kg BW06 d)
regardless of the dietary amino acid supplementation The incremental efficiency of
ingested nitrogen for retention in the body was reduced in LSC pigs from 73 to 53 but
incremental efficiencies of digestible energy intake for fat deposition in the body were
unaffected by the experimental treatments These findings showed that the effects of
continuous immune stimulation by introducing LSC was affecting energy and nutrient
efficiencies of pigs both at maintenance level and at a feeding level close to ad libitum
intake
In Chapter 5 diurnal patterns for heat production respiratory quotient and carbohydrate
and fat oxidation of the pigs studied in the experiment of Chapter 4 were evaluated to get
more insight in the mechanisms behind the effects found in Chapter 4 The LSC pigs had
reduced activity compared with HSC and a higher resting metabolic rate during the period
of restricted feeding especially during the light parts of the day Therefore the diurnal
energy expenditure pattern of LSC and HSC pigs can be considered as different Fat and
169
carbohydrate oxidation patterns were not different for LSC and HSC pigs indicating that
protein and fat deposition during the day was similar for LSC and HSC pigs
Overall the results of this thesis indicate that both energy and AA requirements are greater
in LSC pigs compared with HSC pigs It is questionable however whether it is nutrient and
cost effective and biologically possible to satisfy these increased nutrient requirements in
LSC pigs as the incremental efficiency of N for retained protein is low and ADFI is reduced
for LSC pigs compared with HSC pigs The present thesis demonstrates that care should be
taken in reducing dietary protein concentrations to improve protein efficiency in pigs as it
incurs a risk to increased damaging behaviours particularly when pigs are kept under LSC
171
Acknowledgements
172
Het is zover ik ben bij het dankwoord aangekomen De jaren promotieonderzoek zitten
erop een leerzame en leuke tijd met mooie resultaten Tijdens dit traject heb ik met
verschillende mensen mogen samenwerken en zonder hen was het niet gelukt dit boekje in
elkaar te knutselen
Allereerst wil ik mijn promotor Walter bedanken Walter ik heb het getroffen met jou als
begeleider Uitdagen om dieper te graven kun je als de beste ook wil ik je bedanken voor je
support je enthousiasme alle tijd die je erin hebt gestoken en je humor Sinds kort ben je
professor en dit is je gegund Het is een eer om je eerste PhD student te zijn waarvan je
promotor bent Ik heb overigens niet al je advies opgevolgd lsquoNutrition of dirty pigsrsquo leek
me niet zorsquon geschikte titel
Daarnaast wil ik mijn andere begeleiders Alfons en Aart bedanken Alfons bedankt voor je
hulp bij het creeumlren van het promotieproject je input en je oog voor detail Aart voor het
bediscussieumlren van immunologie kon ik bij jou terecht al weken deze discussies vaak af
naar onderwerpen over van alles en nog wat Bedankt voor je brede blik tijd en support
Naast officieumlle begeleiders had ik ook een aantal niet-officieumlle begeleiders Liesbeth ik was
niet direct overtuigd toen je voorstelde aanvullende gedragsmetingen mee te nemen in het
1e experiment Deze metingen hebben echter geleid tot een hoofdstuk met hele mooie
data Bedankt voor al je hulp en je enthousiasme
Bas Wouter Henk Martin Peter en Loek samen met Walter hebben we verschillende
meetings gehad in het begin van het promotie traject om het onderwerp op te zetten
Bedankt voor jullie input en jullie support toen het anders liep dan we voor ogen hadden
Uiteindelijk is het resultaat er niet minder om
Ik wil Feed4Foodure en BreedampFeed4Food bedanken voor de financiering van dit project
Ook wil ik de varkenshouders die betrokken waren in dit project bedanken voor hun
bijdrage Uiteraard ook De Heus en De Heus collegarsquos Martin Peter Wilfried Julius Mario
bedankt voor de mogelijkheid en de vrijheid die ik heb gekregen om dit promotie
onderzoek te mogen doen
Jane-Martine Saskia Michel Xuan-Huang Hans en Leon bedankt bij alle administratie en
analyses van de monsters op het lab Ger Fleur en Monique ook jullie wil ik hartelijk
danken voor jullie hulp met analyses van serum en bloed monsters
Dirk Pieter Ruud Piet Gerald en John bedankt voor jullie hulp bij het bloedtappen en de
dissecties Al het personeel van Carus bedankt voor de dierverzorging en in het bijzonder
wil ik Ries Andre en Rinie hiervoor bedanken Frank ook jij bedankt voor de dierverzorging
en hulp bij het experiment in Ravenstein Ik weet dat je nog regelmatig aan me denkt
vanwege de emmer resten in de mestput sorry daarvoor
173
Hans en Julius bedankt voor jullie hulp bij het maken van de proefvoeders Betty en Yvonne
bedankt voor al jullie hulp met van alles en nog wat jullie zijn toppers
Tamme Sven en Marcel bedankt voor alle techniek en hulp bij de cellen Het schoonmaken
van de cellen met huilende babyrsquos en codetaal door de portofoon zal ik niet snel vergeten
Gerjan Jedidiah Josselin Eva Thanos Linda Yang and Robin thank you for your interest
in this work and all your help during the experiments Robin leuk dat we alweer een tijdje
collegarsquos zijn Jackeline Irene en Maarten ook jullie bedankt voor jullie hulp in de stal
Many thanks to all PhD colleagues at ANU It was nice to meet you during work or other
activities like the ANU playback show dinners and parties In het bijzonder wil ik nog een
paar mensen noemen Allereerst Sonja en Myrthe leuk dat jullie mijn paranimfen willen
zijn Fijn dat ik bij jullie terecht kon voor vragen over de laatste promotie dingen Samen
met Lotte en Harma vormen jullie tjah hoe zal ik dat omschrijven een bijzonder groepje
Onze ontmoeting ging een beetje raar mijn naam zou volgens jullie niet bij me passenhellipik
heb het jullie vergeven en vind het vooral erg gezellig met jullie
Tetske en Sandra jullie zijn de trouwe rots in de branding wanneer je vastzit of raad nodig
hebt Tetske ik verbaas me soms hoe goed jij details onthoud volgens mij is je geheugen
oneindig Sandra bedankt voor je hulp wanneer ik een vraag had over wat dan ook
Binnenkort maar weer een etentje plannen
Sergio Pierre Sanne Kasper Marijke Bianca Rik Geronda thank you for being
lsquoneighboursrsquo in the PhD room and for the nice conversations we had I enjoyed your
company and wish you all a lot of success with finishing your PhD thesis andor your further
career Rik ook bedankt voor je slappe klets en Marijke bedankt dat je achter me stond
uhh ik bedoel zat de laatste weken
Joyce Fons Michel Emma Kevin Bas Robin we kennen elkaar al een tijdje bedankt voor
de afleiding en de vooral niet-serieuze dingen Anet Lotte Vera en Sabine bedankt voor
de gezellige etentjes en uitjes Al blijf ik jaarlijks toch een hele foute overslaan
Pap mam Pauline Danieumllle en Toine bedankt voor jullie support Pauline ook bedankt
voor het maken van het mooie plaatje op de kaft
Harmen je vond het niet nodig om genoemd te worden in dit boekje maar ik vind van wel
Jij bent mijn grootste afleiding geweest tijdens het harde werken en je hebt ook best wat
van mijn frustraties moeten aanhoren We gaan een mooie toekomst tegemoet
Yvonne
About the author
Curriculum vitae
List of publications
Training and supervision plan
176
Curriculum vitae
Yvonne van der Meer was born in lsquos-Hertogenbosch the Netherlands on the 4th of
November 1986 She graduated from secondary education in 2005 at drsquo Oultremontcollege
location Drunen the Netherlands Thereafter she studied Animal husbandry at HAS
University in lsquos-Hertogenbosch where she obtained her BSc In 2010 Yvonne started her
study Animal Sciences at Wageningen University and she obtained her MSc degree in 2012
Yvonne did her major thesis in Animal Nutrition studying the effects of dietary
chenodeoxycholic acid in weaned piglets She did her minor thesis in Adaptation Physiology
studying the influence of feeding artificial milk to young piglets In 2012 Yvonne started her
PhD at De Heus Animal Nutrition BV and the Animal Nutrition Group of Wageningen
University amp Research In her PhD she studied nutrition of pigs kept under low and high
sanitary conditions This research was part of Feed4Foodure and BreedampFeed4Food The
results of her PhD project are presented in this thesis After concluding her PhD Yvonne
will resume as a nutritionist at De Heus Animal Nutrition BV
177
List of publications
Peer reviewed scientific publications
van der Meer Y W J J Gerrits M van den Bosch J J Holst M Moreto W A Buurman and T A T G van Kempen 2012 Chenodeoxycholic acid reduces intestinal permeability in newly weaned piglets J Anim Sci 90 302-304
van der Meer Y A Lammers A J M Jansman M M J A Rijnen W H Hendriks and W
J J Gerrits 2016 Performance of pigs kept under different sanitary conditions affected by protein intake and amino acid supplementation J Anim Sci 94 4704-4719
van der Meer Y W J J Gerrits A J M Jansman B Kemp and J E Bolhuis 2017 A link
between damaging behaviour in pigs sanitary conditions and dietary protein and
amino acid supply Accepted in PLOS one
van der Meer Y A J M Jansman and W J J Gerrits Low sanitary conditions increase
maintenance energy expenditure and decrease incremental protein efficiency in
growing pigs To be submitted to Journal of Nutrition
van der Meer Y A J M Jansman A Lammers and W J J Gerrits Diurnal patterns of heat
production and oxidation of carbohydrate and fat in pigs kept under different
sanitary conditions To be submitted to Animal
Conference and symposia proceedings
van der Meer Y W J J Gerrits M van den Bosch J J Holst W Kulik and T A T G van
Kempen 2012 Chenodeoxycholic acid improves intestinal permeability in piglets
Proceedings of the 12th Digestive Physiology of Pigs 29 May - 1 June Keystone
Colorado
van der Meer Y W J J Gerrits M van den Bosch M Moretoacute W A Buurman and T A T
G van Kempen 2012 Comparison of three intestinal permeability methods
Proceedings of the 12th Digestive Physiology of Pigs 29 May - 1 June Keystone
Colorado
van der Meer Y A J M Jansman M M J A Rijnen W H Hendriks and W J J Gerrits
2015 Amino acid requirements of growing-fattening pigs affected by sanitary
status Proceedings of the WIAS Science Day 5 February 2015 Wageningen The
Netherlands
178
van der Meer Y A J M Jansman M M J A Rijnen W H Hendriks and W J J Gerrits W
2015 Amino acid requirements differ for fattening boars housed in low or high
sanitary conditions Proceedings of the 13th Digestive Physiology of Pigs 19-21
May 2015 Kliczkoacutew Poland
van der Meer Y W J J Gerrits A J M Jansman B Kemp and JE Bolhuis 2016 Tail and
ear biting behaviour in pigs affected by sanitary conditions dietary amino acid
profile and crude protein level Proceedings of the WIAS Science Day 4 February
2016 Wageningen The Netherlands
van der Meer Y W J J Gerrits B Kemp and J E Bolhuis 2016 Effects of dietary protein
and amino acid supply on damaging behaviours in pigs kept under diverging
sanitary conditions Proceedings of the 50th Congress of the International Society
for Applied Ethology 12-15th July 2016 Edinburgh United Kingdom
van der Meer Y W J J Gerrits A J M Jansman B Kemp and A Lammers 2016 Does a
reduction in dietary protein affect immune status of pigs kept under different
sanitary conditions Proceedings of the 5th International Symposium on Energy
and Protein Metabolism and Nutrition 12-15 September 2016 Krakow Poland
Other Publications
van der Meer Y W J J Gerrits and A J M Jansman 2015 Het effect van
aminozuuraanbod en -samenstelling van het voer op zooumltechnische prestaties van
beren gehuisvest onder verschillende sanitaire condities Vertrouwelijk rapport
445 Wageningen UR Livestock Research The Netherlands
179
Training and supervision plan1
Basic package (3 ECTS2)
WIAS Introduction course 2013
Course on philosophy of science andor ethics 2013
Scientific exposure (13 ECTS)
International conferences
ADSA-ASAS Joint Annual Meeting Indianapolis US 2013
13th Digestive Physiology of Pigs Kliczkoacutew Poland 2015
5th International Symposium on Energy and Protein Metabolism and Nutrition Krakow Poland
2016
Seminars and workshops
WIAS Science Day Wageningen the Netherlands 2013-2016
International Pig Meeting De Heus 2013-2016
14th GUT Day Symposium Leuven Belgium 2012
Animal Nutrition and Research forum 2013
Denkaday Voorthuizen the Netherlands 2013
Aspects of sow and piglets performance seminar Wageningen the Netherlands
2013
2013
WIAS Fiber seminar Wageningen the Netherlands 2014
WIAS Nutrition health and welfare of calves seminar Wageningen the Netherlands
2014
Schothorst Feed Research symposium Future dynamics in sustainable animal nutrition Nijkerk the Netherlands
2014
Nutrient requirements in relation to animal health symposium Wageningen the Netherlands
2014
Presentations
Amino acid requirements of growing-fattening pigs affected by sanitary status WIAS Science Day Wageningen the Netherlands poster presentation
2015
1 Completed in the fulfilment of the requirements for the education certificate of the
Graduate School Wageningen Institute of Animal Sciences (WIAS)
2 One ECTS equals a study load of 28 hours
180
Amino acid requirements differ for fattening boars housed in low or high sanitary conditions Digestive Physiology of Pigs Kliczkoacutew Poland oral presentation
2015
Tail and ear biting behaviour in pigs affected by sanitary conditions dietary amino acid profile and crude protein level WIAS Science Day Wageningen the Netherlands oral presentation poster presentation
2016
Amino acid requirements of growingfinishing pigs kept under different sanitary conditions Wageningen Academy Course Quality of protein in animal diets Wageningen the Netherlands oral presentation
2016
Does a reduction in dietary protein affect immune status of pigs kept under different sanitary conditions 5th International Symposium on Energy and Protein Metabolism and Nutrition Krakow Poland oral presentation
2016
In-depth studies (11 ECTS)
Varkensvoeding in de praktijk Wageningen Academy SterkselWageningen the Netherlands
2012
Applied molecular microbiology MSc course Wageningen the Netherlands
2012
Animal health and immunology discussion group Wageningen the Netherlands
2015
Quality of protein in animal diets Wageningen Academy the Netherlands
2015
Statistics for the life sciences 2016
Indirect calorimetry course University of Krakow Poland 2016
Professional skills support courses (4 ECTS)
Supervising MSc thesis work 2013
Techniques for writing and presenting a paper 2013
Scientific writing 2015
Last stretch of the PhD program 2016
Research skills Training (6 ECTS)
Preparing own PhD research proposal 2012
Didactic skill training (16 ECTS)
Supervising practicalrsquos
Supervision research master cluster 2014
Supervision practical Principles of Animal Nutrition 2015
181
Supervising theses
Supervising MSc thesis (8x) 2013-2017
Management skills training (2 ECTS)
WIAS science day committee member 2013
Education and training total 52 ECTS
Colophon
The research described in this thesis is part of Feed4Foodure and BreedampFeed4Food and
was financially supported by Feed4Foodure BreedampFeed4Food and De Heus Animal
Nutrition BV
Cover design and lay-out Pauline van der Meer and Yvonne van der Meer
Printed by Digiforce

Nutrition of pigs kept under low and high
sanitary conditions
Effects on amino acid and energy metabolism and
damaging behaviour
Yvonne van der Meer
Thesis committee
Promotor
Prof Dr W J J Gerrits
Personal chair at the Animal Nutrition Group
Wageningen University amp Research
Co-promotors
Dr A J M Jansman
Senior researcher Animal Nutrition
Wageningen University amp Research
Dr A Lammers
Researcher Adaptation Physiology Group
Wageningen University amp Research
Other members
Prof Dr J Keijer Wageningen University amp Research
Dr E Labussiegravere INRA Rennes France
Prof Dr CM Nyachoti University of Manitoba Canada
Prof Dr SA Edwards University of Newcastle United Kingdom
This research was conducted under the auspices of the Graduate School of Wageningen
Institute of Animal Science (WIAS)
Nutrition of pigs kept under low and high
sanitary conditions
Effects on amino acid and energy metabolism and
damaging behaviour
Yvonne van der Meer
Thesis
submitted in fulfilment of the requirements for the degree of doctor
at Wageningen University
by the authority of the Rector Magnificus
Prof Dr A P J Mol
in the presence of the
Thesis Committee appointed by the Academic Board
to be defended in public
on Friday 7 July 2017
at 4 pm in the Aula
Yvonne van der Meer
Nutrition of pigs kept under low and high sanitary conditions
Effects on amino acid and energy metabolism and damaging behaviour
182 pages
PhD thesis Wageningen University Wageningen the Netherlands (2017)
With references with summary in English
ISBN 978-94-6343-197-2
DOI httpdxdoiorg1018174413888
Table of contents
Chapter 1 General introduction 9 Chapter 2 Performance of pigs kept under different sanitary
conditions affected by protein intake and amino acid supplementation
25
Chapter 3 A link between damaging behaviour in pigs sanitary conditions and dietary protein and amino acid supply
57
Chapter 4 Low sanitary conditions increase maintenance energy expenditure and decrease incremental protein efficiency in growing pigs
85
Chapter 5 Diurnal patterns of heat production and oxidation of carbohydrate and fat in pigs kept under different sanitary conditions
111
Chapter 6 General discussion 131 List of abbreviations 165 Summary 167 Acknowledgements 171 About the author
Curriculum vitae List of publications Training and supervision plan
175
Colophon 182
Chapter 1
General introduction
Chapter 1
10
DIETARY REQUIREMENTS OF GROWING PIGS
Feed costs are a large proportion of the total costs for pig production It is therefore of
economic importance to match the dietary nutrient supply to the nutrient requirements of
a pig as closely as possible Recommendations for nutrient requirements of a pig are
presented using several nutrient and energy evaluation systems (ARC 1981 Whittemore et
al 2003 Santioga Rostagno et al 2011 NRC 2012 CVB 2016) Mostly a concept is used
that splits requirements for growing pigs in a part for maintenance and production (growth)
purposes The definition of maintenance is the level of feeding at which the requirements
for nutrients are just met to ensure the continuity of vital processes so that there is no net
gain or loss of nutrients in tissue and animal products (ARC 1981) Requirements for
maintenance and growth are both measured under experimental conditions
Protein requirements of growing pigs In practice the dietary protein level of growing pigs
typically decreases during the life of a pig when phase feeding is used This reduction in
dietary protein level follows the efficiency of a pig to use dietary protein for depositing
protein tissue in the body In Figure 11 is indicated how efficient the dietary protein is used
by the pig to deposit protein during its life This 3-dimensional representation by van
Milgen and Noblet (2003) illustrates that the efficiency of a growing pigs reduces when it
becomes more heavyaged and is also depending on the intake of metabolizable energy
(ME)
Figure 11 The response of protein deposition as a function of ME intake and body weight (BW) The connected
points indicate the feed intake capacity (ad libitum intake) of a Large white barrow and corresponding protein
deposition Mem = ME intake for maintenance Source van Milgen and Noblet (2003)
Chapter 1
11
Requirement values for dietary protein do not exist in the evaluation systems Instead
recommendations for dietary amino acid (AA) intake are published (NRC 2012 CVB 2016)
These AA requirements are determined in pig experiments that use a titration set up or are
calculated from experiments with a factorial approach In titration studies typically the
response in performance of pigs to a stepwise increasing or decreasing dietary dose of AA
is evaluated using different treatment groups or within the same individual pig in time For
studies with a factorial approach nutrient requirements for maintenance and protein
deposition in the body can be calculated by using data obtained in pig experiments
The ileal digestibility of AA is measured in AA requirement studies to evaluate the bio-
availability of AA for the pig There are different expressions for Ileal digestibility namely
apparent true and standardized ileal digestibility (AID TID and SID respectively) The
expression used is depending on which proportion of AA outflow is used in the digestibility
calculation (Stein et al 2007) The AID is calculated by subtracting the AA inflow by the
total AA outflow including endogenous losses The endogenous losses can be split into
basal (not influenced by feed ingredient composition) and specific (influenced by ingredient
composition) endogenous losses Correcting for total endogenous losses results in the TID
and correcting digestibility for basal endogenous losses only results in the SID (Stein et al
2007)
The AA and nitrogen (N) requirements for maintenance were described by Moughan (2003)
as requirements for turnover of body protein skin and hair AA losses basal endogenous
intestinal AA losses synthesis of non-protein N-containing compounds and urinary AA
losses The first three processes are considered to be quantitatively important for
requirements for maintenance The AA composition of the whole body protein can be used
as the basis for an ideal AA profile for protein deposition as was suggested by Whittemore
(1983) Several pig growth models have been developed which simulate the AA uptake
metabolism and nutrient partitioning for growing pigs (Whittemore and Fawcett 1974
Moughan 1981 Whittemore 1983) To estimate the biological maximal rate of body
protein retention (Pdmax) net rates of body protein retention are determined under
optimal dietary and environmental conditions (Moughan 2003) Under practical farming
conditions which can be less optimal this Pdmax is not that commonly reached due to
factors such as subclinical disease thermal environment and social conditions (Burrin et
al 2001)
Energy requirements of growing pigs The energy that is ingested by an animal as feed is
deposited as fat or protein excreted in faeces and urine or dissipated as heat The
dissipation of heat by a pig might represent more than 50 of the ingested energy (van
Milgen and Noblet 2000) which can be seen as the major part of inefficiency It is
therefore of major importance to better understand and quantify the energy requirements
of pigs Quantification of heat production helps to better understand the daily energy
Chapter 1
12
balance of an animal The dissipation of heat or the heat production of a pig can be
measured by indirect calorimetry When nutrients are oxidized O2 is consumed and CO2
produced Heat production can be calculated from the combination of O2 consumption CO2
production (and urinary N and CH4 production) according to Brouwer (1965) These
components can be measured by placing the animals in respiration chambers were the gas
exchanges can be measured and used for calculation of heat production The total heat
production of an animal can be split in heat production due to physical activity thermic
effect of feeding (TEF) and fasting heat production
production (Figure 12) The TEF can be split in a short and a long TEF The short TEF is the
heat production associated with a meal related to nutrient digestion and absorption (van
Milgen et al 1998 van Milgen and Noblet 2000) and the long TEF is the heat production
due to ldquolong-termrdquo metabolic processes including protein and lipid synthesis (van Milgen
et al 1998 van Milgen and Noblet 2000) The fasting heat production (FHP) also called
lsquobasalrsquo metabolism is defined as the rate of energy expenditure of a non-reproductive
healthy fasting and a resting adult in thermo-neutral zone in an inactive phase of the day
(McNab 1997 Labussiegravere et al 2008) The FHP is used as a proxy for energy requirement
for maintenance Overall it remains difficult to measure FHP in growing animals
Figure 12 Heat production of a group of restricted fed growing pigs partitioned in different components of heat Feed was offered in two different meals at 730 and 1530 TEF = thermic effect of feeding Based on own data
There is already a lot of knowledge about the requirements for AA and energy in growing
pigs This information is based on pig experiments were pigs are kept under experimental
conditions for the mentioned measurements which means a clean environment low
animal density and high attention of caretakers These experimental conditions can
therefore be considered as optimal conditions for a pig There is not much known
however about nutrient requirements of pigs kept in suboptimal conditions In practice
0
500
1000
1500
2000
2500
20
0
40
0
60
0
08
00
10
00
12
00
14
00
16
00
18
00
20
00
22
00
He
at p
rod
uct
ion
(kJ
B
W -
06
d
-1)
Time (h)
physical activity
short term TEF
long term TEF
fasting heat production
Chapter 1
13
the environmental and management conditions are not always optimal There is a large
variation in pig performance on growing-finishing pig farms (Figure 13) The range in
average daily gain (ADG) of 654 growing-finishing pig farms in the Netherlands was 630
until 1050 g ∙ pig-1 ∙ day-1 A part of this variation might be affected by the health status
conditions (Textbox 11) of the farm (van der Peet-Schwering and Jansman 2007 Pastorelli
et al 2012a) It is therefore of major importance to determine the effect of sub-optimal
conditions on AA and energy requirements in growing pigs
IMMUNE SYSTEM STIMULATION AND THE EFFECT ON NUTRIENT
REQUIREMENTS
Pigs housed in sub-optimal conditions have an increased frequency of exposure to antigens
resulting in a stimulation of their immune system Immune system stimulation (ISS) in
general leads to a series of responses in the body such as production of cytokines acute
phase proteins (APP) blood cells fever increased muscle protein catabolism alterations in
sleep patterns and reduction in feed intake (Heegaard et al 2011)
Immune system stimulation by challenge studies Several challenge studies have been
performed to evaluate the effects of clinical immune system stimulation on nutrient
metabolism An overview of several acute challenge studies in pigs in this context is shown
in Table 11 These acute challenge models are often used to stimulate the immune system
or to mimic an infection in a specific part of the body A model using E coli results for
instance in intestinal inflammation whereas a challenge with Complete Freundrsquos Adjuvant
is leading to chronic lung inflammation As a consequence these ISS models have very
different effects in the animal and the challenge should therefore be chosen carefully
based on the objective of the study
Reduction in feed intake Reasons for a reduction in feed intake during ISS are not
completely understood Some studies describe an effect of cytokines (produced as a
consequence of immune stimulation) on the nervous system causing a reducing effect on
feed intake (Johnson 1997 Langhans 2000) Langhans (2000) reported that anorexia and
consequent behavioural changes during infections have several beneficial short term
effects for the mammal host Suppression of hunger results in saved energy and reduced
heat loss as the need for searching food is reduced In addition lower nutrient intake leads
to less nutrients available for the growth of pathogens involved in clinical or subclinical
disease Although reduced feed intake in response to ISS seems beneficial for an animal in
the short term chronic anorexia can delay recovery and inhibits host defence (Langhans
2000) Sandberg et al (2006) described that the origin and level of infection affect the rate
and duration of the reduced feed intake The length of the recovery phase after infection
Chapter 1
14
Figure 13 The average daily gain (ADG) of 654 growing-finishing pigs farms in The Netherlands from July 2015-June 2016 having pigs in a weight range of 25 ndash 119 kg Each grey bar represents 20 of the farms and the bars are categorised at ADG level The line bars represent the minima and maxima for each category Whit permission of Agrovision (2016)
can be influenced by diet composition (Sandberg et al 2006) Causal relationships between
the composition of the diet and the rate of feed intake recovery after ISS are however not
clearly described
Immune stimulation and AA requirements Studies carried out over the past years in pigs
already showed that the requirement of tryptophan (Trp) (Melchior et al 2004 Le Flocrsquoh
et al 2008 Le Floch et al 2012) methionine (Met) + cysteine (Rakhshandeh et al 2010)
and threonine (Thr) (Li et al 2007 Ren et al 2014) were increased in case of ISS by acute
challenge models (Table 11) Increased muscle protein metabolism and increased
production of several immune related metabolites such as APP (Murata et al 2004
Heegaard et al 2011) during ISS result in a redirection of protein or AA from development
and tissue growth to immune related tissues in the body (Le Flocrsquoh et al 2009) thereby
negatively influencing pig performance (Klasing and Johnstone 1991 Pastorelli et al
2012a) Besides the costs of AA as substrate for several immune related proteins in the pig
associated costs such as increased cell turnover for tissue repair and influence on
metabolism due to effects of ISS on hormonal regulations might be even higher in case of
ISS Amino acids can also have a modulating effect on the immune system Arginine for
example was described in a study of Bruins et al (2002) to upregulate the immune system
while catabolism of glutamine seems to provide precursors for DNA and RNA synthesis of
immune cells (Le Floch et al 2004) These interactions between AA (metabolites) and the
immune system are hitherto not fully understood Although involvement of particular AA in
the immune system is proven many of these studies do not allow a conclusion whether or
500
600
700
800
900
1000
1100
0-20 20-40 40-60 60-80 80-100
AD
G (g
∙p
ig -1
∙ day
-1)
Percentage of pig farms
Chapter 1
15
not supplying additional quantities of the AA concerned is actually beneficial for the animal
The former hampers practical application of this research
TEXTBOX 11 DEFENITIONS HEALTH STATUS AND SANITARY
CONDITIONS
To characterize the health of an animal two definitions are commonly used The first
one ldquoThe absence of disease determined by clinical examinations combined with
various diagnostic testsrdquo (Petersen et al 2004 CVB 2016) The second one is more
precise and is used by the World Health Organisation ldquoA state of complete physical
mental and social well-being and not merely the absence of disease or infirmityrdquo (ARC
1981 Santioga Rostagno et al 2011 WHO 2017)
Measurement of immune system activity alone is therefore not sufficient to evaluate
animal health Behavioural measurements to judge the animals mental and social well-
being (Ullman-Cullere and Charmaine 1999) should be included as well
The definition health status is commonly used to characterize a herd of animals Health
status refers to the presence or the absence of infectious pathogens regardless
whether animals are clinically healthy or not Hence a low health status herd can be
clinically healthy and productive To avoid this apparent contradiction the term
sanitary conditions is used throughout this thesis instead of health status The term
sanitary conditions is chosen to cover a combination of factors affecting health of the
pigs The word sanitary directly links to hygiene level but can also cover other factors
affecting health such as application of vaccinations medication management
housing and animal density
Table 11 Overview of different acute challenges to stimulate the immune system in pigs in relation with nutrition
Immune challenge Administration Effect Reference
Lipopolysaccharide LPS repeated intramuscular injection increase in acute phase proteins fever Rakhshandeh et al (2010) de Ridder et al (2012) Kim et al (2012) Litvak et al (2013) Campos et al (2014)
Complete Freundrsquos adjuvant CFA a mineral oil containing killed M tuberculosis
intravenous injection lung inflammation pneumonia increase in acute phase proteins fever
Melchior et al (2004) Le Flocrsquoh et al (2008) Kampman-van de Hoek et al (2015)
E coli oral administration diarrhoea intestinal infection fever Marquardt et al (2006) McLamb et al (2013)
Turpetine oil subcutaneous injection increase in acute phase proteins fever Carpintero et al(2005) Heegaard et al (2011) Kampman-van de Hoek et al (2013)
A pleuropneumoniae voluntary inhalation of aerosol or intranasal administration
lung inflammation pneumonia fever
Heegaard et al (1998) Heegaard et al (2011) Skovgaard et al (2009)
Chapter 1
17
Immune stimulation and energy requirements Apart from the effect of ISS on AA
metabolism energy metabolism is also found to be influenced during ISS (Benson et al
1993 Humphrey and Klasing 2004) Processes like fever and APP production in response to
ISS consume energy (Lochmiller and Deerenberg 2000 Parmentier et al 2002) Immune
challenge studies often result in reduced ADG for ISS treatment groups compared with
control groups which cannot be completely explained by the related decreased average
daily feed intake (ADFI) as reported in a meta-analysis by Pastorelli et al (2012b)
Depending on the nature of the challenge a substantial portion of the decrease in ADG is
caused by changes in the energetic efficiency in these animals (Pastorelli et al 2012b) A
lower energetic efficiency might show that the animal has an increased energy requirement
in the case of ISS (Williams et al 1997 Le Floch et al 2006) The change in energy
efficiency during ISS might be due to an increased energy expenditure for the immune
system reflected in an increase in the FHP Alternatively ISS may reduce the maximum rate
of protein deposition or change the priority of the animal for depositing protein and fat in
the body For example Parmentier et al (2002) found an increased fat deposition in
broilers repeatedly challenged with lipopolysaccharide (LPS)
Acute challenge studies versus a method mimicking on farm situations Most evidence for
increased AA requirements is obtained in studies in which pigs were repeatedly challenged
with LPS (eg Kim et al 2012 de Ridder et al 2012 Rakhshandeh et al 2010 Table 11)
Complete Freundrsquos Adjuvant (Le Flocrsquoh et al 2008 Kampman-van de Hoek et al 2015) or
turpentine oil (Kampman-van de Hoek et al 2013) and it can be questioned to what
extent these results can be extrapolated to pigs in commercial conditions (Pastorelli et al
2012b) Instead studies with a more practical approach mimicking farm situations are
needed to quantify the nutrient costs of suboptimal conditions This approach should not
focus on acute challenges and clinical infections but on factors that are encountered on
farms in practice and influence the immune system of the pig without inducing severe
clinical signs of disease or mortality The needed model might for instance create a low-
grade contrast in immune system stimulation by exposing pigs to different hygiene levels
medication ventilation and animal density Use of such a model has the advantage that
translation of the results to a farm situation is more easy than for a model with clinical
infection It might be a challenge though to maintain a similar standardized effect of the
factors in the model on the pigs
REDUCTION IN DIETARY PROTEIN A RISK FOR PIG PRODUCTION
Due to environmental issues and a growing world population there is a renewed focus to
increase efficiency of livestock farming In pig nutrition reduction of the dietary crude
protein (CP) level can contribute to this goal as generally protein intake is inversely related
to protein efficiency (Batterham et al 1990)
Chapter 1
18
It is generally perceived that dietary deficiencies due to this CP reduction can be
compensated for by supplementing essential AA to the diet thus restoring normal growth
at lower N intake (Kerr and Easter 1995 Gloaguen et al 2014) However the ideal dietary
AA profile differs depending on animal and environmental conditions which can change
the optimal AA profile (Le Floch et al 2004) Suboptimal conditions may be an increasing
challenge for future pig production due to the restricted use of antibiotics in food animals
(Cogliani et al 2011)
Risk for behavioural problems A reduction in dietary protein supply for pigs housed under
suboptimal conditions may increase the risk on behavioural problems It is known from
literature that dietary AA deficiencies increase the risk of tail- and ear biting outbreaks
(Jericho and Church 1972 Taylor et al 2010) Therefore considering the large variation in
conditions on todayrsquos pig farms the challenge for an increasing protein efficiency on farms
coincides with a lack of understanding of the dietary optimal AA profile and optimal dietary
protein-energy ratio of pigs on these farms which may aggravate behavioural problems
Behavioural characteristics are considered to be important indicators of animal health Tail
biting behaviour constitutes a large economical and welfare problem in the pig industry
(Schroslashder-Petersen and Simonsen 2001 Moinard et al 2003) The level of disease has
already been identified as one of the multifactorial reasons influencing this behaviour
(Schroslashder-Petersen and Simonsen 2001 Taylor et al 2010) Respiratory disease and tail
biting for example seem to have an association with each other as found by Kritas and
Morrison (2007) and Moinard et al (2003) The background of the relationship between
healthdisease and biting behaviour is not completely understood This relation might be
influenced by the effect of ISS and the consequential change of nutrient requirements in
the body If some nutrients are limiting for pig performance or immune functioning pigs
might further increase their rooting behaviour to satisfy their nutritional needs As biting
behaviour is considered to be redirected rooting behaviour consequently there can be an
increased risk for biting behaviour in case of immune stimulation (Taylor et al 2010)
Serotonin might play a key role in the effect of dietary nutrient deficiencies and ISS on
biting behaviour Serotonin is a neurotransmitter synthesised from Trp and is known to
influence pig behaviour (Le Floch and Seve 2007) Trp is one of the essential AA that might
become limiting in case of ISS (Le Flocrsquoh et al 2009) and can therefore indirectly
influence pig behaviour Aggressive behaviour and stress have been shown to be related to
the concentration of dietary Trp and brain serotonin in several animal and human studies
(Gibbons et al 1979 Chamberlain et al 1987 Salomon et al 1994 Winberg et al 2001
Lepage et al 2002) It is very likely that Trp and serotonin play also a role in biting
behaviour however a direct link between optimal or suboptimal health conditions dietary
Trp serotonin and biting behaviour has not yet been demonstrated Ursinus et al (2014)
recently found that pigs that perform tail biting behaviour had lowered blood serotonin
Chapter 1
19
levels This can be due to the direct effect of serotonin on tail biting however it can also be
an indirect effect due to lowered AA level or lowered health status Additionally a reduced
growth in case of low sanitary conditions can have a direct effect on biting behaviour Low
growth rate due to poor health often results in a larger variation in size of animals within
the same pen influencing biting behaviour negatively (Taylor et al 2010)
Overall striving for a reduction in dietary protein content may increase the risk on health
performance and behavioural problems particularly so in pigs housed under low sanitary
conditions
In summary AA metabolism and energy metabolism is altered in case of ISS As the
frequency of ISS is related to the sanitary conditions of the pig altered protein and energy
metabolism results in altered nutrient requirements of these pigs when housed in optimal
or suboptimal situations Interactions between AA and energy metabolism the immune
system and dietary AA and energy supply are not fully understood and require further
research Future feeding strategies taking into account sanitary conditions of the farm
might help to make pig production more efficient specifically when striving for a reduction
in dietary protein content and zero use of antibiotics Development of such feeding
strategies is only possible when nutritional needs affected by sanitary status are quantified
and the interactions between health performance behaviour and sanitary conditions are
better understood
Figure 14 Schematic overview of the outline of this thesis The light grey area represents a pig The small squares represent pools or events The arrows having a symbol represent effects The question marks indicate likely effects The arrows without symbols represent fluxes
Chapter 1
20
OBJECTIVES AND OUTLINES
The objective of the research in this thesis was to study the effects of low and high sanitary
conditions on AA and energy metabolism in pigs Also interactions between the immune
system metabolism and damaging behaviour were taken into account in this thesis The
relationships between low sanitary conditions the immune system AA and energy pool
feed intake protein and fat deposition and damaging behaviour are shown in a schematic
overview in Figure 14
In Chapter 2 an experiment is described revealing the effects of dietary protein level and
dietary AA supplementation on the growth performance of pigs kept under different
sanitary conditions In Chapter 3 the effects of dietary protein level in combination with
dietary AA supplementation on the damage behaviour of pigs kept under different sanitary
conditions are evaluated Chapter 4 describes the effects of different sanitary conditions
on the energy requirement for maintenance and on the incremental efficiencies for
retention of dietary energy and protein in the body in the pig In Chapter 5 diurnal patterns
of heat production and carbohydrate and fat oxidation of pigs kept under different sanitary
conditions are presented Chapter 6 includes a general discussion with emphasis on
different experimental models and methodologies used for immune stimulation studies
and measurement of AA and energy metabolism At the end of this general discussion the
implications of the results found in this thesis for current feed industry are provided
Finally general conclusions are presented
Chapter 1
21
REFERENCES
AgroVision 2016 Kengetallenspiegel juli 2015 - juni 2016 Agrovision BV The Netherlands
ARC 1981 The nutrient requirements of pigs Commonwealth agricultural bureaux LondonUK
Batterham E L Andersen D Baigent and E White 1990 Utilization of ileal digestible amino acids by growing pigs effect of
dietary lysine concentration on efficiency of lysine retention Br J Nutr 64 81-94
Benson B N C C Calvert E Roura and K C Klasing 1993 Dietary energy source and density modulate the expression of
immunologic stress in chicks J Nutr 123 1714-1723
Bruins M J P B Soeters W H Lamers A J Meijer and N E Deutz 2002 l-Arginine supplementation in hyperdynamic
endotoxemic pigs Effect on nitric oxide synthesis by the different organs Crit Care Med 30 508-517
Burrin D B Stoll J van Goudoever and P Reeds 2001 Nutrient requirements for intestinal growth and metabolism in the
developing pig In J E Lindberg and B Ogle editors Digestive physiology of pigs Proceedings of the 8th symposium
Swedish University of agricultural science Uppsala Sweden p 75-88
Campos P H E Merlot M Damon J Noblet and N Le Floch 2014 High ambient temperature alleviates the inflammatory
response and growth depression in pigs challenged with Escherichia coli lipopolysaccharide Vet J 200 404-409
Carpintero R M Pintildeeiro M Andreacutes M Iturralde M A Alava P M H Heegaard J L Jobert F Madec and F Lampreave 2005
The concentration of apolipoprotein A-I decreases during experimentally induced acute-phase processes in pigs
Infect Immun 73 3184-3187
Chamberlain B F R Ervin R O Pihl and S N Young 1987 The effect of raising or lowering tryptophan levels on aggression in
vervet monkeys Pharmacol Biochem Be 28 503-510
Cogliani C H Goossens and C Greko 2011 Restricting antimicrobial use in food animals lessons from Europe Microbe 6 274
Centraal Veevoeder Bureau (CVB) 2016 Tabellenboek Veevoeding Voedernormen varkens en voederwaarden voedermiddelen
voor varkens CVB Lelystad The Netherlands
de Ridder K C L Levesque J K Htoo and C F M de Lange 2012 Immune system stimulation reduces the efficiency of
tryptophan utilization for body protein deposition in growing pigs J Anim Sci 90 3485-3491
Gibbons J L G A Barr W H Bridger and S F Liebowitz 1979 Manipulations of dietary tryptophan Effects on mouse killing and
brain serotonin in the rat Brain Res 169 139-153
Gloaguen M N Le Flocrsquoh E Corrent Y Primot and J van Milgen 2014 The use of free amino acids allows formulating very low
crude protein diets for piglets J Anim Sci 92 637-644
Heegaard P M H A Stockmarr M Pintildeeiro R Carpintero F Lampreave F M Campbell D P Eckersall M J M Toussaint E
Gruys and S N Sorensen 2011 Optimal combinations of acute phase proteins for detecting infectious disease in
pigs Vet Res 42 1-13
Heegaard P M H J Klausen J P Nielsen N Gonzaacutelez-Ramoumln M Pintildeeiro F Lampreave and M A Alava 1998 The Porcine
Acute Phase response to infection with actinobacillus pleuropneumoniae haptoglobin C-reactive protein major
acute phase protein and serum amyloid A protein are sensitive indicators of infection Comp Biochem Phys B 119
365-373
Humphrey B D and K C Klasing 2004 Modulation of nutrient metabolism and homeostasis by the immune system World Poult
Sci J 60 90-100
Jayaraman B J Htoo and C M Nyachoti 2015 Effects of dietary threoninelysine ratioes and sanitary conditions on
performance plasma urea nitrogen plasma-free threonine and lysine of weaned pigs Anim Nutr 1 283-288
Jericho K and T Church 1972 Cannibalism in pigs Can Vet J 13 156
Johnson R W 1997 Inhibition of growth by pro-inflammatory cytokines an integrated view J Anim Sci 75 1244-1255
Kampman-van de Hoek E W J J Gerrits C M C van der Peet-Schwering A J M Jansman and J J G C van den Borne 2013 A
simple amino acid dosendashresponse method to quantify amino acid requirements of individual meal-fed pigs J Anim Sci
91 4788-4796
Kampman-van de Hoek E P sakkas W J J Gerrits J J G C van den Borne C M C van der Peet-Schwering and A J M
Jansman 2015 Induced lung inflammation and dietary protein supply affect nitrogen retention and amino acid
metabolism in growing pigs Brit J Nutr 113 414-425
Kerr B J and R A Easter 1995 Effect of feeding reduced protein amino acid-supplemented diets on nitrogen and energy
balance in grower pigs J Anim Sci 73 3000-3008
Kim J C B P Mullan B Frey H G Payne and J R Pluske 2012 Whole body protein deposition and plasma amino acid profiles
in growing andor finishing pigs fed increasing levels of sulfur amino acids with and without Escherichia coli
lipopolysaccharide challenge J Anim Sci 90 362-365
Klasing K C and B J Johnstone 1991 Monokines in Growth and Development Poult Sci 70 1781-1789
Chapter 1
22
Kritas S M and R B Morrison 2007 Relationships between tail biting in pigs and disease lesions and condemnations at
slaughter Vet Rec 160
Labussiegravere E S Dubois J van Milgen G Bertrand and J Noblet 2008 Fasting heat production and energy cost of standing
activity in veal calves Brit J Nutr 100 1315-1324
Langhans W 2000 Anorexia of infection current prospects Nutr 16 996-1005
Le Floch N F Gondret J J Matte and H Quesnel 2012 Towards amino acid recommendations for specific physiological and
patho-physiological states in pigs Proc Nutr Soc 71 425-432
Le Floch N C Jondreville J J Matte and B Seve 2006 Importance of sanitary environment for growth performance and plasma
nutrient homeostasis during the post-weaning period in piglets Arch Anim Nutr 60 23-34
Le Floch N D Melchior and C Obled 2004 Modifications of protein and amino acid metabolism during inflammation and
immune system activation Livest Prod Sci 87 37-45
Le Floch N and B Seve 2007 Biological roles of tryptophan and its metabolism Potential implications for pig feeding Livest Sci
112 23-32
Le Flocrsquoh N L LeBellego J J Matte D Melchior and B Segraveve 2009 The effect of sanitary status degradation and dietary
tryptophan content on growth rate and tryptophan metabolism in weaning pigs J Anim Sci 87 1686-1694
Le Flocrsquoh N D Melchior and B Segraveve 2008 Dietary tryptophan helps to preserve tryptophan homeostasis in pigs suffering from
lung inflammation J Anim Sci 86 3473-3479
Lepage O O Tottmar and S Winberg 2002 Elevated dietary intake of L-tryptophan counteracts the stress-induced elevation of
plasma cortisol in rainbow trout (Oncorhynchus mykiss) J Exp Bio 205 3679-3687
Li P Y-L Yin D Li S Woo Kim and G Wu 2007 Amino acids and immune function Brit J Nutr 98 237-252
Litvak N A Rakhshandeh J Htoo and C de Lange 2013 Immune system stimulation increases the optimal dietary methionine to
methionine plus cysteine ratio in growing pigs J Anim Sci 91 4188-4196
Lochmiller R L and C Deerenberg 2000 Trade-offs in evolutionary immunology Just what is the cost of immunity Oikos 88 87-
98
Marquardt R R L Z Jin J W Kim L Fang A A Frohlich and S K Baidoo 2006 Passive protective effect of egg-yolk antibodies
against enterotoxigenic Escherichia coli K88+ infection in neonatal and early-weaned piglets FEMS Immunol Med
Microbio 23 283-288
McLamb B L A J Gibson E L Overman C Stahl and A J Moeser 2013 Early weaning stress in pigs impairs innate mucosal
immune responses to enterotoxigenic E coli challenge and exacerbates intestinal injury and clinical disease PLOS
ONE 8 e59838
McNab B K 1997 On the utility of uniformity in the definition of basal rate of metabolism Physiol Zoo 70 718-720
Melchior D B Segraveve and N Le Flocrsquoh 2004 Chronic lung inflammation affects plasma amino acid concentrations in pigs J Anim
Sci 82 1091-1099
Moinard C M Mendl C J Nicol and L E Green 2003 A case control study of on-farm risk factors for tail biting Appl Anim
Behav Sci 81
Moughan P J 1981 A model to simulate the utilisation of dietary amino acids by the growing pig (20ndash100 kg) Massey University
Palmerston North New Zealand
Moughan P J 2003 Simulating the partitioning of dietary amino acids New directions J Anim Sci 81 E60-E67
Murata H N Shimada and M Yoshioka 2004 Current research on acute phase proteins in veterinary diagnosis an overview Vet
J 168 28-40
NRC 2012 Nutrient Requirements of Swine 11th ed Natl Acad Press Washington DC
Parmentier H k S Bronkhorst M G Nieuwland G V Reilingh J M van der Linden M J Heetkamp B kemp J W Schrama M
W Verstegen and H an den Brand 2002 Increased fat deposition after repeated immunization in growing chickens
Poult Sci 81 1308-1316
Pastorelli H N Le Floch E merlot M C Meunier-Salauumln J van Milgen and L Montagne 2012a Sanitary housing conditions
modify the performance and behavioural response of weaned pigs to feed- and housing-related stressors Anim 6
1811-1820
Pastorelli H J van Milgen P Lovatto and L Montagne 2012b Meta-analysis of feed intake and growth responses of growing
pigs after a sanitary challenge Anim 6 952-961
Petersen H H J P Nielsen and P M H Heegaard 2004 Application of acute phase protein measurements in veterinary clinical
chemistry Vet Res 35 163-187
Rakhshandeh A J K Htoo and C F M de Lange 2010 Immune system stimulation of growing pigs does not alter apparent ileal
amino acid digestibility but reduces the ratio between whole body nitrogen and sulfur retention Livest Sci 134 21-23
Ren M X T Liu X Wang G J Zhang S Y Qiao and X F Zeng 2014 Increased levels of standardized ileal digestible threonine
attenuate intestinal damage and immune responses in Escherichia coli K88+ challenged weaned piglets Anim Feed Sci
Tech 195 67-75
Chapter 1
23
Salomon R M C M Mazure P L Delgado P Mendia and D S Charney 1994 Serotonin function in aggression The effect of
acute plasma tryptophan depletion in aggressive patients Biol Psych 35 570-572
Sandberg F B G C Emmans and I Kyriazakis 2006 A model for predicting feed intake of growing animals during exposure to
pathogens J Anim Sci 84 1552-1566
Santioga Rostagno H L F Teixeira Albino J Lopes Donzele P Cezar Gomes R Flaacutevia de Oliveira D Clementino Lopes A Soares
Fereira S L de Toledo Barreto and R F Euclides 2011 Brazililian tables for poultry and swine Composition of
feedstuffs and nutritional requirements 3rd edition Universidade fedral de Viccedilosa Brazil
Schroslashder-Petersen D L and H B Simonsen 2001 Tail biting in pigs Vet J 162 196-210
Skovgaard K S Mortensen M Boye K T Poulsen F M Campbell P D Eckersall and P M H Heegaard 2009 Rapid and widely
disseminated acute phase protein response after experimental bacterial infection of pigs Vet Res 40 23
Stein H H M F Fuller P J Moughan B Segraveve R Mosenhthin A J M Jansman J A Fernaacutendez and C F M de Lange 2007
Definition of apparent true and standardized ileal digestibility of amino acids in pigs Livest Sci 109 282-285
Taylor N R D C J Main M Mendl and S A Edwards 2010 Tail-biting a new perspective Vet J 186 137-147
Ullman-Cullere M H and J F Charmaine 1999 Body condition scoring A rapid and accurate method for assessing health status
in mice Lab Anim Sci 49 319-323
Ursinus W W C G Van Reenen I Reimert and J E Bolhuis 2014 Tail biting in pigs blood serotonin and fearfulness as pieces of
the puzzle PLOS ONE 9 e107040
van der Peet-Schwering C M C and A J M Jansman 2007 Nutrieumlntbehoefte van varkens onder suboptimale omstandigheden
NL rapport no 68 WUR Livestock Research Lelystad The Netherlands
van Milgen J J Bernier Y Lecozler S Dubois and J Noblet 1998 Major determinants of fasting heat production and energetic
cost of activity in growing pigs of different body weight and breedcastration combination Brit J Nutr 79 509-517
van Milgen J and J Noblet 2000 Modelling energy expenditure in pigs In JP McNamara J France D E Beever editors
Modelling nutrient utilization in farm animals University of Cape Town Cape Town South Africa p 103-114
van Milgen J and J Noblet 2003 Partitioning of energy intake to heat protein and fat in growing pigs J Anim Sci 81 E86-E93
Whittemore C T 1983 Development of recommended energy and protein allowances for growing pigs Agricult Sys 47 415-425
Whittemore C T and R H Fawcett 1974 Model responses of the growing pig to the dietary intake of energy and protein Anim
Prod 19 221ndash231
Whittemore C T M J Hazzledine and W H Close 2003 Nutrient requirement standards for pigs BSAS Penicuik UK
WHO 2017 A state of complete physical mental and social well-being and not merely the absence of disease or infirmity World
Health Organization httpwwwwhointaboutmissionen (Accessed 20 January 2017)
Williams N H T S Stahly and D R Zimmerman 1997 Effect of level of chronic immune system activation on the growth and
dietary lysine needs of pigs fed from 6 to 112 kg J Anim Sci 75 2481-2496
Winberg S Oslash Oslashverli and O Lepage 2001 Suppression of aggression in rainbow trout (Oncorhynchus mykiss) by dietary l -
tryptophan J Exp Bio 204 3867-3876
Chapter 2
Performance of pigs kept under different sanitary
conditions affected by protein intake and amino acid
supplementation
Y van der Meer12 A Lammers3 AJM Jansman4 MMJA Rijnen2 WH Hendriks1 and WJJ
Gerrits1
Journal of Animal Science 2016 94 (11) 4704-4719
1Animal Nutrition Group Wageningen University Wageningen 6708 WD The Netherlands
2De Heus Animal Nutrition Ede 6717 VE The Netherlands 3Adaptation Physiology Group Wageningen University Wageningen 6708 WD The
Netherlands 4Wageningen UR Livestock Research Wageningen 6708 WD The Netherlands
Chapter 2
26
ABSTRACT
There is growing evidence that requirements for particular amino acids (AA) increase when
pigs are kept under low sanitary conditions The extent to which reduction in growth
performance is related to these increased requirements is unclear To evaluate this
relationship an experiment (2 times 2 times 2 factorial arrangement) was performed with 612 male
pigs (9 per pen) kept under low sanitary conditions (LSC) or high sanitary conditions (HSC)
and offered ad libitum access to either a normal crude protein (CP) concentration diet (NP
17 15 and 15 CP for the starter grower and finisher phase respectively) or a low CP
concentration diet (LP 20 CP reduced relative to NP for each phase) each of which
containing a basal AA profile (AA-B) or a supplemented AA profile (AA-S) The
supplemented diet type contained 20 more methionine (Met) threonine (Thr) and
tryptophan (Trp) relative to Lys on an apparent ileal digestible basis compared with the
basal diet type Pigs were followed for a complete fattening period and slaughtered at a
targeted pen weight of 110 kg Haptoglobin concentrations in serum (092 gL for LSC and
078 gL for HSC) and IgG antibody titers against keyhole limpet hemocyanin (353 for LSC
and 308 for HSC) collected in the starter grower and finisher phases and pleuritis scores
at slaughter (051 for LSC and 020 for HSC) were greater for LSC pigs compared with HSC
pigs (P le 001) illustrating that sanitary conditions affected health conditions The average
daily gain (ADG) and gain to feed (GF) ratio were greater for HSC pigs compared with LSC
pigs (P le 001) The number of white blood cells (WBC) was higher in (AA-S)ndashfed pigs
compared with (AA-B)ndashfed pigs when kept at LSC but not at HSC (sanitary conditions (SC) times
AA interaction P = 004) Pigs fed NP had a lower number of WBC compared with pigs fed
LP (P = 002) The number of platelets in pigs fed AA-S diets was higher compared with pigs
fed AA-B diets (P le 001) A 20 reduction in dietary supplementation of Met Thr and Trp
relative to Lys decreased GF more in LSC pigs than in HSC pigs (interaction P = 003)
illustrating that dietary requirements for these AA differ depending on sanitary conditions
This study performed under practical conditions shows that AA requirements are
dependent on sanitary conditions Furthermore supplementation of diets with particular
AA may improve performance especially under poor hygienic conditions Dietary protein
concentration as well as Met Thr and Trp supplementation can modify immune status
which may influence resistance to subclinical and clinical diseases
Keywords amino acid immune system performance pig protein sanitary conditions
Chapter 2
27
INTRODUCTION
A potential growth reduction with decreasing dietary protein intake can be ameliorated
through the supplementation of limiting amino acids (AA) in the diet thereby restoring
growth at a lower CP intake (Kerr and Easter 1995 Gloaguen et al 2014) The optimal AA
profile however differs depending on animal and environmental conditions (Le Flocrsquoh et
al 2004) Activating the immune system can increase the requirements for nutrients such
as AA If the enhanced requirements are not compensated for by greater intake
repartitioning of dietary protein or AA away from development and growth tissues occurs
(Le Flocrsquoh et al 2009) toward use by the immune processes This shift of nutrients
together with an often-observed reduction in feed intake in case of immune stimulation
reduces pig performance (Klasing and Johnstone 1991 Pastorelli et al 2012a) Despite the
growing evidence that particular AA requirements are dependent on immune system
activation it remains unclear to what extent reduced performance during (subclinical)
infections is related to changes in AA requirements and whether dietary supplementation
of these AA can reverse the performance loss Moreover most evidence for increased AA
requirements is obtained in studies in which pigs were repeatedly challenged with
lipopolysaccharide (LPS eg Kim et al 2012 de Ridder et al 2012 Rakhshandeh et al
2010) or Complete Freundrsquos Adjuvant (Kampman-van de Hoek et al 2015 Le Flocrsquoh et al
2008) and it can be questioned to what extent these results can be extrapolated to pigs in
commercial conditions (Pastorelli et al 2012b) Therefore we studied under practical
conditions if the performance and immune status of pigs kept under different sanitary
conditions is influenced by protein intake and AA supplementation We hypothesized that
increased provision of Met Thr and Trp would increase performance of pigs particularly
when kept under low sanitary conditions and low dietary protein intake
MATERIAL AND METHODS
The experimental protocol was approved by the Animal Care and Use Committee of
Wageningen University the Netherlands
Experimental Design In a 2 times 2 times 2 factorial arrangement groups of pigs were allocated to
either high sanitary conditions (HSC) or low sanitary conditions (LSC) and were offered ad
libitum access to 2 different diets a normal CP concentration diet (NP) or a low CP
concentration diet (LP) each having either a basal dietary AA profile (AA-B) or
supplemented dietary AA profile containing 20 more Met Thr and Trp compared with
the basal profile (AA-S)
Chapter 2
28
Animals and Treatments In total 612 (Topigs 20 times Tempo Topigs Helvoirt The
Netherlands) newborn boar piglets were selected on a commercial nursery farm in the
Netherlands and allocated to either the LSC or HSC treatment Per nursery room half of the
boar piglets were selected for LSC and the other half for HSC treatment Only HSC piglets
received vaccinations in the first 9 wk of age The HSC piglets were vaccinated at 1 to 2 wk
of age against Mycoplasma hyopneumoniae (Porcilis M Hyo MSD Animal Health Boxmeer
the Netherlands) at 4 to 5 wk of age against M hyopneumoniae porcine circovirus type 2
(PCV2) and porcine reproductive and respiratory syndrome (PRRS Porcilis M Hyo Porcilis
Circo and Porcilis PRRS respectively MSD Animal Health) and Lawsonia intracellularis
(Enterisol Ileitis Boehringer Ingelheim BV Alkmaar the Netherlands) at 6 to 7 wk of age
against Actinobacillus pleuropneumoniae (APP Porcilis APP MSD Animal Health) and
influenza A virus (Gripovac3 Merial BV Velserbroek the Netherlands) and at 8 to 9 wk of
age against APP and influenza A virus (Porcilis APP and Gripovac3 respectively) by
subcutaneous injection in the neck or in the case of Enterisol by oral drench Piglets of
both LSC and HSC treatments were housed in the same rooms until weaning (plusmn24 d of age)
After weaning LSC and HSC pigs were group housed in different rooms to prevent cross-
vaccination by the 2 living vaccines used in the HSC piglets (Enterisol Ileitis and Porcilis
PRRS) The HSC and LSC pigs were separately transported to the experimental farm
(Vlierbos VOF Neerloon the Netherlands) As it was not possible to obtain all
measurements during the study on 612 pigs on a single day the LSC and HSC groups were
split into 2 batches of 324 (180 from the LSC treatment and 144 from the HSC treatment)
and 288 pigs (144 from the LSC treatment and 144 from the HSC treatment) arriving 1 wk
apart Therefore pigs of batch 1 and 2 arrived at the experimental farm at an age of 10 and
11 wk respectively
Upon arrival all pigs were individually weighed and within sanitary condition treatment
and batch allocated to their pen based on BW to minimize variation between pens and
within pens (173 plusmn 006 kg for LSC batch 1 181 plusmn 007 kg for LSC batch 2 159 plusmn 007 kg for
HSC batch 1 and 174 plusmn 007 kg for HSC batch 2) The LSC pigs of each batch were housed
in 5 LSC rooms and the HSC pigs were housed in 4 HSC rooms located in the same building
Each room had separate manure pits and separate ventilation regulation and contained 8
pens with 9 pigs per pen (08 m2 spacepig) except for 1 LSC room where 4 out of 8 pens
were left empty In addition the HSC and LSC rooms were separated by a wall in the central
corridor High sanitary condition rooms were intensively cleaned in 4 steps before arrival of
the pigs twice with foam (MS Topfoam LC Alk MS Schippers Bladel the Netherlands) and
high pressure washing and then treated twice with a disinfectant (MS Megades and MS
Oxydes MS Schippers) In addition a strict hygiene protocol was adhered to when entering
the HSC rooms which included showering change of clothes and use of a hairnet and face
mask People were not allowed to have access to a pig farm 48 h before entering HSC
rooms High sanitary condition animals received a preventative antibiotic injection (Fenflor
AUV Veterinary Services BV Cuijk the Netherlands 1 mLpig intramuscular at Day 1 and
Chapter 2
29
3 of the experiment) and were dewormed every 5 wk during the experiment starting at
arrival (Flutelmium 06 premix AUV Veterinary Services BV topdressing 15 mg
Flubendazolkg BW for 5 subsequent days) Rooms for the LSC pigs were not cleaned after
a previous batch of commercial finisher pigs left the facility 2 d before and no hygiene
protocol was applied Starting at 5 wk after arrival fresh manure of another commercial pig
farm was spread in the LSC pens every 2 wk until end of the experiment to enhance
antigenic pressure Low sanitary condition pigs did not receive any medication or
preventive treatment The experimental period lasted from December 11 2013 until April
16 2014 Animals were monitored for the complete fattening period divided in 3 phases
that is starter (0ndash34 d) grower (35ndash49 d) and finisher phases (from Day 50 until a target
average pen weight of 110 kg BW) At the end of each phase pigs were individually
weighed
Diets and Feeding Pigs were allocated to 2 diets NP (17 15 and 15 CP for the starter
grower and finisher phases respectively) or LP (20 CP reduced relative to NP for each
phase) each of which contained a basal or a supplemented AA profile This resulted in 4
dietary treatments Low protein - basal amino acid diet low protein- supplemented amino
acid diet normal protein - basal amino acid die and normal protein - supplemented amino
acid diet Each diet was fed to the pigs in both sanitary regimes resulting in 8 treatment
groups The apparent ileal digestible (AID) Lys to NE ratio of the diets was reduced in each
subsequent phase of the experiment to follow a 3-phase feeding system For the NP the
ratio was based on the Lys to net energy (NE) requirements for boars according to the NRC
(2012) The values for Lys to NE requirements were multiplied by 095 to make sure that
the dietary energy concentration was not limiting the growth performance of the pigs This
resulted in diets for the starter grower and finisher phases containing 090 081 and 075
g AID LysMJ of NE For the LP the inclusion level of all protein-containing ingredients was
decreased by 20 relative to the NP and replaced by maize starch and Opticell (Agromed
Austria GmbH Kremsmuumlnster Austria) resulting in 072 065 and 060 g AID Lys MJ of
NE The basal AA profile (AA-B) was designed based on a factorial approach to cover the
requirements for body protein deposition based on results from Bikker et al (1994) Le
Bellego and Noblet (2002) and the NRC (2012) and to cover losses associated with basal
endogenous AA in ileal digesta based on results from Jansman et al (2002) and the NRC
(2012) related to losses of AA in skin and hair based on results from the NRC (2012) and
AA losses related to cell turnover based on results from Moughan (1998) All values were
expressed in the same units for a pig of 50 kg BW with an assumed protein deposition of
138 gd The Met + Cys (45 of AID Lys) and Trp (15 of AID Lys) concentrations in AA-B
diets obtained in this manner were adjusted to 51 Met + Cys and 18 Trp based on
results from Knowles et al (1998) and Jansman et al (2010) as we considered these to be
far below the requirement values (CVB 2011 NRC 2012) The supplemented AA profile
(AA-S) was derived from the AA-B profile by increasing the Met Thr and Trp ratio relative
Chapter 2
30
to Lys by 20 These AA were increased in particular as they are believed to be important
as building blocks for proteins for example acute-phase proteins synthesized in case of
immune system activation (Melchior et al 2004 Le Flocrsquoh et al 2008 2012 Rakhshandeh
et al 2010) because of their function as precursors for important immune related
components and antioxidants and also because of their effects on several immune
processes Methionine is known to be an important methyl donor (Burke et al 1951) and
antioxidant (Wu 2009) Thr plays an important role in mucus synthesis for gut integrity and
immune function (Wu 2009) and Trp is known as a precursor of melatonin and serotonin
both known to inhibit inflammatory cytokines (Wu 2009) The ingredient and nutrient
composition of the diets is shown in Tables 21 22 and 23 All diets were isocaloric on a
NE basis and contained TiO2 as an indigestible marker Diets were analyzed for AA
composition by acid hydrolysis at 110degC for 23 h and ion-exchange chromatography with
postcolumn derivatization with ninhydrin (ISO 2005b) and Trp by alkaline hydrolysis at
110degC for 20 h ion-exchange chromatography with fluorescence detection (MOD0094
version G ISO 2005c) Per pen (9 pigs) 1 feeder was used and feed and water were
offered ad libitum The feed was provided as pellets via a computerized automatic system
(Fancom Multiphase Fancom BV Panningen the Netherlands) which registered the mass
of feed delivered per pen per day At the end of each phase (starter grower and finisher)
remainders of the diet per pen were collected and weighed to determine the feed intake
per pen per phase The computerized feeding system was calibrated before the trial started
and after each phase
Digestion of dry matter and nitrogen At wk 13 18 and 24 of age pigs in 4 pens per room
and 4 rooms per sanitary treatment were sampled for feces by rectal stimulation In 3
subsequent days 1 sample per pig was collected and samples were pooled per pen and
stored at minus20degC Sampling pens were equally distributed over dietary treatments Frozen
feces samples were dried at 103degC in an oven for 24 h to determine DM content (method
93015 AOAC ISO 1999) and were analyzed for nitrogen (N) by the Kjeldahl method (ISO
5983 ISO 2005a) Before Ti analysis (Short et al 1996 Myers et al 2004) samples were
freeze-dried and ground to pass a 1-mm screen using a Retsch ZM 100 mill (Retsch GmbH
Haan Germany) Apparent total tract digestibility (ATTD) for dry matter (DM) and N was
calculated using TiO2 as an indigestible marker (Kotb and Luckey 1972)
Blood Sampling At the start of the experiment 2 pigs with an average weight per pen were
selected for blood sampling at 13 18 and 24 wk of age from the vena cava Selected pigs
were sampled during each of the 3 phases Per sampling moment two 9-mL tubes per
animal were filled 1 EDTA tube for blood cell counts (Vacuette Greiner Bio-One
Kremsmuumlnster Austria) and 1 serum tube for acute-phase protein and natural antibody
(Nab) analysis (Vacuette) Blood samples collected in EDTA tubes were immediately stored
on ice and transported to the lab where blood cell counts were performed using a Microcell
Chapter 2
31
counter Sysmex pocH- iV Diff Toa Medical Electronics Co Ltd Kobe Japan) Blood
samples in serum tubes were allowed to clot for 1 h at room temperature after which
serum was collected after centrifugation for 10 min at 5251 times g at room temperature and
stored at minus20degC pending analysis of haptoglobin (Tridelta Phase Haptoglobin Assay catalog
number TP-801 Tridelta Development Ltd Maynooth Ireland) pig major acute-phase
protein (Cusabio Pig-MAP ELISA catalog number CSB-E13425p Cusabio Biotech Co Ltd
Wuhan Hubei Province China) and Nab titers against keyhole limpet hemocyanin (KLH)
types IgG and IgM using ELISA
Chapter 2
32
Table 21 Ingredients and nutrient composition of the starter diets
LP1 NP1
Item AA-B2 AA-S2 AA-B AA-S
Ingredient gkg of feed
Maize 32000 32000 40000 40000 Soybean meal 18202 18200 22754 22754 Barley 16000 16000 20000 20000 Wheat 4553 4553 5691 5691 Maize starch 20679 20464 4065 3790 Sugarcane molasses 2000 2000 2000 2000 Limestone 1394 1394 1411 1411 Monocalcium phosphate 999 999 893 893 Soybean oil 1065 1098 1598 1638 Vitamin + mineral mix3 500 500 500 500 Salt 319 319 383 383 L-lysine HCl 195 194 235 235 Titanium dioxide 250 250 250 250 Sodium bicarbonate 258 258 134 134 L-threonine 060 146 063 171 L-tryptophan 003 031 000 037
DL-methionine 023 094 023 113
Cellulose4 1500 1500 000 000
Nutrients calculated gkg
NE MJkg5 980 980 980 980
DM 88960 88980 89320 88490
Crude protein 13800 13600 16800 16700
Starch4 47410 47230 41000 40770 Lys6 860 860 1050 1050 Thr6 540 620 660 740 Trp6 170 190 200 230 Met + Cys6 430 480 520 590 Ile6 560 560 690 680 Arg6 830 840 1050 1030 Phe6 660 660 820 810 His6 340 340 420 420 Leu6 109 1100 1360 1340 Tyr6 440 450 570 570 Val6 640 640 790 770 1 LP = low CP concentration diet NP = normal CP concentration diet
2 AA-B = basal dietary AA profile AA-S= supplemented dietary AA profile containing 20 more Met Thr and Trp compared with the basal profile 3 Supplied the following per kilogram of diet 30 mg riboflavin 20 mg niacine 20 mg d-pantothenic acid 10 mg choline chloride 0015 mg cyanocobalamin 40 mg dl-α-tocopheryl acetate 15 mg menadione 6000 IU retinyl acetate 1200 IU cholecalciferol 02 mg folic acid 10 mg thiamin 10 mg pyridoxine HCl 50 mg manganese oxide 267 mg iron SO4middotH2O 60 mg copper SO4middot5H2O 140 mg zinc SO4middotH2O 044 mg disodium selenium trioxide10 mg potassium iodate 4 Opticell (Agromed Austri GmbH Kremsmuumlnster Austria)
5 Based on chemical composition digestibility and energy value for pigs from the Centraal Veevoeder Bureau livestock feed table (CVB 2011) 6 Analyzed values
Chapter 2
33
Table 22 Ingredients and nutrient composition of the grower diets
LP1 NP1
Item AA-B2 AA-S2 AA-B AA-S
Ingredient gkg of feed
Maize 40000 40000 50000 50000
Soybean meal 13815 13815 17269 17269
Barley 17136 17136 21419 21419
Maize starch 19919 19724 4334 4086
Wheat 2000 2000 2000 2000
Sugarcane molasses 1311 1311 1333 1333
Limestone 862 862 767 767
Monocalcium phosphate 919 948 1020 1057
Soybean oil 500 500 500 500
Vitamin + mineral mix3 395 395 361 361
Salt 245 245 292 292
L-lysine HCl 250 250 250 250
Titanium dioxide 156 156 200 200
Sodium bicarbonate 387 387 152 152
L-threonine 072 149 074 172
L-tryptophan 021 046 022 055
DL-methionine 012 076 007 087
Cellulose4 2000 2000 000 000
Nutrients calculated gkg
NE MJkg4 984 984 984 984
DM 88370 88590 88280 88770
Crude protein 12400 12400 15200 15200
Starch5 49710 49550 44890 44690
Lys6 800 790 970 1000
Thr6 510 590 590 700
Trp6 156 175 191 216
Met + Cys6 398 452 476 558
Ile6 480 470 590 580
Arg6 720 700 900 900
Phe6 580 570 710 710
His6 300 300 370 360
Leu6 100 990 123 123
Tyr6 380 390 500 500
Val6 570 580 690 690 1 LP = low CP concentration diet NP = normal CP concentration diet
2 AA-B = basal dietary AA profile AA-S= supplemented dietary AA profile containing 20 more Met Thr and Trp compared with the basal profile 3 Supplied the following per kilopgram of diet 30 mg riboflavin 20 mg niacine 20 mg d-pantothenic acid 10 mg choline chloride 0015 mg cyanocobalamin 40 mg dl-α-tocopheryl acetate 15 mg menadione 6000 IU retinyl acetate 1200 IU cholecalciferol 02 mg folic acid 10 mg thiamin 10 mg pyridoxine HCl 50 mg manganese oxide 267 mg iron SO4middotH2O 60 mg copper SO4middot5H2O 140 mg zinc SO4middotH2O 044 mg disodium selenium trioxide10 mg potassium iodate 4 Opticell (Agromed Austri GmbH Kremsmuumlnster Austria)
5 Based on chemical composition digestibility and energy value for pigs from the Centraal Veevoeder Bureau livestock feed table (CVB 2011) 6 Analyzed values
Chapter 2
34
Table 23 Ingredients and nutrient composition of the finisher diets
LP1 NP1
Item AA-B2 AA-S2 AA-B AA-S
Ingredient gkg of feed
Maize 36010 36010 45010 45010 Soybean meal 11570 11570 14460 14460 Barley 24000 24000 30000 30000 Maize starch 18720 18530 3640 3410 Wheat 2000 2000 2000 2000 Sugarcane molasses 1220 1220 1250 1250 Limestone 740 740 650 650 Monocalcium phosphate 1400 1430 1320 1360 Soybean oil 500 500 500 500 Vitamin + mineral mix3 230 230 260 260 Salt 240 240 280 280 L-lysine HCl 250 250 250 250 Titanium dioxide 530 530 300 300 Sodium bicarbonate 000 060 000 070 L-threonine 070 140 070 160 L-tryptophan 010 040 010 040
DL-methionine 010 010 000 000
Cellulose4 2500 2500 000 000
Nutrients calculated gkg
NE MJkg5 984 984 984 984
DM 88590 88650 88160 88770
Crude protein 13200 12600 15100 14800
Starch5 54170 50940 54170 54020 Lys6 800 760 890 890 Thr6 530 560 590 650 Trp6 151 162 168 191 Met + Cys6 403 422 468 504 Ile6 490 460 570 560 Arg6 730 680 820 820 Phe6 600 560 680 680 His6 310 290 350 350 Leu6 1010 960 1190 1130 Tyr6 400 370 470 470 Val6 600 570 660 660 1 LP = low CP concentration diet NP = normal CP concentration diet
2 AA-B = basal dietary AA profile AA-S= supplemented dietary AA profile containing 20 more Met Thr and Trp compared with the basal profile 3 Supplied the following per kilopgram of diet 30 mg riboflavin 20 mg niacine 20 mg d-pantothenic acid 10 mg choline chloride 0015 mg cyanocobalamin 40 mg dl-α-tocopheryl acetate 15 mg menadione 6000 IU retinyl acetate 1200 IU cholecalciferol 02 mg folic acid 10 mg thiamin 10 mg pyridoxine HCl 50 mg manganese oxide 267 mg iron SO4middotH2O 60 mg copper SO4middot5H2O 140 mg zinc SO4middotH2O 044 mg disodium selenium trioxide10 mg potassium iodate 4 Opticell (Agromed Austri GmbH Kremsmuumlnster Austria)
5 Based on chemical composition digestibility and energy value for pigs from the Centraal Veevoeder Bureau livestock feed table (CVB 2011) 6 Analyzed values
Chapter 2
35
Oral Fluid Sampling for Presence of Respiratory Pathogens In each room with 8 pens of pigs
2 pens with the normal protein - basal amino acid diet were selected for oral fluid sampling
by using a swine oral fluid test kit (Tego oral fluids kit ITL Corporation Melbourne
Australia) At wk 14 20 and 24 of age (1 time point per phase) a clean rope was hanged in
the pen at pigsrsquo shoulder height and securely tied Pigs were allowed to chew on the rope
for 30 min Subsequently the rope was removed from the pen (by wearing gloves) and
placed in a clean pouch bag The bag was closed and the fluid was extracted from the rope
by squeezing the rope through the bag Oral fluid was collected from the bag in a clean
sample tube after the corner of the bag was torn off Oral fluid was refrigerated until
further analysis Oral samples were analyzed with multiplex PCR for presence of
Mycoplasma hyorhinis porcine respiratory corona virus PRRS virus M hyopneumoniae
influenza A virus porcine cytomegalo virus and PCV2 (IVD GmbH Hannover Germany)
Anti-Keyhole Limpet Hemocyanin IgM and IgG Assessment Antibody titers were determined
as described by de Koning et al (2015) with the minor modification that a 4-step dilution
(40 160 640 2560 times diluted) of the sera was made instead of a 3-step dilution
Observations at Slaughter All pigs per pen were slaughtered in the week in which the
average BW of the pigs in that pen was close to the target weight of 110 kg In the
slaughterhouse lungs were collected examined and scored by a pathologist for pleuritis (0
to 2 scale in which 0 = absence of pleuritis 1 = adhesion of lung tissue with film-like tissue
and 2 = lung tissue completely grown together) and pneumonia lesions (0 to 3 scale in
which 0 = absence of pneumonia 1 = one spot of pneumonia 2 = a few spots of
pneumonia and 3 = diffuse deviation of pneumonia spots) Carcass weight backfat
thickness and muscle thickness were measured in the slaughterhouse Both fat and muscle
thickness were measured at 6 cm from the back midline between the third and fourth last
rib Lean meat and dressing percentages were calculated per pig from the parameters
obtained at slaughter using the following formulas
lean meat () = 6686 minus 06549 times (fat mm) + 00207 times (muscle mm) (Engel et al 2012)
and dressing () = (carcass weightlive weight) times 100 (Watkins et al1990)
Table 24 Performance parameters of growing pigs kept under different sanitary conditions and fed diets differing in protein content and amino acid supplementation (bold P-values are significant and underlined P-values are considered as tendency)
1LSC = low sanitary conditions HSC = high sanitary conditions 2LP = low CP concentration diet NP = normal CP concentration diet 3AA-B = basal dietary AA profile AA-S = supplemented ietary AA profile containing 20 more Met Thr and Trp compared with basal profile 4SEM = pooled SEM Means are presented as least square means 5SC = sanitary conditions Considered significant when P le 005 considered as tendency when 005 lt P le 010 6A pen contained 9 pigs
LSC1 HSC1
P-values5 LP2 NP2 LP NP
Item AA-B3 AA-S3 AA-B AA-S AA-B AA-S AA-B AA-S SEM4 SC CP AA SCtimesCP SCtimesAA CPtimesAA SCtimesCPtimesAA
No of pens6 9 9 9 9 8 8 8 8
Start kg BW 176 180 176 176 166 166 167 166 01 lt0001 023 043 015 021 010 041
ADG gd
0-34 d 602 591 655 652 618 660 697 724 16 001 lt0001 022 053 006 086 060
35-49 d 962 992 1023 1088 979 1024 1113 1132 33 025 lt0001 002 022 065 089 039
17-110 kg
BW
825 846 864 884 860 886 925 969 18 003 lt0001 001 010 049 066 065
ADFI gd
0-34 d 1246 1225 1218 1198 1201 1280 1230 1259 20 017 039 021 027 001 042 040
35-49 d 2122 2123 2120 2070 2100 2222 2220 2244 51 011 045 049 017 017 027 069
17-110 kg
BW
1950 1924 1901 1890 1910 1989 1940 1998 37 025 066 024 013 004 090 063
GF gg
0-34 d 048 048 054 054 052 052 057 057 0009 0003 lt0001 062 075 094 059 096
35-49 d 046 047 048 052 047 046 05 051 0013 093 lt0001 011 091 009 060 081
17-110 kg
BW
042 044 046 048 045 044 048 048 0004 0002 lt0001 001 070 003 032 015
Chapter 2
37
Statistical Analysis Data were analyzed as a 2 times 2 times 2 factorial arrangement using the GLM
procedure for parameters measured at slaughter and the Mixed Model procedure for other
performance parameters and serum and blood data (SAS 93 SAS Inst Inc Cary NC) with
pen as experimental unit for all parameters For all data the normality of the distribution of
Studentized residuals was assessed by the ShapirondashWilk statistic If required
transformation of data was performed to obtain normal distribution of residuals Values are
presented as least squares means plusmn SEM and effects were considered significant at P le
005 and a trend was defined as 005 lt P le 010 Sanitary condition dietary CP level and AA
profile batch and their interactions were used as fixed effects Phase was added in the
model as a fixed effect and phase times sanitary condition as an interaction for all blood
parameters and ATTD of N and DM The effect of room within sanitary status was used as a
random effect to correct for differences between rooms The KenwardndashRoger statement
was used to correct for the degrees of freedom for batch The difference between
individual start BW and average BW of the treatment group (sanitary conditions and batch)
was used as covariate in the model in the first statistical evaluations but finally omitted
because of absence of statistical significance
RESULTS
Two pigs selected for blood sampling died during the grower phase and as such the data
of these pigs are missing for the finisher phase Data of another pig selected for blood
sampling was omitted from the data set as this pig was treated with antibiotics in the
starter phase due to lung problems No other clinical signs of illness were observed during
the experiment All results are presented in Tables 24 through 28 For clarity selected
treatment interactions are represented in Fig 21A through 21I
Performance Mean BW at start of the experiment was greater for LSC pigs (177 plusmn 01 kg)
compared with HSC pigs (166 plusmn 01 kg P le 001 Table 24) The ADG was (52 gd) lower for
LSC pigs compared with HSC pigs for the starter phase (P le 005) and (55 gd) during the
complete fattening period (P le 001) but not during the grower phase (P gt 010) The LP pigs
had (56 gd) lower ADG in the complete fattening period compared with NP pigs (all P le
005) The AA-B pigs tended to have (28 gd) lower ADG compared with AA-S pigs in the
starter phase when kept under HSC but not under LSC [sanitary conditions (SC) times AA P le
010]
For ADFI an interaction was present for SC times AA in the starter phase (P le 001) and over the
complete fattening period (P le 005 Fig 21A) but not in the grower phase (P gt 010) The
AA-B pigs had (54 gd in the starter phase and 69 gd over the complete fattening period)
lower ADFI compared with AA-S pigs when kept under HSC but not under LSC The GF was
(0035 gg) lower for pigs kept under LSC compared with HSC for the starter phase (P le
Chapter 2
38
001) and (0013 gg) for the entire growerndashfinisher period (P le 001) but not for the grower
phase (P gt 010)
The GF was 0038 gg lower for LP pigs compared with NP pigs in all phases (all P le 001)
The AA-B pigs had a (0008 gg) lower GF compared with AA-S pigs in the entire growerndash
finisher period (P le 001) but not for the grower phase (P gt 010) The GF was 0038 gg
lower for LP pigs compared with NP pigs in all phases (all P le 001) The AA-B pigs had a
(0008 gg) lower GF compared with AA-S pigs in the entire growerndashfinisher period (P le
001) The greater GF for AA-B pigs compared with AA-S pigs for the entire experimental
period was (0025 gg) greater for LSC pigs compared with HSC pigs (SC times AA P le 005 Fig
21B) A tendency for a similar interaction was found for the GF in the grower phase (P le
010)
Acute-Phase Proteins and Natural Antibodies against Keyhole Limpet Hemocyanin in Serum
In LSC pigs but not HSC pigs reduction of dietary CP concentration reduced serum
haptoglobin by 024 gL (CP times SC P le 001 Table 25 Fig 21I) The LSC pigs showed lower
haptoglobin concentrations over time whereas HSC pigs had lower concentrations during
the grower phase compared with the starter phase and showed greater concentrations
again in finisher phase (SC times phase P le 005 Fig 21E) The LSC pigs had (029 gL) greater
serum haptoglobin concentrations compared with the HSC pigs (P le 001) The LSC pigs had
(003 gL) lower PigMAP concentrations in the grower phase compared with the starter
phase and (009 gL) greater concentrations again in the finisher phase compared with the
grower phase whereas the HSC pigs had (009 gL) lower concentrations in the grower
phase compared with the starter phase (SC times phase P le 005 Fig 21F) Keyhole limpet
hemocyaninndashspecific IgM antibody titers in serum tended to be (004) lower for AA-Sndashfed
pigs compared with AA-Bndashfed pigs (P le 010) Keyhole limpet hemocyaninndashspecific IgG
antibody titers were (045) greater for LSC pigs compared with HSC pigs (P le 005)
Blood Cell Counts The number of white blood cells (WBC) was (18 times 109L) greater (Table
26) in AA-Sndashfed pigs compared with AA-Bndashfed pigs when kept under LSC but not under HSC
(SC times AA P le 005 Fig 21C) Over time the concentration of WBC in pigs decreased (by 41
times 109L) but the number of red blood cells consistently increased (with 05 times 1012L) in all
treatment groups (P le 001) Pigs fed the NP had a (31) lower number of WBC compared
with pigs fed the LP (P le 005) Hemoglobin concentration was (01 mmolL) lower in AA-Sndash
fed pigs compared with AA-Bndashfed pigs particularly under HSC (SC times AA P le 005 and P le
005 for AA) Hemoglobin concentrations increased with age in all treatment groups (074
mmolL) however this increase was greater in HSC pigs compared with LSC pigs (SC times
phase P le 005) Pigs fed NP had a (01 mmolL) greater hemoglobin concentration than
pigs fed LP (P le 005) Mean cell volume was (07 times 1015L) greater for AA-Sndashfed pigs
compared with AA-Bndashfed pigs in LSC but this was reversed in HSC (SC times AA P le 001 Fig
21D) The mean cell volume was (04 times 1015L) greater in pigs fed NP compared with pigs
Chapter 2
39
fed LP (P le 005) The number of platelets decreased (by 258 times 109L) in pigs over time for
all treatments but the decrease was (60) greater in HSC pigs compared with LSC pigs
(interaction P le 005) The concentration of platelets in pigs fed AA-S diets was (121 times
109L) greater compared with pigs fed AA-B diets (P le 001)
Figure 21 Interactions between low sanitary condition (LSC) and high sanitary condition (HSC) pigs and a basal dietary AA profile (AA-B) or a supplemented dietary AA profile containing 20 more Met Thr and Trp compared with the basal profile (AA-S) for ADFI (A) GF (B) white blood cell (WBC) number (C) and mean cell volume (MCV D) SC = sanitary conditions Interactions between LSC and HSC pigs and phase (Ph) for serum haptoglobin concentration (E) serum PigMAP concentration (F) plasma granulocyte number (G) and plasma monocyte number (H) Interaction between LSC and HSC pigs and a low CP concentration diet (LP) or a normal CP concentration diet (NP) for serum haptoglobin concentration (I) The open bars represent the LSC treatment and the filled bars represent the HSC treatment Bars represent least squares means plusmn SEM P-values were considered significant when P le 005
20
21
22
23
24
25
26
AA-B AA-S
WB
C p
lasm
a co
nce
ntr
atio
n 1
09L
04
05
AA-B AA-S
GF
kg
kg
SC times AA P = 003SC P = 0002AA P = 001
50
55
60
AA-B AA-S
MC
V in
pla
sma
SC times AA P = 004
SC times AA P lt0001
00
03
06
09
12
15
LP NP
Hap
togl
ob
in s
eru
m
con
cen
trat
ion
gL
ser
um
00
03
06
09
12
15
starter grower finisher
Hap
togl
ob
in in
gL
ser
um
SC times Ph P = 0019SC P = 0004
15
20
25
AA-B AA-S
AD
FI k
g (
pig
bull d
)
SC times AA P = 004
00
03
starter grower finisher
PigM
AP
in s
eru
m g
L
SC times Ph P = 0038
000
005
010
starter grower finisher
Gra
nu
locy
te p
lasm
a co
nce
ntr
atio
n 1
09L
SC times Ph P = 0014 SC P = 0007 Ph P = 0007
5
10
15
starter grower finisher
Mo
no
cyte
co
nce
ntr
atio
n
in p
lasm
a 10
9L
SC times Ph P = 0005 Ph P lt0001
SC times CP P = 001 SC P = 0004
Table 25 Concentrations of acute-phase protein and natural antibody titres against keyhole limpet hemocyanin (KLH) in serum of pigs kept under different sanitary conditions and fed 1 of 4 diets with a low or normal protein level and a basal or supplemented AA profile (bold P-values are significant and underlined P-values are considered as tendency)
1The experiment consisted of different phases starter grower and finisher 2LSC = low sanitary conditions HSC = high sanitary conditions 3LP = low CP concentration diet NP = normal CP concentration diet 4AA-B = basal dietary AA profile AA-S = supplemented dietary AA profile containing 20 more Met Thr and Trp compared with the basal profile 5SEM= pooled SEM Means are presented as least square means 6 SC = sanitary conditions Considered significant when P le 005 considered a tendency when 005 lt P le 010 7
All animals were group housed in pens with 9 animals per pen Two animals per pen were selected for blood sampling 8 Keyhole limpet hemocyanin is a protein produced by a sea snail Pigs have natural antibodies against this protein
LSC2 HSC2
LP2 NP2 LP NP P-values6
Item Phase1 AA-B4 AA-S4 AA-B AA-S AA-B AA-S AA-B AA-S SEM5 SC CP AA SCtimesPh7 SCtimesCP SCtimesAA CPtimesAA SCtimesCPtimesAA
Noof pens7 9 9 9 9 8 8 8 8
Haptoglobin Starter 115 075 136 137 091 079 086 098 016 0004 025 091 002 001 042 012 074 gL Grower 097 097 121 111 063 047 046 062
Finisher 083 073 085 095 085 095 058 069
PigMAP Starter 017 014 014 025 018 016 019 021 003 025 019 055 004 099 035 022 039
gL Grower 007 008 010 012 008 009 011 009
Finisher 019 019 016 017 011 010 009 011
KLH8-IgM Starter 659 629 668 660 640 678 659 642 020 068 047 007 032 092 032 047 020
Grower 750 727 747 709 706 703 731 699
Finisher 785 746 780 769 778 765 790 784
KLH-IgG7 starter 312 330 308 297 278 246 247 302 028 004 075 062 009 042 087 081 008
grower 364 413 367 375 310 298 315 299
finisher 362 370 382 352 346 359 336 359
Chapter 2
41
White blood cell distribution The AA-Sndashfed pigs had (07 times 109L) a greater number of blood
lymphocytes compared with AA-Bndash fed pigs when provided a LP but this was reversed
(minus05 times 109L) when pigs were provided a NP (CP times AA P le 005) The number of
lymphocytes increased (09 times 109L) with age for all treatment groups (P le 001) The
number of monocytes (29 times 109L) decreased over time for all treatment groups
particularly for LSC pigs (SC times phase P le 001 Fig 21H) The AA-Sndashfed pigs had a (06 times
109L) greater monocyte number compared with AA-Bndashfed pigs (P le 005) The NP-fed pigs
had a (08 times 109L) lower monocytes number compared with LP-fed pigs (P le 005) The
concentration of granulocytes increased (by 001 times 109L) over time for LSC pigs and in the
HSC pigs increased (002 times 109L) from the starter to the grower phases but decreased
(003 times 109L) again in the finisher phase (SC times phase P le 005 Fig 21G) The
concentration of granulocytes was (001 times 109L) greater for HSC pigs than for LSC pigs (P le
001)
Carcass observations at slaughter and lung scores Results obtained at slaughter are
presented in Table 27 Carcass weight was (38 kg) lower for LP pigs compared with NP pigs
but not dressing percentage (P le 001 and P gt 005 respectively) The LP pigs had (12 mm)
greater backfat thickness (P le 001) and (08) lower lean meat percentage (P le 001)
compared with NP pigs The AA-B pigs had (15 mm) lower muscle thickness (P le 001 05
mm) greater backfat thickness (P le 001) and a (04) lower lean meat percentage (P le
001) compared with AA-S pigs Pleuritis scores were (03) greater for LSC pigs compared
with HSC pigs (P le 001) Percentage of lung surface with pleuritis was also (12) greater
for LSC pigs compared with HSC pigs (P le 001) The AA-B pigs had a (1) greater
percentage of lung surface with pleuritis compared with AA-S pigs when kept in LSC but for
HSC pigs this was reversed (SC times AA P le 005) The LP pigs had (02) greater pneumonia
scores compared with NP pigs when kept under HSC however when kept under LSC this
was reversed (SC times CP P le 005) The AA-B pigs tended to have greater pneumonia scores
compared with the AA-S pigs in all cases except in LSC pigs fed a LP (CP times AA P le 001)
Dry matter and N digestion The effect of experimental treatments on the ATTD of DM and
N were consistent over the duration of the experiment and are presented averaged over all
phases (Table 28) In general treatment differences albeit significant were small
Apparent total tract digestibility for DM was (03) lower for LSC pigs compared with HSC
pigs during all phases (all P le 005) The AA-B pigs had (04) lower ATTD of DM compared
with AA-S pigs (P le 001) Apparent total tract digestibility for N was (098) greater for HSC
pigs compared with LSC pigs during all phases (all P le 001) regardless the dietary CP
content or AA profile Apparent total tract digestibility for N increased from 806 (starter
phase) to 839 (grower phase) and 847 finisher phase (P le 001) There were no
interactions between phase and other independent variables
Table 26 Cell count in fresh blood of pigs kept under different sanitary conditions and fed one of four diets with a low or normal protein level and a basal or supplemented AA profile (bold P-values are significant and underlined P-values are considered as tendency) LSC2 HSC2
LP3 NP3 LP NP P-values6
Item1 Phase AA-B3 AA-S3 AA-B AA-S AA-B AA-S AA-B AA-S SEM5 SC CP AA phase SCtimesPh SCtimesCP SCtimesAA CPtimesAA SCtimesCPtimesAA
No of pens7
9 9 9 9 8 8 8 8
WBC 109L Starter 243 266 208 250 260 250 251 234 13 089 002 015 lt0001 008 060 004 018 046
Grower 227 249 225 220 219 227 213 199
Finisher 194 212 195 200 196 214 214 208
Lymphocytes 109L Starter 107 113 94 103 110 113 112 104 07 043 010 069 0005 088 013 005 002 030
Grower 110 119 109 108 114 118 117 109
Finisher 112 125 112 111 111 116 132 109
Monocytes 109L Starter 136 153 113 148 150 139 139 130 09 034 001 005 lt0001 0005 055 013 069 056
Grower 117 131 116 113 104 108 95 88
Finisher 81 87 84 89 82 97 81 91
Granulocytes 109L Starter 002 001 001 003 002 003 004 003 00 0007 027 088 0007 001 039 061 074 010
Grower 002 002 001 003 005 007 005 004
Finisher 004 002 002 002 004 003 001 001
RBC 1012L Starter 57 56 56 55 54 60 55 54 01 083 083 095 lt0001 030 095 008 044 036
Grower 59 58 59 56 57 60 59 58
Finisher 60 59 60 61 61 61 60 63
Hb mmolL Starter 64 63 65 64 63 63 65 60 01 013 001 003 lt0001 005 062 005 018 007
Grower 66 66 68 66 68 67 72 67
Finisher 68 69 69 73 72 70 73 72
Ht Starter 478 309 314 309 303 310 310 293 37 049 045 028 064 023 041 040 048 029
Grower 316 316 323 312 319 323 330 316
Finisher 329 329 334 343 340 335 343 345
MCV 10-15L Starter 548 551 558 561 560 544 560 541 059 048 004 006 013 024 031 lt0001 052 095
Grower 540 547 548 553 560 543 564 549
Finisher 545 560 552 560 562 550 567 550
PTL 109 L
Starter 614 712 562 721 571 703 744 1219 948 092 023 0002 lt0001 002 014 046 060 078
Grower 522 606 520 652 438 551 439 559
Finisher 489 555 480 494 405 508 447 401
1 WBC = white blood cells RBC = red blood cells Hb = haemoglobin Ht = Haematocrit MCV = mean cell volume PTL = platelets 2 LSC = low sanitary status HSC = high sanitary status 3 LP = low CP concentration diet NP = normal CP concentration diet4 AA-B= basal dietary AA profile AA-S = supplemented dietary AA profile containing 20 more Met Thr and Trp compared with the basal profile 5SEM = pooled SEM Means are presented as least square means 6 SC=sanitary conditions Considered significant when 1 WBC = white blood cells RBC = red blood cells Hb = haemoglobin Ht = Haematocrit MCV = mean cell volume PTL = platelets 2 LSC = low sanitary status HSC = high sanitary status 3 LP = low CP concentration diet NP = normal CP concentration diet4 AA-B= basal dietary AA profile AA-S = supplemented dietary AA profile containing 20 more Met Thr and Trp compared with the basal profile 5SEM = pooled SEM Means are presented as least square means 6 SC=sanitary conditions Considered significant when P le 005 and considered a tendency when 005 lt P le 010 7All animals were group housed in pens with 9 animals in total Two animals per pen were selected for blood sampling
Chapter 2
44
Oral fluid samples Oral fluid samples of pigs in all sampled pens (18 pens in total) were
positive for M hyorhinis and negative for PRRS M hyopneumoniae influenza A virus and
porcine cytomegalo virus in all phases All pens were negative for porcine respiratory
corona virus in the starter and grower phases but in the finisher phase 4 out of 9 LSC pens
and 3 out of 9 HSC pens became positive All pens were negative for PCV2 in the starter
phase but LSC pigs became positive in grower phase (7 out of 9 pens) and finisher phase
(all 9 pens) Only 1 out of 9 HSC pens became positive for PCV2 in the grower phase and
was negative again in the finisher phase The rest of the sampled HSC pigs were negative
for PCV2 in all phases
Table 27 Slaughter results of fattening boars kept under different sanitary conditions and fed diets with 2 CP levels and 2 AA profiles (bold P-values are significant and underlined P-values are considered as tendency)
1LSC = low sanitary conditions HSC = high sanitary conditions 2LP= low CP concentration diet NP = normal CP concentration diet 3AA-B = basal dietary AA profile AA-S = supplemented dietary AA profile containing 20 more Met Thr and Trp compared with the basal profile 4SEM= pooled SEM means are presented as least square means 5SC = sanitary conditions Considered significant when P le 005 and considered as tendency when 005 lt P le 010 6A pen contained 9 pigs 7 Body weight expressed 1 d before slaughter day muscle backfat and lean meat expressed as corrected for carcass weight by including carcass weight as a covariate in the statistical model 8Pleurits was scored on a scale of 0 to 2 and pneumonia was scored on a scale of 0 to 3
LSC1 HSC1 P-values5
LP2 NP2 LP NP
Item AA-B3 AA-S3 AA-B AA-S AA-B AA-S AA-B AA-S SEM4 SC CP AA SCtimesCP SCtimesAA CPtimesAA SCtimesCPtimesAA
No of pens6 9 9 9 9
8 8 8 8
BW in kg7 1097 1080 1128 1143
1081 1119
1131 1163 185 040 00007 020 098 017 062 048
Carcass weight kg 847 823
864 882
820 857
863 888 155 078 0001 020 095 012 049 023
Muscle mm7 554 556
553 591
553 566
558 566 090 078 012 0008 019 042 018 007
Backfat mm7 153 139
133 129
147 143
134 137 033 045 lt0001 0047 025 007 008 088
Lean meat 7 581 589
593 597
584 587
592 591 023 053 lt0001 003 026 011 013 090
Dressing 771 762
766 772
759 766
763 764 035 018 051 063 073 025 032 002
Pleuritis score8 044 050
059 043
015 021
012 033 008 lt0001 043 051 096 010 087 009
Pleuritis lung 9 182 126
255 104
039 096
006 036 060 0004 039 077 083 049 066 058
Pneumonia score8 053 065
079 074
094 080
086 057 015 032 065 033 002 007 016 083
Pneumonia lung 9 142 126 317 214 181 193 248 070 140 078 022 015 012 027 016 046
Table 28 Apparent fecal digestibility () of DM and N in fattening boars kept under different sanitary conditions and fed 1 of 4 experimental diets with either a low or normal protein level and a basal or supplemented AA profile (bold P-values are significant)
1LSC = low sanitary conditions HSC = high sanitary conditions 2LP = low CP concentration diet NP = normal CP concentration diet 3AA-B = basal dietary AA profile AA-S = supplemented dietary AA profile containing 20 more Met Thr and Trp compared with the basal profile 4SEM = pooled SEM Means are presented as least square means 5 SC = sanitary conditions Considered significant when P le 005 6Results are presented as average values of measurement of digestibility at 3time points once in each of the 3 experimental phases 7A pen contained 9 pigs
LSC1 HSC1
LP2 NP2 LP NP P-values5
Item AA-B3 AA-S3 AA-B AA-S
AA-B AA-S
AA-B AA-S SEM4 SC CP AA Ph6 SCtimesCP SCtimesAA CPtimesAA SCtimesCPtimesAA
No of pens7 4 4
4 4
4 4
4 4
DM 881 885
879 886
888 889
883 885 016 005 010 003 lt0001 021 019 051 070
N 823 821 829 831
836 834
842 831 043 002 014 028 lt0001 031 030 062 031
Chapter 2
47
DISCUSSION
The main objective of the present experiment was to evaluate under practical conditions if
diets with low or normal CP level and basal or supplemented Met Thr and Trp have
differential effects on pig performance and immune status at different sanitary conditions
Effect of sanitary conditions on performance and immune status A contrast in sanitary
conditions was generated by imposing a combination of differences in hygiene antibiotic
treatment deworming and a vaccination protocol all applied to piglets originating from
the same farm Over the duration of the experiment HSC pigs showed greater ADG (50 gd)
and GF (0013 kgkg) than LSC pigs Low sanitary condition pigs had greater serum
haptoglobin levels and greater KLHndashIgG titers than HSC pigs This indicates that LSC pigs had
a more active immune system compared with HSC pigs In addition at slaughter higher
pleuritis scores were observed in LSC pigs compared with HSC pigs Taken together the
absence of clinical signs of illness of pigs in either treatment group and the lower ADG and
GF elevated haptoglobin concentrations increased KLH-specific IgG titers greater pleuritis
occurrence and oral fluid samples positive for PCV2 in the grower and finisher phases in
the LSC groups illustrate a difference in subclinical health status between the LSC and HSC
pigs (Le Flocrsquoh et al 2006 van den Berg et al 2007 Pintildeeiro et al 2009) We expected that
the sanitary regimes used in our study would affect PigMAP and haptoglobin
concentrations in a similar way as these are both considered to be positive acute-phase
proteins and are expected to increase in response to immune stimulation (Murata et al
2004) Haptoglobin appeared more responsive to the difference in sanitary conditions than
PigMAP which is in line with Heegaard et al (1998) and Kampman-van de Hoek et al
(2016) In addition PigMAP levels found here (014 gL serum) were low compared with the
values found by Pintildeeiro et al (2009) and Kampman-van de Hoek et al (2016 09 and 14
gL serum respectively) whereas the haptoglobin concentrations reported by these
authors were similar to values reported in the present study
The KLH antigen is a relevant antigen to measure Nab levels as pigs had no previous
exposure to KLH Natural antibodies are defined as antigen-specific antibodies that are
present in the absence of intentional immunization with specific antigens (KLH in this case
Star et al 2007) The IgG titer against KLH was greater for LSC pigs than for HSC pigs
Because Nab play a role in the first line of defense against pathogens the increase in Nab
levels might be an adaptive response of the pigs to the higher infection pressure at LSC
Keyhole limpet hemocyaninndashspecific antibodies were shown to be cross-reactive with
antigens of pathogens (Hamilton et al 1999) Therefore it can not be excluded that
antigen specific Nab are products of adaptive immune responses and cross-reactive with
structurally related antigens Specific memory B cells were shown to be activated in a
polyclonal but antigen-independent way (Lanzavecchia et al 2006) This way of activation
Chapter 2
48
is triggered by nonspecific microbial-associated molecular patterns such as
lipopolysaccharide or bacterial or viral nucleotide motifs This B cell activation mechanism is
likely responsible for the lifelong presence of circulating specific antibodies which forms an
important part of the first line of defense It can easily be envisaged that memory B cells of
pigs under LSC become more activated by microbial associated molecular patterns than
under HSC resulting in higher levels of KLH-specific IgG levels For IgM titers against KLH
there were no differences between LSC and HSC pigs In the study of Ploegaert et al
(2010) a similar result in IgM and IgG Nab was found Ploegaert et al (2010) studied
genetic and phenotypic correlation of Nab titers in dairy cattle and found greater estimates
for environmental variation in the IgG than in the IgM isotype of Nab Most probably the
LSC in the present study as an environmental factor stimulated KLH-specific IgG responses
Immunoglobulin M titers are believed to be influenced by genetic factors (Ploegaert et al
2010) which explains the absence of differences in IgM against KLH between sanitary
regimes
As the HSC pigs were vaccinated against several pathogens in their first 10 wk of life
vaccination and or antibiotic treatment might have modulated immune functions of these
animals Our results show that despite the vaccination of the HSC pigs LSC pigs had
significantly higher values for haptoglobin and IgG antibodies against KLH showed reduced
ADG and GF and had significant higher pleuritis scores indicating that the effects of the
LSC conditions outweighed the potential effects of the vaccinations or antibiotic treatment
of the HSC pigs However the vaccinations of the HSC pigs may have reduced the
immunological contrasts between the pigs kept under the different sanitary conditions If
this is the case the observed interactions between diet and sanitary conditions could even
be larger when vaccinations are omitted In addition vaccinations or antibiotic treatment
may have affected other (undetermined) immune parameters as well
Sanitary conditions and growth performance At start of the experiment the BW of LSC pigs
was 11 kg greater compared with that of HSC pigs likely related to the vaccination
program of the HSC pigs prior to arrival at the experimental farm During the starter phase
HSC pigs compensated for this lower starting weight or the ADG of the LSC pigs was
negatively influenced by the LSC
A lower ADG of LSC pigs was also found in other studies evaluating a contrast in sanitary
conditions (Williams et al 1997 Le Flocrsquoh et al 2009 Pastorelli et al 2012a) This
decreased ADG can be explained by the competition for use of nutrients between the
immune system and for use in deposition in organs and body tissues In general it is
perceived that use by the immune system has a high priority (Humphrey and Klasing 2004
Le Flocrsquoh et al 2004) From a meta-analysis Pastorelli et al (2012b) concluded that
themajor portion of the reduction in ADG (122 lower ADG of the total 163 lower ADG
in pigs in poor housing conditions compared with unchallenged animals) was related to a
Chapter 2
49
decreased feed efficiency (in Pastorelli et al (2012b) indicated as ldquomaintenancerdquo) rather
than to a decrease in feed intake This was also observed in the present experiment where
GF was affected but ADFI was not influenced by sanitary conditions The former indicates a
greater maintenance requirement or a lower growth efficiency for LSC pigs as suggested by
Pastorelli et al (2012b)
Signs of respiratory problems such as pleuritis or pneumonia are related to reduced
performance (Saco et al 2011) The LSC pigs had greater scores for pleuritis and greater
percentage of lung surface with pleuritis at slaughter compared with HSC pigs which might
have negatively affected growth and GF of LSC pigs From the meta-analysis of Pastorelli et
al (2012b) it appeared that a reduction in ADFI is the major contributor to reduced ADG in
case of respiratory problems In contrast in our study ADFI is not the major contributor to
reduced ADG indicating that respiratory problems are likely not the cause of the decrease
in GF in LSC pigs or that conclusions about the respiratory problems drawn by Pastorelli et
al (2012b) are not representative for our study Pastorelli et al (2012b) used many
different challenge studies for the meta-analysis differing from studies conducted under
more practical conditions such as the present study
The greater GF of the HSC pigs might partly be due to a greater apparent total N digestion
in these animals compared with LSC pigs When assuming similar postabsorptive
efficiencies for absorbed AA the observed increase in N digestibility would typically explain
approximately 20 of the observed increase in ADG hence leaving 80 unaccounted for
Differences in ATTD for N correspond with results by Kampman-van de Hoek et al (2016)
who found a reduction in ATTD for N of 37 in LSC growing pigs compared with HSC pigs
(P le 001) The reduced ATTD for N might be due to intestinal infections intestinal damage
or an increased digesta passage rate (Sandberg et al 2006 Pastorelli et al 2012b) The
small difference found in ATTD of DM might suggest that the ATTD of GE also differed to a
similar extent
Greater ADG and GF were expected for NP-fed pigs compared with the LP-fed pigs It is
well known that additional AA under conditions where AA are limiting but sufficient energy
is available lead to greater ADG and improved GF (Noblet et al 1987) Supplementation of
extra AA by increase in dietary CP (LP vs NP) or by specifically supplementing Met Thr and
Trp (AA-B vs AA-S diet type) resulted in increased ADG suggesting that one of these AA
was limiting The increased GF in AA-S pigs vs AA-B pigs particularly in LSC pigs (SC times AA
interaction Fig 21B) confirms our hypothesis that the dietary AA-S profile better matches
the AA requirements of pigs under LSC It should be noted however that this effect was
not yet present in the starter phase Our results are in accordance with other studies that
show that immune stimulation by different challenges lead to increased requirements for
specific AA compared with unchallenged pigs (Grimble and Grimble 1998 Le Flocrsquoh et al
2004 Klasing 2007 Rakhshandeh et al 2014) As a consequence these animals require
more AA for their immune system The increased demand for these AA (Met Thr and Trp)
Chapter 2
50
for LSC pigs was expected to be greater for pigs fed the LP This interaction however was
absent Therefore the results of our study do not confirm our hypothesis that at low levels
of protein intake the requirements for Thr Trp and Met relative to Lys are increased As
illustrated by the meta-analysis by Pastorelli et al (2012b) the type of challenge has a
major impact on the response of pigs The contrast in sanitary conditions as applied in our
study illustrates that also in absence of clinical disease requirements for Met Thr and Trp
are persistently affected over the entire weight range This is in agreement with
observations by Kim et al (2012) for Met using a repeated LPS model but not in a study by
de Ridder et al (2012) for Trp also using a repeated LPS model in which the response to
incremental intake of Trp was demonstrated to be transient Dietary protein concentration
did not affect ADFI in our study Apparently the exchange of protein for starch did not
affect the satiating potential of the diets This is in agreement with Le Bellego and Noblet
(2002) and Kerr et al (2003) however research in humans has indicated satiating effects
of dietary proteins to exceed that of carbohydrates and fats (Andersen and Moore 2004)
A remarkable result is the interaction between SC and AA profile in ADFI particularly
observed during the starter phase High sanitary condition AA-S pigs had greater ADFI
compared with HSC AA-B pigs whereas pigs in LSC ate the same amount regardless of AA
supplementation The greater ADFI for HSC AA-S pigs resulted in a tendency for ADG in the
same direction as the change in ADFI This result illustrates that pigs in HSC were probably
more limited in their growth by the AA-B profile than LSC pigs receiving the same profile
which was expected to be the other way around due to the effect of immune stimulation of
pigs housed in LSC We speculate that 1 of the 3 supplemented AA probably Met has
restricted growth particularly inhibiting HSC pigs to exploit their full ADG potential
following a period of restricted growth before the start of the trial Methionine is thought
to be the limiting AA because the MetLys ratio deviates most from recommended values
(eg CVB 2011) compared with Thr and Trp The growth restriction in HSC pigs before the
start of the trial was possibly caused by the vaccination strategy and illustrated by a lower
BW of HSC pigs at the onset of the trial The AA profile of the basal diets may not have been
sufficient to support compensatory growth following a period of growth restriction
Dietary protein effect on immune status Increasing the dietary protein concentration
increased serum haptoglobin concentrations in LSC pigs but not in HSC pigs The effect of
protein scarcity on total serum protein concentrations has been demonstrated in mice
(Cooper et al 1974) Houdijk et al (2007) found a reduced C-reactive protein and
haptoglobin response for infected pigs fed a low protein diet This may reflect a sensitive
response of acute-phase proteins to protein scarcity (Houdijk et al 2007) or a high priority
for the use of AA for protein gain in young pigs occurring at the expense of the synthesis of
haptoglobin It is unexpected that this interaction was not observed for WBC counts which
were consistently higher for LP pigs compared with NP pigs (P = 002) being unaffected by
Chapter 2
51
SC Possible differences in migration of WBC into the lymphatic system or tissues
complicates clear conclusions on this point (Ganusov and Auerbach 2014 Marelli-Berg et
al 2010)
Dietary AA effect on immune status Supplementation of AA in diets has been shown to
influence the immune system by increased variation of lymphocytes increased production
of antibodies and cytokines and activation of lymphocytes natural killer cells and
macrophages (Daly et al 1990 Li et al 2007 Negro et al 2008) Although increasing the
dietary protein concentration reduced monocyte counts supplementation of Met Thr and
Trp increased monocyte counts regardless of SC Elevated levels of Trp in the AA-Sndashfed pigs
might have stimulated production of monocytes as Trp is known to play a role in
functionality of monocytes and lymphocytes (Melchior et al 2004) The administration of
300 mg Trp to rats increased monocyte phagocytosis and the innate immune response
(Esteban et al 2004) Overall there was no clear interaction for sanitary conditions and AA
profile present on the measured blood parameters
In summary poor sanitary conditions imposed in our study in a practical setting reduced
ADG over the entire BW range of 17 to 110 kg Low sanitary conditions increased pleuritis
scores at slaughter and increased indicators for the innate immune response and serum
haptoglobin concentrations The vaccination strategy for the HSC pigs in early life may have
triggered a compensatory performance response (particularly ADFI) during the starter
phase Dietary supplementation of Met Thr and Trp improved the GF particularly under
LSC illustrating that dietary requirements for these AA are affected by sanitary conditions
Furthermore this study provides indications that dietary protein concentration and Met
Thr and Trp supplementation modify immune status Our study suggests that dietary
supplementation of Met Thr andor Trp in addition to provision of AA for covering basal
requirements for protein deposition is beneficial for animal performance particularly
under poor sanitary conditions Further research should focus on defining determinants of
sanitary status and identification of the requirement of individual AA to be supplemented
Acknowledgements Funding through Dutch Feed4Foodure consortium is gratefully
acknowledged The authors thank H van Diepen and J Kuipers for their advice and support
on formulation of the experimental diets The authors thank F van den Berg the staff of
Compaxo Zevenaar BV G de Vries Reilingh and the staff of Wageningen UR Livestock
Research for their contributions
Chapter 2
52
REFERENCES Andersen G H and S E Moore 2004 Dietary proteins in the regulation of food intake and body weight in humans J Nut
134974S-979S Batterham E S L M Andersen D R Baigent and E White 1990 Utilization of ileal digestible amino acids by growing pigs effect
of dietary lysine concentration on efficiency of lysine retention Br J Nutr 6481-94 Bikker P M W A Verstegen and M W Bosch 1994 Amino acid composition of growing pigs is affected by protein and energy
intake J Nutr 1241961-1969 Burke KA RF Nystrom and B C Johnson 1951 The role of methionine as methyl donor for choline synthesis in the chick J Bio
Chem188723-728 Cooper W C R A Good and T Mariani 1974 Effects of protein insufficiency on immune responsiveness Am J Clin Nutr 27647-
664 Centraal Veevoeder Bureau (CVB) 2011 Chemical compositions and nutritional values of feed ingredients CVB Lelystad The
Netherlands Daly J M J Reynolds R K Sigal J Shou and M D Liberman 1990 Effect of dietary protein and amino acids on immune
function Crit Care Med 18S85-S94 de Koning D B E P C W Damen M G B Nieuwland E M van Grevenhof W Hazeleger B Kemp and H K Parmentier 2015
Association of natural (auto-) antibodies in young gilts with osteochondrosis at slaughter Livest Sci 176152-160 de Ridder K C L Levesque J K Htoo and C F M de Lange 2012 Immune system stimulation reduces the efficiency of
tryptophan utilization for body protein deposition in growing pigs J Anim Sci 903485-3491 Engel B E Lambooij WG Buist and P Vereijken 2012 Lean meat prediction with HGP CGM CSB-Image-Meater with
prediction accuracy evaluated for different proportions of gilts boars and castrated boars in the pig population Meat Sci 90338-344
Esteban S C Nicolaus A Garmundi R Rial A Rodriacuteguez E Ortega and C Ibars 2004 Effect of orally administered l-tryptophan on serotonin melatonin and the innate immune response in the rat Mol Cell Biochem 26739-46
Figueroa J L AJ Lewis P S Miller R L Fischer R S Goacutemez and R M Diedrichsen 2002 Nitrogen metabolism and growth performance of gilts fed standard corn-soybean meal diets or low-crude protein amino acid-supplemented diets J Anim Sci 802911-2919
Ganusov VV and JA Auerbach 2014 Mathematical modelling reveals kinetics of lymphocyte recirculation in the whole organism PLOS Comput Biol 10 e1003586
Gloaguen M N Le Flocrsquoh E Corrent Y Primot and J van Milgen 2014 The use of free amino acids allows formulating very low crude protein diets for piglets J Anim Sci 92637-644
Grimble R F and G K Grimble 1998 Immunonutrition role of sulfur amino acids related amino acids and polyamines Nutr 14605-610
Hamilton JV PL Chiodini PG Fallon and MJ Doenhoff 1999 Periodate-sensitive immunological cross-reactivity between keyhole limpet haemocyanin (KLH) and serodiagnostic Schistosoma mansoni egg antigens Parasit 11883-89
Heegaard P M A Stockmarr M Pintildeeiro R Carpintero F Lampreave F M Campbell P D Eckersall M J Toussaint E Gruys and NS Sorensen 2011 Optimal combinations of acute phase proteins for detecting infectious disease in pigs Vet Res 1742-50
Houdijk J G M F M Campbell P D Fortomaris P D Eckersall and I Kyriazakis 2007 Effects of sub‐clinical post‐weaning colibacillosis and dietary protein on acute phase proteins in weaner pigs Livest Sci 108 182-185
Humphrey B D and K C Klasing 2004 Modulation of nutrient metabolism and homeostasis by the immune system Worlds Poult Sci J 6090-100
International organisation for standardisation (ISO) 1999 Animal feeding stuff-Determination of moisture and other volatile matter content ISO 6496 Int Organ Stand Geneve Switzerland
International Organization for Standardization (ISO) 2005a Animal feeding stuffs ndash Determination of nitrogen content and calculation of crude protein content ndash Part 1 Kjeldahl method ISO 5983 Int Organ Stand Geneve Switzerland
International Organization for Standardization (ISO) 2005b Animal feeding stuffs ndash Determination of amino acids content ISO 13903 Int Organ Stand Geneve Switzerland
International Organization for Standardization (ISO) 2005c Animal feeding stuffs ndash Determination of tryptophan content ISO 13903 Organ Stand Geneve Switzerland
Jansman A J M W Smink P van Leeuwen and M Rademacher 2002 Evaluation through literature data of the amount and amino acid composition of basal endogenous crude protein at the terminal ileum of pigs Anim Feed Sci Tech 9849-60
Jansman A J M J T M van Diepen and D Melchior 2010 The effect of diet composition on tryptophan requirement of young piglets J Anim Sci 881017-1027
Kampman-van de Hoek E P Sakkas W J J Gerrits J J G van den Borne AJM Jansman 2015 Induced lung inflammation and dietary protein supply affect nitrogen retention and amino acid metabolism in growing pigs Br J Nutr 113414-425
Kampman-van de Hoek E A J M Jansman J J G C van den Borne C M C van der Peet-Schwering H van Beers-Schreurs and W J J Gerrits 2016 Dietary amino acid deficiency reduces the utilization of amino acids for growth in growing pigs after a period of poor health J Nutr 14651-58
Kerr B J and R A Easter 1995 Effect of feeding reduced protein amino acid-supplemented diets on nitrogen and energy balance in grower pigs J Anim Sci733000-3008
Chapter 2
53
Kerr B J L L Southern T D Bidner K G Friesen and R A Easter 2003 Influence of dietary protein level amino acid supplementation and dietary energy levels on growing-finishing pig performance and carcass composition J Anim Sci 813075-3087
Kim J C B P Mullan B Frey H G Payne and J R Pluske 2012 Whole body protein depositions and plasma amino acid profiles in growing andor finishing pigs fed increasing levels of sulfur amino acids with and without Escherichia coli lipopolysaccharide challenge J Anim Sci 90362-365
Klasing K C 2007 Nutrition and the immune system Brit Poult Sci 48525-537 Klasing K C and B J Johnstone 1991 Monokines in growth and development Poultry Sci 701781-1789 Knowles T A L L
Southern and T D Bidner 1998 Ratio of total sulfur amino acids to lysine for finishing pigs J Anim Sci 761081-1090 Kotb A R and T D Luckey 1972 Markers in nutrition Nutr Abs Rev 42813-845 Lanzavecchia A N Bernasconi E Traggiai CR Ruprecht D Corti and F Sallusto 2006 Understanding and making use of human
memory cells Immunol Rev 211 303-309 Le Bellego L and J Noblet 2002 Performance and utilization of dietary energy and amino acids in piglets fed low protein diets
Livest Prod Sci 7645-58 Le Floch N F Gondret J J Matte and H Quesnel 2012 Towards amino acid recommendations for specific physiological and
patho-physiological states in pigs Proc Nutr Soc 71425-432 Le Floch N C Jondreville J J Matte and B Seve 2006 Importance of sanitary environment for growth performance and plasma
nutrient homeostasis during the post-weaning period in piglets Arch Anim Nutr 6023-34 Le Floch N D Melchior and C Obled 2004 Modifications of protein and amino acid metabolism during inflammation and
immune system activation Livest Prod Sci 8737-45 Le Flocrsquoh N L Le Bellego J J Matte D Melchior and B Segraveve 2009 The effect of sanitary status degradation and dietary
tryptophan content on growth rate and tryptophan metabolism in weaning pigs J Anim Sci 871686-1694 Le Flocrsquoh N D Melchior and B Segraveve 2008 Dietary tryptophan helps to preserve tryptophan homeostasis in pigs suffering from
lung inflammation J Anim Sci 863473-3479 Li P Y L Yin D Li S W Kim and G Wu 2007 Amino acids and immune function Br J Nutr 98237-252 Marelli-Berg F M H Fu F Vianello KTokoyoda and A Hamann 2010 Memory T-cell trafficking new directions for busy
commuters Immunol 130158-165 Melchior D B Segraveve and N Le Flocrsquoh 2004 Chronic lung inflammation affects plasma amino acid concentrations in pigs J Anim
Sci 821091-1099 Moughan P J 1998 Protein metabolism in the growing pig In Kyriazakis I Editors A Quantitative Biology of the Pig CABI
Publishing Oxon UK 13 299-331Murata H N Shimada and M Yoshioka 2004 Current research on acute phase proteins in veterinary diagnosis an overview Vet J 16828-40
Myers W D P A Ludden V Nayigihugu and B W Hess 2004 Technical note a procedure for the preparation and quantitative analysis of samples for titanium dioxide J Anim Sci 82(1)179-183
Negro M S Giardina B Marzani and F Marzatico 2008 Branched-chain amino acid supplementation does not enhance athletic performance but affects muscle recovery and the immune system J Sports Med Phys Fitness 48 347
Noblet J Y Henry and S Dubois 1987 Effect of protein and lysine levels in the diet on body gain composition and energy utilization in growing pigs J Anim Sci 65717-726
NRC 2012 Nutritional requirement of swine 11th rev ed Natl Acad Press Washington DC Pastorelli H N Le Floch E merlot M C Meunier-Salauumln J van Milgen and L Montagne 2012a Sanitary housing conditions
modify the performance and behavioural response of weaned pigs to feed- and housing-related stressors Anim 6
1811-1820
Pastorelli H J van Milgen P Lovatto and L Montagne 2012b Meta-analysis of feed intake and growth responses of growing
pigs after a sanitary challenge Anim 6 952-961
Pintildeeiro C M Pintildeeiro J Morales M Andreacutes E Lorenzo M del Pozo M A Alava and F Lampreave 2009 Pig-MAP and haptoglobin concentration reference values in swine from commercial farms Vet J 179 78-84
Ploegaert T C W S Wijga E Tijhaar J J van der Poel T J G M Lam H F J Savelkoul H K Parmentier and J A M van Arendonk 2010 Genetic variation of natural antibodies in milk of Dutch Holstein-Friesian cows J Dairy Sci 935467-5473
Rakhshandeh A J K Htoo and C F M de Lange 2010 Immune system stimulation of growing pigs does not alter apparent ileal amino acid digestibility but reduces the ratio between whole body nitrogen and sulfur retention Livest Sci 13421-23
Rakhshandeh A J K Htoo N Karrow S P Miller and C F M de Lange 2014 Impact of immune system stimulation on the ileal nutrient digestibility and utilisation of methionine plus cysteine intake for whole-body protein deposition in growing pigs Br J Nutr 111101-110
Saco Y L Fraile M Gimeacutenez A Alegre R Loacutepez-Jimenez M Cortey J Segaleacutes and A Bossols 2011 Serum acute phase proteins as biomarkers of pleuritis and cranio-ventral pulmonary consolidation in slaughter-aged pigs Res Vet Sci 9152-57
Sandberg F B G C Emmans and I Kyriazakis 2006 A model for predicting feed intake of growing animals during exposure to pathogens J Anim Sci 841552-1566
Short F J P Gorton J Wiseman and K N Boorman 1996 Determination of titanium dioxide added as an inert marker in chicken digestibility studies Anim Feed Sci Technol 59(4)215-221
Star L M G B Nieuwland B Kemp and H K Parmentier 2007 Effect of single or combined climatic and hygienic stress on natural and specific humoral immune competence in four layer lines Poult Sci 861894-1903
van den Berg A J Danuser J Frey and G Regula 2007 Evaluation of the acute phase protein haptoglobin as an indicator of herd health in slaughter pigs Anim Welfare 16157-159
Chapter 2
54
Watkins LE DJ Jones DH Mowrey DB Anderson and EL Veenhuizen 1990 The effect of various levels of ractopamine hydrochloride on the performance and carcass characteristics of finishing swine J Anim Sci 683588-3595
Williams N H T S Stahly and D R Zimmerman 1997 Effect of level of chronic immune system activation on the growth and dietary lysine needs of pigs fed from 6 to 112 kg J Anim Sci 75 2481-2496
Wu G 2009 Amino acids metabolism functions and nutrition Amino acids 371-17
Chapter 2
55
SUPPLEMENTAL TABLE Supplemental Table I Dietary amino acid profiles relative to lysine on apparent ileal digestible level fed in combination with different dietary protein levels to pigs kept under different sanitary conditions
Amino acid AA-B profile1 AA-S profile1
Lysine 100 100
Methionine + cysteine 51 61
Threonine 59 71
Tryptophan 18 22
Arginine 87 87
Histidine 43 43
Isoleucine 53 53
Leucine 101 101
Phenylalanine 54 54
Valine 69 69 1 AA-B= basal AA profile based on Bikker 1994 Moughan 1998 Jansman et al 2002 NRC 2012 AA-S profile =supplemented profile contains basal profile with 20 extra Met Thr and Trp in ratio to Lys
Chapter 3
A link between damaging behaviour in pigs sanitary
conditions and dietary protein and amino acid supply
Yvonne van der Meer12 Walter JJ Gerrits1 Alfons JM Jansman4 Bas Kemp3 J Elizabeth Bolhuis3
PLoS one 2017 12 (5) e0174688
1Animal Nutrition Group Wageningen University Wageningen 6708 WD The Netherlands 2De Heus Animal Nutrition Ede 6717 VE The Netherlands
3Adaptation Physiology Group Wageningen University Wageningen 6708 WD The Netherlands
4Wageningen UR Livestock Research Wageningen 6708 WD The Netherlands
Chapter 3
58
ABSTRACT
The tendency to reduce crude protein (CP) levels in pig diets to increase protein efficiency
may increase the occurrence of damaging behaviours such as ear and tail biting
particularly for pigs kept under suboptimal health conditions We studied in a 2times2times2
factorial design 576 tail-docked growing-finishing entire male pigs in 64 pens subjected to
low (LSC) vs high sanitary conditions (HSC) and fed a normal CP (NP) vs a low CP diet (LP
80 of NP) ad libitum with a basal amino acid (AA) profile or supplemented AA profile with
extra threonine tryptophan and methionine The HSC pigs were vaccinated in the first nine
weeks of life and received antibiotics at arrival at experimental farm at ten weeks after
which they were kept in a disinfected part of the farm with a strict hygiene protocol The
LSC pigs were kept on the same farm in non-disinfected pens to which manure from
another pig farm was introduced fortnightly At 15 18 and 24 weeks of age prevalence of
tail and ear damage and of tail and ear wounds was scored At 20 and 23 weeks of age
frequencies of biting behaviour and aggression were scored for 10times10 min per pen per
week The prevalence of ear damage during the finisher phase (47 vs 32 of pigs P lt
00001) and the frequency of ear biting (13 vs 12 times per hour P = 003) were increased
in LSC compared with HSC pigs This effect on ear biting was diet dependent however the
supplemented AA profile reduced ear biting only in LSC pigs by 18 (SC times AA profile P lt
001) The prevalence of tail wounds was lower for pigs in LSC (013 plusmn 002) than for pigs in
HSC (022 plusmn 003) in the grower phase (P lt 0007) Regardless of AA profile or sanitary
conditions LP pigs showed more ear biting (+20 P lt 005) tail biting (+25 P lt 010)
belly nosing (+152 P lt 001) other oral manipulation directed at pen mates (+13 P lt
005) and aggression (+30 P lt 001) than NP pigs with no effect on ear or tail damage In
conclusion both LSC and a reduction of dietary protein increase the occurrence of
damaging behaviours in pigs and therefore may negatively impact pig welfare Attention
should be paid to the impact of dietary nutrient composition on pig behaviour and welfare
particularly when pigs are kept under suboptimal (sanitary) conditions
Chapter 3
59
INTRODUCTION
In the pig industry reduction of dietary protein contributes to the goal of making livestock
farming more nutrient efficient Reducing dietary protein level seems possible without
compromising the growth performance of pigs if supplementary dietary essential amino
acids (AA) are provided (Kerr and Easter 1995 Gloaguen et al 2014) It has been
suggested however that feeding diets with low dietary protein levels may increase the
occurrence of damaging behaviours such as ear and tail biting (Jericho and Church 1972
Jensen et al 1993) If particular nutrients are limiting for growth or immune functioning
pigs might increase their foraging behaviour and alter their feed preferences to satisfy their
nutritional needs (Jensen et al 1993) Indeed pigs provided a low-protein diet although
fed ad libitum showed more foraging activities than pigs fed a diet with adequate protein
levels (Jensen et al 1993) Pigs may in turn redirect their natural foraging and exploratory
behaviour to pen mates particularly when suitable rooting substrates are not or only
sparsely available The nosing chewing rooting and sucking directed at the tails ears and
other body parts of conspecifics may culminate in vigorous biting and as a consequence
might lead to wounds (Beattie et al 2001 Zonderland et al 2008) Once wounds have
developed biting behaviour may escalate particularly in pigs fed low-protein diets which
are even more attracted to blood (Fraser et al 1991)
Dietary AA imbalances have also been associated with injurious biting behaviour Several
studies suggest that pigs respond to a shortage of specific essential AA including
methionine (Met) threonine (Thr) and tryptophan (Trp) by adjusting their feed selection
behaviour accordingly (Ettle and Roth 2004 2005 Roth et al 2006 Ettle and Roth 2009)
Due to a relative shortage in AA foraging behaviour and redirected biting behaviour might
increase and blood may become more attractive In line with the latter McIntyre and
Edwards (2002) found that the preference to chew on a blood-soaked rope as opposed to a
water-soaked rope increased when pigs were fed a diet low in Trp The increased
preference for blood in pigs fed low-Trp diets may consecutively influence injurious biting
In support of this weanling pigs fed diets supplemented with free Trp in excess to
requirement bit less on the tails and ears of their pen mates (Martiacutenez-Trejo et al 2009)
Dietary protein deficiencies or AA imbalances may influence behaviour through their
effects on brain neurotransmitters as many of these are synthesized from particular AA
The effects of dietary Trp concentration for instance on aggressive behaviour and stress as
reported in numerous species (Gibbons et al 1979 Chamberlain et al 1987 Salomon et
al 1994 Winberg et al 2001 Lepage et al 2002) have been linked to its role as a
precursor of serotonin (5-hydroxytryptamine 5-HT) Recent studies have provided evidence
for a link between damaging biting behaviour and 5-HT Pigs had lowered blood platelet 5-
HT storage and higher blood platelet 5-HT uptake velocities in phases of life during which
they were classified as tail biters (Ursinus et al 2014a) Additionally Valros and Heinonen
Chapter 3
60
(2015) reported that the Trp and central 5-HT metabolism of tail biters was different from
that of victims and non-biters
Apart from dietary influences on injurious biting behaviour a poor health status has been
identified as one of the risk factors for this multifactorial problem (Schroslashder-Petersen and
Simonsen 2001 Taylor et al 2010) Respiratory disease and tail biting for example seem
to be associated at animal level (Kritas and Morrison 2007) and at farm level (Moinard et
al 2003) The exact nature of the relationship between health and biting behaviour is not
completely understood On the one hand a low health statusF or poor sanitary conditions
could lead to increased requirements for specific nutrients particularly those involved in
immune system activation such as Trp and in this way contribute to biting behaviour On
the other hand biting can also cause health problems as it frequently leads to
inflammatory responses (Munsterhjelm et al 2013) as supported by Heinonen et al (2010)
who found higher acute phase concentrations in blood in tail bitten pigs compared with
non tail-bitten control pigs Finally poor health and injurious biting could also partly reflect
suboptimal management feed or climatic conditions all of which are known to exacerbate
both health and behavioural problems (Moinard et al 2003 Edwards 2006 Zonderland et
al 2010) without necessarily being causally related Cause and effect are thus difficult to
disentangle in the health-biting relationships reported so far and to the best of our
knowledge no studies have been executed on the topic in which health status was
experimentally manipulated rather than only assessed
Reducing dietary protein concentrations on pig farms with poor health conditions may
therefore aggravate behavioural problems Therefore we studied the combined effects of
diverging sanitary conditions dietary protein level and AA profile on redirected biting
behaviours and tail and ear damage of pigs Performance and health parameters of the pigs
in the present study have been published elsewhere (van der Meer et al 2016)
ANIMALS MATERIALS AND METHODS
The experiment was approved by the Animal Care and Use Committee of Wageningen
University
Experimental design A 2 times 2 times 2 factorial design was applied with sanitary conditions (high
HSC or low LSC) dietary crude protein level (low LP or normal NP) and dietary AA profile
(basal AA-B or supplemented AA-S) as experimental factors at pen level
Animals and treatments In total 576 entire male tail-docked Topigs 20 times Tempo (Topigs
Helvoirt The Netherlands) piglets were selected on a commercial farm Half of the piglets
involved were subjected to the LSC and the other half to the HSC treatment The piglets for
both LSC and HSC were selected from the same farrowing rooms and were allocated per
Chapter 3
61
litter all boar piglets of a sow were selected for either LSC or HSC After weaning (mean
age 24 d) LSC and HSC pigs were group-housed in different rooms to prevent cross-
vaccination The HSC piglets and not LSC piglets were vaccinated against Mycoplasma
hyopneumoniae porcine circovirus type 2 porcine reproductive and respiratory syndrome
Lawsonia intracellularis Actinobacillus pleuropneumoniae and influenza A virus in the first
nine weeks of age as specified in van der Meer et al (2016)
The HSC and LSC pigs were transported separately to another commercial farm where the
experiment was conducted (Vlierbos VOF Neerloon The Netherlands) with half of the
pigs at 10 weeks of age and the other half at 11 weeks of age (two batches of 288 LSC
144 HSC 144) Upon arrival pigs were allocated to their pen based on body weight (BW) in
order to minimize variation in BW between pens (mean BW plusmn standard error of the mean
LSC batch 1 173 plusmn 006 kg LSC batch 2 181 plusmn 007 kg HSC batch 1 159 plusmn 007 kg HSC
batch 2 174 plusmn 007 kg) In total 64 concrete pens were used each pen had a partly slatted
floor and contained nine pigs (08 m2 space per pig) All pens were distributed over eight
rooms four rooms we selected for LSC pigs and four rooms for HSC pigs Per room each
experimental diet was distributed to two pens resulting in one repetition of treatment
combination per room Distribution of experimental diet per room was done randomly Per
treatment combination there were eight replicates (pens) Each room had separate manure
pits and separate negative pressure mechanical ventilation regulation The temperature in
the rooms was set at 24degC at start of the experiment and was decreased to 20degC during the
experiment The LSC rooms were not cleaned after containing a previous batch of
commercial finisher pigs that left the facility two days before and no specific hygiene
protocol was applied to these rooms Starting at five weeks after arrival fresh manure of
another commercial pig farm was spread in the LSC pens every two weeks until end of the
experiment to enhance antigenic pressure The LSC pigs did not receive any preventative
medication In contrast HSC pigs received a dose of antibiotics (Fenflor AUV Veterinary
Services BV Cuijk the Netherlands 1 mLpig intramuscular at day 1 and 3 of the experi-
ment) after arrival at 10 weeks of age and were placed in four disinfected rooms in a
distinct part of the pig facility with a strict hygiene protocol see van der Meer et al (2016)
Animals were monitored for the complete fattening period divided in three phases ie
starter (0-34 d) grower (35-49 d) and finisher phase (from day 50 until a target average
pen BW of 110 kg)
Diets feeding and analysis Pens were allocated to a diet with either a low crude protein
(CP) level (LP) or a normal CP level (NP) each having either a basal AA-profile or a
supplemented AA-profile resulting in four different diets LP-AA-B LP-AA-S NP-AA-B NP-
AA-S The apparent ileal digestible (AID) Lys MJ NE ratio of the diets was reduced in each
subsequent phase of the experiment to follow a three phase feeding system For the NP
diet the lysine (Lys) MJ NE ratio was set to 95 of the requirement values for boars as
published by NRC (2012) to prevent dietary energy to be limiting for growth performance
Chapter 3
62
The respective diets contained 090 g AID Lys MJ net energy (NE) for the starter phase
081 g AID Lys MJ NE for the grower phase and 075 g AID Lys MJ NE for the finisher
phase The LP diets were created by decreasing the inclusion level of all protein-containing
ingredients by 20 in exchange for maize starch and cellulose resulting in diets with 072 g
AID Lys MJ NE for the starter phase 065 g AID Lys MJ NE for the grower phase and 060
g AID LysNE for the finisher phase
The basal AA-profile (AA-B) was designed to cover the AA requirements for body protein
deposition (Bikker 1994 Le Bellego and Noblet 2002 NRC 2012) and to cover AA losses
associated with basal endogenous proteins in ileal digesta (Jansman et al 2002 NRC
2012) AA losses in skin and hair (NRC 2012) and AA losses related to cell and tissue
turnover in the body (Moughan 1998) as specified in van der Meer et al (2016) The
supplemented AA-profile (AA-S) was derived from the AA-B profile by increasing the Met
Thr and Trp ratio relative to Lys on a AID basis by 20 These AA are believed to be
increasingly important as building blocks for synthesis of specific proteins such as acute
phase proteins synthesized in case of immune system activation (Melchior et al 2004 Le
Flocrsquoh et al 2008 Rakhshandeh et al 2010 Le Floch et al 2012) and effects on immune
processes (Wu 2009) The composition of the diets is shown in Table 25 and the AA-
profiles are shown in supplementary Table I All diets were isocaloric on a NE basis and
provided as pellets during the experiment Per pen one single space feeder and one nipple
drinker were present and feed and water were offered ad libitum
Diets were analyzed for AA composition by acid hydrolysis at 110degC for 23 h and ion-
exchange chromatography with post-column derivatization with ninhydrin (ISO 2005a) and
Trp by alkaline hydrolysis at 110degC for 20 h ion-exchange chromatography with
fluorescence detection (ISO 2005b)
Behavioural observations Pigs were observed at 20 (grower phase) and 23 (finisher phase)
weeks of age using behaviour sampling Frequencies of the behaviours described in Table
31 were recorded during live observations from 800-1220 h and 1400-1650 h during
two consecutive days In case of continuous biting for gt 30 sec after 30 sec a new
occurrence was scored Animals in each pen were observed 10 times 10 min resulting in 100
min of observations per pen per week of observation Distribution of the 10-min
observation blocks over the day and over the two observation days was balanced for
experimental treatments Observers were blind to the dietary treatments and divided over
the pens balanced for treatment All four observers were trained by the same person
before behavioural observations
Damage and wound scores Tail damage was recorded at 15 18 and 24 weeks of age as
indicator of being tail bitten using the following scores as described in Ursinus et al
(2014b) 1 No tail damage 2 Bite marks thin scratches The individual bite marks have the
size of a pinhead 3 Small wound clearly visible lesion with fresh or dried blood on the (top
Chapter 3
63
of the) tail but the tail retains its entire length 4 Medium wound clearly visible lesion with
fresh or dried blood on the tail and the tail is partly shortened 5 Severe wound lesion with
fresh or dried blood the tail is completely removed Ear damage was recorded together
with the tail damage scoring Only damage to the backside of the ears was recorded
Scoring was done as follows 1 No ear damage 2 Top or bottom lesions thin scratches 3
Top and bottom lesions thin scratches 4 Severe damage part of ear is missing These
scores were determined as described by Ursinus et al (2014b)
Table 31 Ethogram
Behaviour Description
Oral manipulation of group mates Tail biting Nibbling sucking or chewing the tail of a pen mate Ear biting Nibbling sucking or chewing the ear of a pen mate Manipulating other Nibbling sucking or chewing of another part of the body of a pen mate Aggression Fighting Ramming or pushing a pen mate with or without biting the other pen
mate Can be either mutual or unilateral Fighting at feeder Pushing head knocking or biting a pen mate at the feeder Belly nosing Rubbing the belly of a pen mate with up and down snout movements Mounting Standing on hind legs while having front legs on other pigs body Enrichment object biting Chewing on an enrichment object provided in the pen The enrichment
object was a chain with a hard plastic pipe fixed at the top of the pen wall
Cases of ear necrosis were given a score of 5 It is not fully known whether ear necrosis is a
result of ear biting Recent epidemiological studies point to a possible infection route for
ear necrosis through biting however the spread of ear necrosis in pig herds is difficult to
explain solely by opportunistic bacterial infections (Pringle et al 2009 Karlsson et al
2013) Damage scores of both ears were recorded and the average score of both ears was
used for further analysis resulting in one value per pig per recording week for further
analysis Pigs received a binary score for both tail and ear damage (0) no damage (score1)
vs (1) damage (score gt1) per phase Similarly pigs received a binary score for having (0) no
wound (score lt 3 for tails and score lt 4 for ears) vs (1) a wound (score gt 2 for tails and gt 3
for ears) per phase These scores were averaged per pen and phase and used for further
analysis In case of a score gt 4 for tail damage or ear damage pigs were individually treated
with a iodine spray and another wound spray to prevent bacterial infections (MS jodium
Chapter 3
64
bruin and MS protect verband spray MS Schippers BV Bladel The Netherlands) No pigs
were removed from the experiment
Statistical analysis Statistical analyses was performed using SAS (SAS 93 Institute Inc)
Behavioural frequencies were averaged per pen and phase (grower and finisher) before
analysis Residuals of the response variables were checked for normality and if needed
square root transformed All variables for behavioural frequencies were analyzed in a
Mixed Model that included sanitary condition dietary CP level dietary AA profile batch
phase sanitary condition times dietary CP level and sanitary conditions times dietary AA profile as
fixed effects Other interactions were deleted from the model when not significant The
effect of room nested within sanitary conditions was used as a random effect to correct for
differences between rooms
To analyze damage scores the prevalence of damage was analyzed by expressing damage
as a 0-1 variable (0 = no damage 1 = damage) per pig per phase The pen-averaged
prevalences were analyzed per phase by a Mixed model that included sanitary condition
dietary CP level dietary AA profile batch sanitary condition times dietary CP level and sanitary
conditions times dietary AA profile as fixed effects Other interactions were deleted from the
model when not significant The effect of room nested within sanitary condition was used
as a random effect to correct for differences between rooms The prevalence of wounds
was analyzed by expressing wounds as a 0-1 variable (0 = no wound 1 = wound) per pig per
phase and expressed as prevalence per pen per phase The pen-averaged wound
prevalences were analyzed per phase with the same model as the pen averaged damage
prevalences All values are presented as raw means plusmn standard error of the mean (SEM)
RESULTS
Behavioural observations Oral manipulation of group mates occurred more often (41 plusmn 04
times per pig per hour) than chewing on enrichment object (10 plusmn 02) and aggression (24 plusmn
03) Oral manipulation was less directed at tails (03 plusmn 01) than ears (15 plusmn 02) or body
parts other than tails or ears (23 plusmn 03) Frequency of belly nosing was rather low (01 plusmn
01) and the same held for mounting (04 plusmn 01)
Frequency of total oral manipulation of pen mates (chewing or nibbling tail ear or other
body parts) was higher for LSC than for HSC pigs (45 vs 38 times per pig per hour P le
005 Table 32) Ear biting was affected by the interaction between sanitary conditions and
dietary AA treatment (P le 005 Fig 32) Ear biting was more frequently recorded for LSC
pigs fed AA-B diets compared with LSC pigs fed AA-S diets (19 vs 15 times per hour)
whereas frequency of ear biting in HSC pigs was similar for pigs fed the AA-B diet and the
AA-S diets (12 vs 13 times per hour) For tail biting behaviour also an interaction between
sanitary conditions and dietary AA level was found (P le 005) Tail biting was more
Chapter 3
65
frequently recorded in HSC pigs fed AA-B diets compared with HSC pigs fed AA-S diets (04
plusmn 01 vs 03 plusmn 01 times per hour) whereas dietary AA level did not affect frequency of tail
biting in LSC pigs (04 plusmn 01 vs 04 plusmn 01 times per hour) Sanitary conditions dietary AA
profile or their interaction did not affect chewing on an enrichment object or aggressive
behaviour
Apart from sanitary conditions and dietary AA profile also dietary protein level affected the
pigsrsquo behaviour The LP fed pigs showed higher frequencies of total oral manipulation of
group mates (44 plusmn 04 vs 38 plusmn 04 times per hour) ear biting (16 plusmn 02 vs 13 plusmn 032 times
per hour) manipulation of other body parts (25 plusmn 03 vs 22 plusmn 03 times per hour)
enrichment object biting (12 plusmn 02 vs 08 plusmn 02 times per hour) total aggression (27 plusmn 03
vs 21 plusmn03 times per hour) fighting (13 plusmn 02 vs 09 plusmn 02 times per hour) belly nosing
(02 plusmn 01 vs 01 plusmn 00 times per hour) (All P le 005 Table 32 Fig 31) and a tendency for
higher frequencies of tail biting than the NP fed pigs (04 plusmn 01 vs 03 plusmn 01 times per hour
005 le P le 010)
Pigs fed with the AA-B diet had higher frequencies of mounting than pigs fed the AA-S diet
(04 plusmn 01 vs 03 plusmn 01 times per hour P le 005) Mounting was recorded more for LP than
NP fed pigs in LSC (05 plusmn 01 vs 04 plusmn 01 times per hour) but less for LP than NP fed pigs in
HSC (03 plusmn 01 vs 04 plusmn 01 times per hour) (sanitary conditions times dietary protein level
interaction P le 005)
Table 32 Frequencies of behaviours collected by behaviour sampling during the grower and finisher phase in pigs kept under low or high sanitary conditions and provided with diets containing either low or normal protein levels and either a basal or a supplemented amino acid profile
LSC2 HSC2
LP3 NP3 LP NP p-values5
Behaviour1 AA-B4 AA-S4 AA-B AA-S AA-B AA-S AA-B AA-S SC CP AA batch SCtimesCP SCtimesAA
n 8 8 8 8 8 8 8 8
Oral manipulation of group mates 50 plusmn 04 45 plusmn 04 43 plusmn 04 42 plusmn 05 43 plusmn 03 40 plusmn 03 35 plusmn 04 33 plusmn 04
002 0002 023 00004 054 089
Tail biting 04 plusmn 01 04 plusmn 01 03 plusmn 00 03 plusmn 01 04 plusmn 00 03 plusmn 01 04 plusmn 01 02 plusmn 00 059 006 023 009 058 002
Ear biting 20 plusmn 02 16 plusmn 02 17 plusmn 02 14 plusmn 02 13 plusmn 02 14 plusmn 02 10 plusmn 01 12 plusmn 02 003 002 038 095 099 003
Manipulating other 26 plusmn 03 25 plusmn 03 23 plusmn 02 24 plusmn 03 26 plusmn 02 23 plusmn 02 21 plusmn 03 19 plusmn 02 019 004 047 lt0001 030 041
Chewing enrichment object 13 plusmn 02 13 plusmn 03 08 plusmn 02 08 plusmn 02 10 plusmn 02 12 plusmn 02 08 plusmn 02 06 plusmn 02 054 0002 099 048 059 087
Aggression 28 plusmn 03 28 plusmn 03 23 plusmn 03 21 plusmn 02 27 plusmn 03 23 plusmn 03 22 plusmn 03 16 plusmn 03 037 0001 014 065 095 029
Fighting 14 plusmn 02 12 plusmn 02 08 plusmn 01 09 plusmn 02 14 plusmn 02 13 plusmn 02 12 plusmn 02 07 plusmn 01 084 0001 017 035 080 022
Feeder fighting 14 plusmn 02 16 plusmn 02 15 plusmn 02 12 plusmn 02 13 plusmn 02 11 plusmn 01 10 plusmn 02 09 plusmn 02 025 011 041 023 072 074
Belly nosing 02 plusmn 01 03 plusmn 01 01 plusmn 00 01 plusmn 00 01 plusmn 00 02 plusmn 01 01 plusmn 00 00 plusmn 00 039 00003 039 009 079 073
Mounting 05 plusmn 01 04 plusmn 01 04 plusmn 01 03 plusmn 01 03 plusmn 01 02 plusmn 01 05 plusmn 01 03 plusmn 01 054 059 001 016 003 064 1Behaviours are expressed in frequencies per pig per hour observed In case of continuous behaviour a new bout was scored when behaviour was gt 30 seconds 2LSC = low sanitary conditions SC = high sanitary conditions 3LP = low dietary crude protein level NP = normal dietary crude protein level 4AA-B = basal dietary amino acid profile AA-S = supplemented dietary amino acid profile containing 20 more Met Thr and Trp compared with the basal profile 5P-values for manipulating other and belly nosing were based on square root transformed data Significant P-values are indicated in bold and for a tendency values are underlined Means are presented as raw means plusmn standard error 6n = number of pens a pen contained nine pigs
Figure 31 Behaviour of pigs during the grower and finisher phase for pigs fed diets with low (LP) or normal (NP) crude protein level + P lt 010 P lt 005 P lt 001 P lt
0001
0
10
20
30
40
50
60
70
total oralmanipulation of
pen mates
tail biting ear biting manipulatingother
chewing toy total aggression fighting feeder fighting belly nosing
Freq
p
ig
ho
ur
LP NP
+
0
05
1
15
2
25
basal suppl basal suppl basal suppl basal suppl
LP NP LP NP
LSC HSC
Freq
p
ig
ho
ur
SC times AA P = 003 SC P = 003 CP P = 002
Figure 32 Frequency of ear biting in pigs kept under different sanitary conditions and fed a diet with either a low or normal dietary protein level and a basal or supplemented amino acid profile Ear biting was recorded during live ad libitum sampling for 100 min per pen in total The bars represent the raw means per treatment group plusmn standard error of the mean LSC = low sanitary conditions HSC = high sanitary conditions LP = low dietary crude protein level (white bars) NP = normal dietary crude protein level (grey bars) AA-B = basal dietary amino acid profile (striped bars) AA-S = supplemented dietary amino acid profile containing 20 more Met Thr and Trp compared with the basal profile (dotted bars) SC = sanitary conditions AA = amino acid profile
Chapter 3
69
Tail and ear damage scores When considering the prevalence of tail damage as a binary
score (tail damage vs no tail damage) almost all of the pigs had tail lesions with a score
higher than 1 ie at least bite marks in at least one phase during the experiment
Furthermore 39 of the pigs had a tail wound (score gt 2) in at least one of the phases
These proportions were not affected by sanitary conditions or diet
When averaging binary tail damage scores per pen and phase the proportion of pigs with
tail damage in LSC pens (080 plusmn 003) was higher than that in HSC pens (065 plusmn 003) in the
starter phase (P le 005 Table 33) In the grower phase the proportion of pigs with tail
damage in LSC (081 plusmn 004) was lower than that in HSC (092 plusmn 002 P le 005 Table 33)
An interaction for tail damage in the finisher phase was found for sanitary conditions (SC) times
CP P le 005 NP fed pigs in HSC (082 plusmn 004) had lower damage scores than LP fed pigs in
HSC (092 plusmn 002) whereas this score was not different for pigs in LSC (091 plusmn 002 vs 092 plusmn
002)
In total 78 of LSC and 58 of HSC pigs had at least in one phase an ear damage score
higher than 1 (P le 005) When averaging binary ear damage scores per pen and phase the
proportion of animals with ear damage was higher in pens fed AA-B diets (037 plusmn 004)
compared to those fed AA-S diets (025 plusmn 003) in the grower phase (P le 005) The
proportion of pigs with ear damage in the grower phase tended to be higher for LSC (033 plusmn
004) than for HSC pigs (028 plusmn 004) For the finisher phase the proportion of ear damage
was higher for LSC (092 plusmn 002) than for HSC pigs (087 plusmn 002 P le 005) The distribution of
LSC and HSC pigs over tail and ear damage scores are presented in Supplementary Table II
and III respectively
When considering the prevalence of tail wounds as a binary score (tail wound vs no tail
wound) in LSC a lower proportion of pigs had tail wounds (013 plusmn 002) than in HSC (022 plusmn
003) in the grower phase (P le 005 Table 34) The LP diet tended to result in a lower
proportion of pigs with tail wounds (032 plusmn 004) compared with the NP diet (038 plusmn 004)
in the grower phase (005 le P le 010) Proportion of pigs with a tail wound tended to be
lower for the AA-B diet (020 plusmn 003) than for the AA-S diet (014 plusmn 002) in the grower
phase (005 le P le 010) In the finisher phase an interaction was found for SC times CP for
proportion of pigs with tail wounds in LSC a lower proportion of pigs with wounds was
found when fed a LP diet (017 plusmn 003) instead of a NP diet (024 plusmn 003) whereas in HSC a
higher proportion of pigs had tail wounds when fed a LP diet (022 plusmn 004) instead of a NP
diet (015 plusmn 004) in the grower phase (P le 005)
When averaging binary ear wound scores (scores gt 3 for ear wounds vs scores lt 4) per pen
and phase many pens had a score 0 (no wound) Therefore no statistically test was
performed on ear wound scores The raw means are presented in Table 34
Table 33 Proportion of pigs (based on pen averages) with tail damage (score gt 1) and ear damage (score gt 1) observed for each treatment group low and high sanitary condition pigs both with diets containing either low or normal protein levels and basal or supplemented amino acid profiles
1LSC = low sanitary conditions HSC = high sanitary conditions 2LP = low crude protein level in diet NP = normal crude protein level in diet 3AA-B = basal dietary amino acid profile AA-S = supplemented dietary amino acid profile containing 20 more Met Thr and Trp than the basal profile 4 Significant P-values are indicated in bold and for a tendency values are underlined Means are presented as raw means plusmn standard error of the mean 5Damage scores were either 0 = no damage or 1= damage and were averaged per pen 6n = number of pens a pen contained nine pigs
LSC1 HSC1
LP2 NP2 LP NP P-values4
Damage score5 AA-B3 AA-S3 AA-B AA-S AA-B AA-S AA-B AA-S SC CP AA batch SCtimesAA SCtimesCP
n6 8 8 8 8 8 8 8 8
Tail
starter 080 plusmn 008 082 plusmn 004 076 plusmn 004 083 plusmn 008 064 plusmn 006 065 plusmn 006 078 plusmn 007 054 plusmn 004 lt0001 098 045 0002 006 070
grower 083 plusmn 007 075 plusmn 009 078 plusmn 008 088 plusmn 006 095 plusmn 003 094 plusmn 002 094 plusmn 004 085 plusmn 006 lt0001 076 052 047 037 021
finisher 092 plusmn 003 091 plusmn 004 093 plusmn 003 091 plusmn 004 095 plusmn 003 088 plusmn 003 081 plusmn 006 084 plusmn 004 068 007 054 lt0001 088 004
Ear
starter 052 plusmn 005 041 plusmn 008 030 plusmn 007 045 plusmn 006 047 plusmn 012 036 plusmn 008 043 plusmn 006 028 plusmn 006 050 013 030 002 017 078
grower 034 plusmn 012 032 plusmn 006 037 plusmn 005 031 plusmn 007 042 plusmn 010 020 plusmn 005 034 plusmn 008 016 plusmn 005 010 063 002 086 011 053
finisher 053 plusmn 008 040 plusmn 006 051 plusmn 010 045 plusmn 009 031 plusmn 012 029 plusmn 005 032 plusmn 007 035 plusmn 012 lt0001 062 032 076 031 090
Table 34 Proportion of pigs (based on pen averages) with tail wounds (score gt 2) and ear wounds (score gt 3) observed for each treatment group low and high sanitary condition pigs both with diets containing either low or normal protein levels and basal or supplemented amino acid profiles
1LSC = low sanitary conditions HSC = high sanitary conditions 2LP = low crude protein level in diet NP = normal crude protein level in diet 3AA-B = basal dietary amino acid profile AA-S = supplemented dietary amino acid profile containing 20 more Met Thr and Trp than the basal profile 4 Significant P-values are indicated in bold and for a tendency values are underlined Means are presented as raw means plusmn standard error of the mean For ear wounds no statistically test was done as there were too many pens without wounds 5Wound scores were either 0 = no wound or 1= wound and were averaged per pen 6n = number of pens a pen contained nine pigs
LSC1 HSC1
LP2 NP2 LP NP P-values4
Wound score5 AA-B3 AA-S3 AA-B AA-S AA-B AA-S AA-B AA-S SC CP AA batch SCtimesAA SCtimesCP
n6 8 8 8 8 8 8 8 8
Tail
Starter 008 plusmn 003 007 plusmn 003 011 plusmn 004 016 plusmn 005 007 plusmn 004 013 plusmn 005 013 plusmn 004 010 plusmn 003 010 017 050 043 099 038
Grower 015 plusmn 004 004 plusmn 002 022 plusmn 006 010 plusmn 003 018 plusmn 006 021 plusmn 006 027 plusmn 008 022 plusmn 005 0007 010 009 00003 014 080
Finisher 018 plusmn 003 015 plusmn 004 025 plusmn 005 023 plusmn 006 018 plusmn 006 026 plusmn 004 017 plusmn 006 012 plusmn 006 082 094 084 077 056 004
Ear
Starter 005 plusmn 003 004 plusmn 004 000 plusmn 0 006 plusmn 003 006 plusmn 003 001 plusmn 001 000 plusmn 0 000 plusmn 0
grower 005 plusmn 005 000 plusmn 0 000 plusmn 0 005 plusmn 003 017 plusmn 008 007 plusmn 003 000 plusmn 0 000 plusmn 0
finisher 006 plusmn 006 002 plusmn 002 000 plusmn 0 008 plusmn 004 008 plusmn 004 005 plusmn 002 000 plusmn 0 000 plusmn 0
Chapter 3
72
DISCUSSION
In this study we assessed the influence of sanitary conditions dietary protein
concentration and dietary AA profile on behaviour of pigs kept under practical conditions
To the best of our knowledge this is the first study on damaging behaviour in pigs that are
experimentally exposed to diverging sanitary conditions and receive different dietary
treatments in a commercial farm setting We demonstrate evidence for a causal
relationship between sanitary conditions and damaging behaviour indicating that biting
behaviour particularly ear biting in pigs is linked to health status in a diet-dependent
manner In addition low dietary protein levels clearly increased the frequencies of both
damaging biting behaviour and aggression Dietary supplementation of Thr Met and Trp
modified these behavioural responses in low sanitary conditions pigs or low dietary protein
fed pigs to some extent
In our study ear biting and manipulation of body parts other than ears and tails were
scored more frequently than tail biting Given the frequent occurrence of tail wounds tail
docking was applied on the experimental farm This is still common practice in the
Netherlands and many other countries It is known that ear biting occurs more frequently
on farms with docked tails likely because docked tails are not the most attractive body part
to bite in (Goossens et al 2007) Also in studies on pigs with intact (Camerlink et al 2015)
and half-docked tails (Ursinus et al 2014b) ear biting and manipulation of other body
parts was observed more frequently than tail biting Oral manipulation of pen mates
occurred far more frequent than biting of the enrichment object provided probably
because body parts of conspecifics better meet the requirements of pigs for suitable
chewing and rooting materials (Van de Weerd et al 2003) and more pen mates than
enrichment objects were available
Tail docking ie amputation of the tail or part of it in young pigs is still done in several EU
countries to prevent tail damage at later age (Sutherland et al 2011) The underlying
causes of tail biting are however not removed by this practice and tail wounds remain a
problem (Valros and Heinonen 2015) Our results with almost all of pigs showing at least
bite marks and 39 having a small or large tail wound in one of the production phases
confirm that tail docking is no guarantee for the absence of tail biting This is line with other
studies For instance in a study with Irish slaughter pigs 99 of the studied pigs were tail
docked and 725 of these pigs had tail lesions at slaughter (Harley et al 2014) In an
observation study with pigs with half-docked tails (Ursinus et al 2014b) frequency of ear
biting (17 plusmn 01 per hour) in pigs was higher than tail biting (06 plusmn 01 per hour) as was the
case in our study Overall the percentage of pigs with tail lesions was higher than the
percentage of pigs with ear lesions suggesting that in spite of its relatively lower
frequency tail biting was more severe than ear damage in our study
Chapter 3
73
Damaging behaviour and interactions with sanitary conditions and diet Pigs in LSC showed
more ear biting (+39) compared with HSC pigs Dietary supplementation with extra Met
Thr and Trp reduced the frequency of ear biting (-16) only in LSC pigs The proportion of
pigs with ear damage was higher in LSC than in HSC during the grower (tendency) and
finisher phase Similarly proportions of pigs with tail damage was higher in LSC during the
starter phase although the opposite was found for proportion of pigs with tail damage or
wounds in the grower phase The LSC pigs had higher haptoglobin concentrations in blood
and higher pleuritis scores for lungs at slaughter than HSC pigs (van der Meer et al 2016)
confirming a difference in health status The impact of LSC on both damaging behaviours
and the lesions and wounds they induce suggests a causal relationship between poor
health and the occurrence of behavioural problems
The increased propensity of pigs with a poor health status to start biting their pen mates
could be related to increased immune system activation In line with this in laying hens the
stimulation of immune reactivity by intra-tracheal exposure to human serum albumin
increased damaging feather pecking (Parmentier et al 2009) a redirected foraging
behaviour showing a strong similarity to tail biting in pigs (Rodenburg and Koene 2007)
Immune stimulation may lead to a change in the animalrsquos nutrient requirements
particularly also for AA Recent studies have shown indeed that the requirements for Trp
(Melchior et al 2004 Le Flocrsquoh et al 2008 Rakhshandeh et al 2010) Met + cysteine
(Rakhshandeh et al 2010) and Thr (Li et al 2007 Ren et al 2014) are increased in case of
immune system stimulation Increased immune system activity in growing animals may
redirect nutrients from growth to other processes that require AA Indeed the LSC pigs in
our study showed a lower body weight gain than the HSC pigs (van der Meer et al 2016)
Notably and unlike in most studies using model agents like lipopolysaccharide (LPS)
(Rakhshandeh et al 2010 de Ridder et al 2012 Kim et al 2012) Complete Freundrsquos
Adjuvant (CFA) (Le Floch et al 2012 Kampman-van de Hoek et al 2015) to stimulate the
immune system contrasts in sanitary status in this experiment occurred strictly without
pigs showing signs of clinical illness Pigs with suboptimal health may thus need more AA to
support the immune system whilst maintaining growth Indeed particularly in the pigs kept
under poor sanitary conditions the diets with supplemented Met Thr and Trp led to higher
gain-to-feed ratios and a higher body weight gain (van der Meer et al 2016) If particular
AA are limiting for optimal body functioning pigs might intensify their chewing and rooting
behaviour to satisfy their nutritional needs and under commercial conditions direct part
of their oral behaviours towards pen mates This is confirmed by the lower frequency of ear
biting recorded for AA-S compared with AA-B fed pigs in LSC The frequency of tail biting
and the ear and tail damage scores in LSC pigs were not always reduced by the
supplementary AA diet The former suggests that the link between health status AA
availability in metabolism and damaging behaviour is complex and possibly influenced by
multiple mechanisms
Chapter 3
74
An imbalance in AA might also influence behaviour by altering brain neurotransmitter
metabolism Several brain neurotransmitters are synthesized from AA (Anderson 1979
Massey et al 1998) Threonine is a precursor of brain glycine (Castagneacute et al 1993) Met
can be used as a donor of methyl groups used for synthesis of many substrates such as
choline (Burke et al 1951 Rodwell 2003) which is an acetylcholine precursor (Purves et
al 2001) and Trp is a precursor of serotonin (5-hydroxytryptamine 5-HT Rodwell 2003)
a neurotransmitter which is known to affect behaviour and emotional state Aggressive
behaviour and stress have been shown to be related to the supply of dietary Trp andor
brain 5-HT in several animal and human studies (Gibbons et al 1979 Chamberlain et al
1987 Salomon et al 1994 Winberg et al 2001 Lepage et al 2002) including studies on
pigs (Koopmans et al 2005 Edwards 2006) Ursinus et al (2014a) recently found that pigs
that perform tail biting behaviour had lowered blood 5-HT levels and in line with this
feather pecking chickens also showed altered peripheral (Bolhuis et al 2009) and central 5-
HT (Kops et al 2013 Kops et al 2014) metabolism This could either be due to a direct
effect of 5-HT on damaging behaviour demonstrated experimentally for chickens only (van
Hierden et al 2004) or reflect lowered AA availability for neurotransmitter synthesis
either or not caused by a lowered health status
As Trp competes with other large neutral AA (LNAA) for passage over the blood brain
barrier the Trp LNAA ratio in blood is a major determinant of brain 5-HT concentration
(Wurtman and Fernstrom 1975) Despite that there were differences in Trp LNAA ratio
between the AA-B and AA-S diets no clear effects of dietary AA profile on aggression and
on some of the damaging behaviours were found In contrast supplementation of AA in the
AA-S diet resulted in lower recorded frequencies of mounting than for pigs fed the AA-B
diet It is not really clear via which mechanisms dietary AA provision affects mounting
behaviour
Apart from pigs in poor health being more likely to start biting as indicated also affected by
the dietary AA supply the health-biting relationship (Moinard et al 2003b Kritas and
Morrison 2007 Marques et al 2012) can be fortified by the poor ability of ill pigs to avoid
being bitten (Taylor et al 2010) Finally it can be speculated that immune activation in
wounded pigs (eg Heinonen et al 2010 Munsterhjelm et al 2013) in turn increases the
probability of these pigs to start biting as well which consequently leads to an escalation of
tail or ear biting in the entire group
Dietary protein reduction a risk for damaging behaviour Almost all damaging and
aggressive behaviours recorded were more frequently scored for pigs fed the LP diet
considered to be dietary deficient in essential AA than for those fed the NP diet
demonstrating a clear and direct effect of dietary protein level on damaging behaviour In
addition a higher proportion of pigs with tail damage and tail wounds was found in HSC in
the finisher phase when pigs were fed a LP diet In a study of McIntyre and Edwards (2002)
Chapter 3
75
pigs had a higher preference for a wet blood-soaked tail model when fed a low protein diet
(98 g CPkg) compared to their preference when fed a control diet (189 g CPkg) These
results suggest that a diet deficient in essential AA increases preference for blood
However they used different protein sources in both diets (McIntyre and Edwards 2002)
Therefore an effect of protein source rather than CP level alone cannot be excluded in their
study In our study however the same protein sources at a different inclusion level were
used in the respective diets As average daily feed intake was not significantly different
between LP an NP diets we conclude that a the difference in AA uptake lead to more oral
manipulation of pen mates and more aggression
The LP diets might have led to a shortage or imbalance of AA resulting in restless pigs
searching for missing nutrients It might be that some brain neurotransmitters cannot be
synthesized from AA derived from dietary protein as was stated by Harper and Peters
(1989) simply because insufficient precursors were available Nutritional imbalance
probably due to an overall shortage in AA in this case can increase foraging activity and
redirected damaging behaviours
Apart from the effect on damaging behaviour an overall shortage of the dietary supply of
AA might also be responsible for the increase in aggressive behaviour in pigs fed the LP
diets The LP diets regardless of the AA profile were diets with a lower Trp concentration
compared with the NP diets A low Trp concentration in the brain due to a low
concentration of Trp in the diet might affect brain serotonin metabolism resulting in more
aggressive behaviour as found by Martinez-Trejo et al (2009) or might affect aggressive
behaviour via other hormones such as cortisol or noradrenaline as found by Koopmans et
al (2005) Also the effect of AA concentration on blood insulin concentration might have
played a role as blood insulin is known to play a role in Trp uptake in the brain as well
(Kritas and Morrison 2007)
Alternatively Fraser et al (1991) suggested that the effect of deficient dietary essential AA
level on biting behaviour is indirectly caused by a lower growth rate of these animals
rather than by the dietary composition as such In support of this McIntyre and Edwards
(2002) found a tendency for a correlation between body weight gain and preference for a
blood tail model vs water tail model Also Larsen (1983) found that tail biting pigs often
were slower growing animals In contrast Ursinus et al (2014b) reported a higher
phenotypic and genotypic growth in fanatic tail biters These authors suggested that fast
growing pigs and pigs with a low growth rate due to health problems may have a high
metabolic demand for protein synthesis for muscle tissue or immune processes in
common which could explain their increased biting tendencies A larger variation in size of
animals within the same pen has also been reported to negatively influence biting
behaviour (Taylor et al 2010) When calculating the standard error for body weight per
pen in our study the standard error was higher for LSC than HSC animals which means that
Chapter 3
76
variation in weight per pen was higher in LSC animals When calculating this standard error
for body weight with the measured behaviours no clear correlations were found
Even if growth rate is related to biting behaviour more research is needed to determine
cause and effect and to study the impact of a potential shared underlying factor such as
for instance an actual status or history of poor health A low protein diet with deficiencies
in essential AA should thus be considered as a risk factor for biting behaviour and
aggression in pigs which can only partly be counteracted by supplementation with specific
essential AA such as Met Thr and Trp
In conclusion this study shows a causal link between sanitary conditions dietary CP level
and damaging behaviours Both LSC and a reduction of dietary CP level increase the
occurrence of damaging behaviours in pigs and therefore may negatively impact pig
welfare These effects could only partly be counteracted by supplementation with specific
essential AA that are known to be increasingly required in case of immune system
activation
Tail and ear biting clearly are multifactorial problems and combating these requires a
multidisciplinary effort This study demonstrates that care should be taken in reducing
dietary protein concentrations to improve protein efficiency in pigs even when maintaining
the ratio of the most important essential AA relative to energy It incurs a risk to increased
damaging behaviours particularly when pigs are kept under poor sanitary conditions
Acknowledgements The authors would like to thank F van den Berg AC Bartels M
Ooms G De Vries-Reilingh and all students involved for their assistance during this
experiment The authors also thank H van Diepen and J Kuipers for their advice and
support on formulation of the experimental diets
Chapter 3
77
REFERENCES Anderson G H 1979 Control of protein and energy intake role of plasma amino acids and brain neurotransmitters Can J Phys
Pharm 57 1043-1057 Beattie V E I A S VE N Walker and R N Weatherup 2001 Environmental enrichment of intensive pig housing using spend
mushroom compost Anim Sci 71 35-42 Bikker P M W A Verstegen and M W Bosch 1994 Amino acid composition of growing pigs is affected by protein and energy
intake J Nutr 1241961-1969 Bolhuis J E ED Ellen C G van Reenen J de Groot J ten Napel R E Koopmanschap G de Vries-Reiligh K A Uitdehaag B
Kemp and T B Rodenburg 2009 Effects of genetic group selection against mortality on behavior and peripheral serotonin in domestic laying hens with trimmed and intact beaks Phys Beh 97 470-475
Burke K A R F Nystrom and B C Johnson 1951 the role of methionine as a methyl donor for choline synthesis in the chick J Bio Chem 188 723-728
Camerlink I W W Ursinus P Bijma B Kemp and J E Bolhuis 2015 Indirect genetic effects for growth rate in domestic pigs alter aggressive and manipulative biting behaviour Beh Gen 45 117-126
Castagneacute V D Moeumlnnoz P A Finot and J C Maire 1993 Effects of diet-induced hyperthreoninemia Amino acid levels in the central nervous system and peripheral tissues Life Sci 53 1803-1810
Chamberlain B F R Ervin R O Pihl and S N Young 1987 The effect of raising or lowering tryptophan levels on aggression in vervet monkeys Pharm Biochem Beh 28 503-510
Centraal Veevoeder Bureau (CVB) 2011 Chemical compositions and nutritional values of feed ingredients CVB Lelystad The Netherlands
de Ridder K C L Levesque J K Htoo and C F M de Lange 2012 Immune system stimulation reduces the efficiency of tryptophan utilization for body protein deposition in growing pigs J Anim Sci 90 3485-3491
Edwards S 2006 Tail biting in pigs Understanding the intractable problem Vet J 171198-199 Ettle T and F X Roth 2004 Specific dietary selection for tryptophan by the piglet J Anim Sci 82 1115-1121 Ettle T and F X Roth 2005 Dietary preferences for feeds varying in threonine concentration by the piglet Phys Beh 85 289-
295 Ettle T and F X Roth 2009 Dietary selection for lysine by piglets at differing feeding regimen Livest Sci 122 259-263 Fraser D D E Bernon and R O Ball 1991 Enhanced attraction to blood by pigs with inadequate dietary protein
supplementation Can J Anim Sci 71 611-619 Gibbons J L G A Barr W H Bridger and S F Liebowitz 1979 Manipulations of dietary tryptophan Effects on mouse killing and
brain serotonin in the rat Brain Res 169 139-153 Gloaguen M N Le Flocrsquoh E Corrent Y Primot and J van Milgen 2014 The use of free amino acids allows formulating very low
crude protein diets for piglets J Anim Sci 92 637-644 Goossens X L Sobry F Tuyttens D Maes S de Smet F Nevens G Opsomer F Lommelen and R Geers 2007 A population-
based on-farm evaluation protocol for comparing the welfare of pigs between farms Anim Welfare 17 35 Harley S L A Boyle N E OConnell S J More D L Teizeira and A Hanlon 2014 Docking the value of pigmeat Prevalence and
financial implications of welfare lesions in Irish slaughter pigs Anim Welfare 23 275-285 Harper A E and J C Peters 1989 Protein Intake Brain amino acid and serotonin concentrations and protein self-selection J
Nutr 119 677-689 Heinonen M T Orro T Kokkonen C Munsterhjelm O Peltoniemi and A Valros 2010 Tail biting induces a strong acute phase
response and tail-end inflammation in finishing pigs Vet J 184 303-307 International Organization for Standardization (ISO) 2005a Animal feeding stuffs ndash Determination of amino acids content ISO
13903 Int Organ Stand Geneve Switzerland International Organization for Standardization (ISO) 2005b Animal feeding stuffs ndash Determination of tryptophan content ISO
13903 Organ Stand Geneve Switzerland Jansman A J M W Smink P van Leeuwen and M Rademacher 2002 Evaluation through literature data of the amount and
amino acid composition of basal endogenous crude protein at the terminal ileum of pigs Anim Feed Sci Tech 98 49-60
Jensen M B I Kyriazakis and A B Lawrence 1993 The activity and straw directed behaviour of pigs offered foods with different crude protein content Appl Anim Beh Sci 37 211-221
Jericho K and T Church 1972 Cannibalism in pigs Can Vet J 13 156-159 Kampman-van de Hoek E P Sakkas W J J Gerrits J J G C van den Borne C M C van der Peet-Schwering and A J M
Jansman 2015 Induced lung inflammation and dietary protein supply affect nitrogen retention and amino acid metabolism in growing pigs Brit J Nutr 113 414-425
Karlsson F O Svartstroumlm K Belaacutek C Fellstroumlm and M Pringle 2013 Occurrence of Treponema spp in porcine skin ulcers and gingiva Vet microbio 165 402-409
Kerr B J and R A Easter 1995 Effect of feeding reduced protein amino acid-supplemented diets on nitrogen and energy balance in grower pigs J Anim Sci 73 3000-3008
Kim J C B P Mullan B Frey H G Payne and J R Pluske 2012 Whole body protein deposition and plasma amino acid profiles in growing andor finishing pigs fed increasing levels of sulfur amino acids with and without Escherichia coli lipopolysaccharide challenge J Anim Sci 90 362-365
Koopmans S J M Ruis R Dekker H van Diepen M Korte and Z Mroz 2005 Surplus dietary tryptophan reduces plasma cortisol and noradrenaline concentrations and enhances recovery after social stress in pigs Phys Beh 85 469-478
Chapter 3
78
Kops M S E N de Haas T B Rodenburg E D Ellen G A H Korte-Bouws B Olivier O Guumlntuumlrkuumln J E Bolhuis and S M Korte 2013 Effects of feather pecking phenotype (severe feather peckers victims and non-peckers) on serotonergic and dopaminergic activity in four brain areas of laying hens (Gallus gallus domesticus) Phys Beh 120 77-82
Kops M S J B Kjaer O GuumlntuumlrKuumln K G C Westphal G A H Korte-Bouws B Olivier J E Bolhuis and S M Korte 2014 Serotonin release in the caudal nidopallium of adult laying hens genetically selected for high and low feather pecking behavior An in vivo microdialysis study Beh Brain Res 268 81-87
Kritas S K and R B Morrison 2007 Relationships between tail biting in pigs and disease lesions and condemnations at slaughter Vet Rec 160 149-152
Larsen C 1983 Tail biting in pigs New Zeal Vet J 31105-106 Le Bellego L and J Noblet 2002 Performance and utilization of dietary energy and amino acids in piglets fed low protein diets
Livest Prod Sci 76 45-58 Le Floch N F Gondret J J Matte and H Quesnel 2012 Towards amino acid recommendations for specific physiological and
patho-physiological states in pigs Proc Nutr Soc 71 425-432 Le Flocrsquoh N D Melchior and B Segraveve 2008 Dietary tryptophan helps to preserve tryptophan homeostasis in pigs suffering from
lung inflammation J Anim Sci 86 3473-3479 Lepage O O Tottmar and S Winberg 2002 Elevated dietary intake of L-tryptophan counteracts the stress-induced elevation of
plasma cortisol in rainbow trout (Oncorhynchus mykiss) J Exp Bio 205 3679-3687 Li P Y-L Yin D Li S Woo Kim and G Wu 2007 Amino acids and immune function Brit J Nutr 98 237-252 Marques B M F P P et al 2012 Influence of tail biting on weight gain lesions and condemnations at slaughter of finishing pigs
Pesq Vet Bras 32 Martiacutenez-Trejo G et al 2009 Aggressiveness and productive performance of piglets supplemented with tryptophan J Anim Vet
Adv 8 608-611 Massey K A C H Blakeslee and H S Pitkow 1998 A review of physiological and metabolic effects of essential amino acids
Amino Acids 14 271-300 McIntyre J and S Edwards 2002 An investigation into the effect of different protein and energy intakes on model tail chewing
behaviour of growing pigs Appl Anim Beh Sci 77 93-104 Melchior D B Segraveve and N Le Flocrsquoh 2004 Chronic lung inflammation affects plasma amino acid concentrations in pigs J Anim
Sci 82 1091-1099 Moinard C M Mendl C J Nicol and L E Green 2003 A case control study of on-farm risk factors for tail biting in pigs Appl
Anim Behav Sci 81 333-355 Moughan P J 1998 Protein metabolism in the growing pig In Kyriazakis I editor A Quantitative Biology of the Pig CABI
Publishing Oxon UK 299-331 Munsterhjelm C O Simola L Keeling A Valros and M Heinonen 2013 Health parameters in tail biters and bitten pigs in a
casendashcontrol study Anim 7 814-821 NRC 2012 Nutrient Requirements of Swine 11th ed Natl Acad Press Washington DC Parmentier H K T B Rodenburg G De Vries Reilingh B Beerda and B Kemp 2009 Does enhancement of specific immune
responses predispose laying hens for feather pecking Poultr Sci 88 536-542 Pringle M A Backhans F Otman M Sjoumllund and C Fellstroumlm 2009 Isolation of spirochetes of genus Treponema from pigs with
ear necrosis Vet Microbio 139 279-283 Purves D G J Augustine D Fitzpatrick L C Katz A S LaMantia J O McNamara and S M Williams Neurotransmission in the
visceral motor system In M A Sunderland editor Neuroscience 2nd edition 2001 Sinauer associates Inc USA Rakhshandeh A J K Htoo and C F M de Lange 2010 Immune system stimulation of growing pigs does not alter apparent ileal
amino acid digestibility but reduces the ratio between whole body nitrogen and sulfur retention Livest Sci 134 21-23 Ren M X T Liu X Wang G J Zhang S Y Qiao and X F Zeng 2014 Increased levels of standardized ileal digestible threonine
attenuate intestinal damage and immune responses in Escherichia coli K88+ challenged weaned piglets Anim Feed Sci Tech 195 67-75
Rodenburg T B and P Koene 2007 The impact of group size on damaging behaviours aggression fear and stress in farm animals Appl Anim Beh Sci 103 205-214
Rodwell V W 2003 Conversion of amino acids to specialized products In Murray R K Granner D K Mayes P A and Rodwell V W editors Harperrsquos Illustrated Biochemistry 26th edition Mc Graw-Hill companies USA 264-269
Roth F X C Meindl and T Ettle 2006 Evidence of a dietary selection for methionine by the piglet J Anim Sci 84 379-386 Salomon R M C M Mazure P L Delgado P Mendia and D S Charney 1994 Serotonin function in aggression The effect of
acute plasma tryptophan depletion in aggressive patients Biol Psych 35 570-572 Schroslashder-Petersen D L and H B Simonsen 2001 Tail Biting in Pigs Vet J 162 196-210 Sutherland M A B L Davis and J J McGlone 2011 The effect of local or general anesthesia on the physiology and behavior of
tail docked pigs Anim 51237-1246 Taylor N R D C J Main M Mendl and S A Edwards 2010 Tail-biting A new perspective Vet J 186 137-147 Ursinus W W C G Van Reenen I Reimert and J E Bolhuis 2014a Tail biting in pigs blood serotonin and fearfulness as pieces
of the puzzle PLOS ONE 9 e107040 Ursinus W W H J Heinonen A C Bartels N Dijvesteijn C G van Reenen and J E Bolhuis 2014b Damaging biting behaviors in
intensively kept rearing gilts The effect of jute sacks and relations with production characteristics J Anim Sci 92 5193-5202
Valros A and M Heinonen 2015 Save the pig tail Porc Health Managem 1 1-7 Van de Weerd H A C M Docking J E L Day P J Avery and S A Edwards 2003 A systematic approach towards developing
environmental enrichment for pigs Appl Anim Beh Sci 84 101-118
Chapter 3
79
van der Meer Y A Lammers A J M Jansman M M J A Rijnen W H Hendriks and W J J Gerrits 2016 Performance of pigs kept under different sanitary conditions affected by protein intake and amino acid supplementation J Anim Sci 94 4704-4719
van Hierden Y M S F de Boer J M Koolhaas and S M Korte 2004 The control of feather pecking by serotonin Beh Neurosci 118 575
Winberg S Oslash Oslashverli and O Lepage 2001 Suppression of aggression in rainbow trout (Oncorhynchus mykiss) by dietary l-tryptophan J Exp Bio 204 3867-3876
Wu G 2009 Amino acids metabolism functions and nutrition Amino acids 37 1-17 Wurtman R J and J D Fernstrom 1975 Control of brain monoamine synthesis by diet and plasma amino acids Am J Clin Nutr
28 638-647 Zonderland J J M B M Bracke L A den Hartog B Kemp and H A M Spoolder 2010 Gender effects on tail damage
development in single- or mixed-sex groups of weaned piglets Livest Sci 129 Zonderland J J M Wolthuis-Fillerup C G van Reenen M B M Bracke B Kemp L A den Hartog and H A M Spoolder 2008
Prevention and treatment of tail biting in weaned piglets Appl Anim Behav Sci 110
Chapter 3
80
SUPPLEMENTAL TABLES
Supplemental table I Ingredient and nutrient composition of the starter diets
LP1 NP1
Item AA-B2 AA-S2 AA-B AA-S
Ingredient gkg of feed
Maize 32000 32000 40000 40000
Soybean meal 18202 18200 22754 22754
Barley 16000 16000 20000 20000
Wheat 4553 4553 5691 5691
Maize starch 20679 20464 4065 3790
Sugarcane molasses 2000 2000 2000 2000
Limestone 1394 1394 1411 1411
Monocalcium phosphate 999 999 893 893
Soybean oil 1065 1098 1598 1638
Vitamin + mineral mix3 500 500 500 500
Salt 319 319 383 383
L-lysine HCl 195 194 235 235
Titanium dioxide 250 250 250 250
Sodium bicarbonate 258 258 134 134
L-threonine 060 146 063 171
L-tryptophan 003 031 000 037
DL-methionine 023 094 023 113
Cellulose4 1500 1500 000 000
Nutrients calculated gkg
NE MJkg5 980 980 980 980
DM 8896 8898 8932 8849
Crude protein 1380 1360 1680 1670
Starch4 4741 4723 4100 4077
Lys6 860 860 1050 1050
Thr6 540 620 660 740
Trp6 170 190 200 230
Met + Cys6 430 480 520 590
Ile6 560 560 690 680
Arg6 830 840 1050 1030
Phe6 660 660 820 810
His6 340 340 420 420
Leu6 109 1100 1360 1340
Tyr6 440 450 570 570
Val6 640 640 790 770 1 LP = low CP concentration diet NP = normal CP concentration diet
2 AA-B = basal dietary AA profile AA-S= supplemented dietary AA profile containing 20 more Met Thr and Trp compared with the basal profile 3 Supplied the following per kilopgram of diet 30 mg riboflavin 20 mg niacine 20 mg d-pantothenic acid 10 mg choline chloride 0015 mg cyanocobalamin 40 mg dl-α-tocopheryl acetate 15 mg menadione 6000 IU retinyl acetate 1200 IU cholecalciferol 02 mg folic acid 10 mg thiamin 10 mg pyridoxine HCl 50 mg manganese oxide 267 mg iron SO4middotH2O 60 mg copper SO4middot5H2O 140 mg zinc SO4middotH2O 044 mg disodium selenium trioxide10 mg potassium iodate 4 Opticell (Agromed Austri GmbH Kremsmuumlnster Austria)
5 Based on chemical composition digestibility and energy value for pigs from the Centraal Veevoeder Bureau livestock feed table (CVB 2011) 6 Analyzed values
Chapter 3
81
Supplemental table II Ingredient and nutrient composition of the grower diets
LP1 NP1
Item AA-B2 AA-S2 AA-B AA-S
Ingredient gkg of feed
Maize 40000 40000 50000 50000
Soybean meal 13815 13815 17269 17269
Barley 17136 17136 21419 21419
Maize starch 19919 19724 4334 4086
Wheat 2000 2000 2000 2000
Sugarcane molasses 1311 1311 1333 1333
Limestone 862 862 767 767
Monocalcium phosphate 919 948 1020 1057
Soybean oil 500 500 500 500
Vitamin + mineral mix3 395 395 361 361
Salt 245 245 292 292
L-lysine HCl 250 250 250 250
Titanium dioxide 156 156 200 200
Sodium bicarbonate 387 387 152 152
L-threonine 072 149 074 172
L-tryptophan 021 046 022 055
DL-methionine 012 076 007 087
Cellulose4 2000 2000 000 000
Nutrients calculated gkg
NE MJkg5 984 984 984 984
DM 8837 8859 8828 8877
Crude protein 1240 1240 1520 1520
Starch5 4971 4955 4489 4469
Lys6 800 790 970 1000
Thr6 510 590 590 700
Trp6 156 175 191 216
Met + Cys6 398 452 476 558
Ile6 480 470 590 580
Arg6 720 700 900 900
Phe6 580 570 710 710
His6 300 300 370 360
Leu6 100 990 123 123
Tyr6 380 390 500 500
Val6 570 580 690 690 1 LP = low CP concentration diet NP = normal CP concentration diet
2 AA-B = basal dietary AA profile AA-S= supplemented dietary AA profile containing 20 more Met Thr and Trp compared with the basal profile 3 Supplied the following per kilogram of diet 30 mg riboflavin 20 mg niacine 20 mg d-pantothenic acid 10 mg choline chloride 0015 mg cyanocobalamin 40 mg dl-α-tocopheryl acetate 15 mg menadione 6000 IU retinyl acetate 1200 IU cholecalciferol 02 mg folic acid 10 mg thiamin 10 mg pyridoxine HCl 50 mg manganese oxide 267 mg iron SO4middotH2O 60 mg copper SO4middot5H2O 140 mg zinc SO4middotH2O 044 mg disodium selenium trioxide10 mg potassium iodate 4 Opticell (Agromed Austri GmbH Kremsmuumlnster Austria)
5 Based on chemical composition digestibility and energy value for pigs from the Centraal Veevoeder Bureau livestock feed table (CVB 2011) 6 Analyzed values
Chapter 3
82
Supplemental table III Ingredient and nutrient composition of the finisher diets LP1 NP1 Item AA-B2 AA-S2 AA-B AA-S
Ingredient gkg of feed
Maize 36010 36010 45010 45010 Soybean meal 11570 11570 14460 14460 Barley 24000 24000 30000 30000
Maize starch 18720 18530 3640 3410
Wheat 2000 2000 2000 2000
Sugarcane molasses 1220 1220 1250 1250
Limestone 740 740 650 650
Monocalcium phosphate 1400 1430 1320 1360
Soybean oil 500 500 500 500
Vitamin + mineral mix3 230 230 260 260
Salt 240 240 280 280
L-lysine HCl 250 250 250 250
Titanium dioxide 530 530 300 300
Sodium bicarbonate 000 060 000 070
L-threonine 070 140 070 160
L-tryptophan 010 040 010 040
DL-methionine 010 010 000 000
Cellulose4 2500 2500 000 000
Nutrients calculated gkg
NE MJkg5 984 984 984 984
DM 8859 8865 8816 8877
Crude protein 1320 1260 1510 1480
Starch5 5417 5094 5417 5402
Lys6 800 760 890 890
Thr6 530 560 590 650
Trp6 151 162 168 191
Met + Cys6 403 422 468 504
Ile6 490 460 570 560
Arg6 730 680 820 820
Phe6 600 560 680 680
His6 310 290 350 350
Leu6 1010 960 1190 1130
Tyr6 400 370 470 470
Val6 600 570 660 660 1 LP = low CP concentration diet NP = normal CP concentration diet 2 AA-B = basal dietary AA profile AA-S= supplemented dietary AA profile containing 20 more Met Thr and Trp compared with
the basal profile 3 Supplied the following per kilogram of diet 30 mg riboflavin 20 mg niacine 20 mg d-pantothenic acid 10 mg choline chloride
0015 mg cyanocobalamin 40 mg dl-α-tocopheryl acetate 15 mg menadione 6000 IU retinyl acetate 1200 IU cholecalciferol
02 mg folic acid 10 mg thiamin 10 mg pyridoxine HCl 50 mg manganese oxide 267 mg iron SO4middotH2O 60 mg copper SO4middot5H2O
140 mg zinc SO4middotH2O 044 mg disodium selenium trioxide10 mg potassium iodate 4 Opticell (Agromed Austri GmbH Kremsmuumlnster Austria)
5 Based on chemical composition digestibility and energy value for pigs from the Centraal Veevoeder Bureau livestock feed table
(CVB 2011) 6 Analyzed values
Chapter 3
83
Supplemental table IV Formulated dietary amino acid profiles relative to lysine on apparent ileal digestible level fed in combination with different dietary protein levels to pigs kept under different sanitary conditions
Amino acid AA-B profile1 AA-S profile1
Lysine 100 100
Methionine + cysteine 51 61
Threonine 59 71
Tryptophan 18 22
Arginine 87 87
Histidine 43 43
Isoleucine 53 53
Leucine 101 101
Phenylalanine 54 54
Valine 69 69 1 AA-B = basal dietary amino acid profile AA-S profile = supplemented dietary amino acid profile with 20 extra methionine threonine and tryptophan than basal profile
Supplemental table V The percentage of pigs in different tail damage score categories from observations taken across all phases for low and high sanitary conditions
Score LSC HSC
1 156 185
2 694 646
3 145 165
4 05 05
5 00 00
Score 1 No tail damage 2 Bite marks 3 Small wound 4 Medium wound part of tail missing and 5 Severe wound no tail is left LSC low sanitary condition pigs HSC high sanitary condition pigs Supplemental table VI The percentage of pigs in different ear damage score categories from observations taken across all phases for low and high sanitary conditions
Score LSC HSC
1 734 774
2 208 156
3 13 14
4 01 08
5 44 47
Score 1 No ear damage 2 Top or bottom lesions 3 Top and bottom lesions 4 Severe damage part of the ear is missing and 5 ear necrosis LSC low sanitary condition pigs HSC high sanitary condition pigs
Chapter 4
Low sanitary conditions increase maintenance energy
expenditure and decrease incremental protein efficiency
in growing pigs
Y van der Meer12 AJM Jansman3 and WJJ Gerrits1
To be submitted to Journal of Nutrition
1Animal Nutrition Group Wageningen University Wageningen 6708 WD The Netherlands
2De Heus Animal Nutrition Ede 6717 VE The Netherlands 3Wageningen UR Livestock Research Wageningen 6708 WD The Netherlands
Chapter 4
86
ABSTRACT
Background Requirements for energy as well as for some essential amino acids (EAA) are
known to be influenced by the nature and extent of immune system stimulation Most
studies on this topic use immune challenge models mimicking clinical conditions making
results of such studies difficult to extrapolate to practical conditions where subclinical
infections prevail Therefore a contrast in sanitary conditions was applied to study effects
of chronic low grade immune system activation on nutrient partitioning
Objective To quantify the difference in energy requirements for maintenance and in
incremental efficiencies for deposition of dietary energy and protein in the body of clinically
healthy pigs kept under low or high sanitary conditions fed a basal diet either or not
supplemented with additional methionine (Met) threonine (Thr) and tryptophan (Trp)
Methods In a 2 times 2 factorial arrangement 24 groups of 6 pigs each were allocated to either
a low sanitary condition (LSC) or high sanitary condition (HSC) and were offered two
different diets having either a basal or a dietary AA profile supplemented with Met Thr and
Trp For each group of pigs complete energy and nitrogen balances were determined
during two consecutive weeks during which feed was available ad libitum or at 70 of ad
libitum Following the second week the fasting heat production (FHP) was determined
after a 25 h period
Results Low SC conditions increased FHP from 696 to 750 kJ(kg BW06 d) regardless AA
supplementation The incremental efficiency of ingested N for retention was reduced in LSC
pigs from 73 to 53 but incremental efficiencies of DE for fat deposition were unaffected
by the experimental treatments
Conclusions Chronic low grade immune system stimulation by imposing low sanitary
conditions to pigs increases FHP Under such conditions the incremental efficiency of N
utilization for body protein deposition is reduced but the incremental efficiency of
absorbed energy for energy or fat deposition are unaffected Supplementation of Met Thr
and Trp did not affect any of the incremental efficiencies measured
Keywords efficiency pig energy sanitary conditions health amino acid
Chapter 4
87
INTRODUCTION
For developing concepts in clinical nutrition of animals changes in protein and energy
metabolism are often studied using models such as im or ip administered
lipopolysaccharide (LPS) (eg (Rakhshandeh et al 2010 de Ridder et al 2012 Kim et al
2012) or sc Complete Freundrsquos Adjuvant (CFA) (Melchior et al 2004 Le Flocrsquoh et al
2008 Kampman-van de Hoek et al 2015) provoking clinical symptoms It is questionable
whether results obtained from such models apply to conditions of low grade chronic
immune system stimulation (ISS) as often encountered in animal production systems
Under subclinical health conditions quantifying alterations in proteinAA and energy
requirements are important for developing targeted nutritional strategies
Clinical ISS has been shown to increase the metabolism and requirements of some essential
amino acids (EAA) such as methionine (Met) + cysteine (Rakhshandeh et al 2010 Litvak et
al 2013) and tryptophan (Trp) (Melchior et al 2004 Le Flocrsquoh et al 2008 Le Floch et al
2012) relative to lysine In a previous study (van der Meer et al 2016) 20 extra dietary
supplementation of Met threonine (Thr) and Trp relative to lysine (Lys) resulted in
increased growth and GF ratio for pig kept under either low or high sanitary conditions
The beneficial effect however was greater for LSC pigs indicating that low grade chronic
ISS increases the requirements for these AA
Apart from AA metabolism energy metabolism is also found to be influenced during ISS
(Benson et al 1993 Humphrey and Klasing 2004) Responses such as fever and acute
phase protein production in response to ISS consume energy (Lochmiller and Deerenberg
2000 Parmentier et al 2002) For example Lochmiller and Deerenburg (2000) described
that stimulated macrophages like other immune cells use energy to a level comparable to
a maximally functioning heart muscle Immune challenges in pigs often result in decreased
average daily gain (ADG) for ISS treatment groups which cannot be completely accounted
for by a related decreased average daily feed intake (ADFI) as reported in a meta-analysis
by Pastorelli et al (2012b) They estimated a 7 reduction of feed efficiency for respiratory
diseases 12 for poor housing conditions and 30 for bacterial infections of the gastro-
intestinal tract
The change in energy efficiency during ISS might be due to an increased energy
expenditure for the immune system reflected in an increase in the resting or fasting heat
production (FHP) Furthermore an the priority for fat deposition during ISS can be altered
as the consequence of a decreased priority for protein deposition (Lochmiller and
Deerenberg 2000) Alternatively it may be beneficial for the animal to have increased
body fat stores preparing for increased requirements for energy for the future under such
conditions For example Parmentier et al (2002) found an increased fat but not protein
deposition in chicken exposed to a repeated LPS challenge compared with unchallenged
chickens
Chapter 4
88
The effect of ISS on protein and fat deposition is the final result of altered requirements for
the use of nutrients for maintenance purposes and of changes in responses of nutrient
deposition to incremental intake of protein or energy via the diet Hence studying
relationships between ISS and nutrient partitioning requires estimates for nutrient
requirements for maintenance and values for incremental efficiencies of energy and
protein deposition in the body
In this study we measured incremental efficiencies for deposition of dietary energy and
protein in the body of clinically healthy pigs kept under low and high sanitary conditions
fed a basal diet either or not supplemented with additional MET Thr and Trp in ratio to
Lys and measured FHP as a proxy for maintenance energy expenditure Within-day
patterns of heat production and carbohydrate and fat oxidation are reported elsewhere
Chapter 4
89
MATERIALS AND METHODS
The present study was carried out at the experimental facilities of Wageningen University
the Netherlands The experimental protocol was approved by the Animal Care and Use
Committee of Wageningen University The Netherlands
Experimental design In a 2 times 2 factorial arrangement 24 groups of 6 pigs each were
allocated to either a low (LSC) or high sanitary condition (HSC) and were offered one of two
diets having either a basal (AA-B) or supplemented dietary AA profile (AA-S) Pigs were used
from week 3 till week 12 of age From week 3 until 8 pigs were adapted to the different
sanitary conditions after which the dietary treatments were introduced Energy balances
studies were performed from week 9 to 12 During week 9 pigs were allowed ad libitum
access to their diets During week 10 pigs were fed twice daily at 70 of the measured
feed intake during week 9 During week 12 pigs were allowed restricted access to their
diets for 2d prior to a 25h period of feed deprivation for the measurement of FHP These
three experimental weeks are referred to as the ad lib feeding period the restricted
feeding period and the fasting period
Animals and treatments In total 144 (Topigs 20 times Danish Duroc Topigs Helvoirt The
Netherlands Danbred International Herlev Denmark) newborn female piglets were
selected at one week of age in three subsequent batches of 48 pigs on a commercial farm
in The Netherlands and allocated to either the LSC or HSC treatment Per farrowing room
half of the female piglets were selected for LSC and the other half for HSC treatment Only
HSC piglets received vaccinations during the period of the first nine weeks of age At one
week of age HSC piglets were vaccinated against Mycoplasma hyopneumoniae (Porcilis M
Hyo MSD Animal Health Boxmeer The Netherlands by subcutaneous injection in the neck
Piglets of both LSC and HSC treatments were housed in the same rooms until weaning at 21
plusmn 02 d of age
At weaning (at 3 weeks of age) LSC and HSC piglets were transported to the research farm
in Wageningen (plusmn70 km) and housed in separate rooms (LSC and HSC room) Upon arrival
at the research farm all pigs were weighed and allocated to their pen within sanitary
condition (SC) treatment based on BW in order to minimize variation between pens (LSC
batch 1 57 kg LSC batch 2 59 kg LSC batch 3 59 kg HSC batch 1 55 kg HSC batch 2
52 kg HSC batch 3 59 kg) Upon arrival (plusmn 21 d of age) and 2 d thereafter HSC pigs
received an antibiotic injection (Fenflor AUV Cuijk The Netherlands 1 mL per pig im per
time) At the research facility the vaccination program for HSC pigs was continued In week
4 Mycoplasma hyopneumoniae Porcine circovirus type 2 Porcine Reproductive and
Respiratory Syndrome (PRRS) and Lawsonia intracellularis (Porcilis M Hyo Porcilis Circo
Porcilis PRRS all MSD Animal Health Boxmeer The Netherlands and Enterisol Ileitis
Chapter 4
90
Boehringer Ingelheim Alkmaar The Netherlands) at 6 weeks of age against Actinobacillus
pleuropneumoniae and Influenza A virus (Porcilis APP MSD Animal Health Boxmeer The
Netherlands and Gripovac3 Merial Velserbroek The Netherlands) and at 8 weeks of age
against Actinobacillus pleuropneumoniae and Influenza A virus (Porcilis APP MSD Animal
Health Boxmeer The Netherlands and Gripovac3 Merial Velserbroek The Netherlands)
by subcutaneous injection in the neck or in case of Enterisol by oral drench
Housing After arrival until 9 weeks of age pigs were housed in identical pens located in
either a room in which HSC or LSC conditions were applied The HSC room was intensively
cleaned before arrival of each batch of pigs once with high pressure washing and once
disinfected with a mixture of hydrogen peroxide and peracetic acid gas (Destbest 400
Frans Veugen Bedrijfshygiene BV Nederweert The Netherlands) with an ecofogger
(Coldfogger Frans Veugen Bedrijfshygiene BV Nederweert The Netherlands) for 2 h In
addition all people entering the HSC room were obliged to shower change clothes and
were a hairnet and face mask The manure in HSC pens was removed daily
The LSC room was not cleaned and no hygiene protocol was applied A mixture of fresh
manure of three commercial pig farms obtained fresh weekly was spread weekly in the
LSC pens to increase pathogenic pressure The LSC pigs were exposed to nylon bags
containing a mixture of pig manure and straw ground to pass a 1 mm screen as a model
for dust The bags were mounted on a chain above the LSC pens for pigs to play with The
LSC pigs did not receive any medication
During the measurement period (10 until 13 weeks of age) within each batch groups of six
pigs were housed in one of eight identical 40-m3 respiration chambers described by
Heetkamp et al (2015) Each chamber contained one pen of 175 times 285 meter with 40
slatted floor During this period pre-weighed quantities of fresh manure and dust were
introduced weekly in LSC chambers similar to their introduction in the pre-experimental
period The HSC chambers were cleaned and disinfected before start measurement at the
ad lib period (week 9 of age) as was done with the rooms for the pre-period During the
measurement period a strict hygiene protocol was adhered to when entering the HSC
chambers similar to the one described above Temperature in the chambers was
maintained at 20 degC relative humidity at 65 and air velocity at lt 02 ms Pigs were
exposed to artificial light from 0730 to 1930 h (420 lux) and to darkness (35 lux) during the
remainder of the day
Diets and feeding From arrival (start week 3) until week 5 (12 d post weaning) all pigs were
allowed ad libitum access to a commercial diet containing 164 gkg crude protein (CP) 180
kJg gross energy (GE) (Comfort 3 De Heus Animal Nutrition The Netherlands) and from
week 6 until week 9 containing 170 gkg CP and 178 kJg GE (Comfort 4 De Heus Animal
Nutrition The Netherlands) From week 9 onwards pigs were allocated to one of two
treatment diets either containing a basal or a supplemented AA-profile The diets were
Chapter 4
91
formulated to be slightly limiting in Lys (95 of the requirement value for lysine relative to
the dietary net energy value (NE) to prevent that the dietary energy concentration could
limit the growth performance of the pigs in the study (NRC 2012)
The AA-B diet was designed as described in van der Meer et al (2016) Briefly this was
developed by a factorial approach to cover AA requirements for maintenance (skin and hair
losses intestinal endogenous losses and cell turnover) and whole body protein deposition
The AA-S diet was derived from the AA-B profile by increasing the Met Thr and Trp ratio
relative to Lys by 20
The ingredient and nutrient composition of the experimental diets is shown in Table 1 The
diets were isocaloric on an NE basis and contained TiO2 as indigestible marker for
measuring fecal nutrient digestibility The diets were analyzed for AA composition by acid
hydrolysis at 110degC for 23 h and ion-exchange chromatography with post-column
derivatization with ninhydrin and Trp by alkaline hydrolysis at 110 degC for 20 h followed by
ion-exchange chromatography and fluorescence detection (ISO 2005b ISO 2005c) During
the ad libitum feeding period pigs were fed ad libitum from a single space feeder During
the restricted feeding period pigs were fed 70 of their ad libitum intake divided over two
meals at 0730 h and 1530 h fed from a through which allowed all 6 pigs to eat at the same
time Per meal pigs had 30 minutes to eat their meal after which the through was closed to
prevent contamination of feeding troughs with urine
Measurements During the ad libitum restricted feeding period and fasting period gas
exchange of each group of pigs was measured in the calorimetric chambers in 6-min
intervals by measuring exchange of O2 CO2 and CH4 as described by Heetkamp et al
(2015) A CO2 recovery test with the respiration chambers was performed immediately
prior to the start of the experiment according to procedures described by Heetkamp et al
(2015) In the eight chambers 99 964 979 1007 987 983 992 and 1005 of the
CO2 released was recovered A radar device was mounted above each chamber completely
covering the housing area of the pigs to measure physical activity continuously during the
ad libitum restricted and fasting period Complete energy and nitrogen (N) balances were
determined in for the ad libitum and the restricted period (Supplement tables I to IV)
Individual pigs were weighted before and after each balance week In each balance week
manure was collected quantitatively weighed mixed thoroughly and sampled for analysis
of GE DM ash and N Aerial NH3 was collected from a quantified sample of the outgoing
air after trapping in H2SO4 and NH4+ in water that condensed on the heat exchanger For
LSC pigs the contribution of the manure and dust introduced into the pens to the energy
and nitrogen balances was quantified
From each group of six pigs a representative rectal feces sample was obtained in each
balance week by sampling each pig once during 3 subsequent days Fecal samples of
individual pigs were pooled by weight per chamber and stored at -20 for later analysis of
GE DM neutral detergent fibre (NDF) and N and worms (coccidian parasite Ascaris
Chapter 4
92
TrichostrongulusStrongylus other endoparasites P217 De Gezondheidsdienst voor
Dieren Deventer The Netherlands) After the restricted feeding period pigs had restricted
feeding for 2 more days (01 kg diet ∙ kg BW-06∙ d-1) after which they were fasted for 25 h to
measure FHP
Dissection From the fasting heat measurement in the fasting heat period pigs were fed ad
libitum for 4-5 days until dissection At the dissection day three pigs per room were
euthanized on one day between 830 and 1500 h to collect blood samples for further
analysis and lungs for lesion scores The order of euthanizing was balanced per room and
treatment group Pigs were restrained and anaesthetized with an im injection in the neck
with in total 6 mg Zoletilkg BW (Zoletil Virbac Laboratories Carros France) After sedation
they were euthanized by an iv injection of 24 mgkg BW of sodium pentobarbital (Euthasol
20 AST Farma BV The Netherlands) in the ear vein and subsequently blooded by
incision in the neck Blood samples were collected during bleeding in two 9-mL tubes per
animal were filled 1 EDTA tube for blood cell counts (Vacuette Greiner Bio-One
Kremsmuumlnster Austria) and 1 serum tube (Vacuette) for acute-phase protein and natural
antibody (Nab) analysis Blood samples collected in EDTA tubes were immediately stored on
ice and transported to the lab where blood cell counts were performed using a Microcell
counter (Sysmex pocH- iV Diff Toa Medical Electronics Co Ltd Kobe Japan) Blood
samples in serum tubes were allowed to clot for 1 h at room temperature after which
serum was collected after centrifugation for 10 min at 5251 times g at room temperature and
stored at -80degC pending analysis of haptoglobin (Pig haptoglobin Elisa kit catalog number
ab205091 Abcam Cambridge UK) pig major acute-phase protein (Cusabio Pig-MAP ELISA
catalog number CSB-E13425p Cusabio Biotech Co Ltd Wuhan Hubei Province China) C-
reactive protein (CRP Pig CRP Elise kit catalog number ab205089 Abcam Cambridge UK)
and Nab titers against keyhole limpet hemocyanin (KLH) types IgG and IgM were
determined as described by de Koning et al (2015) with the minor modification that a 4-
step dilution (40 160 640 2560 times diluted) of the sera was made instead of a 3-step
dilution
Chemical analysis Samples of diets were pooled per batch of pigs and analysed for DM ash
N GE Ti and NDF content (ISO 1998 ISO 1999 ISO 2005a) Pooled fecal samples were
analysed for DM N GE Ti and NDF content For determination of DM content faeces
were freeze-dried and feces and diets were ground to pass a 1-mm screen before analysis
using a Retsch ZM 100 mill (Retsch GmbH Haan Germany) Dry matter content was
determined by drying at 103 degC Crude ash content was determined by combustion at 550
degC Nitrogen content was determined by kjeldahl in fresh material Neutral detergent fiber
content was analysed according to the method of van Soest et al (1991) with prior
amylase treatment The GE content was analysed using bomb calorimetry (model C7000
calorimeter IKA Werke GmbH amp Co KG Staufen Germany) Ti was analysed after
Chapter 4
93
hydrolysis with concentrated sulphuric acid in the presence of a copper catalyst at 420 degC
and subsequent addition of peroxide (Short et al 1996 Myers et al 2004) All analysis
were carried out in duplicate
Calculations Gross energy intake was calculated as feed intake (supply minus refusals)
multiplied by the GE content of the diet Intake of metabolizable energy (ME) was
determined by subtracting energy excretion in manure and CH4 from the gross energy
intake Heat production (HP) was calculated from consumed volumes of O2 produced
volumes of CO2 and CH4 and quantitative urinary N excretion (Brouwer 1965) and
physical activity of the pigs as measured by radar (Gerrits et al 2015) Energy retention
was calculated as the difference between ME intake and HP Nitrogen retention was
calculated as N intake minus N losses in manure aerial NH3 and NH4+ in water that
condensed on the heat exchanger Protein retained (N retention times 625) and energy
retained as protein (protein retained times 237 kJg) were calculated from N retention Energy
retained as fat was calculated from the difference between total energy retained and
energy retained as protein in the body Apparent total tract digestibility for DM GE NDF
and N was calculated using TiO2 as an indigestible marker (Kotb and Luckey 1972)
Incremental efficiencies and incremental digestion coefficients From data on parameters
related to energy and N utilization and deposition in the body measured in the ad lib and
restricted feeding period incremental energy and nutrient efficiencies were calculated as
the difference in a response parameter X divided by the difference in dietary intake
between the ad lib and restricted feeding period (Fig 41) The incremental efficiency of
energy retained in the body was thus calculated as the increase in energy retained (kJ∙kg
BW-06∙d-1) per extra unit of GE intake digestible energy (DE) or ME intake (kJ∙kg BW-
06∙d-1) Likewise the incremental efficiency of N retention was expressed as a percentage
of extra units of N retained (g N∙kg BW-1∙d-1) per extra unit of gross or digestible N intake
(g N∙kg BW-1∙d-1) Analogously incremental apparent total tract digestion coefficients for
all nutrients analysed were calculated as the difference in digestible nutrient intake
between the ad libitum and restricted feeding periods divided by the difference in gross
intake of that nutrient between both feeding periods (all in gkg BW) As incremental
efficiencies are dependent on the level of feeding (Labussiegravere et al 2011) we chose to
determine these values using feed intake levels close to the maximum voluntary intake ic
using first a period of ad lib feed intake followed by a period of restricted supply set at 70
of the voluntary feed intake
Chapter 4
94
Figure 41 Example for calculating incremental efficiency of intake converted to parameter X The difference in measured parameter X in the ad lib and restricted feeding period divided by the difference in intake between the ad lib and restricted feeding period The outcome is equal to the slope of the equation between the points in the graph and equals the incremental efficiency
Fasting heat production and resting metabolic rate Two days after termination of the
restricted feeding period pigs were fasted in the respiration chambers for measurement of
FHP for 25 h ic from after the morning meal provided at 0730 until 0900 am on the next
day For the ad libitum and the restricted feeding period and the FHP measurement
separately HP was partitioned between heat production related to physical activity and
resting metabolic rate (RMR) using penalised β-spline regression procedures developed
and described by van Klinken et al (2012) The FHP was calculated as the average RMR
during the last 2 h of feed deprivation By using this method there were three missing
values out of 24 observations in total Parameters related to heat production or energy
balance were scaled to BW060 according to Noblet et al (1999) Parameters related to
digestion or N retention were scaled to BW
Statistical analysis Data were analyzed using the GLM procedure of SAS (SAS 93 SAS Inst
Inc Cary NC) with pen as experimental unit for all parameters For all data the normality
of the distribution of studentized residuals was assessed by the ShapirondashWilk statistic If
required transformation of data was performed to obtain normal distribution of residuals
Sanitary conditions diet batch and their interactions were used as fixed effects Values are
presented as least squares means plusmn SEM Effects were considered significant at P le 005
and a trend was defined as 005 lt P le 010
Par
ame
ter
X
Intakerestricted feeding ad lib feeding
period
slope = incrementalefficiencyre
stri
cted
fee
din
g p
erio
dad
lib
fee
din
g p
erio
d
Chapter 4
95
RESULTS
One pig had a volvulus and died just before entering the respiration chambers Therefore
one pen had five instead of six animals in the experimental period No clinical signs of
illness were observed during the experiment in the other pigs All fecal samples were found
to be negative for Ascaris Eimeria spp Trichostrongylus and other endoparasites Five out
of 36 LSC pigs (13) and 8 out of 36 HSC pigs (22) had a small pneumonia lesion in the
lungs at dissection The remainder of the pigs had no lung lesions
In the restricted feeding period pigs were offered 70 of the feed intake of the ad libitum
feeding period supplied in two meals per day Not all groups consumed the feed supplied
within 30 min leading to a contrast in feed intake between periods slightly exceeding the
30 anticipated 39 for LSC and 31 for HSC Due to a technical problem in batch 2 and 3
with the device measuring physical activity in one chamber of the LSC treatment and one
chamber in the HSC treatment the activity measurements in these chambers were not
considered reliable and were therefore discarded
The results of the energy and nitrogen balances are presented as incremental efficiencies
The energy and nitrogen balances of the groups of pigs during the ad libitum and restricted
feeding period are presented in supplemental tables I-IV To facilitate interpretation of
treatment differences in these tables al parameters were standardized to the same level of
feed intake within period by including GE intake as a covariate in the statistical model
Performance Mean BW at weaning was greater for LSC pigs (58 plusmn 01 kg) compared with
HSC pigs (56 plusmn 01 kg P le 001 Table 42) The difference in mean BW at weaning between
sanitary conditions (SC) differed between batches (interaction batch SC P le 001) The
difference in BW for LSC and HSC pigs in batch 2 was greater (+07 plusmn 01 kg) than for batch
1 (+02 plusmn 01 kg) and batch 3 (00 plusmn 01 kg) Mean BW at weaning of batch 3 pigs (59 plusmn 01
kg) was greater compared with batch 1 and 2 pigs (56 plusmn 01 kg P le 001) A batch effect
was still observed for the mean BW at dissection (P le 001) The BW at the dissection day
was lower for LSC (284 plusmn 08 kg) compared with HSC pigs (380 plusmn 08 kg P le 005)
During the ad libitum feeding period ADFI ADG and GF were on average 9 22 and 10
higher in HSC pigs compared with LSC pigs for ADFI ADG and GF respectively (all P lt
001) depending on batch (SC times batch all P le 0001) Differences between SC for these
parameters were in the same direction for ADG (+6 +145 and +245 gd for batch 1 2 and
3 respectively) but not for ADFI (-77 +308 and +81 gd for batch 1 2 and 3 respectively)
and GF (+004 -003 and +016 gg for batch 1 2 and 3 respectively) In the restricted
feeding period pigs were restricted to the level of their intake in the ad libitum feeding
period Hence treatment effects during the ad lib feeding period for ADFI ADG and GF
ratio were sustained in the restricted week
Chapter 4
96
Acute-phase proteins natural antibodies against keyhole limpet hemocyanin in serum and
blood cell counts The LSC pigs showed greater (740 μgmL) haptoglobin and lower (54
μgmL) CRP concentrations in serum than HSC pigs (P le 005 Table 43) The LSC pigs had
(02 times 1012L) a lower RBC count and a (04 mmolL) lower haemoglobin concentration and
(1) lower haematocrit value in blood than HSC pigs (P le 005) For mean corpuscular
volume (MCV) an interaction was found between SC times batch (P le 001) caused by a positive
difference between LSC and HSC pigs in batch 1 but negative differences in batches 2 and
3
Apparent total tract digestion and incremental ATTD coefficients The average apparent total
tract digestibility (ATTD) of DM GE and N for the ad libitum and restricted feeding period
was lower for LSC than for HSC pigs (-3 -3 and -7 for DM GE and N respectively all P
le 00001) Incremental ATTD coefficients for DM GE NDF and N were not affected by SC (P
gt 005) The incremental ATTD coefficient for N was affected by batch (P le 005) being 69
77 and 74 for batch 1 2 and 3 respectively A tendency for SC times diet was found for the
ATTD coefficient for N (005 lt P le 010) the value being higher for the AA-S diet than for
the AA-B diet in LSC pigs while the opposite result was obtained in HSC pigs
Incremental efficiencies of energy and nitrogen retained as protein or fat and fasting heat
production Incremental responses of heat production to increased GE and DE but not ME
intake were 7 and 8 points higher for HSC than for LSC pigs respectively (P le 001)
Incremental responses of retained energy to increased GE DE and ME intake were
unaffected by experimental treatments (P gt 005) Incremental responses of protein
deposition to increased GE DE or ME intake and to increased N or digestible N intake were
substantially higher for HSC compared with LSC pigs (all P le 005) For example the
incremental N efficiency was nearly 20 points higher in HSC (73) compared with LSC
(53) pigs Conversely the incremental response in fat deposition to increased ME intake
but not to increased GE or DE intake was higher in LSC compared to HSC pigs (P le 005)
Surprisingly none of the incremental efficiencies were affected by dietary AA
supplementation
Fasting heat production was (55 kJ BW06 day-1) greater in LSC than HSC pigs (P le 005)
Chapter 4
97
Table 41 Ingredient and nutrient composition of the experimental diets
Item Ingredient gkg of feed
AA-B1 AA-S1
Wheat 3086 3086
Maize 2000 2000
Barley 2000 2000
Soybean meal 1845 1845
Maize starch 258 234
Sugarcane molasses 200 200
Limestone 147 147
Monocalcium phosphate 90 90
Soybean oil 192 192
Vitamin + mineral mix2 50 50
Salt 35 35
L-lysine HCl 34 34
Titanium dioxide 25 25
Sodium bicarbonate 21 21
L-threonine 10 21
L-tryptophan 00 04
DL-methionine 04 13
L-Valine 03 03
Analyzed nutrients composition gkg
NE MJkg3 98 98
DM 8896 8898
Crude protein4 166 167
Starch 474 472
Lys4 98 101
Thr4 66 78
Trp4 22 26
Met + Cys4 52 62
Ile4 82 83
Arg4 118 122
Phe4 94 99
His4 55 53
Leu4 150 153
Tyr4 62 62
Val4 96 98 1 AA-B = basal dietary AA profile AA-S= supplemented dietary AA profile containing 20 more Met Thr and Trp compared to the profile in the basal profile 2 Supplied the following per kilogram of diet 30 mg riboflavin 20 mg niacine 20 mg d-pantothenic acid 10 mg choline chloride 0015 mg cyanocobalamin 40 mg dl-α-tocopheryl acetate 15 mg menadione 6000 IU retinyl acetate 1200 IU cholecalciferol 02 mg folic acid 10 mg thiamin 10 mg pyridoxine HCl 50 mg manganese oxide 267 mg iron SO4middotH2O 60 mg copper SO4middot5H2O 140 mg zinc SO4middotH2O 044 mg disodium selenium trioxide10 mg potassium iodate 3 Based on chemical composition digestibility and energy values for pigs from CVB (2011)
Table 42 Performance data of pigs kept under low or high sanitary conditions and fed diets differing in AA composition
1 LSC= Low sanitary conditions HSC= High sanitary conditions 2 AA-B = basal dietary AA profile AA-S= supplemented dietary AA profile containing 20 more Met Thr and Trp compared to the profile in the basal profile3 n = number of pens a pen contained 6 pigs 4 SEM= pooled standard error of the mean means are presented as least square
means 5Considered significant when P le 005 considered as tendency when 005 lt P le 010
LSC1 HSC1 P-values5
Item AA-B2 AA-S2 AA-B AA-S SEM4 SC diet batch SCtimesdiet SCtimesbatch diettimesbatch
n3 6 6 6 6
BW week 1 kg 24 25 22 24 01 022 016 025 061 028 035
BW weaning (plusmn 21 d) kg 58 58 55 56 01 0001 082 001 080 0004 081
BW start ad lib feeding kg 178 190 242 245 05 lt0001 015 lt0001 042 021 042
BW start restricted feeding kg 216 234 293 295 06 lt0001 013 lt0001 020 083 074
ADFI g
ad lib feeding period 1136 1200 1292 1252 32 0006 072 0001 013 0001 046
restricted feeding period 743 797 973 923 29 lt0001 095 017 010 002 055
ADG g
ad lib feeding period 545 636 737 709 26 00002 025 083 004 0008 055
restricted feeding period 299 332 405 367 13 lt0001 088 003 002 lt0001 014
GF gg
ad lib feeding period 048 054 057 056 002 0007 019 00004 010 0001 087
restricted feeding period 040 042 042 039 001 084 078 002 014 00001 028
Table 43 Blood parameters of pig kept under low or high sanitary conditions and fed diets differing in AA composition
1 LSC = Low sanitary conditions HSC = High sanitary conditions 2 AA-B = basal dietary AA profile AA-S= supplemented dietary AA profile containing 20 more Met Thr and Trp compared to the profile in the basal profile 3 n = number of pens a pen contained 6 pigs and 3 pigs were sampled for blood 4 SEM = pooled standard error of the mean means are presented as least square means 5 Considered significant when P le 005 considered as tendency when 005 lt P le 010
LSC1 HSC1 P-values5
Item AA-B2 AA-S2 AA-B AA-S SEM4 SC diet batch SCtimesdiet SCtimesbatch diettimesbatch
n3 6 6 6 6
pigMAP microgmL 783 826 855 816 62 062 097 002 052 047 050
Haptoglobin microgmL 1884 1502 1156 750 326 004 009 006 071 052 045
CRP microgmL 170 167 251 194 23 003 022 080 025 067 090
IgG_KLH 45 47 47 40 03 021 035 099 007 074 054
IgM_KLH 48 51 49 49 02 078 033 073 038 023 049
WBC 109 L 126 139 137 133 07 076 057 016 024 073 062
RBC 1012L 57 57 58 60 01 002 014 007 025 012 077
Hb mmolL 65 64 68 68 01 0002 080 0003 029 042 011
Ht 320 316 324 332 04 001 061 001 012 050 034
MCV 10-15L 562 554 563 554 04 094 007 0003 094 0003 015
PTL 109L 405 409 420 427 21 046 080 061 094 034 023
Table 44 Apparent total tract digestibilities averaged over an ad libitum and restricted feeding period for pigs kept under low (LSC) or high (HSC) sanitary conditions and fed diets differing in AA composition
LSC
HSC P-values4
Item AA-B1 AA-S1 AA-B AA-S SEM3 SC diet Week batch SCtimesdiet SCtimesbatch
n2 6 6 6 6
DM 799 799 831 830 03 lt0001 096 068 024 074 046
GE 801 806 835 836 04 lt0001 046 038 024 067 041
NDF 392 415 415 415 15 015 096 075 029 094 007
N 699 709 777 773 06 lt0001 066 053 014 027 080 1 AA-B = basal dietary AA profile AA-S= supplemented dietary AA profile containing 20 more Met Thr and Trp compared to the profile in the basal profile 2 n = number of pens a pen contained 6 pigs 3 SEM = pooled standard error of the mean means are presented as least square means 4 Considered significant when P le 005 considered as tendency when 005 lt P le 010 Table 45 Incremental apparent total tract digestibility (ATTD) coefficients in pigs allowed ad libitum or 70 of ad libitum access to diets differing in AA composition and kept under low (LSC) or high (HSC) sanitary conditions
LSC
HSC
P-values4
Increment in intake of Response parameter AA-B1
AA-S1
AA-B
AA-S
SEM3
SC AA batch SCtimesAA
n2 6 6 6 6
DM gmiddotkg BWmiddotd-1 ATTD DM gmiddotkg BWmiddotd-1 82 84 84 82 2 086 084 013 026
GE gmiddotkg BWmiddotd-1 ATTD GE gmiddotkg BWmiddotd-1 80 82 82 80 2 096 084 017 032
NDF gmiddotkg BWmiddotd-1 ATTD NDF gmiddotkg BWmiddotd-1 42 45 35 34 7 022 085 070 076
N gmiddotkg BWmiddotd-1 ATTD N gmiddotkg BWmiddotd-1 70
74
77
72
2
021 089 003 010 1 AA-B = basal dietary AA profile AA-S= supplemented dietary AA profile containing 20 more Met Thr and Trp compared to the profile in the basal profile 2n = number of
pens a pen contained 6 pigs 3 SEM = pooled standard error of the mean means are presented as least square means 4 Considered significant when P le 005 considered as
tendency when 005 lt P le 010
Table 46 Incremental responses of heat production activity related heat and body retention to increases in dietary energy and N intake in pigs of pigs kept under low (LSC) or
high (HSC) sanitary conditions and fed diets differing in AA composition
LSC1 HSC1 P-values5
Increment in intake of Response parameter AA-B2 AA-S2 AA-B AA-S SEM4 SC diet batch6 SCtimesdiet
n3 6 6 6 6 GE kJmiddotkg BW-06middotd-1 Heat production kJmiddotkg BW-06middotd-1 023 022 030 028 002 00005 039 013 063 GE kJmiddotkg BW-06middotd-1 Activity heat kJmiddotkg BW-06middotd-1 047 -005 -147 125 10 074 028 021 012 GE kJmiddotkg BW-06middotd-1 Energy retention kJmiddotkg BW-06middotd-1 051 052 055 059 005 036 064 095 081 GE kJmiddotkg BW-06middotd-1 Protein retention kJmiddotkg BW-06middotd-1 012 013 019 017 002 0004 085 064 054 GE kJmiddotkg BW-06middotd-2 Fat retention kJmiddotkg BW-06middotd-1 039 039 036 041 004 095 049 088 058 DE kJmiddotkg BW-06middotd-1 Heat production kJmiddotkg BW-06middotd-1 028
027
036
035
002
00003 043 008 089
DE kJmiddotkg BW-06middotd-1 Activity heat kJmiddotkg BW-06middotd-1 064
00
-169
151
12
074 029 019 012 DE kJmiddotkg BW-06middotd-1 Energy retention kJmiddotkg BW-06middotd-1 065
064
067
074
007
039 070 098 060
DE kJmiddotkg BW-06middotd-1 Protein retention kJmiddotkg BW-06middotd-1 016
016
023
022
002
0005 087 052 078 DE kJmiddotkg BW-06middotd-1 Fat retention kJmiddotkg BW-06middotd-1 049
048
044
052
005
095 057 097 043
ME kJmiddotkg BW-06middotd-1 Heat production kJmiddotkg BW-06middotd-1 032 030 035 033 003 037 056 048 086 ME kJmiddotkg BW-06middotd-1 Activity heat kJmiddotkg BW-06middotd-1 047 -025 -192 133 13 069 029 020 015 ME kJmiddotkg BW-06middotd-1 Energy retention kJmiddotkg BW-06middotd-1 068 070 065 067 003 037 056 048 086 ME kJmiddotkg BW-06middotd-1 Protein retention kJmiddotkg BW-06middotd-1 017 017 022 020 001 002 043 068 042 ME kJmiddotkg BW-06middotd-1 Fat retention kJmiddotkg BW-06middotd-1 051 053 043 047 003 004 032 031 058 GE kJmiddotkg BW-06middotd-1 ME intake kJmiddotkg BW-06middotd-1 074 074 085 087 005 003 08 066 091 DE kJmiddotkg BW-06middotd-1 ME intake kJmiddotkg BW-06middotd-1 093 090 104 109 007 005 085 073 056 N gmiddotkg BW-1middotd-1 N retention gmiddotkg BW-1middotd-1 051 055 075 071 006 0003 099 060 052 Digested N7 gmiddotkg BW-1middotd-1 N retention gmiddotkg BW-1middotd-1 075 075 098 098 008 0007 098 034 099 FHP8 kJkg BW06d-1 753 747 708 683 25 004 054 013 069
1 LSC = Low sanitary conditions HSC = High sanitary conditions2 AA-B = basal dietary AA profile AA-S= supplemented dietary AA profile containing 20 more Met Thr and Trp compared to the profile in the basal profile3 n = number of pens a pen contained 6 pigs 4 SEM = pooled standard error of the mean means are presented as least square means5 Considered significant when P le 005 considered as tendency when 005 lt P le 0106 There were no interactions with batch7 Apparent total tract digested N-intake 8 FHP = fasting heat production
Chapter 4
102
DISCUSSION
The main objective of the present experiment was to quantify the difference in energy
requirements for maintenance and in incremental efficiencies for energy and protein
deposition of clinically healthy pigs kept under low or high sanitary conditions and fed a
diet with or without extra supplemented Met Thr and Trp The measured FHP was used as
a proxy for the energy requirement for maintenance Incremental efficiencies for energy
and N retention were derived from nutrient digestibility and retention values obtained with
animals fed ad libitum or at a level of 70 of ad libitum intake
Methodological issues There were several batch effects and interactions found for SC times
batch in this study which means that the treatment effects varied among batches The
batch effect was a composite effect of the batch of pigs originating from the same farm
but taken at a different point in time the effect of batches of manure and dust introduced
into the pens and the effect of time As housing conditions were well standardized we
assume that the batch effect is dominated by differences between batches of pigs and
batches of manure It should be noted that the direction of most observed effects
however was not affected by batch and that none of the incremental efficiencies were
affected by batch Variation in responses between experiments and between batches of
animals in the same experiment are commonly observed when imposing either challenges
with live micro-organisms and multifactorial challenges as used in the present study The
observed variation among batches illustrates the importance to carefully consider variation
among batches rather than reducing experimental variation by the use of a single batch as
often done in studies applying similar models (Williams et al 1997 Le Flocrsquoh et al 2009
Pastorelli et al 2012a)
In our study the contrast in feed intake allowing the determination of incremental nutrient
efficiencies was created within each group of pigs The advantages of this approach are
that the effect of feed intake is estimated using the same animals and that it enables the
incremental efficiencies to be estimated at levels of feed intake close to the maximum
voluntary feed intake level The disadvantage is that the restricted period inevitably follows
the ad libitum period and that it is conducted later in time Effects of the latter are
minimized by standardizing the experimental housing conditions (hygiene management
temperature relative humidity air velocity) To account for differences in BW between
weeks we expressed energy metabolism parameters relative to BW060 (Noblet et al 1999)
In addition we found our conclusions unaltered when expressing the results relative to the
traditionally used BW075
Contrast in sanitary conditions affecting pig performance and the immune system The
contrast in SC in the present study was created by a combination of factors vaccinations
Chapter 4
103
against specific pathogens a preventive antibiotic treatment application of a hygiene
protocol and weekly introduction of a mixture of manure and dust in pens The slightly
higher BW at weaning for LSC pigs likely results from the Mycoplasma vaccination that HSC
pigs received in the period just before weaning (Thacker et al 2000) After weaning until
the end of the experiment LSC pigs had substantially lower BW and BW gain than HSC pigs
At dissection day the difference in BW for LSC and HSC pigs was 10 kg The difference in
weight gain during the experiment was caused both by a reduction in ADFI and GF In
addition LSC pigs had a greater haptoglobin concentration in blood compared with HSC
pigs Taken together the lower BW lower ADFI lower ADG greater haptoglobin levels in
LSC pigs and the absence of clinical signs of illness in both SC treatment groups indicate a
contrast in subclinical health between LSC and HSC pigs slightly more severe than a
previous study using a similar model of ISS (van der Meer et al 2016)
Because pigMAP haptoglobin and CRP are all positive acute phase proteins the blood
concentrations of these acute phase proteins were expected to be greater for LSC pigs than
for HSC pigs The results did however not meet the expectations as only the haptoglobin
concentration was significantly greater in LSC pigs and CRP concentrations were even
lower The absence of an effect of subclinical ISS on pigMAP concentration was also found
in van der Meer et al (2016) and suggests a less sensitive response for pigMAP compared
with haptoglobin as found in a number of other studies as well (Heegaard et al 1998
Kampman-van de Hoek et al 2016 Saco et al 2016) We have no explanation for the
unexpected lower CRP level in blood in LSC compared with HSC pigs Haptoglobin and CRP
have different functions and may therefore respond differently to low grade inflammation
Chen et al (2003) who determined haptoglobin and CRP concentrations in pig blood at
different farms found also increased haptoglobin concentrations in subclinical ill pigs but
no differences in CRP concentrations Based on their observations it was concluded that
haptoglobin is a better indicator of inflammatory reactions in pig herds than serum CRP
Natural antibodies levels against KLH as measure of the response to low grade immune
stimulation were not significantly different which was in contrast with higher values found
for LSC compared with HSC pigs in a previous experiment (van der Meer et al 2016) In
that study the effect was most pronounced shortly after the transfer of the piglets to the
novel sanitary conditions In the current study KLH specific natural antibodies were
measured only 10 weeks after the time point at which the piglets were exposed to the
different sanitary conditions The increased infectious pressure that likely occurs at low
sanitary conditions might be the stimulus that causes a short term increase in NAb levels
These increased NAb levels may gradually disappear on the long term The period of
measurement might therefore have contributed to the lack of effect on the antibody
response against KLH in the current experiment Furthermore the SC to create a contrast in
ISS were different between the two experiments For example manure was introduced
more often and was a mixture of manure from more farms compared with the first
experiment introduction of dust in the pens was not applied in the previous experiment
Chapter 4
104
pigs were housed in groups of 6 instead of 9 and pigs were housed in experimental
facilities compared with a commercial pig farm in the previous experiment We cannot
exclude that these differences in sanitary conditions are responsible for the contradicting
observations
Dietary amino acid supplementation The basal AA profile was designed based on a factorial
estimate of the requirements for protein deposition basal endogenous losses cell
turnover and skin and hair losses slightly increasing Met and Trp (Knowles et al 1998
Jansman et al 2010) The rationale for this choice was that requirement estimates
originating from dose response studies will always include the requirements for meeting
increased needs associated with ISS under the conditions of that study Supplementing
Met Thr and Trp was based on studies in which increased requirements for these AA were
demonstrated mostly using clinical models (Melchior et al 2004 Le Flocrsquoh et al 2008
Litvak et al 2013 Rakhshandeh et al 2014) and the level of supplementation was
arbitrarily set to 20 In a previous study we showed that performance of LSC pigs was
increased by a similar supplementation strategy with Met Thr and Trp In the present
study however pig performance was not improved by supplementation of these AA
A reason for the lack of effect might be that pigs in the current study were exposed to the
contrast in SC at younger age (weaning age 21 d of age) than in the previous study (10
weeks of age van der Meer et al 2016) while the measurements in both studies started
at the same age (9-10 weeks of age) The effects of the extra supplemented AA in the
previous study was mainly expressed in the starter phase (week 10 until 15 of age) in HSC
pigs and may result from compensatory growth performance when introduced to the clean
environment after a period of reduced growth in the pre-experimental period as also
observed by Kampman-van de Hoek et al (2016) In our previous study the reduced
growth in the pre-experimental period was related to the administration of a number of
vaccinations in this period (van der Meer et al 2016) In the current study such an effect
might not have occurred as the period of measurements started 6 weeks later We find in
contrast to other published information using clinical models of ISS (Melchior et al 2004
Le Flocrsquoh et al 2008 Rakhshandeh et al 2014 Kampman-van de Hoek et al 2015) no
effects of AA supplementation on performance and on incremental efficiency of N
utilization Also our findings do not corroborate the effects of SC on Trp as was found by Le
Flocrsquoh et al (2009)
Use of dietary energy and protein We expected GF ratio to be reduced in case of ISS due to
the LSC treatment comparable to results from other ISS studies (Williams et al 1997 Le
Floch et al 2006) We found a higher FHP for LSC compared with HSC pigs which reflects a
lower energetic efficiency for LSC compared with HSC pigs due to an increased energy
expenditure for maintenance purposes of which eg functioning of the immune system is
Chapter 4
105
part of The extra energy required by LSC pigs compared with HSC pigs was estimated at 55
kJ kg BW06d-1 when considering a HSC pig as reference
The incremental efficiencies for ATTD of DM GE NDF and N were not influenced by the
different treatments however the average ATTD of DM GE and N were reduced for LSC
pigs compared with HSC pigs with 3 3 and 7 respectively for the ad libitum and restricted
period together A reduced ATTD of N and DM for LSC pigs was in line with van der Meer et
al (2016) and Kampman-van de Hoek (2016) where 1 and 4 reduced ATTD N values and
1 and 1 reduced ATTD DM values were reported for LSC pigs compared with HSC pigs
The reduced ATTD found for LSC pigs might be due to intestinal infections intestinal
damage or an increased digesta passage rate (Sandberg et al 2006 Pastorelli et al
2012b)
The incremental efficiencies for energy retention were not affected by the different
treatments however a substantial reduction in the utilization of dietary N for N retention
was found for LSC compared with HSC pigs The reduced incremental efficiency for N
retention of LSC pigs was due to a difference in the gross efficiency of retained N of 71
and 79 in the ad libitum feeding period while the gross efficiency for retained N in the
restricted feeding period was similar (71) for LSC and HSC pigs The difference found for
the incremental efficiency of retained N between LSC and HSC might be due to a reduced
maximal rate of protein deposition for LSC pigs compared with HSC pigs an increased rate
of AA oxidation due to increased protein turnover for LSC pigs or an imbalance of AA
available for protein retention in the body in LSC pigs The latter however is unlikely when
considering the lack of effect of dietary supplementation of Met Thr and Trp unless
another essential AA was limiting protein deposition in LSC pigs or the dietary protein
supply in general was limiting
The incremental efficiency of ingested energy for fat retention was greater for LSC pigs
than HSC pigs when calculated for ME intake retained as fat however this effect was
absent when calculated for GE or DE intake retained as fat The significant effect found for
the incremental efficiency of ME intake retained as fat was likely related to a higher urinary
energy excretion in LSC pigs compared with HSC pigs coinciding with an increased urinary
N output Hence it is unlikely that incremental efficiencies of DE for fat retention were
affected by SC
In conclusion a chronic low grade stimulation of the immune system by imposing low
sanitary conditions to pigs increases FHP by 8 and reduces apparent total tract nutrient
digestibility particularly of protein Under such conditions the incremental efficiency of
digestion is unaffected but the incremental N utilization for body protein deposition is
reduced by 20 points The incremental efficiency of digestible energy for fat deposition is
unaffected by sanitary conditions Dietary supplementation of Met Thr and Trp did not
affect incremental efficiencies for energy and protein deposition
Chapter 4
106
REFERENCES
Benson B N C C Calvert E Roura and K C Klasing 1993 Dietary energy source and density modulate the expression of
immunologic stress in chicks J Nutr 123 1714-1723 Chen H H J H Lin H P Fung L L Ho P C Yang W C Lee Y P Lee and R M Chu 2003 Serum acute phase proteins and
swine health status Can J Vet Res 67 283 de Ridder K C L Levesque J K Htoo and C F M de Lange 2012 Immune system stimulation reduces the efficiency of
tryptophan utilization for body protein deposition in growing pigs J Anim Sci 90 3485-3491 Gerrits W J J M J W Heetkamp E Labussiegravere and J B van Klinken 2015 Quantifying physical activity heat in farm animals In
W J J Gerrits and E Labussiegravere editors Indirect calorimetry Wageningen Academic Publishers Wageningen p 155-170
Heegaard P M H J Klausen J P Nielsen N Gonzaacutelez-Ramoumln M Pintildeeiro F Lampreave and M A Alava 1998 The Porcine Acute Phase response to infection with actinobacillus pleuropneumoniae haptoglobin C-reactive protein major acute phase protein and serum amyloid A protein are sensitive indicators of infection Comp Biochem Phys B 119 365-373
Heetkamp M J W S J J Alferink T Zandtra P Hendriks H van den Brand and W J J Gerrits 2015 Design of climate respiration chmabers adjustable to the metabolic mass of subjects In W J J Gerrits and E Labussiegraverre editors Indirect calorimetry Wageningen Academic Publishers Wageningen p 35-56
Humphrey B D and K C Klasing 2004 Modulation of nutrient metabolism and homeostasis by the immune system Worlds Poult Sci J 60 90-100
International organisation for standardisation (ISO) 1998 Animal feeding stuff-Determination of gross calorific value- Bomb calorimetry method ISO 9831 Int Organ Stand Geneve Switzerland
International organisation for standardisation (ISO) 1999 Animal feeding stuff-Determination of moisture and other volatile matter content ISO 6496 Int Organ Stand Geneve Switzerland
International organisation for standardisation (ISO) 2002 Animal feeding stuff-Determination of crude ash ISO 5984 Int Organ Stand Geneve Switzerland
International Organization for Standardization (ISO) 2005a Animal feeding stuffs ndash Determination of nitrogen content and calculation of crude protein content ndash Part 1 Kjeldahl method ISO 5983 Int Organ Stand Geneve Switzerland
International Organization for Standardization (ISO) 2005b Animal feeding stuffs ndash Determination of amino acids content ISO 13903 Int Organ Stand Geneve Switzerland
International Organization for Standardization (ISO) 2005c Animal feeding stuffs ndash Determination of tryptophan content ISO 13903 Int Organ Stand Geneve Switzerland
Jansman A J M J T M van Diepen and D Melchior 2010 The effect of diet composition on tryptophan requirement of young piglets J Anim Sci 88 1017-1027
Kampman-van de Hoek E A J M Jansman J J G C van den Borne C M C van der Peet-Schwering H van Beers-Schreur and W J J Gerrits 2016 Dietary amino acid deficiency reduces the utilization of amino acids for growth in growing pigs after a period of poor health J Nutr 146 51-58
Kampman-van de Hoek E P sakkas W J J Gerrits J J G C van den Borne C M C van der Peet-Schwering and A J M Jansman 2015 Induced lung inflammation and dietary protein supply affect nitrogen retention and amino acid metabolism in growing pigs Brit J Nutr 113 414-425
Kim J C B P Mullan B Frey H G Payne and J R Pluske 2012 Whole body protein deposition and plasma amino acid profiles in growing andor finishing pigs fed increasing levels of sulfur amino acids with and without Escherichia coli lipopolysaccharide challenge J Anim Sci 90 362-365
Knowles T L Southern and T Bidner 1998 Ratio of total sulfur amino acids to lysine for finishing pigs J Anim Sci 76 1081-1090 Kotb A and T Luckey 1972 Markers in nutrition Nutr Abstr Rev 42813-845 Labussiegravere E J van Milgen C F M de Lange and J Noblet 2011 Maintenance energy requirements of growing pigs and calves
are influenced by feeding level J Nutr 141 1855-1861 Le Floch N F Gondret J J Matte and H Quesnel 2012 Towards amino acid recommendations for specific physiological and
patho-physiological states in pigs Proc Nutr Soc 71 425-432 Le Floch N C Jondreville J J Matte and B Seve 2006 Importance of sanitary environment for growth performance and plasma
nutrient homeostasis during the post-weaning period in piglets Arch Anim Nutr 60 23-34 Le Flocrsquoh N L LeBellego J J Matte D Melchior and B Segraveve 2009 The effect of sanitary status degradation and dietary
tryptophan content on growth rate and tryptophan metabolism in weaning pigs J Anim Sci 87 1686-1694 Le Flocrsquoh N D Melchior and B Segraveve 2008 Dietary tryptophan helps to preserve tryptophan homeostasis in pigs suffering from
lung inflammation J Anim Sci 86 3473-3479 Litvak N A Rakhshandeh J Htoo and C de Lange 2013 Immune system stimulation increases the optimal dietary methionine to
methionine plus cysteine ratio in growing pigs J Anim Sci 91 4188-4196 Lochmiller R L and C Deerenberg 2000 Trade-offs in evolutionary immunology Just what is the cost of immunity Oikos 88 87-
98 Melchior D B Segraveve and N Le Flocrsquoh 2004 Chronic lung inflammation affects plasma amino acid concentrations in pigs J Anim
Sci 82 1091-1099 Myers W D P A Ludden V Nayigihugu and B W Hess 2004 Technical Note A procedure for the preparation and quantitative
analysis of samples for titanium dioxide J Anim Sci 82 179-183
Chapter 4
107
Noblet J C Karege S Dubois and J van Milgen 1999 Metabolic utilization of energy and maintenance requirements in growing pigs effects of sex and genotype J Anim Sci 77 1208-1216
NRC 2012 Nutrient Requirements of Swine 11th ed Natl Acad Press Washington DC
Parmentier H K S Bronkhorst M G Nieuwland G V Reilingh J M van der Linden M J Heetkamp B Kemp J W Schrama M
W Verstegen and H van den Brand 2002 Increased fat deposition after repeated immunization in growing chickens
Poult Sci 81 1308-1316
Pastorelli H N Le Floch E merlot M C Meunier-Salauumln J van Milgen and L Montagne 2012a Sanitary housing conditions
modify the performance and behavioural response of weaned pigs to feed- and housing-related stressors Anim 6
1811-1820
Pastorelli H J van Milgen P Lovatto and L Montagne 2012b Meta-analysis of feed intake and growth responses of growing
pigs after a sanitary challenge Anim 6 952-961
Rakhshandeh A J K Htoo and C F M de Lange 2010 Immune system stimulation of growing pigs does not alter apparent ileal amino acid digestibility but reduces the ratio between whole body nitrogen and sulfur retention Livest Sci 134 21-23
Rakhshandeh A J K Htoo N Karrow S P Miller and C F M de Lange 2014 Impact of immune system stimulation on the ileal nutrient digestibility and utilisation of methionine plus cysteine intake for whole-body protein deposition in growing pigs Brit J Nutr 111 101-110
Saco Y F Martiacutenez-Lobo M Cortey R Pato R Pentildea J Segaleacutes C Prieto and A Bossols 2016 C-reactive protein haptoglobin and Pig-Major acute phase protein profiles of pigs infected experimentally by different isolates of porcine reproductive and respiratory syndrome virus Vet Microbio 183 9-15
Sandberg F B G C Emmans and I Kyriazakis 2006 A model for predicting feed intake of growing animals during exposure to pathogens J Anim Sci 84 1552-1566
Short F J P Gorton J Wiseman and K N Boorman 1996 Determination of titanium dioxide added as an inert marker in chicken digestibility studies Anim Feed Sci Tech 59 215-221
Thacker E L B J Thacker M Kuhn P A Hawkins and W R Waters 2000 Evaluation of local and systemic immune responses induced by intramuscular injection of a Mycoplasma hyopneumoniae bacterin to pigs Am J Vet Res 61 1384-1389
van der Meer Y A Lammers A J M Jansman M M J A Rijnen W H Hendriks and W J J Gerrits 2016 Performance of pigs kept under different sanitary conditions affected by protein intake and amino acid supplementation J Anim Sci 94 4704-4719
van Soest P v J Robertson and B Lewis 1991 Methods for dietary fiber neutral detergent fiber and nonstarch polysaccharides in relation to animal nutrition J Dairy Sci 74 3583-3597
Williams N H T S Stahly and D R Zimmerman 1997 Effect of chronic immune system activation on the rate efficiency and composition of growth and lysine needs of pigs fed from 6 to 27 kg J Anim Sci 75 2463-2471
SUPPLEMENTAL TABLES Supplemental table I Least square means of energy balance parameters for ad libitum fed pigs kept under low or high sanitary conditions and fed diets containing basal or supplemented amino acid profiles All parameters except gross energy (GE) intake were adjusted to a similar level of feed intake by including GE intake as a covariate
LSC1 HSC1 P-values4
Item gkg BW060day
AA-B2
AA-S2
AA-B
AA-S
SEM3
SC diet batch SCtimesdiet SCtimesbatch diettimesbatch GE intake6
BW kg
178
190
242
245
06
lt0001 015 lt0001 042 021 042 - GE intake
2843
3007
2872
2843
56
0246 024 00008 010 lt0001 006 -
ME intake5 2285 2329 2449 2439 36 0002 064 044 049 023 015 0002 MEGE ratio 79 81 85 84 1 0003 068 052 044 022 018 030 Methane production 38 48 92 105 11 00002 028 026 089 096 080 026 Heat production 1373 1368 1429 1401 20 004 043 005 058 024 061 010 Energy retention total 912 961 1020 1039 47 007 048 013 077 036 049 005 Energy retention protein 358 376 440 421 11 lt0001 097 028 015 042 071 002 Energy retention fat 554 585 580 618 41 048 042 013 094 035 050 010
Supplemental table II Least square means of energy balance parameters restricted fed pigs kept under low or high sanitary conditions and fed diets containing basal or supplemented amino acid profiles All parameters except gross energy (GE) intake were adjusted to a similar level of feed intake by including GE intake as a covariate
LSC1 HSC1 P-values4
Item gkg BW060day AA-B2 AA-S2 AA-B AA-S SEM3 SC diet batch SCtimesdiet SCtimesbatch diettimesbatch GE intake6
BW kg
216
234
293
295
06
lt0001 013 lt0001 020 083 074 - GE intake
1819
1934
2035
1933
49
005 089 0007 004 0001 024 -
ME intake5 1592 1601 1636 1615 11 003 057 074 025 006 041 lt0001 MEGE ratio 82 83 85 84 1 004 065 075 026 009 033 052 Methane production 46 52 103 103 08 lt0001 061 062 074 067 046 071 Heat production 1162 1159 1153 1142 17 049 064 0008 083 077 097 002 Energy retention total 430 442 483 473 21 008 094 001 064 041 072 lt0001 Energy retention protein 244 249 261 254 6 011 082 008 039 021 006 lt0001 Energy retention fat 185 193 222 219 18 013 088 002 079 062 098 00002
1 LSC = Low sanitary conditions HSC = High sanitary conditions2 AA-B = basal dietary AA profile AA-S= supplemented dietary AA profile containing 20 more Met Thr and Trp compared to the profile in the basal profile3 SEM = pooled standard error of the mean means are presented as least square means4 Considered significant when P le 005 considered as tendency when 005 lt P le 010 5 ME = metabolizable energy 6 This value represents the significance of the covariable GE-intake
Supplemental table III Least square means of nitrogen (N) balance parameters for ad libitum fed pigs kept under low or high sanitary conditions and fed diets containing basal or supplemented amino acid profiles All parameters were adjusted to a similar level of feed intake by including gross energy (GE) intake as a covariate
Supplemental table IV Least square means of nitrogen (N) balance parameters for restricted fed pigs kept under low or high sanitary conditions and fed diets containing basal or supplemented amino acid profiles All parameters were adjusted to a similar level of feed intake by including gross energy (GE) intake as a covariate
LSC1 HSC1 P-values4
Item AA-B2 AA-S2 AA-B AA-S SEM3 SC diet batch SCtimesdiet SCtimesbatch diettimesbatch GE intake5
BW kg 216
234
293
295
06
lt0001 013 lt0001 020 083 074 -
N intake 089 086 081 079 000 lt0001 0002 lt0001 093 050 006 lt0001
N retention 046 047 045 044 001 015 064 0006 043 019 017 00007
N retentionN intake 052 054 056 055 001 011 048 009 035 026 002 015 1 LSC = Low sanitary conditions HSC = High sanitary conditions2 AA-B = basal dietary AA profile AA-S= supplemented dietary AA profile containing 20 more Met Thr and Trp compared to the profile in the basal profile3 SEM = pooled standard error of the mean means are presented as least square means4 Considered significant when P le 005 considered as tendency when 005 lt P le 010 5 GE = gross energy this value represents the significance of the covariable GE-intake
LSC1 HSC1 P-values4
Item AA-B2 AA-S2 AA-B AA-S SEM3 SC diet batch SCtimesdiet SCtimesbatch diettimesbatch GE intake5
BW kg 178
190
242
245
06
lt0001 015 lt0001 042 021 042 -
N intake 142 138 127 124 001 lt0001 002 lt0001 055 096 026 lt0001
N retention 073 075 080 076 002 009 081 002 021 038 053 005
N retentionN intake 051 055 063 061 002 00001 069 042 014 046 066 093
Chapter 5
Diurnal patterns of heat production and oxidation of
carbohydrate and fat in pigs kept under different
sanitary conditions
Y van der Meer12 AJM Jansman3 A Lammers4 and WJJ Gerrits1
To be submitted to Animal
1Animal Nutrition Group Wageningen University Wageningen 6708 WD The Netherlands
2De Heus Animal Nutrition Ede 6717 VE The Netherlands 3Wageningen UR Livestock Research Wageningen 6708 WD The Netherlands
4Adaptation Physiology Group Wageningen University Wageningen 6708 WD The
Netherlands
Chapter 5
112
ABSTRACT
In Chapter 4 we showed that low grade chronic inflammation imposed on pigs by keeping
them under low sanitary conditions (LSC) increased fasting heat production (FHP) by 8
and reduced incremental utilization of dietary protein by 20 points compared with high
sanitary conditions (HSC) Dietary supplementation of methionine (Met) threonine (Thr)
and tryptophan (Trp) affected neither the incremental utilization of dietary protein nor any
of the energy balance traits By studying diurnal patterns of heat production and substrate
oxidation rates we aimed to gain insight in the underlying mechanisms for increased energy
expenditure and reduced marginal protein efficiency in LSC pigs fed diets with either a
basal amino acid profile or supplemented with Met Thr and Trp In a 2 times 2 factorial
arrangement 24 groups of 6 pigs each were allocated to either LSC or HSC and were
offered one of two different diets having either a basal or supplemented dietary AA profile
For each group of pigs heat production and physical activity was measured in 6 min
intervals by indirect calorimetry during two consecutive weeks during which feed was
available ad libitum or at 70 of ad libitum The LSC pigs had reduced rates of body weight
gain feed intake gainfeed ratio and higher serum haptoglobin concentrations than HSC
pigs indicating that the contrast in sanitary conditions was reflected in physiological and
immunological parameters Supplementation of Met Thr and Trp did not affect any of the
traits measured When compared with HSC pigs LSC pigs reduced their energy expenditure
on physical activity and increased their resting metabolic rate in the restricted feeding
period compared with HSC pigs especially when lights were on This confirms our previous
observation that FHP was increased at LSC Within day patterns of net fat and carbohydrate
oxidation were not affected by sanitary conditions It is speculated that the reduction of the
incremental utilization of dietary protein under LSC is not restricted to particular periods
within the day
Keywords heat production pig energy expenditure sanitary conditions health amino
acid
Implications The results of this study indicate that sanitary conditions of pigs cause
variation in energy utilization and expenditure over the day The results help to understand
the effect of sanitary conditions on dietary requirements of pigs Providing diets that match
the requirements of the pig on the correct moment of the day might help to increase the
efficiency of pig production and to reduce the environmental pressure of the pig industry
Chapter 5
113
INTRODUCTION
Sanitary conditions (SC) have been shown to affect energy expenditure for fasting heat
production (FHP) and incremental efficiency for protein retention in pigs (In Chapter 4 we
showed that low grade chronic inflammation imposed on pigs by keeping them under low
sanitary conditions (LSC) increased fasting heat production (FHP) by 8 and reduced
incremental utilization of dietary protein by 20 points Dietary supplementation of
methionine (Met) threonine (Thr) and tryptophan (Trp) affected neither the incremental
utilization of dietary protein nor any of the energy balance traits measured in Chapter 4 In
the study described in Chapter 4 the low grade chronic inflammation was apparent from
reduced performance and increased serum haptoglobin concentrations Whereas immune
system stimulation in the clinical range is known to increase heat production (Lochmiller
and Deerenberg 2000 Parmentier et al 2002) little is known about the metabolic or
immunological processes underlying the increased FHP and reduced incremental protein
utilization at LSC As energy is also needed to deposit fat or protein in the body and the
requirements for specific amino acids (AA) Met Thr and Trp are also known to be affected
by immune system stimulation (Le Flocrsquoh et al 2008 Kampman-van de Hoek et al 2016
van der Meer et al 2016) an interaction between energy and AA metabolism affected by
immune stimulation was expected but was found to be absent in Chapter 4 Detailed
analysis of within day patterns of heat production activity related or resting and net rates
of substrate oxidation will allow to track the observed effects of SC and (absence of) effects
of AA supplementation (Chapter 4) to particular periods within the day Treatment
differences in heat production or net rates of substrate oxidation directly following a meal
would typically indicate altered metabolism of ingested nutrients indicating substantial
contribution of visceral tissues
To this end we explored the diurnal patterns of energy expenditure by partitioning total
heat production (Htot) into heat production related to physical activity (Hact) and resting
metabolic rate (RMR) of pigs kept under different sanitary conditions fed diets with or
without extra supplemented Met Thr and Trp In addition the diurnal patterns of the
respiratory quotient (RQ) and net rates of carbohydrate and fat oxidation of these pigs
were also evaluated
MATERIALS AND METHODS
In a 2 times 2 factorial arrangement 24 groups of six pigs were allocated to either LSC or HSC
and were offered two different diets having either a basal (AA-B) or supplemented dietary
AA profile (AA-S) Pigs were followed from week 3 until week 12 of age Pigs were used
from week 3 till week 12 of age From week 3 until 8 pigs were adapted to the different
sanitary conditions after which the dietary treatments were introduced Energy balances
Chapter 5
114
studies were performed from week 9 to 12 During week 9 pigs were allowed ad libitum
access to their diets During week 10 pigs were fed twice daily at 70 of the measured
feed intake during week 9 During week 12 pigs were allowed restricted access to their
diets for 2 d prior to a 25h period of feed deprivation for the measurement of FHP These
three experimental weeks are referred to as the ad lib feeding period the restricted
feeding period and the fasting period
Animals and treatments In total 144 (Topigs 20 times Danish Duroc Topigs Helvoirt The
Netherlands Danbred International Herlev Denmark) newborn female piglets were
selected at one week of age in three subsequent batches of 48 pigs on a commercial farm
in The Netherlands and allocated to either the LSC or HSC treatment as explained in
Chapter 4
In brief piglets were selected at the same farrowing rooms and HSC piglets received six
vaccinations (against Mycoplasma hyopneumoniae procine circovirus type 2 porcine
reproductive and respiratory disease Lawsonia intercellularis action bacillus
pleuropneumoniae and influenza A virus) during the period of the first nine weeks of age
Piglets of both LSC and HSC treatments were housed in the same rooms at the commercial
farm until weaning at 21 plusmn 02 d of age At weaning (start pre-period) LSC and HSC piglets
were transported to the research farm in Wageningen and housed in separate rooms (LSC
and HSC room) until nine weeks of age (end adaptation period)
The HSC room was intensively cleaned and disinfected before arrival of the pigs In
addition a strict hygiene protocol was adhered to when entering the HSC rooms The LSC
room was not cleaned and no hygiene protocol was applied A mixture of manure of three
commercial pig farms obtained fresh weekly was spread weekly in the LSC pens to
increase microbial pressure In addition the LSC pigs were exposed to nylon bags
containing a mixture of pig manure and straw ground to pass a 1 mm screen as a model
for dust The bags were mounted on a chain above the LSC pens for pigs to play with
Upon arrival at the research farm all pigs were individually weighed and allocated to their
pen within sanitary condition treatment based on BW in order to minimize variation
between pens (LSC batch 1 57 kg LSC batch 2 59 kg LSC batch 3 59 kg HSC batch 1 55
kg HSC batch 2 52 kg HSC batch 3 59 kg) At arrival day (plusmn 21 d of age) and 2 d
thereafter HSC pigs received an antibiotic injection (Fenflor AUV Cuijk The Netherlands 1
mL per pig sub muscular per time)
Housing experimental period During the experimental period (9 until 12 weeks of age)
groups of six pigs were housed in one of eight identical 40 m3 indirect calorimetric
chambers described by Heetkamp et al (2015) containing a pen of 175 times 285 m with 40
slatted floor During this period pre-weighed quantities of fresh manure and dust were
introduced weekly in LSC chambers similar to their introduction in the pre-experimental
period The HSC chambers were cleaned and disinfected before start measurement at week
Chapter 5
115
10 as was done with the rooms in the pre-period During the experiment period a strict
hygiene protocol was adhered to when entering the HSC chambers as was done in the pre-
period Temperature in the chambers was maintained at 20 degC relative humidity at 65
and air velocity at lt 02 ms Pigs were exposed to artificial light from 0730 to 1930 h (420
lux) and to darkness (35 lux) during the remainder of the day
Diets and feeding From arrival (start week 3) until week 5 (12 d post weaning) all pigs were
allowed ad libitum access to a commercial diet containing 164 gkg CP 180 kJg GE
(Comfort 3 De Heus Animal Nutrition The Netherlands) and from week 6 until week 9
containing 170 gkg CP and 178 kJg gross energy (GE) (Comfort 4 De Heus Animal
Nutrition The Netherlands) From week 9 onwards pigs were allocated to one of two
treatment diets either containing a basal or a supplemented AA-profile The diets were
formulated to be slightly limiting in lysine (95 of the requirement value for lysine relative
to the dietary net energy value (NE NRC 2012) to prevent that the dietary energy
concentration could limit the growth performance of the pigs in the study
The basal AA-profile (AA-B) was designed as described in van der Meer et al (2016) Briefly
this was developed by a factorial approach to cover AA requirements for maintenance (skin
and hair losses intestinal endogenous losses and cell turnover) and whole body protein
deposition The supplemented AA-profile (AA-S) was derived from the AA-B profile by
increasing the Met Thr and Trp ratio relative to Lys by 20
The ingredient and nutrient composition of the experimental diets is shown in
supplemental Table I The diets were isocaloric on an NE basis and contained TiO2 as
indigestible marker for measuring fecal nutrient digestibility The diets were analyzed for
AA composition by acid hydrolysis at 110degC for 23 h and ion-exchange chromatography
with post-column derivatization with ninhydrin (ISO 2005a) and Trp by alkaline hydrolysis
at 110 degC for 20 h followed by ion-exchange chromatography and fluorescence detection
(ISO 2005b) During the ad libitum feeding period pigs were fed ad libitum from a single
space feeder During the restricted feeding period pigs were fed 70 of their ad libitum
intake divided over two meals at 0730 h and 1530 h fed from a through which allowed all 6
pigs to eat at the same time Per meal pigs had 30 minutes to eat their meal after the
trough was closed to prevent contamination of the trough with urine
Feeding strategy during experimental period During the experimental period (week 10 until
12 of age) pigs were fed ad libitum for one week (week 10 of age) and restricted in the
second week (week 11 of age) Feed was provided ad libitum in a single feeder during the
ad libitum week and caretakers visited the chambers at 730 am and 330 pm In the
restricted week pigs were fed 70 of the ad libitum intake in two meals provided in a
trough at 730 am and 330 pm Water was available ad libitum in both weeks In week 12
of age the pigs were fed four more restricted meals and subsequently they were starved
Chapter 5
116
for 25 h for FHP measurement After FHP measurement the pigs were fed ad libitum until
the end of the experiment
Measurements in the experimental period During the ad libitum restricted feeding period
and fasting period gas exchange of each group of pigs was measured in the calorimetric
chambers in 6-min intervals by measuring exchange of O2 CO2 and CH4 as described by
Heetkamp et al (2015) A CO2 recovery test with the respiration chambers was performed
immediately prior to the start of the experiment according to procedures described by
Heetkamp et al (2015) In the eight chambers 99 964 979 1007 987 983 992 and
1005 of the released CO2 was recovered A radar device was mounted above each
chamber completely covering the housing area of the pigs to measure physical activity in 6-
min intervals during the three experimental weeks Changes in the frequency of the
reflected radar waves due to movement of the animals (Doppler effect) were converted
into electrical pulses and pulses were recorded Complete energy and nitrogen (N) balances
were determined in for the ad lib and the restricted period Individual pigs were weighted
before and after each balance week In each balance week manure was collected
quantitatively weighed mixed thoroughly and sampled for analysis of GE DM ash and N
Aerial NH3 was collected from a quantified sample of the outgoing air after trapping in
H2SO4 and NH4+ in water that condensed on the heat exchanger For LSC pigs the
contribution of the extra administered manure and dust to the energy and nitrogen
balances was quantified
The Htot was partitioned between Hact and RMR using a penalised β-spline regression
procedure developed and described by van Klinken et al (2012) The FHP was estimated as
the average RMR during the last 2 h of feed deprivation The thermic effect of feeding
(TEF) in the restricted week was calculated by subtracting the average RMR in the
restricted week by the FHP Short TEF (sTEF) was calculated by subtracting the average
RMR of the restricted by the lowest RMR value and long TEF (lTEF) was calculated by
subtracting the lowest RMR value in the restricted week by FHP The RQ was calculated as
the ratio between O2 consumption and CO2 production The carbohydrate and fat oxidation
(in g) were calculated from gas exchange (in L) as described by Brouwer (1958) ignoring
the contribution of methane production and protein oxidation (van den Borne et al 2015)
Carbohydrate oxidation in g = -2965 times VO2 + 4170 times VCO2
Fat oxidation in g = 1718 times VO2 ndash 1718 times VCO2
where VO2 = volume O2 consumption and VCO2 = volume CO2 produced
Chapter 5
117
Dissection From the fasting heat measurement in the fasting heat period pigs were fed ad
libitum for 4-5 days until dissection At the dissection day three pigs per room were
euthanized on one day between 830 and 1500 h to collect lungs for lesion scores The
order of euthanizing was balanced per room and treatment group Pigs were restrained
and anaesthetized with an im injection in the neck with in total 6 mg Zoletilkg BW (Zoletil
Virbac Laboratories Carros France) After sedation they were euthanized by an iv
injection of 24 mgkg BW of sodium pentobarbital (Euthasol 20 AST Farma BV The
Netherlands) in the ear vein and subsequently blooded by incision in the neck
Statistical analysis The experimental unit for all measurements was the group of 6 pigs ie
one pen of six pigs in each chamber Effects of sanitary conditions AA profile batch and
their interactions on the hourly means of Htot Hact RMR RQ carbohydrate oxidation and
fat oxidation were assessed by analysis of variance using the GLM procedure in SAS (v 93
SAS Institute Inc Cary NC USA) Non significant interactions with batch were deleted from
the model The partitioning of heat in Htot Hact and RMR in the restricted feeding period
was analysed with the same model as was used for the hourly means In addition GE intake
was included in the model for the partitioning of heat in the ad libitum and restricted
feeding period as a covariate to correct for feed intake P-values were considered
significant when P le 005 and considered as tendency when 005 lt P le 010 Results are
presented as least square means plusmn SEM
RESULTS
General One LSC pig fed the AA-S diet in the adaptation period had a volvulus and died just
before entering the respiration chambers Therefore one pen had five instead of six
animals in the experimental period Throughout the experiment no clinical signs of illness
were observed All fecal samples were negative for Ascaris coccidia Trichostrongylus and
other endoparasites Five out of 36 LSC pigs (13) and 8 out of 36 HSC pigs (22) had a
small pneumonia lesion in the lungs at dissection the remainder of the pigs had no lung
lesions
In the restricted feeding period pigs were offered 70 of the feed intake of the ad libitum
feeding period supplied in two meals per day Not all groups consumed the feed supplied
within 30 min leading to a contrast in feed intake between periods slightly exceeding the
30 anticipated 39 for LSC and 31 for HSC Due to a technical problem in batch 2 and 3
with the activity device in one chamber of LSC in and one chamber in HSC the activity
measurements of these chambers were not reliable and had to be discarded
Ad libitum feeding period During the ad libitium feeding period Htot peaked twice daily
This variation in Htot was almost completely accounted for by variation in Hact resulting in
Chapter 5
118
only minor within-day variation in RMR (Fig 51) There were no significant effects of
treatments at any point in time on RMR and only few on Hact and Htot
An interaction for sanitary conditions (SC) times AA was found for Htot at 800 am (P le 005)
the LSC pigs fed the AA-B diet had higher Htot than the LSC pigs fed the AA-S diet whereas
the HSC pigs had a similar Htot independent of the diet The HSC pigs had higher Htot at
000 400 800 am and 100 pm than LSC pigs (P le 005) The pigs fed the AA-B diet had
higher Htot at 700 pm
At 200 and 300 pm a tendency for an interaction between SC times AA was found for Hact
(005 lt P le 010) the Hact for LSC pigs fed the AA-B diet was lower than for LSC pigs fed the
AA-S diet whereas for HSC pigs fed the AA-B diet the Hact was higher compared with HSC
pigs fed the AA-S diet
The RQ exceeded unit 1 during the whole day (Fig 52) Positive values were found for
carbohydrate oxidation and negative values for fat oxidation indicating substantial
synthesis of fatty acids de novo
Restricted feeding period During the restricted feeding period Htot peaked twice daily This
variation in Htot was partly accounted for by variation in Hact and partly by within-day
variation in RMR (Fig 53) There were only a few significant effects of treatments at points
in time on Htot and Hact and RMR values were higher for LSC pigs from 800 am until 100
pm and from 300 pm until 700 pm (Fig 53C) An interaction for SC times AA was found for
Htot at 600 and 700 pm (P le 005) the LSC pigs fed the AA-B diet had higher Htot
production than the LSC pigs fed the AA-S diet whereas the HSC pigs had a similar Htot
production independent of the diet The HSC pigs had higher Htot production at 000 100
400 am and 600 800 900 and 1000 pm than LSC pigs (P le 005) and tended to have
higher Htot production at 200 and 700 am than LSC pigs (005 lt P le 010) At 800 pm an
interaction SC times AA was found for Hact (005 lt P le 010) The Hact was lower for LSC pigs at
900 and 1100 am (P le 005)
The RQ in the restricted feeding period values were below 1 between 1200 and 700 am
and between 200 and 300 pm Positive values were found for the net rate of carbohydrate
oxidation and negative values for fat oxidation were only found between 800 am to100
pm and 4 pm to 1 am indicating synthesis of fatty acids de novo only after consumption of
the meals (Fig 54)
Partitioning of heat in the restricted week Overall no treatment effects were found on
parameter of heat partitioning except for a SC tendency for RMR The LSC pigs tended to
have higher RMR values than the HSC pigs in the restricted feeding period (P = 005 Table
51) This tendency corresponded with a tendency for a higher estimate of FHP in LSC pigs
(P = 006)
Chapter 5
119
FIGURE CAPTIONS
Figure 51 Heat partitioning of pigs kept under different sanitary conditions (SC) and fed a diet (ad libitum) with or without extra supplemented amino acids (AA) Symbols are least square means of 6 groups of pigs adjusted to equal GE intake among treatments A Total heat production (Htot) B physical activity related heat (Hact) C resting metabolic rate (RMR) The dashed lines represent low sanitary condition pigs and the closed lines high sanitary condition pigs The circles represent pigs fed a basal AA profile diet and the triangles represent pigs fed a supplemented AA profile represent P le 005 + represents 005 lt P le 010 and ndash represents P gt 010 Figure 52 Respiration quotient (RQ) and net rates of carbohydrate and fat oxidation of pigs kept under different sanitary conditions (SC) and fed a diet (ad libitum) with or without extra supplemented amino acids (AA) A RQ B carbohydrate oxidation C fat oxidation The dashed lines represent low sanitary condition pigs and the closed lines high sanitary condition pigs The circles represent pigs fed a basal AA profile diet and the triangles represent pigs fed a supplemented AA profile represent P le 005 + represents 005 lt P le 010 and ndash represents P gt 010 Figure 53 Heat partitioning of pigs kept under different sanitary conditions (SC) and fed a diet (restricted 70 of ad libitum intake) with or without extra supplemented amino acids (AA) Symbols are least square means of 6 groups of pigs adjusted to equal GE intake among treatments A Total heat production (Htot) B physical activity related heat (Hact) C resting metabolic rate (RMR) The arrows represent the moments of meal feeding The dashed lines represent low sanitary condition pigs and the closed lines high sanitary condition pigs The circles represent pigs fed a basal AA profile diet and the triangles represent pigs fed a supplemented AA profile represent P le 005 + represents 005 lt P le 010 and ndash represents P gt 010 Figure 54 Respiration quotient (RQ) and net rates of carbohydrate and fat oxidation of pigs kept under different sanitary conditions (SC) and fed a diet (restricted 70 of ad libitum intake) with or without extra supplemented amino acids (AA) A RQ B carbohydrate oxidation C fat oxidation The arrows represent the moments of meal feeding The dashed lines represent low sanitary condition pigs and the closed lines high sanitary condition pigs The circles represent pigs fed a basal AA profile diet and the triangles represent pigs fed a supplemented AA profile represent P le 005 + represents 005 lt P le 010 and ndash represents P gt 010
Chapter 5
120
Figure 51
Chapter 5
121
Figure 52
Chapter 5
122
Figure 53
Chapter 5
123
Figure 54
Chapter 5
124
DISCUSSION
We explored the diurnal patterns of heat production RQ and net rates of carbohydrate
and fat oxidation of LSC and HSC pigs fed a diet with or without extra supplemented AA
with the objective to gain insight in underlying mechanisms of increased energy
expenditure and reduced incremental efficiency of protein retention for LSC pigs This was
determined by measurement of heat production RQ carbohydrate and fat oxidation in 6
min intervals and averaging these values per hour per day per ad libitum and restricted
feeding period Feed intakes differed among treatments during the ad libitum and
restricted feeding periods (Chapter 4) For the objective of this study we adjusted all
parameters to the same GE intake to ease interpretation of the effects of SC and AA
supplementation
Contrast in sanitary conditions The contrast in SC was created by a combination of
vaccination antibiotic treatment hygiene disinfecting and introducing manure and dust in
pens The LSC pigs had a lower rate of BW gain feed intake gainfeed ratio (Chapter 4) and
higher haptoglobin concentrations in serum than HSC pigs which is in accordance with a
previous study (van der Meer et al 2016) In addition no clinical signs of illness were
observed during the experiment Overall these results indicate that a contrast in SC is
reflected by the physiology of the pigs and illustrate the chronic low grade inflammation
that was induced which is detailed in Chapter 4
The LSC pigs had an 8 increased FHP 20 points reduced incremental efficiency for
protein deposition compared with HSC pigs The incremental efficiency for fat deposition
remained unaffected (Chapter 4) Supplementation of the basic AA profile with 20 Met
Thr and Trp did not affect any of the parameters measured
The difference in FHP seems to be present during the whole day as RMR values in the
diurnal pattern in the restricted feeding period were higher or tended to be higher for LSC
pigs compared with HSC pigs for almost all hours The difference between LSC and HSC pigs
was close to 50 kJ kg -06 d-1 which is similar to the difference in FHP (+55 kJ kg -06 d-1 )
found between the LSC and HSC pigs as described in Chapter 4 It is likely that the
difference found in FHP was causing the difference in RMR between the SC treatment
groups in the restricted feeding period The maximal difference in RMR of LSC and HSC pigs
in the restricted week however was higher than 50 kJ kg -06 d-1 namely 80 kJ kg -06 d-1
at max at 900 and 1000 am This greater difference was especially present during the
peak moments in RMR over the day Assuming that FHP stays constant over the day the
difference in RMR higher than the difference in FHP should be due to a difference in the
TEF post meal between LSC and HSC pigs but this could not be detected significantly
Interestingly the difference in RMR between SC was not present during the ad libitum
period during which RMR values were 300 kJ higher than during the restricted period
Chapter 5
125
Physical activity in ad libitum and restricted fed pigs The increase in energy expenditure for
physical activity with increasing feed intake was not affected by the experimental
treatments (Chapter3) Nonetheless differences were detected for physical activity during
the ad libitum and restricted periods and treatment effects were present during the
restricted period During the restricted but not during the ad libitum feeding period
activity of LSC pigs was lower after the morning meal and increasing in the beginning of the
night compared with the HSC pigs
The stable RQ found in the ad libitum week (Fig 52A) suggests that the ad libitum fed
animals ate several times during the 24 h period In a study of Souza da Silva et al (2014)
was reported that group housed control pigs that were fed ad libitum had 175 meals per
day and spend 815 min eating per 24 h period supporting that ad libitum fed animals eat
several times per day As the ad libitum pigs in our experiment did not eat only during the
moment of high Hact the two peaks found for Hact in the ad libitum fed pigs cannot be
explained by feeding activity alone The two similar Hact peaks for the restricted fed
animals might be largely affected by meal related behaviour though In the ad libitum week
caretakers visited the chambers at 730 am and 330 pm for taking rectal faecal samples
perhaps these events affected the activity pattern of the ad libitum fed pigs
At 200 and 300 pm in the ad libitum week and at 900 and 1100 am in the restricted week
the Hact was lower for LSC pigs than for HSC pigs In the ad libitum feeding period we also
observed a lower carbohydrate oxidation for LSC pigs at 200 and 300 pm than for HSC
pigs It might be that LSC pigs in the ad libitum feeding period were less active and
therefore used less energy for activity leading to lower carbohydrate oxidation for LSC pigs
than for HSC pigs In the restricted feeding period no effects on carbohydrate oxidation
were found at 900 and 1100 am For RMR there were differences found at these moments
in the 24 period with higher RMR for LSC pigs than for HSC pigs
It might be that the differences found for Hact in LSC and HSC pigs was related to
differences in satiety between LSC and HSC pigs It is known that in pigs activity patterns
reflect differences in satiety (Brouns et al 1994 Beattie and OConnellt 2002 de Leeuw et
al 2008) Lower Hact values might reflect higher satiety in LSC pigs than in HSC pigs When
comparing the feed intake per kg BW06 of the ad libitum and restricted feeding period for
both SC groups we see a larger reduction in intake between the two periods for LSC than
for HSC pigs The LSC pigs had more difficulty with consuming 70 of their ad libitum intake
in two meals of 30 min than HSC pigs even though the absolute reduction in gd was less
big for LSC pigs More feed refusals for the LSC pigs in the restricted feeding period led to a
stronger reduction in feed intake between the two periods for the LSC compared with the
HSC pigs Taking this into consideration the reduction in energy expenditure for physical
activity following the morning meal likely reflects increased satiety of these pigs suggesting
that feeding patterns over the day may be affected by SC
Chapter 5
126
The RQ for the oxidation of carbohydrates fats and proteins is approximately 1 07 and
08 respectively slightly depending on the type of substrate within each class An RQ
exceeding 1 indicates de novo fatty acid synthesis from carbohydrates (Kuhla et al 2015
van den Borne et al 2015) The RQ value for the ad libitum feeding period was
continuously exceeding 1 reflecting fat deposition from carbohydrates and corresponds
with the constant negative fat oxidation found during the day The diurnal pattern for the
RQ of pigs in the restricted feeding period was comparable to restricted fed pigs with a diet
containing pregelatinized starch in a study of Gerrits et al (2012) and to restricted fed pigs
with a pregelatinized or a native potato starch in a study of Bolhuis et al (2008) Hence the
diurnal pattern found for the restricted feeding period seems to be typical for restricted fed
pigs Diurnal patterns for carbohydrate and fat oxidation were unaffected by SC Hence
there are no indications that differences in the incremental efficiency of dietary protein for
protein deposition can be linked to particular differences in fat or carbohydrate oxidation at
particular times of the day It can be concluded from the present study that LSC pigs
reduced their energy expenditure on physical activity and increased their resting metabolic
rate in the restricted feeding period compared with HSC pigs especially when lights were
on Therefore the diurnal energy expenditure pattern of LSC and HSC pigs can be
considered as different Within day patterns of net fat and carbohydrate oxidation were not
affected by sanitary conditions Therefore It is speculated that the reduction of the
incremental utilization of dietary protein under low sanitary conditions is not restricted to
particular periods within the day
Acknowledgements Funding through Dutch BreedampFeed4Food consortium is gratefully
acknowledged The authors thank H Van Diepen for support on formulation of the
experimental diets The authors thank the staff of the experimental facility of Wageningen
University T Zandstra S Alferink M Heetkamp and the staff of Wageningen UR Livestock
Research for their contributions
Chapter 5
127
REFERENCES
Beattie V and N OConnellt 2002 Relationship between rooting behaviour and foraging in growing pigs Anim Welfare 11 295-
303 Bolhuis J E Van den Brand H Staals S Zandstra T Alferink S Heetkamp M and Gerrits W 2008 Effects of fermentable starch and
straw-enriched housing on energy partitioning of growing pigs Anim 21028-1036 Brouns F S A Edwards and P R English 1994 Effect of dietary fibre and feeding system on activity and oral behaviour of group
housed gilts Appl Anim Beh Sci 39 215-223 Brouwer E 1958 One simple formulae for calculating the heat expenditure and the quantities of carbohydrate and fat oxidized in
metabolism of men and animals from gaseous exchange (oxygen intake and carbon acid output) and urine-N Acta Physiolog Neerl 6 795-802
Centraal Veevoeder Bureau (CVB) 2011 Chemical compositions and nutritional values of feed ingredients CVB Lelystad The Netherlands
de Leeuw JA J E Bolhuis G Bosch and W J J Gerrits 2008 Effects of dietary fibre on behaviour and satiety in pigs Symposium on lsquoBehavioural nutrition and energy balance in the young Proc Nutr Soc 67 334-342
Gerrits W J J M W Bosch J J G C and van den Borne 2012 Quantifying resistant starch using novel in vivo methodology and the energetic utilization of fermented starch in pigs J Nutr 142 238-244
Heetkamp M J W S J J Alferink T Zandtra P Hendriks H van den Brand and W J J Gerrits 2015 Design of climate respiration chambers adjustable to the metabolic mass of subjects In W J J Gerrits and E Labussiegravere editors Indirect calorimetry Techniques computations and applications Wageningen Academic Publishers Wageningen p 35-56
International Organization for Standardization (ISO) 2005a Animal feeding stuffs ndash Determination of amino acids content ISO 13903 Int Organ Stand Geneve Switzerland
International Organization for Standardization (ISO) 2005b Animal feeding stuffs ndash Determination of tryptophan content ISO 13903 Organ Stand Geneve Switzerland
Kampman-van de Hoek E A J M Jansman J J G C van den Borne C M C van der Peet-Schwering H van Beers-Schreur and W J J Gerrits 2016 Dietary amino acid deficiency reduces the utilization of amino acids for growth in growing pigs after a period of poor health J Nutr 146 51-58
Kuhla B M Derno and C C Metges 2015 Indirect calorimetry for elucidating dynamics in energy metabolism of farm animals In W J J Gerrits and E Labussiegravere editors Indirect calorimetry Techniques computations and applications Wageningen Academic Publishers p 115-134
Le Flocrsquoh N D Melchior and B Segraveve 2008 Dietary tryptophan helps to preserve tryptophan homeostasis in pigs suffering from lung inflammation J Anim Sci 86 3473-3479
Lochmiller R L and C Deerenberg 2000 Trade-offs in evolutionary immunology Just what is the cost of immunity Oikos 88 87-98
NRC 2012 Nutrient Requirements of Swine 11th ed Natl Acad Press Washington DC
Parmentier H k S Bronkhorst M G Nieuwland G V Reilingh J M van der Linden M J Heetkamp B Kemp J W Schrama M
W Verstegen and H van den Brand 2002 Increased fat deposition after repeated immunization in growing chickens
Poult Sci 81 1308-1316
Souza da Silva C G Bosch J E Bolhuis L Stappers H van Hees W J J Gerrits and B Kemp 2014 Effects of alginate and resistant starch on feeding patterns behaviour and performance in ad libitum-fed growing pigs Anim 8 1917-1927
van der Meer Y A Lammers A J M Jansman M M J A Rijnen W H Hendriks and W J J Gerrits 2016 Performance of pigs kept under different sanitary conditions affected by protein intake and amino acid supplementation J Anim Sci 94 4704-4719
van den Borne J J G C M J W Heetkamp S JJ Alferink and W JJ Gerrits 2015 Moving from a complete energy balance towards substrate oxidation use of stable isotopes In W J J Gerrits and E Labussiegravere editors Indirect calorimetry Techniques computations and applications Wageningen Academic Publishers p 2907-2915
van Klinken J B S A van den Berg L M Havekes and K W van Dijk 2012 Estimation of activity related energy expenditure and resting metabolic rate in freely moving mice from indirect calorimetry data PLOS ONE 7 e36162
Table 51 Partitioning of heat in pigs kept under different sanitary conditions and fed a diet with or without extra AA at 70 of ad libitum intake and during a 25 h period of
fasting1
LSC2 HSC P-values6
Item (kJBW-06d-1) AA-B3 AA-S AA-B AA-S SEM5 SC AA batch7 SCtimesAA
n4 6 3 6 4
Htot 1168 1134 1149 1135 15 016 059 0002 058
Hact 177 204 179 206 26 032 095 042 099
RMR 990 930 970 929 23 005 066 026 070
TEF 250 228 237 248 20 078 083 074 041
sTEF 165 139 155 161 18 058 072 082 040
lTEF 85 89 82 87 17 077 087 098 099
FHP 741 702 733 680 23 006 052 009 077
Htot = total heat production Hact = physical activity related heat RMR = resting metabolic rate TEF = thermic effect of feeding sTEF = short thermic effect of feeding lTEF = long thermic effect of feeding FHP = fasting heat production GE = gross energy1Results are predicted means adjusted to the same GE intake by including observed GE intakes per group as covariate in the model 2 LSC = Low sanitary conditions HSC= High sanitary conditions 3 AA-B = basal amino acid profile AA-S= supplemented amino acid profile 20 more Met Thr and Trp compared with basal 4 n = number of pens a pen contained 6 pigs 5 SEM = pooled standard error of the mean means are presented as least square means 6 Considered significant when P le 005 considered as tendency when 005 lt P le 010 7No interactions with batch were found
Chapter 5
129
SUPPLEMENTAL TABLE Supplemental table I Ingredients and nutrient composition of the treatment diets
Item Ingredient gkg of feed
AA-B1 AA-S1
Wheat 3086 3086
Maize 2000 2000
Barley 2000 2000
Soybean meal 1845 1845
Maize starch 258 234
Sugarcane molasses 200 200
Limestone 147 147
Monocalcium phosphate 90 90
Soybean oil 192 192
Vitamin + mineral mix2 50 50
Salt 35 35
L-lysine HCl 34 34
Titanium dioxide 25 25
Sodium bicarbonate 21 21
L-threonine 10 21
L-tryptophan 00 04
DL-methionine 04 13
L-Valine 03 03
Nutrients calculated gkg
NE MJkg3 98 98
DM 8896 8898
Crude protein4 1660 1670
Starch 4741 4723
Lys4 98 101
Thr4 66 78
Trp4 22 26
Met + Cys4 52 62
Ile4 82 83
Arg4 118 122
Phe4 94 99
His4 55 53
Leu4 150 153
Tyr4 62 62
Val4 96 98 1 AA-B = basal dietary AA profile AA-S= supplemented dietary AA profile containing 20 more Met Thr and Trp compared with the basal profile 2 Supplied the following per kilogram of diet 30 mg riboflavin 20 mg niacine 20 mg d-pantothenic acid 10 mg choline chloride 0015 mg cyanocobalamin 40 mg dl-α-tocopheryl acetate 15 mg menadione 6000 IU retinyl acetate 1200 IU cholecalciferol 02 mg folic acid 10 mg thiamin 10 mg pyridoxine HCl 50 mg manganese oxide 267 mg iron SO4middotH2O 60 mg copper SO4middot5H2O 140 mg zinc SO4middotH2O 044 mg disodium selenium trioxide10 mg potassium iodate 3 Based on chemical composition digestibility and energy value for pigs from the Centraal Veevoeder Bureau livestock feed table (CVB 2011) 4 Analyzed values
Chapter 6
General discussion
Chapter 6
132
INTRODUCTION
It is economically and environmentally important to match the nutrient supply to the
nutrient requirements in pig production Until now the effects of different sanitary
conditions (SC) on energy and nutrient requirements are not implemented in
recommendations for nutrient requirement values (ARC 1981 Whittemore et al 2003
Santioga Rostagno et al 2011 NRC 2012 CVB 2016) The nutrient requirement data in
these tables are based on studies in with pigs are kept under conditions that can be
regarded as close to optimal Changes in nutrient requirements caused by differences in
sanitary conditions are poorly documented As in pig industry hygienic conditions are
variable it is of major importance to determine the effects of low sanitary conditions (LSC)
on amino acids (AA) and energy requirements in growing pigs Pigs under LSC have an
increased risk of (subclinical) infections resulting consequently in a more chronic
stimulation of their immune system Immune system stimulation is known to influence
energy and AA metabolism However most studies in pigs evaluating the relationship
between immune system stimulation and nutrient requirements use specific experimental
challenge models Whereas such models have the obvious advantage of reproducibility and
allow mechanistic insight in the effects of stimulating specific parts of the immune system
these models often are in the range of clinical illness and results from such models may
therefore be difficult to translate to practical situations
Therefore the objective of this thesis was to study the effects of low and high sanitary
conditions (HSC) on AA and energy metabolism in pigs In this chapter the different
experiments presented in this thesis are discussed with emphasis on the different models
used in comparison with other challenge studies Additional data are presented in text
boxes Methodological aspects related to measurements on AA and energy metabolism are
discussed and an overall summary of effects for LSC pigs compared with HSC pigs and
consequences for nutrient requirements is given with implication of the results for current
pig feed industry General conclusions are provided at the end of this chapter
Chapter 6
133
CHALLENGE STUDIES TO STIMULATE THE IMMUNE SYSTEM
To implement effects of SC on energy and nutrient requirements for growing pigs in feed
advise tables data on the effects of SC on energy and nutrient metabolism are needed
Sanitary conditions are known to influence the energy and nutrient requirements via the
immune system and therefore it is interesting to collect data of pigs with a contrast in
immune stimulation To study the effects of immune stimulation due to LSC a model is
needed that mimics chronic immune stimulation on a subclinical level and allows to study
the impact on nutrient requirements In literature several immune stimulating models have
been described and several porcine immune stimulation models used in relation to
nutrition or metabolism are listed in Table 61
Table 61 Overview of models used in pigs experiments to stimulate the immune system in relation with nutrition
challenge dose estimated BW1 response fever duration ΔADFI2 ΔADG2 ΔGF ratio2 references
Lipopolysaccharide (LPS)
LPS repeated increasing iv dose every 48 h for 7 d 21-25 kg haptoglobinuarr
fibrinogenuarr yes
7 days from start to end
-6 Rakhshandeh et al (2010)
LPS repeated iv dose every 48 h for 7 d initial
dose 20 μgkg BW +15 per dose 20-25 kg
haptoglobinuarr albumindarr
fibrinogenuarr white blood cell countuarr
yes 7 days from start to end
de Ridder et
al (2012)
LPS repeated iv dose every Monday and Thursday
for 6 weeks initial dose 30 microgkg BW +15 per dose
53-60 kg haptoglobinuarr
albumindarr neutrophilsuarr
yes 6 weeks
from start to end
Kim et al
(2012)
LPS repeated iv dose d1 every 48h until day 7
initial dose 50 microg kg BW +12 each dose and the last one +15
18-22 kg haptoglobinuarr
albumindarr fibrinogenuarr
yes
7 days from start to end
plusmn 12h of anorexia per
injection
Litvak et al
(2013)
LPS Repeated iv dose d1 3 5 7 9initial dose 30
microgkg BW +12 per dose 64-68 kg yes
10 days from start to
end -25 -67 -55
Campos et al (2014)
LPS single iv dose 2 microgkg BW 12-16 kg TNF-αuarr IFN-үuarr
yes plusmn 6 hours Clouard et al
(2015)
LPS single iv dose 25 microgkg BW
TNF-αuarr IL-1buarr IL-6uarr haptoglobinuarr
WBCuarr
plusmn 6 hours Williams et al (2009)
1 BW = body weight 2 Δ = the difference between challenged and unchallenged pigs ADFI = average daily feed intake ADG average daily gain GF = gain to feed 3 RBC = red
blood cells
1 BW = body weight 2 Δ = the difference between challenged and unchallenged pigs ADFI = average daily feed intake ADG average daily gain GF = gain to feed 3 RBC = red
blood cells
challenge dose estimated
BW1 response fever duration ΔADFI2 ΔADG2 ΔGF
ratio2 references
Complete Freundrsquos adjuvant (CFA)
CFA iv 3 mL per pig 11-16 kg haptoglobinuarr
respiratory rythmuarr Yes
7 days from start to end clinical sign seem to decrease
after 2 days
no
effect
Le Flocrsquoh et al (2008)
CFA iv 3 mL per pig 11-15 kg haptoglobinuarr
respiratory rythmuarr Yes
10 days from start to end clinical sign seem to decrease
after 2 days
-50 immediately after
no effect
Melchior et al (2004)
CFA iv 02 mLkg BW 28-35 kg haptoglobinuarr
CRPuarr PigMAPuarr
9 days from start to end
Kampman-van de Hoek et al
(2015)
CFA iv 02 mLkg BW 30-40 kg haptoglobinuarr
CRPuarr PigMAPuarr respiratory rythm uarr
Yes 9 days from start
to end
-30 immediately after no effect
from 2 d onwards -10
Kampman- van de Hoek et
al (2011) Turpetine oil (TO)
TO sc 10 mLkg BW every 72h 24-27 kg IL-1β uarr RBC3 darr skin
ulcersuarr Yes
10 days from start to end
plusmn-50 Rakhshandeh and de Lange
(2012)
TO sc 03 mLkg BW 20-25 kg haptoglobinuarr
CRPuarr PigMAPuarr plusmn 14 days
Carpintero et al (2005)
TO sc 03 mLkg BW 18-22 kg haptoglobinuarr
CRPuarr PigMAPuarr Yes plusmn 15 days
Heegaard et al (2011)
TO sc 03 mLkg BW 30-40 kg haptoglobinuarr
CRPuarr PigMAPuarr Yes
9 days from start to end
-17 immediately after no effect
from 2 d onwards
no effect
Kampman-van de Hoek et al
(2011)
challenge dose estimated
BW1 response fever duration ΔADFI2 ΔADG2 ΔGF
ratio2 references
A pleuropneumoniae
A pleu Serotype 5b biotype 1 28-35 kg haptoglobin uarrCRP uarr
MAP uarr yes
plusmn 15 days
Heegaard et al (1998)
A pleu inhalation with serotype 4 isolate 15-20 kg haptoglobin uarrCRP uarr
PigMAP uarr yes
plusmn 20 days
loss of appetite
direct after
Heegaard et al (2011)
A pleu intranasal with serotype 5b isolate
L20 15-20 kg CRP uarr IL-6 uarr Skovgaard et al (2009)
A pleu serotype 5b biotype 1 28-35 kg PigMAP uarr Apo A-1 darr
plusmn 12-15
days Carpintero et al (2005)
E coli (ETEC)
ETEC 5 ml of E coli K88+ dose of 1010
CFUml per piglet 5-10-kg
diarrhoeauarr mortalityuarr
2 days from
start to end
Marquardt et al (2006)
ETEC oral challenge of 2times109 CFU
comprised of two strains of F18 ETEC 6-10 kg
IL-6uarr IL-8uarr TNF-αuarr neutrophilsuarr
diarrheauarr villus lengthdarr mucosal mast
cellsuarr
4 days from
start to end
-30 Mclamb et al (2013)
ETEC orally dose of 10 ml PBS containing 1 times 108 CFU of ETEC K88 2 subsequent
days 8-10 kg
diarrhoeauarr gene expression IL-10 and
IL12auarr -35 -60 -30 Heim et al (2014)
S suis
Ssuis serotype 2 strain 93 30-35 kg PigMAPuarr ApoA-1darr
plusmn 12-15
days Carpintero et al (2005)
Ssuis sc serotype 2 ribotype I isolate 1
mL (1010 CFU) 10-15 kg
haptoglobinuarr CRPuarr PigMAPuarr
yes plusmn 20 days
loss of appetite at 1st day
p challenge
Heegaard et al (2011))
1 BW = body weight 2 Δ = the difference between challenged and unchallenged pigs ADFI = average daily feed intake ADG average daily gain GF = gain to feed
Chapter 6
137
The effects on the immune system andor pig performance are listed per model in Table
61 All described models stimulated the innate immune system of the pig which was
expected This means that cytokines produced by innate immune cells and acute phase
proteins in the blood and rectal temperature increase significantly in response to the
challenge The adaptive immune system was not evaluated in these studies which does not
mean that this part of the immune system was not influenced by these challenges
Administration of a single iv dose of lipopolysaccharide (LPS) leads to a short sickness
response of about 6 hours (Williams et al 2009 Clouard et al 2015) Injection with LPS
typically leads to an increase in proinflammatory cytokines (IL-6 TNF-α IFN-ү) body
temperature acute phase proteins (haptoglobin CRP pigMAP fibrinogen) and the number
of white blood cells (WBC) Attention should be paid to the effects of LPS injection between
individual pigs as the sickness response for some pigs might be very severe and even may
cause death (Williams et al 2009) By repeating the administration of LPS every two days
the immune system can be stimulated for a longer period than 6 hours (for example for 7-
10 days (Rakhshandeh et al 2010 de Ridder et al 2012 Kim et al 2012 Litvak et al
2013 Campos et al 2014) Pigs develop however rapidly tolerance to LPS To maintain a
similar immune stimulating effect an increased dosage of 12 or 15 should be given at
each subsequent injection (Table 61) Campos et al (2014) and Rakshandeh et al (2010)
reported a reducing effect on ADFI when pigs were repeatedly challenged with LPS
Campos et al (2014) also found a negative effect on ADG and GF ratio suggesting that the
lower ADG found for challenged pigs was not only due to the reduced feed intake but also
partly due to a different efficiency In contrast Pastorelli et al (2012b) showed in a meta-
analysis based on 12 studies with LPS challenged pigs that a reduction in ADG after this
challenge was associated with a reduction in feed intake rather than related to changes in
feed efficiency
Another model to stimulate the immune system of pigs is iv injection with Complete
Freundrsquos Adjuvant (CFA) (Melchior et al 2004 Le Flocrsquoh et al 2008 Kampman-van de
Hoek et al 2011) Complete Freundrsquos Adjuvant is a mineral oil containing 1 mg of dead
Mycobacterium tuberculosis cells per mL As CFA contains dead bacteria this challenge is
not infectious to other animals in the same room or pen After injection with CFA pigs will
develop a chronic lung inflammation and acute phase proteins like haptoglobin pigMAP
and CRP increase Pigs will become lethargic and the respiratory rhythm of the pig is
accelerated The clinical signs of illness are reported to decrease after 2 days post challenge
(Melchior et al 2004 Le Flocrsquoh et al 2008) and after dissection lung lesions can be found
which were found to be the most severe between 7 and 14 days post injection (Edwards
and Slauson 1983) Severity of the response to CFA challenge can be variable between
individual animals Kampman-van de Hoek et al (2015) reported that eight out of 16 pigs
responded clinically more severe than expected based on the response in a previous pilot
study with the same challenge
Chapter 6
138
Turpentine oil (TO) an oil from a coniferious tree (Pinus spp) is sc injected and is used in
pigs and also other animal as a model agent such as LPS and CFA to stimulate the immune
system Similar to LPS and CFA TO leads to increased acute phase protein concentrations in
blood and fever after injection most likely due to cytokine production (IL-6 TNF-α and IL-
1β) Kampman-van de Hoek et al (2016) found a greater within animal variation and a
lower magnitude of response for acute phase proteins of pigs challenged with TO
compared with CFA In a study of Rahkshandeh and de Lange (2012) an extreme reduction
in feed intake (50) and severe skin ulcerations were found in repeatedly TO injected pigs
which indicates that TO as a model leads to severe responses
Next to the non-pathogenic agents such as LPS CFA and TO there are models in which pigs
are exposed to live pathogenic bacteria such as Actinobacillus pleuropneumoniae
Escherichia coli and Streptococcus suis bacteria to stimulate the immune system These
bacteria are orally dosed or intranasal administered to the pig E coli is used for inducing an
intestinal infection leading to diarrhoea A pleuropneumoniae to induce a lung
inflammation and S suis challenge might lead to clinical signs of illness such as lameness
and meningitis The effects of these three experimental models using living pathogenic
bacteria can be managed by using a standard dosage of bacterial cells to infect the pigs It is
difficult to estimate how long the immune system remains stimulated after the described
bacterial challenges as in many studies pigs are dissected before responses were back to
baseline again Based on the references listed in Table 61 the effects of a challenge with E
coli last at least several days (plusmn 4 days McLamb et al 2013) and a challenge with A
pleuropneumoniae and S suis can result in a stimulated immune system up to 20 days
(Heegaard et al 2011)
In general models with agents such as LPS CFA and TO and living pathogens are suitable
for studies evaluating nutritional costs of disease or mechanistic relationships between
immune stimulation and nutrition These models already lead to valuable information
about the effects of immune stimulation on AA requirements in pigs and showed for
example that requirements for tryptophan and methionine were increased for immune
stimulated pigs The results of studies using such challenge models however are difficult
to translate to an on farm situation The models using live pathogens are associated with
variable responses high mortality rate and extreme loss of BW depending on the nature
and pathogenicity of the micro-organism (Wichterman et al 1980) When using living
pathogens in an immune stimulation model it should be taken into account that special
housing conditions should be available to prevent spreading of the pathogen to
unchallenged animals Models with non-pathogenic agents such as LPS CFA and TO are
sterile models which can be more easily controlled and can induce more reproducible
responses Administering these agents in a high concentration single dose however might
lead to severe clinical responses and it is not unusual that some of the challenged pigs die
(Williams et al 2009) Reduction of the concentration per dose gives less severe responses
Chapter 6
139
however shortens the recovery time to several hours and repeated or continuous
administration of LPS leads to tolerance
The natural challenges for a growing pig on a commercial farm are mostly less extreme and
more low-grade (often subclinical instead of clinical) than the immune stimulation models
presented in Table 61 Some examples of factors stimulating the innate immune system of
growing pigs on commercial farms are the presence of pathogenic bacteria viruses and
parasites that can spread via faeces dust feed water or low hygiene conditions in general
A sub-optimal climate (too cold or warm air flow too high or low) high animal density and
behavioural problems (biting behaviour aggressive behaviour) may aggravate this by
increasing transmission of pathogens causing stress and irritated tissue
Pigs on farm often have not to deal with one single immune stimulating factor such as LPS
or an infection with E coli but with a combination of the earlier mentioned factors To
measure the effects of these commercial farm factors on energy and AA requirements of
pigs these commercial farm conditions should be mimicked with a model in an
experimental setting or the measurements should be done on a farm having these
conditions The following criteria were set for an experimental model to study energy and
AA metabolism of growing pigs affected by sanitary conditions
- The experimental conditions should lead to a contrast in innate immune
stimulation however clinical signs of disease should be absent
- The contrast in innate immune stimulation should be created in a group of pigs
with the same origin and background
- Interaction with pen mates in group housing should be possible by using the
model
For the experiments described in Chapter 2 and 4 an experimental model based on these
criteria was used In both experiments pigs with clinical signs of illness were removed from
these studies (n = 1 and n = 0 for Chapter 2 and 4 respectively) The ADG of LSC pigs was
lower and LSC pigs had higher serum haptoglobin levels than HSC pigs In addition LSC pigs
of Chapter 2 had greater KLH-IgG titers than HSC pigs This indicates that in the absence of
clinical signs of illness a contrast in immune effector functions was found between LSC and
HSC pigs In addition after slaughter more lung lesions were observed in LSC than in HSC
pigs which is a sign of increased subclinical infections for LSC pigs
Kampman-van de Hoek et al (2016) selected pigs at a low and high health status farm
based on a contrast in serological monitoring program for the presence of antibodies
against several pathogens and moved these pigs to an experimental farm for
measurements Upon arrival at the experimental farm all pigs were housed on metabolism
cages Low health status pigs were housed in a clean but not disinfected area and were not
treated with antibiotics while high health pigs were housed in a cleaned and disinfected
area including HEPA filters and received an antibiotic treatment High health pig personnel
Chapter 6
140
had to follow a strict hygiene protocol Despite the contrast in conditions for low and high
health pigs low health pigs showed a greater ADG more efficient N digestion and greater
N retention during the experiment than high health pigs (Kampman-van de Hoek et al
2016) which was explained as possible compensatory effect due to improved health during
the experimental period for low health status pigs compared with the period on the farm of
origin before the experimental period The study of Kampman-Van de Hoek et al (2016)
shows that it is difficult to maintain the health status of pigs of a farm of origin in an
experimental setting particularly when housed in metabolism cages When a contrast in
health status is imposed to a group of pigs with the same original health status and are
obtained from the same farm as done in Chapter 2 and 4 low sanitary status could be
maintained more easily
For the studies described in Chapter 2 and 4 several batch effects were found for
performance and immunological parameters but not for parameters related to the
incremental efficiency of nutrient utilization which means that the response of pig batches
varied among treatments The batch effects might be caused by a combination of effect of
the batch of pigs originating from the same farm per experiment but obtained at a
different time point the effect of batches of manure and dust introduced to the pens and
the effect of time As the housing conditions during the experiments were standardised it
is assumed that the batch effects were due to pig batch and manure and dust batch Most
of the effects found for batch were not changing the direction of the observed effects
Reducing experimental variation by the use of a single batch as done by others using
similar models (Williams et al 1997 Le Flocrsquoh et al 2009 Pastorelli et al 2012a) should
be reconsidered as the observed variation among batches of Chapter 2 and 4 indicate the
importance of having more than a single batch in studies using a chronic low grade immune
stimulation approach
VARIATION IN CONDITIONS FOR DIFFERENT EXPERIMENTAL
MODELS
In literature several studies have been described that used a similar chronic low-grade
immune system stimulation model (Williams et al 1997 Lee et al 2005 Le Floch et al
2006 Le Flocrsquoh et al 2009 Pastorelli et al 2012a Jayaraman et al 2016) Each study uses
a combination of factors to create a contrast in immune system stimulation and was
compared with the studies described in Chapter 2 and 4 (Table 62) It is interesting to see
whether these models by using a different combination of factors result in a similar effect
as in our studies
Haptoglobin concentration When comparing the haptoglobin concentration in the blood of
pigs from these eight comparable studies (Fig 61) haptoglobin concentration was greater
Chapter 6
141
for LSC pigs compared with HSC pigs in four out of six studies that measured this
parameter Jayaraman et al (2016) found a tendency for higher haptoglobin concentration
for LSC compared with HSC pigs The haptoglobin values for Jayaraman et al (2016) were in
a higher range than in the other studies Perhaps this was due to more severe conditions
such as a high aerial ammonia concentration for both LSC and HSC pigs compared with the
other studies Pastorelli et al (2012a) did not find a significant difference for average
haptoglobin concentration between LSC and HSC pigs over the complete experimental
period Pastorelli et al (2012a) found a tendency for greater haptoglobin values in LSC
compared with HSC pigs in a period before the pigs were transferred from the weaner to
the grower unit which was an event meant as stressor in both LSC and HSC groups
Perhaps transfer from weaner to grower unit stimulated the immune system of both LSC
and HSC pigs resulting in similar haptoglobin values in blood
Table 62 Overview of factors used to create a contrast in immune stimulation for six comparable studies with pigs
Nr Reference n Housing m2 pig
Weaning age
Initial age contrast
Duration of experiment
1 experiment 1 (Chapter 2) 612 Group 08 24 d 70 d 16 wk
2 experiment 2 (Chapter 4) 144 Group 08 21 d 21 d 8 wk
3 le Floc h et al 2006 40 Individual 23 28 d 28 d plusmn65 wk
4 le Floc h et al 2009 80 Individual 28 d 28 d plusmn6 wk
5 Pastorelli et al 2012 20 Individual 05 28 d 28 d plusmn6 wk
6 Williams et al 1997 30 Individual 04 12 vs 19
d 12 vs 19 d plusmn 7 wk
7 Jayaraman et al 2016 180 Group 21 d 21 d 2 wk
8 Lee et al 2005 272 groupindividual 054 21 d 21 d 5 wk
low sanitary condition high sanitary condition
vaccination program 12 (6)a
clean and disinfected rooms 12345678
preventive antibiotics 12345
deworming 1
introduction of non-experimental pigs 346
spreading manure 127
spreading dust 2
hygiene protocol personnel 12
recycling air in room 8 a The number between brackets means that these pigs were the offspring of vaccinated sows instead of vaccinated
experimental pigs
Vaccination as part of the model Pastorelli et al (2012a) vaccinated both LSC and HSC pigs
against Influenza as controlled immunological challenge to compare the responses of both
LSC and HSC pigs The LSC pigs tended to have higher serum antibodies against influenza
virus than HSC pigs which suggest that LSC stimulated the antigen-specific humoral
response
Chapter 6
142
The studies described in Chapter 2 and 4 included a vaccination program as part of the
sanitary condition model It is debatable whether vaccination contributes to HSC It is
generally known that vaccination leads to initial innate immune activation as vaccines
contain a weak or dead pathogenic microorganism Vaccination might therefore cause loss
of appetite and fever andor adverse behaviour for a short period as side effect (Maes et
al 1999 Thacker et al 2000) The vaccination program used in the studies described in
Chapter 2 and 4 was not meant to challenge HSC pigs but to protect HSC pigs against
disease The vaccination program included administration of six vaccines during the first
nine weeks of age In the first experiment (Chapter 2) HSC pigs were 1 kg lighter than LSC
pigs at 10 weeks of age (after a complete vaccination program) and in the second
experiment (Chapter 4) HSC pigs were 03 kg lighter at weaning (plusmn 21 days of age after one
vaccination) than LSC pigs of the same age In both experiments this effect was in the
opposite direction during the experimental period The differences in BW at the beginning
of the experiments might be due to a negative effect immediately after vaccination on feed
intake and growth These negative effects on performance disappeared however within 2
weeks It can however not be excluded that vaccination of the HSC pigs reduced
unintentionally the immunological contrast between LSC and HSC pigs Inclusion of a
vaccination programme as a factor in the experimental model in this sense can be
controversial In the experiment described in Chapter 2 however the LSC pigs were tested
positive for porcine circo virus type 2 (PCV2) a virus HSC pigs were vaccinated against It is
likely that PCV2 vaccination protected the HSC pigs and consequently maintained a contrast
in immune stimulation between LSC and HSC pigs In this sense vaccination as part of an
experimental model for high sanitary conditions can be beneficial Vaccination of the
experimental pigs should therefore be considered based on the risks for disease during the
experiment When taking this into account vaccination of the HSC pigs in the experiment
described in Chapter 4 was probably not needed as this experiment was conducted under
(clean) experimental facilities with a low risk for pig diseases
Chapter 6
143
Figure 61 Comparison of haptoglobin concentration in blood of low (LSC) and high (HSC) sanitary condition pigs
for several references using a similar model to stimulate the immune system (Le Floch et al 2006 Le Flocrsquoh et al
2009 Pastorelli et al 2012a Jayaraman et al 2016) P le 005 + 005 lt P le 010
Performance and sanitary condition model When comparing performance data of the
previously mentioned eight studies the results for average daily gain (ADG) give a similar
picture (Fig 62) The difference in ADG between LSC and HSC treatments was significantly
different for all studies with HSC pigs having the highest ADG The proportion of the
difference in ADG when expressing the difference between LSC and HSC as a percentage of
HSC was variable between the studies (Fig 63) The lowest difference (6 reduction in ADG
for LSC compared with HSC) was found in the experiments described in Chapter 2 and for a
study of Le Flocrsquoh et al (2006) The highest difference was found in the experiment
described in Chapter 4 (26 difference in ADG) In all studies except for Jayaraman et al
(2016) the difference in ADG was due to both a difference in average daily feed intake
(ADFI) and gain to feed (GF) ratio for the LSC and HSC treatment groups In a meta-analysis
of Pastorelli et al (2012b) the reduction in ADG was reported for different immune
challenged pigs compared with control pigs For poor housing conditions a combination of
studies with poor hygiene conditions exposure to extreme temperatures and limiting
0
05
1
15
2
25
3
35
Hap
togl
ob
in g
LLSC
HSC
+
Chapter 6
144
Figure 62 Average daily gain (ADG) of low (LSC) and high (HSC) sanitary condition pigs for several references using
a similar model to stimulate the immune system (Williams et al 1997 Lee et al 2005 Le Floch et al 2006 Le
Flocrsquoh et al 2009 Pastorelli et al 2012a Jayaraman et al 2016) P le 005
space allowance a reduction of 15 in ADG was reported with 41 due to a reduction in
ADFI and 122 due to reduced efficiency or GF ratio Despite that all the eight studies (Fig
63) have a contrast in hygiene conditions the results of these studies are not completely in
line with Pastorelli et al (2012b) All studies represented in in Fig 63 differed in more
factors than only a contrast in hygiene conditions other factors were different which might
explain the difference in results with the previous mentioned meta-analysis The difference
in ADG was highest for the study described in Chapter 4 Williams et al (1997) and
Jayaraman et al (2016) In these studies piglets were weaned at 21 d of age or younger
(Table 61) and the contrast in sanitary conditions was created from weaning onwards for a
duration of 2 to 8 weeks The other studies except for Lee et al (2005) used pigs weaned at
24 d (Chapter 2) or 28 d of age (Le Floch et al 2006 Le Flocrsquoh et al 2009 Pastorelli et al
2012a) and the contrast in SC was created from weaning onwards or later in life (Chapter 2
initial age 70 d) and the experimental period lasted for 40 d to 16 weeks Pastorelli et al
(2012b) found that the difference in ADG decreased with increasing initial age and
0
200
400
600
800
1000
AD
G g
pig
day
LSC
HSC
Chapter 6
145
increased duration of the experimental period for models containing poor housing
conditions and digestive bacterial infections which is in line with the findings in Fig 63
The difference in initial age and duration of the study might explain the difference in ADG
contrast between the treatments of the studies described in Chapter 2 and 4 however the
experimental models used in both studies were not completely similar which might have
affected ADG as well In the study of Chapter 4 a manure mixture of 3 growing pigs farms
was spread weekly in the LSC pens whereas in the study of Chapter 2 manure of one sow
farm was spread every 2 weeks in the LSC pens from 5 weeks in experimental period
onwards In addition dust (ground pig manure and straw) was introduced in the study in
Chapter 4 which might have increased the contrast in SC compared with the study in
Chapter 2 Despite the differences in spreading manure or dust the composition of manure
is also variable in time which lowers the repeatability of such studies
Effect of aerial ammonia on performance When comparing the studies in which aerial
ammonia concentrations were reported there is variability in results (Table 63) Ammonia
is known to be irritating for respiratory tissues and eyes and will influence consequently
respiratory function (Urbain et al 1994 Groot Koerkamp et al 1998) The threshold for
ammonia was set on 20 ppm measured in the mean dwelling zone of animals by CIGR
(CIGR 1984) It is unclear where the value of the CIGR is based on In a study of Groot
Koerkamp et al (1998) was described that the labour inspectorate in several countries in
Europe has set the threshold limit for an 8 h working day on 25 ppm ammonia In a study of
Jones et al (1999) was reported that weaner pigs showed averse to ammonia
concentrations of more than 20 ppm in a choice study In this perspective ammonia
concentration was more severe in the study of Jayaraman et al (2016) compared with the
study in Chapter 2 and Lee et al (2005) Drummond et al (1980) found a negative effect of
high concentrations of aerial ammonia (50 ppm) on pig growth (-12 growth) This
negative effect of high ammonia concentrations on growth might partly explain the greater
difference in ADG between LSC and HSC pigs in the study of Jayaraman et al (2016)
compared with the study in Chapter 2 and Lee et al (2005)
Behaviour and sanitary conditions The relation between sanitary conditions and behaviour
of pigs is not often made In the experiment described in Chapter 3 LSC pigs were more
frequently biting in ears of pen mates than HSC pigs The mechanism behind the
relationship between LSC and redirected behaviour is not completely understood yet
Redirected behaviour might be a result of an increased drive for foraging behaviour as a
consequence of shortages of nutrients caused by immune stimulation In a study of
Pastorelli et al (2012a) individual housed LSC and HSC pigs were submitted to a diet change
from a starter to a weaner diet over a 3 day period (12 to 14 days post weaning) The HSC
pigs did not react on a change in diet whereas the LSC pigs increased their exploration
Chapter 6
146
behaviour towards the trough which included sniffing licking touching and chewing on the
trough The absence in the behavioural effect of HSC pigs was explained as a lower
reactivity for new situations associated with a more stable environment as described by
Greenberg (2003) and the redirected behaviour of LSC pigs was considered as a typical
signal of maladjustment as found by Wood-Gush and Vestergaard (1989) Despite that a
link between immune system stimulation due to LSC and a possibly consequential shortage
in nutrients and increased redirected behaviour was not made in the study of Pastorelli et
al (2012a) behavioural measurements showed that sanitary conditions and behaviour
were related Behaviour of pigs as an indicator for wellbeing can be considered as an
important parameter for immune stimulation studies The measurement of pig behaviour
in studies about sanitary conditions should therefore be considered more often
Figure 63 Difference in average daily gain (ADG) of low (LSC) and high (HSC) sanitary condition pigs for several references using a similar model to stimulate the immune system (Williams et al 1997 Le Floch et al 2006 Le Flocrsquoh et al 2009 Pastorelli et al 2012a Jayaraman et al 2016) The difference is expressed as a percentage relative to HSC
-6
-26
-6
-9
-11
-17-19
-10
-30
-25
-20
-15
-10
-5
0
Chapter 6
147
Table 63 Ammonia concentration for low and high sanitary condition pigs for several references using a similar model to stimulate the immune system
Estimated BW low sanitary condition high sanitary condition P-value
Chapter 2a 25-110 kg 171 plusmn 18 ppm 138 plusmn 13 ppm 014
Lee et al 2005 6-20 kg 130 plusmn 07 ppm 60 plusmn 05 ppm 0001
Jayaraman et al 2016 7-12 kg 267 plusmn 10 ppm 182 plusmn 11 ppm le 0001 a unpublished data measured weekly per room from 17 until 22 weeks of age
Immune system stimulation It is difficult to estimate the severity of the stimulation of the
innate immune system in pig studies Most of the studies about immune stimulation in
relation to nutrition and health report haptoglobin values some other acute phase proteins
and body temperature however often not many more parameters are presented
(Melchior et al 2004 Le Flocrsquoh et al 2009 Rakhshandeh et al 2010 Pastorelli et al
2012a) Acute phase proteins are relevant parameters as it is known that these proteins are
relatively stable in comparison to eg cytokines however more parameters are needed to
gain insight in the physiologicalmetabolic processes in the pig under different sanitary
conditions Analysis of natural antibodies in blood can for instance be such an additional
parameter Natural antibodies are defined as antigen-specific antibodies that are present in
the absence of intentional immunization with specific antigens (Star et al 2007) Because
natural antibodies play a role in the first line of defence against pathogens (Ochsenbein and
Zinkernagel 2000) an increase in natural antibody concentration might be an adaptive
response of pigs to the higher infection pressure for instance in the case of LSC The
experiment described in Chapter 4 showed higher KLH specific natural antibody levels in
LSC than in HSC pigs and this suggests together with the results presented in Textbox 61
that there was a contrast in immune system stimulation between LSC and HSC pigs
Measurement of white blood cell concentrations and blood cell differentiation might give
extra insight in the stimulation of the immune system For clinical infection studies this
might work as the results can be compared with reference values for clinically healthy
animals Results for blood cell counts as described in Chapter 2 and 4 however were more
difficult to interpret and gave variable results Partly the problems with interpreting these
blood cell counts were due to the fact that these values were within the reference values
for clinically healthy pigs
The pathogenic pressure on the immune system can be measured by testing the presence
of antigens against specific pathogens in the blood or the saliva of pigs A method to
analyse the presence of saliva was applied in the experiment described in Chapter 2
Collecting saliva of pigs is rather easy when using chewing ropes and the samples can
subsequently be analysed for the presence of pathogenic bacteria viruses and parasites
with PCR or culture techniques Saliva collection is not stressful for the pigs so it will not
influence other parameters measured in the experiment Moreover it is possible and easy
to sample a pen of pigs with one chewing rope to get a representative saliva sample The
collected saliva samples in the study described in Chapter 2 were only used for qualitative
Chapter 6
148
testing of the presence of antibodies against specific pathogens Other available analytical
methods allow to quantify antibody concentrations in saliva samples Collection and
analysis of saliva can therefore be of interest in studies evaluating the effects of sanitary
conditions
The pig performance and acute phase protein information reported in several studies
about sanitary conditions is too limited to conclude whether the innate immune system
was stimulated differently in LSC than in HSC pigs Additional measurements of natural
antibodies and antibodies against specific pathogens can give additional insight in the
infectious pressure however further research is needed develop a method or to evaluate
what combination of sanitary condition parameters are needed to get more insight into the
actual level of innate immune responses
It is interesting to investigate whether robustness of pigs is affected by different sanitary
conditions To this end we studied within the setting of the experiment described in
Chapters 2 and 3 the effect of sanitary conditions on the sickness response of pigs
provoked by a low iv dose of LPS This test is described in Textbox 61 From the results of
this study there are no indications that the sickness response of pigs is altered by sanitary
conditions
Chapter 6
149
Textbox 61 Effects of RGG and LPS challenge in pigs kept under low or high sanitary conditions
Aim To determine whether sanitary conditions (SC) affect the sickness response and antibody levels of pigs iv challenged with rabbit gamma globulin (RGG) and lipopolysaccharide (LPS) Materials and methods In Chapter 2 612 pigs (9 per pen) were subjected to one of 8 experimental treatments in a 2 times 2 times 2 factorial arrangement Pigs were kept under low (LSC) or high (HSC) sanitary conditions and offered ad libitum access to either a normal CP concentration diet or low CP concentration diet each of which containing a basal AA profile or a supplemented AA profile Pigs were followed for a complete fattening period and slaughtered at a targeted pen weight of 110 kg In total 68 pigs (40 kg BW) of Chapter 2 (one per pen) were iv challenged with LPS (Escherichia coli LPS serotype O111B4 Sigma Aldrich Zwijndrecht The Netherlands product code L4391) and RGG (ICN Biomedicals Inc code824551) LPS an endotoxin of E coli was used to induce a sickness response (Clouard et al 2015) and RGG protein was used to induce a specific humoral immune response The challenge solution was prepared the day prior to the injection by dissolving 1 mg RGG and 80 μg LPS in 1 ml sterile physiological saline and kept at 4 degC The average BW of the challenged animals was 40 kg at the day of challenge resulting in a challenge dose of about 2 μg of LPSkg BW similar to the dosage used by Clouard et al (2015) and a challenge dose of 0024 mg RGG kg BW One pig per pen was assigned to an iv injection with the challenge solution in the ear vein The challenge pigs were restrained the ear was cleaned with a gauze drained in alcohol and the vein at the ear base was clamped down by gently pressing it The solution was injected using 05 ml syringes with 29 gauge needles Rectal temperature of the challenged pigs was measured just before the challenge and 15 35 and 65 h after challenge In order to assess sickness behaviour a human approach test (HAT) was performed at 1 3 and 6 h after the challenge Although this test is normally used to assess fear and anxiety in pigs in the present study high latency in this test was considered indicative of sickness behaviour (Clouard et al 2016) During the test a person entered each pen and walked to a fixed position in the centre The latency of the challenged pig to approach or seek physical contact with the person was recorded with a maximum of 120 sec Blood was sampled from the jugular vein of the challenged pigs at 5 and 10 days post challenge and blood serum samples were analysed for antibody concentrations (both IgG and IgM against each LPS RGG and keyhole limpet hemocyanin (KLH) by ELISA Antibody titers were determined as described by de Koning et al (2015) with the minor modification that a 4-step dilution (40 160 640 2560 times diluted) of the sera was made instead of a 3-step dilution Rectal temperature at the 3 time points following the challenge and antibody titers at day 5 and 10 post-challenge were analysed by the proc MIXED procedure of SAS 93 (SAS 93 SAS Inst Inc Cary NC) with SC dietary protein level dietary AA-profile batch and their interactions as fixed effects Results The rectal temperature increased after a LPSRGG injection for all challenged pigs and was almost back to baseline at 65 h post challenge (Fig 64) This response in rectal temperature was similar to the response of pigs in a study of Clouard et al (2015) and shows a clear response on the LPS challenge for both treatments
Chapter 6
150
Measurement of energy and protein metabolism
Hoe meet je de kosten van energie en eiwit
Figure 64 Rectal temperature response of low (LSC) and high (HSC) sanitary condition pigs challenged with LPS and RGG P le 005
Figure 65 Antibody titers (type IgG and IgM) against keyhole limpet hymocyanin (KLH) rabbit gamma globulin (RGG) and lipopolysaccharide (LPS) in pigs measured at 5 and 10 days post iv challenge with LPS and RGG P le 005 + 005 lt P le 010 The open bars represent low sanitary condition pigs and the striped bars high sanitary condition pigs
00
05
10
15
20
0 1 2 3 4 5 6 7
Re
ctal
te
mp
era
ture
incr
eas
e
˚C
Time post challenge h
LSC
HSC
00
30
60
5 10
IgG
tit
er a
gain
st K
LH
days post challenge
00
30
60
90
5 10
IgM
tit
er a
gain
st K
LH
days post challenge
00
30
60
5 10
IgM
tit
er a
gain
st R
GG
days post challenge
00
30
60
90
5 10
IgM
tit
er a
gain
st L
PS
days post challenge
+
00
30
60
5 10
IgG
tit
er a
gain
st R
GG
days post challenge
00
30
60
5 10
IgG
tit
er a
gain
st L
PS
days post challenge
A B C
D E F
Chapter 6
151
TECHNIQUES TO MEAUSURE AMINO ACID AND ENERGY
METABOLISM
In several studies effects of sanitary conditions or acute immune stimulation on AA
metabolism were studied by using a titration method between pigs (Williams et al 1997
de Ridder et al 2012 Kim et al 2012 Kahindi et al 2014 Jayaraman et al 2015) or
within individual pigs (Kampman-van de Hoek et al 2013) In most of the studies using a
titration method between pigs different treatment groups with pigs were offered
treatment diets with a contrast in dietary AA concentration developed by supplementing
the AA in free form to a diet that is limiting in the AA of interest For example Kahindi et al
(2014) created a difference in lysine concentration in the treatment diets by addition of
increasing levels of free lysine to the diet in exchange for maize starch In a study of
Kampman-van de Hoek et al (2013) a within-animal titration approach was used in
individual meal-fed pigs The dietary Lys concentration was stepwise increased or
decreased with a step length of 3 days resulting in a minimum experimental time period of
21 days as 7 different Lys concentrations were evaluated The advantage of this titration
approach is that it results in the estimation of a requirement value for an individual animal
Nevertheless a minimum time period of 21 days was required in the study of Kampman-
van de Hoek (2013) and standardization of effects of ISS over a prolonged period of time
remains difficult particularly when housing the pigs on metabolism cages
Rectal temperature increase in relation to the rectal temperature before challenge did not differ between LSC and HSC pigs (P = 058) Latency time in the HAT did not differ between LSC pigs and HSC pigs (P = 019) Type IgG antibody titers against KLH RGG were higher in LSC pigs compared with HSC pigs (P le 005) at 5 days post challenge whereas LPS specific IgG titers although numerically higher were not significantly different between pigs of different sanitary conditions (Fig 65) In unchallenged pigs the KLH specific IgG titers were also higher for LSC pigs compared with HSC pigs (P le 005 Chapter 2) It might therefore be that the SC effect in IgG against KLH and maybe also against LPS and RGG in challenged pigs is due to the contrast in sanitary conditions rather than to the difference in response to the combined LPS and RGG challenge Unfortunately no blood sampling was done (to avoid stress due to blood sampling) before the LPS RGG challenge to distinguish between effects due to this challenge or SC effects Conclusion Low and high sanitary condition pigs do not respond differently to a HAT test and have very likely also no different rectal temperature or antibody response after a combined iv RGG and LPS challenge The effects found for antibody response are probably due to the SC effect rather than to the LPS RGG challenge effect
Chapter 6
152
In general the titration method is an easy and accurate method to quantify the effect of
sanitary conditions on the AA requirement of pigs Nevertheless by using the dose-
response method the focus is only on a single supplemented AA that is assumed to be
limiting
Using multiple AA in an alternative approach Kampman-van de Hoek et al (2016)
measured whole body fluxes of 9 essential AA simultaneously This flux referred to as the
irreversible loss rate from the plasma AA pool was measured in pigs assumed to be in a
steady state (ie hourly fed) following an iv bolus of a mixture of U-13C-labelled essential
AA after which the disappearance of 13C-labeled AA from the plasma pool was measured
for 60 min When assuming that the measurement is in physiological steady state
differences in ILR between treatments (sanitary conditions) and between individual AA are
assumed to reflect differences and changes in AA requirements and their metabolism
Unfortunately data on ILR of AA do not discriminate between use in oxidative metabolism
or protein synthesis (Kampman-van de Hoek et al 2016) In addition individual housing
and frequent blood sampling is required
The factorial method used in the experiments described in Chapter 2 and 4 was not meant
to determine quantitative AA requirements of the pigs but to determine whether the
requirements of LSC and HSC pigs were different The method used allowed to study the
effect of a diet with a basal AA profile compared with a supplemented AA profile containing
extra Met Thr and Trp in ratio to Lys compared with the basal diet in group housed pigs
By using this method it was possible to study the effect of supplementing more than one
AA at the same time In Chapter 2 the supplemented diet lead to greater ADG and GF ratio
than the basal diet in both LSC and HSC pigs The increase in GF was greater in LSC pigs
indicating that supplementing Met Thr and Trp were more beneficial for LSC pigs than HSC
pigs With the method used it is not possible to distinguish between the effects of the
individual AA supplemented so it remains unclear if one of the three AA or a combination
of AA was responsible for the observed effects Therefore results obtained with this
approach do not lead to knowledge on quantitative changes in requirements of the specific
AA but these results show whether requirements for the combination of the
supplemented AA were affected This method can therefore be very useful to determine if
there is a contrast in AA requirements for different groups of pigs To determine the exact
AA requirements the dose response approach might be useful
Methods to measure energy metabolism In Chapter 4 the effect of sanitary conditions on
energy metabolism was measured by indirect calorimetry By using this method the
exchange of O2 CO2 and CH4 per group of 6 pigs in climate respiration chambers was
measured in 6 minutes intervals as described by Heetkamp et al (2015) Heat production
per chamber was calculated from the measured consumed volumes of O2 produced
volumes of CO2 and CH4 This calculation was done by using an equation (Brouwer 1958)
with coefficients based on the stoichiometry of the complete oxidation of carbohydrates
Chapter 6
153
fat and protein The indirect calorimetry method is known to be an accurate method
however attention should be paid in situations where an animals is pushed with a diet
infusate or when using indirect calorimetry to estimate short term variation in heat
production (Gerrits et al 2015) as it is assumed that O2 and CO2 pools within the body do
not change within a measurement period The indirect calorimetry method has the
advantage that repeated measurements can be performed in group housed animals
Another method to measure energy metabolism in pigs is the slaughter technique (Kim et
al 2012) Despite that this technique is accurate and simple it is laborious and does not
allow repetitive measurements within one animal In a study of Kim et al (2012) the
slaughter technique was used to quantify the effects of immune system stimulation on AA
metabolism for an experimental period of 40 d When using the slaughter technique for
such a long experimental period this means that the contrast in sanitary conditions should
be standardized for at least 40 d It will be a challenge to create a standardized contrast in
extent of innate immune system activation over such a period Therefore the indirect
calorimetry method was preferred in Chapter 4 In the study described in this Chapter
fasting heat production (FHP) was measured as estimate for energy requirement for
maintenance This was done in pigs fasted over a period of 25 h To determine whether 25
h of fasting was enough to reach a plateau in resting metabolic rate (RMR) a part of the pigs
were fasted for a period of 32 h (Textbox 62) The results in this textbox indicate that the
RMR was not stable after 25 h of fasting yet however the conclusion that LSC pigs had
greater FHP compared with HSC pigs was the same for 25 h and 32 h fasted pigs From FHP
the energy requirement for maintenance (MEm) can be estimated by using the method of
Labussiegravere et al (2011) as illustrated in Textbox 63 The MEm was 7 greater for LSC pigs
compared with HSC pigs according to this method
Chapter 6
154
Textbox 62 Twenty-five vs thirty two hours measurement for determining fasting heat production in pigs
In Chapter 4 fasting heat production (FHP) was measured as the resting metabolic rate (RMR) until 25 h after the start of the fasting period in 24 groups with 6 pigs each In addition FHP of 16 of these groups was also measured until 32 h after initiation of fasting to determine whether 25 h of fasting was sufficient to reach a plateau in energy expenditure as measure for their RMR Materials and methods In a 2 times 2 factorial arrangement 16 groups of pigs housed in calorimetric chambers were allocated to either a low sanitary condition (LSC) or a high sanitary condition (HSC) and were offered either a diet with a basal AA profile (AA-B) or a diet with a supplemented AA profile (AA-S) as described in Chapter 4 At 12 weeks of age pigs were deprived from feed after the morning meal at 0730 am until 0330 pm the next day Gas exchange was measured in the calorimetric chambers in 6-min intervals by measuring exchange of O2 CO2 and CH4 as described by Heetkamp et al (2015) The FHP was measured as described in Chapter 4
Figure 66 Partitioned heat production of pigs kept under low (LSC) and high (HSC) sanitary conditions and fed a diet with (AA-S) or without (AA-B) extra AA A represents the total heat production B represents resting metabolic rate C represent heat related to physical activity The arrow indicates the moment of the last meal The grey area represents dark time and the white area light time The dotted area represents the measurement of energy expenditure after 25 h fasting Results are presented as least square mean plusmn SEM
Chapter 6
155
Results The RMR of the LSC pigs and the HSC pigs fed the AA-B diet was higher 25 h (LSC-AA-B 698 LSC-AA-S 743 HSC-AA-B690 kJBW-06d-1) than 32 h after the last meal (LSC-AA-B 668 LSC-AA-S 733 HSC-AA-B 648 kJBW-06d-1 Fig 66) The RMR of HSC pigs fed the AA-S diet did not differ using either a 25h or a 32 h period of feed deprivation
Figure 67 Respiration coefficient (RQ) and fat oxidation of pigs kept under low (LSC) and high (HSC) sanitary conditions and fed a diet with (AA-S) or without (AA-B) extra AA The arrow indicates the moment of the last meal The grey area represents dark time and the white area light time The dotted area represents the extra measurement after 25 hours of fasting Results are presented as least square mean plusmn SEM
These results indicate that RMR which is needed to estimate the energy was still decreasing after 25 h of fasting The respiration coefficient (RQ) was higher at 25 h (078 kJ kg -06 d-1) of fasting compared with 32 h (075 kJ kg -06 d-1) of fasting (Fig 67) indicating that fat oxidation still increased after 25 h of fasting Fat oxidation was lower at 25 h of fasting compared with 32 h of fasting probably partly due to higher physical activity after 32 h compared with 25 h of fasting (Fig 67) The FHP was still greater for LSC pigs compared with HSC pigs at 32 h after initiation of fasting (P le 005) as was found for 25 h after initiation of fasting (Chapter 4) Conclusion The length of the measurement period for estimating FHP influenced RMR RQ and fat oxidation A 32 h fasting measurement gave a lower RMR a lower RQ value and a higher fat oxidation than a period of 25 h of fasting
Chapter 6
156
Textbox 63 Energy requirements for maintenance for low and high sanitary condition pigs
Aim To estimate energy requirements for maintenance for low sanitary conditions (LSC) and high sanitary conditions (HSC) pigs by using data on fasting heat production (FHP) Materials and methods In a 2 times 2 factorial arrangement 24 groups of 6 pigs housed in calorimetric chambers were allocated to either a LSC or a HSC and were offered either a diet with a basal AA profile (AA-B) or a diet with a supplemented AA profile (AA-S) as described in Chapter 4 Heat production of these groups was calculated over an ad libitum and a restricted feeding period and fasting heat production was measured for the same groups (Chapter 4) Feed intake in ad libitum and restricted feeding periods was registered Metabolizable energy for maintenance (MEm) was calculated by using relationships between heat production (HP) or FHP and ME intake by adapting a method used by Labussiegravere et al (2011) A relationship between ME intake for the restricted and ad lib period was plotted (line A) and for the restricted and FHP and ad libitum and FHP two other lines were plotted (lines B Fig 68) The intercept between line A and the dashed line representing HP corrected for activity = ME gives the conventional MEm The MEm according to the method of Labussierre et al (2011) is represented by the intersection between lines B and HPcorrected = ME
Figure 68 Relationships between heat production corrected for activity (HPcorrected) fasting heat production (FHP) and ME intake for a restricted and ad libitum feeding period for calculating ME for maintenenance (MEm) This figure is based on data of a single experimental group of pigs
Results The MEm according to the conventional method was 808 kJ ∙ BW-06∙ d-1 for LSC and 617 kJ ∙ BW-06∙ d-1 for HSC (P = 013) This means on average an 30 higher MEm for LSC compared with HSC pigs according to this method which does not take feeding level into account MEm however is known to depend on feeding level The MEm calculated by using lines B varied from 885 to 930 kJ ∙ BW-06∙ d-1 for LSC pigs and from 818 to 875 kJ ∙ BW-06∙ d-1 for HSC pigs This means on average a 7 higher MEm for LSC compared with HSC pigs according to this method (P = 005) This estimate is preferred as the conventional method requires extrapolation too far outside the measured range Conclusion Consistent with the difference in FHP observed the MEm for LSC pigs was 7 higher than the MEm for HSC pigs
Chapter 6
157
NUTRIENT REQUIREMENTS OF LOW SANITARY CONDITION PIGS
To translate the findings of the studies in the present thesis to possible feeding strategies
under varying SC the main findings are summarized (Table 64) This summary of results
only focusses on data obtained in ad libitum fed pigs and excluded data of pigs fed low
protein diets (Chapter 2 and 3)
Table 64 Summary of parameters affected for ad libitum fed LSC compared with HSC pigs in Chapter 2 and 4
Itema Difference compared with HSC pigsb
ADFI -6
ADG -12
GF ratio -5
N-digestibility -6
Fasting heat production +8
Maintenance energy (Textbox 63) +7
Incremental efficiency nitrogen -20
Haptoglobin concentration serum +69
Ear biting behaviour +30 a ADFI = average daily feed intake ADG = average daily gain GF ratio = gain to feed ratio N = nitrogen FHP =
fasting heat production b Data are based on pigs fed ad libitum with adequate dietary crude protein level
Based on the summary of parameters affected by SC (Table 64) the impact of SC on
energy and AA requirements was estimated for a standard pig of 25 kg BW (Table 65)
Changes in energy requirements for maintenance N digestibility and incremental efficiency
of N for deposition in the body for a LSC compared with a HSC pig were taken into account
For this comparison differences in ADFI observed in Chapter 2 and 4 (75 and 110 gd
respectively) between LSC and HSC pigs are not taken into account and ADFI of LSC pigs
was set equal to the ADFI of HSC pigs A 10 weeks old HSC pig of 25 kg with an ADFI of
1256 g ∙ pig-1 ∙ d-1 was taken as reference The reference diet contained 1025 g Lyskg an
134 kJ of MEg diet and a dietary CP concentration of 165 gkg For the first 950 g of
ADFId nutrient digestibility efficiencies for protein and energy deposition in the body
observed for the restricted fed pigs were assumed (Chapter 4) and for the feed intake
above this level (ie 306 gd) the incremental energy and N efficiencies were assumed as
presented in Chapter 4 Other reference data were based on results presented in this
thesis
Chapter 6
158
Table 65 Calculation of the effects of low sanitary conditions (LSC) on Lys and ME requirements by using a high sanitary condition (HSC) pig of 25 kg BW as a reference
Item HSC LSC
Reference data BW1 kg 25 25
ADFI2 for ad libitum period gd 1256 1256
ADFI for restricted period gd 950 950
Dietary ME3 content kJg 134 134
Dietary CP4 content gkg 165 165
Dietary Lys5 content gkg 103 103
MEm6 kJBW06 847 908
ATTD7 coefficient for N8 080 075
Incremental ATTD coefficient for N 073 073
Feed needed for MEm gd 436 467
Feed left above maintenance gd 820 789
ME intake MJd 168 168
ATTD protein intake (ad lib) gd 166 156
ATTD protein intake (restricted) gd 125 118
Extra ATTD protein intake (ad lib - restricted) gd 37 37
Protein deposition for restricted intake gd 88 84
Incremental protein deposition (ad lib - restricted) gd 36 28
Total protein deposition in the body gd 124 111
Lys intake gd 129 129
ATTD Lys intake (ad lib) gd 101 96
Total Lys deposition gd 88 79
Incremental Lys deposition (ad lib - restricted) gd 26 20
LysME ratio and increased energy and Lys requirements for LSC pigs LysME ratio gMJ 076 076
Increased ME requirement to compensate for increased MEm MJd
042
Increased Lys requirement to compensate for reduced ATTD gd
045
Increased Lys requirement to compensate for reduced incremental efficiency gd
060
LysME ratio needed for total extra requirements g ATTD LysMJ
249 1BW = body weight 2 ADFI = average daily feed intake 3 ME = metabolizable energy 4 CP = crude protein 5 Lys = lysine 6 MEm = metabolizable energy for maintenance 7 ATTD = apparent total tract digestibility 8 N = nitrogen
Chapter 6
159
From these calculations it appeared that the LSC pig needed 042 extra MJ MEd to
compensate for increased MEm 045 g extra ATTD Lysd to compensate reduced total tract
N digestibility and 060 g extra ATTD Lysd to compensate for reduced incremental N
efficiency for LSC compared with HSC pigs Overall this means that the Lys ME ratio of the
extra feed required to maintain performance is 249 g ATTD LysMJ ME which is higher
than the ratio of the diet that was offered to the HSC pigs (076 g ATTD LysMJ ME) The
results described in the different Chapters in this thesis show that energy and AA
requirements are both increased for LSC compared with HSC pigs however this calculation
shows that the increase in AA requirement is proportionally more important than the
increase in energy requirement
The increase in energy for maintenance and the reduction of incremental protein efficiency
would have to be accounted for in increased requirement values of all AA per unit of
energy When expressing the total extra requirement for Lys (045 + 060 gd Table 65) as
a percentage of the ATTD Lys intake for HSC pigs a 10 increase in Lys would be needed to
compensate for reduced ATTD and reduced incremental N efficiency
Taking the reduction in ADFI that we observed in chapter 2 and 4 into account implies that
the increased energy and AA requirements for LSC pigs calculated should be concentrated
in a smaller quantity of feed For a reduction in ADFI of 6 (Table 64) this would mean that
the ME content of the diet would have to increase to 142 kJ of MEg diet without
considering the increased requirement for MEm as described in Table 65 The former
could be implemented in practical diet formulation by increasing the dietary fat content
This would only be feasible if the feed intake capacity of LSC pigs is not further reduced by
an increased dietary energy concentration Little is known about the background of satiety
regulation in LSC pigs but our observation that LSC pigs have increased feed refusals upon
a 30 feed restriction (Chapter 4) illustrate that LSC pigs tend to eat in smaller meals
When translating the results of these studies into practise it is an interesting debate
whether the decreased efficiency of nutrient utilization in LSC pigs should be reflected
either in the evaluation of feed ingredients or in altered nutrient requirements values As
the effects of SC on ATTD of nutrients appeared independent of the level of feeding it
would appear that effects on nutrient digestibility could be represented in lowering the
concentrations of SID AA in feed ingredients as compared to current values (CVB 2011
NRC 2012) It would require more information on the effects of LSC on nutrient
digestibility particularly considering low and high digestible feed ingredients
Regarding the low incremental efficiency of utilization of dietary protein in LSC pigs it is
questionable whether it is cost-effective to completely satisfy the increased AA
requirements As LSC pigs have a reduced incremental efficiency of dietary N for protein
retention in the body increases in dietary AA might lead to a relatively low increase in body
protein deposition It is known that the total efficiency of the use of protein for depositing
protein in pigs reduces when protein is fed in excess The reduced incremental efficiency
Chapter 6
160
found might be related to a lower maximal rate of protein deposition of LSC pigs compared
with HSC pigs a increased AA oxidation for LSC compared with HSC pigs or an imbalance in
AA In addition an excess of dietary protein in the gastro intestinal tract might lead to an
increase in fermentation of undigested protein and in risk for growth of intestinal
pathogens (Prohaacuteszka and Baron 1980 Nollet et al 1999)
In general the results presented in the chapters of the present thesis indicate that LSC and
HSC pigs have increased requirements for energy and AA In proportion the increase in AA
requirements seem more important than the increase in energy requirements for LSC pigs
The different requirements found for LSC and HSC pigs were especially present in early life
It might be beneficial to reduce nutrient digestibility values of feed ingredients for young
LSC pigs or to select highly digestible ingredients for diets of these pigs and to increase the
concentrations of AA in the diet for LSC pigs to a certain extent Results obtained in this
thesis help to understand the nutrient requirements of LSC compared with HSC pigs and
might be used for implementation in models predicting growth performance of pigs and for
targeted feeding strategies for LSC pigs To further implement the results obtained in LSC
and HSC pigs in more exact energy and AA recommendations for diet formulation in
practise additional studies are needed for validation
Chapter 6
161
CONCLUSIONS
In two large-scale experiments we studied the effect of a chronic low grade inflammation
by imposing low sanitary conditions on energy and AA metabolism in growing pigs The
results provide a scientific basis for developing targeted nutritional strategies for pigs kept
under various conditions In brief the following conclusions were drawn from this thesis
- Using low and high sanitary conditions to create a contrast in chronic low grade
immune stimulation as described in the present thesis leads to
o A 12 reduced body weight gain a 6 reduced ADFI and a 5 reduced
GF ratio in LSC compared with HSC pigs
o An increased occurrence of damaging behaviour for LSC compared with
HSC pigs
- The observed variation in pig performance and innate immune responses among
batches and between studies in the current thesis indicates the importance of
having more than a single batch in studies using our sanitary condition approach
- Extra dietary supplementation of Met Thr and Trp was beneficial for the growth
performance in HSC pigs and in particular for LSC pigs in the first study however
these effects were not observed in the second study
- Reduction of dietary protein increases the occurrence of damaging behaviours in
pigs
- The apparent total N digestibility of LSC pigs was 6 lower compared with HSC
pigs
- Based on measured rates of fasting heat production the energy requirement for
maintenance is estimated to be 7 greater in LSC than in HSC pigs
- The incremental efficiency for N intake retained as body protein was 53 for LSC
pigs and 73 for HSC pigs
Overall the results of this thesis indicate that both energy and AA requirements are greater
in LSC pigs compared with HSC pigs It is questionable however whether it is nutrient and
cost effective and biologically possible to satisfy these increased nutrient requirements in
LSC pigs as the incremental efficiency of N for retained protein is low and ADFI is reduced
for LSC pigs compared with HSC pigs The present thesis demonstrates that care should be
taken in reducing dietary protein concentrations to improve protein efficiency in pigs as it
incurs a risk to increased damaging behaviours particularly when pigs are kept under LSC
Chapter 6
162
REFERENCES
ARC 1981 The nutrient requirements of pigs Commonwealth agricultural bureaux London UK
Brouwer E 1958 One simple formulae for calculating the heat expenditure and the quantities of carbohydrate and fat oxidized in metabolism of men and animals from gaseous exchange (oxygen intake and carbon acid output) and urine-N Acta Physiolog Neerl 6 795-802
Campos P H E Merlot M Damon J Noblet and N Le Floch 2014 High ambient temperature alleviates the inflammatory response and growth depression in pigs challenged with Escherichia coli lipopolysaccharide Vet J 200 404-409
Carpintero R M Pintildeeiro M Andreacutes M Iturralde M A Alava P M H Heegaard J L Jobert F Madec and F Lampreave 2005 The concentration of apolipoprotein A-I decreases during experimentally induced acute-phase processes in pigs Infect Immun 73 3184-3187
CIGR Commision internationale de genie rural 1984 Report on working group on climatization of animal houses Craibstone Aberdeen UK
Clouard C A S Souza W J J Gerrits R Hovenier A Lammers and E J Bolhuis 2015 Maternal fish oil supplementation affects the social behavior brain FA profile and sickness response of piglets J Nutr 1452176-2184
Centraal Veevoeder Bureau (CVB) 2011 Chemical compositions and nutritional values of feed ingredients CVB Lelystad The Netherlands
Centraal Veevoeder Bureau (CVB) 2016 Tabellenboek Veevoeding Voedernormen varkens en voederwaarden voedermiddelen
voor varkens CVB Lelystad The Netherlands
de Ridder K C L Levesque J K Htoo and C F M de Lange 2012 Immune system stimulation reduces the efficiency of tryptophan utilization for body protein deposition in growing pigs J Anim Sci 90 3485-3491
Drummond J G S E Curtis J Simon and H W Norton 1980 Effects of aerial ammonia on growth and health of young pigs J Anim Sci 50 1085-1091
Edwards J F and D O Slauson 1983 Complete Freunds adjuvant-induced pneumonia in swine A model of interstitial lung disease J Comp Pathol 93 353-361
Gerrits W J J J J G C van den Borne and E Labussiegravere 2015 Deriving heat production from gaseous exchange validity of the approach In W J J Gerrits and E Labussiegravere editors Indirect calorimetry Techniques computations and applications Wageningen Academic Publishers Wageningen p 19-34
Greenberg R 2003 The role of neophobia and neophilia in the development of innovative behaviour of birds In M Simon and K N Laland editors Animal innovation Oxford University Press New York US p175-196
Groot Koerkamp P W G J H M Matz G H Uenk V R Plilips M R Holden R W Sneath J L Short R P P White J Hartung J Seedorf M Schroumlder K H Linkert S Pedersen H Takai J O Johnson and C M Wathes 1998 Concentrations and emissions of ammonia in livestock buildings in northern europe J Agric Engin Res 70 79-95
Heegaard P M H A Stockmarr M Pintildeeiro R Carpintero F Lampreave F M Campbell D P Eckersall M J M Toussaint E Gruys and S N Sorensen 2011 Optimal combinations of acute phase proteins for detecting infectious disease in pigs Vet Res 421-13
Heegaard P M H J Klausen J P Nielsen N Gonzaacutelez-Ramoumln M Pintildeeiro F Lampreave and M A Alava 1998 The Porcine Acute Phase response to infection with actinobacillus pleuropneumoniae haptoglobin C-reactive protein major acute phase protein and serum amyloid A protein are sensitive indicators of infection Comp Biochem Phys B 119 365-373
Heetkamp M J W S J J Alferink T Zandtra P Hendriks H van den Brand and W J J Gerrits 2015 Design of climate respiration chmabers adjustable to the metabolic mass of subjects In W J J Gerrits and E Labussiegravere editorsIndirect calorimetry Techniques computations and applications Wageningen Academic Publishers Wageningen p 35-56
Heim G T Sweeney C J OShea D N Doyle and J V ODoherty 2014 Effect of maternal supplementation with seaweed extracts on growth performance and aspects of gastrointestinal health of newly weaned piglets after challenge with enterotoxigenic Escherichia coli K88 Brit J Nutr 112 1955-1965
Jayaraman B J Htoo and C M Nyachoti 2015 Effects of dietary threoninelysine ratioes and sanitary conditions on performance plasma urea nitrogen plasma-free threonine and lysine of weaned pigs Anim Nutr 1 283-288
Jayaraman B J K Htoo and C M Nyachoti 2016 Effects of different dietary tryptophan lysine ratios and sanitary conditions on growth performance plasma urea nitrogen serum haptoglobin and ileal histomorphology of weaned pigs Anim Sci J
Jones J B A J F Webster and C M Wathes 1999 Trade-off between ammonia exposure and thermal comfort in pigs and the influence of social contact Anim Sci 68 387-398
Kahindi R J Htoo and C Nyachoti 2014 Short Communication Effect of dietary lysine content and sanitation conditions on performance of weaned pigs fed antibiotic-free diets Can J Anim Sci 94 115-118
Kampman-van de Hoek E W J J Gerrits J J G C van den Borne C M C van der Peet-Schwering H van Beers-Scheurs and A J M Jansman 2011 Selectie van een onderzoeksmodel voor het bestuderen van de invloed van immuunsysteem activatie op de aminozuurbehoefte van varkens WUR Livestock Research Lelystad The netherlands
Kampman-van de Hoek E W J J Gerrits C M C van der Peet-Schwering A J M Jansman and J J G C van den Borne 2013 A simple amino acid dosendashresponse method to quantify amino acid requirements of individual meal-fed pigs J Anim Sci 91 4788-4796
Chapter 6
163
Kampman-van de Hoek E A J M Jansman J J G C van den Borne C M C van der Peet-Schwering H van Beers-Schreur and W J J Gerrits 2016 Dietary amino acid deficiency reduces the utilization of amino acids for growth in growing pigs after a period of poor health J Nutr 146 51-58
Kampman-van de Hoek E P sakkas W J J Gerrits J J G C van den Borne C M C van der Peet-Schwering and A J M Jansman 2015 Induced lung inflammation and dietary protein supply affect nitrogen retention and amino acid metabolism in growing pigs Brit J Nutr 113 414-425
Kim J C B P Mullan B Frey H G Payne and J R Pluske 2012 Whole body protein deposition and plasma amino acid profiles in growing andor finishing pigs fed increasing levels of sulfur amino acids with and without Escherichia coli lipopolysaccharide challenge J Anim Sci 90 362-365
Labussiegravere E J van Milgen C F M de Lange and J Noblet 2011 Maintenance energy requirements of growing pigs and calves are influenced by feeding level J Nutr 141 1855-1861
Le Floch N C Jondreville J J Matte and B Seve 2006 Importance of sanitary environment for growth performance and plasma nutrient homeostasis during the post-weaning period in piglets Arch Anim Nutr 60 23-34
Le Flocrsquoh N L LeBellego J J Matte D Melchior and B Segraveve 2009 The effect of sanitary status degradation and dietary tryptophan content on growth rate and tryptophan metabolism in weaning pigs J Anim Sci 87 1686-1694
Le Flocrsquoh N D Melchior and B Segraveve 2008 Dietary tryptophan helps to preserve tryptophan homeostasis in pigs suffering from lung inflammation J Anim Sci 86 3473-3479
Lee C L R Giles W L Bryden J L Downing P C Owens A C Kirby and P C Wynn 2005 Performance and endocrine responses of group housed weaner pigs exposed to the air quality of a commercial environment Livest Prod Sci 93 255-262
Litvak N A Rakhshandeh J Htoo and C de Lange 2013 Immune system stimulation increases the optimal dietary methionine to methionine plus cysteine ratio in growing pigs J Anim Sci 91 4188-4196
Maes D H Deluyker M Verdonck F Castryck C Miry B Vrijens W Verbeke J Viaene and A de Kruif 1999 Effect of vaccination against Mycoplasma hyopneumoniae in pig herds with an all-inall-out production system Vaccine 17 1024-1034
Marquardt R R L Z Jin J W Kim L Fang A A Frohlich and S K Baidoo 2006 Passive protective effect of egg-yolk antibodies against enterotoxigenic Escherichia coli K88+ infection in neonatal and early-weaned piglets FEMS Immunol Med Microbio 23 283-288
McLamb B L A J Gibson E L Overman C Stahl and A J Moeser 2013 Early weaning stress in pigs impairs innate mucosal immune responses to enterotoxigenic E coli challenge and exacerbates intestinal injury and clinical disease PLOS ONE 8 e59838
Melchior D B Segraveve and N Le Flocrsquoh 2004 Chronic lung inflammation affects plasma amino acid concentrations in pigs J Anim Sci 82 1091-1099
Nollet H P Deprez E Van Driessche and E Muylle 1999 Protection of just weaned pigs against infection with F18+ Escherichia coli by non-immune plasma powder Vet Microbio 65 37-45
NRC 2012 Nutrient Requirements of Swine 11th ed Natl Acad Press Washington DC
Ochsenbein A F and R M Zinkernagel 2000 Natural antibodies and complement link innate and acquired immunity Immun Today 21 624-630
Pastorelli H N Le Floch E merlot M C Meunier-Salauumln J van Milgen and L Montagne 2012a Sanitary housing conditions
modify the performance and behavioural response of weaned pigs to feed- and housing-related stressors Anim 6
1811-1820
Pastorelli H J van Milgen P Lovatto and L Montagne 2012b Meta-analysis of feed intake and growth responses of growing
pigs after a sanitary challenge Anim 6 952-961
Prohaacuteszka L and F Baron 1980 The predisposing role of high dietary protein supplies in enteropathogenic E coli infections of weaned pigs Zentralblatt fuumlr Veterinaumlrmedizin Reihe B 27 222-232
Rakhshandeh A and C F M de Lange 2012 Evaluation of chronic immune system stimulation models in growing pigs Anim 6 305-310
Rakhshandeh A J K Htoo and C F M de Lange 2010 Immune system stimulation of growing pigs does not alter apparent ileal amino acid digestibility but reduces the ratio between whole body nitrogen and sulfur retention Livest Sci 134 21-23
Santioga Rostagno H L F Teixeira Albino J Lopes Donzele P Cezar Gomes R Flaacutevia de Oliveira D Clementino Lopes A Soares
Fereira S L de Toledo Barreto and R F Euclides 2011 Brazililian tables for poultry and swine Composition of
feedstuffs and nutritional requirements 3rd edition Universidade fedral de Viccedilosa Brazil
Skovgaard K S Mortensen M Boye K T Poulsen F M Campbell P D Eckersall P M H Heegaard 2009 Rapid and widely disseminated acute phase protein response after experimental bacterial infection of pigs Vet Res 40 23
Star L M G B Nieuwland B Kemp and H K Parmentier 2007 Effect of single or combined climatic and hygienic stress on natural and specific humoral immune competence in four layer lines Poult Sci 86 1894-1903
Thacker E L B J Thacker M Kuhn P A Hawkins and W R Waters 2000 Evaluation of local and systemic immune responses induced by intramuscular injection of a Mycoplasma hyopneumoniae bacterin to pigs Am J Vet Res 61 1384-1389
Urbain B P Gustin J Prouvost and M Ansay 1994 Quantitative assessment of aerial ammonia toxicity to the nasal mucosa by use of the nasal lavage method in pigs Am J Vet Res 55 1335-1340
Whittemore C T M J Hazzledine and W H Close 2003 Nutrient requirement standards for pigs BSAS Penicuik UK Wichterman K A A E Baue and I H Chaudry 1980 Sepsis and septic shockmdashA review of laboratory models and a proposal J
Surgl Res 29 189-201
Chapter 6
164
Williams N H T S Stahly and D R Zimmerman 1997 Effect of chronic immune system activation on the rate efficiency and composition of growth and lysine needs of pigs fed from 6 to 27 kg J Anim Sci 75 2463-2471
Williams P N C T Collier J A Carroll T H Welsh Jr and J C Laurenz 2009 Temporal pattern and effect of sex on lipopolysaccharide-induced stress hormone and cytokine response in pigs Dom Anim Endocrin 37 139-147
Wood-Gush D G M and K Vestergaard 1989 Exploratory behavior and the welfare of intensively kept animals J Agri Ethics 2 161-169
165
List of abbreviations
AA amino acids ADG average daily gain ADFI average daily feed intake AID apparent ileal digestibility APP acute phase proteins BW body weight CFA Complete Freundrsquos Adjuvant CP crude protein CRP C-reactive protein Cys cysteine DE digestible energy ECTS European Credit Transfer System ETEC E coli FHP fasting heat production GE gross energy GF gain to feed Hact physical activity related heat HP heat production HSC high sanitary condition Htot total heat production im intramuscular iv intravenous IL interleukin ILR irreversible loss rate ISS immune system stimulation KLH keyhole limpet hymocyanin LP low protein LPS lipopolysaccharide LSC low sanitary condition Lys lysine MCV mean cell volume ME metabolizable energy Met methionine N nitrogen Nab natural antibody NDF neutral detergent fibre NE net energy NP normal protein PCV2 porcine circovirus type 2 Pdmax maximal protein deposition Pig-MAP pig major acute-phase protein PTL platelets RBC red blood cells
166
PRRSV porcine reproductive and respiratory syndrome virus RMR resting metabolic rate SC sanitary conditions sc subcutaneous SEM standard error of the mean SID standardized ileal digestibility S suis Streptococcus suis TEF thermic effect of feeding Thr threonine Ti titanium TID true ileal digestibility TNF tumour necrosis factor TO turpentine oil Trp tryptophan WBC white blood cells
167
SUMMARY
It is economically and environmentally important to match the nutrient supply to the
nutrient requirements in pig production Until now the effects of different sanitary
conditions on energy and nutrient requirements are not implemented in recommendations
for nutrient composition of pig diets The current nutrient requirement data are based on
studies with pigs in experimental settings which can be regarded as rather optimal
Changes in nutrient requirements caused by differences in sanitary conditions are poorly
documented As in the pig production sector farm conditions are variable it is of major
importance to determine the effects of low sanitary conditions (LSC) on requirements for
amino acids and energy in growing pigs Pigs under LSC have an increased risk of clinical
and subclinical infections resulting in a chronic stimulation of their immune system
Immune system stimulation is known to influence energy and amino acid metabolism
However most studies in pigs evaluating the relationship between immune system
stimulation and nutrient requirements often use specific experimental challenge models
Whereas such models have the obvious advantage of reproducibility and allow mechanistic
insight in the effects of stimulating specific parts of the immune system these models
often induce clinical illness rather than subclinical infections Results obtained with such
models may therefore be difficult to translate to practical situations Therefore the
objective of the present thesis was to study the effect of low and high sanitary conditions
(HSC) on amino acids and energy metabolism in pigs Also interactions between the
immune system nutrient metabolism and damaging behaviour of pigs were considered in
this thesis
The experiment described in Chapter 2 was designed to study the effect of different dietary
crude protein levels and extra amino acid supplementation on the growth performance of
pigs kept under different sanitary conditions In a 2times2times2 factorial arrangement 68 groups
of 9 pigs were allocated to either LSC or HSC and were offered ad libitum access to two
different diets a normal crude protein concentration diet or a low crude protein
concentration diet each having either a basal dietary amino acid profile or supplemented
dietary amino acid profile containing 20 more methionine threonine and tryptophan
compared with the basal profile The pigs were followed from 10 weeks of age until
slaughter Haptoglobin concentrations in serum and IgG antibody titers against keyhole
limpet heamocyanin collected in the starter grower and finisher phases and pleuritis
scores at slaughter were greater for LSC pigs compared with HSC pigs illustrating that
sanitary conditions affected health conditions The average daily gain and gain to feed ratio
were greater for HSC pigs compared with LSC pigs A 20 increase in dietary
supplementation of methionine threonine and tryptophan relative to lysine increased gain
to feed ratio more in LSC than in HSC pigs The results therefore illustrated that dietary
168
requirements for methionine threonine and tryptophan were greater for LSC compared
with HSC pigs
In Chapter 3 the damaging behaviour of 576 pigs from the experiment in Chapter 2 was
evaluated At 15 18 and 24 weeks of age prevalence of tail and ear damage and of tail
and ear wounds was scored At 20 and 23 weeks of age frequencies of biting behaviour
and aggression were scored by behaviour sampling The prevalence of ear damage during
the finisher phase and the frequency of ear biting were increased in LSC compared with
HSC pigs The frequency of ear biting was increased in low protein fed pigs compared with
normal protein fed pigs The supplemented AA profile reduced ear biting only in LSC pigs
The prevalence of tail wounds was lower for pigs in LSC than for pigs in HSC in the grower
phase Regardless of dietary amino acid profile or sanitary status pigs fed low protein diets
showed more ear biting tail biting belly nosing other oral manipulation directed at pen
mates and aggression than pigs fed normal protein diets with no effect on ear or tail
damage In conclusion both LSC and a reduction of dietary protein increased the
occurrence of damaging behaviours in pigs and therefore may negatively impact pig
welfare
The experiment of Chapter 4 was designed to quantify the difference in energy
requirements for maintenance and in incremental efficiencies for deposition of dietary
energy and protein in the body of clinically healthy pigs kept under LSC or HSC fed a basal
diet either or not supplemented with additional methionine threonine and tryptophan
In a 2 times 2 factorial arrangement 24 groups of 6 pigs each were allocated to either a LSC or
HSC and were offered two different diets having either a basal or a dietary amino acid
profile supplemented with methionine threonine and tryptophan For each group of pigs
complete energy and nitrogen balances were determined during two consecutive weeks
during which feed was available ad libitum or at 70 of ad libitum Fasting heat production
was determined over a 25 h period of fasting after a period of restricted feeding Low
sanitary conditions increased fasting heat production from 696 to 750 kJ(kg BW06 d)
regardless of the dietary amino acid supplementation The incremental efficiency of
ingested nitrogen for retention in the body was reduced in LSC pigs from 73 to 53 but
incremental efficiencies of digestible energy intake for fat deposition in the body were
unaffected by the experimental treatments These findings showed that the effects of
continuous immune stimulation by introducing LSC was affecting energy and nutrient
efficiencies of pigs both at maintenance level and at a feeding level close to ad libitum
intake
In Chapter 5 diurnal patterns for heat production respiratory quotient and carbohydrate
and fat oxidation of the pigs studied in the experiment of Chapter 4 were evaluated to get
more insight in the mechanisms behind the effects found in Chapter 4 The LSC pigs had
reduced activity compared with HSC and a higher resting metabolic rate during the period
of restricted feeding especially during the light parts of the day Therefore the diurnal
energy expenditure pattern of LSC and HSC pigs can be considered as different Fat and
169
carbohydrate oxidation patterns were not different for LSC and HSC pigs indicating that
protein and fat deposition during the day was similar for LSC and HSC pigs
Overall the results of this thesis indicate that both energy and AA requirements are greater
in LSC pigs compared with HSC pigs It is questionable however whether it is nutrient and
cost effective and biologically possible to satisfy these increased nutrient requirements in
LSC pigs as the incremental efficiency of N for retained protein is low and ADFI is reduced
for LSC pigs compared with HSC pigs The present thesis demonstrates that care should be
taken in reducing dietary protein concentrations to improve protein efficiency in pigs as it
incurs a risk to increased damaging behaviours particularly when pigs are kept under LSC
171
Acknowledgements
172
Het is zover ik ben bij het dankwoord aangekomen De jaren promotieonderzoek zitten
erop een leerzame en leuke tijd met mooie resultaten Tijdens dit traject heb ik met
verschillende mensen mogen samenwerken en zonder hen was het niet gelukt dit boekje in
elkaar te knutselen
Allereerst wil ik mijn promotor Walter bedanken Walter ik heb het getroffen met jou als
begeleider Uitdagen om dieper te graven kun je als de beste ook wil ik je bedanken voor je
support je enthousiasme alle tijd die je erin hebt gestoken en je humor Sinds kort ben je
professor en dit is je gegund Het is een eer om je eerste PhD student te zijn waarvan je
promotor bent Ik heb overigens niet al je advies opgevolgd lsquoNutrition of dirty pigsrsquo leek
me niet zorsquon geschikte titel
Daarnaast wil ik mijn andere begeleiders Alfons en Aart bedanken Alfons bedankt voor je
hulp bij het creeumlren van het promotieproject je input en je oog voor detail Aart voor het
bediscussieumlren van immunologie kon ik bij jou terecht al weken deze discussies vaak af
naar onderwerpen over van alles en nog wat Bedankt voor je brede blik tijd en support
Naast officieumlle begeleiders had ik ook een aantal niet-officieumlle begeleiders Liesbeth ik was
niet direct overtuigd toen je voorstelde aanvullende gedragsmetingen mee te nemen in het
1e experiment Deze metingen hebben echter geleid tot een hoofdstuk met hele mooie
data Bedankt voor al je hulp en je enthousiasme
Bas Wouter Henk Martin Peter en Loek samen met Walter hebben we verschillende
meetings gehad in het begin van het promotie traject om het onderwerp op te zetten
Bedankt voor jullie input en jullie support toen het anders liep dan we voor ogen hadden
Uiteindelijk is het resultaat er niet minder om
Ik wil Feed4Foodure en BreedampFeed4Food bedanken voor de financiering van dit project
Ook wil ik de varkenshouders die betrokken waren in dit project bedanken voor hun
bijdrage Uiteraard ook De Heus en De Heus collegarsquos Martin Peter Wilfried Julius Mario
bedankt voor de mogelijkheid en de vrijheid die ik heb gekregen om dit promotie
onderzoek te mogen doen
Jane-Martine Saskia Michel Xuan-Huang Hans en Leon bedankt bij alle administratie en
analyses van de monsters op het lab Ger Fleur en Monique ook jullie wil ik hartelijk
danken voor jullie hulp met analyses van serum en bloed monsters
Dirk Pieter Ruud Piet Gerald en John bedankt voor jullie hulp bij het bloedtappen en de
dissecties Al het personeel van Carus bedankt voor de dierverzorging en in het bijzonder
wil ik Ries Andre en Rinie hiervoor bedanken Frank ook jij bedankt voor de dierverzorging
en hulp bij het experiment in Ravenstein Ik weet dat je nog regelmatig aan me denkt
vanwege de emmer resten in de mestput sorry daarvoor
173
Hans en Julius bedankt voor jullie hulp bij het maken van de proefvoeders Betty en Yvonne
bedankt voor al jullie hulp met van alles en nog wat jullie zijn toppers
Tamme Sven en Marcel bedankt voor alle techniek en hulp bij de cellen Het schoonmaken
van de cellen met huilende babyrsquos en codetaal door de portofoon zal ik niet snel vergeten
Gerjan Jedidiah Josselin Eva Thanos Linda Yang and Robin thank you for your interest
in this work and all your help during the experiments Robin leuk dat we alweer een tijdje
collegarsquos zijn Jackeline Irene en Maarten ook jullie bedankt voor jullie hulp in de stal
Many thanks to all PhD colleagues at ANU It was nice to meet you during work or other
activities like the ANU playback show dinners and parties In het bijzonder wil ik nog een
paar mensen noemen Allereerst Sonja en Myrthe leuk dat jullie mijn paranimfen willen
zijn Fijn dat ik bij jullie terecht kon voor vragen over de laatste promotie dingen Samen
met Lotte en Harma vormen jullie tjah hoe zal ik dat omschrijven een bijzonder groepje
Onze ontmoeting ging een beetje raar mijn naam zou volgens jullie niet bij me passenhellipik
heb het jullie vergeven en vind het vooral erg gezellig met jullie
Tetske en Sandra jullie zijn de trouwe rots in de branding wanneer je vastzit of raad nodig
hebt Tetske ik verbaas me soms hoe goed jij details onthoud volgens mij is je geheugen
oneindig Sandra bedankt voor je hulp wanneer ik een vraag had over wat dan ook
Binnenkort maar weer een etentje plannen
Sergio Pierre Sanne Kasper Marijke Bianca Rik Geronda thank you for being
lsquoneighboursrsquo in the PhD room and for the nice conversations we had I enjoyed your
company and wish you all a lot of success with finishing your PhD thesis andor your further
career Rik ook bedankt voor je slappe klets en Marijke bedankt dat je achter me stond
uhh ik bedoel zat de laatste weken
Joyce Fons Michel Emma Kevin Bas Robin we kennen elkaar al een tijdje bedankt voor
de afleiding en de vooral niet-serieuze dingen Anet Lotte Vera en Sabine bedankt voor
de gezellige etentjes en uitjes Al blijf ik jaarlijks toch een hele foute overslaan
Pap mam Pauline Danieumllle en Toine bedankt voor jullie support Pauline ook bedankt
voor het maken van het mooie plaatje op de kaft
Harmen je vond het niet nodig om genoemd te worden in dit boekje maar ik vind van wel
Jij bent mijn grootste afleiding geweest tijdens het harde werken en je hebt ook best wat
van mijn frustraties moeten aanhoren We gaan een mooie toekomst tegemoet
Yvonne
About the author
Curriculum vitae
List of publications
Training and supervision plan
176
Curriculum vitae
Yvonne van der Meer was born in lsquos-Hertogenbosch the Netherlands on the 4th of
November 1986 She graduated from secondary education in 2005 at drsquo Oultremontcollege
location Drunen the Netherlands Thereafter she studied Animal husbandry at HAS
University in lsquos-Hertogenbosch where she obtained her BSc In 2010 Yvonne started her
study Animal Sciences at Wageningen University and she obtained her MSc degree in 2012
Yvonne did her major thesis in Animal Nutrition studying the effects of dietary
chenodeoxycholic acid in weaned piglets She did her minor thesis in Adaptation Physiology
studying the influence of feeding artificial milk to young piglets In 2012 Yvonne started her
PhD at De Heus Animal Nutrition BV and the Animal Nutrition Group of Wageningen
University amp Research In her PhD she studied nutrition of pigs kept under low and high
sanitary conditions This research was part of Feed4Foodure and BreedampFeed4Food The
results of her PhD project are presented in this thesis After concluding her PhD Yvonne
will resume as a nutritionist at De Heus Animal Nutrition BV
177
List of publications
Peer reviewed scientific publications
van der Meer Y W J J Gerrits M van den Bosch J J Holst M Moreto W A Buurman and T A T G van Kempen 2012 Chenodeoxycholic acid reduces intestinal permeability in newly weaned piglets J Anim Sci 90 302-304
van der Meer Y A Lammers A J M Jansman M M J A Rijnen W H Hendriks and W
J J Gerrits 2016 Performance of pigs kept under different sanitary conditions affected by protein intake and amino acid supplementation J Anim Sci 94 4704-4719
van der Meer Y W J J Gerrits A J M Jansman B Kemp and J E Bolhuis 2017 A link
between damaging behaviour in pigs sanitary conditions and dietary protein and
amino acid supply Accepted in PLOS one
van der Meer Y A J M Jansman and W J J Gerrits Low sanitary conditions increase
maintenance energy expenditure and decrease incremental protein efficiency in
growing pigs To be submitted to Journal of Nutrition
van der Meer Y A J M Jansman A Lammers and W J J Gerrits Diurnal patterns of heat
production and oxidation of carbohydrate and fat in pigs kept under different
sanitary conditions To be submitted to Animal
Conference and symposia proceedings
van der Meer Y W J J Gerrits M van den Bosch J J Holst W Kulik and T A T G van
Kempen 2012 Chenodeoxycholic acid improves intestinal permeability in piglets
Proceedings of the 12th Digestive Physiology of Pigs 29 May - 1 June Keystone
Colorado
van der Meer Y W J J Gerrits M van den Bosch M Moretoacute W A Buurman and T A T
G van Kempen 2012 Comparison of three intestinal permeability methods
Proceedings of the 12th Digestive Physiology of Pigs 29 May - 1 June Keystone
Colorado
van der Meer Y A J M Jansman M M J A Rijnen W H Hendriks and W J J Gerrits
2015 Amino acid requirements of growing-fattening pigs affected by sanitary
status Proceedings of the WIAS Science Day 5 February 2015 Wageningen The
Netherlands
178
van der Meer Y A J M Jansman M M J A Rijnen W H Hendriks and W J J Gerrits W
2015 Amino acid requirements differ for fattening boars housed in low or high
sanitary conditions Proceedings of the 13th Digestive Physiology of Pigs 19-21
May 2015 Kliczkoacutew Poland
van der Meer Y W J J Gerrits A J M Jansman B Kemp and JE Bolhuis 2016 Tail and
ear biting behaviour in pigs affected by sanitary conditions dietary amino acid
profile and crude protein level Proceedings of the WIAS Science Day 4 February
2016 Wageningen The Netherlands
van der Meer Y W J J Gerrits B Kemp and J E Bolhuis 2016 Effects of dietary protein
and amino acid supply on damaging behaviours in pigs kept under diverging
sanitary conditions Proceedings of the 50th Congress of the International Society
for Applied Ethology 12-15th July 2016 Edinburgh United Kingdom
van der Meer Y W J J Gerrits A J M Jansman B Kemp and A Lammers 2016 Does a
reduction in dietary protein affect immune status of pigs kept under different
sanitary conditions Proceedings of the 5th International Symposium on Energy
and Protein Metabolism and Nutrition 12-15 September 2016 Krakow Poland
Other Publications
van der Meer Y W J J Gerrits and A J M Jansman 2015 Het effect van
aminozuuraanbod en -samenstelling van het voer op zooumltechnische prestaties van
beren gehuisvest onder verschillende sanitaire condities Vertrouwelijk rapport
445 Wageningen UR Livestock Research The Netherlands
179
Training and supervision plan1
Basic package (3 ECTS2)
WIAS Introduction course 2013
Course on philosophy of science andor ethics 2013
Scientific exposure (13 ECTS)
International conferences
ADSA-ASAS Joint Annual Meeting Indianapolis US 2013
13th Digestive Physiology of Pigs Kliczkoacutew Poland 2015
5th International Symposium on Energy and Protein Metabolism and Nutrition Krakow Poland
2016
Seminars and workshops
WIAS Science Day Wageningen the Netherlands 2013-2016
International Pig Meeting De Heus 2013-2016
14th GUT Day Symposium Leuven Belgium 2012
Animal Nutrition and Research forum 2013
Denkaday Voorthuizen the Netherlands 2013
Aspects of sow and piglets performance seminar Wageningen the Netherlands
2013
2013
WIAS Fiber seminar Wageningen the Netherlands 2014
WIAS Nutrition health and welfare of calves seminar Wageningen the Netherlands
2014
Schothorst Feed Research symposium Future dynamics in sustainable animal nutrition Nijkerk the Netherlands
2014
Nutrient requirements in relation to animal health symposium Wageningen the Netherlands
2014
Presentations
Amino acid requirements of growing-fattening pigs affected by sanitary status WIAS Science Day Wageningen the Netherlands poster presentation
2015
1 Completed in the fulfilment of the requirements for the education certificate of the
Graduate School Wageningen Institute of Animal Sciences (WIAS)
2 One ECTS equals a study load of 28 hours
180
Amino acid requirements differ for fattening boars housed in low or high sanitary conditions Digestive Physiology of Pigs Kliczkoacutew Poland oral presentation
2015
Tail and ear biting behaviour in pigs affected by sanitary conditions dietary amino acid profile and crude protein level WIAS Science Day Wageningen the Netherlands oral presentation poster presentation
2016
Amino acid requirements of growingfinishing pigs kept under different sanitary conditions Wageningen Academy Course Quality of protein in animal diets Wageningen the Netherlands oral presentation
2016
Does a reduction in dietary protein affect immune status of pigs kept under different sanitary conditions 5th International Symposium on Energy and Protein Metabolism and Nutrition Krakow Poland oral presentation
2016
In-depth studies (11 ECTS)
Varkensvoeding in de praktijk Wageningen Academy SterkselWageningen the Netherlands
2012
Applied molecular microbiology MSc course Wageningen the Netherlands
2012
Animal health and immunology discussion group Wageningen the Netherlands
2015
Quality of protein in animal diets Wageningen Academy the Netherlands
2015
Statistics for the life sciences 2016
Indirect calorimetry course University of Krakow Poland 2016
Professional skills support courses (4 ECTS)
Supervising MSc thesis work 2013
Techniques for writing and presenting a paper 2013
Scientific writing 2015
Last stretch of the PhD program 2016
Research skills Training (6 ECTS)
Preparing own PhD research proposal 2012
Didactic skill training (16 ECTS)
Supervising practicalrsquos
Supervision research master cluster 2014
Supervision practical Principles of Animal Nutrition 2015
181
Supervising theses
Supervising MSc thesis (8x) 2013-2017
Management skills training (2 ECTS)
WIAS science day committee member 2013
Education and training total 52 ECTS
Colophon
The research described in this thesis is part of Feed4Foodure and BreedampFeed4Food and
was financially supported by Feed4Foodure BreedampFeed4Food and De Heus Animal
Nutrition BV
Cover design and lay-out Pauline van der Meer and Yvonne van der Meer
Printed by Digiforce