Embed Size (px)
Citation preview

Their use and value
NUTRITIONSURVEILLANCE SYSTEMS

Save the Children works in more than 120 countries. We save children’s lives. We fight for their rights. We help them fulfil their potential.
Published bySave the Children 1 St John’s LaneLondon EC1M 4ARUK+44 (0)20 7012 6400savethechildren.org.uk
First published 2016
© The Save the Children Fund 2016
The Save the Children Fund is a charity registered in England and Wales (213890) and Scotland (SC039570). Registered Company No. 178159
This publication is copyright, but may be reproduced by any method without fee or prior permission for teaching purposes, but not for resale. For copying in any other circumstances, prior written permission must be obtained from the publisher, and a fee may be payable.
Typeset by Grasshopper Design CompanyPrinted by Page Bros Ltd.
AcknowledgementsThe review was written by Veronica Tuffrey, a consultant with Save the Children. Technical input and review was provided by Andrew Hall.
We are most grateful to all the experts who agreed to be interviewed as part of this study, for their time and insights. These include Mathias Altmann, Inka Barnett, Cecile Basquin, David Boone, Erin Boyd, Nina Dodd, Elisa Dominguez, Joseph Fanor, Patrizia Fracassi, Gregg Friedman, Stuart Gillespie, Lola Gostelow, Suraiya Ismail, Maria Jefferds, Robert Johnston, Gerald Lerebours, Charles Llewellyn, John Mason, Alex Rees, Elena Rivero, Lilly Schofield and Fiona Watson. In Bangladesh those interviewed were Mashud Alam, Mostafa Al Banna, Lalita Bhattacharjee, Farzana Bilkes, Rachel Fuli, Aaron Hawkins, Meredith Jackson-de Graffenried, Abdul Kader, Nasreen Khan, Erica Khetran, Zeba Mahmud, Mary Manandhar, Ahmadullah Mia, Noreen Prendiville, Mamunur Rashid, Sabiha Sultana, Jillian Waid and Shannon Young.
Thanks are due to Helen Keller International for hosting the author’s visit to Dhaka, in particular to Erica Khetran, Jillian Waid and Ruhul Amin for facilitating the logistics and Mithila Hossain for organising the schedule.
This report is a product of the research consortium Transform Nutrition; see www.transformnutrition.org. The research was funded by UK aid.
The views expressed are those of the author and do not necessarily reflect UK government official policies or the views of Save the Children. Any errors are the sole responsibility of the author.
Recommended citation: Tuffrey, V. (2016). Nutrition surveillance systems: their use and value. London: Save the Children and Transform Nutrition.
Cover photo: Eight-month-old Elton is about to be measured by a nurse at Chinhacanine clinic, Guija district, Mozambique. (Photo: Luca Kleve-Ruud)

CONTENTS
Abbreviations and acronyms vi
Executive summary viii
1 Introduction 1 1.1 Context and aims of the study 1 1.2 Structure of the report 2 1.3 Study methods 2
2 The concept of nutrition surveillance 4 2.1 Historical development of nutrition surveillance and definitions from the literature 4 2.2 Surveillance v. surveillance systems 7 2.3 Surveillance systems and Information systems 8 2.4 Surveillance and surveys 8 2.5 Surveys and sentinel sites 9 2.6 Monitoring v. surveillance 9 2.7 The process of nutrition surveillance 10
3 Surveillance in practice 11 3.1 Introduction 11 3.2 Approaches used for data collection 11 3.3 Type of data collected 18 3.4 Stakeholders and their use of surveillance information 18
4 Choice of approaches for data collection 19 4.1 Strategy 19 4.2 Methods for primary data collection 21 4.3 Approaches for different applications 22 4.4 Data quality 24
5 Information for decisions 25 5.1 Introduction 25 5.2 Data analysis, interpretation and presentation 25 5.3 Dissemination of information 26 5.4 Examples of surveillance information having been used for action 28 5.5 General applications of surveillance information 30
6 Ownership and sustainability 31 6.1 Site of management 31 6.2 Participation of stakeholders 33 6.3 Continuity of funding 33 6.4 Capacity-building 34 6.5 Demand for the system 34

NU
TR
ITIO
N S
URV
EILL
AN
CE
SYST
EMS
iv
7 The future – opportunities and challenges 36 7.1 Introduction 36 7.2 Strengthening health information systems 36 7.3 Community participation 36 7.4 Urbanisation 37 7.5 The role of technology 37 7.6 The way ahead for nutrition surveillance 39
Appendices 40
Appendix A 40 A.1 Characteristics of surveillance systems used as case studies 40 A.2 Documents that met the inclusion and exclusion criteria 41
Appendix B 55 B.1 International targets related to nutrition 55 B.2 Definition, goal and objectives of nutrition surveillance systems from the most recent official guidance 57 B.3 Note on the recent Guidance from WHO 58
Appendix C 59 C.1 Sources of bias, advantages and disadvantages for nutrition surveillance of the various approaches to collecting anthropometric data 59 C.2 Summary of findings from the literature on bias related to the various approaches used to collect anthropometric data for surveillance 62 C.3 Key outcome indicators used in nutrition surveillance 64 C.4 Examples of indicators of causes of malnutrition used in nutrition surveillance 65 C.5 Stakeholders of nutrition surveillance systems, and the tasks for which they can use surveillance information 66
Appendix D 67 D.1 Note on the LQAS method 67 D.2 Issues related to data analysis, interpretation and presentation 68 D.3 Example from Uganda of application of probability thresholds for GAM prevalence 70
Appendix E – case studies 71 E.1 Bangladesh, Food Security and Nutrition Surveillance Project 71 E.2 Listening Posts: Zimbabwe and Burkina Faso 75 E.3 Ethiopia: Nutrition Surveillance Programme (NSP) 77 E.4 Malawi: Integrated Nutrition and Food Security Surveillance System (INFSS) 80 E.5 Nicaragua: Sistema Integrado de Vigilancia de Intervenciones Nutricionales (SIVIN) 82
Appendix F 84 F.1 Costs of systems 84 F.2 Needs for strengthening capacity at various levels 85
Appendix G 86 G.1 Factors affecting urban food security and nutrition with implications for nutrition surveillance 86 G.2 Issues to consider when adapting design and methods of nutrition surveillance for urban areas 87 G.3 Key research, reviews and initiatives relevant to technology in nutrition surveillance 88 G.4 Applications of information and communication technologies (ICTs) in nutrition surveillance 89
References 91
Notes 101

v
One-year-old Ena is weighed in Ouagadougou, Burkina Faso.
PHO
TO
: LU
CIA
ZO
RO
/SA
VE
TH
E C
HIL
DR
EN

vi
ACC/SCN Administrative Committee on Coordination/Subcommittee on Nutrition
ACF Action Contre la Faim
BAZ BMI-for-age Z score
BMI body mass index
BRAC Bangladesh Rural Advancement Committee
CFS Committee on World Food Security
CMAM community management of acute malnutrition
DFID Department for International Development
DHS Demographic and Health Survey
EOS Emergency Outreach Strategy (Ethiopia)
EWS early warning system
FANTA Food and Nutrition Technical Assistance
FAO Food and Agriculture Organization
FIVIMS Food Insecurity and Vulnerability Information Mapping Systems
FNS Food and Nutrition Security
FSNAU Food Security and Nutrition Assessment Unit (Somalia)
FSNSP Food Security and Nutrition Surveillance Project (Bangladesh)
GAM Global acute malnutrition
GMC growth monitoring clinic
HAZ height-for-age Z score
HFIAS Household Food Insecurity Access Scale
HKI Helen Keller International
ICT Information and Communication Technology
IDS Institute of Development Studies
IFPRI International Food Policy Research Institute
INFSS Integrated Nutrition and Food Security Surveillance System (Malawi)
IPHN Institute of Public Health Nutrition (Bangladesh)
IRIN Integrated Regional Information Network
LBW low birthweight
ABBREVIATIONS AND ACRONYMS

AB
BR
EVIA
TIO
NS A
ND
AC
RON
YM
S
vii
LQAS Lot Quality Assurance Sampling
MDG Millennium Development Goals
MICS Multiple Indicator Cluster Survey
MUAC mid upper arm circumference
NGO non-governmental organisation
NSP Nutrition Surveillance Project (Bangladesh)
PDA personal digital assistant
RRC Relief and Rehabilitation Commission (Ethiopia)
RTM real-time monitoring
SAM severe acute malnutrition
SIVIN Sistema Integrado de Vigilancia de Intervenciones Nutricionales (Nicaragua)
SMART Standardized Monitoring and Assessment of Relief and Transition (surveys)
UN United Nations
UNICEF United Nations International Children’s Emergency Fund
UNISDR United Nations International Strategy for Disaster Reduction
USAID United States Agency for International Development
VAS vitamin A supplementation
WASH water, sanitation and hygiene
WAZ weight-for-age Z score
WFP World Food Programme
WFH weight-for-height
WFL weight-for-length
WHA World Health Assembly
WHZ weight-for-height Z score
WHO World Health Organization

viii
BACKGROUND
The detrimental consequences of child undernutrition are well documented. It has been estimated that undernutrition in its various forms is a cause of 3.1 million child deaths annually, or 45% of all child deaths in 2011. Also, by restricting physical growth, undernutrition adversely affects children’s cognitive development, school performance, and health in adulthood. The fact that the effects of undernutrition early in life are largely irreversible means that quick and effective action is crucial.
Large-scale surveys that take place every few years are useful for mapping national and global trends, but their infrequency and the time lag before obtaining findings, and their aggregated nature, mean other sources of data are needed for policy and programme decisions which need to be taken quickly. Nutrition surveillance systems that collect regular and representative primary nutritional data can provide such information. Unfortunately, such systematic processes for tracking trends within countries only exist in a few countries. Methods used vary greatly and there is little research into their effectiveness and value.
Currently there are unprecedented levels of political commitment and resources at country level for addressing nutrition. This situation, combined with the need at an international level to monitor progress towards the six global World Health Assembly targets, means there is a renewed interest in the concept of nutrition surveillance. Specifically, it is important to explore the potential added value that nutrition surveillance systems offer over other sources of primary data, such as ad hoc surveys, or over identification of trends from secondary sources such as growth monitoring systems.
AIM AND METHODS OF THE STUDY
The aim was to review past and current nutrition surveillance systems that involve anthropometric data collection in low-income countries, in order to examine their role in nutrition surveillance. The findings are based on a review of published and unpublished literature, and interviews with key informants.
METHODS USED IN PRACTICE
There are four major methods used to collect primary data used in surveillance: • large-scale nationally representative surveys such
as Demographic and Health Surveys (DHS) and Multiple Indicator Cluster Surveys (MICS)
• repeated smaller-scale cross-sectional surveys• community-based sentinel monitoring• the collection of height data from schoolchildren.
There are three major sources of secondary data from administrative sources: feeding centres, clinics (growth monitoring and birthweight), and community-based data collection including mass screenings for malnutrition. The importance of using a conceptual framework and collecting data on contextual variables (those known to have a causal relationship with malnutrition like water, sanitation and hygiene (WASH) and feeding practices) is now well recognised.
CHOICE OF APPROACHES
One-off cross-sectional surveys can identify the most vulnerable areas and population groups. But other methods are needed to identify changes in the nutritional situation, particularly in areas with great variation in nutritional status across seasons, and/or in situations with unstable nutritional status
EXECUTIVE SUMMARY

EXEC
UT
IVE SU
MM
ARY
ix
due to natural or manmade crises. Whether nutrition surveillance systems involving regular collection of representative primary data on indicators of nutrition and the factors that affect them are needed depends on the purpose of the surveillance.
1) FOR EARLY WARNING
Anthropometry is not the most useful variable to predict problems, as there is a time lag between the cause and the nutritional outcome. Agricultural and climatic data are more useful. However, anthropometric data, including secondary data from administrative systems, are still useful for assessing trends in nutritional conditions, modifications to targeting, and checking the adequacy and effectiveness of interventions.
Given the risk of future food price rises or other crises, there is a need to develop simple methods for nutrition surveillance with rapid reporting of findings for early warning which can be used in particularly vulnerable geographic areas and livelihood groups. Sentinel surveillance approaches have potential in this regard, especially if combined with developments in real time monitoring. Findings cannot be used for geographical comparisons, only for detecting trends in nutritional status over time in those sites. Lessons learned from previous attempts to use this approach, such as the Save the Children Listening Posts Hunger monitoring system, must be applied, for example in relation to sampling, the methods of analysis and reporting, and supervision. There is a lack of confidence in the findings from such systems and research is needed to validate approaches and indicators.
2) FOR POLICY/PROGRAMMING
As for early warning, secondary nutrition data, eg, from growth monitoring or non-systematic small-scale surveys can provide early indication of likely trends in nutrition conditions. In contrast, nutrition surveillance systems using probability sampling and data collection at fixed intervals can provide firm evidence of the severity of the situation and enable predictions on its evolution. It is this application for which nutrition surveillance systems are most useful, at national and international levels.
It is feasible in all but the most unstable contexts to collect nationally representative nutritional data more frequently than is currently provided by the
DHS or MICS. There is a model for this in Nicaragua where nationally representative findings are available yearly and regionally representative findings every three years. ‘Over-sampling’ of vulnerable areas could provide detailed annual information for use at regional and district levels of those areas. Again, lessons must be learned from previous and existing initiatives, especially regarding institutionalisation of systems and dissemination of findings.
At sub-national levels, repeated surveys at the necessary level of disaggregation would be expensive and not necessarily the best approach. There is potential to make better use of administrative data for local monitoring, especially given developments in real time monitoring. However, such data must be interpreted with caution and with contextual information.
3) FOR EVALUATION
Surveillance systems can only give an indication of whether a programme is effective or not. In order to properly evaluate a programme, special designs for data collection and more complex analysis are needed. It is, however, relatively straightforward to monitor implementation of programmes and projects as long as data are collected on process indicators such as access to and use of services – and such indicators justify greater attention.
In summary, surveillance systems involving repeated surveys are suitable for international monitoring and national-level planning and policy development. For planning at more local level, improved collection and use of secondary data is more appropriate. For early warning, secondary data and sentinel systems can be valuable. Surveillance systems also have an important role in providing information that can be used for advocacy and for promoting accountability for actions or lack of actions.
DECISION-MAKING
Many examples were documented of information from surveillance systems being used for programming and policy applications at national level. The fact that few were found at sub-national level may be partly related to the researcher’s bias in choice of key informants, but also probably reflects a real lack of sharing findings with stakeholders

NU
TR
ITIO
N S
URV
EILL
AN
CE
SYST
EMS
x
at sub-national level. It is clear that findings from systems were and still are underused, as a result of under-investment in communication of findings compared to investment in data collection and analysis.
SUSTAINABILITY AND INSTITUTIONS
Surveillance systems are complex and expensive for low-income countries to run so they generally have external technical and financial support. Systems rarely survive after withdrawal of the support, because an insufficient proportion of the external funds have been directed towards institutional and individual capacity-building, and because turnover of national government staff is high. It would be cost effective to improve the mechanisms of nutrition surveillance in highly vulnerable regions such as the Horn of Africa, given the huge amount of humanitarian assistance directed there each year and the number of ad hoc surveys being undertaken.
THE FUTURE
An ever-increasing proportion of undernourished children live in cities, where they are very vulnerable to environmental and economic shocks that affect food security. Traditional approaches to surveillance may not be optimally effective in urban areas, and so taking the local situation into account when designing surveillance activities is essential, so that policies and programmes most relevant to the urban context can be formulated.
Developments in real-time monitoring (RTM) have obvious advantages for timely warning of deteriorating nutritional conditions, while less obvious is the need to adopt common guidance on quality and equity, given the potentially conflicting priorities related to the necessary partnerships between public and private stakeholders.
Capacity-building, improving communication and strengthening existing systems are essential for increasing the utility and cost effectiveness of future nutrition surveillance activities.

1
“Together we must make a decisive move, now, to improve the health of women and children around the world… key areas where action is urgently required … : … Improved monitoring and evaluation to ensure the accountability of all actors for results.”
UN Secretary General Ban Ki-Moon, New York, September 2010, at the launch
of the Global Strategy for Women’s and Children’s Health (Ki-Moon, 2010)
1.1 CONTEXT AND AIMS OF THE STUDY
During the last decade there has been an increase in interest and activity in international nutrition, especially to reduce the number of children affected by undernutrition. The harmful consequences of undernutrition for individuals, communities and nations are now being recognised and better understood. For example, it has been estimated that undernutrition in its various forms, including foetal growth restriction, stunting, wasting and deficiencies of vitamin A, iron and zinc, contribute to about 45% of all child deaths annually, and thus to 3.1 million child deaths in 2011 alone (Black et al, 2013). As well as increasing the risk of dying, undernutrition also impairs children’s cognitive development and restricts their physical growth, which, in turn, delays enrolment in school and affects educational outcomes and earnings in adulthood (Grantham-McGregor et al, 2007).
Based on evidence that the damage caused by malnutrition in early life is often irreversible, it has been argued by the World Bank (Young, 2007) that investing in the nutrition and health of very young children is one of the best investments to be made in human capital and leads to substantial returns. It has been shown that interventions to
improve the nutrition of pre-primary and early school-age children are important and it has been claimed that improvements in children’s growth after early faltering can have significant benefits to their schooling and cognitive achievements (Crookston et al, 2013).
Evidence of what works to prevent maternal and child undernutrition has recently been summarised (Bhutta et al, 2013; Ruel et al, 2013), but in order for governments and other stakeholders to decide on priorities and how best to address them, timely and credible current data are essential. Nutrition surveillance systems can play a key role in providing such data. Information and surveillance systems can also help civil society organisations to hold governments to account for the effectiveness of their interventions (Gillespie et al, 2013).
Since the effects of undernutrition early in life seem largely to be irreversible, quick and effective action is crucial. Large-scale surveys that take place every few years are useful to detect national and global trends, but surveillance systems are needed to provide information to make decisions about policies and programmes that need to be implemented quickly. Unfortunately, systematic data collection systems to track trends exist in only a few countries, and the methods used to collect data vary greatly.
It is within this context that Save the Children commissioned this report as a part of the Transform Nutrition Research Programme Consortium, with the aim of reviewing the purpose, value and use of nutrition surveillance information.
The aims of the analysis were to: • examine the role of nutrition surveillance• review past and current nutrition surveillance
systems• explore whether nutrition surveillance systems
are needed for effective nutrition surveillance.1
1 INTRODUCTION

NU
TR
ITIO
N S
URV
EILL
AN
CE
SYST
EMS
2
1.2 STRUCTURE OF THE REPORT
The report starts in Chapter 2 with a discussion of the concept of nutrition surveillance, including definitions. Chapter 3 describes the approaches currently used for surveillance, which are then appraised in Chapter 4 with a discussion of issues related to the design of surveillance systems. Chapters 5 and 6 examine two critical issues in surveillance: decision-making and sustainability. Chapter 7 looks to the future by exploring the implications of urbanisation and the role of technology for nutrition surveillance, and by highlighting the findings from the earlier sections that are most critical for the design and implementation of future nutrition surveillance systems. Further details of the case studies and methods used are included in the Appendices.
1.3 STUDY METHODS
The analysis used a combination of secondary and primary data, collected using two methods: a review of published and unpublished literature, and interviews with key informants.
1.3.1 DATA COLLECTION
Literature review
The purpose of this part of the analysis was to assess the extent of the published literature and summarise current knowledge. This review was systematic in the sense that multiple databases were searched, bibliographies were scanned for additional references, and studies were screened for their relevance. However, the next stage of a systematic review in which studies are usually screened for the quality of their methods was not pertinent: all surveillance systems were included so that their quality could be assessed. For the topic of this review, the published and unpublished literature mainly relates to descriptions of activities and outputs rather than to primary research into the themes normally addressed in a systematic review, which include effectiveness, cost effectiveness, appropriateness to needs, and feasibility.
Thus the approach used should correctly be termed a “narrative review” (Popay et al, 2006). Elements of the strategy recommended by Hagen-Zanker and colleagues, who described a way of carrying out a less rigid and more reflective form of evidence-focused literature review compared
with conventional systematic reviews, were applied (Hagen-Zanker et al, 2012). In their words (p.5): “Systematic reviews often miss context and process, understandings of which are central to good international development (as well as broader social science) research.”
The review strategy involved three tracks.
Track I: Academic literature search
The search terms [nutrition* AND surveillance] were applied to the title and abstract depending on the database. The following databases were searched: Applied Social Sciences Index and Abstracts (ASSIA), High Wire, Ingenta Connect, Pubmed Central, Science Direct and Web of Science. More than 2,000 references identified by these terms were screened, resulting in 143 references after the criteria listed below were applied and duplicates were removed. For these remaining references, efforts were made to obtain either electronic versions or hard copies of the full text, and a second stage of screening was applied.
Inclusion criteria Exclusion criteria
Pertained to low-income countries
Pertained to high- or middle-income countries
Pertained to surveillance of anthropometric status of children
Pertained solely to demographic or morbidity surveillance
Written in the English language
Pertained solely to hospital-based nutrition surveillance
Pertained solely to micronutrient surveillance
Track II: Snowballing
Additional, relevant published literature was identified from the reference lists of the papers identified during the first track, and during interviews with key informants (see below). In total, 157 published references were identified that met the inclusion and exclusion criteria listed above.
Track III: Grey literature capture
Institutional websites including those of the Food and Agriculture Organization of the United Nations (FAO), UNICEF, the World Health Organization (WHO), the World Bank, FANTA, the International

1 INT
ROD
UC
TIO
N
3
Food Policy Research Institute (IFPRI) and the Resource Library of the Emergency Nutrition Network were searched for reports that met the inclusion and exclusion criteria listed above. Also, the internet search engine Google (www.google.com) was used to identify further relevant material, particularly reports or papers that had recently been released and which had not been identified using either of the first two tracks. Key informants also recommended or provided reports.
The process
The review did not follow a direct path through these three tracks. After a first scan of the literature it became clear that the following topics were critical in order to address the questions posed in the terms of reference: ownership/sustainability; use of data for decision-making; validity of anthropometric data from various approaches; urban methods; and the role of technology. Additional rapid searches, mainly using the methods of Tracks II and III, were undertaken for these topics given the impracticality of undertaking thorough reviews. It is recognised that this process, both in the choice of topics and choice of studies included in the discussion of these topics, inevitably introduced subjectivity to the process and therefore creates a risk of researcher bias.
Choice of case studies
Five case studies of nutrition surveillance systems were purposively selected to provide geographical variety; to cover the range of approaches used in nutrition surveillance, ie, national v. sub-national, random v. sentinel sampling, and longitudinal v. cross-sectional data collection, and to provide data relating to the critical topics listed above. Appendix A.1 shows the characteristics of the selected systems with respect to these factors.
Key informant interviews
A range of stakeholders were approached in order to provide practitioners’ perspectives to balance the academic perspective obtained from the literature. This was particularly valuable with respect to providing up-to-date information on the approaches
being used in nutrition surveillance and their pros and cons. Key informants were identified through networks, by snowballing, and by internet research. Also, after having identified surveillance systems as case studies, potential participants who had been, or were, involved with these systems were identified. The interviews were semi-structured in that the questions and themes were sent in advance. The majority were conducted using Skype. A field visit to Bangladesh provided the opportunity to interview a range of stakeholders in a long-running system and obtain more detailed information for one of the case studies.
1.3.2 DATA ANALYSIS
Literature review
Endnote software was used to manage the references and bibliography. The studies identified during the literature review were classified as pertaining to one or more of the following categories: history/definitions, current approaches, critical topics and case studies. Data extraction was guided by the questions posed in the terms of reference for the consultancy. Appendix A.2 provides basic descriptive information for each paper or report which met the search criteria. Figure 2.1 in Chapter 2 shows the main themes addressed in the published papers over time, and Figure 2.2 shows the geographical distribution of the surveillance activities described in the papers.
Key informant interviews
Notes taken during Skype calls were classified under themes as follows: history and programmes; ownership and sustainability; decision-making; anthropometry; urban and technology, and other.
Synthesis
Due to the nature of the evidence being collected, the synthesis was necessarily narrative. Given the breadth of the topics addressed and the requirement to limit the length of the review, it was possible only to “paint a broad picture” (Hagen-Zanker et al, 2012 p.17).

4
“… political arithmetic”W Petty, Mankind and Political Arithmetic, 1687,
cited in Choi (2012)
In this section, the origins of nutrition surveillance and relevant definitions are examined. It sets the scene for the remainder of the report, which describes the characteristics and value of existing nutrition surveillance systems, and examines opportunities for the future. As will become clear, the challenges faced by those involved with these systems are technical, organisational and political. Thus, Sir William Petty’s description above of 17th century summaries of population-based health data serves as a good description for today’s activities in nutrition surveillance: they require arithmetical and technical skills to analyse data and a sound political awareness to interpret and communicate the findings.
2.1 HISTORICAL DEVELOPMENT OF NUTRITION SURVEILLANCE AND DEFINITIONS FROM THE LITERATURE
The foundations of nutrition surveillance were laid around 50 years ago when the term ‘surveillance’ was defined by Langmuir in relation to monitoring trends in disease in the population, rather than monitoring individuals at risk of disease (Langmuir, 1963). At the World Food Conference held in 1974, the FAO, the WHO and UNICEF were invited to establish a global nutrition surveillance system. The methods were then developed by an expert committee. Their report did not include a clearly stated definition of nutrition surveillance, but Box 2.1 includes the general and specific objectives given in this first official guidance (WHO, 1976).
2 THE CONCEPT OF NUTRITION SURVEILLANCE
BOX 2.1 OBJECTIVES OF NUTRITION SURVEILLANCE
General objective: Surveillance should provide ongoing information about the nutritional conditions of the population and the factors that influence them. This information will provide the basis for decisions to be made by those responsible for policy, planning and the management of programmes relating to improvement of food consumption patterns and nutritional status.
Specific objectives: 1) To describe the population’s nutritional status,
with particular reference to defined subgroups who are identified as being at risk. This will permit description of the character and magnitude of the nutrition problem and changes in these features;
2) To provide information that will contribute to the analysis of causes and associated factors and so permit a selection of preventive measures, which may or may not be nutritional;
3) To promote decisions by governments concerning priorities and the disposal of resources to meet the needs of both normal development and emergencies;
4) To enable predictions to be made on the basis of current trends in order to indicate the probable evolution of nutritional problems. Considered in conjunction with existing and potential measures and resources, these will assist in the formulation of policy;
5) To monitor nutrition programmes and to evaluate their effectiveness.
From (WHO, 1976, pp.8–9)
2 TH
E CO
NC
EPT O
F NU
TR
ITIO
N SU
RVEILLA
NC
E
5
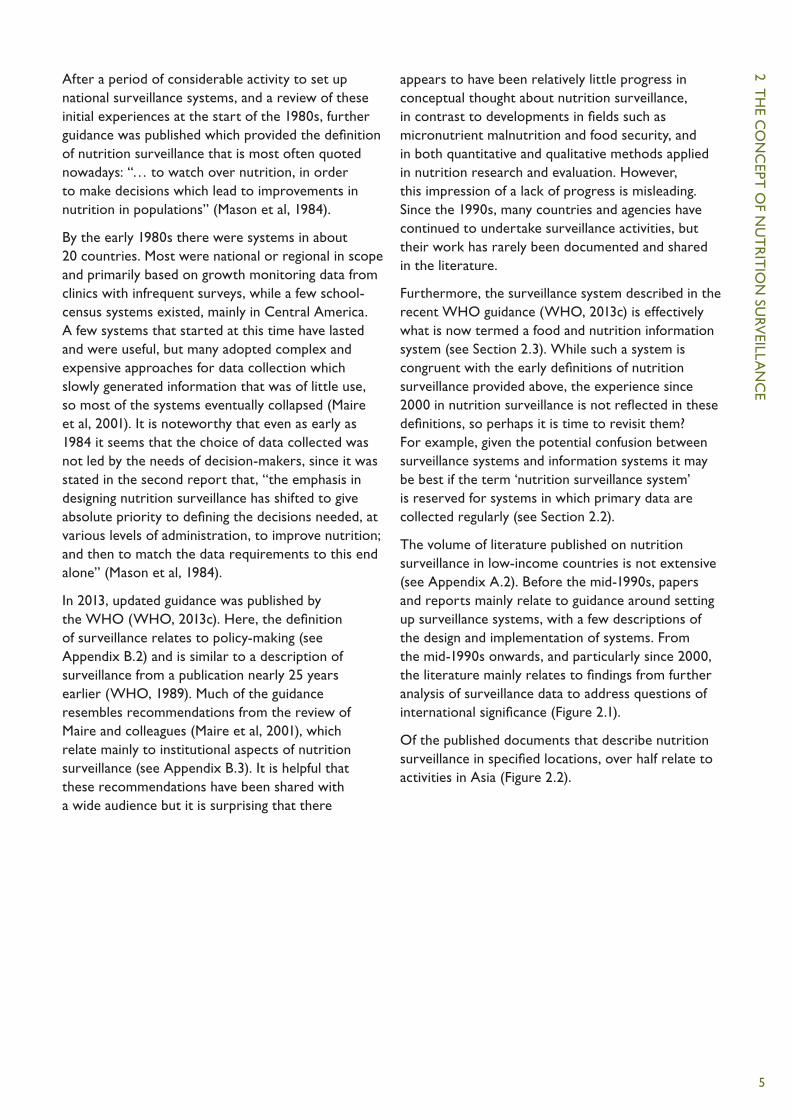
After a period of considerable activity to set up national surveillance systems, and a review of these initial experiences at the start of the 1980s, further guidance was published which provided the definition of nutrition surveillance that is most often quoted nowadays: “… to watch over nutrition, in order to make decisions which lead to improvements in nutrition in populations” (Mason et al, 1984).
By the early 1980s there were systems in about 20 countries. Most were national or regional in scope and primarily based on growth monitoring data from clinics with infrequent surveys, while a few school-census systems existed, mainly in Central America. A few systems that started at this time have lasted and were useful, but many adopted complex and expensive approaches for data collection which slowly generated information that was of little use, so most of the systems eventually collapsed (Maire et al, 2001). It is noteworthy that even as early as 1984 it seems that the choice of data collected was not led by the needs of decision-makers, since it was stated in the second report that, “the emphasis in designing nutrition surveillance has shifted to give absolute priority to defining the decisions needed, at various levels of administration, to improve nutrition; and then to match the data requirements to this end alone” (Mason et al, 1984).
In 2013, updated guidance was published by the WHO (WHO, 2013c). Here, the definition of surveillance relates to policy-making (see Appendix B.2) and is similar to a description of surveillance from a publication nearly 25 years earlier (WHO, 1989). Much of the guidance resembles recommendations from the review of Maire and colleagues (Maire et al, 2001), which relate mainly to institutional aspects of nutrition surveillance (see Appendix B.3). It is helpful that these recommendations have been shared with a wide audience but it is surprising that there
appears to have been relatively little progress in conceptual thought about nutrition surveillance, in contrast to developments in fields such as micronutrient malnutrition and food security, and in both quantitative and qualitative methods applied in nutrition research and evaluation. However, this impression of a lack of progress is misleading. Since the 1990s, many countries and agencies have continued to undertake surveillance activities, but their work has rarely been documented and shared in the literature.
Furthermore, the surveillance system described in the recent WHO guidance (WHO, 2013c) is effectively what is now termed a food and nutrition information system (see Section 2.3). While such a system is congruent with the early definitions of nutrition surveillance provided above, the experience since 2000 in nutrition surveillance is not reflected in these definitions, so perhaps it is time to revisit them? For example, given the potential confusion between surveillance systems and information systems it may be best if the term ‘nutrition surveillance system’ is reserved for systems in which primary data are collected regularly (see Section 2.2).
The volume of literature published on nutrition surveillance in low-income countries is not extensive (see Appendix A.2). Before the mid-1990s, papers and reports mainly relate to guidance around setting up surveillance systems, with a few descriptions of the design and implementation of systems. From the mid-1990s onwards, and particularly since 2000, the literature mainly relates to findings from further analysis of surveillance data to address questions of international significance (Figure 2.1).
Of the published documents that describe nutrition surveillance in specified locations, over half relate to activities in Asia (Figure 2.2).

NU
TR
ITIO
N S
URV
EILL
AN
CE
SYST
EMS
6
FIGURE 2.1 NUMBER OF PUBLISHED PAPERS RELATING TO NUTRITION SURVEILLANCE BY YEAR OF PUBLICATION AND TOPIC
FIGURE 2.2 PROPORTION OF PUBLISHED DOCUMENTS THAT DESCRIBE NUTRITION SURVEILLANCE BY GEOGRAPHIC REGION OF SURVEILLANCE ACTIVITIES
12
10
8
6
4
2
0
Description
Findings
Guidance
1973
1976
1978
1980
1982
1984
1986
1988
1990
1992
1994
1996
1998
2000
2002
2004
2006
2008
2010
2012
2014
Bangladesh 18%
Indonesia 18%
China 8%
Other Asia 7%
Americas 23%
Africa 26%

2 TH
E CO
NC
EPT O
F NU
TR
ITIO
N SU
RVEILLA
NC
E
7
2.2 SURVEILLANCE v. SURVEILLANCE SYSTEMS
It is important to distinguish between the terms ‘surveillance’ as a general activity, and ‘surveillance systems’ as a specific process within this activity. It is also important to clarify what the term ‘surveillance system’ encompasses. Reference is often made in the literature to the original definitions of surveillance described above (WHO, 1976; Mason et al, 1984). In contrast it is rare to see a definition of a surveillance system. Only three definitions were found, and these are reproduced in Box 2.2.
The definition of surveillance system applied in this review is narrower than the definitions in Box 2.2. This is in order to distinguish between the activity of surveillance, which could be undertaken without a formal administrative structure, and systems designed specifically to collect and process primary data for which the principal application is surveillance. The terms are defined in Box 2.3 to provide a way of examining whether such systems are necessary for effective surveillance.
BOX 2.3 DEFINITIONS FOR THE PURPOSES OF THIS REVIEW
A nutrition surveillance system is: A system, coordinated by a central institution, that collects representative primary data at recurrent intervals on indicators of nutrition and the factors that influence them, for making decisions.
Nutrition surveillance is: Regular and systematic collection of data on nutritional indicators.
It follows from these definitions that data collected in a health system including growth monitoring, which are not representative, could be used for nutrition surveillance (the activity) but their collection would not be classified as a surveillance system. Figure 3.1 illustrates this distinction.
Numerous descriptions of nutrition surveillance exist in the literature, and several of the activities described were termed surveillance systems. At one
BOX 2.2 DEFINITIONS OF NUTRITION SURVEILLANCE SYSTEMS FROM THE LITERATURE
1) From a review of the use of anthropometric indices (Beaton et al, 1990 p.25): “Such systems are based upon routinely compiled data and monitor changes in relevant variables over time, give warning of impending crises or monitor the effectiveness/ineffectiveness of existing programmes and policies. Surveillance may draw upon several types of data but the essential features are that the data are collected across time, as in repeated cross-sectional surveys or repeated reporting of the prevalence of underweight children from growth monitoring, and that the data collection and analysis are linked to decision-making.”
2) From an account of Botswana’s national system (Nnyepi et al, 2011), which is based on the growth monitoring programme and established in 1978: “Nutrition surveillance systems are health information systems that entail the systematic collection, analysis and interpretation of children’s growth information to monitor nutritional status.”
3) From recent guidance (WHO, 2013c, p.10, and see Appendix B.2 for the goals and objectives): “A food and nutrition surveillance system is a mechanism to transfer food and nutrition data into action through formulation, modification and application of the food and nutrition policy of a country.”

NU
TR
ITIO
N S
URV
EILL
AN
CE
SYST
EMS
8
end of the continuum lies the classic system that exists in Bangladesh and which used to exist in Indonesia, which involves repeated rounds of data collection at the same sites, administered centrally by an institution that oversees all activities from data collection and analysis to making recommendations based on the findings. At the other end of the continuum is the approach involving repeated cross-sectional surveys, administered by different agencies, with a central institution that compiles the findings to provide an overview of trends in the sub-national or national nutrition situation.
For the purposes of this review, a line between these two models is drawn based on the existence of a central institution that coordinates the data collection. Thus the systems in South Sudan (National Nutrition Directorate of the Federal Ministry of Health Sudan and UNICEF, 2012a), Ethiopia (Emergency Nutrition Coordination Unit – Ethiopia, 2013) and Somalia (Food Security and Nutrition Analysis Unit – Somalia, 2013b) would be termed ‘information systems’ rather than surveillance systems. For each of these examples, one of the sources of information is a nutrition surveillance system.
2.3 SURVEILLANCE SYSTEMS AND INFORMATION SYSTEMS2
In the same way that health surveillance is one component of health information systems (Choi, 2012), nutrition surveillance systems can be considered as one component of nutrition information systems, as illustrated in Figure 2.3.
For example, repeated surveys at six-monthly intervals in Ethiopia provide a system of nutrition surveillance that contributes to an information system administered by the Emergency Nutrition Coordination Unit (DFID, 2013).
There are several types of information systems relevant to nutrition surveillance in low-income countries, and information from each can be useful in the others. For example, process indicators relating to coverage of nutrition programmes from health management information systems can be included in nutrition information systems. Similarly, nutrition surveillance data collected during repeated cross-sectional anthropometric surveys can be included in food security information systems such as those used in the Southern African Development Community. New information systems that integrate food security and nutrition security information, for example the Food and Nutrition Security Information Systems (FSNIS) (United Nations Economic Commission for Africa Subregional Office for Southern Africa, 2011)3 in Malawi, Angola and Cambodia provide information to feed into nutrition policy and planning, to assess trends and predict problems. Nutrition data are increasingly used together with other related data to predict and classify crises including by means of the Integrated Phase Classification (IPC) (IPC Global Partners, 2014). Nutrition and health data are also key to tracking progress towards targets such as the WHA goals, and some of the MDGs (Appendix B.1). If information systems exist in which health, nutrition and food security data are compiled, such analysis can proceed more easily. As discussed above, such information systems facilitate surveillance of the nutrition situation, but would not be categorised as a ‘surveillance system’ according to the definition adopted in this review (Box 2.3).
2.4 SURVEILLANCE AND SURVEYS
There is a useful distinction to be made between regular or periodic surveys – which are included in the definition of a surveillance system above – and occasional or ad hoc surveys to collect data.4 (Figure 3.1 below, shows that some, but not all, surveys are included in the category of surveillance systems.) The Food Security and Nutrition Surveillance Project (FSNSP) in Bangladesh (see Box 3.1) is an example of the former while most SMART surveys (Standardized Monitoring and
FIGURE 2.3 VENN DIAGRAM ILLUSTRATING THE RELATIONSHIP BETWEEN NUTRITION INFORMATION SYSTEMS AND SURVEILLANCE SYSTEMS
Nutrition surveillance
systems
Nutrition information systems

2 TH
E CO
NC
EPT O
F NU
TR
ITIO
N SU
RVEILLA
NC
E
9
Assessment of Relief and Transition surveys) fall into the latter category. Many agencies undertake SMART surveys when they think there may be a nutrition problem. However, SMART surveys have been done twice a year at roughly the same time each year in eight states in northern Nigeria in an attempt to monitor trends (Government of Nigeria and UNICEF, 2012), so in this case they could be considered as a form of surveillance system. For surveillance to be achieved, the survey data need to be sufficiently frequent to detect seasonal changes as well as trends over time. The optimal periodicity of data collection differs between locations, an issue that will be considered in Chapter 4.
2.5 SURVEYS AND SENTINEL SITES
In a recent review of approaches to collecting anthropometric data for surveillance in humanitarian settings, the first two approaches described were repeated cross-sectional surveys and community-based sentinel sites (Bilukha et al, 2012). The literature review undertaken for the present analysis showed that these two approaches do not fall into neat categories, and the terminology is not used consistently. There is overlap because in nutritional surveys if the survey or cluster locations have been purposively sampled, they may be called sentinel sites.
For example, Action Contre la Faim (ACF) use the term ‘sentinel surveillance’ for their system comprising SMART surveys in Mathare Valley in Nairobi, Kenya (ACF International, 2009a) because the Mathare slum ‘sentinel site’ was purposively chosen as being representative of the poorest urban areas of Nairobi. Similarly, ACF refer to their 33 Ï 6 Lot Quality Assurance Sampling (LQAS) surveys in purposively selected sites in Garissa and Mandera districts of Kenya as an “integrated sentinel site surveillance system”’ (ACF International, 2009c). Conversely, USAID mistakenly refers to the ACF surveillance system in Karamoja, Uganda, as consisting of sentinel surveys (FANTA-2, 2010) while ACF itself simply describes them as “regular surveys (using) multi-stage cluster sampling methodology” (Government of Uganda and ACF USA, 2013). Here, the districts were purposively sampled but then the clusters and individual children were selected randomly.
It seems that the term ‘sentinel’ is used to signify that data collection is from small samples, and therefore is a warning that the findings are not representative of a larger population but are simply useful for trend analysis. Presumably it was for this reason that ‘sentinel site surveillance’ in Darfur was renamed ‘community nutrition surveillance’ in 2012 (National Nutrition Directorate of the Federal Ministry of Health Sudan and UNICEF, 2012a). Given the increasing adoption of survey designs with small samples that are still accepted as being representative of the population from which the samples were drawn (see Appendix D.1), to avoid confusion it would be helpful for the term sentinel to be defined using a methodological criterion. In this review, the term is restricted to: Nutritional assessments at sites that are repeatedly visited. This definition does not include surveys where fixed geographic areas are purposively sampled, and different clusters within them are chosen each time (such as ACF’s system in Karamoja) or every year (such as the case study in Ethiopia, Box 3.2). But it does include systems in which each round of data collection includes the same villages or a purposively selected zone in an urban area, and in which there are new samples of children at each round (like the ACF surveillance system in Mathare, Nairobi). It also includes systems in which the same sites are included every round, and new samples of children are selected after a number of rounds. For example, each year new samples of children are selected at the clinics included in the surveillance system in Malawi (Box 3.5).
2.6 MONITORING v. SURVEILLANCE
The term ‘monitoring’ implies recurrent observation. In nutrition this word usually refers to an activity related to evaluating programmes, so is more specific than surveillance. However, the term monitoring is often also used inter-changeably with the term surveillance, and in fact surveillance has been defined in terms of monitoring both academically (Bender, 2009 p.386) and in practice: for example, the FSNSP in Bangladesh is said to provide “timely and accurate monitoring of the nutrition situation in Bangladesh” (Helen Keller International and BRAC Institute of Global Health, 2014). In this review, the term monitoring is therefore used in the general not the specific sense.

NU
TR
ITIO
N S
URV
EILL
AN
CE
SYST
EMS
10
2.7 THE PROCESS OF NUTRITION SURVEILLANCE
It is helpful to break down the nutrition surveillance process and note what is created at each stage. Following the terms defined by Stansfield and colleagues, data are defined here as simple measures or characteristics of people and things, and have little inherent meaning or value (Stansfield et al, 2006). After the analysis and interpretation of data, patterns can be identified, thereby creating information. Finally, the use of information to generate recommendations, rules for action, and behaviour change signifies the creation of knowledge that is used to make decisions. Figure 2.4 shows the four stages of the nutrition surveillance process and illustrates that organised data result from the first two stages, information is created from the third, and knowledge is derived from the final stage. The model
also shows how knowledge gained from surveillance should feed into making decisions to improve nutrition. The utility of the system depends on the extent to which the information it yields is used effectively (Bertozzi et al, 2006).
The research for the present analysis has identified that there is no standard approach to nutrition surveillance. While there is published guidance on the development of a national food and nutrition information system (WHO, 2013c), no guidance exists regarding strategies to collect primary data for nutrition surveillance. Decisions relating to the frequency of data collection, the sample size required, and the choice of repeated cross-sectional or longitudinal designs, are all needed when designing such systems. These issues will be considered in Chapter 4 after the current approaches used for nutrition surveillance have been described in Chapter 3.
FIGURE 2.4 THE PROCESS OF NUTRITION SURVEILLANCE, AND THE PRODUCTS OF EACH STAGE
4 Dissemination and communication
3 Analysis and interpretation
2 Collation
1 Collection
• Leads to improvement in nutrition situation
• Leads to knowledge
• Creates information
• Creates organised data
• Creates data
Decision-making and action

11
“Surveillance should provide ongoing information about the nutritional conditions of the population and the factors that influence them.”
FAO/UNICEF/WHO Expert Committee Methodology of nutritional surveillance (WHO, 1976)
Having provided an historical context in the previous chapter, this chapter summarises the methods currently used for nutrition surveillance in low-income countries, with examples. The quotation above from early guidance is a reminder that surveillance needs long-term systems that incorporate both nutritional outcomes and exposures.
3.1 INTRODUCTION
As outlined in Chapter 2, nutrition surveillance is about monitoring trends in the nutrition situation over time to inform decision-making. It does not necessarily trigger action, it informs decisions about actions when needed and guides the most appropriate actions, such as making or amending policies or introducing or amending the management of a programme.
The link between information and action is mediated by an analysis of the causes of the nutrition outcomes observed, so can be viewed as a part of the ‘triple A’ cycle of assessment, analysis and action (UNICEF, 1990). Surveillance systems involve the assessment and analysis parts of this cycle, while the output – information – can be used to advocate for an appropriate action.
To inform decision-making “by those responsible for policy, planning and the management of programmes relating to improvement of food consumption patterns and nutritional status” (WHO, 1976), surveillance needs to provide information, not only about malnutrition but also about its likely determinants: household food insecurity, inadequate preventive services and inadequate care, all identified in the UNICEF conceptual framework of malnutrition
(UNICEF, 1990; Black et al, 2008). This model distinguishes between the basic and underlying causes of undernutrition – including environmental, economic and socio-political factors, in which poverty has a central role.5
In addition to identifying factors associated with malnutrition, the main uses of surveillance data are to describe the current situation, to provide a warning of increasing nutritional risk, to monitor progress towards achieving nutritional goals, and to assess the delivery and coverage of services. The value and use of the data depends on the types of data collected, the sampling method and representativeness, the frequency of data collection, and minimising sources of error that lead to bias. These factors are considered in the following section, and in this section the approaches used for data collection are described. First, the methodological approaches applied and the methods used to collect data used for nutrition surveillance are summarised, together with their limitations; and second, the stakeholders of nutrition surveillance and the purposes for which they use the information are identified. Examples from the case study systems are included in boxes, and further information about each of these systems is included in Appendix E.
3.2 APPROACHES USED FOR DATA COLLECTION
A recent review by Bilukha and colleagues identified five approaches to collecting anthropometric data for surveillance in humanitarian settings (Bilukha et al, 2012). These are described below with two more approaches, because this review is not limited to the humanitarian context. All seven approaches are classified into two types (see Figure 3.1) as follows:
Collection of primary data for surveillance: This category includes the first two approaches described in the earlier review – repeated cross-sectional surveys and data collection at sentinel sites in communities –
3 SURVEILLANCE IN PRACTICE

FIGURE 3.1 SOURCES OF NUTRITION OUTCOME DATA FOR SURVEILLANCE
NU
TR
ITIO
N S
URV
EILL
AN
CE
SYST
EMS
12
together with two more approaches: infrequent large-scale nationally representative surveys; and data collected from children attending schools.
Use of secondary data from administrative sources:6 This category includes the remaining three approaches described in the previous review: admissions data collected at feeding centres; data collected at clinics; and data collected in the community (termed ‘mass screenings’ in the earlier review).
The methods of each approach are described below, and the pros and cons for nutrition surveillance are summarised in Appendix C.1.
3.2.1 COLLECTION OF PRIMARY DATA FOR NUTRITION SURVEILLANCE
a. Large-scale nationally representative surveys. Two household survey programmes, the Demographic and Health Surveys (DHS) supported by USAID and the Multiple Indicator Cluster Surveys (MICS) supported by UNICEF, provide representative data of national populations. These surveys provide valuable data for assessing trends in nutrition globally, as was envisaged when they were started in the mid-1980s, and have assisted with monitoring progress towards targets such as the Millennium Development Goals (MDGs) (Hancioglu and Arnold, 2013). In terms of national surveillance, the findings from these surveys enable long-term trends to be discerned (WHO, 2013a) and
may provide a resource for verifying the findings of other and more frequent sources of data.
b. Repeated cross-sectional surveys. This category includes periodic surveys undertaken for the purposes of surveillance, as opposed to ad hoc surveys undertaken when a problem has been identified by another method (Section 2.4). Representative surveys of populations for surveillance are undertaken at intervals of one, three, four, six or 12 months usually by non-governmental organisations (NGOs) in collaboration with national governments and may be funded by development or UN agencies. Examples are small-scale SMART surveys in: Garissa and Mandera counties of Kenya (ACF International, 2009c);7 in the Karamoja Region of Uganda (ACF USA, 2011);8 in Upper Nile State, Malakal, South Sudan (Government of South Sudan and ACF International, 2008);9 and full SMART surveys in South Sudan (ACF USA, 2007).10 Other organisational models exist: in Somalia survey data are collected by local NGOs but the process is coordinated by a UN body because of the security situation (Food Security and Nutrition Analysis Unit – Somalia, 2013a); in Bangladesh (Box 3.1) the data are collected by an academic institution in collaboration with an NGO and the government; and in Nicaragua, government agencies collect data (Box 3.3).
Surveillance systems
Nutrition surveillance
Sources of primary data Sources of secondary data
Surveys, large-scale and
small-scale
Community-based sentinel sites
School height censuses
Clinics
Feeding programmes
Mass screening

3 SURV
EILLAN
CE IN
PRA
CT
ICE
13
BOX 3.1 THE FOOD SECURITY AND NUTRITION SURVEILLANCE PROJECT (FSNSP), BANGLADESH
There has been a national surveillance system in Bangladesh for most of the last 25 years. The Nutrition Surveillance Project (NSP), which operated between 1990 and 2006, used a three-stage sampling design: households were sampled in randomly selected villages in fixed districts, thus sampling different households at each round in six rounds/year or 9,000 households per round in the year 2000. The system was established by the NGO Helen Keller International (HKI) in partnership with the national Institute of Public Health Nutrition (IPHN) and a variable number of mostly national NGOs who employed staff
to collect the data. The successor to the NSP, the Food Security and Nutrition Surveillance Project (FSNSP), has operated since 2009 as a partnership between HKI, Bangladesh Rural Advancement Committee (BRAC) University and the Bangladesh Bureau of Statistics, part of the Ministry of Planning. It uses a three-stage sampling design to provide nationally representative data. Different villages are included in each round of data collection (three rounds/year), and sample size in 2012 was around 9,000 households per round. Data are collected on indicators of food security and the care and nutrition of women and children.
(Bloem et al, 2003; Helen Keller International and BRAC Institute of Global Health, 2014)
BOX 3.2 THE NUTRITION SURVEILLANCE PROGRAMME (NSP), ETHIOPIA
Save the Children UK funded and implemented a surveillance system between 1986 until 2001. The design was termed ‘sentinel site surveillance system’ (p.1) and also, more accurately as a ‘random longitudinal cluster survey’ (p.22) (Watson et al, 2006). Survey areas were purposively selected to include the most famine-prone areas of the country. Twelve villages (clusters) were randomly selected within each survey area at the beginning of each survey year
in November and December, and were visited at three-monthly intervals over the following 12 months. In the following year, new villages were randomly selected and a completely new sample was selected. A total of around 185 clusters were surveyed, with 50 children under 5 years old in each cluster, so a total of 9,250 children were followed each year. Data on anthropometry and food security were collected.
(Watson et al, 2006)
BOX 3.3 SISTEMA INTEGRADO DE VIGILANCIA DE INTERVENCIONES NUTRICIONALES (SIVIN), NICARAGUA
There has been a surveillance system since 2003 in Nicaragua, implemented by the Ministry of Health. Three sources of information are used: routine health statistics on the coverage of nutrition-related services; existing monitoring systems of nutrition programmes; and a national household survey in the form of a stratified cluster sample of households with children under 5 years of age. There is random selection of 150 clusters (1,500 households) every three years, so a sub-sample comprising
50 clusters = 500 households are covered yearly, sufficient to provide a nationally representative sample. The total sample of 1,500 households is covered over a three-year period. The questionnaire includes demographics; morbidity; breastfeeding practices; growth monitoring activities; and micronutrient supplementation. Biological samples collected included haemoglobin, serum retinol and urinary iodine. Samples of sugar, salt and bread are collected, and height and weight are measured.
(Welsh, 2003; Mora, 2007)

NU
TR
ITIO
N S
URV
EILL
AN
CE
SYST
EMS
14
Since 2006, the Standardized Monitoring and Assessment of Relief and Transition (SMART) project has provided guidance on sampling methods (SMART, 2006; SMART, 2012). SMART survey findings are perceived as accurate and representative when standard sampling methods are employed and when quality control and data plausibility checks are integrated within the process. Also, given the high cost of good-quality surveys, survey methods have been developed that require smaller samples without a great loss of precision (Appendix D.1 Note on the LQAS method).
As surveys have become less expensive and the findings more trusted during the last decade, the use of cross-sectional surveys to monitor the nutrition situation – surveillance in the general sense – has become more frequent. For example, ACF, which is active in areas where there are no formal nutrition surveillance systems, but which regularly implements cross-sectional surveys, has developed expertise in using data from these surveys to detect and interpret trends, for example in South Sudan (ACF USA, 2008).
c. Community-based sentinel sites. The definition of the term sentinel site was discussed in Section 2.5. As for category b), this approach is most often
used by NGOs. Data are collected periodically in communities selected because they are in an area that is typical of a livelihood zone or are most vulnerable to malnutrition. Typically 12 to 50 children are selected per site and data are collected every one to three months. Children are sampled randomly within the sites but the sites themselves can be sampled either purposively or randomly within the district, livelihood zone or ecological zone that has been sampled purposively. A new sample of children can be selected each time at each site, as done for example in South Sudan (National Nutrition Directorate of the Federal Ministry of Health Sudan and UNICEF, 2012a) and Zimbabwe between November 2004 and October 2006 (Mason, 2010; UNICEF, 2010a). Alternatively, the same children can be studied repeatedly, with replacements when children become older than a threshold age, are lost to follow-up, or die (see Box 3.4).
d. Data from schools. There are many examples of data collected on school children being used for nutrition surveillance in Central America in the 1980s (Valverde et al, 1985; Valverde et al, 1986; Delgado et al, 1991; Delgado and Palmieri, 1994). In some Central American countries periodic censuses of the height of children being enrolled in the first
BOX 3.4 LISTENING POSTS MONITORING SYSTEM
This community-based sentinel system was developed by Save the Children and ACF, who collaborated in an effort to integrate surveillance into routine programme work. With this approach, first, the studied area is divided into livelihood zones and six villages are selected in each zone, using random or systematic sampling. Alternatively, a spatial sampling technique, or purposive sampling using predefined criteria such as vulnerability in terms of food security, health, or nutritional status, may be used. Nutrition data are collected from these six villages and market price data are collected from Market Listening Posts – the town or village where each Listening Post community purchases the bulk of their food and other commodities. At least 16 children aged between 6 and 24 months are monitored at each Listening Post, so there is a total of 96 children
being followed periodically in each livelihood zone. When a child reaches 24 months of age, he or she is replaced by another child aged 6 to 9 months. A child who dies or is lost to follow-up is replaced by another child of the same age. This system was implemented between October 2009 and December 2011 in Kariba district, Zimbabwe, and between September 2010 and December 2012 in Tapoa Province in Burkina Faso. In Zimbabwe only one livelihood zone was included in the pilot, so 6 Ï 16 = 96 children were studied. In Burkina Faso there were three livelihood zones, and 22 children per village, so around 3 Ï 6 Ï 22 = 396 children were studied. The price of major staple foods was collected monthly, while indicators of food access, contextual factors and anthropometric data were collected every three months.
(Save the Children, 2009)
3 SURV
EILLAN
CE IN
PRA
CT
ICE
15
grade of primary schools are still undertaken. For example, in Guatemala there were height censuses of schoolchildren in 1986, 2001 and 2008 and the resulting data have been used to monitor rates of stunting and to target interventions (Delgado, 2011). This approach differs from other methods of nutrition surveillance in that there is no sampling: all children at a particular stage or stages of schooling are included.
In Palestine, data are collected on the height, weight and food habits of children in the 1st, 7th and 10th grades of sentinel schools (Palestinian National Authority Ministry of Health, 2011). In the Seychelles there was a school-based surveillance programme between 1998 and 2004 that included all pupils in kindergarten and in the 4th, 7th and 10th grades, giving an age range from five years to 15 years (Bovet et al, 2011).
3.2.2 USE OF DATA FROM ADMINISTRATIVE SYSTEMS
a. Data on admissions to feeding centres and to community management of acute malnutrition (CMAM). If the number of new cases of moderate or severe acute malnutrition is recorded over a period of
time, if coverage is 100%, and if the denominator is known, an incidence rate can be calculated. Examples of countries in which data from feeding centres or CMAM programmes are used for nutrition surveillance are Ethiopia (DFID, 2013), Sudan (National Nutrition Directorate of the Federal Ministry of Health Sudan and UNICEF, 2012b) and Afghanistan (Afghanistan – Nutrition Cluster, 2013). Figure 3.2 shows how admissions to feeding centres operated by MSF-France in the Maradi region of Niger during the 2005 crisis were highly correlated with the earlier price of millet (Cornia et al, 2008). Such collection of data of different types enables assessment of the importance of causal factors as well as the severity of the situation.11 Since 2006, Niger has included data from feeding centres in its food security early warning system (Hillbruner, 2010).
New survey methods, from CSAS, through SLEAC and SQUEAC to S3M12 have been developed to assess coverage for routine CMAM programmes from regional up to national level. The increased accessibility of these methods has enabled coverage audits to be done more regularly and quickly. Thus, CMAM data is becoming more widespread (UNICEF,
BOX 3.5 THE USE OF CENSUS DATA ON THE HEIGHT OF SCHOOL CHILDREN TO MONITOR STUNTING
Between 1979 and 1989 there were five censuses of schoolchildren in Costa Rica. Between 1979 and 1985 the stunting rate in first-grade children had fallen from 20% to 11%, and this was believed to be a valid indicator of improvements in quality of life and reductions in food insecurity in Costa Rica
during this period. In Panama, census data from schools showed that the prevalence of stunting increased from 19% to 24% between 1985 and 1988, and the trend was thought to reflect the socio-political crisis and internal rural–urban migration.
(Delgado et al, 1991)
BOX 3.6 USE OF CLINIC-BASED GROWTH MONITORING DATA FOR SURVEILLANCE IN GHANA
About 7% of preschool children were enrolled in the growth monitoring programme in 1981 in which the parents of children under 80% of weight-for-age received a supplementary ration. The system provided a clear warning
of an impending crisis 18 months before the government’s declaration of an emergency in June 1983. Disaggregation of the data on a regional basis helped to determine which areas were most in need of food aid assistance.
(Shoham et al, 2001)

NU
TR
ITIO
N S
URV
EILL
AN
CE
SYST
EMS
16
2013) and will play an increasingly important role in nutrition surveillance.
b. Anthropometry data from clinics. The main source of anthropometry data collected routinely through health systems comes from growth monitoring in clinics where data are compiled and used for surveillance.13 Appendix C.1 lists issues related to the quality and lack of representativeness of data from clinics. Some surveillance systems are based on such data, for example the Botswana National Nutrition Surveillance System since 1978 (Bailes, 2006; Nnyepi et al, 2011) and the data collection system in Ghana (see Box 3.7). Birthweight can also be used for surveillance, as in Nicaragua (Pena-Rosas and Perez, 2005 p.24).
c. Anthropometry data collected in the community. There are several ways that anthropometry data are collected through health systems in the community. These include: community-based growth monitoring (Box 3.8); screening for malnutrition and referral to feeding programmes such as in Chad (UNICEF,
2010b), in Maharashtra in India (Haddad et al, 2014), or in Haiti (MEASURE Evaluation, 2013); and screening for malnutrition incorporated into Child Health Days14 as one of a package of activities, such as in some districts of Ethiopia in the Extended Outreach System (Negash, 2011).
Collection of secondary data from sentinel sites. Certain clinics, or villages included in community-based health programmes, can be purposively selected because their sites are typical of a livelihood zone or because the communities are vulnerable. Periodic data are collected from sampled children attending these health services. This is similar to the concept of sentinel sites for primary data collection, see Section 3.2.1 c. Examples have been reported in Uganda (Government of Uganda and World Health Organization, 2009) and Malawi (see Box 3.7). Extra resources may be allocated to such clinics for recording information, reporting and communication, for example by ACF in Somalia (Shoham et al, 2001 p.29).
FIGURE 3.2 THE ASSOCIATION BETWEEN THE PRICE OF MILLET AND THE NUMBER OF CHILDREN ADMITTED TO FEEDING CENTRES IN MARADI, NIGER
Wee
k 1
Wee
k 4
Wee
k 7
Wee
k 10
Wee
k 13
Wee
k 16
Wee
k 19
Wee
k 22
Wee
k 25
Wee
k 28
Wee
k 31
Wee
k 34
Wee
k 37
Wee
k 40
Wee
k 43
Wee
k 46
Wee
k 49
Wee
k 52
30,000
25,000
20,000
15,000
10,000
5,000
0
CFA
fra
ncs
per
10
0 kg
of m
illet
Nu
mb
er of ad
missio
ns
2,500
2,000
1,500
1,000
500
0
Maradi millet prices brought forward by 5 weeks
Admissions to feeding centres in Maradi
(Cornia et al, 2008 p.31)

3 SURV
EILLAN
CE IN
PRA
CT
ICE
17
3.2.3 COMBINATION OF APPROACHES
Surveys that provide representative data and reliable estimates are expensive so repeated surveys are more expensive (see Chapter 6). Consequently, one approach to surveillance involves undertaking surveys only in areas that have been identified by another method as experiencing a deterioration in anthropometric or food security indicators, such as monitoring admissions to feeding programmes or data from community sentinel sites.15 This is the current model in Ethiopia (Watson et al, 2006; Muzeiyn and Yohannes, 2011). With this approach, prevalence rates derived from the ad hoc surveys are representative only of the badly affected areas and cannot be generalised.
3.3 TYPE OF DATA COLLECTED
As well as data on nutritional outcomes, data are also needed to help identify the factors that influence the nutritional outcome variables observed16 or, in epidemiological terms, exposures or risk factors. Appendix C.3 and C.4 show the types of nutrition outcome indicators and give examples of variables of causal factors collected in nutrition surveillance systems. Issues related to the type of data collected are discussed below in Section 4.2.3. For summaries of the data collected in the case study systems, see Appendix E.
BOX 3.8 USE OF COMMUNITY-BASED GROWTH MONITORING DATA FOR SURVEILLANCE IN BANGLADESH
The National Nutrition Programme included a monitoring system designed to support decision-making in the community by using data from village, union and upazila levels, so ‘on the way up’, before being aggregated at central level. Monthly data on the weight-for-age of children < 2 y and weight
gain among pregnant women were collected by community nutrition promoters, local women who were trained by NGOs and supervised by community nutrition officers. The reliability of data was poor.
(Shoham et al, 2001)
BOX 3.7 THE INTEGRATED NUTRITION AND FOOD SECURITY SURVEILLANCE SYSTEM (INFSS), MALAWI
This clinic-based sentinel system was designed and coordinated by ACF and implemented between 2003 and 2008 in partnership with the Ministry of Health and Ministry of Agriculture. A total of 26 of all 28 districts in Malawi were included. Five sentinel growth-monitoring clinics (GMCs) were purposively selected within each district to ensure that all livelihood zones were covered. From all the children attending each clinic, 70 children between the ages of 0 and 59 months were randomly selected, so approximately 9,100 children were included nationally per year, or 350 per district (random sampling was carried out at all the GMC
sessions at the start of the year). Anthropometric data were collected at each monthly GMC session, and if the sampled child was not brought back to any of the sessions, the Health Surveillance Assistants were supposed to follow up that child at home. Food security, morbidity and WASH data were collected from ten households out of the 70 in the sample, from the father at home or the mother at the clinic. Samples were supposed to be reselected every 12 months, and replacements for defaulters and over-age children done on an ongoing basis.
(Rivero et al, 2008; Teller, 2008)

NU
TR
ITIO
N S
URV
EILL
AN
CE
SYST
EMS
18
3.4 STAKEHOLDERS AND THEIR USE OF SURVEILLANCE INFORMATION
The list below includes the main potential applications of nutrition surveillance information. The five objectives of nutrition surveillance identified in 1976 (WHO, 1976) (see Box 2.1) have been amended and used as the basis for this list, to which other potential applications were added from the literature (Gillespie et al, 2013; WHO, 2013c; Barnett and Edwards, 2014) and from discussions with key informants: 1. to describe the nutritional status of the
population, with particular reference to groups most at risk
2. to analyse the causes or factors associated with malnutrition
3. to promote or advocate for decisions by governments regarding both normal development and emergencies
4. to predict the occurrence of nutrition problems so as to assist in policy formulation
5. to monitor, evaluate and change nutrition programmes
6. to monitor national policies, such as structural adjustment policies
7. to monitor progress, including towards targets 8. to contribute to global nutrition surveillance 9. to educate and raise awareness of nutritional
issues 10. to promote accountability for actions, or lack
of actions.
Appendix C.5 lists the stakeholders and the purposes for which they can use the information, with note to the corresponding objectives from the list above. Different kinds of data are needed, or could potentially be used, for the varied applications. Mason and colleagues described three types of surveillance: long-term nutritional monitoring; evaluation of the impact of programmes and projects; and early warning systems (Mason et al, 1984). However, it was soon noted that, in practice, the distinction between the types was not clear (Ismail, 1991). The next chapter describes what types of data are needed and how best they can be collected for the most common of the potential applications of surveillance information.

19
“There is no best indicator, best measure of an indicator, or best analysis of an indicator in a generic sense. The definition of ‘best’ depends ultimately on what is most appropriate for the decision that must be made.”
The importance of context in choosing nutritional indicators, (Habicht and Pelletier, 1990)
The previous chapter described the approaches applied to nutrition surveillance and how the resulting information is used. This chapter discusses the relevance of these approaches to effective surveillance, based on an appraisal of advantages and disadvantages of the approaches and taking context into account, as advised in the quotation above. The main issues are categorised as related either to the design, meaning the general strategy adopted, or to the methods, meaning the specific data collected and the choice of techniques for doing so.
4.1 STRATEGY
The ultimate use of the information is what determines the optimum strategy for surveillance. For example, to monitor progress towards targets, accurate and precise estimates of prevalence rates are needed, while for timely warning of a nutritional problem, the ability to detect a trend is more important than the accuracy of the absolute values.
4.1.1 PRIMARY v. SECONDARY DATA COLLECTION
There is considerable evidence that data obtained from people attending health services are not representative of the population (Trowbridge and Stetler, 1980; Serdula et al, 1987; Wright et al, 2001; Nnyepi et al, 2011, see Appendix C.1 for the causes of the bias, and Appendix C.2 for a
summary of the findings from these studies). This means that data from weighing programmes, such as birthweight recorded at attended deliveries or from children attending clinics, must be treated with caution and not used to judge the severity of a situation. However, secondary data may provide useful indications of local trends for monitoring, and of national trends between large-scale surveys (Section 4.3.1).
4.1.2 LONGITUDINAL v. REPEATED CROSS-SECTIONAL DATA COLLECTION
There is a statistical advantage to including the same children in consecutive rounds of data collection compared with sampling new subjects, because it reduces random variation in measurements, which increases the statistical power to detect a significant change. The disadvantage is that it is labour intensive and expensive to repeatedly find and measure the same individuals, something that is usually only done in cohort studies in wealthy countries. Boxes 4.1 and 4.2 also describe the risk of loss to follow-up and the bias that may be introduced by the Hawthorne effect of repeatedly studying the same children (Grellety et al, 2013). If children are lost to follow-up and are replaced, the sample becomes a mixture of longitudinal and cross-sectional samples, which makes the analysis more statistically complex and there may not be enough statistical power to detect changes. The inclusion of new children in the sample also changes the mean age of the subjects between rounds, which may be a problem as anthropometric indices tend to worsen with age. For example, in the Zimbabwe Listening Posts system (Box 3.4), the age structure of the sample changed from one round to the other, making it very difficult to interpret mean weight change and mean mid upper arm circumference (MUAC) (Frison, 2011).
4 CHOICE OF APPROACHES FOR DATA COLLECTION

NU
TR
ITIO
N S
URV
EILL
AN
CE
SYST
EMS
20
BOX 4.1 LONGITUDINAL DATA COLLECTION IN THE LISTENING POSTS SYSTEM IN ZIMBABWE
This system involved repeated visits to the same sites and measurements of the first sample of children. The table below shows the numbers included in the six rounds of data collection. There was a large loss to follow-up (30%, 34% and 59% for rounds 4, 5 and 6 respectively) and recruitment of new children was very difficult due to the high
rate of migration of the population for agricultural or casual work. The table also shows the small sample on which the weight change was calculated: the number of children followed up at each round was always under 80, less than the target of 96 (see Box 3.4).
LOSS TO FOLLOW-UP IN THE WEIGHT AND MUAC (FROM QUARTER 4) MEASUREMENT IN ZIMBABWE LISTENING POSTS
Surveillance round
Number of children measured (report)
Number of children measured (database)*
Number of children followed up
Loss to follow-up (%)**
Round 1 106 86 NA NA
Round 2 106 80 78 9.3
Round 3 91 91 79 1.3
Round 4 64 93 64 29.7
Round 5 61 61 61 34.4
Round 6 107 107 25 59.0
* The sample sizes in the first two columns differ because those in the first column are from the report of the rounds, while those in the second column are the total number of measurements recorded in the database.
** Calculated as the proportion of the children in column 2 who are not included in the sample for the following round. For example for Round 2, 78/86 = 0.907, so loss to follow-up is 9.3%.
(Frison, 2011)
BOX 4.2 LONGITUDINAL DATA COLLECTION IN THE INFSS, MALAWI
This system included the same clinics and same children for 12 rounds of measurement over one year, after which time new children were sampled at the same sites (Box 3.5). An evaluation found that, on average, only 42% (3,824) of the total required data at each clinic was being collected, and only 77% of this (2,957) was usable for analysis (Phiri, 2008). The high default rate was mainly among children older than a year, as caregivers did not see the need to bring their children back to the clinics after their immunisation had been completed. Whatever the age of children who
dropped out, they were usually replaced with older children who were attending the clinic because of illness, or with children younger than a year, as that was easier than following the protocol (Phiri, 2008). In some clinics there was an age bias towards older children and the sample aged over time as the yearly reselection did not happen (Teller, 2008). A separate bias was introduced by sampling only children who were brought to the clinics, so children living in remote areas were omitted.

4 CH
OIC
E OF A
PPROA
CH
ES FOR
DA
TA C
OLLEC
TIO
N
21
4.1.3 SAMPLING METHODS, REPRESENTATIVENESS, AND BIAS
The choice of sampling methods depends on the use of the information. If accurate measures are required, for example to obtain prevalence rates at national or district level or for ecological zones, then the data must be statistically representative of the population in those levels or zones, so probability sampling is needed. To reduce the cost or for the sake of convenience, smaller samples are possible by choosing individual villages or clinics that are thought to be typical of the larger areas such as an ecological zone or an urban area, and designating them as sentinel sites. In this case, even if the sites have been randomly rather than purposively sampled, the findings will not be representative in a statistical sense. The credibility of the findings will be more open to question compared with surveys using probability sampling because of the small sample and because of the evidence that sentinel sites can be prone to bias (Solarsh et al, 1994; Grellety et al, 2013 see Appendix C.2). As summarised in Appendix C.1, as well as the potential Hawthorne effect due to studying the same child repeatedly, the true situation may be masked over time due to the attention paid to the site by the survey teams who may provide education and advice, treat illness, provide employment and spend money (UNICEF, 2010a). So to provide the most reliable data using the sentinel approach it is best to sample a new site or sites within the ecological zone at each round, or at a minimum, each year.
The characteristics of sentinel sites can represent those of an ecological zone in the everyday sense of the word represent.17 Such sites may also be ‘representative’ in the statistical sense of providing an unbiased indication of what the population of the ecological zone is like; however, it is not possible to know whether this is true in individual situations without also undertaking good-quality, anthropometric surveys of the ecological zone using probability sampling, as such surveys are accepted as providing population-representative data. These data could be used as a ‘gold standard’ against which the sentinel site data would be compared.18 Such research to validate the sentinel approach would be helpful, as would guidance on how to minimise bias. Even if this is done, it will be impossible completely to rule out the possibility that bias exists in individual situations, so leading to potential doubt over the reliability of findings. It could therefore be argued that the most pragmatic approach to surveillance is
to use surveys conducted using probability sampling to estimate prevalence rates, and use sentinel sites and secondary data both to indicate trends between surveys and to identify which locations need more detailed surveys using probability sampling.
4.2 METHODS FOR PRIMARY DATA COLLECTION
4.2.1 SAMPLE SIZE
Surveys to detect trends need to be designed carefully to ensure that there is sufficient statistical power. When doing a calculation of the sample size needed to detect a difference in prevalence rate between two rounds of data collection, it is necessary to estimate the prevalence rate at the first round, the difference in prevalence between rounds that would signify a meaningful change, as well as the design effect19 if the survey uses cluster sampling. If comparisons are to be made later using disaggregated data, eg, by sex, geographical area or socio-economic status, then this must be considered during the sample size calculation, as a larger sample will be needed to have the same statistical power.
4.2.2 FREQUENCY OF DATA COLLECTION
The frequency of data collection depends on which indicators have been chosen, which, in turn, depends on the objectives and the data required. It will take many months or years for a change in the prevalence of stunting to be detected, while for timely warning and programme planning in emergencies the prevalence of wasting and of a small MUAC can increase quickly during a crisis due to food insecurity or outbreaks of disease. Similarly, some indicators of exposure may need to be collected less frequently than others as they change little over time. For example, indicators of hygiene such as hand washing or of feeding practices such as the duration of exclusive breastfeeding are likely to change slowly, while food production is seasonally influenced so agricultural data should be collected more frequently to capture any variation.
In the Listening Posts project in Zimbabwe (Box 3.4), which had the objective of detecting shocks and their nutritional effects at local level, market price data were collected every month and nutrition data every three months (Taylor, 2010). In the FSNSP in Bangladesh, which has the objective of informing policy-makers about the distribution and degree of food insecurity and malnutrition in the country, and

NU
TR
ITIO
N S
URV
EILL
AN
CE
SYST
EMS
22
where there is significant seasonality in nutritional status and its likely causes, rounds of data collection take place every four months (Box 3.1). It could be argued that this high frequency of data collection is no longer necessary in Bangladesh except in the most vulnerable areas, given the wealth of historical seasonal data.
4.2.3 TYPE OF DATA TO BE COLLECTED
The UNICEF conceptual framework (see Section 3.1) identifies the main factors known to affect nutritional status, and the framework helps identify which indicators should be recorded in a surveillance system. The framework distinguishes between immediate and underlying causal factors: immediate indicators are most often measured for individuals and relate to their health status and food consumption, while underlying factors are most often measured at household, community or higher levels and relate to household circumstances, the economic environment and the climate.20 Indicators of processes, such as the delivery of vitamin A capsules to children or the number of children treated for severe acute malnutrition at health facilities, also help to assess the quality and coverage of health services and provide information about context.
Some surveillance systems are jointly food security and nutrition monitoring systems, such as the INFSS in Malawi and the FSNSP in Bangladesh. There are four types of food security indicators that can be included in surveillance systems: calorie deprivation, monetary poverty, dietary diversity, and subjective/experiential indicators (Headey and Ecker, 2012) such as the Household Food Insecurity Access Scale (HFIAS). Some stakeholders may resist accepting findings from subjective indicators. Also, the inconsistent way in which some of these indicators are calculated can lead to confusion and scepticism. For example, there are several different indicators of dietary diversity, each using a different number of food groups. To monitor progress towards targets, and compare the extent to which different countries are affected by global climate change, or food price shocks for example, there is a need to harmonise the use of household survey-based food security indicators (Carletto et al, 2013). In contrast, for timely warning of a nutritional problem at a sub-national level, data relating to local livelihoods is necessary (Devereux et al, 2004) and context-specific indicators are most appropriate, ideally chosen using participatory approaches (ACF International, 2011).
4.3 APPROACHES FOR DIFFERENT APPLICATIONS
As discussed above, the objectives of the surveillance system determine the most appropriate strategy and methods. This section examines the best combinations for what are arguably the three most common objectives of surveillance, bearing in mind that many systems aim to serve more than one purpose.
4.3.1 LONG-TERM NUTRITIONAL MONITORING AS INFORMATION FOR NATIONAL AND LOCAL POLICY AND PLANNING
While the data are not ideal, information provided by national surveillance systems based on growth monitoring have in the past provided guidance to formulate general national nutrition policies and plans (Ismail, 1991). More recently, as a minimum, useful nationally representative data have been collected every few years by the DHS and MICS, which enable long-term trends to be detected and progress monitored towards international targets such as the MDGs and WHA goals (Appendix B.1)21 (WHO, 2013a). However, for detailed policy and planning purposes these surveys are not frequent enough, and also cannot be disaggregated sufficiently to identify locations or socio-economic groups that are most in need of interventions. For local planning purposes, repeated surveys at an informative level of disaggregation would be expensive and are not necessarily the best approach; instead, there is potential to better use administrative data for local monitoring. For example, data from child weighing programmes can be compiled as part of normal operational processes and sent to a higher administrative level. This can provide regular estimates of the prevalence of child malnutrition in districts as well as data on the implementation of programmes. However, given the potential for bias, such data must be interpreted with caution and together with contextual information.
It is feasible in all but the most unstable contexts to collect nationally representative nutrition data at a greater frequency than is currently provided by the DHS and MICS. There is a model for this in Nicaragua (Box 3.3), where nationally representative data are available annually, and regionally representative data are available every three years. Over-sampling of vulnerable areas or at the request of a donor for evaluation purposes, such as in the Bangladesh FSNSP, can provide detailed annual

4 CH
OIC
E OF A
PPROA
CH
ES FOR
DA
TA C
OLLEC
TIO
N
23
data for use at regional and district levels. Another approach is to have a mix of so-called ‘thick and thin’ rounds of data collection where the ‘thick’ rounds are conducted less frequently, but collect the widest array of data (Barrett and Headey, 2014).
Seasonality is an important source of variability in data: if the surveys are to be annual, they should be undertaken at the same time each year so that long-term trends in data over time can be distinguished from seasonal variation. In areas with vulnerable populations, a case may be made for collecting data more frequently than annually, and the timing of the intervening surveys should be chosen to correspond with peaks and troughs in nutritional status due to seasonal variation.22 However, if the seasonal variation has a very short periodicity, the value of collecting data frequently to capture short-term variation may not justify the additional effort and cost. For this reason, in Bangladesh, the frequency with which data were collected was reduced from six times each year in the NSP to three times a year in the FSNSP (Box 3.1).
A range of nutritional indicators is needed to fully characterise the nutrition situation. Recent evidence does not support the current degree of separation of wasting and stunting into acute and chronic conditions (Khara and Dolan, 2014), and so for policy and programming purposes it is important to collect data on both conditions as a minimum. It is also important to disaggregate findings by age and sex, and ideally to include adult women as well as young children, because adult members of a household may protect children from the harmful effects of shocks by sacrificing their food intake, something that was observed during Indonesia’s drought and financial crisis in 1997/98 (Block et al, 2004) and in Bosnia in 1993/94 (Vespa and Watson, 1995).
4.3.2 EVALUATION OF THE NUTRITIONAL IMPACT OF PROGRAMMES AND PROJECTS
The evaluation of programmes was identified as one of the original goals of nutrition surveillance (see Chapter 2). But most early systems used secondary data and it was not realistic to think that such data could be used for this purpose.23 Even more recent systems that collect primary data cannot be used to monitor the effectiveness of large-scale programmes unless additional information is collected.24 For example, in Bangladesh, the FSNSP collection has been expanded to collect data in zones included in the programmes of the US government’s global hunger and food security initiative Feed the Future.
Since evaluations of current programmes cannot easily involve randomised controlled trials, they typically aim to give plausible estimates of effectiveness rather than probabilistic conclusions. Evaluation studies with plausibility designs are usually sufficient for decisions about whether to continue, modify or replicate programmes (Victora et al, 2004). The choice of indicators must relate to the objectives of the programme, and substantial resources are required for both data collection and analysis of evaluations (WHO, 2013a). Outcome data ideally are disaggregated by age groups and sex to check for differences. In contrast to estimates of effectiveness, it is relatively straightforward to monitor the implementation of programmes and projects as long as data are collected on process indicators such as access to and use of services, for example in the system in Nicaragua (Box 3.5). Some process indicators are collected in any case as part of national surveys, eg, DHS, MICS. In this way it is possible to check if services are being delivered to the target group.
4.3.3 TIMELY WARNING
There are many examples of nutrition surveillance systems in which data have been used for early warning of a deteriorating nutrition situation to enable mitigating actions to be taken. For some systems this is the primary focus, such as the original NSP in Bangladesh, while for others timely warning is one of a number of goals. For a warning to be timely the rapid collection, analysis and reporting of data on a few predictive indicators is needed. New technology to collect and transmit data could be really helpful in this regard (see Chapter 7). Anthropometric status does not provide a good predictive indicator because of the time lag between exposure to causes and the outcome. So data that predict potentially harmful trends in food security or disease are more helpful, such as food prices or data on rainfall. Anthropometric data are primarily useful25 for monitoring nutritional outcomes, assessing intervention delivery and coverage, and for modifying targeting, so long as the data are reported quickly.
However, in some contexts changes in nutritional status may occur at an early stage of a food crisis when populations’ coping strategies are not yet damaging or dangerous, for example when meal frequency or the quantity or quality of the diet is reduced. These changes may occur as a normal response to seasonal shortages of food, so abnormal responses can only be distinguished

NU
TR
ITIO
N S
URV
EILL
AN
CE
SYST
EMS
24
when comparative data from previous years are available (Watson et al, 2006). Data from nutrition surveillance are valuable in such instances. For example in Indonesia, surveillance detected that dietary quality rather than quantity had changed during an economic crisis, when reduced access to animal and fortified foods led to lower dietary intakes of iron (Kiess et al, 2000).
Some anthropometric measurements or indices can change relatively rapidly, such as MUAC or weight-for-height, because weight can be lost as well as not gained. Height-for-age changes less rapidly so is a less sensitive indicator of changes in food insecurity or the health environment. For timely warning, in most contexts collection of MUAC and weight-for-height data would ideally occur every two to four months. Findings from the INFSS in Malawi where data were collected monthly (Box 3.5) indicate that, except in very exceptional circumstances, changes in prevalence rates are not sufficient to justify the extra work, costs and potentially lower data quality associated with monthly data collection.
As discussed above, sentinel systems can be useful for detecting trends, even though data may not be statistically representative of the population. Such data can be particularly useful to provide a timely warning in situations in which there are security risks when conducting nutrition surveys, such as in parts
of Somalia. Similarly, while health systems data are recognised as being biased, they can be useful for timely warning in places where access or resources are limited. Feeding programme data can identify a surge in demand for services (see Figure 3.2), and a downward trend in anthropometric status derived from growth monitoring data can indicate an incipient emergency (Box 3.7).
4.4 DATA QUALITY
Errors related to data collection can be random, so cannot be prevented, or they can be systematic due to consistent faults or mistakes in sampling or measurement and can lead to bias, so need to be minimised. The means to prevent this bias include using specialist, well-trained staff,26 and applying quality control procedures such as random spot-checks on staff to verify that data have been collected and are correct. Hand-held electronic devices to record data have the potential to improve data quality, although there is no rigorous evidence of this yet. Checks on the software can highlight outliers or missing data, and errors introduced when data are transferred from paper to computer are eliminated, together with other errors related to the use of paper-based forms.27
A child’s length is measured in Kilolambwani, a village in Lindi district, Tanzania.
PHO
TO
: CA
RO
LIN
E T
RU
TM
AN
N/S
AV
E T
HE
CH
ILD
REN

25
“Nutritional surveillance means to watch over nutrition, in order to make decisions which lead to improvements in nutrition in populations.”
Nutritional surveillance (Mason et al, 1984 p.14)
This chapter examines the use of information from nutrition surveillance systems. An early definition of nutrition surveillance, above, shows that decision-making has always been a key objective.
5.1 INTRODUCTION
Chapter 3 described how the remit of surveillance systems included two factors in the Triple A cycle, assessment and analysis. This chapter describes issues that affect the link between analysis and the third factor, action. Clearly, the simple existence of information will not transform outcomes. It must also be possessed by those who have the power to act on it, they need to understand it, and the organisational, fiscal, political, and cultural conditions must be favourable for action to occur; in other words, there must be an “enabling environment” (Gillespie et al, 2013).
The chapter is structured as follows. First, the methods used to analyse data collected during surveillance and the means of disseminating information are summarised. This is followed by examples of cases where information from surveillance systems has been used to inform action, and a brief description of some general applications.
5.2 DATA ANALYSIS, INTERPRETATION AND PRESENTATION
The people analysing surveillance data need to make decisions about how best to undertake the analysis and present the findings in order to maximise the likelihood of response, if one is needed. Appendix D.2 describes some issues they need to grapple with, including whether to compute and present mean values of indices or prevalence rates of indicators; how to disaggregate data, and what to use as reference values. The statistical analysis also needs to account for the clustering of subjects, and to separate variability observed over time into secular trends, seasonal variation and random variation.
Analysts also have the important role of interpreting the data and identifying the practical implications of the findings in order to highlight them to the users of the information. This is not straightforward: for example, a similar prevalence of acute malnutrition may differ in significance depending on the context. Also, unless the analysts understand what the underlying causes of nutritional disorders are, the appropriate response may not be identified.
Then there is an essential step which is often missing in surveillance systems: expressing findings in language that is accessible to others, for example to people in civil society, managers in the UN and donor agencies – people who are not nutritionists but who need to understand what is going on. For surveillance systems to be effective “... information should be functionally disaggregated so as to guide decision-makers, rather than being simply undifferentiated data for technocrats” (Gillespie, 1994). Box 5.1 lists examples of reports of surveillance findings, and the following general comments can be made about the presentation of information in such reports:28 • Changes over time are generally made easy to
discern because data are presented in tables and charts, as well as being described in the text.
5 INFORMATION FOR DECISIONS

NU
TR
ITIO
N S
URV
EILL
AN
CE
SYST
EMS
26
• There are generally no explanations of technical concepts, even in an annex. It is assumed that the reader is sufficiently knowledgeable to understand terms such as p values, confidence intervals, z scores and wasting.
• While it is obvious that considerable efforts are often made to simplify the findings and ensure the language is not too technical, there are still many examples of reports which are dense and opaque to non-experts.
• The font size is often small for the main text, and even smaller for text in charts, so the labels are difficult to read.
• Sample sizes are often missing from tables and figures, and provided only in the methods sections.
• Comparisons between geographical areas sometimes take precedence over an overview of changes across time.
• Description of the practical implications of findings is often excellent, but sometimes completely absent.
• Many reports have a concise summary of findings at the start, but an equal number do not.
• Most reports include useful maps, having made good use of geographical information systems software.
• No reports were encountered in which findings had been translated into a local language.
The overall impression gained from many reports is that insufficient thought has been given to the needs of busy decision-makers who rarely have time to read long documents, and are especially unlikely to do so if the contents are complex and presented in small print. There is much potential to improve communication, for example by producing separate reports for different types of users, and having a stronger focus on the policy and programming implications of findings.
5.3 DISSEMINATION OF INFORMATION
It is clearly important that the information derived from surveillance activities gets to those with the potential to take decisions that lead to action, so the means of disseminating this information is crucial. Methods used include workshops and presentations for stakeholders; bulletins and policy papers distributed as hard copies, on a CD-ROM or via the internet; papers published in academic journals; and even books.
BOX 5.1 EXAMPLES OF PUBLICATIONS THAT DESCRIBE FINDINGS FROM SURVEILLANCE ACTIVITIES
NATIONAL AND SUB-NATIONAL, CLASSIFIED BY PURPOSE
• Nutrition surveillance for health and development planning and policy: Bangladesh (Helen Keller International and BRAC Institute of Global Health, 2014), and Palestine (Palestinian National Authority Ministry of Health, 2011)
• Evaluation of adequacy of programmes: Nicaragua (Ministerio de Salud, 2005)
• Timely warning: Ethiopia national (Emergency Nutrition Coordination Unit – Ethiopia, 2013); Somalia national (Food Security and Nutrition Analysis Unit – Somalia, 2013b), and Sudan Darfur sub-national (UNICEF and Federal Ministry of Health – Sudan, 2007)
GLOBAL
• The RNIS (Refugee Nutrition Information System) Report was produced by the WHO between 1993 and November 2003, and replaced by the NICS (Nutrition Information in Crisis Situations) quarterly bulletin from February 2004 – March 2012. Since then, no reports have been produced.
• Reports on the World Nutrition Situation: There have been six reports produced by ACC/SCN (1987, 1992, 1997, 2000, 2004 and 2010) with updates in 1989, 1994 and 1996.
• The annual SOFI (The state of food insecurity in the world) reports, produced by FAO since 1999, list estimated rates of underweight, stunted and wasted children in most developing countries, with accompanying explanatory text.

5 INFO
RM
AT
ION
FOR
DEC
ISION
S
27
Box 5.2 lists the methods of information dissemination for three case studies. Cleaned data from every second year were also distributed on a CD-ROM for the Indonesian Nutrition Surveillance System (Helen Keller International Indonesia, 2004) and Bangladesh NSP (Chopra et al, 2004). No examples were found of data being disseminated from central level to a level more local than district, but this may reflect the narrow range of key informants.
Although the remit of nutrition surveillance does not include the third factor in the triple A cycle, action, ideally decision-makers are involved with developing an analytical framework for how the information will be used. This strengthens the system’s credibility and so increases the likelihood of a response where necessary (NutritionWorks et al, 2011).
BOX 5.2 EXAMPLES FROM THE CASE STUDIES OF METHODS OF INFORMATION DISSEMINATION
BANGLADESH NSP (AFTER 2000) (Chopra et al, 2004):
• Bulletins providing information on a specific topic: four pages for a topic-based bulletin (eg, egg consumption, rickets, urban poverty), eight pages for a site-specific bulletin that provides recent data for nutrition and health indicators
• Presentations to the government, NGO partners, donors and at national and international scientific conferences
• Scientific papers, eg, on vitamin A capsule distribution, homestead food production, rice prices and malnutrition
• In 2003 the NSP annual report was published as a book, Health and Nutrition surveillance for Development, with two chapters reporting the main health and nutrition data collected in 2002 for rural and urban poor; a chapter on urbanisation and MDGs; a chapter on disasters; and the nine bulletins published between 2002 and 2003.
Comment from evaluation: Some stakeholders found the bulletins were appropriate for nutrition experts only. It was suggested that an additional short and simple report in the local language, Bangla, should be produced.
ETHIOPIA NSP (Watson et al, 2006):
• From 1995 there were two publications: NSP Reports and NSP Focus. These were distributed to around 20 donors, NGOs and other external agencies, and within the Disaster Prevention and Preparedness Commission (DPPC) and other government agencies.
• Save the Children staff were members of the federal DPPC Early Warning Group and were asked to attend meetings and contribute to discussions about needs.
Comment from evaluation: Information was presented regularly in a format that was easy to understand, but not enough attention was given to ensuring a response.
MALAWI INFSS (van der Heide, 2008):
• Each month a bulletin was issued, with the results of the data analysis presented by district and livelihood zone showing trends over time for information on both nutrition and food security.
• All reports and bulletins were shared with government ministries and any other interested institutions.
• Findings were sent to the district representatives of ministries, and presented at Nutrition and Food Security meetings.
Comment from evaluation: The bulletin was often published late; it was very readable for people with knowledge of the subject; staff at district level found it difficult to understand; interviewers and health surveillance assistants never saw it.

NU
TR
ITIO
N S
URV
EILL
AN
CE
SYST
EMS
28
5.4 EXAMPLES OF SURVEILLANCE INFORMATION HAVING BEEN USED FOR ACTION
Boxes 5.3, 5.4 and 5.5 include examples of the use of surveillance data for policy and planning, evaluation of the implementation and impact of programmes and projects, and timely warning respectively. The examples in the boxes simply provide illustrations of the use of information from surveillance systems. There are numerous other examples that could have been included from the published literature and from key informants’ descriptions. For example, the use of surveillance information to feed into decisions about allocation of resources was described by representatives from donor agencies.
The connection between information and action is complex – effective action to address nutrition issues at national level is dependent on many factors apart from the existence of information/evidence. Such factors include leadership, prioritisation of nutrition, the policy context, and operational capacities (Bryce et al, 2008). Better knowledge of the politics of nutrition, and knowledge of how best to drive political commitment to nutrition and turn it into action on the ground is needed (Nisbett et al, 2014). Similarly, in a humanitarian context, there is a history of warnings being given, based on evidence, that were not acted upon. A greater understanding of the politics and processes of decision-making would increase the potential for timely and appropriate responses (Darcy et al, 2013).
BOX 5.3 EXAMPLES OF SURVEILLANCE DATA HAVING INFLUENCED HEALTH AND DEVELOPMENT POLICY AND PLANNING
NATIONAL LEVEL
BANGLADESH NUTRITION SURVEILLANCE PROJECT (NSP) (Chopra et al, 2004) (Akhter and Haselow, 2010)
1) NSP findings in the early 1990s were used to emphasise the role of and need for universal vitamin A supplementation (VAS) for children to prevent night blindness, and so influenced development of the programme.
2) NSP findings in 1997–98 led to the extension of the period after delivering that a mother can be given vitamin A from two to six weeks.
INDONESIA NUTRITION AND HEALTH SURVEILLANCE SYSTEM (NSS) 1999–2003 (Helen Keller International Indonesia, 2004)
1) The Ministry of Health used NSS data as a basis to formulate policy on anaemia control and used haemoglobin data as a sensitive indicator of economic difficulties.
2) NSS findings on breastfeeding and complementary feeding practices in the 2002 annual report were used to promote and support breastfeeding activities in Indonesia, and led to a change in national breastfeeding recommendations.
LOCAL LEVEL
BANGLADESH NSP (Akhter and Haselow, 2010)
1) In the 1990s, NSP data measured the severity and magnitude of the impacts of disasters – this then guided relief and rehabilitation efforts.
2) Partner NGOs refined geographical targeting, and changed methods, eg, from income- to dietary intake-based.
3) Data from urban slums led to increased activities by a partner NGO in these areas.
INDONESIA NSS 1999–2003 (Helen Keller International Indonesia, 2004)
Vitamin A coverage and other nutritional indicators were used by individual districts for health budgeting purposes.

5 INFO
RM
AT
ION
FOR
DEC
ISION
S
29
BOX 5.4 EXAMPLES OF SURVEILLANCE DATA HAVING BEEN USED TO EVALUATE THE IMPLEMENTATION AND NUTRITIONAL IMPACT OF PROGRAMMES AND PROJECTS
BANGLADESH NSP (Akhter and Haselow, 2010)
1) Information from the NSP revealed pockets of low VAS coverage in 1997–98, which were then addressed.
2) The NSP assessed VAS coverage among different age groups (6–12 m. and 12–59 m.) who were supplemented through two different channels. The findings on characteristics of non-recipients among 12–59 m. children guided the government and partners to incorporate extra strategies to include children who were not being reached.
3) The data collection sites of the NSP were extended to assess the performance and impact of the government’s National Nutrition Programme (NNP). National-level findings on malnutrition allowed for an assessment of the impact of the programme against secular trends in malnutrition. It was concluded that Bangladesh’s large-scale malnutrition reduction programme had failed to reach this objective, that programme performance varied widely by area, and that coverage of the intervention and targeting was inadequate.
INDONESIA NUTRITION SURVEILLANCE SYSTEM (NSS) 1995–1997 (Helen Keller International Indonesia, 2006)
The objective of this surveillance was to monitor and evaluate the impact of a social marketing campaign that promoted consumption of dark-green leafy vegetables and eggs. The system documented success in changing behaviours and also reduced malnutrition and improved the vitamin A status of mothers and their < 5-year-old children.
INDONESIA NSS 1999–2003 (Helen Keller International Indonesia, 2004)
The Ministry of Health used the NSS data to monitor and evaluate the National VAS programme. Data on capsule coverage rates at provincial level were used to determine if goals for vitamin A capsule coverage were being met.
BOX 5.5 EXAMPLES OF SURVEILLANCE DATA HAVING BEEN USED FOR TIMELY WARNING
MALAWI
Information from the INFSS was mainly used at national level (Teller, 2008), eg, by the Malawi Vulnerability Assessment Committee (MVAC, a consortium of government, NGOs and UN agencies) to trigger emergency responses.
For example (Oliphant, 2005) during the food crisis of 2005, data from the MINFSS contributed to scaling up of:• UNICEF-supported nutrition rehabilitation units
from 62 to 97 in priority areas• WFP/UNICEF supported supplementary feeding
programmes in 17 districts and set up 15 emergency centres in 11 districts
• community-based therapeutic care in Lilongwe and Mangochi
• WFP school feeding programmes, from 249 to 429 schools in seven districts.
ETHIOPIA (Watson et al, 2006)
The NSP was mainly used as a tool to advocate for food aid response, eg, via: • a warning of crisis in Wollo in 1997, and
emergency declared in 1998 leading to distribution of food aid
• a warning of crisis in Wolayita 2000, leading to nutrition surveys and feeding centres.
NU
TR
ITIO
N S
URV
EILL
AN
CE
SYST
EMS
30
For early warning, in situations of chronic poverty and vulnerability it is difficult to identify the point at which a ‘normal’ situation tips into a crisis situation, both in urban (Oxfam et al, 2009; Schofield et al, 2013) and rural contexts (Mack Smith, 2012). In slow-onset food crises, early action often falls between timebound humanitarian funding on the one hand and unresponsive development funding on the other (Bailey, 2013).
5.5 GENERAL APPLICATIONS OF SURVEILLANCE INFORMATION
5.5.1 ADVOCACY AND ACCOUNTABILITY
Several of the examples above and key informants referred to the role of nutrition surveillance information for advocacy. Its possible advocacy role in influencing the basic causes of malnutrition has long been recognised (Mason and Mitchell, 1983).29 But the information has not been used to its potential; for example, in an evaluation of the Bangladesh NSP, one donor felt “… the NSP needs to be more aggressive in putting the information on the table and pushing it further” (Chopra et al, 2004 p.33). Similar sentiments were expressed by informants about the current FSNSP. However, advocacy is not in the remit of surveillance, and if lobbying for action was undertaken, the perceived independence and credibility of the information would be at risk. It is preferable to build links with organisations that are better placed to undertake advocacy, and involve them with the system’s design and data analysis.
Another potential use of nutrition surveillance data is as an accountability mechanism. Statistically representative nutrition surveys are needed to provide regular nutrition outcome data in order to track progress towards those international nutrition
commitments that explicitly identify quantitative targets, and thereby allow greater accountability for these commitments (te Lintelo, 2014). Nutrition surveillance systems could provide these data and could also process data to track resource management and accountability within programmes. National health information systems (HIS) could also provide nutrition data to demonstrate national accountability to donors (WHO, 2011). As is the case with advocacy, organisations other than those implementing the surveillance are best placed to assess accountability. For example, in Maharashtra state in India, two civil society movements have helped raise awareness about child undernutrition, increased pressure and held government officials accountable (Haddad et al, 2014 p.76).
5.5.2 RESEARCH USING SURVEILLANCE DATA
Published papers enable surveillance systems to have an international as well as national impact. Further analysis of surveillance data is often undertaken to address questions of international significance, mainly about micronutrient deficiencies or programmes to control them (de Pee et al, 2002; Berger et al, 2007; Berger et al, 2008; Campbell et al, 2009; Campbell et al, 2011a; Campbell et al, 2011b). Other public health issues addressed by researchers using surveillance data have been tobacco use (Best et al, 2007; Best et al, 2008), the link between anthropometric status and expenditure on rice (Torlesse et al, 2003; Campbell et al, 2010) and education (Semba et al, 2008), and the double burden of malnutrition (Shafique et al, 2007). One can surmise that these papers have helped guide policies and programmes to improve health and nutrition, and reduce poverty.30 Data from large-scale nationally representative surveys are also used for research on trends and determinants of undernutrition (for example Crum et al, 2013 and Headey et al, 2014).

31
“…the multi-sectoral nature of nutrition planning makes it vulnerable to various types of bureaucratic derailment.”
John Osgood Field The soft underbelly of applied knowledge: Conceptual and operational problems in nutrition planning (Field, 1977)
It could be argued that the needs of decision-makers have been secondary to the collection of data when planning and implementing nutrition surveillance systems. This chapter examines how the need for sustainability has often also been overlooked and how institutional issues are important, as indicated in the quotation above.
Ownership and sustainability are closely linked. In low-income countries, technical capacity may be lacking and resources may be stretched, so external agencies have become involved with national surveillance systems, both with respect to funding and implementing the systems. Many systems have not survived the decline or withdrawal of external support in particular. Issues pertaining to ownership and sustainability are discussed under five headings relating to the location of the institutional base, to participation, to financial support, to developing capacity, and to demand.
6.1 SITE OF MANAGEMENT
It can be argued that information relating to health services and the systems for the supply of such information are a ‘public good’ as they meet the defining criteria of being non-excludable31 and non-rival32 (Stansfield et al, 2006). Thus, national governments have a primary responsibility to supply information on health and nutrition, both alone within their jurisdictions, and together with international agencies to allow international comparisons and global reviews.
Country governments are therefore the natural owners of national nutrition surveillance systems, although if there is a sensitive political environment,
for example in Ethiopia in the 1990s (Watson et al, 2006), it might be preferable for the information to be provided from a source that is independent of government. In addition to this theoretical justification, key informants were in almost unanimous agreement that a nutrition surveillance system should be integrated within government structures for the following practical reasons: • Location of decision-makers. Surveillance
information is intended for policy and planning purposes. Civil servants and politicians who are responsible for designing and implementing a country’s food and nutrition policy must trust and understand the information. This is more likely to happen if they are also responsible for its creation.
• Security. The priorities of donors and aid agencies change, but government structures are permanent.
• Capacity-building. Surveillance systems can be a mechanism to build tools, skills and infrastructure.
The location of the specific institutional base of surveillance systems within government varies between countries. A recent review reported that in Bangladesh it is located within the Ministry of Planning; in Guatemala, Indonesia, Mozambique, Nicaragua, Palestinian Territories, Sudan, Vietnam and Zambia it is within the Ministry of Health; and only in the Democratic Republic of Congo and Ethiopia is the Ministry of Agriculture mentioned (Friedman, 2014).
External institutions have often been involved with funding and implementing surveillance systems.33 It seems these outsiders have often prioritised technical rather than institutional issues. Planning to enable transfer of the systems to governments once their capacity is sufficiently developed is frequently not done and historically there has been little investment in developing capacity. This lack of planning and resourcing means that systems often do not survive
6 OWNERSHIP AND SUSTAINABILITY

NU
TR
ITIO
N S
URV
EILL
AN
CE
SYST
EMS
32
in competition with other national priorities of the government. Box 6.1 describes three case studies of transferring the institutional base of surveillance systems. Only for the FSNSP in Bangladesh was
separate funding allocated to institutionalise the surveillance system within a government structure, in this case within the Ministry of Planning.34
BOX 6.1 EXPERIENCES OF TRANSFERRING THE INSTITUTIONAL BASE OF THREE SURVEILLANCE SYSTEMS
ETHIOPIA NSP 1986 TO 2001 (Watson et al, 2006): TRANSFER FROM SAVE THE CHILDREN TO THE DISASTER PREVENTION AND PREPAREDNESS COMMISSION (DPPC), MINISTRY OF AGRICULTURE
The NSP provided nutritional status information for early warning of food insecurity for the Ethiopian government’s Early Warning System (EWS) within the Relief and Rehabilitation Commission (RRC). The EWS had its own Nutrition Unit but it was poorly resourced and mainly dependent for data on NGOs such as Save the Children and CARE. The NSP was both funded and implemented by Save the Children. In 1998, Save the Children decided to withdraw and, despite a three-year plan to transfer skills, the system was not maintained after 2001. This was due to a lack of human and financial resources within the DPPC, formerly the RRC, to deal with nutrition.
MALAWI INFSS 2003 TO 2008 (Blaschke et al, 2009): TRANSFER FROM ACF TO MINISTRIES OF HEALTH AND AGRICULTURE
The INFSS provided information on trends in nutrition among children aged under five years and their household’s food security situation. ACF designed and coordinated the system, which was implemented in partnership with the Ministry of Health and Ministry of Agriculture; it was funded by the EU with technical support from UNICEF and the FAO. The system was always perceived as belonging to ACF rather than the government. When funding for the system ended and ACF withdrew, functionality quickly began to decline. There was a lack of ownership in the system, a lack of human resources to undertake data entry and analysis, and unclear roles and responsibilities among government employees for maintaining the system. The system has since recovered: the use of Rapid SMS technology was piloted in three clinics
in 2009, and now a ‘rapid surveillance system’ for health facility and community screening is being established, supported by UNICEF and the EU (Zambrano and Seward, 2014).
BANGLADESH FSNSP 2009 TO PRESENT DAY: TRANSFER FROM BRAC UNIVERSITY AND HELEN KELLER INTERNATIONAL TO THE MINISTRY OF PLANNING
The FSNSP is funded by the EU and implemented by the James P Grant School of Public Health of BRAC University with the NGO Helen Keller International and the Bangladesh Bureau of Statistics (BBS). The EU separately funds a programme within BBS called a Nutritional Surveillance Component project through which the BBS conducts post-enumeration checks (PECs) for quality control and arranges training programmes for capacity-building. The process of transferring the FSNSP to the BBS has started, although the exact manner remains to be finalised. One model is for BBS to take over the data collection and reporting from BRAC with HKI still being involved with data analysis and training, and BRAC doing the quality control including PECs. It would be sensible for BBS to be responsible for data collection as they are already setting up data collection cells in every union, and their capability in this regard has already been demonstrated in the Bangladesh DHS and MICS surveys in collaboration with USAID and UNICEF respectively. Another model is for health workers at community level to take over data collection. While it might be argued that this would fit well with the initiative to develop a computerised routine health information system within the Management Information (MIS) System of the Directorate General of Health Services, the introduction of the new information system will not be straightforward for local health workers. It may be unwise to give them another task, for which they would need significant training and supervision.

6 OW
NER
SHIP A
ND
SUSTA
INA
BILIT
Y
33
6.2 PARTICIPATION OF STAKEHOLDERS
If information from the surveillance system is to be used in decision-making, then the users of information need to be involved, at least at the design stage, otherwise they may doubt the credibility of the information. It could be argued that the application of scientific methods, together with provision of a detailed description of the methods employed, should ensure that findings are credible. However, personal and political differences may hinder this rational approach. Of course, in addition to the planning stage, decision-makers ideally would also be involved with other stages such as data analysis, interpretation, or even cost sharing, but this is likely to be less feasible. Also, if decision-makers are involved in the process of deciding which information is to be generated and how, this should avoid having to ‘sell’ the resulting information to decision-makers (Arnauld et al, 1990).
In an evaluation of nutrition surveillance in Botswana it was reported that some of the district and clinic health staff had never seen a report from the system (Bailes, 2006 p.4). The need to better involve stakeholders35 at lower levels is often mentioned in the literature (for example, Chotard, 2005; Pelletier et al, 2013; Schelling, 2013; WHO, 2013c) and was also raised by key informants. The justification partly relates to quality and use of data, which are linked: if those who collect data use the information that results, there will be more incentive to collect high-quality data in the first place. Thus, it can be argued that the local use of data collected at lower levels of an information system is key to improving the quality of data. This need is particularly relevant where surveillance is dependent on data collected by health workers, who may see this task as burdensome, taking time from their primary function to provide healthcare. For example, in the INFSS system in Malawi the quality of data collected was found often to be poor and incomplete, and district surveillance committees were suggested as a mechanism to link their district’s own data with its use (Teller, 2008). Similar issues were identified in an evaluation of the sentinel site surveillance system in Mozambique, where no analysis of the data was conducted at the clinic, district, or provincial level, and clinic teams mentioned that they did not know why they were collecting the data (Doledec, 2014, p.7). The decentralisation of information management to district level is said to be an effective strategy
to improve routine information systems (Lucas et al, 2013), and the case for decentralised data management in nutrition surveillance systems was made long ago (Mulder-Sibanda and Chowdhury, 1995; Babu and Chapasuka, 1997) and applied in Haiti (Mulder-Sibanda et al, 2002) and Thailand (Valyasevi et al, 1995).
Also, there is an ethical case to be made: a human rights-based approach to nutrition action demands active involvement by beneficiaries in processes to improve nutrition (Gillespie, 2001). In this vein, in Central America nearly 30 years ago, an additional role for food and nutrition surveillance activities beyond policy and programming was identified. It was argued that they could contribute to the food security and socioeconomic development of the poor if the activities were designed, operated and evaluated by communities organised at grassroots level (Immink, 1988). Sentinel sites may have a role to play in a more participatory model of nutrition surveillance where the data are collected for local use, and community members participate in deciding what to assess and how to design and implement solutions (Elder and Kiess, 2004 p.131) as has occurred in Sudan for example (Ahmed and Ahmed, 1996).
6.3 CONTINUITY OF FUNDING
As noted in World Bank guidance, “The disadvantage of formal surveillance systems is their cost (both initial and recurrent) as well as the tendency to generate large amounts of excess information” (Elder and Kiess, 2004). Few low-income developing countries can afford to invest in the infrastructure needed for strong surveillance systems (Wagstaff et al, 2006). Thus, in addition to the relevance and success of capacity-building efforts (see below), sustainability relates largely to whether there is sufficient interest among donors and other external agencies to sustain the system (Watson et al, 2006). Therefore a key question faced by national governments, donors and other external agencies is whether these systems offer value for money compared with competing priorities. Unfortunately, it is impossible to address this except in very qualitative terms.36 The answer is likely to differ depending on the context, but the case is clearest for the purposes of timely warning.
Appendix F.1 summarises information from the literature regarding the costs of different approaches used in nutrition surveillance. It shows the cost of

NU
TR
ITIO
N S
URV
EILL
AN
CE
SYST
EMS
34
surveys to be around US$10,000 each, not including staff salaries for the organisation coordinating the survey.37 In Ethiopia, 509 surveys were carried out between 2000 and 2009 (Watson et al, 2011), which is more than one per week, and cost more than half a million US$ per year. It was calculated that the Save the Children-funded NSP had provided data from nearly four times as many sites and four times a year compared with the amount of data that could have been generated for the same cost by nutrition surveys (Watson et al, 2006).
Save the Children perceived its support of the NSP as expensive but, compared with the amount spent on aid to Ethiopia at that time, it was not. It can be argued that an accurate early-warning mechanism that triggers a protective response is far more cost-effective than having to support a full-scale humanitarian response to a nutritional emergency (WHO, 2013c p.18). One can, therefore, justify investment in improved monitoring of food and nutrition security in highly vulnerable regions such as the Horn of Africa, to which many millions of dollars of humanitarian assistance are directed annually (Headey and Ecker, 2012). For example, the UK’s DFID, UNICEF and the World Bank are currently supporting nutrition surveillance in Ethiopia (DFID, 2012; DFID, 2013). Unfortunately, donors work to budget cycles of five or ten years at most, and their priorities change. In Bangladesh, USAID funded the NSP from 1990 to 2002, a relatively long period in terms of programme support. The Dutch government took over, then there was a gap in funding from 2006 until 2009, and it is now funded by the EU until 2015. The total EU contribution (90%) is €5.2 million or about €1 million/year, a relatively small proportion of the total budget for Bangladesh managed by EuropeAid, which was €131 million in 2011 (European Union, 2012). This level of support for a system appears to be a good investment from a donor’s viewpoint.38
Nutrition surveillance does not have a direct impact on nutritional status, so it is impossible to demonstrate a causal link to key outcome indicators. However, in countries such as Bangladesh with a long tradition of collecting and using quantitative data, there is a plausible and convincing argument that investing in nutrition surveillance to provide information for health and development policy and planning offers good value for money. High-level users in Bangladesh habitually draw on the information provided by the FSNSP to justify
and target nutrition-sensitive and nutrition-specific interventions, which have been shown to be effective (Bhutta et al, 2013), and there is great potential to increase the utility of the system by improving the communication of information (see Chapter 5).
6.4 CAPACITY-BUILDING
Capacity-building for planning and implementing national surveillance systems, both for individuals and institutions, is an important factor affecting the systems’ sustainability. Sustainability is linked not only to sufficient financial support, but also to the extent to which well-designed plans exist to build local capacity39 and to the commitment and ability of a government to support the system. With these two factors in place, dependence on external assistance can be steadily reduced over time.
It is important that individuals who have become competent through training and gaining experience in a system are allowed to remain in post rather than be transferred to other departments. In both the Malawi and Bangladesh case studies, numerous individuals who had been working as the government counterparts of staff from external agencies were moved from the surveillance system to other duties after a few years. A lack of sufficient capacity-building was identified as the main reason the Ethiopian NSP did not survive the handover from Save the Children. At a meeting in 2007 in Nairobi organised through NIPHORN40 (UNICEF, 2010a) a list was compiled of ways in which capacity for nutrition information systems at different levels could be developed and strengthened. This list is provided in Appendix F.2 as the needs are relevant for surveillance systems, particularly at community level.
6.5 DEMAND FOR THE SYSTEM
For any public health activity to be sustainable in the long term, not only are there technical, institutional and financial dimensions, there also needs to be social sustainability. In other words, there needs to be pressure to continue. For nutrition surveillance, there are many users and potential users of the information that is produced (Appendix C.5). However, as shown by the examples given in Chapter 5, most of the demand comes from people at national or international level. With the recent

6 OW
NER
SHIP A
ND
SUSTA
INA
BILIT
Y
35
global financial crisis, development budgets are increasingly under scrutiny, so donors need proof of success and accountability is becoming more important (see Section 5.5.1). Also, UN bodies would like to track progress towards international goals such as MDGs and, more recently, the WHA targets.41 These factors have helped stimulate the current major global initiative to support health information systems in low-income countries (WHO, 2011), which will enhance the quality and quantity of nutrition data from health systems which can be used for surveillance.
In contrast to the existing demand at a high level, historically there has been little demand for nutrition surveillance information from sub-national administrative levels and community level perhaps because, despite the identified benefits of decentralised planning and decision-making in nutrition (Gillespie et al, 1996), this is not a reality in most low-income countries.
One-year-old Aman is placed on weighing scales in Bona, Ethiopia.
PHO
TO
: KA
RIN
BEA
TE N
OST
ERU
D/SA
VE T
HE C
HILD
REN

36
“Vast technological improvements in mobile communication, data collection, and data processing mean that these household-level indicators could be aggregated, cleaned, and disseminated in near-real time”
Measuring Resilience in a Volatile World: A Proposal for a Multicountry System of Sentinel Sites (Barrett and Headey, 2014)
7.1 INTRODUCTION
In this chapter some issues touched on in previous chapters which are of particular importance for nutrition surveillance in the future are considered in more detail, together with two new issues, urbanisation and technology. The quotation above illustrates the optimism engendered by the potential applications of technology for surveillance.
7.2 STRENGTHENING HEALTH INFORMATION SYSTEMS
Section 6.6 noted the great current interest and investment internationally in health information systems in low-income countries (Countdown to 2015 and Health Metrics Network, 2011), since such systems are generally weak (WHO, 2011). Chapters 3 and 4 described how feeding centres, clinics and community-based growth monitoring and mass screening for malnutrition are all components of national health systems. These can all provide useful information for nutrition surveillance as long as data quality is upheld and if the issues of bias are understood and taken into account when interpreting data. National nutrition surveillance activities can benefit from the current investment in health information systems.
It can be argued that there is an ethical justification for choosing to strengthen health systems in order to provide reliable secondary data in preference to setting up new systems for primary data collection. The treatment of severe acute malnutrition (SAM) was shown in a recent analysis to be the most cost-effective nutrition-specific intervention (Bhutta et al, 2013). Thus, it is important to collect data on the coverage and quality of programmes so that they can be improved (UNICEF, 2013). While one cannot justify promoting better growth monitoring simply to provide data for surveillance, strengthening this activity can be justified as a useful vehicle for other activities that are effective in addressing malnutrition.42 Similarly, promoting systems that include mass screening – such as the Emergency Outreach Strategy (EOS) in Ethiopia43 – can be justified as they address wasting, with the added advantages for surveillance of good coverage, integration within government systems, and mobilisation of existing resources.
7.3 COMMUNITY PARTICIPATION
An important element envisaged for community-based growth monitoring was to empower communities to gather, interpret and act on nutrition information to address their nutrition problems. It seems that this can work well when community nutrition mobilisers are sufficiently resourced, trained and supported (Shoham et al, 2001), and there is recent evidence for this from Maharashtra in India,44 where stunting rates have greatly declined in the last decade (Haddad et al, 2014).
Only one example could be found in the literature of a participatory model of nutrition surveillance involving primary data collection – that was in Sudan (Ahmed and Ahmed, 1996).
7 THE FUTURE – OPPORTUNITIES AND CHALLENGES

7 TH
E FUT
UR
E – OPPO
RTU
NIT
IES AN
D C
HA
LLENG
ES
37
7.4 URBANISATION
The process of urbanisation, the demographic transition from rural to urban living45 and economic transition from an agriculture-based economy to mass industry, technology and services, is accelerating. Already more than half the world’s population live in urban areas and it is estimated that by 2030 over 60% of the world’s population will live in a city, rising to 70% by 2050 (WHO, 2014b). And by 2015, three billion people will probably be living in urban slums46 (IRIN, 2013).
In developing regions, the urban population ranges from 37% in sub-Saharan Africa to nearly 80% in Latin America and the Caribbean. In almost all low- and middle-income countries, urban children are taller and heavier than their rural counterparts. But the difference and its trends over time vary greatly (Paciorek et al, 2013), while averages mask huge disparities between individual locations. Compared with rural areas, tracking vulnerable people is more complex in densely populated towns and cities, particularly in informal neighbourhoods such as slums. So agencies and institutions have been slow to take on the challenge of working in urban areas, inadvertently creating a rural-urban divide (IRIN, 2013). Urban malnutrition and food insecurity are rarely monitored in early warning and nutrition surveillance systems,47 and this cannot be ignored, given the growing numbers of people involved.
Rapid urbanisation increases the risk of both natural hazards and manmade crises. A growing dependence on markets for food means that increases in staple food prices, such as the sudden rise that occurred in 2011, affect poor urban people more than poor people in general. While the types of natural disasters experienced by urban populations tend to be the same as those affecting rural communities – eg, earthquakes,48 tsunamis, flooding, military conflict and drought – two potentially new categories of disaster exist in urban areas. The first is a new kind of armed conflict between state and non-state armed groups. The second is the chronic urban emergency in which specific socio-economic groups continually display ill health or malnutrition which, in another environment, would be classed as an emergency, but which is difficult to identify because of a lack of data or a lack of disaggregation (Ramalingam and Clarke, 2012).
Reliable surveillance information is needed from urban sites as well as from rural areas in order to formulate policies and programmes that are relevant to each context. Traditional approaches may not be optimally effective in urban areas, so it is essential to take into account the local situation when designing surveillance activities. Appendix G.1 lists factors affecting urban food security and nutrition that have implications for nutrition surveillance, while Appendix G.2 lists the issues to consider when adapting the design and methods of nutrition surveillance to urban areas.
7.5 THE ROLE OF TECHNOLOGY
Taking advantage of technological innovation has been a theme through the history of nutrition surveillance, from drawing on food security assessments informed by satellite data in the 1980s, to computer-assisted interviewing in the 1990s, the use of mobile phones and the development of real-time monitoring49 in the last decade.
It is recognised that despite the efficiencies that automation50 might bring, human input will continue and a source of error will remain large and consequential even in high-income contexts where surveillance systems are likely to be very sophisticated (Thacker et al, 2012). Figure 7.1 below presents an assessment of the optimal balance of human and automated inputs into surveillance systems, showing how technology will mainly help with data collection, collation, analysis and dissemination, but not replace human inputs for planning, system design, and interpretation.
Appendix G.3 summarises important research, reviews and initiatives while Appendix G.4 summarises the present and potential applications of information and communication technology (ICT) in nutrition surveillance. All the central tasks related to information management, including data collection, storage, analysis, visual representation and sharing, can be greatly facilitated by the use of ICT. There have been important recent developments in the use of ICT for data collection (Barnett and Gallegos, 2013). While some key informants for this review had great enthusiasm regarding the potential advantages of adopting these methods, others were less sanguine, arguing that, even if data collection is speeded up, real-time monitoring does

NU
TR
ITIO
N S
URV
EILL
AN
CE
SYST
EMS
38
not offer great benefits compared to paper-based methods because the data may still be wrong, or wrongly recorded, and still need to be analysed after collection. Thus, overall gains in speed may be negligible, notwithstanding that data quality may be improved (see Section 4.6). This is a valid point, although one which should be relatively straightforward to assess. In low-income rural contexts, most community-based health and nutrition centres or monthly growth monitoring events do not have access to a computer, so the nutrition data need to be transferred to the district health facility and entered there. Particularly for paper-based systems, flooding and the rainy season may cause long delays in the collation of the data from remote villages. So
until basic hardware is distributed and its reliability ensured, advantage cannot be taken of the increased speed of data collection offered by the adoption of mobile phone technology.
As well as these and other technical challenges to real-time monitoring, such as internet band width and the need for operations research (Mock et al, 2013), there are more general challenges. Real-time monitoring initiatives commonly involve partnerships between the state, civil society, donors and the private sector, each of which will inevitably have different objectives and priorities. It will be important to ensure that data quality and equity are given precedence over other potentially conflicting priorities inherent in the necessary partnerships
FIGURE 7.1 THE BALANCE OF HUMAN AND AUTOMATED INPUTS INTO NUTRITION SURVEILLANCE SYSTEM ACTIVITIES
Source: Thacker et al, 2012
Knowledge application
Planning and system design
Data collection
Data collation
Data analysis
Data interpretation
Information dissemination
Information communicationMajor input is human
Major input is automated

7 TH
E FUT
UR
E – OPPO
RTU
NIT
IES AN
D C
HA
LLENG
ES
39
between public and private stakeholders, so common guidance must be adopted on quality and equity, including (Greeley et al, 2013):• visibility/disaggregation of data on socially
excluded groups, focusing on inclusivity and addressing horizontal equity
• specific evidence on the poorest and most economically vulnerable, focusing on inclusivity and addressing vertical equity.
Also, there is a need, identified by Mock and colleagues, to build cultural bridges between three groups: the youthful technological community who are promoting modern methods, the seasoned conventional development/humanitarian policy and programme makers, and the affected communities (Mock et al, 2013).
7.6 THE WAY AHEAD FOR NUTRITION SURVEILLANCE
The findings from the literature review and from key informants that have the greatest future relevance are:• For nutrition surveillance to be effective, it must
yield high-quality and timely information. • Information derived from nutrition surveillance is
least used at district level and below.• However, it is at sub-national level that this
information has the most potential value.• There is a great need to build capacity at all levels,
and the low use of information from nutrition surveillance is related to this need.
• Information from surveillance needs to be presented and communicated appropriately for users at different levels.
• Communication between those who analyse and interpret surveillance data, and decision-makers is key.
• Active participation in system design leads to relevant data and ownership of information.
• The availability of high-quality information is not sufficient alone for it to be used for action.
Rather than creating expensive new systems for primary data collection, the following is recommended:• Optimise the use of data that are currently
collected. There is already a huge quantity of data being collected that is not being used.
• Prioritise increasing data production and quality from existing sources.
• Use cost-effective opportunities to obtain primary nutrition data for surveillance, including: – Incorporating anthropometric measurements
into existing data collection mechanisms such as household expenditure and consumption surveys.
– Requiring external agencies to implement systems for monitoring and evaluation that contribute to nutrition surveillance, when these agencies initiate nutrition and food security interventions.

40
APP
END
ICES
APP
END
IX A
A.1
CH
AR
AC
TER
IST
ICS
OF
SURV
EILL
AN
CE
SYST
EMS
USE
D A
S C
ASE
ST
UD
IES
Ban
glad
esh
Lis
ten
ing
Po
sts
in Z
imb
abw
e an
d B
urk
ina
Fas
o
Eth
iop
iaM
alaw
iN
icar
agu
a
Nat
iona
l v. s
ub-n
atio
nal
Nat
iona
lSu
b-na
tiona
lSu
b-na
tiona
lN
atio
nal
Nat
iona
l
Ran
dom
v. s
entin
elR
ando
mSe
ntin
elB
oth
Sent
inel
Ran
dom
Long
itudi
nal v
. cro
ss-s
ectio
nal
Cro
ss-s
ectio
nal
Long
itudi
nal
Long
itudi
nal f
or o
ne
year
the
n ne
w s
ampl
eLo
ngitu
dina
l for
one
ye
ar t
hen
new
sam
ple
Cro
ss-s
ectio
nal
Freq
uenc
y of
dat
a co
llect
ion
Ever
y fo
ur m
onth
sM
arke
t da
ta m
onth
ly;
nutr
ition
dat
a ev
ery
thre
e m
onth
s
Ever
y th
ree
mon
ths
Mon
thly
Nat
iona
l find
ings
yea
rly;
R
egio
nal fi
ndin
gs e
very
th
ree
year
s
Sam
ple
size
(c
hild
ren Ï
rou
nds
per
year
)4,
500 Ï
396
Ï 4
39
6 Ï
49,
250 Ï
49,
100 Ï
12
500 Ï
1
Ow
ners
hip/
sust
aina
bilit
yX
XX
XX
Link
s w
ith d
ecis
ion-
mak
ers
XX
XX
X
Ant
hrop
omet
ric
appr
oach
esX
X
Urb
an m
etho
dsX
Rol
e of
tec
hnol
ogy
XX

APPEN
DIC
ES
41
A.2
DO
CU
MEN
TS
TH
AT
MET
TH
E IN
CLU
SIO
N A
ND
EX
CLU
SIO
N C
RIT
ERIA
A.2
A P
UBL
ISH
ED D
OC
UM
ENT
S R
ELA
TIN
G T
O N
UT
RIT
ION
SU
RVEI
LLA
NC
E
Au
tho
rsY
ear
Tit
leJo
urn
alV
ol.
Issu
eP
ages
Sys
tem
des
crip
tio
n,
fin
din
gs o
r gu
idan
ce
Lo
cati
on
Fu
ll te
xt51
L. H
und
and
M. P
agan
o20
14Ex
tend
ing
clus
ter
lot
qual
ity
assu
ranc
e sa
mpl
ing
desi
gns
for
surv
eilla
nce
prog
ram
sSt
at M
edG
uida
nce
E
G. F
ried
man
2014
Rev
iew
of N
atio
nal N
utri
tion
Sur
veill
ance
Sys
tem
s(R
epor
t)D
escr
ipti
onG
ener
alE
D. D
oled
ec20
14A
naly
sis
of t
he S
enti
nel S
ite
Nut
riti
on S
urve
illan
ce
Syst
em in
Moz
ambi
que
(Rep
ort)
Des
crip
tion
Moz
ambi
que
E
H. B
arre
tt a
nd D
. Hea
dey
2014
Mea
suri
ng R
esili
ence
in a
Vol
atile
Wor
ld: A
Pro
posa
l fo
r a
Mul
tico
untr
y Sy
stem
of S
enti
nel S
ites
(Rep
ort)
Des
crip
tion
and
gu
idan
ceG
ener
alE
I. B
arne
tt a
nd E
. Edw
ards
2014
Mob
ile p
hone
s fo
r re
al-t
ime
surv
eilla
nce:
App
roac
hes,
ch
alle
nges
and
opp
ortu
niti
es fo
r th
e da
ta p
rese
ntat
ion
and
diss
emin
atio
n
(Rep
ort)
Des
crip
tion
Gen
eral
E
WH
O20
13Fo
od a
nd n
utri
tion
sur
veill
ance
sys
tem
s Te
chni
cal g
uide
fo
r th
e de
velo
pmen
t of
a fo
od a
nd n
utri
tion
sur
veill
ance
sy
stem
(Gui
de)
Gui
danc
e E
M. J
effe
rds
and
R
. Flo
res-
Aya
la20
13C
onti
nuou
s ho
useh
old
surv
eys
to p
rodu
ce h
igh
qual
ity,
lo
w c
ost,
and
tim
ely
nutr
itio
n su
rvei
llanc
e da
taA
nnal
s of
Nut
riti
on
and
Met
abol
ism
6389
–89
Des
crip
tion
Nic
arag
ua, G
uate
mal
a an
d U
gand
aE
N. H
ajee
bhoy
, N. P
huon
g H
ong,
T. D
o T
hanh
and
M
. de
Oni
s
2013
Intr
oduc
ing
infa
nt a
nd y
oung
chi
ld fe
edin
g in
dica
tors
in
to n
atio
nal n
utri
tion
sur
veill
ance
sys
tem
s: le
sson
s fr
om V
ietn
am
Mat
erna
l and
Chi
ld
Nut
riti
on9
131–
149
Des
crip
tion
Vie
tnam
E
E. G
relle
ty, F
. J. L
uque
ro,
C. M
ambu
la, H
. H. A
dam
u,
G. E
lder
and
K. P
orte
n
2013
Obs
erva
tion
al b
ias
duri
ng n
utri
tion
sur
veill
ance
: re
sult
s of
a m
ixed
long
itud
inal
and
cro
ss-s
ecti
onal
dat
a co
llect
ion
syst
em in
Nor
ther
n N
iger
ia
PLoS
One
85
e627
67Fi
ndin
gs a
nd g
uida
nce
Nig
eria
E
H. F
. Del
isle
, O. R
ecev
eur,
V. A
gueh
and
C. N
ishi
da20
13Pi
lot
proj
ect
of t
he N
utri
tion
-Fri
endl
y Sc
hool
Init
iati
ve
(NFS
I) in
Oua
gado
ugou
, Bur
kina
Fas
o an
d C
oton
ou,
Ben
in, i
n W
est
Afr
ica
Glo
b H
ealt
h Pr
omot
201
39-4
9D
escr
ipti
onB
urki
na F
aso
and
Ben
inE
N. M
. Dal
e, M
. Mya
tt,
C. P
rudh
on a
nd A
. Bri
end
2013
Ass
essm
ent
of t
he P
RO
BIT
app
roac
h fo
r es
tim
atin
g th
e pr
eval
ence
of g
loba
l, m
oder
ate
and
seve
re a
cute
m
alnu
trit
ion
from
pop
ulat
ion
surv
eys
Publ
ic H
ealt
h N
utr
165
858–
63G
uida
nce
E
I. B
arne
tt a
nd J.
V. G
alle
gos
2013
Usi
ng M
obile
Pho
nes
for
Nut
riti
on S
urve
illan
ce: A
R
evie
w o
f Evi
denc
e(r
epor
t)D
escr
ipti
onG
ener
alE
I. G
. Rab
iul,
A. M
. Jah
angi
r an
d J.
Buy
sse
2012
Non
-cer
eal f
ood
cons
umpt
ion,
food
inse
curi
ty a
nd
nutr
itio
nal s
tatu
s of
chi
ldre
n an
d m
othe
rs: a
cas
e st
udy
in B
angl
ades
h
Mal
ays
J Nut
r18
177
–88
Find
ings
Ban
glad
esh
E

NU
TR
ITIO
N S
URV
EILL
AN
CE
SYST
EMS
42
Au
tho
rsY
ear
Tit
leJo
urn
alV
ol.
Issu
eP
ages
Sys
tem
des
crip
tio
n,
fin
din
gs o
r gu
idan
ce
Lo
cati
on
Fu
ll te
xt51
V. M
. Odd
o, J.
H. R
ah,
R. D
. Sem
ba, K
. Sun
, N
. Akh
ter,
M. S
ari,
S. d
e Pe
e, R
. Moe
nch-
Pfan
ner,
M. B
loem
and
K. K
raem
er
2012
Pred
icto
rs o
f mat
erna
l and
chi
ld d
oubl
e bu
rden
of
mal
nutr
itio
n in
rur
al In
done
sia
and
Ban
glad
esh
Am
J C
lin N
utr
954
951–
8Fi
ndin
gsIn
done
sia
and
Ban
glad
esh
E
H. T
. Ngu
yen,
B
. Eri
ksso
n, L
. T. N
guye
n,
C. T
. Ngu
yen,
M. P
etzo
ld,
G. B
ondj
ers
and
H. A
sche
r
2012
Phys
ical
gro
wth
dur
ing
the
first
yea
r of
life
. A
long
itud
inal
stu
dy in
rur
al a
nd u
rban
are
as o
f Han
oi,
Vie
tnam
BM
C P
edia
tr12
26Fi
ndin
gsV
ietn
amE
M. G
aren
ne, B
. Mai
re,
O. F
onta
ine
and
A. B
rien
d20
12A
dequ
acy
of c
hild
ant
hrop
omet
ric
indi
cato
rs fo
r m
easu
ring
nut
riti
onal
str
ess
at p
opul
atio
n le
vel:
a st
udy
from
Nia
khar
, Sen
egal
Publ
ic H
ealt
h N
utr
169
1533
–9Fi
ndin
gs a
nd g
uida
nce
Sene
gal
E
J. C
. Fot
so, N
. Mad
ise,
A
. Bas
chie
ri, J
. Cle
land
, E.
Zul
u, M
. Kav
ao M
utua
an
d H
. Ess
endi
2012
Chi
ld g
row
th in
urb
an d
epri
ved
sett
ings
: Doe
s ho
useh
old
pove
rty
stat
us m
atte
r? A
t w
hich
sta
ge o
f ch
ild d
evel
opm
ent?
Hea
lth
& P
lace
182
375–
384
Find
ings
Ken
yaE
G. M
. Cal
eo, A
. P. S
y,
S. B
alan
dine
, J. P
olon
sky,
P.
P. P
alm
a, R
. F. G
rais
and
F.
Che
cchi
2012
Sent
inel
sit
e co
mm
unit
y su
rvei
llanc
e of
mor
talit
y an
d nu
trit
iona
l sta
tus
in s
outh
-wes
tern
Cen
tral
Afr
ican
R
epub
lic, 2
010
Popu
l Hea
lth
Met
r10
118
Find
ings
and
gui
danc
eC
entr
al A
fric
an
Rep
ublic
E
O. B
ilukh
a, C
. Pru
dhon
, G
. Mol
oney
, P. H
aile
y an
d D
. Dol
edec
2012
Mea
suri
ng a
nthr
opom
etri
c in
dica
tors
thr
ough
nut
riti
on
surv
eilla
nce
in h
uman
itar
ian
sett
ings
: Opt
ions
, iss
ues,
an
d w
ays
forw
ard
Food
and
Nut
riti
on
Bul
l.33
216
9–17
6D
escr
ipti
on a
nd
guid
ance
G
ener
alE
B. A
. Abu
ya, J
. Cie
ra a
nd
E. K
iman
i-M
urag
e20
12Ef
fect
of m
othe
r’s
educ
atio
n on
chi
ld’s
nutr
itio
nal s
tatu
s in
the
slu
ms
of N
airo
biB
MC
Ped
iatr
1280
Find
ings
Ken
yaE
R. D
. Sem
ba,
A. A
. Cam
pbel
l, K
. Sun
, S.
de
Pee,
N. A
khte
r,
R. M
oenc
h-Pf
anne
r,
J. H
. Rah
, J. B
adha
m,
K. K
raem
er a
nd
M. W
. Blo
em
2011
Pate
rnal
sm
okin
g is
ass
ocia
ted
wit
h gr
eate
r fo
od
inse
curi
ty a
mon
g po
or fa
mili
es in
rur
al In
done
sia
Asi
a Pa
c J C
lin N
utr
204
618–
23Fi
ndin
gsIn
done
sia
E
Nut
riti
onW
orks
, Em
erge
ncy
Nut
riti
on
Net
wor
k an
d G
loba
l N
utri
tion
Clu
ster
2011
Mod
ule
10: N
utri
tion
info
rmat
ion
and
surv
eilla
nce
syst
ems,
Tec
hnic
al n
otes
Har
mon
ised
Tra
inin
g Pa
ckag
e V
2E
M. N
nyep
i, K
. S.
Gob
otsw
ang
and
P. C
odjia
2011
Com
pari
son
of e
stim
ates
of m
alnu
trit
ion
in c
hild
ren
aged
0–5
yea
rs b
etw
een
clin
ic-b
ased
nut
riti
on
surv
eilla
nce
and
nati
onal
sur
veys
J Pub
lic H
ealt
h Po
licy
323
281–
92G
uida
nce
E
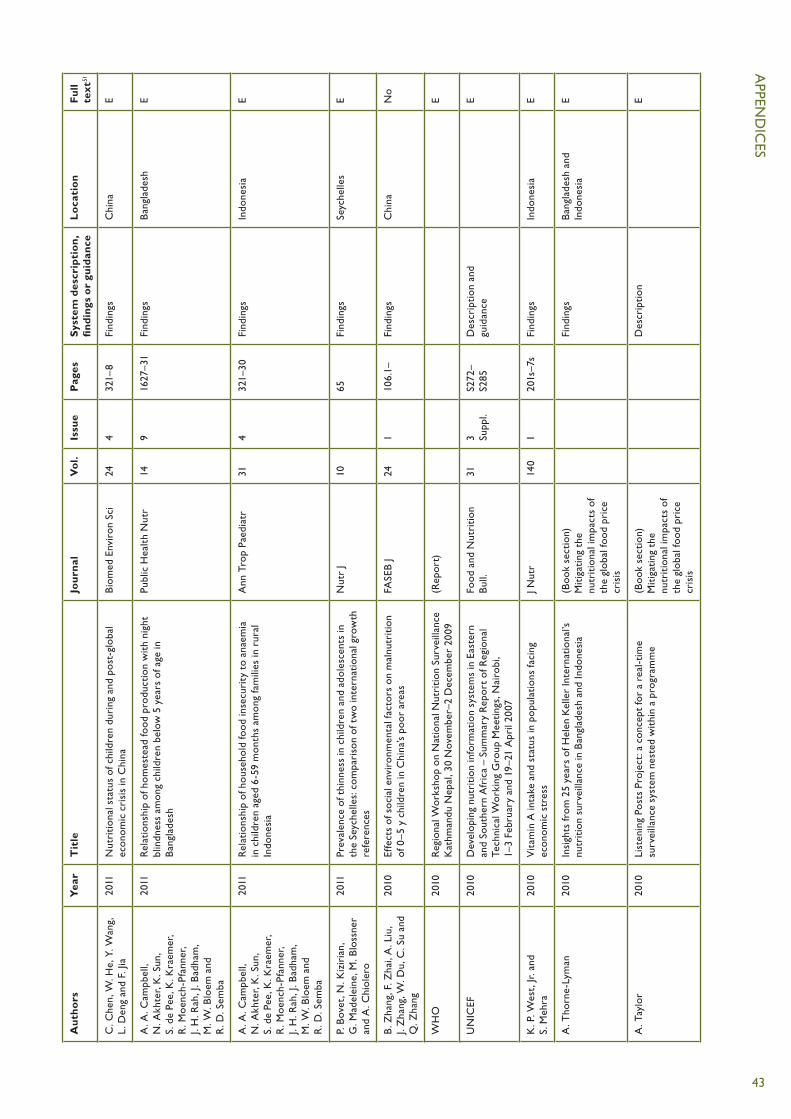
APPEN
DIC
ES
43
Au
tho
rsY
ear
Tit
leJo
urn
alV
ol.
Issu
eP
ages
Sys
tem
des
crip
tio
n,
fin
din
gs o
r gu
idan
ce
Lo
cati
on
Fu
ll te
xt51
C. C
hen,
W. H
e, Y
. Wan
g,
L. D
eng
and
F. Ji
a20
11N
utri
tion
al s
tatu
s of
chi
ldre
n du
ring
and
pos
t-gl
obal
ec
onom
ic c
risi
s in
Chi
naB
iom
ed E
nvir
on S
ci24
432
1–8
Find
ings
Chi
naE
A. A
. Cam
pbel
l,
N. A
khte
r, K
. Sun
, S.
de
Pee,
K. K
raem
er,
R. M
oenc
h-Pf
anne
r,
J. H
. Rah
, J. B
adha
m,
M. W
. Blo
em a
nd
R. D
. Sem
ba
2011
Rel
atio
nshi
p of
hom
este
ad fo
od p
rodu
ctio
n w
ith
nigh
t bl
indn
ess
amon
g ch
ildre
n be
low
5 y
ears
of a
ge in
B
angl
ades
h
Publ
ic H
ealt
h N
utr
149
1627
–31
Find
ings
Ban
glad
esh
E
A. A
. Cam
pbel
l,
N. A
khte
r, K
. Sun
, S.
de
Pee,
K. K
raem
er,
R. M
oenc
h-Pf
anne
r,
J. H
. Rah
, J. B
adha
m,
M. W
. Blo
em a
nd
R. D
. Sem
ba
2011
Rel
atio
nshi
p of
hou
seho
ld fo
od in
secu
rity
to
anae
mia
in
chi
ldre
n ag
ed 6
-59
mon
ths
amon
g fa
mili
es in
rur
al
Indo
nesi
a
Ann
Tro
p Pa
edia
tr31
432
1–30
Find
ings
Indo
nesi
aE
P. B
ovet
, N. K
izir
ian,
G
. Mad
elei
ne, M
. Blo
ssne
r an
d A
. Chi
oler
o
2011
Prev
alen
ce o
f thi
nnes
s in
chi
ldre
n an
d ad
oles
cent
s in
th
e Se
yche
lles:
com
pari
son
of t
wo
inte
rnat
iona
l gro
wth
re
fere
nces
Nut
r J
1065
Find
ings
Seyc
helle
sE
B. Z
hang
, F. Z
hai,
A. L
iu,
J. Z
hang
, W. D
u, C
. Su
and
Q. Z
hang
2010
Effe
cts
of s
ocia
l env
iron
men
tal f
acto
rs o
n m
alnu
trit
ion
of 0
–5 y
chi
ldre
n in
Chi
na’s
poor
are
asFA
SEB
J24
1 10
6.1–
Find
ings
Chi
naN
o
WH
O20
10R
egio
nal W
orks
hop
on N
atio
nal N
utri
tion
Sur
veill
ance
K
athm
andu
Nep
al, 3
0 N
ovem
ber–
2 D
ecem
ber
2009
(Rep
ort)
E
UN
ICEF
2010
Dev
elop
ing
nutr
itio
n in
form
atio
n sy
stem
s in
Eas
tern
an
d So
uthe
rn A
fric
a –
Sum
mar
y R
epor
t of
Reg
iona
l Te
chni
cal W
orki
ng G
roup
Mee
ting
s, N
airo
bi,
1–3
Febr
uary
and
19–
21 A
pril
2007
Food
and
Nut
riti
on
Bul
l.31
3 Supp
l.S2
72–
S285
D
escr
ipti
on a
nd
guid
ance
E
K. P
. Wes
t, Jr
. and
S.
Meh
ra20
10V
itam
in A
inta
ke a
nd s
tatu
s in
pop
ulat
ions
faci
ng
econ
omic
str
ess
J Nut
r14
01
201s
–7s
Find
ings
Indo
nesi
aE
A. T
horn
e-Ly
man
2010
Insi
ghts
from
25
year
s of
Hel
en K
elle
r In
tern
atio
nal’s
nu
trit
ion
surv
eilla
nce
in B
angl
ades
h an
d In
done
sia
(Boo
k se
ctio
n)
Mit
igat
ing
the
nutr
itio
nal i
mpa
cts
of
the
glob
al fo
od p
rice
cr
isis
Find
ings
Ban
glad
esh
and
Indo
nesi
aE
A. T
aylo
r20
10Li
sten
ing
Post
s Pr
ojec
t: a
con
cept
for
a re
al-t
ime
surv
eilla
nce
syst
em n
este
d w
ithi
n a
prog
ram
me
(Boo
k se
ctio
n)
Mit
igat
ing
the
nutr
itio
nal i
mpa
cts
of
the
glob
al fo
od p
rice
cr
isis
Des
crip
tion
E

NU
TR
ITIO
N S
URV
EILL
AN
CE
SYST
EMS
44
Au
tho
rsY
ear
Tit
leJo
urn
alV
ol.
Issu
eP
ages
Sys
tem
des
crip
tio
n,
fin
din
gs o
r gu
idan
ce
Lo
cati
on
Fu
ll te
xt51
J. H
. Rah
, N. A
khte
r,
R. D
. Sem
ba, S
. de
Pee,
M
. W. B
loem
, A
. A. C
ampb
ell,
R
. Moe
nch-
Pfan
ner,
K
. Sun
, J. B
adha
m a
nd
K. K
raem
er
2010
Low
die
tary
div
ersi
ty is
a p
redi
ctor
of c
hild
stu
ntin
g in
ru
ral B
angl
ades
hEu
r J C
lin N
utr
6412
1393
–8Fi
ndin
gsB
angl
ades
hE
J. M
ason
2010
Nut
riti
on s
urve
illan
ce in
rel
atio
n to
the
food
pri
ce a
nd
econ
omic
cri
ses
(Boo
k se
ctio
n)
Mit
igat
ing
the
nutr
itio
nal i
mpa
cts
of
the
glob
al fo
od p
rice
cr
isis
Find
ings
Gen
eral
E
R. M
arto
rell
2010
Phys
ical
gro
wth
and
dev
elop
men
t of
the
mal
nour
ishe
d ch
ild: c
ontr
ibut
ions
from
50
year
s of
res
earc
h at
INC
AP
Food
Nut
r B
ull
311
68–8
2D
escr
ipti
on a
nd
findi
ngs
Cen
tral
Am
eric
aE
C. H
illbr
uner
2010
Fam
ine
earl
y w
arni
ng s
yste
ms
netw
ork,
nut
riti
on
surv
eilla
nce,
and
ear
ly w
arni
ng(B
ook
sect
ion)
M
itig
atin
g th
e nu
trit
iona
l im
pact
s of
th
e gl
obal
food
pri
ce
cris
is
Des
crip
tion
Afr
ica
E
A. A
. Cam
pbel
l, S.
de
Pee,
K
. Sun
, K. K
raem
er,
A. T
horn
e-Ly
man
, R
. Moe
nch-
Pfan
ner,
M
. Sar
i, N
. Akh
ter,
M
. W. B
loem
and
R
. D. S
emba
2010
Hou
seho
ld R
ice
Expe
ndit
ure
and
Mat
erna
l and
Chi
ld
Nut
riti
onal
Sta
tus
in B
angl
ades
hJ.
Nut
r.14
01
189S
–19
4Fi
ndin
gsB
angl
ades
hE
N. A
khte
r an
d N
. Has
elow
2010
Usi
ng d
ata
from
a n
atio
nally
rep
rese
ntat
ive
nutr
itio
n su
rvei
llanc
e sy
stem
to
asse
ss t
rend
s an
d in
fluen
ce
nutr
itio
n pr
ogra
ms
and
polic
y
Fiel
d A
ctio
ns S
cien
ce
Rep
orts
. The
Jour
nal
of fi
eld
acti
ons
4 D
escr
ipti
on a
nd
findi
ngs
Ban
glad
esh
E
S. P
urdi
n, P
. Spi
egel
, K
.P. M
ack,
and
J. M
illen
2009
Surv
eilla
nce
beyo
nd c
amp
sett
ings
in h
uman
itar
ian
emer
genc
ies:
find
ings
from
the
Hum
anit
aria
n H
ealt
h In
form
atio
n M
anag
emen
t W
orki
ng G
roup
Preh
osp
Dis
aste
r M
ed24
Sup
pl 2
s202
–5D
escr
ipti
onG
ener
alE
A. I
slam
, E. H
asib
, D
. Lia
dsey
and
M. A
ndre
2009
Gov
ernm
ent
part
ners
hip
wit
h in
tern
atio
nal n
on-
gove
rnm
ent
orga
niza
tion
s (N
GO
s) a
re in
tegr
al t
o bu
ildin
g nu
trit
ion
surv
eilla
nce
capa
city
in B
angl
ades
h
Ann
als
of N
utri
tion
an
d M
etab
olis
m55
565–
566
Des
crip
tion
Ban
glad
esh
E
A. A
. Cam
pbel
l,
A. T
horn
e-Ly
man
, K. S
un,
S. d
e Pe
e, K
. Kra
emer
, R
. Moe
nch-
Pfan
ner,
M
. Sar
i, N
. Akh
ter,
M
. W. B
loem
and
R
. D. S
emba
2009
Indo
nesi
an w
omen
of c
hild
bear
ing
age
are
at g
reat
er
risk
of c
linic
al v
itam
in A
defi
cien
cy in
fam
ilies
tha
t sp
end
mor
e on
ric
e an
d le
ss o
n fr
uits
/veg
etab
les
and
anim
al-b
ased
food
s
Nut
r R
es29
275
–81
Find
ings
Indo
nesi
aE

APPEN
DIC
ES
45
Au
tho
rsY
ear
Tit
leJo
urn
alV
ol.
Issu
eP
ages
Sys
tem
des
crip
tio
n,
fin
din
gs o
r gu
idan
ce
Lo
cati
on
Fu
ll te
xt51
A. A
. Cam
pbel
l, S.
de
Pee,
K
. Sun
, K. K
raem
er,
A. T
horn
e-Ly
man
, R
. Moe
nch-
Pfan
ner,
M
. Sar
i, N
. Akh
ter,
M
. W. B
loem
and
R
. D. S
emba
2009
Rel
atio
nshi
p of
hou
seho
ld fo
od in
secu
rity
to
neon
atal
, in
fant
, and
und
er-fi
ve c
hild
mor
talit
y am
ong
fam
ilies
in
rura
l Ind
ones
ia
Food
Nut
r B
ull
302
112–
9Fi
ndin
gsIn
done
sia
E
S. B
lasc
hke,
K
. Bok
enka
mp,
R
. Cos
mac
iuc,
M. D
enby
, B
. Hai
lu a
nd R
. Sho
rt
2009
Usi
ng M
obile
Pho
nes
to Im
prov
e C
hild
Nut
riti
on
Surv
eilla
nce
in M
alaw
i(r
epor
t)D
escr
ipti
onM
alaw
iE
V. W
iwan
itki
t20
08N
utri
tion
sur
veill
ance
in r
ural
tro
pica
l cou
ntri
es: a
n in
tegr
ated
con
cept
Asi
an P
acifi
c Jo
urna
l of
Trop
ical
Med
icin
e1
160
–62
Gui
danc
eE
R. D
. Sem
ba, S
. de
Pee,
K
. Sun
, M. S
ari,
N. A
khte
r an
d M
. W. B
loem
2008
Effe
ct o
f par
enta
l for
mal
edu
cati
on o
n ri
sk o
f chi
ld
stun
ting
in In
done
sia
and
Ban
glad
esh:
a c
ross
-sec
tion
al
stud
y
Lanc
et37
196
0932
2–8
Find
ings
Ban
glad
esh
and
Indo
nesi
a E
S. Y
. Cha
ng, W
. He
and
C
. M. C
hen
2008
Com
plem
enta
ry fe
edin
g an
d gr
owth
of i
nfan
t an
d yo
ung
child
in C
hina
Bio
med
Env
iron
Sci
213
264–
8Fi
ndin
gsC
hina
E
A. A
. Cam
pbel
l,
A. T
horn
e-Ly
man
, K. S
un,
S. d
e Pe
e, K
. Kra
emer
, R
. Moe
nch-
Pfan
ner,
M
. Sar
i, N
. Akh
ter,
M
. W. B
loem
and
R
. D. S
emba
2008
Gre
ater
hou
seho
ld e
xpen
ditu
res
on fr
uits
and
ve
geta
bles
but
not
ani
mal
sou
rce
food
s ar
e as
soci
ated
w
ith
decr
ease
d ri
sk o
f und
er-fi
ve c
hild
mor
talit
y am
ong
fam
ilies
in r
ural
Indo
nesi
a
J Nut
r13
811
2244
–9Fi
ndin
gsIn
done
sia
E
M. W
. Blo
em, S
. de
Pee
and
R. D
. Sem
ba20
08H
ow M
uch
Do
Dat
a In
fluen
ce P
rogr
ams
for
Hea
lth
and
Nut
riti
on?
Expe
rien
ce fr
om H
ealt
h an
d N
utri
tion
Su
rvei
llanc
e Sy
stem
s
(Boo
k se
ctio
n)
Nut
riti
on a
nd
Hea
lth
in D
evel
opin
g C
ount
ries
Des
crip
tion
and
fin
ding
sB
angl
ades
h an
d In
done
sia
E
C. M
. Bes
t, K
. Sun
, S. d
e Pe
e, M
. Sar
i, M
. W. B
loem
an
d R
. D. S
emba
2008
Pate
rnal
sm
okin
g an
d in
crea
sed
risk
of c
hild
m
alnu
trit
ion
amon
g fa
mili
es in
rur
al In
done
sia
Tob
Con
trol
171
38–
45Fi
ndin
gsIn
done
sia
E
S. G
. Ber
ger,
S. d
e Pe
e,
M. W
. Blo
em, S
. Hal
ati a
nd
R. D
. Sem
ba
2008
Mal
nutr
itio
n an
d m
orbi
dity
am
ong
child
ren
not
reac
hed
by t
he n
atio
nal v
itam
in A
cap
sule
pro
gram
me
in u
rban
sl
um a
reas
of I
ndon
esia
Publ
ic H
ealt
h12
24
371–
378
Find
ings
Indo
nesi
aE
V. W
iwan
itki
t20
07N
utri
tion
sur
veill
ance
in r
ural
com
mun
ity
Agr
o Fo
od In
dust
ry
Hi-T
ech
185
30–3
1(n
ot s
een)
No

NU
TR
ITIO
N S
URV
EILL
AN
CE
SYST
EMS
46
Au
tho
rsY
ear
Tit
leJo
urn
alV
ol.
Issu
eP
ages
Sys
tem
des
crip
tio
n,
fin
din
gs o
r gu
idan
ce
Lo
cati
on
Fu
ll te
xt51
S. S
hafiq
ue, N
. Akh
ter,
G
. Sta
llkam
p, S
. de
Pee,
D
. Pan
agid
es a
nd
M. W
. Blo
em
2007
Tren
ds o
f und
er-
and
over
wei
ght
amon
g ru
ral a
nd
urba
n po
or w
omen
indi
cate
the
dou
ble
burd
en o
f m
alnu
trit
ion
in B
angl
ades
h
Int
J Epi
dem
iol
362
449–
57Fi
ndin
gsB
angl
ades
hE
R. D
. Sem
ba, L
. M. K
alm
, S.
de
Pee,
M. O
. Ric
ks,
M. S
ari a
nd M
. W. B
loem
2007
Pate
rnal
sm
okin
g is
ass
ocia
ted
wit
h in
crea
sed
risk
of
chi
ld m
alnu
trit
ion
amon
g po
or u
rban
fam
ilies
in
Indo
nesi
a
Publ
ic H
ealt
h N
utr
101
Jul–
15Fi
ndin
gsIn
done
sia
E
W. A
. Joh
nech
eck
and
D
. E. H
olla
nd20
07N
utri
tion
al s
tatu
s in
pos
tcon
flict
Afg
hani
stan
: Evi
denc
e fr
om t
he N
atio
nal S
urve
illan
ce S
yste
m P
ilot
and
Nat
iona
l Ris
k an
d V
ulne
rabi
lity
Ass
essm
ent
Food
and
Nut
riti
on
Bul
l.28
1M
ar–1
7Fi
ndin
gsA
fgha
nist
anE
C. M
. Bes
t, K
. Sun
, S.
de
Pee,
M. W
. Blo
em,
G. S
tallk
amp
and
R
. D. S
emba
2007
Pare
ntal
tob
acco
use
is a
ssoc
iate
d w
ith
incr
ease
d ri
sk
of c
hild
mal
nutr
itio
n in
Ban
glad
esh
Nut
riti
on23
1073
1–73
8Fi
ndin
gsB
angl
ades
hE
S. G
. Ber
ger,
S. d
e Pe
e,
M. W
. Blo
em, S
. Hal
ati a
nd
R. D
. Sem
ba
2007
Mal
nutr
itio
n an
d m
orbi
dity
are
hig
her
in c
hild
ren
who
ar
e m
isse
d by
per
iodi
c vi
tam
in A
cap
sule
dis
trib
utio
n fo
r ch
ild s
urvi
val i
n ru
ral I
ndon
esia
J Nut
r13
75
1328
–33
Find
ings
Indo
nesi
aE
L. M
. Neu
feld
and
L.
Tol
enti
no20
05N
utri
tion
sur
veill
ance
: Dev
elop
ing
Cou
ntri
es(B
ook
sect
ion)
En
cycl
oped
ia o
f N
utri
tion
337
1–38
1D
escr
ipti
onG
ener
alE
H. T
orle
sse,
H. M
oest
ue,
A. H
all,
S. D
e Pe
e,
L. K
iess
and
M. W
. Blo
em
2004
Die
tary
div
ersi
ty in
Ban
glad
esh:
Evi
denc
e fr
om t
he
nutr
itio
n su
rvei
llanc
e pr
ojec
tFi
ndin
gsB
angl
ades
hE
H. M
oest
ue, S
. de
Pee,
A
. Hal
l, A
. Hye
, N
. Sul
tana
, M. Z
. Ish
tiaq
ue,
N. H
uq a
nd M
. W. B
loem
2004
Con
clus
ions
abo
ut d
iffer
ence
s in
line
ar g
row
th
betw
een
Ban
glad
eshi
boy
s an
d gi
rls
depe
nd o
n th
e gr
owth
ref
eren
ce u
sed
Eur
J Clin
Nut
r58
572
5–31
Find
ings
(a
bout
gro
wth
re
fere
nces
)
Ban
glad
esh
E
S. A
. Blo
ck, L
. Kie
ss,
P. W
ebb,
S. K
osen
, R
. Moe
nch-
Pfan
ner,
M
. W. B
loem
and
C
. Pet
er T
imm
er
2004
Mac
ro s
hock
s an
d m
icro
out
com
es: c
hild
nut
riti
on
duri
ng In
done
sia’
s cr
isis
Econ
omic
s &
Hum
an
Bio
logy
21
21–
44Fi
ndin
gsIn
done
sia
E
M. B
loem
, R. M
oenc
h-Pf
anne
r an
d D
. Pan
agid
es20
03H
ealt
h &
nut
riti
on s
urve
illan
ce fo
r de
velo
pmen
t(B
ook)
Des
crip
tion
and
fin
ding
sB
angl
ades
hE
H. T
orle
sse,
L. K
iess
and
M
. W. B
loem
2003
Ass
ocia
tion
of h
ouse
hold
ric
e ex
pend
itur
e w
ith
child
nu
trit
iona
l sta
tus
indi
cate
s a
role
for
mac
roec
onom
ic
food
pol
icy
in c
omba
ting
mal
nutr
itio
n
J Nut
r13
35
1320
–5Fi
ndin
gsB
angl
ades
hE
M. M
ulde
r-Si
band
a,
F. S
. Sib
anda
-Mul
der,
L.
d’A
lois
and
D. V
erna
2002
Mal
nutr
itio
n in
food
-sur
plus
are
as: e
xper
ienc
e fr
om
nutr
itio
n su
rvei
llanc
e fo
r de
cent
raliz
ed p
lann
ing
in H
aiti
Food
and
Nut
riti
on
Bul
l.23
325
3–61
Des
crip
tion
and
fin
ding
sH
aiti
E

APPEN
DIC
ES
47
Au
tho
rsY
ear
Tit
leJo
urn
alV
ol.
Issu
eP
ages
Sys
tem
des
crip
tio
n,
fin
din
gs o
r gu
idan
ce
Lo
cati
on
Fu
ll te
xt51
S. D
e Pe
e, M
. W. B
loem
, M
. Sar
i, L.
Kie
ss, R
. Yip
an
d S.
Kos
en
2002
The
hig
h pr
eval
ence
of l
ow h
emog
lobi
n co
ncen
trat
ion
amon
g In
done
sian
infa
nts
aged
3–5
mon
ths
is r
elat
ed t
o m
ater
nal a
nem
ia
J Nut
r13
28
2215
–21
Find
ings
Indo
nesi
aE
B. M
aire
, I. B
eghi
n,
F. D
elpe
uch
and
P.
Kol
ster
en
2001
Nut
riti
on s
urve
illan
ce: A
Sus
tain
able
Ope
rati
onal
A
ppro
ach
Stud
ies
in H
ealt
h Se
rvic
es O
rgan
isat
ion
& P
olic
y
19G
ener
al a
nd g
uida
nce
E
E. B
oons
tra,
M. L
indb
aek,
B
. Fid
zani
and
D
. Bru
usga
ard
2001
Cat
tle
erad
icat
ion
and
mal
nutr
itio
n in
und
er-fi
ves:
a
natu
ral e
xper
imen
t in
Bot
swan
aPu
blic
Hea
lth
Nut
r4
487
7–82
Find
ings
Bot
swan
aE
L. K
iess
, Jr.,
R. M
oenc
h-Ph
anne
r, M
. W. B
loem
, S.
d. P
ee, M
. Sar
i and
S.
Kos
en
2000
New
Con
cept
ual T
hink
ing
abou
t Su
rvei
llanc
e: U
sing
M
icro
nutr
ient
Sta
tus
to A
sses
s th
e Im
pact
of E
cono
mic
C
rise
s on
Hea
lth
and
Nut
riti
on
Mal
aysi
an jo
urna
l of
nutr
itio
n6
222
3–32
Find
ings
Indo
nesi
aE
E. G
ibbo
ns a
nd R
. Gar
field
1999
The
impa
ct o
f eco
nom
ic s
anct
ions
on
heal
th a
nd h
uman
ri
ghts
in H
aiti
, 199
1–19
94A
mer
ican
Jour
nal o
f Pu
blic
Hea
lth
8910
1499
–15
04Fi
ndin
gsH
aiti
E
A. B
orre
l and
P. S
alam
a19
99Pu
blic
nut
riti
on fr
om a
n ap
proa
ch t
o a
disc
iplin
e:
conc
ern’
s nu
trit
ion
case
stu
dies
in c
ompl
ex
emer
genc
ies
Dis
aste
rs23
432
6–42
Find
ings
Afr
ica
E
S. d
e Pe
e, M
. W. B
loem
, J.
Gor
stei
n, M
. Sar
i, Sa
toto
, R. Y
ip,
R. S
hrim
pton
and
Muh
ilal
1998
Rea
ppra
isal
of t
he r
ole
of v
eget
able
s in
the
vit
amin
A
stat
us o
f mot
hers
in C
entr
al Ja
va, I
ndon
esia
Am
J C
lin N
utr
685
1068
–74
Find
ings
Indo
nesi
aE
C. M
. Che
n19
98Fo
od a
nd n
utri
tion
pol
icie
s in
Chi
na –
Usi
ng n
utri
tion
su
rvei
llanc
e da
taPr
oc. 1
6th
Inte
rnat
iona
l Con
gres
s of
Nut
riti
on
(not
see
n)C
hina
NO
S.D
. Bab
u an
d
E. C
hapa
suka
1997
Mit
igat
ing
the
effe
cts
of d
roug
ht t
hrou
gh fo
od s
ecur
ity
and
nutr
itio
n m
onit
orin
g: L
esso
ns fr
om M
alaw
iFo
od a
nd N
utri
tion
B
ull.
181
Find
ings
Mal
awi
Link
N. W
. Jer
ome
and
J.
A. R
icci
1997
Food
and
nut
riti
on s
urve
illan
ce: A
n in
tern
atio
nal
over
view
Am
eric
an Jo
urna
l of
Clin
ical
Nut
riti
on65
4S1
198–
S1
202
Des
crip
tion
Tha
iland
E
R. G
arfie
ld a
nd S
. San
tana
1997
The
impa
ct o
f the
eco
nom
ic c
risi
s an
d th
e U
S em
barg
o on
hea
lth
in C
uba
Am
J Pu
blic
Hea
lth
871
15–2
0Fi
ndin
gsC
uba
E
R. F
inch
am19
97N
utri
tion
sur
veill
ance
and
inte
rven
tion
, Sou
th A
fric
aSC
N n
ews
/ UN
, A
CC
SCN
1508
–Aug
Des
crip
tion
Sout
h A
fric
aE
C. M
. Mar
in, J
. L. S
egur
a,
C. B
ern,
D. S
. Fre
edm
an,
A. G
uille
rmo
Lesc
ano,
L.
E. B
enav
ente
, L.
G. C
orde
ro, L
. Cla
vijo
an
d J.
B. G
ilman
1996
Seas
onal
cha
nge
in n
utri
tion
al s
tatu
s am
ong
youn
g ch
ildre
n in
an
urba
n sh
anty
tow
n in
Per
uTr
ans
R S
oc T
rop
Med
H
yg90
444
2–5
Find
ings
Peru
E

NU
TR
ITIO
N S
URV
EILL
AN
CE
SYST
EMS
48
Au
tho
rsY
ear
Tit
leJo
urn
alV
ol.
Issu
eP
ages
Sys
tem
des
crip
tio
n,
fin
din
gs o
r gu
idan
ce
Lo
cati
on
Fu
ll te
xt51
C. M
. Che
n19
96N
utri
tion
sta
tus
of t
he C
hine
se p
eopl
eB
iom
ed E
nvir
on S
ci9
02–
Mar
81–9
2Fi
ndin
gsC
hina
No
A. V
alya
sevi
, P.
Win
icha
goon
and
S.
Dha
nam
itta
1995
Com
mun
ity-
base
d su
rvei
llanc
e fo
r ac
tion
tow
ards
he
alth
and
nut
riti
on: e
xper
ienc
e in
Tha
iland
Food
and
Nut
riti
on
Bul
l.16
Des
crip
tion
Tha
iland
Link
L. R
odri
guez
1995
Nut
riti
on s
urve
illan
ce: t
he u
se o
f inf
orm
atio
n fo
r pr
ogra
mm
e pl
anni
ng a
nd m
anag
emen
tFo
od a
nd N
utri
tion
B
ull.
16
Des
crip
tion
Cos
ta R
ica
Link
D. L
. Pel
leti
er, K
. Den
eke,
Y.
Kid
ane,
B. H
aile
and
F.
Neg
ussi
e
1995
The
food
-firs
t bi
as a
nd n
utri
tion
pol
icy:
less
ons
from
Et
hiop
iaFo
od P
olic
y20
427
9–98
Find
ings
Ethi
opia
E
M. M
ulde
r-Si
band
a an
d
R. I
. Cho
wdh
ury
1995
Dec
entr
aliz
ed d
ata
man
agem
ent
in n
utri
tion
su
rvei
llanc
e fo
r ti
mel
y w
arni
ng a
nd in
terv
enti
onD
isas
ters
192
140–
7D
escr
ipti
onH
aiti
H
D. K
arya
di
1995
Nut
riti
on s
urve
illan
ce: A
pla
nner
s’ p
ersp
ecti
veFo
od a
nd N
utri
tion
B
ull.
16
112–
114
Des
crip
tion
Indo
nesi
aLi
nk
U. J
onss
on19
95To
war
ds a
n im
prov
ed s
trat
egy
for
nutr
itio
n su
rvei
llanc
eFo
od a
nd N
utri
tion
B
ull.
1610
2–11
1 G
uida
nce
Link
B. G
izaw
1995
Nut
riti
on s
urve
illan
ce in
a s
itua
tion
of r
ecur
rent
nat
ural
di
sast
ers
Food
and
Nut
riti
on
Bul
l.16
212
6–13
0D
escr
ipti
onEt
hiop
iaLi
nk
M. W
. Blo
em, A
. Hye
, M
. Wijn
roks
, A. R
alte
, K
. P. W
est,
Jr. a
nd
A. S
omm
er
1995
The
rol
e of
uni
vers
al d
istr
ibut
ion
of v
itam
in A
cap
sule
s in
com
batt
ing
vita
min
A d
efici
ency
in B
angl
ades
hA
m J
Epid
emio
l14
28
843–
55Fi
ndin
gsB
angl
ades
hE
M. W
. Blo
em, A
. Hye
, J.
Gor
stei
n, M
. Wijn
roks
, G
. Hal
l, H
. Mat
zger
and
A
. Som
mer
1995
Nut
riti
on s
urve
illan
ce in
Ban
glad
esh:
a u
sefu
l too
l for
po
licy
plan
ning
at
the
loca
l and
nat
iona
l lev
els
Food
and
Nut
riti
on
Bul
l.16
213
1–13
8 D
escr
ipti
onB
angl
ades
hLi
nk
G. C
. Sol
arsh
, D
. M. S
ande
rs,
C. A
. Gib
son
and
E.
Gou
ws
1994
Com
mun
ity-
base
d su
rvey
ver
sus
sent
inel
sit
e sa
mpl
ing
in d
eter
min
ing
the
nutr
itio
nal-
stat
us o
f rur
al c
hild
ren
– im
plic
atio
ns fo
r nu
trit
ion
surv
eilla
nce
and
the
deve
lopm
ent
of n
utri
tion
al p
rogr
ams
Sout
h A
fric
an M
edic
al
Jour
nal
8411
747–
752
Gui
danc
eE
V. J.
Qui
nn a
nd E
. Ken
nedy
1994
Food
sec
urit
y an
d nu
trit
ion
mon
itor
ing
syst
ems
in
Afr
ica:
A r
evie
w o
f cou
ntry
exp
erie
nces
and
less
ons
lear
ned
Food
Pol
icy
193
234–
254
De s
crip
tion
and
gu
idan
ceA
fric
aH
V. J.
Qui
nn19
94A
his
tory
of t
he p
olit
ics
of fo
od a
nd n
utri
tion
in M
alaw
i –
the
cont
ext
for
food
and
nut
riti
on s
urve
illan
ceFo
od P
olic
y19
325
5–27
1D
escr
ipti
onM
alaw
iH

APPEN
DIC
ES
49
Au
tho
rsY
ear
Tit
leJo
urn
alV
ol.
Issu
eP
ages
Sys
tem
des
crip
tio
n,
fin
din
gs o
r gu
idan
ce
Lo
cati
on
Fu
ll te
xt51
D. L
. Pel
leti
er a
nd
U. J
onss
on19
94T
he u
se o
f inf
orm
atio
n in
the
Irin
ga n
utri
tion
prog
ram
me
– so
me
glob
al le
sson
s fo
r nu
trit
ion
surv
eilla
nce
Food
Pol
icy
193
301–
313
Des
crip
tion
and
gu
idan
ceTa
nzan
iaH
D. P
elle
tier
and
F. J
ohns
on19
94T
he v
alid
ity
of c
linic
-bas
ed n
utri
tion
sur
veill
ance
dat
a:
A s
tudy
from
sel
ecte
d si
tes
in n
orth
ern
Mal
awi
Food
and
Nut
riti
on
Bul
l.15
Fi
ndin
gs a
nd g
uida
nce
Mal
awi
Link
M. L
awre
nce,
T. Y
imer
and
J.
K. O
’Dea
1994
Nut
riti
onal
sta
tus
and
earl
y w
arni
ng o
f mor
talit
y in
so
uthe
rn E
thio
pia,
198
8–19
91Eu
rope
an Jo
urna
l of
Clin
ical
Nut
riti
on48
138
–45
Find
ings
Ethi
opia
No
L. H
adda
d, E
. Ken
nedy
and
J.
Sulli
van
1994
Cho
ice
of in
dica
tors
for
food
sec
urit
y an
d nu
trit
ion
mon
itor
ing
Food
Pol
icy
193
329–
343
Gui
danc
eH
G. E
ele
19
94In
dica
tors
for
food
sec
urit
y an
d nu
trit
ion
mon
itor
ing:
A
rev
iew
of e
xper
ienc
e fr
om S
outh
ern
Afr
ica
Food
Pol
icy
193
314–
328
Des
crip
tion
and
gu
idan
ceSo
uthe
rn A
fric
aH
H. L
. Del
gado
and
M
. Pal
mie
ri19
94Se
ntin
el s
urve
illan
ce in
hea
lth
and
nutr
itio
n: e
xper
ienc
e in
Gua
tem
ala
Food
and
Nut
riti
on
Bul
l.15
303–
307
Des
crip
tion
Gua
tem
ala
Link
M. d
e G
uzm
an a
nd
W. M
olan
o 19
94N
utri
tion
indi
cato
rs fo
r de
velo
pmen
t: p
rior
ity
and
inte
rven
tion
effo
rts
Food
and
Nut
riti
on
Bul
l.15
325
0–6
Des
crip
tion
Phili
ppin
esLi
nk
S. C
. Bab
u an
d V.
J. Q
uinn
1994
Food
sec
urit
y an
d nu
trit
ion
mon
itor
ing
in A
fric
a:
Intr
oduc
tion
and
his
tori
cal b
ackg
roun
dFo
od P
olic
y19
321
1–21
7D
escr
ipti
onA
fric
aH
S. C
. Bab
u an
d
P. P
inst
rup-
And
erse
n19
94Fo
od s
ecur
ity
and
nutr
itio
n m
onit
orin
g: A
con
cept
ual
fram
ewor
k, is
sues
and
cha
lleng
esFo
od P
olic
y19
321
8–23
3 D
escr
ipti
on a
nd
guid
ance
H
D. T
aren
and
J. C
hen
1993
A p
osit
ive
asso
ciat
ion
betw
een
exte
nded
bre
ast-
feed
ing
and
nutr
itio
nal s
tatu
s in
rur
al H
ubei
Pro
vinc
e, P
eopl
e’s
Rep
ublic
of C
hina
Am
J C
lin N
utr
586
862–
7Fi
ndin
gsC
hina
E
N. B
. Moc
k an
d
W. E
. Ber
tran
d19
93C
once
ptua
l fra
mew
ork
for
nutr
itio
n su
rvei
llanc
e sy
stem
sB
ull.
of t
he P
an
Am
eric
an H
ealt
h O
rgan
izat
ion
273
254–
64D
escr
ipti
on a
nd
guid
ance
E
M. K
elly
1993
Ope
rati
onal
val
ue o
f ant
hrop
omet
ric
surv
eilla
nce
in
fam
ine
earl
y w
arni
ng a
nd r
elie
f: W
ollo
reg
ion,
Eth
iopi
a,
1987
–88
Dis
aste
rs17
148
–55
Find
ings
and
gui
danc
eEt
hiop
iaE
S. A
tkin
son
1993
Infa
nts
and
nutr
itio
n su
rvei
llanc
e in
Eth
iopi
aJ T
rop
Pedi
atr
395
306–
7Fi
ndin
gs a
nd g
uida
nce
Ethi
opia
E
S. N
. Zul
kifli
1992
Nut
riti
on p
rom
otio
n: t
he r
ole
of m
onit
orin
g ph
ysic
al
grow
thA
sia
Pac
J Pub
lic
Hea
lth
64
210–
6gu
idan
ceE
F. V
io, J
. Kai
n an
d E.
Gra
y19
92N
utri
tion
sur
veill
ance
– t
he c
ase
of C
hile
Nut
riti
on R
esea
rch
123
321–
335
Des
crip
tion
Chi
leN
o
D. L
. Pel
leti
er19
92T
he r
ole
of q
ualit
ativ
e m
etho
dolo
gies
in N
utri
tion
su
rvei
llanc
eR
apid
Ass
essm
ent
Proc
edur
esG
uida
nce
Link
T. S
hen
and
J.-P.
Hab
icht
1991
Nut
riti
on s
urve
illan
ce in
Chi
na: S
ourc
e of
info
rmat
ion
for
acti
onFo
od a
nd N
utri
tion
B
ull.
13D
escr
ipti
on a
nd
guid
ance
Chi
naLi
nk

NU
TR
ITIO
N S
URV
EILL
AN
CE
SYST
EMS
50
Au
tho
rsY
ear
Tit
leJo
urn
alV
ol.
Issu
eP
ages
Sys
tem
des
crip
tio
n,
fin
din
gs o
r gu
idan
ce
Lo
cati
on
Fu
ll te
xt51
D. L
. Pel
leti
er a
nd
L. A
. H. M
sukw
a19
91T
he u
se o
f nat
iona
l sam
ple
surv
eys
for
nutr
itio
n su
rvei
llanc
e: L
esso
ns fr
om M
alaw
i’s n
atio
nal s
ampl
e su
rvey
of a
gric
ultu
re
Soci
al S
cien
ce &
M
edic
ine
328
887–
898
Gui
danc
eE
W. J
ames
and
A. R
alph
1991
Wha
t is
nut
riti
on s
urve
illan
ce?
Proc
Nut
r So
c50
0365
3–65
9D
escr
ipti
onE
S. J.
Ism
ail
1991
Nut
riti
on s
urve
illan
ce: e
xper
ienc
es fr
om d
evel
opin
g co
untr
ies
Proc
Nut
r So
c50
367
3–9
Des
crip
tion
E
H. D
elga
do, P
. Pal
ma
and
M. F
isch
er
1991
The
use
of t
he h
eigh
t ce
nsus
of s
choo
lchi
ldre
n in
C
entr
al A
mer
ica
and
Pana
ma
Food
and
Nut
riti
on
Bul
l.13
117
–19
Des
crip
tion
Cen
tral
Am
eric
aLi
nk
M. A
mad
or a
nd
M. P
eem
19
91
Nut
riti
on a
nd h
ealt
h is
sues
in C
uba:
str
ateg
ies
for
a de
velo
ping
cou
ntry
Food
and
Nut
riti
on
Bul
l.13
4D
escr
ipti
onC
uba
Link
D. P
elle
tier
and
L. M
sukw
a19
90T
he r
ole
of in
form
atio
n sy
stem
s in
dec
isio
n-m
akin
g fo
llow
ing
disa
ster
s: le
sson
s fr
om t
he m
ealy
bug
dis
aste
r in
nor
ther
n M
alaw
i
Hum
an O
rgan
izat
ion
493
245–
254
Des
crip
tion
and
gu
idan
ceM
alaw
iN
o
S. M
acPh
erso
n 19
90So
cial
pol
icy
and
nutr
itio
n su
rvei
llanc
eSo
cial
Pol
icy
&
Adm
inis
trat
ion
24D
ec-9
025
4–25
7(n
ot s
een)
No
P. R
. Ken
ya19
90Su
rvei
llanc
e m
etho
dolo
gy fo
r pl
anni
ng, a
nd e
valu
atio
n of
nut
riti
onal
sta
tes
East
Afr
Med
J67
212
6–36
Gui
danc
eN
o
J. P.
Hab
icht
and
D
. L. P
elle
tier
1990
The
impo
rtan
ce o
f con
text
in c
hoos
ing
nutr
itio
nal
indi
cato
rsJ N
utr
120
Supp
l 11
1519
–24
Gui
danc
eE
R. C
. Bro
wn
1990
A s
impl
e sy
stem
of n
utri
tion
sur
veill
ance
for
Afr
ican
co
mm
unit
ies
J Tro
p Pe
diat
r36
416
2–4
Gui
danc
eE
G. B
eato
n, A
. Kel
ly,
J. K
evan
y, R
. Mar
tore
ll an
d J.
Mas
on
1990
Nut
riti
on s
urve
illan
ce: P
opul
atio
n Le
vel –
Tre
nd
Ass
essm
ent
(boo
k se
ctio
n)
App
ropr
iate
use
s of
ant
hrop
omet
ric
indi
ces
in c
hild
ren
Gui
danc
eE
J. A
rnau
ld, J
. Ala
rcon
and
M
. Im
min
k19
90Fo
od s
ecur
ity
and
food
and
nut
riti
on s
urve
illan
ce in
C
entr
al A
mer
ica:
the
nee
d fo
r fu
ncti
onal
app
roac
hes
Food
and
Nut
riti
on
Bul
l.12
126
–33
Gui
danc
eLi
nk
WH
O19
89G
uide
lines
for
the
Dev
elop
men
t of
a F
ood
and
Nut
riti
on S
urve
illan
ce S
yste
m fo
r C
ount
ries
in t
he
East
ern
Med
iter
rane
an R
egio
n
(Gui
de)
Gui
danc
eE
D. P
. Sin
ha19
89Fo
od a
nd n
utri
tion
sur
veill
ance
in t
he E
nglis
h-sp
eaki
ng
Car
ibbe
anB
ull P
an A
m H
ealt
h O
rgan
234
457–
60D
escr
ipti
onC
arib
bean
E
R. F
icht
ner,
K. S
ulliv
an,
F. T
row
brid
ge a
nd
B. C
arls
on
1989
Rep
ort
of t
he t
echn
ical
mee
ting
on
soft
war
e fo
r nu
trit
ion
surv
eilla
nce
Food
and
Nut
riti
on
Bul
l.11
N
/AL i
nk

APPEN
DIC
ES
51
Au
tho
rsY
ear
Tit
leJo
urn
alV
ol.
Issu
eP
ages
Sys
tem
des
crip
tio
n,
fin
din
gs o
r gu
idan
ce
Lo
cati
on
Fu
ll te
xt51
A. B
rien
d, K
. Z. H
asan
, K
. M. A
ziz,
B. A
. Hoq
ue
and
F. J.
Hen
ry
1989
Mea
suri
ng c
hang
e in
nut
riti
onal
sta
tus:
a c
ompa
riso
n of
di
ffere
nt a
nthr
opom
etri
c in
dice
s an
d th
e sa
mpl
e si
zes
requ
ired
Eur
J Clin
Nut
r43
1176
9–78
Gui
danc
eN
o
P. A
utie
r, J.
P. D
’Alt
ilia,
J.
P. D
elam
alle
and
V.
Ver
cruy
sse
1989
The
Foo
d an
d N
utri
tion
Sur
veill
ance
Sys
tem
s of
Cha
d an
d M
ali:
The
SA
P A
fter
Tw
o Ye
ars
Dis
aste
rs13
1Se
p–32
Des
crip
tion
Cha
d an
d M
ali
No
Ano
n19
89Fo
od a
nd n
utri
tion
sur
veill
ance
sys
tem
sB
ull P
an A
m H
ealt
h O
rgan
234
453–
7D
escr
ipti
on a
nd
guid
ance
E
M. I
mm
ink
1988
Com
mun
ity-
base
d fo
od a
nd n
utri
tion
sur
veill
ance
as
an
inst
rum
ent
of s
ocio
-eco
nom
ic d
evel
opm
ent
in C
entr
al
Am
eric
a: A
poi
nt o
f vie
w
Food
and
Nut
riti
on
Bul
l.10
4G
uida
nce
Link
J. G
orst
ein
and
J. A
kre
1988
The
use
of a
nthr
opom
etry
to
asse
ss n
utri
tion
al s
tatu
sW
orld
Hea
lth
Stat
Q41
248
–58
Gui
danc
eN
o
N. G
erei
n19
88Is
gro
wth
mon
itor
ing
wor
thw
hile
?H
ealt
h Po
licy
Plan
.3
318
1–19
4G
uida
nce
E
J. Sh
oham
1987
Doe
s nu
trit
ion
surv
eilla
nce
have
a r
ole
to p
lay
in e
arly
w
arni
ng o
f foo
d cr
isis
and
in t
he m
anag
emen
t of
rel
ief
oper
atio
ns
Dis
aste
rs11
428
2–28
5G
uida
nce
H
M. K
. Ser
dula
, D. H
erm
an,
D. F
. Will
iam
son,
N
. J. B
inki
n, J.
M. A
phan
e an
d F.
Tro
wbr
idge
1987
Val
idit
y of
clin
ic-b
ased
nut
riti
on s
urve
illan
ce fo
r pr
eval
ence
est
imat
ion
of u
nder
nutr
itio
nB
ull W
orld
Hea
lth
Org
an65
452
9–33
Gui
danc
eE
R. K
arim
and
K. A
hmad
1987
An
econ
omic
app
roac
h to
nut
riti
on s
urve
illan
ceB
angl
ades
h D
evel
opm
ent
Stud
ies
153
121–
125
Gui
danc
eE
J. G
. Haa
ga a
nd J.
B. M
ason
1987
Food
dis
trib
utio
n w
ithi
n th
e fa
mily
: Evi
denc
e an
d im
plic
atio
ns fo
r re
sear
ch a
nd p
rogr
amm
esFo
od P
olic
y12
214
6–16
0G
uida
nce
No
R. C
. Bro
wn
1987
Nut
riti
on s
urve
illan
ce b
y Q
UA
C s
tick
Tran
s R
Soc
Tro
p M
ed
Hyg
816
1038
–9G
uida
nce
E
V. V
alve
rde,
H. D
elga
do,
S. F
lore
s, R
. Sib
rian
and
M
. Pal
mie
ri
1986
Use
s an
d co
nstr
aint
s of
sch
ool c
hild
ren’
s he
ight
dat
a fo
r pl
anni
ng p
urpo
ses:
nat
iona
l exp
erie
nces
in C
entr
al
Am
eric
a
Food
Nut
r B
ull
8 3
42–
48
Des
crip
tion
and
gu
idan
ceC
entr
al A
mer
ica
Link
V. V
alve
rde,
H. D
elga
da,
R. F
lore
s, R
. Sib
rian
and
M
. Pal
mie
ri
1985
The
sch
ool a
s a
data
sou
rce
for
food
and
nut
riti
on
surv
eilla
nce
syst
ems
in C
entr
al A
mer
ica
and
Pana
ma
Food
Nut
r B
ull
74
32–7
Des
crip
tion
Cen
tral
Am
eric
aLi
nk
R. M
orga
n19
85T
he d
evel
opm
ent
and
appl
icat
ions
of a
Dro
ught
Ear
ly
War
ning
Sys
tem
in B
otsw
ana
Dis
aste
rs9
144
–50
Des
crip
tion
Bot
swan
aE

NU
TR
ITIO
N S
URV
EILL
AN
CE
SYST
EMS
52
Au
tho
rsY
ear
Tit
leJo
urn
alV
ol.
Issu
eP
ages
Sys
tem
des
crip
tio
n,
fin
din
gs o
r gu
idan
ce
Lo
cati
on
Fu
ll te
xt51
R.M
. Bro
oks,
D. A
buna
in,
D. K
arya
di, I
. Sum
arno
, D
. Will
iam
son,
M
.C. L
atha
m a
nd
J- P
. Hab
icht
1985
A t
imel
y w
arni
ng a
nd in
terv
enti
on s
yste
m fo
r pr
even
ting
food
cri
ses
in In
done
sia:
app
lyin
g gu
idel
ines
fo
r nu
trit
ion
surv
eilla
nce
Food
Nut
r (R
oma)
112
37–
43D
escr
ipti
onIn
done
sia
No
J.B. M
ason
, J-P
. Hab
icht
, H
. Tab
atab
ai a
nd
V. V
alve
rde
1984
Nut
riti
on s
urve
illan
ce(g
uide
)G
uida
nce
E
E. F
. Jel
liffe
and
D. B
. Jel
liffe
1984
Nut
riti
on s
urve
illan
ce –
nut
riti
on e
duca
tion
J Tro
p Pe
diat
r30
12
Apr
Gui
danc
eE
H. P
alti
and
I. B
elm
aker
1983
Nut
riti
on s
urve
illan
ce o
f chi
ldre
n in
mat
erna
l and
chi
ld
heal
th s
tati
ons
Har
efua
h10
512
422–
6(n
ot s
een)
No
J. B
. Mas
on a
nd
J. T.
Mit
chel
l19
83N
utri
tion
sur
veill
ance
Bul
l Wor
ld H
ealt
h O
rgan
615
745–
55G
uida
nce
E
J-P.
Hab
icht
and
J. M
ason
1983
Nut
riti
on s
urve
illan
ce: P
rinc
iple
s an
d Pr
acti
ce(b
ook
sect
ion)
N
utri
tion
in t
he
Com
mun
ity
Des
crip
tion
and
gu
idan
ceE
J. A
rand
a-Pa
stor
, M
. T. M
ench
u, C
. Tel
ler,
R
. Sib
rian
and
D. S
alce
do
1983
Food
and
Nut
riti
on S
urve
illan
ce S
yste
ms:
Sel
ecte
d M
etho
dolo
gica
l Adv
ance
sJ T
rop
Pedi
atr
291
23–2
7G
uida
nce
E
F. L
. Tro
wbr
idge
and
H
. C. S
tetl
er19
82R
esul
ts o
f nut
riti
onal
sta
tus
surv
eilla
nce
in E
l Sal
vado
r, 19
75-7
7B
ull W
orld
Hea
lth
Org
an60
343
3–40
Des
crip
tion
and
fin
ding
sEl
Sal
vado
rE
M. A
. And
erso
n19
82N
utri
tion
Sur
veill
ance
and
Fam
ine
Rel
ief
(boo
k se
ctio
n)
Fam
ine
in A
fric
aG
uida
nce
E
K. A
hmad
and
N. H
assa
n19
82O
n N
utri
tion
sur
veill
ance
in B
angl
ades
hB
angl
ades
h D
evel
opm
ent
Stud
ies
103
81–9
3D
escr
ipti
onB
angl
ades
hE
F. L
. Tro
wbr
idge
and
N
. Sta
ehlin
g19
81So
me
char
acte
rist
ics
of in
dica
tors
of n
utri
tion
al-s
tatu
s fo
r us
e in
scr
eeni
ng a
nd s
urve
illan
ce –
rep
lyA
mer
ican
Jour
nal o
f C
linic
al N
utri
tion
343
438–
439
Gui
danc
eE
J. M
ason
and
J. P
. Hab
icht
1981
Nut
riti
on s
urve
illan
cePr
ogre
ss in
clin
ical
and
bi
olog
ical
res
earc
h77
539–
47(n
ot s
een)
No
F. L
. Tro
wbr
idge
and
H
. C. S
tetl
er19
80N
utri
tion
al s
tatu
s su
rvei
llanc
e in
El S
alva
dor
Bul
l Wor
ld H
ealt
h O
rgan
582
327–
32D
escr
ipti
on a
nd
findi
ngs
El S
alva
dor
E
F. L
. Tro
wbr
idge
, L.
New
ton,
A. H
uong
, N
. Sta
ehlin
g an
d
V. V
alve
rde
1980
Eval
uati
on o
f nut
riti
on s
urve
illan
ce in
dica
tors
Bul
l Pan
Am
Hea
lth
Org
an14
323
8–43
Find
ings
and
gui
danc
eEl
Sal
vado
rE
J. P.
Hab
icht
1980
Som
e ch
arac
teri
stic
s of
indi
cato
rs o
f nut
riti
onal
sta
tus
for
use
in s
cree
ning
and
sur
veill
ance
Am
J C
lin N
utr
333
531–
5G
uida
nce
E

APPEN
DIC
ES
53
Au
tho
rsY
ear
Tit
leJo
urn
alV
ol.
Issu
eP
ages
Sys
tem
des
crip
tio
n,
fin
din
gs o
r gu
idan
ce
Lo
cati
on
Fu
ll te
xt51
C. H
. Daz
a an
d M
. S. R
ead
1980
Hea
lth-
rela
ted
com
pone
nts
of a
nut
riti
on s
urve
illan
ce
syst
emB
ull P
an A
m H
ealt
h O
rgan
144
327–
36G
uida
nce
E
C. H
. Tel
ler,
I. B
eghi
n an
d J.
del C
anto
1979
Popu
lati
on a
nd n
utri
tion
pla
nnin
g: t
he u
sefu
lnes
s of
de
mog
raph
ic d
isci
plin
e fo
r nu
trit
ion
polic
y in
Lat
in
Am
eric
a
Bul
l Pan
Am
Hea
lth
Org
an13
121
–32
Des
crip
tion
and
gu
idan
ceN
o
M. G
ebre
-Med
hin
1979
Nut
riti
on s
urve
illan
ce in
dev
elop
ing
coun
trie
s, w
ith
spec
ial r
efer
ence
to
Ethi
opia
(boo
k se
ctio
n)
Nut
riti
on a
nd G
row
th
(not
see
n)N
o
J. B
. Mas
on19
78A
gric
ultu
ral a
nd e
cono
mic
com
pone
nts
of n
utri
tion
su
rvei
llanc
eFo
od a
nd N
utri
tion
403
-Apr
21–J
un(n
ot s
een)
No
J. A
rand
a-Pa
stor
, M
. T. M
ench
u, R
. Pal
ma
and
J. P.
Kev
any
1978
Plan
ning
a fo
od a
nd n
utri
tion
sur
veill
ance
sys
tem
: the
ex
ampl
e of
Hon
dura
sA
m J
Publ
ic H
ealt
h68
874
8–50
Des
crip
tion
Hon
dura
sE
Ano
n19
77N
utri
tion
sur
veill
ance
in t
he O
gade
nLa
ncet
280
4491
1–2
Des
crip
tion
H
D. M
orle
y19
76N
utri
tion
sur
veill
ance
of y
oung
chi
ldre
n in
dev
elop
ing
coun
trie
sIn
t J E
pide
mio
l5
151
–5G
uida
nce
E
WH
O19
76M
etho
dolo
gy o
f nut
riti
on s
urve
illan
ce. R
epor
t of
a Jo
int
FAO
/UN
ICEF
/WH
O E
xper
t C
omm
itte
eW
orld
Hea
lth
Org
an
Tech
Rep
Ser
ies
593
Gui
danc
eE
J. B
. Mas
on19
75N
utri
tion
sur
veill
ance
Food
and
Nut
riti
on1
424
–Jul
(Not
see
n)N
o
Ano
n19
73N
utri
tion
sur
veill
ance
Lanc
et2
7821
166
Des
crip
tion
H
A2.
B U
NPU
BLIS
HED
DO
CU
MEN
TS
REL
AT
ING
TO
NU
TR
ITIO
N S
URV
EILL
AN
CE
Au
tho
rsY
ear
Tit
leIn
stit
uti
on
CD
C20
13In
tegr
ated
Mat
erna
l and
Chi
ld H
ealt
h an
d N
utri
tion
Sur
veill
ance
Sys
tem
Pro
posa
l, U
gand
aC
DC
S. C
. Bab
u
2013
Food
Sec
urit
y an
d N
utri
tion
Mon
itor
ing
Syst
ems
and
the
Food
Cri
sis:
Les
sons
from
the
Las
t T
hree
Dec
ades
IFPR
I
Gov
ernm
ent
of U
gand
a &
AC
F U
SA20
13N
utri
tion
Sur
veill
ance
Dat
a A
naly
sis
Kar
amoj
a, U
gand
a D
ec 2
009
- M
ay 2
012
AC
F
P. M
cKin
ney
2012
Rev
iew
of T
hree
Nut
riti
on s
urve
illan
ce M
odel
s in
Kar
amoj
a &
Uga
nda’
s st
rate
gy o
n N
utri
tion
sur
veill
ance
UN
ICEF
C. T
elle
r
2008
Tech
nica
l ass
essm
ent
of d
ata
qual
ity
and
info
rmat
ion
use
of t
he M
alaw
i int
egra
ted
nutr
itio
n an
d fo
od s
ecur
ity
surv
eilla
nce
syst
em.
Fina
l Rep
ort
to O
PC, M
alaw
i, an
d A
GN
/FA
O
FAO
F. P
. Phi
ri
2008
Eval
uati
on o
f the
Nut
riti
on S
urve
illan
ce P
rogr
amm
e in
Mal
awi
Uni
vers
ity
of M
alaw
i

NU
TR
ITIO
N S
URV
EILL
AN
CE
SYST
EMS
54
Au
tho
rsY
ear
Tit
leIn
stit
uti
on
A. v
an d
er H
eide
2008
Eval
uati
on o
f the
sus
tain
able
nut
riti
on r
ehab
ilita
tion
pro
ject
(SN
RP)
and
rev
iew
of t
he in
tegr
ated
nut
riti
on a
nd fo
od s
ecur
ity
surv
eilla
nce
syst
em (
INFS
SS)
Act
ion
agai
nst
Hun
ger
The
Ass
ocia
tion
of S
outh
-Eas
t A
sian
N
atio
ns20
08W
orks
hop
docu
men
ts fr
om a
Sem
inar
–Wor
ksho
p To
war
ds E
stab
lishi
ng a
Nut
riti
on S
urve
illan
ce S
yste
m in
the
ASE
AN
14–
18 Ju
ly
2008
* M
akat
i Cit
y, P
hilip
pine
sA
SEA
N
F. W
atso
n, C
. Dol
an, J
. Sho
ham
and
M
. Buc
hana
n-Sm
ith
20
06A
Rev
iew
of S
ave
the
Chi
ldre
n U
K’s
Nut
riti
on S
urve
illan
ce P
rogr
amm
e in
Eth
iopi
aN
utri
tion
Wor
ks
E. S
mit
h20
06N
utri
tion
sur
veill
ance
Sys
tem
s in
Ken
ya A
Rev
iew
and
Rec
omm
enda
tion
Rep
ort
Supp
orte
d by
UN
ICEF
ESA
R
E. S
mit
h20
06N
utri
tion
sur
veill
ance
Sys
tem
s in
Som
alia
A R
evie
w a
nd R
ecom
men
dati
on R
epor
t Su
ppor
ted
by U
NIC
EF E
SAR
A. B
aile
s20
06N
atio
nal N
utri
tion
Sur
veill
ance
sys
tem
: A R
evie
w a
nd R
ecom
men
dati
on R
epor
tSu
ppor
ted
by U
NIC
EF
Bot
swan
a
S. C
hota
rd
2005
Dev
elop
ing
Nut
riti
on S
urve
illan
ce w
ithi
n th
e fr
amew
ork
of E
OS
in E
thio
pia
UN
ICEF
Eth
iopi
a
Hel
en K
elle
r In
tern
atio
nal,
Indo
nesi
a20
04N
utri
tion
and
Hea
lth
Surv
eilla
nce
Syst
em C
lose
out
rep
ort
2003
HK
I
M. C
hopr
a, N
. Has
san,
W. K
lave
r, A
. Rah
man
and
S. d
e Pe
e20
04Ex
tern
al R
evie
w o
f the
Nut
riti
on s
urve
illan
ce P
roje
ct in
Ban
glad
esh
HK
I
N. P
rend
ivill
e
2003
Nut
riti
on a
nd fo
od s
ecur
ity
info
rmat
ion
syst
ems
in c
risi
s-pr
one
coun
trie
sIn
tern
atio
nal W
orks
hop
on
Food
Sec
urit
y in
Com
plex
Em
erge
ncie
s
J. Sh
oham
, F. W
atso
n an
d
C. D
olan
20
01T
he u
se o
f nut
riti
onal
indi
cato
rs in
sur
veill
ance
sys
tem
sN
utri
tion
Wor
ks, O
DI
G. M
arks
and
J. H
aas
1987
The
Indo
nesi
an F
ood
and
Nut
riti
on S
urve
illan
ce S
yste
m: A
rev
iew
of t
he d
evel
opm
ent,
cur
rent
sta
tus
and
futu
re d
irec
tion
sC
orne
ll U
nive
rsit
y
Cor
nell
Nut
riti
on S
urve
illan
ce
Prog
ram
1983
Surv
eilla
nce
Sum
mar
ies
No.
2C
orne
ll U
nive
rsit
y
UN
ICEF
and
Cor
nell
Nut
riti
on
surv
eilla
nce
Prog
ram
1982
Soci
al a
nd N
utri
tion
sur
veill
ance
in E
aste
rn &
Sou
ther
n A
fric
a, B
ackg
roun
d pa
pers
for
wor
ksho
p N
airo
bi, K
enya
17–
19 M
ay 1
982
UN
ICEF
J. M
ason
and
J. P
. Hab
icht
1981
Nut
riti
on s
urve
illan
ce, P
aper
pre
sent
ed a
t th
e X
IIth
Inte
rnat
iona
l Con
gres
s O
f Nut
riti
on, 1
7–21
Aug
ust
1981
, San
Die
go,
Cal
iforn
ia.
Cor
nell
Uni
vers
ity

APPEN
DIC
ES
55
APPENDIX B B.1 INTERNATIONAL TARGETS RELATED TO NUTRITION
MILLENNIUM DEVELOPMENT GOAL 1: ERADICATE EXTREME HUNGER AND POVERTY
Target 2. Halve, between 1990 and 2015, the proportion of people who suffer from hunger*
Indicators:1. Prevalence of underweight children under 5 years of age 2. Proportion of population below minimum level of dietary energy consumption
65TH WORLD HEALTH ASSEMBLY COMPREHENSIVE IMPLEMENTATION PLAN ON MATERNAL, INFANT AND YOUNG CHILD NUTRITION (MAY 2012)
(WHO, 2014a)
Six global targets to be achieved by 2025:• A 40% reduction of the global number of children under 5 who are stunted• A 50% reduction of anaemia in women of reproductive age• A 30% reduction of low birthweight• No increase in childhood overweight• Increase the rate of exclusive breastfeeding in the first six months up to at least 50%• Reduce and maintain childhood wasting to less than 5%
PROPOSED CORE INDICATORS TO TRACK THE ACHIEVEMENTS OF THE GLOBAL STRATEGY FOR WOMEN’S AND CHILDREN’S HEALTH
(WHO, 2014a)
Indicator Data sources
Collection frequency
Primary outcome indicators, monitoring progress towards the six global nutrition targets
Prevalence of low height-for-age in children under five years of age DHS, MICS, NSS, NNS
3-5 years
Prevalence of haemoglobin <11 g/dL in pregnant women DHS, MICS, NSS, NNS
3-5 years
Prevalence of haemoglobin <12 g/dL in non-pregnant women DHS, MICS, NSS, NNS
3-5 years
Prevalence of infants born <2500 g DHS, MICS, NSS, NNS
3-5 years
Prevalence of weight-for-height >2 SD in children under five years of age DHS, NNS 3-5 years
Prevalence of exclusive breastfeeding in infants aged six months or less DHS, MICS, NSS, NNS
3-5 years
Prevalence of low weight-for-height in children under five years of age DHS, MICS, NSS, NNS
3-5 years
* http://www.unmillenniumproject.org/goals/gti.htm#goal1

NU
TR
ITIO
N S
URV
EILL
AN
CE
SYST
EMS
56
Indicator Data sources
Collection frequency
Intermediate outcome indicators, monitoring conditions on the causal pathways to the targets
Prevalence of diarrhoea in children under 5 years of age DHS, MICS 3–5 years
Proportion of women aged 15–49 years with low body mass index (<18.5 kg/m2)* DHS, MICS 3–5 years
Number of births during a given reference period to women aged 15–19 years/1,000 females aged 15–19 years
DHS, MICS 3–5 years
Proportion of overweight and obese women 18+–49 years of age (body mass index ≥25 kg/m2)
DHS, MICS 3–5 years
Proportion of overweight in school-age children and adolescents 5–18 years (BMI-for-age >+1 SD)
School surveys, NNS
at least every 5 years
Process indicators, monitoring programmes and situation-specific progress
Proportion of children aged 6–23 months who receive a minimum acceptable diet DHS, MICS, NNS
3–5 years
Proportion of population using a safely managed drinking service DHS, MICS, WHS
3–5 years
Proportion of population using a safely managed sanitation service DHS, MICS, WHS
3–5 years
Proportion of pregnant women receiving iron and folic acid supplements DHS, MICS 3–5 years
Percentage of births in baby-friendly facilities NutriDash, GINA
annual
Proportion of mothers of children 0–23 months who have received counselling, support or messages on optimal breastfeeding at least once in the last year
NutriDash annual
Policy environment and capacity indicators, measuring political commitment
Number of trained nutrition professionals/100,000 population WHS annual
Number of countries with legislation/regulations fully implementing the International Code of Marketing of Breast-milk Substitutes (resolution WHA34.22) and subsequent relevant resolutions adopted by the Health Assembly
NutriDash, GINA
annual
Number of countries with maternity protection laws or regulations in place NutriDash, GINA
annual
DHS: Demographic Health Surveys MICS: Multiple Indicator Cluster Surveys NSS: National surveillance systems NNS: National nutrition surveysWHS: World Health Statistics (http://www.who.int/gho/publications/world_health_statistics/en/) NutriDash: UNICEF internal data collection platform. Global report to be published early 2015.GINA: Global database on the Implementation of Nutrition Action (http://www.who.int/nutrition/gina/en/)u/r: urban/rural
* Less than 2 SD below the mean body-mass-index-for-age in women aged 15–18 years.

APPEN
DIC
ES
57
B.2 DEFINITION, GOAL AND OBJECTIVES OF NUTRITION SURVEILLANCE SYSTEMS FROM THE MOST RECENT OFFICIAL GUIDANCE
(WHO, 2013c)
Definition
A food and nutrition surveillance system is a mechanism to transfer food and nutrition data into action through formulation, modification and application of the food and nutrition policy of a country.
Goal
The overall goal of a food and nutrition surveillance system is to provide regular and updated information on the nutritional conditions of a population and the influencing factors. This information will provide a basis for decisions made by those responsible for policy planning and the management of programmes relating to improvement of food consumption patterns and nutritional status.
The immediate objectives of a food and nutrition surveillance system are:
• to describe the nutritional status of the population, with particular reference to defined subgroups who are identified as being at risk; this will permit description of the character and magnitude of the nutrition problem and possible changes in these features
• to provide information that contributes to the analysis of causes and associated factors and therefore permits a selection of preventive measures, which may or may not be nutritional
• to promote decisions by governments concerning priorities and the disposal of resources to meet the needs of both ‘normal development’ and emergencies
• to enable predictions on the basis of current trends in order to indicate the probable evolution of nutritional problems. Considered in conjunction with existing and potential measures and resources, these will assist in the formulation of policies
• to monitor nutritional programmes and evaluate their effectiveness.
In emergency settings, the objectives specifically focus on the following:
• A warning system: This is used as a means of highlighting an evolving crisis.• Identification of appropriate response strategies: These may include non-food as well as food assistance to
address the underlying causes of malnutrition.• Triggering a response: Nutrition surveillance systems provide a trend analysis focusing on the magnitude of
change. This may trigger an in-depth assessment, which in turn may lead to a response.• Targeting: Nutrition information can help target areas that are more at risk or in greater need of assistance.• Identification of malnourished children: Some forms of surveillance can identify acutely malnourished children.

NU
TR
ITIO
N S
URV
EILL
AN
CE
SYST
EMS
58
B.3 NOTE ON THE RECENT GUIDANCE FROM WHO
In 2013 a guide was published by the World Health Organization Regional Office for the Eastern Mediterranean (WHO, 2013c). The main objective of this publication was to provide the technical background for the development of a national food and nutrition surveillance system. The terminology has changed since the first guidance (Mason et al, 1984), since food is now explicitly included in the name.
The WHO Eastern Mediterranean Region covers countries experiencing the full range of nutritional situations, from emergency (eg, Afghanistan, Somalia, Sudan, Syrian Arab Republic) through transition (eg, Tunisia, Morocco, Egypt, Libya) to high-income (eg, Bahrain, Saudi Arabia, United Arab Emirates, Qatar) where overweight and obesity are likely to be issues of concern.
Appendix B.2 above includes the definition, goal and objectives of nutrition surveillance systems taken from this publication. Some features to note:• A surveillance system is now defined in relation
to providing input to policy development and application. Providing input to decision-making is now a goal rather than part of the definition, as in previous guidance.
• It is a surveillance system which is being defined rather than surveillance (the activity) as in previous guidance.
• Furthermore, according to the definitions adopted in this review (see Chapter 2), what is being described here is an information system, rather than a surveillance system.
• The last of the objectives that are provided specifically for emergency settings – identification of malnourished children – moves from the concept of community surveillance to management of individuals (notwithstanding that the numbers of malnourished children could be argued to be a useful indicator for surveillance (see Chapter 3)).
The guidance has some valuable advice, particularly in Chapter 3, regarding setting up a system. For example: • New criteria are provided for selecting indicators
for inclusion in a system. As well as being SMART,52 the authors suggest that when change is to be measured, other properties of indicators become more important, and call for different criteria, SPICED – that is Subjective, Participatory, Interpreted and communicable, Cross-checked and compared, Empowering, and Diverse and disaggregated.
• There is a recommendation that a central surveillance unit should be established, to be specifically responsible for data collection, analysis and interpretation, and to serve as a reference and support for other national institutions engaged in surveillance (p.36).

APPEN
DIC
ES
59
APPENDIX CC.1 SOURCES OF BIAS, ADVANTAGES AND DISADVANTAGES FOR NUTRITION SURVEILLANCE OF THE VARIOUS APPROACHES TO COLLECTING ANTHROPOMETRIC DATA
Sources of primary data
1. Large-scale representative surveys
Potential bias from: None documented which affect nutrition data.
Pros: • Findings can be compared between countries• Data exists for other age groups apart from children• Generally good quality-control so findings are
perceived as being reliable• Data are generally made available in the public
domain for further analysis
Cons: • Expensive (see Chapter 5)• Only happen every five years or so• Takes a long time to get the findings after the survey• Often only provide information at national or sub-
national (regional) level – more detailed information is often needed when there is significant variation within the population of a region
2. Repeated cross-sectional surveys
Potential bias from:• Because of their cost, surveys are usually performed infrequently in the same area. This can lead to bias
because prevalence of nutritional disorders can change markedly with season. A misleading impression of the situation in an area may result from that area being surveyed during the ‘hungry season’ rather than before or after that period.
• Bias can also arise through sampling error if the sample size is not large enough or standard methods are not followed.
Pros: • Can get reliable prevalence rates• Findings are respected as reliable if they follow
standard methods, eg, SMART, which includes quality checks
• If repeated using the same methods in same population, can be used for trend analysis
Cons:• Expensive (see Chapter 5) as need high level of
technical expertise• Can be time consuming if population is widely
dispersed• Findings can be unreliable due to seasonality or from
not following recommended methods
continued overleaf

NU
TR
ITIO
N S
URV
EILL
AN
CE
SYST
EMS
60
3. Community-based sentinel sites
Potential bias from:• The selected sentinel villages can be surveyed repeatedly over prolonged periods, sometimes many years. During
the process of surveillance, the nutritional situation in the selected sites may become progressively different from the rest of community that they were chosen to represent. This is due to the inputs of the survey teams such as education, advice and counselling, treating illness, referral of malnourished children to a treatment programme, providing employment, and spending funds within the community (UNICEF, 2010a).
• Significant population movements over time invalidate the representativeness of the sentinel sites (Elder and Kiess, 2004).
Pros: • Sites can be selected to monitor specific livelihood
groups • Can be useful to indicate the need for a more
detailed nutrition survey• Fewer sites so can have more detail on causes• Quicker and cost less than traditional surveys in
which new sites are selected at each round because the households can be mapped and thus a random sample can be chosen rapidly and accurately
• Community members become familiar with the system and the data collectors
• Local teams mean community members can be involved, meaning the assessment can be more participatory than with surveys
Cons: • No standardised method so findings not perceived
as reliable. The extent of bias will vary according to environmental context and methods chosen, and this is not well researched
• Data quality can suffer without supervision• Do not provide reliable estimates of nutritional
status, they are only suitable for detecting trends• Even the trend data may be questioned as not
considered to be reliable • If the design is longitudinal (the same children
included each time) it is more complicated to calculate required sample size (compared to cross-sectional surveys)
• Can get community fatigue of the system
4. Data from schools
Potential bias from: Estimates of stunting from School Children Height Censuses and anthropometric surveys of preschool children will differ if:• the proportion of children entering first grade within a few years of the official entry age is lower than
about 80%• the School Children Height Census dataset is not complete and missing children do not occur at random.
Pros: • With adequate instructions, teachers can collect
high-quality data• Socio-economic data can also be collected through
the school (Valverde et al, 1985)• Low cost compared to surveys• Can be helpful to understand the influences on
obesity in children
Cons: • Young children are not included• If % attendance at school is low the data are not
representative

APPEN
DIC
ES
61
Sources of data from administrative systems
Potential source of bias for all these approaches: hospital and health facility-based reporting systems are rarely representative of the population (WHO, 2011). They are usually biased because of limited access and cost of health services. Also poor quality of measurements and varying case definitions can lead to bias.
1. Admissions data from feeding programmes and CMAM
Potential bias from: • If coverage is low and/or variable (eg, due to variable access of potential beneficiaries to feeding programmes)
data will not be representative of the complete population. • If the programme quality is low, the data quality will be low and not reliable.• If the reporting rate from programme centres is not consistent, trends can simply reflect changes in numbers of
centres reporting data.
Pros: • Can provide useful trend information if have good
coverage• Can provide useful findings on which groups are
most vulnerable, eg, age and geographical area
Cons: • Data from these are difficult to interpret • If coverage is low then an increase in admissions
could be simply due to coverage increasing• Needs constant follow-up and technical expertise to
maintain database and interpret data
2. Data from clinics
Potential bias from: • Many of the factors that affect attendance at health centres, such as household income, remoteness of the
household from facilities, gender, health status and religious affiliation, may also affect the nutritional status of the child. This leads to an underestimate of the scale of the nutritional problem.
• Not all children are weighed who come to the clinics.• Mainly younger children attend clinics (for vaccination) so an age bias is introduced.• Older children who attend are often sick, leading to an overestimate of the nutritional problem.
Pros: • Data are collected anyway, so no additional cost• As well as anthropometric data, other health data
can be collected including vaccination status, etc• Sentinel clinics can be purposively sampled to
monitor specific livelihood groups• Sentinel clinics can be useful to indicate the need for
a detailed nutrition survey
Cons: • Potential bias as above• Data quality may be poor as equipment and skills
may be poor (leading, eg, to poor calibration of scales, mistakes in plotting weight on the growth chart, and errors in data entry)
• Reporting incomplete, some repeated measurements• May need to provide incentives for staff• Staff need supervision
3. Data from the community
Potential bias from: • As for clinics above, if % attendance is low and/or variable (eg, due to variable access of potential beneficiaries)
and those attending are not representative of population, then data will not be representative of complete population.
Pros: • Data can be disaggregated by gender, age and
geographical area, and then provide useful findings on which groups are most vulnerable
• Can provide useful trend information if have good coverage
• Coverage of the children under five years of age is more comprehensive compared to clinic-based growth monitoring
Cons: • Data take a long time to be reported, eg, in Ethiopia
the data are late in being reported, taking 6–8 weeks (DFID, 2012)
• Coverage not 100%• Amount of bias due to low coverage is not known
each time, so difficult to interpret the data
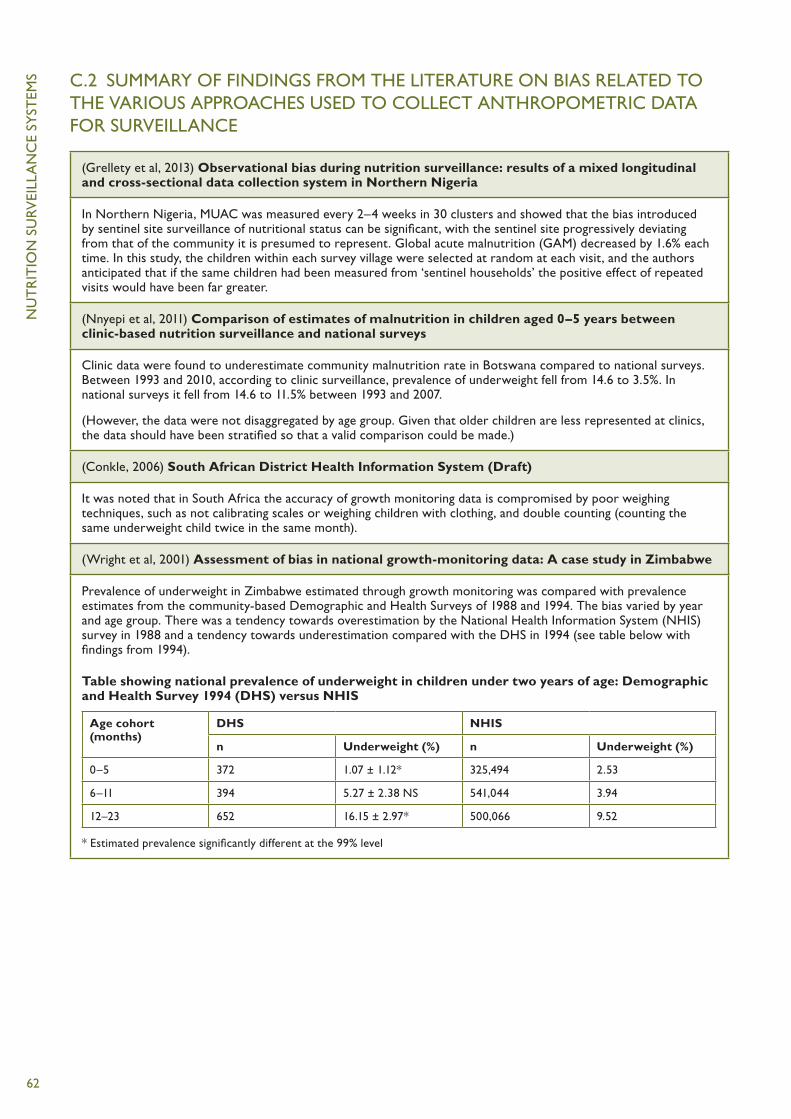
NU
TR
ITIO
N S
URV
EILL
AN
CE
SYST
EMS
62
C.2 SUMMARY OF FINDINGS FROM THE LITERATURE ON BIAS RELATED TO THE VARIOUS APPROACHES USED TO COLLECT ANTHROPOMETRIC DATA FOR SURVEILLANCE
(Grellety et al, 2013) Observational bias during nutrition surveillance: results of a mixed longitudinal and cross-sectional data collection system in Northern Nigeria
In Northern Nigeria, MUAC was measured every 2–4 weeks in 30 clusters and showed that the bias introduced by sentinel site surveillance of nutritional status can be significant, with the sentinel site progressively deviating from that of the community it is presumed to represent. Global acute malnutrition (GAM) decreased by 1.6% each time. In this study, the children within each survey village were selected at random at each visit, and the authors anticipated that if the same children had been measured from ‘sentinel households’ the positive effect of repeated visits would have been far greater.
(Nnyepi et al, 2011) Comparison of estimates of malnutrition in children aged 0–5 years between clinic-based nutrition surveillance and national surveys
Clinic data were found to underestimate community malnutrition rate in Botswana compared to national surveys. Between 1993 and 2010, according to clinic surveillance, prevalence of underweight fell from 14.6 to 3.5%. In national surveys it fell from 14.6 to 11.5% between 1993 and 2007.
(However, the data were not disaggregated by age group. Given that older children are less represented at clinics, the data should have been stratified so that a valid comparison could be made.)
(Conkle, 2006) South African District Health Information System (Draft)
It was noted that in South Africa the accuracy of growth monitoring data is compromised by poor weighing techniques, such as not calibrating scales or weighing children with clothing, and double counting (counting the same underweight child twice in the same month).
(Wright et al, 2001) Assessment of bias in national growth-monitoring data: A case study in Zimbabwe
Prevalence of underweight in Zimbabwe estimated through growth monitoring was compared with prevalence estimates from the community-based Demographic and Health Surveys of 1988 and 1994. The bias varied by year and age group. There was a tendency towards overestimation by the National Health Information System (NHIS) survey in 1988 and a tendency towards underestimation compared with the DHS in 1994 (see table below with findings from 1994).
Table showing national prevalence of underweight in children under two years of age: Demographic and Health Survey 1994 (DHS) versus NHIS
Age cohort (months)
DHS NHIS
n Underweight (%) n Underweight (%)
0–5 372 1.07 ± 1.12* 325,494 2.53
6–11 394 5.27 ± 2.38 NS 541,044 3.94
12–23 652 16.15 ± 2.97* 500,066 9.52
* Estimated prevalence significantly different at the 99% level

APPEN
DIC
ES
63
(Pelletier and Johnson, 1994) The validity of clinic-based nutrition surveillance data: A study from selected sites in northern Malawi
Taking into account seasonality, child’s age and statistical considerations, comparisons were made between clinic-based data and community-based data. Among infants, the clinic prevalence was significantly lower than the survey prevalence in three clusters, significantly higher in two clusters, and not significantly different in two. It is suggested that cross-sectional clinic-based data should be assumed invalid for targeting purposes unless proved otherwise in a given country.
(Solarsh et al, 1994) Community-based survey versus sentinel site sampling in determining the nutritional status of rural children. Implications for nutrition surveillance and the development of nutritional programmes
Sentinel clinics, schools and preschools are not representative of the community in KwaZulu Zone, South Africa. Data are provided showing the discrepancy in anthropometric status between survey and sentinel site samples. For stunting, wasting and underweight, of the nine comparisons using the chi-square test between survey rates, and clinic, preschool and school rates, eight were statistically significant. The disparity in age between the samples was identified as a possible cause for the differences in prevalence rates.
(Serdula et al, 1987) Validity of clinic-based nutrition surveillance for prevalence estimation of undernutrition
Clinic data were found to underestimate community malnutrition rates in Swaziland compared to national surveys. Age-adjusted prevalence of underweight among first-time clinic attenders (10%) was similar to that estimated by the 1983 National Nutritional Status Survey of Rural Swaziland (9.4%). But the prevalence of underweight among children attending two or more times in a year was 4.4%. Also regional differences detected in the national survey were not detected by the clinic-based nutrition surveillance system.
(Trowbridge and Stetler, 1980) Nutritional status surveillance in El Salvador
Compared to field survey data, undernutrition estimated from the countrywide system of outpatient clinics was overestimated because a large number of sick children were weighed as part of the scheme (no data provided).

NU
TR
ITIO
N S
URV
EILL
AN
CE
SYST
EMS
64
C.3 KEY OUTCOME INDICATORS USED IN NUTRITION SURVEILLANCE
Adapted from (NutritionWorks et al, 2011)
Anthropometric measurement or index
Indicator What it assesses
Bipedal pitting oedema Kwashiorkor, a form of severe acute malnutrition
Low Z-score of weight-for-height
Wasted53 Acute malnutrition
Low Z-score of height-for-age
Stunted54 Chronic malnutrition
Low Z-score of weight-for-age
Underweight55 Acute or chronic malnutrition or both
Low BMI (weight/height2) Thinness in adults and elderly56 Acute malnutrition
Low BMI-for-age Thinness in children aged 5–19y57 Acute malnutrition
Birthweight <2,500g Low birthweight58 Associated with poor nutrition in mothers and prematurity
MUAC Thinness in children59 Acute malnutrition
Biochemical and clinical indicators of micronutrient deficiencies
Low haemoglobin concentration
Pallor, tiredness, breathlessness Micronutrient deficiency
Low serum retinol concentration
Night blindness Bitot’s spots
Vitamin A deficiency (xeropthalmia)
Low urinary iodine concentration
Goitre, cretinism, hypothyroidism Iodine deficiency
Scurvy: painful joints, minute haemorrhages around hair follicles, swollen and bleeding gums, delayed healing
Vitamin C deficiency
Beriberi: Eight clinically recognisable signs of wet or dry beriberi, five in adults, three in children
Thiamine deficiency (Vitamin B1)
Pellagra: dermatitis, dementia, diarrhoea and death, in extreme cases, Cassal’s necklace
Niacin deficiency (Vitamin B2)

APPEN
DIC
ES
65
C.4 EXAMPLES OF INDICATORS OF CAUSES OF MALNUTRITION USED IN NUTRITION SURVEILLANCE
Adapted from (NutritionWorks et al, 2011)
Caring practices
Infant feeding practices
Breastfeeding practices, initiation, exclusive duration, introduction of other liquids and solids, use of bottles, reason for stopping breastfeeding
Complementary feeding
Age at which complementary foods introduced, types and preparation methods
Young child feeding Foods fed to young children, number of meals per day, snacks, feeding methods, eg, sharing plates
Home health practices
Treatment of simple childhood illness, traditional treatments
Hygiene practices Hand washing practices, disposal of child faeces, availability of soap, etc
Food preparation and storage
Food preparation, storage, cooking
Health status
Morbidity From anthropometric surveys: sickness of child in last two weeks, and from health workers: major diseases in the under-5 and general population, main causes of death, endemic diseases, seasonal outbreaks, epidemic history
Vaccination status and supplementation coverage
Coverage of main vaccines and supplementation of vitamin A for children.60 Coverage of iron and folic acid supplementation for pregnant women.
Water and sanitation
Water Source: protected or not, containers used to carry and store water, treatment such as boiling or chlorination, amount consumed per day, distance to source
Sanitation Facilities available, condition, number of people using latrine, distance to latrines, male and female facilities
Food security
Access to food Market prices, terms of trade, household income, perception of food insecurity, eg, Household Hunger Index, dietary diversity
Utilisation of food Intra-household distribution, meal frequency, food preference, gender issues
Coping strategies Strategies households undertake to meet their food needs – whether these strategies are normal (seasonal sale of assets, livestock cereal), reversible (switching to less-preferred foods), destructive (selling of productive assets) or crisis strategies (moving to search for food). The Coping Strategy Index is a common tool

NU
TR
ITIO
N S
URV
EILL
AN
CE
SYST
EMS
66
C.5 STAKEHOLDERS OF NUTRITION SURVEILLANCE SYSTEMS, AND THE TASKS FOR WHICH THEY CAN USE SURVEILLANCE INFORMATION
Adapted from (FAO, 1998; WHO, 2013c; Barnett and Edwards, 2014)
Stakeholder Objective Examples of application of information
Ministers and civil servants and in government (national level) Nutrition; Health; Food; Environment; Finance; Agriculture; Fisheries; Development; Trade/Planning; Statistics; Office of the President or Prime Minister
1444 & 57
Estimate extent and distribution of malnutrition Develop/amend policyIdentify crisesResource allocationMonitor progress
Government officials and technical staff at sub-national levels (provinces and districts)
1 & 2457
Nutrition and food security researchPlanning Plan and day-to-day management of interventions Monitoring
Health sector (national, district and local)
4555
Develop /amend policy Monitor nutrition service delivery and health worker performanceDevelop programmes (eg, nutrition education, health promotion, food safety) and servicesPatient monitoring, advice and education Data collection
Non-governmental organisations (international, national, district and local)
1134 & 5510
Estimate extent and distribution of malnutritionIdentify populations at riskAdvocacyInform resource allocationProgramme planning and monitoringAccountability
Inter-governmental organisations (eg, UNICEF)
114 & 5710
Estimate extent and distribution of malnutritionIdentify populations at riskInform resource allocationMonitor progressAccountability
Donors 14 & 5
Estimate extent and distribution of malnutrition Resource allocation
Academic institutions (local and international) and statisticians at the national statistics office
9999
Prioritise research directionsCollect and analyse research dataDisseminate findings TeachingData collection
Training institutions 9 Teaching
Media 9 Raise awareness
Food industry 9 Food labelling Food marketing
Civil society 310
AdvocacyAccountability
General public Information, advice, education (recipients of)Participants in data collection

APPEN
DIC
ES
67
APPENDIX DD.1 NOTE ON THE LQAS METHOD
Given the high cost of good-quality surveys, there have been initiatives to develop survey designs which involve smaller samples without too much loss of precision. It has long been recognised that fewer than 30 clusters may result in point prevalence estimates for malnutrition that greatly differ from the true prevalence (Binkin et al, 1992), so the effort has been directed towards reducing the number of individuals per cluster. For immunisation coverage, the WHO ‘30 by 7’ cluster surveys were introduced in 1978 and coverage estimates are assumed to be within ± 10% of the true value. Attention has been focused on similar designs for nutrition surveys in the last decade; for example, three new sampling designs were described in 2009 (FANTA-2 Project, 2009): • 33 Ï 6 (33 clusters, 6 observations in each:
n=198)• 67 Ï 3 (67 clusters, 3 observations in each:
n=201) • A sequential design (up to 67 clusters,
3 observations in each: n ≤ 201).
These are hybrid designs, combining aspects of cluster sampling and analysis, with lot quality assurance sampling (LQAS) analysis. LQAS is a method derived for quality control purposes in manufacturing industry. It has been applied for the past 30 years or so to assess public health parameters and evaluate programme outcomes, and interest has grown during the last decade in its application to assess levels of malnutrition. Conventional surveys provide an estimate of the rate of a binary indicator, while with LQAS one simply classifies the prevalence as exceeding or not exceeding pre-established threshold values, eg, 15% for acute malnutrition.
The LQAS method was trialled by FSNAU (Oguta et al, 2008), and adopted by ACF International, for example in:• Malakal, South Sudan: 33 clusters Ï 6 children
= 198 (Government of South Sudan and ACF International, 2008)
• Garissa and Mandera, Kenya: 33 clusters Ï 6 children = 198 children in each site (ACF International, 2009c)
• Mathare, Kenya: 33 clusters Ï 6 children = 198 children (ACF International, 2009b)
• West Pokot Country, South Sudan: 25 clusters Ï 12 = 300 households (ACF International, 2013)
• Karamoja, Uganda: 25 clusters Ï 12 households = 300 households per district (ACF USA, 2010)
Recently, ACF data from Kenya and South Sudan were used to demonstrate how cluster LQAS designs can be used in nutrition surveillance systems to detect changes in the prevalence of malnutrition (Hund and Pagano, 2014).
Interpreting findings from surveys using the LQAS method is not straightforward. The statistical approach taken for tests using the LQAS approach is perhaps counter-intuitive for those trained in classical statistical techniques. Traditionally, one constructs a null hypothesis that an effect does not exist, and then requires strong evidence to reject this hypothesis, and uses an alpha threshold of 5%.61 For LQAS in nutrition surveys, the null hypothesis is that acute malnutrition is greater or equal to the threshold, and therefore the statistical test needs strong evidence in order to reject the null hypothesis that the prevalence rate is dangerously high. Perhaps to counter this tendency, the alpha threshold is set at 10%.
Nevertheless, it has been argued (Bilukha and Blanton, 2008) that the LQAS test is prone to producing false-positive results62 and likely to suggest the need for interventions in situations where they may not be needed. Conversely, others have warned that LQAS tests can be used, either by design or lack of understanding, to produce findings which are misleading and potentially damaging to vulnerable populations. They argued that type 1 and type 2 errors are inappropriately designated, and that this biases findings towards concluding that no intervention is needed63 (Rhoda et al, 2010).
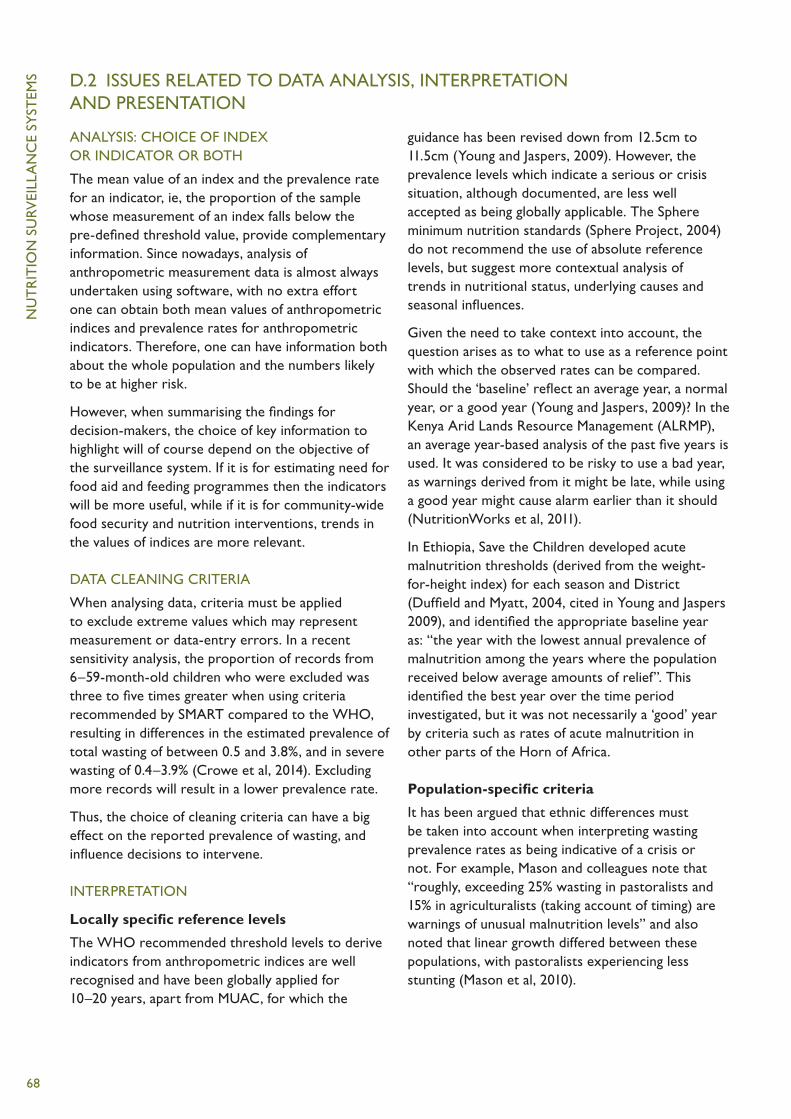
NU
TR
ITIO
N S
URV
EILL
AN
CE
SYST
EMS
68
D.2 ISSUES RELATED TO DATA ANALYSIS, INTERPRETATION AND PRESENTATION
ANALYSIS: CHOICE OF INDEX OR INDICATOR OR BOTH
The mean value of an index and the prevalence rate for an indicator, ie, the proportion of the sample whose measurement of an index falls below the pre-defined threshold value, provide complementary information. Since nowadays, analysis of anthropometric measurement data is almost always undertaken using software, with no extra effort one can obtain both mean values of anthropometric indices and prevalence rates for anthropometric indicators. Therefore, one can have information both about the whole population and the numbers likely to be at higher risk.
However, when summarising the findings for decision-makers, the choice of key information to highlight will of course depend on the objective of the surveillance system. If it is for estimating need for food aid and feeding programmes then the indicators will be more useful, while if it is for community-wide food security and nutrition interventions, trends in the values of indices are more relevant.
DATA CLEANING CRITERIA
When analysing data, criteria must be applied to exclude extreme values which may represent measurement or data-entry errors. In a recent sensitivity analysis, the proportion of records from 6–59-month-old children who were excluded was three to five times greater when using criteria recommended by SMART compared to the WHO, resulting in differences in the estimated prevalence of total wasting of between 0.5 and 3.8%, and in severe wasting of 0.4–3.9% (Crowe et al, 2014). Excluding more records will result in a lower prevalence rate.
Thus, the choice of cleaning criteria can have a big effect on the reported prevalence of wasting, and influence decisions to intervene.
INTERPRETATION
Locally specific reference levels
The WHO recommended threshold levels to derive indicators from anthropometric indices are well recognised and have been globally applied for 10–20 years, apart from MUAC, for which the
guidance has been revised down from 12.5cm to 11.5cm (Young and Jaspers, 2009). However, the prevalence levels which indicate a serious or crisis situation, although documented, are less well accepted as being globally applicable. The Sphere minimum nutrition standards (Sphere Project, 2004) do not recommend the use of absolute reference levels, but suggest more contextual analysis of trends in nutritional status, underlying causes and seasonal influences.
Given the need to take context into account, the question arises as to what to use as a reference point with which the observed rates can be compared. Should the ‘baseline’ reflect an average year, a normal year, or a good year (Young and Jaspers, 2009)? In the Kenya Arid Lands Resource Management (ALRMP), an average year-based analysis of the past five years is used. It was considered to be risky to use a bad year, as warnings derived from it might be late, while using a good year might cause alarm earlier than it should (NutritionWorks et al, 2011).
In Ethiopia, Save the Children developed acute malnutrition thresholds (derived from the weight-for-height index) for each season and District (Duffield and Myatt, 2004, cited in Young and Jaspers 2009), and identified the appropriate baseline year as: “the year with the lowest annual prevalence of malnutrition among the years where the population received below average amounts of relief”. This identified the best year over the time period investigated, but it was not necessarily a ‘good’ year by criteria such as rates of acute malnutrition in other parts of the Horn of Africa.
Population-specific criteria
It has been argued that ethnic differences must be taken into account when interpreting wasting prevalence rates as being indicative of a crisis or not. For example, Mason and colleagues note that “roughly, exceeding 25% wasting in pastoralists and 15% in agriculturalists (taking account of timing) are warnings of unusual malnutrition levels” and also noted that linear growth differed between these populations, with pastoralists experiencing less stunting (Mason et al, 2010).

APPEN
DIC
ES
69
Need for age-specific criteria
It is increasingly recommended that data should be disaggregated and different reference levels used for different age groups, particularly for:• prevalence of wasting (low WHZ), GAM (low
WHZ and oedema) and mean WFH for children above and below 2 years. This is because as the prevalence of low WFH increases, there is a greater relative increase in wasting among older children than younger children, which implies a different causality. Low WFH in older children is more likely to be a result of increasing food insecurity, as an increase in disease levels would affect young children more than older children (Young and Jaspers, 2009, p.72)
• prevalence of stunting (low HAZ) for children above and below 2 years.
Presentation of findings
The traditional method of presenting descriptive statistics is to provide the estimated population value that has been derived from the sample, together with a 95% confidence interval, which gives the range within which it is practically certain that the true population value lies.
As an alternative approach, it has been suggested that the probability of an indicator’s exceeding the threshold should be reported as a direct measure of ‘risk’, to provide information that is more useful for decision-making (Bilukha and Blanton, 2008). This approach to analysis has been used to good effect by ACF in Uganda. The table in Appendix D.3 below is taken from a report of the system in Karamoja (ACF USA, 2011). The columns for each district show the probability of exceeding the threshold values on the left-hand side of the table. Taking 85% probability as the threshold, in Nakapiripirit district for example, there was 85% probability that GAM exceeds 18%.

NU
TR
ITIO
N S
URV
EILL
AN
CE
SYST
EMS
70
D.3 EXAMPLE FROM UGANDA OF APPLICATION OF PROBABILITY THRESHOLDS FOR GAM PREVALENCE
Threshold value
Kaabong Kotido Abim Moroto Napak
Amudat Nakapiripirit
5.0% 100% 100% 100% 100% 100% 100%
7.0% 84% 100% 85% 100% 99% 100%
7.5% 74% 100% 76% 100% 98% 100%
10.0% 20% 99% 22% 93% 80% 100%
11.0% 9% 95% 10% 84% 65% 100%
12.0% 4% 87% 4% 71% 48% 100%
12.5% 2% 80% 0% 63% 40% 100%
15.0% 0% 33% 0% 26% 12% 99%
17.5% 0% 6% 0% 7% 3% 89%
18.0% 0% 4% 0% 5% 2% 85%
20.0% 0% 1% 0% 2% 1% 57%
22.5% 0% 0% 0% 0% 0% 20%
25.0% 0% 0% 0% 0% 0% 4%
NB The probabilities listed in the columns were estimated using the CDC probability calculator (ACF USA, 2011)
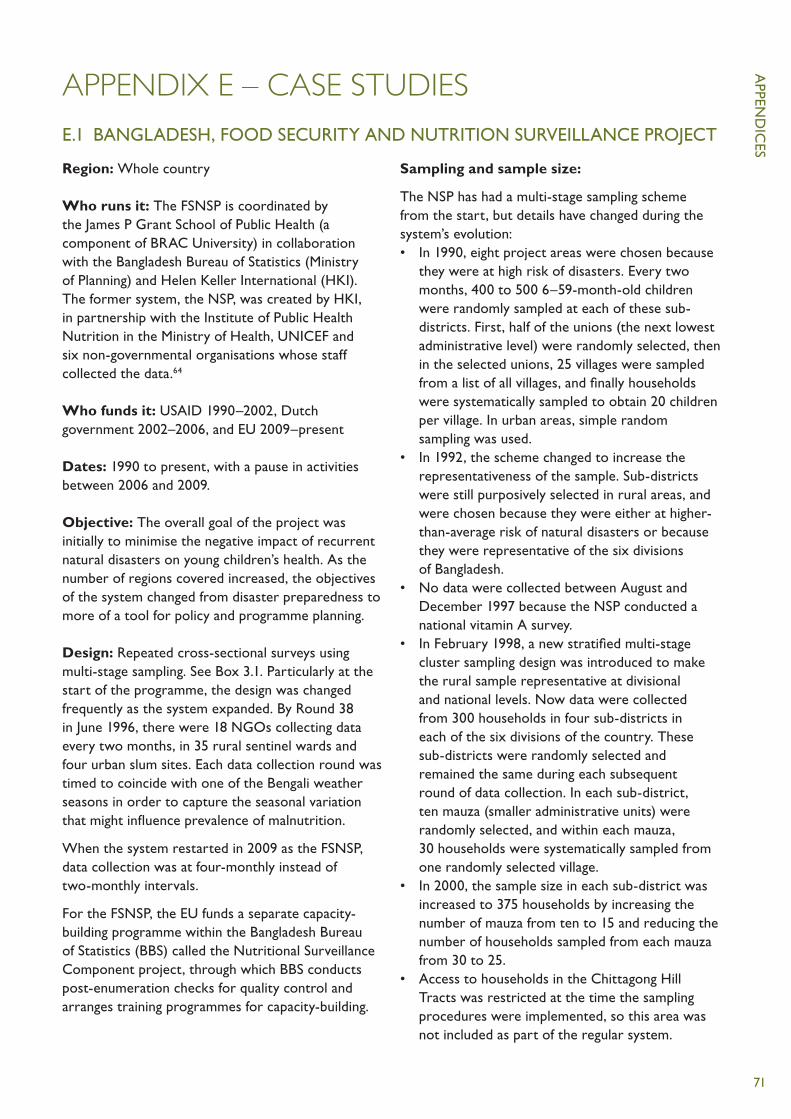
APPEN
DIC
ES
71
APPENDIX E – CASE STUDIESE.1 BANGLADESH, FOOD SECURITY AND NUTRITION SURVEILLANCE PROJECT
Region: Whole country
Who runs it: The FSNSP is coordinated by the James P Grant School of Public Health (a component of BRAC University) in collaboration with the Bangladesh Bureau of Statistics (Ministry of Planning) and Helen Keller International (HKI). The former system, the NSP, was created by HKI, in partnership with the Institute of Public Health Nutrition in the Ministry of Health, UNICEF and six non-governmental organisations whose staff collected the data.64
Who funds it: USAID 1990–2002, Dutch government 2002–2006, and EU 2009–present
Dates: 1990 to present, with a pause in activities between 2006 and 2009.
Objective: The overall goal of the project was initially to minimise the negative impact of recurrent natural disasters on young children’s health. As the number of regions covered increased, the objectives of the system changed from disaster preparedness to more of a tool for policy and programme planning.
Design: Repeated cross-sectional surveys using multi-stage sampling. See Box 3.1. Particularly at the start of the programme, the design was changed frequently as the system expanded. By Round 38 in June 1996, there were 18 NGOs collecting data every two months, in 35 rural sentinel wards and four urban slum sites. Each data collection round was timed to coincide with one of the Bengali weather seasons in order to capture the seasonal variation that might influence prevalence of malnutrition.
When the system restarted in 2009 as the FSNSP, data collection was at four-monthly instead of two-monthly intervals.
For the FSNSP, the EU funds a separate capacity-building programme within the Bangladesh Bureau of Statistics (BBS) called the Nutritional Surveillance Component project, through which BBS conducts post-enumeration checks for quality control and arranges training programmes for capacity-building.
Sampling and sample size:
The NSP has had a multi-stage sampling scheme from the start, but details have changed during the system’s evolution:• In 1990, eight project areas were chosen because
they were at high risk of disasters. Every two months, 400 to 500 6–59-month-old children were randomly sampled at each of these sub-districts. First, half of the unions (the next lowest administrative level) were randomly selected, then in the selected unions, 25 villages were sampled from a list of all villages, and finally households were systematically sampled to obtain 20 children per village. In urban areas, simple random sampling was used.
• In 1992, the scheme changed to increase the representativeness of the sample. Sub-districts were still purposively selected in rural areas, and were chosen because they were either at higher-than-average risk of natural disasters or because they were representative of the six divisions of Bangladesh.
• No data were collected between August and December 1997 because the NSP conducted a national vitamin A survey.
• In February 1998, a new stratified multi-stage cluster sampling design was introduced to make the rural sample representative at divisional and national levels. Now data were collected from 300 households in four sub-districts in each of the six divisions of the country. These sub-districts were randomly selected and remained the same during each subsequent round of data collection. In each sub-district, ten mauza (smaller administrative units) were randomly selected, and within each mauza, 30 households were systematically sampled from one randomly selected village.
• In 2000, the sample size in each sub-district was increased to 375 households by increasing the number of mauza from ten to 15 and reducing the number of households sampled from each mauza from 30 to 25.
• Access to households in the Chittagong Hill Tracts was restricted at the time the sampling procedures were implemented, so this area was not included as part of the regular system.

NU
TR
ITIO
N S
URV
EILL
AN
CE
SYST
EMS
72
• However, the system’s design was flexible, in that extra areas could be included for individual rounds, so the Chittagong Hill Tracts could be included when the need arose and access was possible. After the severe flood in 1998, flood-affected areas outside the regular NSP sites were included to assess the impact of the flood.
For the FSNSP:
• The sampling frame consists of seven surveillance zones: six based in the major agro-ecological areas of Bangladesh, with the seventh including everywhere else. Depending on the size of the village being sampled, every fifth or tenth house in a village is interviewed.
• In 2012, more than 27,000 households and 13,000 children aged 0–59 months were included.
• As for the NSP, the design of the FSNSP is flexible. For example, USAID fund ‘over-sampling’ in their ‘Feed the Future’ zones.
Data collected:
For the NSP, data were collected every two months by the Institute of Public Health Nutrition (IPHN) and the local NGO. Training, field supervision, quality control, data management and analysis were the responsibility of HKI.
A household was eligible for inclusion if it contained at least one physically able child aged less than 5 years and if the mother was present. A structured coded questionnaire was used to record data on children aged between 6 and 59 months, including anthropometric measurements, date of birth, sex, symptoms of night blindness, diarrhoea and acute respiratory tract infection, breastfeeding and child-feeding practices, and receipt of vitamin A capsules. The mother of the child or other adult member of the household provided information on the household’s composition, parental education, occupation of the main household earner, sanitary conditions, land ownership, food production and consumption, expenditure, exposure to natural disasters and domestic crises.
There was an intensive quality control system in place including random re-administration of 10% of the questionnaires by HKI quality control officers.
Modules were sometimes added to the regular questionnaire; for example, an extra module was added to investigate strategies that were
effective in increasing vitamin A capsule coverage among children.
For the FSNSP, in each household, one non-pregnant woman aged 10–49 years is randomly selected to be interviewed about her diet and to have her height, weight and mid upper arm circumference (MUAC) measured. Also, all pregnant women are interviewed about their diet and the care they have received during their pregnancy, and their MUAC measured. In addition, if the youngest child in the household is younger than six months old, that child’s mother is asked about the care she received during her pregnancy with this child.
In each household with a child less than 5 years of age, child caregivers are asked about the care and feeding practices for the youngest child in the household. Caregivers are also asked about recent childhood illnesses, and, if the child is reported to have been ill, about care during the child’s illness. The height, weight and MUAC of all children under 5 years of age in the household are recorded.
Food insecurity is assessed by Household Food Insecurity Access Scale (HFIAS), Food Deficit Scale (FDS) and Food Consumption score. Also the market prices of food and other consumables are collected.
At present, 50% of the data are collected using personal digital assistants (PDAs), and there are plans to adopt Android-based tablets that will include the facility for geo-location and simultaneous data cleaning.
Quality control officers revisit 5–10% of households without prior notice within 48 hours of data collection by the field teams and recollect data including anthropometric measurements. This internal FSNSP system is supplemented by a 10% post-enumeration check by staff from the Bangladesh Bureau of Statistics, who administer a shortened questionnaire.
Data analysis:
For the NSP, staff of partner NGOs received training to enter data using a standard entry package. Data were sent to HKI in batches, which were then merged, cleaned, reviewed and analysed by the Analysis and Reporting Unit team.
For the FSNSP, data entry from paper questionnaires, and data importation from PDAs are done

APPEN
DIC
ES
73
concurrently with data collection. Data from the two sources are merged, then data management officers review, edit and clean the data. For analysis, estimates are weighted using sampling weights based on each household’s probability of selection. All estimations during analysis take account of the complex sampling design.
Outputs:
Through the 1990s, a range of publications were produced as outputs based on the data collected in the NSP, ranging from special reports on topics of policy relevance such as seasonality of birth, the situation in urban areas, gender and refugee health status, special reports on the impact of individual disasters such as floods and cyclones, annual reports, and reports of individual rounds, etc.
After an expansion of sample size from 7,200 to 9,000 from Round 60 in the year 2000, a new series of 20 bulletins were produced on topics of practical interest until the project ended in 2006. These were written in the style of discussion papers, using data from the NSP; each cited only a few references, and were written in non-technical language. Again, these identified the practical implications of the findings from the system.
Findings derived from data collected via the system were also often reported in the academic and international development literature.
For the FSNSP, findings from each round are reported separately in bulletins, and annual reports are produced each year following discussions with the Technical Consultative Group, which has representatives from the UN, government, NGOs and health agencies. Also there are advocacy meetings and workshops; results are publicised via electronic (TV/radio/internet) and news media (newspapers), and staff participate in key national events related to nutrition and food security.
Use of information:
See Boxes 5.2, 5.3 and 5.4.
From the start, rounds of data collection took place six times a year, and thus the data could be used to elucidate seasonal variation in nutritional outcome variables including wasting, underweight, stunting and night-blindness together with socio-economic and demographic exposure variables.
Notes:
The NSP was never ‘institutionalised’. HKI tried to build capacity in the IPHN through secondment of staff, but this had little effect since government policy is to regularly transfer personnel between functions after a number of years. When the FSNSP started in 2009, the process of institutionalisation was not delineated, but at least this time it was identified as an activity in the programme that needed separate support, parallel to the support for the surveillance activities of data collection, analysis, interpretation and communication. The process of transferring the FSNSP to BBS has started, though the exact manner by which this will happen remains to be finalised.
It appears that findings from the FSNSP are underused, and this was reported to be due to poor timeliness of reporting, the technical style of the reports, and lack of awareness that the system exists. The most frequent criticism was that the reports are not sufficiently ‘user friendly’ for non-technical people. This is due to the complexity of the methods used, and of the resulting dataset, and due to the decision to report all the findings in one single document.
Key informants made several suggestions for more effective communication of findings including: local workshops; translation of reports into local languages; creation of two types of bulletins (the first with simple descriptive findings which would be produced very quickly, and the second following more sophisticated analysis and including more interpretation and commentary); and creation of bulletins focusing on topics of policy interest such as seasonality and gender. The perception was that the FSNSP could be used much more effectively for advocacy if there was more investment in communication, and that this should be a priority in future planning.
Present day:
Representatives from donors, NGOs, and UN agencies alike all described how the FSNSP fills a gap left by the larger national surveys such as Bangladesh DHS, MICS and the Household Income and Expenditure Survey which take place every few years. They provided numerous examples of how the data from the FSNSP are used for targeting, to draft situation analyses, undertake plausibility evaluations of programmes and frame policy. To date, health information systems are relatively poorly developed

NU
TR
ITIO
N S
URV
EILL
AN
CE
SYST
EMS
74
in Bangladesh compared to other countries, and growth monitoring is starting almost from scratch. Until the adoption of services offered by community clinics increases, and there is a consistent flow of reliable nutrition information from them, the FSNSP will be needed to provide systematic nutritional data for policy-makers and programme planners. The FSNSP has the advantage over the large-scale national surveys of collecting food security and nutrition data from the same households, and also, with three rounds a year, it provides evidence of seasonal variation in key variables.
However, given the number of surveys taking place in Bangladesh, there is almost certainly duplication in data collected. There is a tradition of collecting data and a respect for it in Bangladesh, which means the country is awash with data, and there is probably more potential for triangulation and cross-checking findings in Bangladesh than in any other low-income country in the world.
The nutrition and food security situation in Bangladesh has improved considerably over the past 20 years. So as long as the large national surveys continue, a case could be made to focus the more regular surveillance system on only the most vulnerable areas, and have a mix of thick and thin rounds whereby the very detailed collection only occurs once a year for example. The future need would also appear to be for a system which includes key additional indicators such as anaemia, and for which the findings could be disaggregated to a more local level in vulnerable areas.
Sources:
(Bloem et al, 1995; Bloem et al, 2003; Torlesse et al, 2003; Akhter and Haselow, 2010; Helen Keller International, 2011; Helen Keller International and BRAC Institute of Global Health, 2014; and key-informant interviews)
A community health worker measures the mid upper arm circumference of 21-month-old Shanto in Borhamuddin Upazilla, Bhola, Bangladesh.
PHO
TO
: SH
AFI
QU
L A
LAM
KIR
ON

APPEN
DIC
ES
75
E.2 LISTENING POSTS: ZIMBABWE AND BURKINA FASO
Region:
• The Cereal and Low Cotton Producing Communal (CLCPC) livelihood zone of Kariba rural district, Zimbabwe
• Tapoa Province in Burkina Faso
(The approach has also been used in urban Liberia since late 2011)
Who runs it: Save the Children for Zimbabwe, and ACF International for Burkina Faso
Who funds it: Save the Children for Zimbabwe, and ACF International for Burkina Faso
Dates: October 2009 to December 2011 for Zimbabwe, and September 2010 to December 2012 for Burkina Faso
Objective: To demonstrate the impact of changes in food security resulting from economic and natural shocks on child nutrition
Design: Community-based sentinel site surveillance system
Sampling and sample size:
For the Listening Posts approach, the studied area is first divided into homogeneous livelihood zones and six villages are purposively selected in each zone. The sites can be selected from a complete list of communities in the Sentinel Zone using a random or systematic sample; spatial sampling techniques such as centric systematic area sampling may be used, or predefined criteria such as vulnerability in terms of food security, health, or nutritional status (Save the Children, 2009 p.21). Nutrition data are collected from these six villages, and market price data collected from Market Listening Posts, which are the town/village where each Listening Post community purchases the bulk of their food and other commodities.
Sixteen children aged between 6 and 24 months should be monitored at each Listening Post, so there are a total of 96 children being followed in each livelihood zone. When a child reaches 24 months, he or she is replaced by another child aged 6 to 9 months; and a dead or lost child is replaced by another child of the same age to
ensure the age structure of the cohort between surveillance rounds.
At least 16 children between the ages of 6 to 24 months need to be drawn per village to detect differences in weight means of about 100g and a difference between proportions of about 10%. For the prevalence of GAM estimated using mean MUAC, the minimum number of children required per village is 22.
In Zimbabwe, only one livelihood zone was included in the pilot, so in theory there should have been 96 children. In Burkina Faso, there were three livelihood zones, and 22 children per village, so 396 included per month.
Data collected:
Market price data should be collected every month and nutrition data every three months. The pilot in Zimbabwe focused on the collection of the following core information:• major staple food prices collected monthly • household food access consolidated quarterly • contextual analysis and response information
consolidated quarterly • nutritional information collected quarterly.
Data analysis:
The database is a Microsoft Excel file with four worksheets: (i) instructions, (ii) MUAC measurement entry, (iii) weight measurement entry, and (iv) feeding practices entry. Nutritional indicators should be calculated including prevalence estimate of wasting, daily weight gain compared to WHO standard of 6.5g, percentage of children consuming at least four food groups, percentage of children being fed with appropriate frequency, and percentage of children being fed with iron-rich or iron-fortified food.
Outputs:
For Zimbabwe, there should have been a report produced each quarter, but there were only four in total. January 2010 covered quarter 1 and 2; April 2010 covered quarter 3; October 2010 covered quarter 4 and 5; and January 2011 quarter 6.
For Burkina Faso, a bulletin summarising the main indicators was issued each month and an analysis report drafted half-yearly.

NU
TR
ITIO
N S
URV
EILL
AN
CE
SYST
EMS
76
Use of information:
The plan was for all of the data to be fed into national early warning systems and FEWSNET.
Also it was planned that ultimately there would be an annual global report, capturing findings from a number of livelihood zones over a number of countries, which would allow for discussion of what is happening to vulnerable communities in multiple locations for global policy application.
However, information from the Listening Posts monitoring system remained internal in ACF Burkina Faso.
Notes:
This is a relatively sophisticated approach to sentinel surveillance, based around the concept of the ‘Cost of the Diet’. The software calculates the lowest cost of an adequate diet (Save the Children, 2013); thus, using estimated income, the percentage of households that are unable to meet these needs can be estimated. Also, the integration of the food security and nutrition components, and repeat observations of children, mean it should have been a powerful system for detecting the impact of shocks.
However, despite designing the system to be as light as possible, it proved to be difficult in practice. It was time consuming to follow up the same children each time, and there were problems with the Excel spreadsheets for entering data. Also, no model for reporting findings was provided in the guidance, so the conclusions of the reports related to the application of the methods not the findings about the situation.
In Zimbabwe:
• There were many issues experienced in the field, and data collection forms were not filled in properly.
• Market data were mostly collected quarterly not monthly because of lack of formal markets.
• The recruitment of new children was very difficult due to high migration rate of the population to the agricultural fields for part of the year or for casual work.
• The loss to follow-up65 in each round was high (see table in Box 4.1) especially from Round 4 onwards.
• The number of children followed up at each round was always under 80, and the minimum required sample sizes were not reached for weight change or MUAC.
• Not enough data were entered to calculate feeding practices.
• There were many issues with the database and data entry.
• Reports do not present information in the same way each time. MUAC data were presented wrongly as the proportions falling between thresholds were provided.
• The mean age of children measured in each round differed between rounds.
• When calculated from the database, the values for many variables did not match the numbers stated in the reports, eg, sample size, mean weight change, mean MUAC.
• It was not felt to be worth collecting additional information as originally envisaged; it was decided that focus should be on the core indicators.
In Burkina Faso:
• Annex 2 on page 48 of Nirina (2012) shows the numbers of children included each month, but it is not possible to distinguish how many were repeat measurements.
• It was originally planned to have institutional anchoring of the monitoring system (with departments of government ministries, or health centres) and partnerships with research organisations or with other NGOs working in the area, but this did not happen.
Sources:
(Save the Children UK, 2009; Save the Children in Zimbabwe, 2010; Taylor, 2010; Frison, 2011; NutritionWorks et al, 2011; Nirina, 2012)
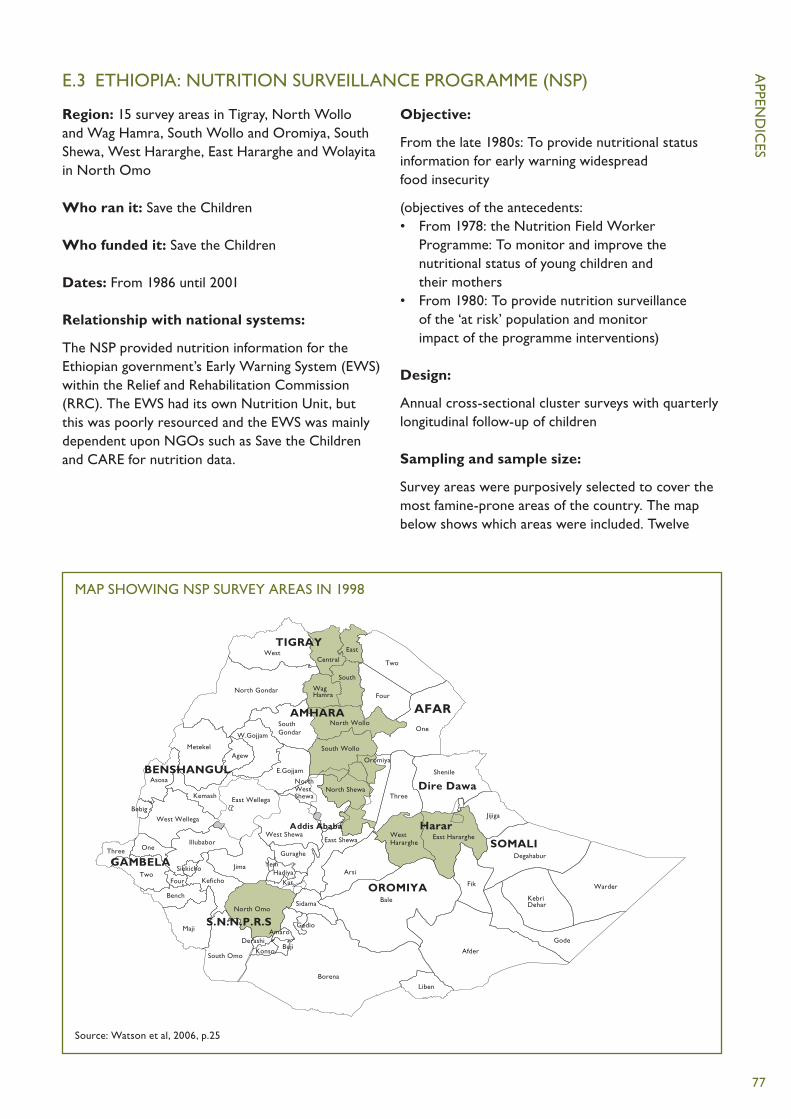
APPEN
DIC
ES
77
E.3 ETHIOPIA: NUTRITION SURVEILLANCE PROGRAMME (NSP)
Region: 15 survey areas in Tigray, North Wollo and Wag Hamra, South Wollo and Oromiya, South Shewa, West Hararghe, East Hararghe and Wolayita in North Omo
Who ran it: Save the Children
Who funded it: Save the Children
Dates: From 1986 until 2001
Relationship with national systems:
The NSP provided nutrition information for the Ethiopian government’s Early Warning System (EWS) within the Relief and Rehabilitation Commission (RRC). The EWS had its own Nutrition Unit, but this was poorly resourced and the EWS was mainly dependent upon NGOs such as Save the Children and CARE for nutrition data.
Objective:
From the late 1980s: To provide nutritional status information for early warning widespread food insecurity
(objectives of the antecedents:• From 1978: the Nutrition Field Worker
Programme: To monitor and improve the nutritional status of young children and their mothers
• From 1980: To provide nutrition surveillance of the ‘at risk’ population and monitor impact of the programme interventions)
Design:
Annual cross-sectional cluster surveys with quarterly longitudinal follow-up of children
Sampling and sample size:
Survey areas were purposively selected to cover the most famine-prone areas of the country. The map below shows which areas were included. Twelve
MAP SHOWING NSP SURVEY AREAS IN 1998
Source: Watson et al, 2006, p.25
South Gondar
North Gondar
North Wollo
South Wollo
WagHamra
North Shewa
Oromiya
East Hararghe
Bale
Central
East
South
East ShewaWest Shewa
Borena
South Omo
North Omo
West Hararghe
Two
Four
One
West
Metekel
W.Gojjam
Agew
E.GojjamAsosa
KemashEast Wellega
West Wellega
IllubaborOneThree
Bebig
TwoFour Keficho
Bench
Maji AmaroDerashi
BujiKonso
Sidama
Gedio
Liben
Afder
Arsi
Fik
Gode
KebriDehar
Degahabur
Warder
Jijiga
Shenile
Three
Addis Ababa
Jima
Guraghe
HadiyaKat
SOMALI
TIGRAY
AMHARA AFAR
OROMIYA
YemSiekicho
GAMBELA
S.N.N.P.R.S
Harar
Dire Dawa
BENSHANGULNorth West Shewa

NU
TR
ITIO
N S
URV
EILL
AN
CE
SYST
EMS
78
villages (clusters) were randomly selected within each survey area66 at the beginning of each survey year (in November and December) and visited at three-monthly intervals over the following 12 months: post-harvest (December–February), early belg (March–May), late belg (June–August) and kremt (September–November). In the following year, new villages were randomly selected. A total of around 185 clusters were surveyed, with 50 < 5 y.o. children in each cluster, so a total of 9,250 children were followed each year.
Data collected:
Weight and length of 50 children between 70 and 110cm in length.
The data were collected by mobile teams consisting of nutrition field workers, who collected the anthropometric data, and food security information officers.
Data on crop and animal prices, animal sales and migration were collected from 15 households per locality. Using village questionnaires, information was collected on socio-economic and environmental factors. In total, 30 food security indicators were collected. Anecdotal reports of illness, such as epidemics, were included in reports.
Data analysis:
The data were analysed in each of the three regional offices and summaries prepared. These were sent to Addis Ababa, where the final reports were prepared and approved by the government.
Mean weight-for-length (WFL) was calculated for each survey area. Guidelines called for intervention once the mean %WFL was less than 90%.
Outputs:
From 1995 there were two publications: NSP Reports and NSP Focus. These were distributed to around 20 donors, NGOs and other external agencies, and within the Disaster Prevention and Preparedness Commission and other government agencies.
Save the Children staff were members of the federal DPPC Early Warning Group and were asked to attend meetings and contribute to discussions about needs.
Information was disseminated about a few food security indicators chosen from the 30 collected.
Use of information:
The outputs were mainly used as a tool to advocate for food aid response: • The Nutrition Field Workers programme, the
antecedent of the NSP, drew attention to the impending famine of 1983–85.
• Data were useful to verify that a problem existed (or did not exist), to triangulate the government’s EWS data and for targeting food-based resources.
• Information provided early warning of crises in Wollo and Wolayita in 1997 and 2000 (Box 5.5).
• However, warning of widespread crisis went unheeded in Wolayita between 1993 and 1994.
For the Ogaden Region in 1988, advocacy related to provision of greater inputs to the health sector, especially malaria treatment and control, and to the release of food aid onto the market for sale rather than its distribution.
Present day:
The decision by Save the Children to phase out was taken in 1998, and despite a three-year plan to transfer skills, the government did not have sufficient capacity to maintain the system after 2002 when Save the Children withdrew.
The Emergency Nutrition Co-ordinating Unit (ENCU) was formed in November 2000, as part of the Disaster Preparedness and Prevention Agency (DPPA) (now ENCU is part of the Disaster Risk Management and Food Security Sector in Ministry of Agriculture (Manyama et al, 2011)).
In 2000, the decision was taken by the DPPC to undertake rapid nutrition assessments on an ‘as-needed’ basis instead of collecting data on a regular basis in order to monitor deterioration in the food security situation. The dominant view within Ethiopia at the time was that nutritional status is a late indicator of crisis and therefore had no role in early warning.
Currently an early warning system exists to identify ‘Hotspot woredas’ according to the extent of food insecurity, and then if deemed necessary, a nutrition survey of levels of wasting in the under-5 population is carried out. This system has been the major source of nutrition information in Ethiopia for the last decade. The surveys are undertaken using SMART methodology so are technically sound and play a crucial role in advocacy for food aid. Proposals were made to use screening data from the UNICEF

APPEN
DIC
ES
79
supported Emergency Outreach Strategy (EOS) (Chotard, 2005) for national nutrition surveillance purposes, and these data are now being used as part of a new national surveillance system in Ethiopia, supported by UNICEF and partly funded by DFID (DFID, 2012).
There are three main sources of information for surveillance:• Nutrition indicators from existing programme
data systems, including the Community-Based Nutrition (CBN) programme, Therapeutic Feeding Programme (TFP),67 Emergency Outreach Strategy (EOS) and Child Health Days (CHD)
• Ad hoc surveys using SMART methodology in hotspot woredas where early warning information indicates nutrition situation is deteriorating (hotspot classification identifies areas to be prioritised for humanitarian assistance or close monitoring, and is done 3–4 times a year)
• Bi-annual nutrition surveys in selected woredas (not hotspots) in 25 districts in six regions (SNNP, Tigray, Amhara, Oromiya, Somali and Afar) since 2012.
Sources:
(Chotard, 2005; Watson et al, 2006; Manyama et al, 2011; DFID, 2012; Kumar, 2012; DFID, 2013)

NU
TR
ITIO
N S
URV
EILL
AN
CE
SYST
EMS
80
E.4 MALAWI: INTEGRATED NUTRITION AND FOOD SECURITY SURVEILLANCE SYSTEM (INFSS)
Region: 26 out of 28 districts of Malawi
Who runs it: ACF designed and coordinated the system, which was implemented in partnership with Ministry of Health and Ministry of Agriculture
Who funded it: EU with technical support of UNICEF and FAO
Dates: 2003–0868
Objectives:69 To provide information on nutrition trends of children under 5 years, and the household food security situation in Malawi (Rivero et al, 2008)
Design: Clinic-based sentinel system
Sampling and sample size:
Five sentinel growth-monitoring clinics were purposively selected within each district to ensure that all livelihood zones were covered; 26 of the 28 districts in Malawi were included.
From all the children attending each clinic, 70 children between the ages of 0 and 59 months were randomly selected, so around 9,100 children nationally, or 350 per district were included. Food security data were recorded from ten of the 70 households sampled from each clinic.
Data collected:
For each clinic, at monthly intervals, the following data were collected from the 70 children: ID, age, sex, weight, height, MUAC, diarrhoea in last two weeks and oedema. From ten households, baseline food security data were collected including structure of the household; ownership of assets; land, crops and cultivation practices; cash income and income sources; loans; food consumption and preferences; sickness and health; water and sanitation. A shorter questionnaire was used on a monthly basis to monitor changes.
Data analysis:
Child measurements and health indicators were written down on paper, collected by regional managers every month and sent to the capital, Lilongwe, for analysis.
For anthropometry, the Excel-based software ANALYNUT was used. Data were matched with previous measurements of the same child for trend analysis.
For food security data, the software Surveyprogramv10, Monthstrendsv5, and Food Stress Index mark 1 were used.
Outputs:
See Chapter 5, Box 5.2.
Each month, a bulletin was issued with the results of the data analysis for both the nutrition and the food security information presented by district and livelihood zone. All reports and bulletins were shared with government ministries and any other interested institution. Results were also sent to district representatives of the ministries and presented at nutrition and food security meetings.
Use of information:
See Chapter 5, Box 5.5.
Notes:
Challenges experienced were poor data quality, long delays between data collection and analysis, and high dropout rates of participants.
Although with clinic-based data there is usually a bias towards including children under 2 years of age, here there was a bias towards including children over the age of 2 years due to not reselecting new children each year. There was also a bias introduced, since knowing the child was included mothers took more care of them.
Production of bulletins took more than six weeks between data collection and reporting.
The information was not used at levels lower than national. People at district level complained the bulletin was too complicated.
Present day:
The system was always perceived as ACF rather than government owned. When funding to ACF for the system ended, the system faltered because the government did not have the budget or sufficient technical capacity to continue it alone.
APPEN
DIC
ES
81
A new system using Rapid SMS technology started in 2009. This system aims to provide instant classification of the anthropometric status of the child, to improve utilisation of the data in the clinics for referral to feeding programmes, and to increase the reported number of children.
The system was piloted in three growth monitoring clinics by Columbia University’s School of International and Public Affairs (SIPA) in partnership with UNICEF Malawi and UNICEF’s Innovations Unit. For each child, a monthly text message was sent by the health worker to UNICEF’s headquarters in Lilongwe, and a confirmation message was sent back to the worker.
Despite a promising start, the project encountered difficulties with poor ICT infrastructure and a lack of local technical capacity, which led to a stalled scale-up of the initiative when the team from SIPA/UNICEF Malawi left the pilot. However, in 2011, the project – now called AnthroWatch – started
operation again and expanded to health clinics throughout the country. The system is also collecting information on maternal health and HIV and AIDS, as well as nutrition monitoring, and there is a plan to use it for monitoring mothers and children up to the age of 2, as part of Malawi’s Continuum of Care for Maternal and Child Health. This ‘rapid surveillance system’ by health facility and community screening is being established with funds from UNICEF and the European Union (EU) and a website is being set up with technical support from the EU to facilitate information-sharing and dissemination (Scaling up Nutrition, 2014).
Sources:
(Government of Malawi and Action Against Hunger, 2007; Phiri, 2008; Rivero et al, 2008; Teller, 2008; van der Heide, 2008; Blaschke et al, 2009; NutritionWorks et al, 2011; Zambrano and Seward, 2014)

NU
TR
ITIO
N S
URV
EILL
AN
CE
SYST
EMS
82
E.5 NICARAGUA: SISTEMA INTEGRADO DE VIGILANCIA DE INTERVENCIONES NUTRICIONALES (SIVIN)70
Region: Country-wide
Who runs it: The Directorate for Primary Health Care, Ministry of Health
Who supports it: At the start, USAID/MOST (Micronutrient Operational Strategies and Technologies), CDC (Centers for Disease Control and Prevention), the Micronutrient Initiative (MI) of Canada, and the Institute of Nutrition of Central America and Panama (INCAP/PAHO). UNICEF provided technical and financial assistance to the national government.
Dates: 2003 to present71
Objectives:
General objective (2003) To contribute to improvements in the health and nutritional status of women and children through periodic collection, processing, analysis and use of relevant information on nutrition programme implementation process and outcomes, as well as on biological indicators of nutritional status.
Purpose (2003) To optimise policy and programme decision-making for increased effectiveness in reducing nutrient deficiencies.
Design:
There are three sources of information: • routine health service statistics• existing nutrition programme monitoring systems• national household survey of a representative
sample of households.
The modular system of the household survey allows for addition or deletion of modules annually, according to needs.
There is also a national height census for 6–9-year-old children, described in (Pena-Rosas and Perez, 2005 p.19). The SIVIN Annual report from 2004 (Ministerio de Salud, 2005 p.25) gave the sample size for the 2004 height census as 159,710.
Sampling and sample size for household survey (see Box 3.3):
Stratified cluster sampling of households with children under five years. Six- to 59-month-old children and the selected child’s mother/caregiver (not pregnant) are included.
There is random selection of clusters, households and children by region, 15 clusters in each of three largest regions, and five clusters in the most sparsely populated region.
Nationally representative results are available yearly (n= 500 children), and regionally representative results are available every three years. The four regions are Pacific, Managua, Central and Atlantic.
Field teams are selected from regular Ministry of Health staff from central or district level, and dedicate one week per month (ten months per year) to visit five clusters. Data collection is undertaken by three rotating teams.
Data collected:
1) Routine health service statistics, on coverage of nutrition-related services such as vitamin A, iron supplementation and deworming.
2) Data from ongoing monitoring and evaluation systems from nutrition programmes, such as food control (regulatory monitoring) of fortified foods in plants/stores, and breastfeeding promotion activities and growth monitoring/education activities.
3) National household survey of a representative sample of households: • Biological indicators of nutritional status collected
for diagnosis and effectiveness/impact evaluation purposes, including nutritional anthropometry of children and women (height and weight) and biological samples as follows: – haemoglobin in women and children, serum
retinol and AGP72 in children, and urinary iodine in women are collected each time
– serum/red-cell folate and vitamin B12 in women, ferritin in women and children collected only once for baseline national prevalence estimates.

APPEN
DIC
ES
83
• Programme monitoring data, including:– iron/folate supplementation coverage– samples collected of fortified foods including
sugar, salt and bread– breastfeeding practices– growth monitoring activities attended.
There is training in standard methodology. Laboratory analysis takes place at INCAP (Instituto de Nutrición de Centroamérica y Panamá) in Guatemala.
Quality control takes place at the point of collection, at the INCAP laboratory (biological samples) and during data analysis.
Data analysis:
Data processing is centralised at Ministry of Health offices in Managua, within the Statistics Unit of the Planning Office. Duplicate data entry takes place in EPI-INFO databases, followed by data cleaning as soon as possible after collection. Integrated analysis is carried out yearly and at the end of each three-year period to estimate adjusted national rates for indicators.
Outputs:
• detailed annual and 3-year reports with regional breakdown of rates and time trends
• technical workshops with decision-makers for discussion of policy and programme implications of the results
• dissemination at district and local levels.
Examples of use of information:
Anaemia rates derived from the data enable trend analysis and national comparisons (Mora et al, 2010, p.12).
Data from the height census was reported to have been used to develop poverty maps, to allocate resources to communities, to help design and evaluate development policies and programmes, and as baseline data for research, for communications and for advocacy (Pena-Rosas and Perez, 2005).
Notes:
In 2001, MOST (Micronutrient Operational Strategies and Technologies)73 and the Centers for Disease Control and Prevention (CDC) launched an initiative to develop model micronutrient M&E systems, to field test them in a few countries, and to refine and replicate them with proper adaptations in other countries. A prototype Integrated System for Monitoring of Nutritional Interventions (SIVIN) was designed in Nicaragua, where a national USAID/MOST-supported micronutrient survey had been carried out in 2000.
A report (Pena-Rosas and Perez, 2005) at the end of the first year of implementation of SIVIN:• noted that the lack of data for use at department
level was often cited as a serious limitation of the system
• included many recommendations, including involving stakeholders to create ‘ownership’, and the need to build capacity in government departments and advocacy for the use of the data.
Another early report (Welsh, 2003):• noted a strong political commitment to SIVIN• reported that by the end of the first year
the Ministry of Health had seconded most of the human resources needed for its regular implementation. They had been well trained so there was a highly motivated and technically competent field team
• reported that financial and social sustainability was less developed. International agencies had so far covered additional personnel, equipment, laboratory analysis, supplies, transportation and travel expenses, and other recurrent costs. The plan was for this to progressively decrease over time so that by the end of the three-year period SIVIN would be fully sustained by MOH formal budgetary allocations – but it took longer.
Sources:
(Welsh, 2003; Welsh, 2004; Pena-Rosas and Perez, 2005; Mora, 2007; Jefferds, 2011)

NU
TR
ITIO
N S
URV
EILL
AN
CE
SYST
EMS
84
APPENDIX FF.1 COSTS OF SYSTEMS
Ref Type of data collection
Location and year
Cost Sample size Annualised cost per participant74
Frequency per year
Large-scale surveys (national)
(Gillespie, 1998, Module 7.4)
DHS survey Zimbabwe 1988
$120,000 1
(Rommelmann et al, 2005, Table 2)
DHS survey Tanzania 1991, 1994, 1996, 1999
$900,000 (comparative cost for 2001)
43,636 Ï 4.9 (household size)
$19.57 1
(Health Metrics Network, 2012)
DHS survey Peru 2000 $1,200,000 33,046 $36.31
(World Bank, 2004)
DHS/MICS Burkina Faso DHS 2003,
Cambodia DHS 2000,
Malawi DHS 2002
Moldova MICS 2000
$900,000 (Households)
9,097;
12,810;
14,213;
11,592
1
(Stansfield et al, 2006)
DHS Low-income countries
$600,000 6,000 $10075 (should divide by household size to make comparable to other values)
SMART or other survey
(Oguta et al, 2008)
30 Ï 30 Somaliland 2008
$13,700 905 $15.1376 1
(Oguta et al, 2008)
LQAS Somaliland
2008
$5,600 204 $27.45 1
(Watson et al, 2011)
SMART Ethiopia, 2009 $10,000 (Assume 900) $11.11 1
(Watson et al, 2006, p.49)
185 x 50 Ethiopia 1999 £216,00077 9250 £23.36 4
(Muzeiyn and Yohannes, 2011)
SMART Ethiopia 2011 $8,500 (Assume 900) $9.44 1
Sentinel sites
(Gillespie, 1998, Module 7.4)
Community sentinel surveillance
Zimbabwe $60,000 ? ? 3

APPEN
DIC
ES
85
F.2 NEEDS FOR STRENGTHENING CAPACITY AT VARIOUS LEVELS
Derived from (UNICEF, 2010a)
Community-level needs
• Authority to act• Skills for assessment, analysis, and action including
weighing and plotting charts, interpretation of growth data, tallying results, community presentation and utilisation of data (eg, bar graphs), community facilitation skills (discuss problems and come up with solutions)
• Use and understanding of reporting tools, trained by district staff
• Local understanding of nutrition issues, training by district staff
• Creation of community support groups, eg, mother-to-mother support groups
• Supervision from district and national levels• Communication and advocacy skills
District-level needs:
• Training, mentoring in service• Skills in data management, analysis, use, and
presentation/dissemination• Local programme planning, budgeting,
management, supervision, coordination, leadership
• Utilisation of reporting network and tools• Communications and advocacy skills
National-level needs:
• Data management, including training to develop confidence and skills to manage and analyse data
• Mentoring programmes• Leadership skills• Management skills• Communications and advocacy skills
Different training programmes are applicable to different levels. For example, non-governmental organisations may focus on community level and
universities on national and district levels. A ‘skills audit’ can determine the requirements and best approaches at different levels. This may be done through a regional or national coordination group that is familiar with the relevant organisations and their capacities. Linking personnel with academic institutions can help build a staff of qualified people to sustain nutrition information systems.
The technical skills particularly needed include the following: • data assessment and analysis• public nutrition programming and planning• basic epidemiology• survey design• monitoring and evaluation methods• advocacy• quantitative and qualitative data management
and collection• mentoring: support and practice of mobile
outreach teams (‘roving mentors’); student-to-student, professor-to-student; study groups, tutoring; regional offices, training institutions, United Nations agencies, and non-governmental organisations; distance mentoring; exchange programmes.
Decentralised health services have dramatically increased the need for improved skills. This can be addressed through different levels of certification and flexible entry and exit points. Much training could be provided in a distance format, with participants remaining in their posts and studying part time while they carry out their regular duties.
Mentoring is an essential element, to support skills and systems. One idea is to promote ‘roving mentors’ who can have long-term relationships with people in this area to mentor and ensure skills development and implementation in practice and who are able to provide in-service support for trainees.

NU
TR
ITIO
N S
URV
EILL
AN
CE
SYST
EMS
86
APPENDIX GG.1 FACTORS AFFECTING URBAN FOOD SECURITY AND NUTRITION WITH IMPLICATIONS FOR NUTRITION SURVEILLANCE
Compared with rural households, urban households are: • more dependent on purchased food. This can
lead to a more varied diet and higher reliance on ‘ready-made’ and fast foods, compared with rural households
• more vulnerable to any changes in the market system
• more dependent on income from a wide variety of jobs, often in the informal sector, that rarely provide enough income to meet consumption needs, so lead people to employ risky coping mechanisms and incur debt.
Women are more likely than men to have irregular and less secure jobs, and this will have adverse impacts on breastfeeding, infant feeding and childcare practices, especially for mothers with poor social support networks who need to adapt their work patterns or use poor-quality childcare.
Environmental issues (eg, overcrowding, poor water quality and sanitation, pollution, open sewerage and contamination) are most severe in cities and are
especially intense in slums. They have a significant impact on disease transmission and child health.
Compared with rural areas, urban areas might appear to be better served by health services, education and sanitation, but proximity and population density does not necessarily mean access. Access by the urban poor to health services, improved water sources, etc is limited by the high cost of such services, and also by livelihoods that often involve long journeys to places of work and long working hours.
Urban populations are less settled than rural, and have complex patterns of displacement and vulnerability. The poor may be geographically scattered and may not want to be identified or assisted. They may live next door to the well-to-do. Thus, prevalence rates for indicators such as malnutrition are difficult to act on and interpret – the percentage of malnourished children may be very low while the actual number of malnourished children is very high.
Sources: (Mohiddin et al, 2012; Carletto et al, 2013) and (Save the Children UK, 2007, Chapter 6)

APPEN
DIC
ES
87
G.2 ISSUES TO CONSIDER WHEN ADAPTING DESIGN AND METHODS OF NUTRITION SURVEILLANCE FOR URBAN AREAS
Sampling and data collection: • Nutrition assessment should be focused on
areas of the city in which the most vulnerable populations live, in order to avoid specific nutritional problems among the poorest going unnoticed due to the use of averages.
• Sampling is more difficult in urban areas, due to lack of information on numbers in the actual population and complex arrangements of closely packed households that differ from rural villages (based on a roughly circular group of dwellings).
• Specific guidance on urban sampling for nutrition surveys is available on the web (Brixton Health), but is complex and remains a topic of discussion among practitioners.
• Data may need to be collected at individual not household level, as it cannot be assumed that members of households pool resources.
• Data collection schedules must be more flexible, since adults are often away from the home for long working days.
• Time needs to be invested in developing sampling frames.
• Security of investigators must be considered.• Contextual data, for example information from
health clinics and local doctors, can help to highlight specific nutritional problems.
• Therapeutic feeding programme admissions data can be useful.
• Existing tools for assessing food security, such as food consumption scores, can be misleading in urban areas.
Sources: (Creti, 2010) and key informants
Interpretation of indicators for malnutrition: • Threshold prevalence rates for malnutrition
indicators cannot be interpreted in the same way as in rural areas. Urban areas are so varied, and the vulnerable may live close to the wealthy, so the percentage of malnourished children may be low while the absolute numbers of malnourished children is high.
• Usually thresholds of wasting prevalence are used to classify the severity of a situation, but percentage wasting and mortality rates may not rise as sharply in urban contexts despite very high numbers of affected individuals.
• Thus, there are concerns over using the same triggers for action in urban areas as in rural areas. Existing triggers may be inappropriate for a population in a densely populated urban setting where absolute numbers affected relative to the availability of services may be considered more important in determining the need for intervention.
Sources: (Mohiddin et al, 2012) (Oxfam et al, 2009) and key informants

NU
TR
ITIO
N S
URV
EILL
AN
CE
SYST
EMS
88
G.3 KEY RESEARCH, REVIEWS AND INITIATIVES RELEVANT TO TECHNOLOGY IN NUTRITION SURVEILLANCE
1) Reviews of the use of mobile phones in nutrition surveillance: (Barnett and Gallegos, 2013), and (Barnett and Edwards, 2014).
2) The ‘Real Time Monitoring for the Most Vulnerable (RTMMV) study’: Key findings were reported in IDS Bulletin Volume 44 Number 2 in March 2013, eg, (Lucas et al, 2013). The Institute of Development Studies (IDS), supported by UNICEF, carried out a multi-country assessment of initiatives that collect high-frequency and/or time-sensitive data on risk, vulnerability and access to services among vulnerable children and populations and on the stability and security of livelihoods affected by shocks.
3) Global Pulse: This is a UN initiative to investigate the viability of using new and alternative data sources to support development goals (Letouzé, 2012). WFP and UNICEF undertook a study as part of the ‘Rapid Impact and Vulnerability Assessment Fund’ to explore the compatibility of data from local food and nutrition security monitoring systems in five countries (FNSMS), and therefore whether integrated analysis was possible to better inform decision-makers on vulnerability and food and nutrition security (UN, 2012).
4) Review of the evolution of food and nutrition security information efforts in the context of emerging technology and data collection techniques (Mock et al, 2013).

APPEN
DIC
ES
89
G.4 APPLICATIONS OF INFORMATION AND COMMUNICATION TECHNOLOGIES (ICTS) IN NUTRITION SURVEILLANCE
1. INFORMATION MANAGEMENT
For data collection, entry of data directly into electronic devices can reduce error, in that:• it removes the error involved with transfer of data
from paper records• range checks can be used to limit data entry to
reasonable values • instant calculations can be performed to indicate
improbable measurements or values that need checking.
PDAs (personal digital assistants), which were introduced in the 1990s, are now considered out of date, and have been replaced by notebook computers, tablets, mobile phones and smart phones. Where there is a telephone network, the data can be sent directly to the surveillance database or can be downloaded to a computer and transferred later.
SMS using mobile phones
Agencies working in the field use a variety of software, often via local private companies as there is no system which is universally adopted. FrontlineSMS is an open source application which is used extensively especially by local NGOs, that turns any laptop into a messaging centre by connecting it by cable to a mobile handset (Korenblum, 2012). Also, the free code base of the open source RapidSMS platform can be customised by aid agencies. For example, the RapidSMS nutrition application ‘Anthro Watch’ used in Malawi (Blaschke et al, 2009) runs on simple 2G phones. The calculation of nutrition indices happens on the server and an SMS is sent back to the health worker with the result, which can aid the case management of the child (Barnett and Edwards, 2014).
Smart phones
Similarly, data collectors can use smart phone devices together with survey and data management software. For example, FHI360s GATHER package, collect and transmit data to a centralised database for real-time compilation. Camera and GPS functions allow recording of data on current position and image data.
For nutrition applications, hardly any mobile phone-based surveillance system works with simple 2G mobile phone handsets any longer. Most projects use smart phones with more sophisticated software packages and more user-friendly screens. The
software, such as the ‘growth monitoring’ application from Motech Suite, calculates nutrition indices immediately and independently of whether or not network coverage is available. Smart phones also allow health workers to deliver different nutrition services such as nutrition counselling using behavioural change videos, and diagnoses using other tools.
Mapping and geographic information system (GIS) software
GIS mapping capacities can be developed using GIS software for traditional, print-based maps, or for interactive maps to be viewed on a digital device. This is especially useful for combining information from different sources to aid identification of areas that are experiencing the worst conditions. Examples of outputs are in bulletins produced by FSNAU for Somalia (Food Security and Nutrition Analysis Unit – Somalia, 2013a) and by ENCU for Ethiopia (Emergency Nutrition Coordination Unit – Ethiopia, 2013).
‘Crowd sourcing’ methods can be used for intersectoral data collection and creating interactive maps; for example, Ushahidi was the online platform for crowd mapping used after the Haiti earthquake in 2010 (Mock et al, 2013).
Software for statistical analysis
Data collation: Data quality control mechanisms/checks can be incorporated into the statistical software.
Data analysis: The design of nutrition surveillance systems often involves multi-stage sampling methods, and unless the statistical software used for data analysis takes the clustering and/or stratification into account, estimates of means and prevalence rates may not be reliable, and the width of confidence intervals can be underestimated. Also, surveillance can involve mixed longitudinal and cross-sectional datasets with missing data, and its analysis is complex. Finally, time series analysis which partitions the variability in data into secular trends, seasonal variation and random variation is useful for analysis of surveillance data. For all these issues, the increasing user-friendliness of analysis software such as STATA will maximise the utility of data collected and the reliability of the findings.

NU
TR
ITIO
N S
URV
EILL
AN
CE
SYST
EMS
90
Examples of specialist software applications for nutrition data analysis: • the Save the Children Cost of Diet tool calculates
the lowest cost of an adequate diet (Save the Children, 2013) and can calculate the percentage of households that are unable to meet these needs, based on estimated income
• spreadsheets have been developed to calculate risks of exceeding threshold prevalence rates, which helps analysts to report findings that are understandable by non-specialists (Bilukha and Blanton, 2010).
Data visualisation
Data visualisations78 can make it easier to see relationships among data and therefore to interpret them and derive useful information. Developments in software will facilitate visualisations to become part of the research process, rather than something that only happens at the end of data analysis (Fox and Hendler, 2011). Also new approaches to data visualisation and communication to different political levels and the public can help to make undernutrition more visible (Haddad et al, 2014 p.4).
Sharing data and information
The existence of the internet means that datasets and reports can be available to potential users as soon as they have been prepared.
2. COORDINATION
ICT can aid coordination between stakeholders, for example via:• face-to-face and virtual meetings using laptops,
internet, video-conferencing, etc• automatically updated contact lists and profiles,
which aid communication by email, SMS and Skype.
3. CAPACITY-BUILDING AND KNOWLEDGE-SHARING
ICT can be used to build capacity and share knowledge, for example via• Distance learning: Online, and mixed online/
face-to-face courses can provide greater access to training.
• Online communities of practice: For example, a website with social networking capabilities could become a space for collaboration, capacity-building and knowledge for stakeholders in surveillance systems.
Watson and colleagues suggested that, given the confusion among practitioners about the role and scope of surveys as opposed to surveillance or rapid assessments, it would be helpful to create a dedicated forum on nutrition information systems for the international nutrition community (Watson et al, 2006). The forum would enable users to raise questions and have them answered, as well as enable dissemination of information about new approaches.

91
Abuya, B.A., Ciera, J. and Kimani-Murage, E. (2012). Effect of mother’s education on child’s nutritional status in the slums of Nairobi. BMC Pediatrics. 12, 80.
ACF (2011). Food security & livelihoods surveillance, a practical guide for field workers.
ACF International (2009a). Mathare Sentinel Surveillance Report, July 2009.
ACF International (2009b). Mathare Sentinel Surveillance Report, April 2009.
ACF International (2009c). Sentinel Surveillance Report, Garissa and Mandera, March 2009.
ACF International (2013). Small Scale Survey West Pokot County, Kenya June 2013.
ACF USA (2007). Evaluation of the Nutrition Surveillance Activities of ACF-USA and Analysis of the Nutritional Situation in South Sudan 2006.
ACF USA (2008). Evaluation of the Nutrition Surveillance Activities of ACF-USA and Analysis of the Nutritional Situation in South Sudan 2007.
ACF USA (2010). Integrated Nutrition Surveillance System in Karamoja Region Final report number 004, December 2010.
ACF USA (2011). Nutrition Surveillance Karamoja Region, Uganda Round 5, May 2011.
Afghanistan – Nutrition Cluster (2013). Nutrition Surveillance in 2012.
Ahmed, A.E. and Ahmed, I.A. (1996). Nutrition surveillance in the Sudan: a community-based approach. Eastern Mediterranean Health Journal. 2, 229–235.
Akhter, N. and Haselow, N. (2010). Using data from a nationally representative nutrition surveillance system to assess trends and influence nutrition programs and policy. Field Actions Science Reports. 4, 1–7.
Arnauld, J., Alarcon, J. and Immink, M. (1990). Food security and food and nutrition surveillance in Central America: the need for functional approaches. Food and Nutrition Bulletin. 12, 26–33.
Ashworth, A., Shrimpton, R. and Jamil, K. (2008). Growth monitoring and promotion: review of evidence of impact. Maternal & child nutrition. 4, 86–117.
Babu, S. and Chapasuka, E. (1997). Mitigating the effects of drought through food security and nutrition monitoring: Lessons from Malawi. Food and Nutrition Bulletin. 18.
Bailes, A. (2006). National Nutrition Surveillance system: A review and recommendation report, Supported by UNICEF Botswana. Botswana MoH Food and Nutrition Unit, Family Health Division.
Bailey, R. (2013). Managing famine risk, linking early warning to early action. A Chatham House report
Barnett, I. and Gallegos, J.V. (2013). Using Mobile Phones for Nutrition Surveillance: A Review of Evidence. Institute of Development Studies.
Barnett, I. and Edwards, E. (2014). Mobile phones for real-time surveillance: Approaches, challenges and opportunities for the data presentation and dissemination. Evidence Report No 75. Brighton, Institute of Development Studies.
Barrett, C.B. and Headey, D. (2014). Measuring Resilience in a Volatile World: A Proposal for a Multicountry System of Sentinel Sites. 2020 Conference papers. International Food Policy Research Institute (IFPRI).
Beaton, G., Kelly, A., Kevany, J., Martorell, R. and Mason, J. (1990). Appropriate uses of anthropometric indices in children, A report based on an ACC/SCN workshop. ACC/SCN State-of-the-art series, Nutrition policy discussion paper No 7. Geneva, UN ACC/SCN.
Bender, D.A. (2009). Nutrition Surveillance. A Dictionary of Food and Nutrition. 3rd ed. Oxford, Oxford University Press.
REFERENCES

NU
TR
ITIO
N S
URV
EILL
AN
CE
SYST
EMS
92
Berger, S.G., de Pee, S., Bloem, M.W., Halati, S. and Semba, R.D. (2007). Malnutrition and morbidity are higher in children who are missed by periodic vitamin A capsule distribution for child survival in rural Indonesia. Journal of Nutrition. 137, 1328–33.
Berger, S.G., de Pee, S., Bloem, M.W., Halati, S. and Semba, R.D. (2008). Malnutrition and morbidity among children not reached by the national vitamin A capsule programme in urban slum areas of Indonesia. Public Health. 122, 371–378.
Bertozzi, S., Padian, N., Wegbreit, J., DeMaria, L., Feldman, B., Gayle, H., et al (2006). HIV/AIDS Prevention and Treatment. In: Jamison, D. T., Breman, J. G., Measham, A. R., Alleyne, G., Claeson, M., Evans, D. B., et al. (Eds.) Disease Control Priorities in Developing Countries. 2nd ed. New York: Oxford University Press, pp 331–369.
Best, C.M., Sun, K., de Pee, S., Bloem, M.W., Stallkamp, G. and Semba, R.D. (2007). Parental tobacco use is associated with increased risk of child malnutrition in Bangladesh. Nutrition. 23, 731–738.
Best, C.M., Sun, K., de Pee, S., Sari, M., Bloem, M.W. and Semba, R.D. (2008). Paternal smoking and increased risk of child malnutrition among families in rural Indonesia. Tobacco Control. 17, 38–45.
Bhutta, Z.A., Das, J.K., Rizvi, A., Gaffey, M.F., Walker, N., Horton, S., et al (2013). Evidence-based interventions for improvement of maternal and child nutrition: what can be done and at what cost? The Lancet. 382, 452–477.
Bilukha, O. and Blanton, C. (2008). Interpreting results of cluster surveys in emergency settings: is the LQAS test the best option? Emerging themes in epidemiology. 5, 25.
Bilukha, O. and Blanton, C. (2010). Interpreting results of field surveys using probability calculators. Field Exchange. 39, 37.
Bilukha, O., Prudhon, C., Moloney, G., Hailey, P. and Doledec, D. (2012). Measuring anthropometric indicators through nutrition surveillance in humanitarian settings: options, issues, and ways forward. Food and nutrition bulletin. 33, 169–176.
Binkin, N., Sullivan, K., Staehling, N. and Nieburg, P. (1992). Rapid Nutrition Surveys: How Many Clusters are Enough? Disasters. 16, 97–103.
Black, R.E., Allen, L.H., Bhutta, Z.A., Caulfield, L.E., De Onis, M., Ezzati, M., et al (2008). Maternal and
child undernutrition: global and regional exposures and health consequences. The Lancet. 371, 243–260.
Black, R.E., Victora, C.G., Walker, S.P., Bhutta, Z.A., Christian, P., de Onis, M., et al (2013). Maternal and child undernutrition and overweight in low-income and middle-income countries. The Lancet. 382, 427–451.
Blaschke, S., Bokenkamp, K., Cosmaciuc, R., Denby, M., Hailu, B. and Short, R. (2009). Using mobile phones to improve child nutrition surveillance in Malawi. UNICEF.
Block, S.A., Kiess, L., Webb, P., Kosen, S., Moench-Pfanner, R., Bloem, M.W., et al (2004). Macro shocks and micro outcomes: child nutrition during Indonesia’s crisis. Economics and Human Biology. 2, 21–44.
Bloem, M.W., Hye, A., Gorstein, J., Wijnroks, M., Hall, G., Matzger, H., et al (1995). Nutrition surveillance in Bangladesh: a useful tool for policy planning at the local and national levels. Food and Nutrition Bulletin. 16, 131–138.
Bloem, M.W., Moench-Pfanner, R. and Panagides, D. (2003). Health & nutritional surveillance for development. Helen Keller International, Asia Pacific Regional Office Singapore.
Bovet, P., Kizirian, N., Madeleine, G., Blossner, M. and Chiolero, A. (2011). Prevalence of thinness in children and adolescents in the Seychelles: comparison of two international growth references. Nutr J. 10, 65.
Brixton Health (undated) Sampling in Urban Settings. Retrieved 21/3/15, from http://www.brixtonhealth.com/urbanSampling.pdf
Bryce, J., Coitinho, D., Darnton-Hill, I., Pelletier, D. and Pinstrup-Andersen, P. (2008). Maternal and child undernutrition: effective action at national level. The Lancet. 371, 510–526.
Campbell, A.A., Thorne-Lyman, A., Sun, K., de Pee, S., Kraemer, K., Moench-Pfanner, R., et al (2009). Indonesian women of childbearing age are at greater risk of clinical vitamin A deficiency in families that spend more on rice and less on fruits/vegetables and animal-based foods. Nutr Res. 29, 75–81.
Campbell, A.A., de Pee, S., Sun, K., Kraemer, K., Thorne-Lyman, A., Moench-Pfanner, R., et al (2010). Household Rice Expenditure and Maternal and Child Nutritional Status in Bangladesh. Journal of Nutrition. 140, 189S–194.

REFER
ENC
ES
93
Campbell, A.A., Akhter, N., Sun, K., de Pee, S., Kraemer, K., Moench-Pfanner, R., et al (2011a). Relationship of homestead food production with night blindness among children below 5 years of age in Bangladesh. Public Health Nutrition. 14, 1627–31.
Campbell, A.A., Akhter, N., Sun, K., De Pee, S., Kraemer, K., Moench-Pfanner, R., et al (2011b). Relationship of household food insecurity to anaemia in children aged 6–59 months among families in rural Indonesia. Annals of Tropical Paediatrics. 31, 321–30.
Carletto, C., Zezza, A. and Banerjee, R. (2013). Towards better measurement of household food security: Harmonizing indicators and the role of household surveys. Global Food Security. 2, 30–40.
CFS (2012). Coming to terms with terminology: Food Security, Nutrition Security, Food Security and Nutrition and Food and Nutrition Security. Committee on World Food Security.
Choi, B.C. (2012). The Past, Present, and Future of Public Health Surveillance Scientifica Vol. 2012, 26 pages doi:10.6064/2012/875253
Chopra, M., Hassan, N., Klaver, W., Rahman, A. and de Pee, S. (2004). External Review of the Nutritional Surveillance Project in Bangladesh. Royal Government of the Kingdom of the Netherlands.
Chotard, S. (2005). Developing Nutrition Surveillance Within the Framework of EOS in Ethiopia. UNICEF.
Chotard, S., Mason, J.B., Oliphant, N.P., Mebrahtu, S. and Hailey, P. (2010). Fluctuations in wasting in vulnerable child populations in the Greater Horn of Africa. Food & Nutrition Bulletin. 31, 219S–233S.
Conkle, J. (2006). South African District Health Information System (Draft). Unpublished working paper for Short Course ‘Nutrition Information Systems in Eastern and Southern Africa’, Cape Town, University of the Western Cape, 20–24 August 2007, Tulane University School of Public Health and University of the Western Cape.
Cornia, G.A., Deotti, L. and UNICEF (2008). Millet prices, public policy and child malnutrition: The case of Niger in 2005. UNICEF, Innocenti Research Centre.
Countdown to 2015 and Health Metrics Network (2011). Monitoring maternal,newborn and child health: understanding key progress indicators. Geneva, World Health Organization.
Creti, P. (2010). Review of existing approaches, methods and tools used by humanitarian agencies to measure livelihoods, food insecurity and vulnerability in urban contexts. WFP/OXFAM.
Crookston, B.T., Schott, W., Cueto, S., Dearden, K.A., Engle, P., Georgiadis, A., et al (2013). Postinfancy growth, schooling, and cognitive achievement: Young Lives. The American Journal of Clinical Nutrition. 98, 1555–1563.
Crowe, S., Seal, A., Grijalva-Eternod, C. and Kerac, M. (2014). Effect of nutrition survey ‘cleaning criteria’on estimates of malnutrition prevalence and disease burden: secondary data analysis. PeerJ. 2, e380.
Crum, J., Mason, J., Pokharel, R., Hutchinson, P., Mebrahtu, S. and Dahal, P. (2013). Trends and determinants of maternal and child under-nutrition in Nepal: further analysis of the Nepal demographic health survey, 1996–2011. Kathmandu, Nepal, Nepal Ministry of Health and Population, UNICEF.
Darcy, J., Stobaugh, H., Walker, P. and Maxwell, D. (2013). The Use of Evidence in Humanitarian Decision Making ACAPS Operational Learning Paper. Somerville, MA, USA, Feinstein International Centre.
De Pee, S., Bloem, M.W., Sari, M., Kiess, L., Yip, R. and Kosen, S. (2002). The high prevalence of low hemoglobin concentration among Indonesian infants aged 3–5 months is related to maternal anemia. Journal of Nutrition. 132, 2215-21.
Delgado, H. (2011). School Children Height Censuses to Monitor Chronic Malnutrition. Healthcare Improvement Project.
Delgado, H., Palma, P. and Fischer, M. (1991). The use of the height census of schoolchildren in Central America and Panama. Food and Nutrition Bulletin. 13, 17–19.
Delgado, H.L. and Palmieri, M. (1994). Sentinel surveillance in health and nutrition: experience in Guatemala. Food and Nutrition Bulletin. 15, 303–307.
Devereux, S., Baulch, B., Hussein, K., Shoham, J., Sida, H. and Wilcock, D. (2004). Improving the analysis of Food Insecurity. Food Security Measurement, Livelihoods Approaches and Policy: Applications in FIVIMS.
DFID (2012). Project Title: Humanitarian Support to UNICEF Nutrition Surveillance 2012. London, Department for International Development.

NU
TR
ITIO
N S
URV
EILL
AN
CE
SYST
EMS
94
DFID (2013). Annual Review – Humanitarian Support to UNICEF Nutrition Surveillance 2013. London, Department for International Development.
Doledec, D. (2014). Analysis of the Sentinel Site Nutrition Surveillance System in Mozambique. FHI 360/FANTA. Washington, DC, Food and Nutrition Technical Assistance III Project (FANTA).
Elder, L. and Kiess, L. (2004). Nutrition Toolkit Tool #2:– Basic Facts: Nuts and Bolts on Nutrition. Annex A Data Collection Methods and Statistics. Human Development Network, The World Bank.
Emergency Nutrition Coordination Unit – Ethiopia (2013). Emergency Nutrition Quarterly Bulletin, First Quarter 2013.
European Union (2012). Annual Report 2012 on the European Union’s Development and external assistance policies and their implementation in 2011. Luxembourg, Publications Office of the European Union.
FANTA-2 (2010). The Analysis of the Nutrition Situation in Uganda. Washington, DC, AED.
FANTA-2 Project (2009). Alternative Sampling Designs for Emergency Settings: A Guide for Survey Planning, Data Collection and Analysis Washington DC, Food and Nutrition Technical Assistance Project II (FANTA-2), Academy for Educational Development.
FAO (1998). Guidelines for National Food Insecurity and Vulnerability Information and Mapping Systems (FIVIMS: Background and principles. Rome, FAO.
Field, J.O. (1977). The soft underbelly of applied knowledge: Conceptual and operational problems in nutrition planning. Food Policy. 2, 228–239.
Food Security and Nutrition Analysis Unit – Somalia (2013a). Nutrition Update November – December 2013.
Food Security and Nutrition Analysis Unit – Somalia (2013b). Nutrition Analysis Post Gu 2013 Technical Series Report No VII. 52.
Fotso, J., Madise, N., Baschieri, A., Cleland, J., Zulu, E., M., K., et al (2012). Child growth in urban deprived settings: Does household poverty status matter? At which stage of child development? Health & Place. 18, 375–384.
Fox, P. and Hendler, J. (2011). Changing the equation on scientific data visualization. Science (Washington). 331, 705–708.
Friedman, G. (2014). Review of National Nutrition Surveillance Systems. Washington DC, Food and Nutrition Technical Assistance III Project (FANTA).
Frison, S. (2011). Listening Posts: Internal review of Zimbabwe data Unpublished report.
Gerein, N. (1988). Is growth monitoring worthwhile? Health Policy and Planning. 3, 181–194.
Gillespie, S. (1994). Nutrition Surveillance for Action. Paper prepared for the National Update on Nutrition in Children, 24–25 September 1994, New Delhi, UNICEF.
Gillespie, S., Mason, J. and Martorell, R. (1996). How Nutrition Improves − Nutrition policy discussion paper No. 15. ACC/SCN.
Gillespie, S. (1998). Nutrition Learning Package, Module 7 Information and Communication Strategies For Improving Triple A Cycles. UNICEF.
Gillespie, S., Haddad, L., Mannar, V., Menon, P. and Nisbett, N. (2013). The politics of reducing malnutrition: building commitment and accelerating progress. The Lancet. 382, 552–569.
Gillespie, S.R. (2001). Strengthening capacity to improve nutrition. IFPRI, Food Consumption and Nutrition Division.
Government of Malawi and Action Against Hunger (2007). Malawi Integrated Nutrition and Food Security Surveillance System October 2007 Data Report.
Government of Nigeria and UNICEF (2012). Summary Findings of Cross-Sectional Nutrition Surveys Northern Nigeria, September 2012.
Government of South Sudan and ACF International (2008). Nutrition Sentinel Site Surveillance Report South Sudan – June 2008 Malakal Southern Zone Upper Nile State.
Government of Uganda and ACF USA (2013). Nutrition Surveillance Data Analysis Karamoja, Uganda December 2009 – May 2012.
Government of Uganda and World Health Organization (2009). Karamoja Nutrition Surveillance Report, June 09.
Grantham-McGregor, S., Cheung, Y.B., Cueto, S., Glewwe, P., Richter, L. and Strupp, B. (2007). Developmental potential in the first 5 years for children in developing countries. The Lancet. 369, 60–70.

REFER
ENC
ES
95
Greeley, M., Lucas, H., Chai, J. and Cummins, M. (2013). Introduction: Real Time Monitoring for the Most Vulnerable – Investing in Common Guidance for Equity and Quality. IDS Bulletin. 44, 1–14.
Grellety, E., Luquero, F.J., Mambula, C., Adamu, H.H., Elder, G. and Porten, K. (2013). Observational bias during nutrition surveillance: results of a mixed longitudinal and cross-sectional data collection system in Northern Nigeria. PloS One. 8, e62767.
Groves, R.M., Fowler Jr, F.J., Couper, M.P., Lepkowski, J.M., Singer, E. and Tourangeau, R. (2013). Survey methodology. New Jersey, John Wiley & Sons.
Habicht, J.-P. and Pelletier, D.L. (1990). The importance of context in choosing nutritional indicators. The Journal of Nutrition. 120, 1519.
Haddad, L., Nisbett, M., Barnett, I. and Valli, E. (2014). Maharashtra’s Child Stunting Declines: What is Driving Them? Findings of a Multidisciplinary Analysis. Brighton, IDS.
Hagen-Zanker, J., Duvendack, M., Mallett, R., Slater, R., Carpenter, S. and Tromme, M. (2012). Making systematic reviews work for international development research. London, Overseas Development Institute, Secure Livelihoods Research Consortium.
Hancioglu, A. and Arnold, F. (2013). Measuring coverage in MNCH: Tracking progress in health for women and children using DHS and MICS household surveys. PLoS Medicine. 10, e1001391.
Headey, D. and Ecker, O. (2012). Improving the measurement of food security. IFPRI Discussion Paper 01225. International Food Policy Research Institute.
Headey, D., Hoddinott, J., Ali, D., Tesfaye, R. and Dereje, M. (2014). The Other Asian Enigma: Explaining the rapid reduction of malnutrition in Bangladesh. IFPRI.
Health Metrics Network (2012). Technical note on the costs of alternative approaches to collecting population and vital events data. World Health Organization.
Helen Keller International (2007). OFDA Nutritional Surveillance Program Summary (Guinea). Unpublished.
Helen Keller International (2011). The Food Security and Nutrition Surveillance Project Round 4 February – May 2011. Dhaka.
Helen Keller International and BRAC Institute of Global Health (2014). State of Food Security & Nutrition in Bangladesh 2012. Dhaka, Bangladesh: Helen Keller International and BRAC Institute of Global Health.
Helen Keller International Indonesia (2004). Nutrition and Health Surveillance System Close out report 2003. Helen Keller International Indonesia
Helen Keller International Indonesia (2006). Summary and Accomplishments of the HKI/GOI Collaboration for Vitamin A, 1999–2005. Jakarta, Helen Keller International Indonesia.
Hillbruner, C. (2010). Famine early warning systems network, nutrition surveillance and early warning. In: Haytmanek, E. and Mcclure, K. (Eds.) Mitigating the nutritional impacts of the global food price crisis: workshop summary. National Academies Press, pp 85–88.
Hund, L. and Pagano, M. (2014). Extending cluster lot quality assurance sampling designs for surveillance programs. Statistics in Medicine.
Immink, M. (1988). Community-based food and nutrition surveillance as an instrument of socio-economic development in Central America: A point of view. Food and nutrition bulletin. 10.
IPC Global Partners (2014). IPC Nutrition Phase Classification 2014. Rome, The Integrated Food Security Phase Classification Global Partners.
IRIN (2013). ‘Finding the urban crisis tipping point’. Retrieved 13/5/2014 , from http://www.irinnews.org/printreport.aspx?reportid=99168.
Ismail, S.J. (1991). Nutritional surveillance: experiences from developing countries. Proceedings of the Nutrition Society. 50, 673–9.
Jefferds, M.E. (2011). Integrated Surveillance System for Nutrition Interventions in Nicaragua (SIVIN). A2Z Cornerstone Meeting, June 13, 2011.
Kameli, Y., Ndiaye, B., Castan, F., Fortin, S., Tapsoba, S. and Martin-Prevel, Y. (2012). Food security and Nutrition Surveillance in Urban Areas for Improved Decision Making, A case-study in Ouagadougou and Bobo-Dioulasso, Burkina Faso. International Scientific Symposium on Food and Nutrition Security Information : From valid measurement to effective decision making. Rome.
Khara, T. and Dolan, C. (2014). Technical Briefing Paper: The relationship between wasting and stunting, policy, programming and research

NU
TR
ITIO
N S
URV
EILL
AN
CE
SYST
EMS
96
implications. Technical Briefing Paper. Emergency Nutrition Network.
Ki-Moon, B. (2010). Global Strategy for Women’s and Children’s Health. New York, UN.
Kiess, L., Jr., Moench-Phanner, R., Bloem, M.W., Pee, S., Sari, M. and Kosen, S. (2000). New Conceptual Thinking about Surveillance: Using Micronutrient Status to Assess the Impact of Economic Crises on Health and Nutrition. Malaysian Journal of Nutrition. 6, 223–232.
Korenblum, J. (2012). Mobile phones and crisis zones: how text messaging can help streamline humanitarian aid delivery. Humanitarian Exchange Magazine.
Kumar, A. (2012). Nutrition Assessment Methods in Ethiopia. Unpublished note for information.
Langmuir, A.D. (1963). The surveillance of communicable diseases of national importance. New England Journal of Medicine. 268, 182–92.
Letouzé, E. (2012). Big Data for Development: Challenges & Opportunities. New York, UN.
Lucas, H., Greeley, M. and Roelen, K. (2013). Real Time Monitoring for the Most Vulnerable: Concepts and Methods. IDS Bulletin. 44, 15–30.
Mack Smith, S. (2012). Food Crisis in the Horn of Africa Progress Report July 2011–July 2012. Oxford, Oxfam International.
Maire, B., Beghin, I., Delpeuch, F. and Kolsteren, P. (2001). Nutritional Surveillance: A Sustainable Operational Approach. Antrewp, Belgium: ITG Press.
Mangasaryan, N., Arabi, M. and Schultink, W. (2011). Revisiting the concept of growth monitoring and its possible role in community-based nutrition programs. Food and Nutrition Bulletin. 32.
Manyama, I.B., Abate, G. and Tamiru, M. (2011). The Emergency Nutrition Coordination Unit of Ethiopia, roles, responsibilities and achievements. Field Exchange. 40, 32.
Marin, C.M., Segura, J.L., Bern, C., Freedman, D.S., Guillermo Lescano, A., Benavente, L.E., et al. (1996). Seasonal change in nutritional status among young children in an urban shanty town in Peru. Transactions of the Royal Society of Tropical Medicine and Hygiene. 90, 442–5.
Mason, J., Habicht, J.P., Tabatabai, H. and Valverde, V. (1984). Nutritional surveillance. Geneva: World Health Organization.
Mason, J.B. and Mitchell, J.T. (1983). Nutritional surveillance. Bulletin of the World Health Organization. 61, 745–55.
Mason, J.B. (2010). Nutrition surveillance in relation to the food price and economic crises. In: Haytmanek, E. and Mcclure, K. (Eds.) Mitigating the nutritional impacts of the global food price crisis: workshop summary. National Academies Press, pp 76–82.
Mason, J.B., Chotard, S., Cercone, E., Dieterich, M., Oliphant, N.P., Mebrahtu, S., et al (2010). Identifying priorities for emergency intervention from child wasting and mortality estimates in vulnerable areas of the Horn of Africa. Food & Nutrition Bulletin. 31, 234S–247S.
MEASURE Evaluation (2013). Haiti Nutrition Surveillance. Unpublished Report, Port au Prince, MEASURE Evaluation.
Ministerio de Salud, Republica de Nicaragua (2005). Sistema Integrado de Vigilancia de Intervenciones Nutricionales (SIVIN) Informe anual 2004.
Mock, N., Morrow, N. and Papendieck, A. (2013). From complexity to food security decision-support: Novel methods of assessment and their role in enhancing the timeliness and relevance of food and nutrition security information. Global Food Security. 2, 41–49.
Mohiddin, L., Phelps, L. and Walters, T. (2012). Urban malnutrition: a review of food security and nutrition among the urban poor. Nutrition Works.
Mora, J.O. (2007). Integrated system for nutrition program monitoring and evaluation (SIVIN) Brief review of the experience after 3 years of implementation (2003–2005). Micronutrient Forum Meeting 2007.
Mora, J.O., Boy, E., Lutter, C. and Grajeda, R. (2010). Anemia in Latin America and the Caribbean, 2009. Situation analysis, trends, and implications for public health programming. Washington DC, Pan American Health Organization.
Mulder-Sibanda, M. and Chowdhury, R.I. (1995). Decentralized data management in nutritional surveillance for timely warning and intervention. Disasters. 19, 140–7.
Mulder-Sibanda, M., Sibanda-Mulder, F.S., d’Alois, L. and Verna, D. (2002). Malnutrition in food-surplus areas: experience from nutritional surveillance for

REFER
ENC
ES
97
decentralized planning in Haiti. Food and nutrition bulletin. 23, 253–61.
Muzeiyn, Z. and Yohannes, E. (2011). Maintaining GOAL’s capacity to support surveillance in Ethiopia. Field Exchange. 40, 61.
National Nutrition Directorate of the Federal Ministry of Health Sudan and UNICEF (2012a). Sudan Nutrition Update Covering CMAM and surveillance Issue two: Q2 – April, May and June 2012.
National Nutrition Directorate of the Federal Ministry of Health Sudan and UNICEF (2012b). Sudan Nutrition Update Covering CMAM, surveillance and routine indicators Issue 3: Q3 – July, August and September 2012.
Negash, S. (2011). Enhanced Outreach Strategy/Targeted Supplementary Feeding for Child Survival in Ethiopia (EOS/TSF) Field Exchange. 40, 7.
Neufeld, L.M. and Tolentino, L. (2005). Nutritional Surveillance: Developing Countries. In: Caballero, B., Allen, L. and Prentice, A. (Ed.) Encyclopedia of Human Nutrition (Second Edition) Volume 3. Oxford: Elsevier, pp 371–381.
Nirina, I. (2012). Methodologie de Surveillance, ‘Listening Posts’, Projet Pilote au Burkina Faso.
Nisbett, N., Gillespie, S., Haddad, L. and Harris, J. (2014). Why Worry About the Politics of Childhood Undernutrition? World Development. 64, 420–433.
Nnyepi, M., Gobotswang, K.S. and Codjia, P. (2011). Comparison of estimates of malnutrition in children aged 0–5 years between clinic-based nutrition surveillance and national surveys. Journal of Public Health Policy. 32, 281–92.
NutritionWorks, Emergency Nutrition Network and Global Nutrition Cluster (2011). Module 10: Nutrition information and surveillance systems, Technical notes. The Harmonised Training Package (HTP): Resource Material for Training on Nutrition in Emergencies, Version 2 (2011) Oxford, Emergency Nutrition Network.
Oguta, T., Moloney, G. and Masese, L. (2008). Piloting LQAS in Somaliland. Field Exchange. 33, 26.
Olack, B., Burke, H., Cosmas, L., Bamrah, S., Dooling, K., Feikin, D.R., et al (2011). Nutritional status of under-five children living in an informal urban settlement in Nairobi, Kenya. J Health Popul Nutr. 29, 357–63.
Oliphant, N. (2005). Nutrition Surveillance in Malawi. Unpublished working paper for Short Course ‘Nutrition Information Systems in Eastern and Southern Africa’. Cape Town, University of the Western Cape , 20–24 August 2007, Tulane University School of Public Health and University of the Western Cape.
de Onis, M., Dewey, K.G., Borghi, E., Onyango, A.W., Blossner, M., Daelmans, B., et al (2013). The World Health Organization’s global target for reducing childhood stunting by 2025: rationale and proposed actions. Matern Child Nutr. 9 Suppl 2, 6–26.
Oxfam, Worldwide, C. and International, C. (2009). The Nairobi Informal Settlements: An emerging food security emergency within extreme chronic poverty – a compilation and synthesis of key food security, livelihood, nutrition and public health data. Oxfam GB, Concern Worldwide, Care International (Kenya).
Paciorek, C.J., Stevens, G.A., Finucane, M.M. and Ezzati, M. (2013). Children’s height and weight in rural and urban populations in low-income and middle-income countries: a systematic analysis of population-representative data. The Lancet Global Health. 1, e300–e309.
Palestinian Ministry of Health and UNICEF (2011). National Nutrition Surveillance Report Highlights January–June 2011.
Palestinian National Authority Ministry of Health (2011). National Nutrition Surveillance System 2011 Report.
Pelletier, D. and Johnson, F. (1994). The validity of clinic-based nutrition surveillance data: A study from selected sites in northern Malawi. Food and Nutrition Bulletin. 15.
Pelletier, D.L. and Msukwa, L.A.H. (1991). The use of national sample surveys for nutritional surveillance: Lessons from Malawi’s national sample survey of agriculture. Social Science and Medicine. 32, 887–98.
Pelletier, D.L., Porter, C.M., Aarons, G.A., Wuehler, S.E. and Neufeld, L.M. (2013). Expanding the frontiers of population nutrition research: new questions, new methods, and new approaches. Adv Nutr. 4, 92–114.
Pena-Rosas, J.P. and Perez, M. (2005). Organizations, programs and information systems for nutrition interventions in Nicaragua: an updated inventory. US Centers for Disease Control and Prevention

NU
TR
ITIO
N S
URV
EILL
AN
CE
SYST
EMS
98
(CDC) and Universidad Nacional Autónoma de Nicaragua (UNAN).
Phelps, L. (2013). From the Editor. Field Exchange. 46, 2.
Phiri, F.P. (2008). Evaluation of the Nutrition Surveillance Programme in Malawi. University of Malawi.
Popay, J., Roberts, H., Sowden, A., Petticrew, M., Arai, L., Rodgers, M., et al (2006). Guidance on the conduct of narrative synthesis in systematic reviews. A product from the ESRC methods programme.
Ramalingam, B. and Clarke, P.K. (2012). Meeting the urban challenge: Adapting humanitarian efforts to an urban world. ALNAP and ODI.
Rhoda, D.A., Fernandez, S.A., Fitch, D.J. and Lemeshow, S. (2010). LQAS: user beware. International Journal of Epidemiology. 39, 60–68.
Rivero, E., Salse, N. and Zapatero, E. (2008). Integrated Nutrition and Food Security Surveillance in Malawi. Field Exchange. 33, 21–23.
Rommelmann, V., Setel, P.W., Hemed, Y., Angeles, G., Mponezya, H., Whiting, D., et al (2005). Cost and results of information systems for health and poverty indicators in the United Republic of Tanzania. Bulletin of the World Health Organization. 83, 569–577.
Ruel, M.T. and Alderman, H. (2013). Nutrition-sensitive interventions and programmes: how can they help to accelerate progress in improving maternal and child nutrition? The Lancet. 382, 536–551.
Save the Children (2009). Listening Posts: A Hunger Monitoring System for Children An Integrated Approach for Country Programme and Global Analysis (December 2009) Draft.
Save the Children UK (2007). The Practitioners’ Guide to the Household Economy Approach. Regional Hunger and Vulnerability Programme (RHVP), Food Economy Group, Save the Children UK.
Save the Children UK (2013). A Cost of the Diet analysis in the fish cultivation and urban livelihood zones of Khulna. London. Save the Children.
Save the Children, Zimbabwe (2010). Hunger Monitoring Systems Cereal and Low Cotton Producing Communal July/October 2010. Unpublished report.
Scaling up Nutrition (2014). ‘Bringing People Together – Government’. Retrieved 4/06/14, from http://scalingupnutrition.org/sun-countries/malawi/progress-impact/bringing-people-together/government.
Schelling, E. (2013). Enhanced enrolment of pastoralists in the implementation and evaluation of the UNICEF-FAO-WFP Resilience Strategy in Somalia. UNICEF.
Schofield, L., Mohamed, S., Kimani-Murage, E., Wekesah, F., Mberu, B., Egondi, T., et al (2013). Spotting the invisible crisis: early warning indicators in urban slums of Nairobi, Kenya. Field Exchange. 55–59.
Semba, R.D., de Pee, S., Sun, K., Sari, M., Akhter, N. and Bloem, M.W. (2008). Effect of parental formal education on risk of child stunting in Indonesia and Bangladesh: a cross-sectional study. Lancet. 371, 322–8.
Serdula, M., Herman, D., Williamson, D., Binkin, N.J., Aphane, J. and Trowbridge, F. (1987). Validity of clinic-based nutritional surveillance for prevalence estimation of undernutrition. Bulletin of the World Health Organization. 65, 529.
Shafique, S., Akhter, N., Stallkamp, G., de Pee, S., Panagides, D. and Bloem, M.W. (2007). Trends of under- and overweight among rural and urban poor women indicate the double burden of malnutrition in Bangladesh. International Journal of Epidemiology. 36, 449–57.
Shoham, J., Watson, F. and Dolan, C. (2001). The use of nutritional indicators in surveillance systems. Nutrition Works/ODI, Technical Paper.
SMART (2006). Measuring Mortality, Nutritional Status, and Food Security in Crisis Situations: SMART Methodology. Retrieved 21/3/15, from http://smartmethodology.org/survey-planning-tools/smart-methodology/
SMART (2012). Sampling Methods and Sample Size Calculation for the SMART Methodology. Retrieved 21/3/15, from http://www.humanitarianresponse.info/system/files/documents/files/Sampling_Paper_June_2012.pdf
Solarsh, G.C., Sanders, D.M., Gibson, C.A. and Gouws, E. (1994). Community-based survey versus sentinel site sampling in determining the nutritional status of rural children. Implications for nutritional surveillance and the development of nutritional
REFER
ENC
ES
99
programmes. South African medical journal = Suid-Afrikaanse tydskrif vir geneeskunde. 84, 747–752.
Sphere Project (2004). Humanitarian Charter and Minimum Standards in Disaster Response. Geneva: The Sphere Project.
Stansfield, S., Walsh, J., Prata, N. and Evans, T. (2006). Information to Improve Decision Making for Health. In: Jamison, D. T., Breman, J. G., Measham, A. R., Alleyne, G., Claeson, M., Evans, D. B., et al (Eds.) Disease Control Priorities in Developing Countries. 2nd ed. New York: Oxford University Press, pp 1017–1030.
Taylor, A. (2010). Listening Posts Project: a concept for a real-time surveillance system nested within a program. In: Haytmanek, E. and Mcclure, K. (Eds.) Mitigating the nutritional impacts of the global food price crisis: workshop summary. National Academies Press, pp 88–91.
te Lintelo, D. (2014). Accountability for International Nutrition Commitment Initiatives. Brighton, Institute of Development Studies.
Teller, C. (2008). Technical assessment of data quality and information use of the Malawi integrated nutrition and food security surveillance system: developing the system’s capacity and importance for nutrition planning, intervention, monitoring and evaluation. Final Report to OPC, Malawi, and AGN/FAO. Rome: Food and Agriculture Organization (FAO)
Thacker, S.B., Qualters, J.R. and Lee, L.M. (2012). Public Health Surveillance in the United States: Evolution and Challenges. Morbidity and Mortality Weekly report. 61, 3–9.
Torlesse, H., Kiess, L. and Bloem, M.W. (2003). Association of household rice expenditure with child nutritional status indicates a role for macroeconomic food policy in combating malnutrition. Journal of Nutrition. 133, 1320–5.
Trowbridge, F.L. and Stetler, H.C. (1980). Nutritional Status Surveillance in El Salvador. Bulletin of the World Health Organization. 58, 327–332.
UN (2012). Rapid Impact and Vulnerability Analysis Fund (RIVAF) Final Report. New York, UN.
UNICEF (1990). Strategy for improved nutrition of children and women in developing countries. New York, UNICEF.
UNICEF (2010a). Developing nutrition information systems in Eastern and Southern Africa – Summary Report of Regional Technical Working Group Meetings, Nairobi, 1–3 February and 19–21 April 2007. Food and nutrition bulletin. 31, S272–S285.
UNICEF (2010b). Child malnutrition in Chad, it’s time to act. New York, UNICEF.
UNICEF (2013). Global SAM management update, Summary of findings. New York, UNICEF.
UNICEF and Federal Ministry of Health – Sudan. (2007). Darfur Nutrition Update December 2006–February 2007
UNISDR and WMO (2012). Disaster risk and resilience, Thematic Think Piece. United Nations International Strategy for Disaster Reduction and World Meteorological Organization.
United Nations Economic Commission for Africa Subregional Office for Southern Africa (2011). Enhancing the Effectiveness of Food Security Information Systems in SADC
Valverde, V., Delgado, H., Flores, R., Sibrian, R. and Palmieri, M. (1985). The school as a data source for food and nutrition surveillance systems in Central America and Panama. Food Nutr Bull. 7, 32–7.
Valverde, V., Delgado, H., Flores, S., Sibrian, R. and Palmieri, M. (1986). Uses and constraints of school children’s height data for planning purposes: national experiences in Central America. Food Nutr Bull. 8, 42–48.
Valyasevi, A., Winichagoon, P. and Dhanamitta, S. (1995). Community-based surveillance for action towards health and nutrition: experience in Thailand. Food and Nutrition Bulletin. 16.
van der Heide, A. (2008). Evaluation of the sustainable nutrition rehabilitation project (SNRP) and review of the integrated nutrition and food security surveillance system (INFSSS). Action against Hunger, for the Joint Food and Nutrition Security Task Force of Malawi and the Delegation of the EC to Malawi.
Vespa, J. and Watson, F. (1995). Who is nutritionally vulnerable in Bosnia-Hercegovina? BMJ. 311, 652–654.
Victora, C.G., Habicht, J.P. and Bryce, J. (2004). Evidence-based public health: moving beyond randomized trials. American Journal of Public Health. 94, 400–5.

NU
TR
ITIO
N S
URV
EILL
AN
CE
SYST
EMS
100
Wagstaff, A., Claeson, M., Hecht, R., Gottret, P. and Fang, Q. (2006). Millennium Development Goals for Health: What Will It Take to Accelerate Progress? In: Jamison, D. T., Breman, J. G., Measham, A. R., Alleyne, G., Claeson, M., Evans, D. B., et al. (Eds.) Disease Control Priorities in Developing Countries. 2nd ed. New York: Oxford University Press, pp 181–194.
Watson, F., Dolan, C., Shoham, J. and Buchanan-Smith, M. (2006). A Review of Save the Children UK’s Nutritional Surveillance Programme in Ethiopia. London, Nutrition Works: International Public Nutrition Resource Group.
Watson, F., Negussie, B., Dolan, C., Shoham, J. and Hall, A. (2011). Quality and potential use of data collected during nutrition surveys: an analysis of surveys in Ethiopia. International Health. 3, 85–90.
Welsh, J. (2003). Nicaragua Integrated System for Monitoring of Nutritional Interventions – SIVIN.
Welsh, J. (2004). Integrated Surveillance System for Nutrition Interventions in Nicaragua (SIVIN) Results Year One July 2002 to Oct 2003. MCN Branch Seminar 18 March 2004.
White, J. and Mason, J. (2012). Assessing the impact on child nutrition of the Ethiopia Community-based Nutrition Program. New Orleans, Tulane University School of Public Health and Tropical Medicine.
WHO (1976). Methodology of nutritional surveillance. Report of a Joint FAO/UNICEF/WHO Expert Committee. World Health Organization Technical Report Series. FAO/UNICEF/WHO.
WHO (1989). Guidelines for the Development of a Food and Nutrition Surveillance System for Countries in the Eastern Mediterranean Region. WHO EMRO Technical Publication. Alexandria, WHO Regional Office for the Eastern Mediterranean.
WHO (2011). Country health information systems. A review of the current situation and trends. Geneva, WHO.
WHO (2013a). A draft framework for the global monitoring of the Comprehensive Implementation
Plan on Maternal, Infant and Young Child Nutrition (6 September 2013). Informal Consultation with Member States and UN Agencies on a Proposed Set of Indicators for the Global Monitoring Framework for Maternal, Infant and Young Child Nutrition.
WHO (2013b). Essential Nutrition Actions: improving maternal, newborn, infant and young child health and nutrition. Geneva, World Health Organization.
WHO (2013c). Food and nutrition surveillance systems Technical guide for the development of a food and nutrition surveillance system. WHO Regional Publications, Eastern Mediterranean Series. Cairo, WHO Regional Office for the Eastern Mediterranean.
WHO (2014a). Indicators for the Global Monitoring Framework on Maternal, Infant and Young Child Nutrition. Geneva, World Health Organization.
WHO (2014b). ‘Urban population growth’. Retrieved 13/5/14, from http://www.who.int/gho/urban_health/situation_trends/urban_population_growth_text/en/.
World Bank (2004). Paris 21, Partnership in Statistics for Development in the 21st Century, Six Country Case Studies. Washington DC, World Bank.
Wright, J., Gundry, S., Ferro-Luzzi, A., Mucavele, P., Russell, G. and Nyatsanza, J. (2001). Assessment of bias in national growth-monitoring data: A case study in Zimbabwe. Food & Nutrition Bulletin. 22, 31–38.
Young, M.E. (editor) (2007). Early child development from measurement to action, a priority for growth and equity. Washington DC, World Bank.
Young, H. and Jaspers, S. (2009). Review of Nutrition and Mortality Indicators for the Integrated Food Security Phase Classification (IPC) Reference Levels and Decision-making UN Inter-Agency Standing Committee (IASC) Nutrition Cluster and ECHO through the Global IPC Partnership.
Zambrano, R. and Seward, R.K. (2014). Mobile technologies and innovation: Case studies in m-governance. UNDP.

101
1 This aim may appear tautological, but see Section 2.2 for the distinction between the terms used.2 Information systems are an integrated set of hardware, software, data, people and procedures that produce information.3 To reflect the broad remit of information systems that include food security, mortality and morbidity data, these are sometimes termed Food and Nutrition Information Systems (FNIS) such as in Uganda, rather than the more lengthy term Food, Health and Nutrition Information System (FHANIS) only adopted by Zambia.4 A survey is a systematic method for gathering information from (a sample of) entities for the purpose of constructing quantitative descriptors of the attributes of the larger population of which the entities are members (Groves et al, 2013). 5 The framework has recently been adapted to include actions (Figure 1 from Black, Victora et al, 2013). Optimum foetal and child nutrition and development is now the focus, having replaced maternal and child undernutrition, and the framework shows how ‘nutrition-specific’ interventions address the immediate causes of sub-optimum growth and development, and how ‘nutrition-sensitive’ interventions address their underlying causes. It also indicates ways in which an enabling environment can be built to support interventions and programmes. Thus the new framework integrates the action part of the Triple A cycle, and should help stakeholders to advocate and develop appropriate responses to the information derived from surveillance data.6 Administrative sources are collections of data held by government, which are gathered and used for the purposes of administering taxes, benefits or services.7 Design is 33 clusters of 6 children in each, 4 surveys per year. 8 Design is 25 clusters of 12 children in each, 3 surveys per year.9 Design is 33 clusters of 6 children in each, 4 surveys per year .10 30 Ï variable cluster size (depends on sample size calculation), variable periodicity.11 Admissions in weeks 30–39 reflected rises in the price of millet during weeks 25–34. The surge in admissions partly related to an increase in the number of feeding centres, but mostly to a rise in child malnutrition rate, since the strong trend still existed when data from only those eight centres which existed in 2004 were included.12 Centric Systematic Area Sampling (CSAS), Simplified Lot Quality Assurance Sampling Evaluation of Access and Coverage (SLEAC), Semi-Quantitative Evaluation of Access and Coverage (SQUEAC) and Simple Spatial Survey Methods (S3M).13 CMAM is included under a) not b) since the identification and treatment of children with acute malnutrition is done in the community. Only severely malnourished children who are <6m. old or who have medical complications are referred for care in a health facility.14 Health days occur every one to six months and usually involve collecting data on one anthropometric indicator, often MUAC. The screening is often combined with delivering other interventions, and all children at the site are included. 15 This model was described by Pelletier and Msukwa (1991). They recognised that data being collected for surveillance mainly from growth monitoring and national sample surveys were not sufficient for certain types of planning decisions. They suggested that future surveillance systems should build local capacity to undertake ad hoc investigations using formal and informal surveys and quantitative and qualitative methods, and so support analyses based on existing data. 16 Any inference will be weak since studies which are actually designed to identify ‘causality’ are complex and need considerable financing, planning and supervision. 17 Some practitioners prefer to use the word ‘reflect’ as it has no statistical connotations. 18 In fact the design of the system may be such that the findings are statistically representative of the individual site, for example of a certain slum area, but the slum area is acting as a sentinel site for the larger urban area (see Section 2.5). Thus the application of the term sentinel depends on the level at which one can validly claim the findings are statistically representative.
19 This is the multiplier used to adjust the estimate of required sample size to take the cluster design into account. The CDC ‘2 surveys’ calculator is helpful as one can examine the effect of different survey designs on the required sample size. (http://www.cdc.gov/globalhealth/healthprotection/errb/researchandsurvey/calculators.htm)20 There is likely to be a substantial time lag between changes in the values of such indicators and changes in the values of the nutritional outcome variables. Data on variables of underlying causes may still be useful to identify increased nutritional risk, but on a cross-sectional basis, correlations with nutritional outcomes will be weaker with underlying than immediate causal indicators.21 In 2012 the 65th World Health Assembly approved a Comprehensive Implementation Plan on maternal, infant and young child nutrition, including six global targets: improvements by 2025 in stunting, anaemia, low birthweight, overweight, exclusive breastfeeding, and wasting (see Appendix B.1). Action 5 of the plan is to monitor and evaluate the implementation of policies and programmes, and calls for a monitoring framework to assess progress. The case for strengthening national surveillance systems to monitor achievement towards targets has been made by de Onis et al (2013).22 Seasonal ranges have been listed for different African countries (Chotard, Mason et al, 2010 ), and fluctuations in prevalence of wasting were found to be greatest among pastoralists during years of drought, in comparison with other livelihood groups.23 However, administrative data collected for surveillance can be a useful adjunct to custom primary data collection to evaluate effectiveness of programmes, for example in Ethiopia (White and Mason, 2012)24 In order to plausibly attribute changes in outcomes to programme activities, a custom-designed survey is needed, that is, a prospective design with some form of both before-after measures, and comparisons either with-without the intervention, or with significant variation in exposure to the interventions.25 Anthropometric data can also be used retrospectively to identify, characterise and validate other predictive indicators for future use (eg, agricultural and climatic). In this case, the data do not need to be available quickly (Beaton, Kelly et al, 1990).26 Staff should be trained or re-trained before each round of data collection. As well as optimising data quality, there are cost-savings related to having rounds which are sufficiently frequent, or which include different areas in turn, to enable teams to be employed continuously and to avoid the need to recruit and train new staff for each survey. Ideally, data collectors are locally recruited or the same teams return to the same communities as this promotes an in-depth understanding, like in the Bangladesh NSP.27 Paper-based forms can be poorly legible and the forms can be damaged, for example by humidity. Raw data can be repeatedly transferred manually to different paper forms and to reports during the monitoring process, with the potential to introduce errors each time. Also during growth monitoring, nutritional status is often calculated based on manual plotting of the measurements on the growth charts, so errors are more likely than with an electronic calculation.28 Derived from a critical evaluation of a selection of reports (not those listed in Box 5.1), and discussions with key informants.29 The importance of advocacy for meeting global targets for stunting reduction, etc was described by Pelletier et al, 2013.30 For example, the potential of macroeconomic food policies to prevent malnutrition was demonstrated when data analysis showed an association between rice prices and the prevalence of underweight (Torlesse et al, 2003).31 Once the information is in the public domain it is difficult to withhold from users.32 The consumption of information does not lessen its availability for use by others.33 There is a disadvantage when the funder and implementer are the same institution: it can lead to institutional isolation, which can reduce ‘buy-in’ and therefore affect responses. The NSP in Ethiopia led by Save the Children UK is an example (Watson et al, 2006).
NOTES

NU
TR
ITIO
N S
URV
EILL
AN
CE
SYST
EMS
102
34 The choice of the Ministry of Planning seems ideal because the surveillance system is then external to both of the two key Ministries, of Health and Food, whose activities are designed to influence nutritional status and food security, so the findings can be perceived as impartial. The Bureau of Statistics is committed to making the system work and has a good experience conducting substantial national surveys. 35 A stakeholder is any individual or entity that is involved, directly or indirectly, in any stage in the programme including the ultimate beneficiaries (Gillespie, 2001).36 When trying to estimate the value of nutrition surveillance systems, and whether they are cost-effective, ideally this would be expressed in terms of cost savings, for example due to increased coverage or quality of services, or of improved health outcomes, for example, children’s lives saved or improved health equity. However, clearly it is impossible to show a direct link between the existence of nutrition surveillance systems and improved services or health outcomes, because there are so many other factors that have contributory influences. All that can be done for the purposes of this report is to document the costs of systems as far as possible, so that they can be compared, and uses of the information recorded.37 The table shows that new approaches for sampling lead to a lower total cost of the survey but higher cost per participant.38 DFID considers its support of the Ethiopian system offers value for money via “… identifying early where malnutrition problems are taking hold. Nutritional monitoring was instrumental in identifying early the onset of the 2011 drought indicating which areas were most affected and facilitating improved emergency coordination of partners, supplies and resources to affected areas. This translated into the lives of children being saved” (DFID, 2013). 39 Here capacity is defined as “The ability of individuals and organizations or organizational units to perform functions effectively, efficiently, and sustainably” (UNDP, 2000).40 Regional Technical Working Group Meetings “Developing nutrition information systems in Eastern and Southern Africa” organised through NIPHORN (Nutrition Information Project for the Horn of Africa) and supported by UNICEF and Tulane University.41 This may not be a top priority for a country’s government, and there might be an element of reluctance if the data may show that the country is not performing well in comparison with others.42 There is a large body of literature on growth monitoring, and whether the research is old (Gerein, 1988) or recent (Ashworth, Shrimpton et al, 2008) there is little evidence that it is an effective intervention to promote child growth. However, it seems to be a useful vehicle for providing health interventions (Mangasaryan et al, 2011). In a recent review of nutrition interventions targeting the first 1,000 days of life, while growth monitoring by itself has no efficacy, it was found to be included as an operational programme component in most programmes which had been identified as effective (WHO (2013b p.73). 43 The primary objective of the EOS is to reduce child morbidity and mortality in drought-prone areas by providing child survival activities. The potential use of the data for surveillance was recognised by Chotard, who proposed selecting some EOS sites as sentinel sites (Chotard, 2005). Currently the EOS data are used together with other approaches for national surveillance (DFID 2013). 44 One of the supplementary objectives of the Malnutrition Removal Campaign is social transformation by participation of the community, so that the responsibility for nutrition management is transferred from the government to civil society.45 There is no internationally agreed definition of ‘urban’ or ‘slum’. Since the distinction between rural and urban is not binary, the World Bank uses a continuum model and considers the three factors of diversity, density and dynamics (Ramalingam and Clarke, 2012). The characteristics typical of urban areas and slums were summarised by Phelps in 2013.46 Ibid.47 The few documented examples of nutrition surveillance in urban areas include those of Bangladesh (Bloem et al, 2003 and Helen Keller International and BRAC Institute of Global Health (BIGH) 2014), Burkina Faso (Kameli et al, 2012), Kenya (Fotso et al, 2012; Abuya et al, 2012; Olack et al, 2011), in Guinea (Helen Keller International, 2007) and Peru (Marin et al, 1996). 48 More than half of the world’s large cities are located in areas of high earthquake risk (UNISDR and WMO, 2012).49 Here ‘real time’ means the most recently collected data.
50 Here automation means a method of undertaking a task using electronic devices, which reduces human intervention.51 E = electronic version (pdf); H = Hard copy; Link = need internet access to read paper.52 Specific; Measurable (and also reliable, comparable and contextually appropriate); Achievable (and also cost-effective); Relevant and Time-bound (and also sensitive).53 % below minus 2 Z score weight-for-height (% < -2 WHZ) for wasting and below minus 3 Z score for severe wasting.54 % below minus 2 Z score height-for-age (% < -2 HAZ).55 % below minus 2 Z score weight-for-age (% < -2 WAZ).56 % below BMI threshold % < 18.5kg/m2.57 % below minus 2 Z score BMI-for-age (% < -2 BAZ).58 % below 2,500g.59 % below MUAC threshold (< 12.5cm moderate acute malnutrition and < 11.5cm severe acute malnutrition).60 As well as providing information on the vaccination and supplementation status of the child, these indicators serve as useful proxy indicators for access to health services. 61 That is, we are happy to accept a chance of 1 in 20 that we make a Type 1 error, that is, we mistakenly say the effect exists when in fact it does not. (A type 2 error occurs when we mistakenly say the effect does not exist when in fact it does.)62 This terminology is confusing since, as described in the previous paragraph, a false positive with respect to detecting malnutrition would be a false negative according to the statistical test.63 Examples used are situations with high prevalence rates, which presumably explains the discrepancy between their conclusions and those in the previously mentioned paper.64 The number of partner NGOs increased rapidly as the system expanded to cover more regions of the country; 34 NGOs were involved between 1990 and 2000.65 The % lost to follow-up for each round was calculated from counting repeated database entries, since the number of children successfully followed up was not reported. This explains why the number of children for whom data exist (column 3 in Table 4.1) differs from the numbers reportedly measured (column 2 in Table 4.1).66 One criticism of the system is that coverage was so low – within each survey area, there were only very small numbers of clusters spread across very large areas, compared to surveys which are carried out nowadays.67 TFP admissions data are compiled at woreda, zonal, regional and national level on a monthly basis (Manyama et al, 2011). There are 11,050 TFP sites across approximately 600 districts (DFID, 2013).68 The RapidSMS Malawi Child Nutrition Surveillance Project started in 2009, implemented by an external team from Columbia University’s School of International and Public Affairs (SIPA) with support from UNICEF Malawi and UNICEF’s Innovations Unit – see below.69 The exact objectives from a planning document have not been ascertained.70 This description covers the period until 2005.71 Although see footnote above.72 alpha1-acid glycoprotein, used to identify the influence of inflammation on the distribution of iron status biomarkers.73 The MOST Project was a seven-year activity funded by the USAID (1998–2005) to assist implementation of programmes and policies to prevent and control micronutrient malnutrition.74 This is the total cost per study participant divided by the period which the study covers.75 Estimate of cost per participant during 2001–03. Per capita (in the total country population) annualised cost is $0.02 assuming a population of 30 million.76 Shading signifies author’s own calculation.77 This includes: salaries and allowances for 36 national staff and one international technical manager; vehicles, fuel and maintenance; report production and survey costs; and administration and overheads.78 A data visualisation is a pictorial representation of data, for example an animation, map, chart or picture, which is produced by specially designed software.

This comprehensive review was stimulated by the growing need for data on nutrition outcomes to track changes over time and assess the progress of nations towards international development goals such as the World Health Assembly global nutrition targets. The review assesses the use and value of nutrition data for a number of other purposes including early warning of malnutrition, to guide the development of national and regional policies and programmes, and for evaluating their impact on populations.
Nutrition Surveillance Systems: their use and value also examines the wide variety of methods used to collect data for nutrition surveillance, giving many examples from past and current data collection systems. It goes on to assess how those data are used for decision-making and the dissemination of findings in forms that are accessible to different audiences, and describes the problems that may arise with ownership, capacity building and the sustainability of nutrition surveillance systems.
This review was commissioned by Save the Children and funded by the UK Department for International Development through the Transform Nutrition Research Programme Consortium.
savethechildren.org.uk
CO
VER
PHO
TO
: LUC
A K
LEVE-R
UU
D
Their use and value
NUTRITIONSURVEILLANCE SYSTEMS