Embed Size (px)
Citation preview

www.elsevier.com/locate/jembe
Journal of Experimental Marine Biolog
Nutritional condition, starvation status and growth of early juvenile
Japanese sea bass (Lateolabrax japonicus) related to prey
distribution and feeding in the nursery ground
Md. Shahidul Islam*, Masaru Tanaka
Division of Applied Biosciences, Graduate School of Agriculture, Kyoto University, Kyoto 606-8502, Japan
Received 10 January 2005; received in revised form 23 March 2005; accepted 4 April 2005
Abstract
The nutritional condition and protein growth rates of Japanese temperate bass larvae and juveniles were studied in relation to
prey distribution and feeding habits in the nursery grounds in Chikugo estuary, Ariake Sea, Japan. Samples were collected from a
wide spatial area covering the nursery grounds of the fish in March and April 2003. Food habits of the fish were analyzed by
examining the gut contents. Fish condition was evaluated by using RNA/DNA ratio and other nucleic acid-based indices and
protein growth rates. The nucleic acid contents in individually frozen larvae and juveniles were quantified by fluorometric method.
Two distinguished feeding patterns, determined by the distribution of prey copepods, were identified along the nursery ground.
The first pattern showed the dependency of the fish on the calanoid copepod Sinocalanus sinensis, which was the single dominant
prey in low saline upper river areas and the second pattern involved a multi-species dietary habit mainly dominated by Acartia
omorii, Oithona davisae and Paracalanus parvus. Values of RNA, DNA, total protein, growth rates and for all the nucleic acid-
based indices were higher in upstream areas than in the downstream areas. The proportion of the starving fish was higher in the
downstream areas than in the upstream areas. Condition of juvenile sea bass was not equal throughout the nursery grounds; fish
in the upper river were in better condition than those in the lower estuary. We speculated that utilization of S. sinensis, which
appears a suitable prey item and provide a better foraging environment in the upstream nursery ground, is one of the key factors
for early survival and growth of Japanese temperate bass larvae and juveniles in the Chikugo estuary.
D 2005 Elsevier B.V. All rights reserved.
Keywords: Nutritional condition; RNA/DNA ratio; Starvation; Protein growth rate; Japanese temperate bass; Ariake Sea
0022-0981/$ - see front matter D 2005 Elsevier B.V. All rights reserved.
doi:10.1016/j.jembe.2005.04.007
* Corresponding author. Tel.: +81 75 753 6225; fax: +81 75 753
6229.
E-mail address: [email protected] (Md.S. Islam).
1. Introduction
The condition of fish larvae may affect the prob-
ability of their survival because larvae in poor condi-
tion are not only more vulnerable to predation, disease
and unfavorable environmental conditions but also are
y and Ecology 323 (2005) 172–183

Md.S. Islam, M. Tanaka / J. Exp. Mar. Biol. Ecol. 323 (2005) 172–183 173
less efficient in foraging (Amara and Galois, 2004).
Therefore, assessment of the nutritional condition of
field-caught larvae helps to predict larval survival and
year-class fluctuations (Richard et al., 1991). RNA/
DNA ratio has been proven as a useful and reliable
indicator of nutritional condition and growth of larval
and juvenile fishes that has been widely applied to
laboratory-reared as well as wild fishes (Buckley,
1980; Clemmesen, 1987, 1988; Robinson and Ware,
1988; Bailey et al., 1995; Rooker and Holt, 1996;
Canino, 1997; Chicharo, 1997, 1998; Chicharo et
al., 1998a,b; Buckley et al., 1999). The quantity of
DNA in most animal cells is believed to be normally
stable but RNA quantity varies with physiological
status, the requirement for protein synthesis and
growth (Buckley et al., 1999). Because mRNA,
tRNA and rRNA are essential for the biosynthesis of
protein, the quantity of bulk RNA in a cell varies in
response to changes in demand for protein synthesis.
RNA quantities are high in rapidly growing organisms
(Bergeron, 1997; Buckley et al., 1999); any factor
preventing or slowing growth is reflected by a reduc-
tion in RNA quantities. Among such factors, the
nutritional condition seems to be the most studied
and the most widely used. Nutritional condition is
associated with food supply and feeding success of
the fish and, therefore, variability in the trophic envir-
onment is reflected in the nutritional condition of fish.
Since the larval stage of fish is characterized by rapid
exponential growth (i.e., rapid protein synthesis),
RNA/DNA ratio is a good index of relative growth
rate (Buckley et al., 1999), reflecting the role of
variable trophic environment in the field.
Japanese temperate bass (Lateolabrax japonicus),
one of the dominant members of the fish assemblage
of Ariake Sea, is an important species of the commer-
cial as well as sport fishery and a highly promising
species for sea farming in winter (Matsumiya et al.,
1982). This is also an ecologically important species
because, in Ariake Sea, the fish is an endemic species
and is genetically unique and an independent popula-
tion. Nursery grounds of the fish are located in the
estuarine waters and the life history is characterized
by river ascension to arrive in fresh water nursery
areas from the sea. Therefore, the species is highly
suitable for the study of larval ecophysiology because
the fish is exposed to severe environmental changes.
However, the role of different habitats in supporting
larval and juvenile Japanese sea bass and the nutri-
tional condition of the bass in the nursery grounds
have not been clarified yet. In the present study, we
have described the spatial patterns in dietary habits of
the larval and early juvenile Japanese sea bass and
have attempted to investigate the growth rates and
condition of larval and early juvenile Japanese sea
bass along the estuary using RNA/DNA ratio and
other nucleic acid-based indices.
2. Materials and methods
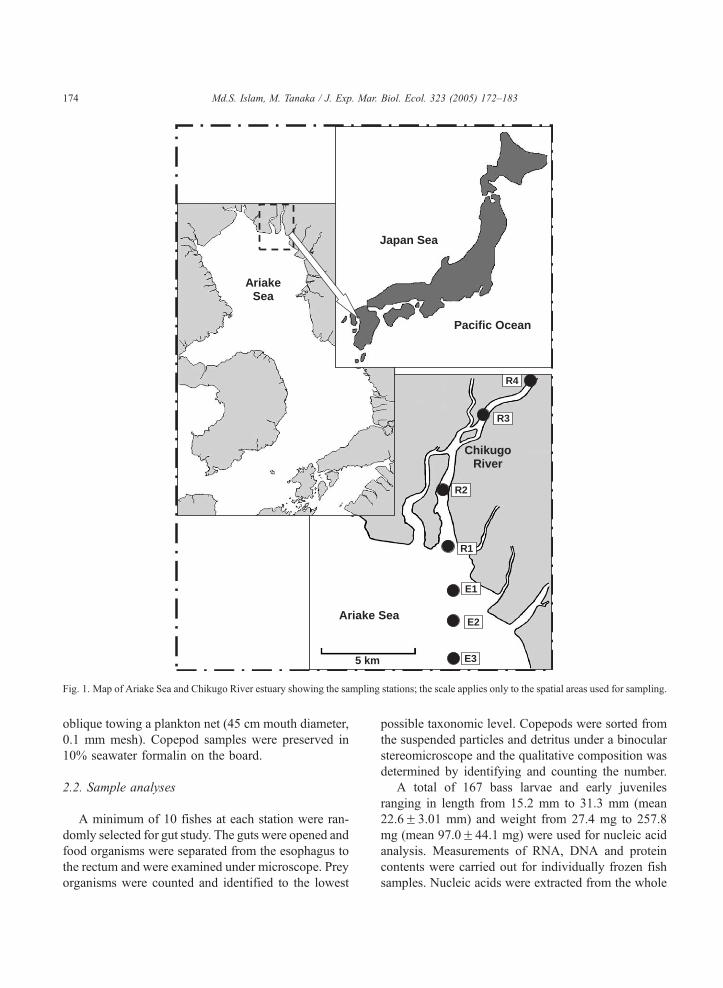
2.1. The study area and sampling
The Ariake Sea, the largest tidal wetland of Japan, is
located at the southwestern part of Japan. The Chikugo
estuary is the largest estuary of the Ariake Sea, with the
highest tidal differences in Japan. Seven sampling sta-
tions were set up along Chikugo estuary (Fig. 1). The
sampling stations are lined along the tideway of the
Chikugo River. Among them, four stations were posi-
tioned along the river (R4–R1) and the other three
were outside the river mouth along the estuary (E1–
E3). Station R1 is located at the river mouth and R4 is
the uppermost station, 16 km upstream from the
mouth and with little seawater influence even at spring
high tide. Starting from the river mouth, the estuarine
stations were positioned on the tidal flat and E3 is the
most distant station with the highest salinity.
Larval and juvenile fish samplings at selected sta-
tions were carried out by two research cruises in March
and April 2003. Samples were collected by surface
towing with a larval ring net (1.3 m mouth diameter, 1
mm mesh size along the body and 0.33 mm mesh size
at the cod end) for 10 min against tidal flow. Sea bass
samples were sorted and immediately frozen on dry ice
on board and transported to the laboratory for subse-
quent storage in a deep freezer at �85 8C. All larvaeand juveniles were counted, total length (TL) was
measured to the nearest 0.1 mm with a digital slide
calipers and weight was measured with a sensitive
electronic balance to the nearest 0.1 mg.
During each cruise, hydrographic data and plank-
ton samplings were also carried out. Temperature and
salinity were recorded at each station by an Environ-
mental Monitoring System (YSI 650 MDS, YSI Incor-
porated, USA). Copepod samples were collected by
R4
R3
R2
R1
E1
E2
E3
Japan Sea
Pacific Ocean
5 km
Ariake Sea
Ariake Sea
Chikugo River
Fig. 1. Map of Ariake Sea and Chikugo River estuary showing the sampling stations; the scale applies only to the spatial areas used for sampling.
Md.S. Islam, M. Tanaka / J. Exp. Mar. Biol. Ecol. 323 (2005) 172–183174
oblique towing a plankton net (45 cm mouth diameter,
0.1 mm mesh). Copepod samples were preserved in
10% seawater formalin on the board.
2.2. Sample analyses
A minimum of 10 fishes at each station were ran-
domly selected for gut study. The guts were opened and
food organisms were separated from the esophagus to
the rectum and were examined under microscope. Prey
organisms were counted and identified to the lowest
possible taxonomic level. Copepods were sorted from
the suspended particles and detritus under a binocular
stereomicroscope and the qualitative composition was
determined by identifying and counting the number.
A total of 167 bass larvae and early juveniles
ranging in length from 15.2 mm to 31.3 mm (mean
22.6F3.01 mm) and weight from 27.4 mg to 257.8
mg (mean 97.0F44.1 mg) were used for nucleic acid
analysis. Measurements of RNA, DNA and protein
contents were carried out for individually frozen fish
samples. Nucleic acids were extracted from the whole

0
3
6
9
12
15
18
0
5
10
15
20
25
30
R4 R3 R2 R1 E1 E2 E3
MarchAprilMean
Sampling stations
Sal
init
y (P
SU
) T
emp
erat
ure
(0 C
)
Fig. 2. Variation in temperature and salinity along Chikugo estuary.
Temperature was fairly stable over the spatial scale, while there was
a salinity gradient with increasing salinity downstream.
0
11
22
33
44
55
R4 R3 R2 R1 E1 E2 E3
March April
Sampling stations
Nu
mb
er o
f fi
sh
Fig. 3. The number of larval and juvenile fish collected form seven
sampling stations along Chikugo estuary during March and Apri
2003. The upstream areas had generally higher number of fish than
the lower estuary.
Md.S. Islam, M. Tanaka / J. Exp. Mar. Biol. Ecol. 323 (2005) 172–183 175
body by homogenizing the sample in ice-cold Tris–
EDTA buffer (0.05 M Tris, 0.1 M NaCl, 0.01 M
EDTA, pH 8.0) using a glass homogenizer and sub-
sequently transferring to a mixture of Tris–EDTA
buffer, proteinase-K (pro-K) and sodium dodecyl sul-
fate (SDS). The quantity of RNA and DNA in the
whole body was determined by the fluorescence-
photometric technique using a specific nucleic acid
fluorescent dye—ethidium bromide (Nacalai Tesque
Co. Ltd., Kyoto, Japan), as described by Clemmesen
(1993) and slightly modified by Sato et al. (1995). In
order to measure the DNA content of a sample, RNA
was enzymatically digested with RNAase and the
remaining quantity of DNA was determined with
ethidium bromide. The fluorescence due to total
RNA was calculated as the difference between total
fluorescence (RNA and DNA) and the fluorescence
after RNAase treatment, which is assumed to be due
to presence of only DNA. Salmon sperm DNA (Wako
Pure Chemical Co. Ltd.) and yeast RNA (Kanto Che-
mical Co. Ltd.) were used as standards. RNA and
DNA contents are both expressed as milligrams per
fish. Total protein (dissolved in NaOH) was deter-
mined by a Bio-Rad protein kit (Bio-Rad, Tokyo,
Japan) using bovine serum albumin as a standard.
Results are expressed as milligrams of protein per
fish; the ratio of RNA to protein and protein to
DNA content are cited as indices of protein synthesis
capacity and cell size, respectively (Buckley et al.,
1999). The instantaneous protein growth rate (Gpi)
was calculated from the larval growth model based on
the RNA:DNA values and temperature; the model,
proposed by Buckley (1984), was given as
Gpi ¼ 0:93T þ 4:75 RNA=DNAð Þ � 18:18 ð1Þ
where Gpi is the protein growth rate (% day�1) and T
is the water temperature.
2.3. Statistical analysis
One-way analysis of variance (ANOVA) was used
separately to examine the spatial (between stations)
and temporal (between cruises) variations in different
parameters studied. Effects of fish size (length and
weight) and hydrographical parameters (temperature
and salinity) on fish condition parameters were
assessed by simple linear regression analysis. Values
were considered significant at 5% level of confidence.
3. Results
3.1. Hydrography and fish distribution
Temperature ranged 10.9–11.6 8C (mean
11.3F0.23 8C) in March and 16.6–16.8 (mean
l

MarchM = 21.83 ± 2.27
N = 230
0
5
10
15
20
AprilM = 26.01 ± 2.96
N = 155
0
5
10
15
20
10 15 20 25 30 35
Fre
qu
ency
(%
)
TL (mm)
Fig. 4. Total length frequency distribution of the fish collected
during two sampling cruises in March (upper) and April (lower)
along the Chikugo estuary.
0
5
10
1520
25
30
35
40
0
50
100
150
200
250
300
R4 R3 R2 R1 E1 E2 E3
March April
Sampling stationsT
L (
mm
)W
eig
ht
(mg
)
Fig. 5. Spatial variations in the mean total length (TL) and body
weight of all larvae and juveniles collected during two sampling
cruises in March and April 2003 along the Chikugo estuary: show-
ing larger fish sizes in the upstream areas than that in the down-
stream areas.
Md.S. Islam, M. Tanaka / J. Exp. Mar. Biol. Ecol. 323 (2005) 172–183176
16.7F0.08) in April, with no significant (P b0.05)
spatial variations (Fig. 2). Temperature was signifi-
cantly higher (P b0.05) in April than in March. Sali-
nity showed gradual increase from stations R4 to E3
and ranged 0.14–28.5 in March and 0.12–27.5 in
April (Fig. 2). Salinity showed significant spatial
differences but did not differ significantly between
the two cruises (P b0.05). Distribution of the fish
Table 1
Results of one-way analysis of variance (ANOVA) comparing parameters between stations and between years (s=significant, ns=no
significant)
Between stations Between months
MS F P Remark MS F P Remark
Temperature 0.0274 0.0019 1.0000 ns 101.521 2842.58 0.0000 s
Salinity 267.628 58.893 0.0000 s 19.873 0.147416 0.7077 ns
TL 39.325 4.960 0.0001 s 607.279 111.692 0.0000 s
Weight 5620.68 3.113 0.0065 s 132805.2 115.452 0.0000 s
RNA 4.127 5.603 0.0000 s 57.745 112.2553 0.0000 s
DNA 0.1247 2.2997 0.0370 s 3.608 102.325 0.0000 s
Protein 77.448 2.030 0.0646 ns 2967.40 135.970 0.0000 s
RNA/DNA 3.372 9.394 0.0000 s 9.241 22.284 0.0000 s
RNA/protein 0.0278 9.175 0.0000 s 0.0291 7.721 0.0061 s
Protein/DNA 95.795 4.712 0.0002 s 1101.73 66.687 0.0000 s
Gpi 149.3047 8.622439 0.0000 s 2146.65 233.068 0.0000 s
extended over a wide range of salinity from about 0
PSU in the upstream to as high as 29 PSU in the sea
and fish were collected in all seven stations during
both cruises; however, there was no clear spatial
pattern in fish abundance (Fig. 3). A total of 411
(256 in March and 155 in April) bass larvae and
t

Md.S. Islam, M. Tanaka / J. Exp. Mar. Biol. Ecol. 323 (2005) 172–183 177
juveniles were collected with the mean total length of
21.83F2.27 mm in March and 26.0F2.96 mm in
April (Fig. 4). Significant spatial and temporal varia-
tions in fish length and weight were observed (Table
1). Fish length and weight were higher in upstream
areas in the river than in the downstream areas and in
April than in March (Fig. 5, Table 1).
0%
20%
40%
60%
80%
100%
0%
20%
40%
60%
80%
100%
0%
20%
40%
60%
80%
100%
0%
20%
40%
60%
80%
100%
R4 R3 R2 R1
Co
pep
od
co
mp
osi
tio
n in
wat
er (
%)
Gu
t co
nte
nt
com
po
siti
on
(%
)
Sampling stati
March
March
April
April
Fig. 6. Copepod composition (upper two graphs) in water and gut conten
along the Chikugo estuary. The low saline upper estuary was characterized
the high saline lower estuary had a multi-species assemblage, dominated
3.2. Copepod assemblage in water and gut content of
fish
A total of 9 zooplankton types, mainly copepods,
were recorded; they were: Sinocalanus sinensis, Acar-
tia omorii, Paracalanus parvus, Oithona davisae,
Calanus sinicus, Pseudodiaptomus marinus, Coryac-
E1 E2 E3
OthersMysis NaupliiP. marinusC. sinicusP. parvusCopepoditeO. davisaeA. omoriiS. sinensis
ons
ts composition (%) of fish larvae and juveniles (lower two graphs)
by the dominance of a single species (Sinocalanus sinensis), while
by Acartia omorii and Oithona davisae.

Md.S. Islam, M. Tanaka / J. Exp. Mar. Biol. Ecol. 323 (2005) 172–183178
eous affinis, unidentified copepodite and decapod
mysis (Fig. 6). Copepod composition (%) in water
at each station (Fig. 6) showed that S. sinensis was
overwhelmingly dominant along the low saline areas,
especially in stations R4 and R3, and was the single
dominant copepod species recorded in these two sta-
tions where this species contributed 97.7–98.8% in
March and 94.5–96.4% in April. In contrast to the low
salinity upper estuary, a multi-species assemblage was
0
5
10
15
20
25
30
0
50
100
150
200
0
1
2
3
4
0
0.2
0.4
0.6
0.8
1
1.2
1.4
R4 R3 R2 R1 E1 E2 E3
MarchAprilMean
TL
(m
m)
Wei
gh
t (m
g)
RN
A (
mg
fis
h-1
)D
NA
(m
g f
ish
-1)
Sampling stations
Fig. 7. Spatial variations in the nucleic acid-based indices in individual sea
during March and April 2003. Significant spatial variations were observed
values in the upstream areas indicating better condition.
observed in the high salinity lower estuary (stations
R1–E3), which was mainly dominated by A. omorii
(39.2–55.5%) in March and by P. marinus (36.3–
49.7%) in April (Fig. 6). The other species in these
regions include O. davisae, C. sinicus, P. parvus and
C. affinis.
Among the prey types, 8 species of copepods
were recorded that contributed as much as 97.7% of
the total diet. Profound influence of the distribution
0
5
10
15
20
25
30
0
1
2
3
4
0
0.1
0.2
0.3
0
5
10
15
20
25
R4 R3 R2 R1 E1 E2 E3
MarchAprilMean
Pro
tein
(m
g f
ish
-1)
RN
A:D
NA
RN
A:p
rote
inP
rote
in:D
NA
Sampling stations
bass larvae and early juveniles collected along the Chikugo estuary
in almost all the parameters (see Table 1 for statistics), with higher

0
4
8
12
16
20
R4 R3 R2 R1 E1 E2 E3
March
April
Sampling stations
GP
i (%
day
-1)
Fig. 8. Spatial variations in the protein growth rate (Gpi) of
individual larvae and juveniles of Japanese temperate bass collected
along the Chikugo estuary. Significantly higher growth rates were
observed in the fish collected in the upper estuary than those
collected downstream (see Table 1 for statistics).
Md.S. Islam, M. Tanaka / J. Exp. Mar. Biol. Ecol. 323 (2005) 172–183 179
pattern and salinity was observed on the food habit
of each species. The gut contents of the fishes at
low-to-medium salinity zones (stations R4–R2) were
highly dominated by a single species of copepod, S.
sinensis in both years (Fig. 6). In these stations, S.
sinensis contributed nearly 100% of the prey con-
sumption. In contrast to the mono-specific gut com-
position in the low saline area, a multi-species gut
assemblage, dominated by A. omorii, O. davisae and
decapod mysis, was observed in the high saline lower
estuary in both years. Minor prey items in these
regions include P. parvus, C. sinicus, P. marinus, C.
affinis and unidentified copepodite (Fig. 6).
3.3. Nutritional condition
The mean RNA, DNA, protein, RNA/DNA ratio,
RNA/protein ratio and protein/DNA ratio and corre-
sponding mean length and weight of the fish ana-
lyzed in March and April (Fig. 7) showed a high
degree of spatial variability in all the parameters, with
a general trend of higher values in upstream stations
(stations R4–R2). The total length and weight of fish
used for biochemical analyses were significantly
higher in upper river areas than in the lower estuaries
in both March and April (Fig. 7) and also differed
significantly between the two cruises (Table 1). RNA,
DNA, RNA/DNA ratio and RNA/protein ratio
showed significant variations between stations and
between cruises; values were generally higher in the
upstream areas of the river than in the sea and in April
than in March (Fig. 7). Total protein content did not
show significant spatial variation but was significantly
higher in April than in March. In contrast to the RNA-
based ratios (RNA/DNA and RNA/protein), signifi-
cantly higher values of protein/DNA ratio were
recorded in the estuarine stations than in the upstream
stations (Fig. 7). However, similar to the RNA-based
ratios, significantly higher protein growth rates were
observed in fish collected from the upstream areas
than those collected in the sea (Fig. 8, Table 1).
While the amount of RNA, DNA and protein had
significant relation with fish length and body
weight, RNA/DNA ratio, RNA/protein ratio, pro-
tein/DNA ratio and protein growth rate did not
have significant relation with either fish length or
fish body weight (Table 1, Fig. 9). Regression ana-
lysis RNA/DNA ratio with temperature and with sali-
nity showed that spatial variations in the RNA/DNA
ratios were not related to either temperature or salinity
(Table 2).
Spatial scale of starvation status was determined
on the basis of the values reported in other studies
(Martin et al., 1985 in striped bass and Robinson and
Ware, 1988 in Atlantic herring); they reported the
critical RNA:DNA value of 2.0 for starving fish for
these two species. Based on the reported critical value,
6.7–40.0% fish were identified as starved in March
and 3.0–40.0% fish were starving in April. Starvation
rates were higher in the downstream stations than in
the upstream stations, with no fish found starving in
the three uppermost stations (Fig. 10).
4. Discussion
The distribution found in the present study is
typical for the early life condition of this fish
species (Matsumiya et al., 1982, 1985; Hibino et al.,
1999). Fish were distributed over wide estuarine areas
and, therefore, showed a high degree of plasticity to
salinity and were collected from all seven stations.
The fish showed a highly degree of plasticity in their
food habit also; plasticity to environmental changes
and feeding may be important factor for a wide spatial
distribution. The results of the gut analyses shows that
S. sinensis is the most important food item in the
upstream stations (stations R4–R2) and A. omorii
and O. davisae were major species of the gut contents
0
1
2
3
4
5
RNADNA
0
1
2
3
4
5
0
5
10
15
20
25
30
35
40
0
5
10
15
20
25
30
35
10 15 20 25 30 35
Protein:DNA Gpi
0
1
2
3
4
5
RNADNA
0
1
2
3
4
5
0
5
10
15
20
25
30
35
40
0
5
10
15
20
25
30
35
0 50 100 150 200 250 300
Protein:DNA Gpi
RN
A &
DN
A (
µg f
ish
-1)
RN
A:D
NA
Pro
tein
(m
g f
ish
-1)
TL (mm) Weight (mg)
Pro
tein
:DN
A &
GP
i
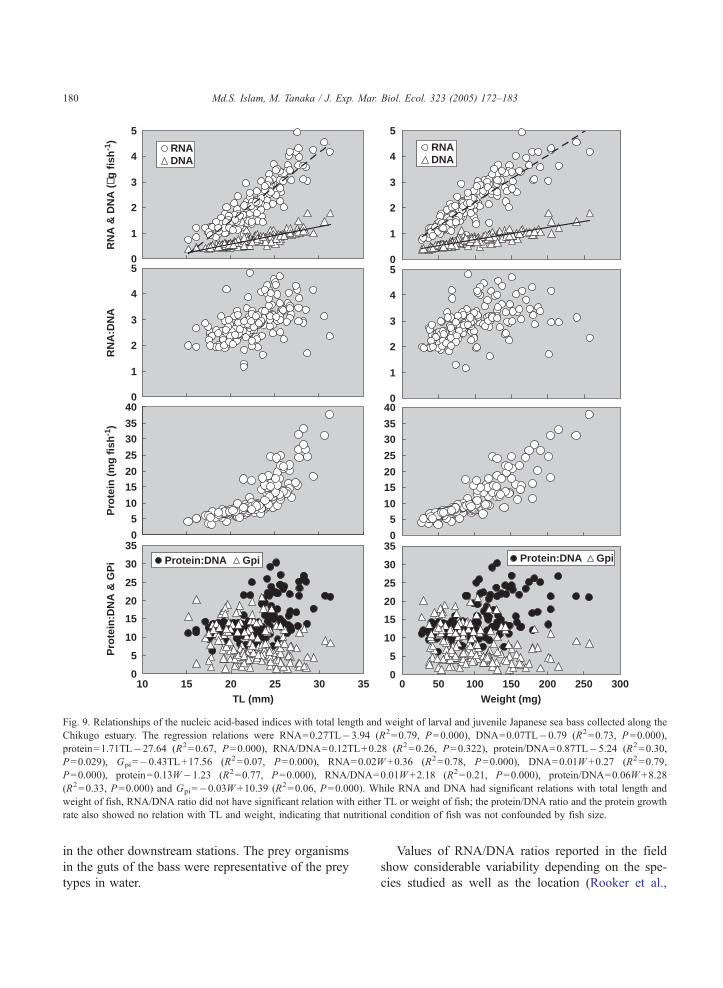
Fig. 9. Relationships of the nucleic acid-based indices with total length and weight of larval and juvenile Japanese sea bass collected along the
Chikugo estuary. The regression relations were RNA=0.27TL�3.94 (R2=0.79, P=0.000), DNA=0.07TL�0.79 (R2=0.73, P=0.000),
protein=1.71TL�27.64 (R2=0.67, P=0.000), RNA/DNA=0.12TL+0.28 (R2=0.26, P=0.322), protein/DNA=0.87TL�5.24 (R2=0.30,
P=0.029), Gpi=�0.43TL+17.56 (R2=0.07, P=0.000), RNA=0.02W +0.36 (R2=0.78, P=0.000), DNA=0.01W +0.27 (R2=0.79,
P=0.000), protein=0.13W�1.23 (R2=0.77, P=0.000), RNA/DNA=0.01W +2.18 (R2=0.21, P=0.000), protein/DNA=0.06W +8.28
(R2=0.33, P=0.000) and Gpi=�0.03W +10.39 (R2=0.06, P=0.000). While RNA and DNA had significant relations with total length and
weight of fish, RNA/DNA ratio did not have significant relation with either TL or weight of fish; the protein/DNA ratio and the protein growth
rate also showed no relation with TL and weight, indicating that nutritional condition of fish was not confounded by fish size.
Md.S. Islam, M. Tanaka / J. Exp. Mar. Biol. Ecol. 323 (2005) 172–183180
in the other downstream stations. The prey organisms
in the guts of the bass were representative of the prey
types in water.
Values of RNA/DNA ratios reported in the field
show considerable variability depending on the spe-
cies studied as well as the location (Rooker et al.,

Table 2
Results of the regression analysis between RNA/DNA ratio and
temperature and salinity during the two sampling cruises in Chikugo
estuary, Ariake Sea (R/D=RNA/DNA ratio, T =temperature,
S =salinity, ns=not significant)
Cruise Regression equation R2 value P df Significance
March R/D=�0.8329T +12.217 0.1388 0.411 1.5 ns
April R/D=�2 .0479T +36.975 0.1072 0.474 1.5 ns
March R/D=�0.0168S +3.2811 0.1243 0.438 1.5 ns
April R/D=�0.0231S +3.3416 0.1846 0.336 1.5 ns
0
8
16
24
32
40
R4 R3 R2 R1 E1 E2 E3
MarchAprilMean
Sta
rvat
ion
rat
e (%
)
Sampling stations
Fig. 10. Starvation rates (%) of the larval and juvenile fish collected
from seven sampling stations along Chikugo estuary, as determined
on the basis of RNA/DNA values, indicated a downstream increase
in the number of starved fish.
Md.S. Islam, M. Tanaka / J. Exp. Mar. Biol. Ecol. 323 (2005) 172–183 181
1997). Chicharo (1998) reported RNA/DNA values of
sardine (Sardina pilchardus) being 2.3–4.82 with 1.3
as the critical value, below which fish were considered
as starved, while Lough et al. (1996) reported 5.23–
5.96 for cod and 4.74–5.87 for haddock with a critical
value of 4.1 for both. Martin et al. (1985) reported
RNA/DNA ratios of striped bass ranging 0.9–11.9 in
Potomac River estuary, USA and determined that the
critical value for the fish is 2.0 in laboratory condi-
tions. Our results of RNA:DNA values which ranged
1.29–7.82 (2.93F0.99) are in strong agreement with
Martin et al. (1985). The critical values of RNA/DNA
ratios as well as the starvation status are also species
as well as site-specific, depending upon the physical
environmental conditions and food supply in a parti-
cular area. Although the starvation rates reported in
the present paper were calculated indirectly and are,
therefore, not exclusively reliable estimates, we report
a reliable scale for between-station comparison which
showed that a higher proportion of the fish in the
estuary is starving as compared to the river (Fig.
10), indicating a better feeding environment and
potential nursery ground in the upstream areas of
Chikugo estuary. The significant between stations
differences in each of the nucleic acid-based indices
indicate that all the nursery habitats within a cruise
were not equivalent in promoting growth, and pre-
sumably survival in Japanese sea bass larvae and
juveniles in this area. This was the central question
of this study, which covered almost the total nursery
ground of this species. Based on the nucleic acid-
based indices and the starvation status, it can be
speculated that fish in the upper regions were in better
condition than in lower estuaries.
The underlying factors that govern the spatial var-
iations in fish condition have been discussed by many
authors (Buckley, 1982; Buckley et al., 1999; Clem-
mesen, 1994; Imsland et al., 2002). The major factors
involved in changing fish condition in the field
include the hydrological parameters, fish length and
weight, and the food supply, both qualitative and
quantitative. Of the hydrological variables that play
potential role in fish condition, temperature is
believed to be the most prominent due to its direct
involvement in both foraging behavior and food uti-
lization by fish. In our study, temperature did not
show significant spatial variation and, therefore, tem-
perature is less likely to play a role in fish condition
over the narrow spatial scale studied. Salinity showed
significant spatial variations; however, regression ana-
lysis did not show significant relation between RNA/
DNA ratio and salinity, indicating that fish condition
was not related to salinity. Field studies have not
consistently indicated a correlation between fish
length and RNA/DNA ratio (Lough et al., 1996;
Chicharo et al., 1998a,b). RNA/DNA values, when
plotted against TL and weight, produced no signifi-
cant relations with either TL or weight of fish (Fig. 9),
suggesting that the variations in fish condition were
not confounded by fish size. Another important factor
that affects individual fish condition is the larval
ontogeny; as larvae progress through stages of onto-
genic development and growth, some of the stages
require more protein synthesis and therefore might
cause a lower RNA/DNA ratio even if the fish are
well fed. This factor may contribute substantially to
the observed pattern of spatial differences in fish
condition. However, the effects of ontogenic develop-
ment are particularly important in pre-metamorphic

Md.S. Islam, M. Tanaka / J. Exp. Mar. Biol. Ecol. 323 (2005) 172–183182
larvae and, in the present study, we used fish that had
already metamorphosed to early juveniles, to avoid
the effects of ontogeny.
Several authors have suggested that changes in
condition of larval and juvenile fishes may be brought
about by particular prey types probably by virtue of
their nutritional quality. Martin et al. (1985), for
example, reported that the condition of striped bass
in the Potomac River estuary was highly influenced
by cladoceran Bosmina abundance; they reported that
the lowest level of starvation and better condition of
the fish was associated with highest abundance of this
prey species. Canino et al. (1991) studied the feeding
and condition of walleye pollock inside and outside of
a plankton patch in Shelikof Straight of the Gulf of
Alaska and found that the distribution and condition
of the fish was strongly associated with the concen-
tration of copepod nauplii. They reported reduced
feeding intensity and lower RNA/DNA ratio in areas
of lower nauplier concentration outside the plankton
patch than in areas of higher nauplier concentration
inside the plankton patch. We also consider that the
spatial variation in fish condition in the present study
was caused among others by food quality, particularly
by S. sinensis which was abundant in the upper
region, which is also evident from the comparison
of the gut contents of the fish between the two
regions. We suppose that the better quality of the
fish in the upper river was contributed by this copepod
species, presumably by virtue of its better nutritional
quality. Similar to our result, significant between sta-
tion differences in nutritional condition of larval
anchovy (Engraulis mordax) were reported by Hakan-
son (1989) in the Southern California Bight, where the
between station variation was associated with the
energy storage in a specific prey copepod Calanus
pacificus. Similar influence of prey quality was also
reported by Davis and Olla (1992) in walleye pollock
(Theragra chalcogramma) larvae.
The results of the present study indicate that star-
vation may be a significant source of mortality during
early life stages of the fish in the lower estuary of
Chikugo; the condition of the fish as indicated by the
RNA/DNA ratios and other nucleic acid-based indices
and growth rates infer suboptimal growth and
extended duration at size which may contribute to
predation mortality in early life stages in the lower
estuary. It could be hypothesized that the fish undergo
ascending migration as an adaptation to reduce this
early mortality by utilizing a better foraging ground in
the upper estuary which is occupied by S. sinensis,
which appears a suitable prey copepod for the juvenile
bass and provide better condition in the upper regions.
It could be speculated that utilization of S. sinensis in
the upstream nursery grounds is one of the most
important factors for early survival and growth in
Japanese temperate bass along the Chikugo estuary.
Acknowledgements
[SS]
References
Amara, R., Galois, R., 2004. Nutritional condition of metamorphos-
ing sole: spatial and temporal analyses. J. Fish Biol. 64, 72–88.
Bailey, K.M., Canino, M.F., Napp, J.M., Spring, S.M., Brown, A.L.,
1995. Contrasting years of prey levels, feeding conditions
and mortality of larval walleye pollock Theragra chalco-
gramma in the western Gulf of Alaska. Mar. Ecol. Prog. Ser.
119, 11–23.
Bergeron, J.P., 1997. Nucleic acids in ichthyoplankton ecology: a
review, with emphasis on recent advances for new perspectives.
J. Fish Biol. 51 (Suppl. A), 284–302.
Buckley, L.J., 1980. Changes in ribonucleic and deoxyribonucleic
acid, and protein content during ontogenesis in winter flounder
Pseudopleuronectes americanus, and effect of starvation. Fish.
Bull. U.S. 77, 703–708.
Buckley, L.J., 1982. Effects of temperature on growth and biochem-
ical composition of larval winter flounder (Pseudopleuronectes
americanus). Mar. Ecol. Prog. Ser. 8, 181–186.
Buckley, L.J., 1984. RNA/DNA ratio: an index of larval fish growth
in the sea. Mar. Biol. 80, 291–298.
Buckley, L.J., Caldarone, E., Ong, T.L., 1999. RNA–DNA ratio and
other nucleic acid-based indicators for growth and condition of
marine fishes. Hydrobiologia 401, 265–277.
Canino, M.F., 1997. Nucleic acid contents and growth of first-
feeding walleye pollock larvae in response to prey densities
typical of sub-artic ecosystems. J. Fish Biol. 51, 41–52.
Canino, M.F., Bailey, K.M., Incze, L.S., 1991. Temporal and geo-
graphic differences in feeding and nutritional condition of wal-
leye pollock larvae Theragra chalcogramma in Shelikof
Straight, Gulf of Alaska. Mar. Ecol. Prog. Ser. 79, 27–35.
Chicharo, M.A., 1997. Starvation percentages in field caught Sar-
dina pilchardus larvae off southern Portugal. Sci. Mar. 61 (4),
507–516.
Chicharo, M.A., 1998. Nutritional condition and starvation in Sar-
dina pilchardus (L.) larvae off southern Portugal compared
with some environmental factors. J. Exp. Mar. Biol. Ecol.
225, 123–137.
Md.S. Islam, M. Tanaka / J. Exp. Mar. Biol. Ecol. 323 (2005) 172–183 183
Chicharo, M.A., Chicharo, L., Valdes, L., Lopez-Jamar, E., Re, P.,
1998a. Does the nutritional condition limit survival potential of
sardine Sardina pilchardus (Walbaum, 1792) larvae off the
north coast of Spain? RNA/DNA ratios and their variability.
Fish. Res. 39, 43–54.
Chicharo, M.A., Chycharo, L.M., Valdez, L., Lopez-Jamar, E., Re,
P., 1998b. Estimation of starvation and diel variation of the
RNA/DNA ratios in field-caught Sardina pilchardus larvae off
the north of Spain. Mar. Ecol. Prog. Ser. 164, 273–283.
Clemmesen, C., 1987. Laboratory studies on RNA/DNA ratios of
starved and fed herring (Clupea harengus) and turbot
(Scophthalmus maximus) larvae. J. Cons.-Cons. Int. Explor.
Mer 43, 122–128.
Clemmesen, C., 1988. An RNA and DNA fluorescent technique to
evaluate the nutritional condition of individual marine fish
larvae. Meeresforschung 32, 134–143.
Clemmesen, C., 1993. Improvements in the fluorometric determina-
tion of the RNA and DNA content of individual marine fish
larvae. Mar. Ecol. Prog. Ser. 100, 177–183.
Clemmesen, C., 1994. The effect of food availability, age or size on
the RNA/DNA ratio of individually measured herring larvae:
laboratory calibration. Mar. Biol. 118, 377–382.
Davis, M.W., Olla, B.L., 1992. Comparison of growth, behavior and
lipid concentrations of walleye Pollock Theragra chalco-
gramma larvae fed lipid enriched, lipid deficient and field
collected prey. Mar. Ecol. Prog. Ser. 90, 23–30.
Hakanson, J.L., 1989. Condition of larval anchovy (Engraulis
mordax) in the Southern California Bight, as measured through
lipid analysis. Mar. Biol. 102, 153–159.
Hibino, M., Ueda, H., Tanaka, M., 1999. Feeding habits of Japanese
temperate bass and copepod community in the Chikugo River
estuary, Ariake Sea, Japan. Nippon Suisan Gakkaishi 65 (6),
1062–1068.
Imsland, A.K., Foss, A., Bonga, S.W., Ham, E.V., Stefansson, S.O.,
2002. Comparison of growth and RNA:DNA ratios in three
populations of juvenile turbot reared at two salinities. J. Fish
Biol. 60, 288–300.
Lough, R.G., Galdarone, E.M., Rotunno, R.K., Broughton, E.A.,
Burns, B.R., Buckley, L.J., 1996. Vertical distribution of cod
and haddock eggs and larvae, feeding and condition in stratified
and mixed waters on southern Georges Bank, May 1992. Deep-
Sea Res., Part II 43 (7–8), 1875–1904.
Martin, F.D., Wright, D.A., Means, J.C., Setzler-Hamilton, E.M.,
1985. Importance of food supply to nutritional state of larval
stripped bass in the Potomac River estuary. Trans. Am. Fish.
Soc. 114, 137–145.
Matsumiya, Y., Mitani, T., Tanaka, M., 1982. Changes in distribu-
tion pattern and condition coefficient of the juvenile Japanese
sea bass with the Chikugo River ascending. Bull. Jpn. Soc. Sci.
Fish. 48 (2), 129–138.
Matsumiya, Y., Masumoto, H., Tanaka, M., 1985. Ecology of
ascending larval and early juvenile Japanese sea bass in the
Chikugo estuary. Nippon Suisan Gakkaishi 51, 1955–1961.
Richard, P., Bergeron, J.P., Boulhic, M., Galois, R., Person-Le
Ruyet, J., 1991. Effect of starvation on RNA, DNA and protein
content of laboratory-reared larvae and juveniles of Solea solea.
Mar. Ecol. Prog. Ser. 72, 69–77.
Robinson, S.M., Ware, D., 1988. Ontogenetic development of
growth rates in larval Pacific herring, Clupeaharengus pallasi,
measured with RNA/DNA ratios in the Strait of Georgia, British
Columbia. Can. J. Fish. Aquat. Sci. 45, 1422–1429.
Rooker, J.R., Holt, G.J., 1996. Application of RNA:DNA ratios to
evaluate the condition and growth of larval and juvenile red
drum (Sciaenops ocellatus). Mar. Freshw. Res. 47, 283–290.
Rooker, J.R., Holt, G.J., Holt, S.A., 1997. Condition of larval and
juvenile red drum (Sciaenops ocellatus) from estuarine nursery
habitats. Mar. Biol. 127, 387–394.
Sato, C., Kimura, R., Nakata, K., Umeda, S., Suzuki, M., 1995.
RNA/DNA ratio of first-feeding larvae of Japanese sardine.
Fish. Sci. 61, 538–539.