Embed Size (px)
Citation preview
AMERICAN JOURNAL OF PHYSICAL ANTHROPOLOGY 88:309-321 (1992)
Nutritional Status of Adults in Rural Mali KATHERINE A. DETTWYLER Department of Anthropology, Texas A&M Uniuersity, College Station, Texas 77843-4352
KEY WORDS buffering, Variability
Anthropometry, Weight, Height, Africa, Female
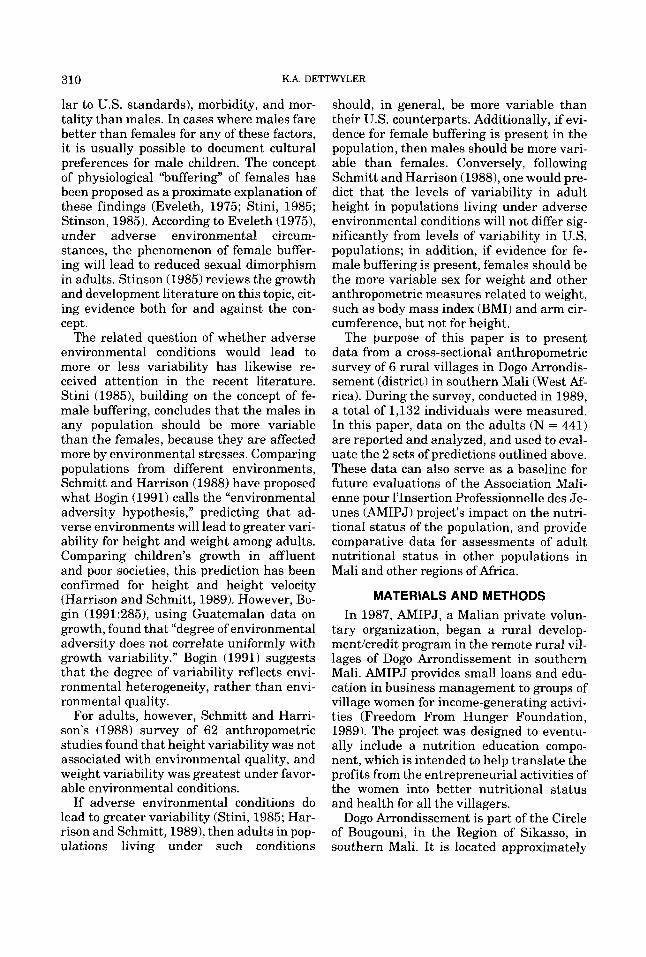
ABSTRACT An anthropometric assessment was conducted of 441 adults from six rural villages in southern Mali. As is typical for human populations, females are shorter and lighter than males. Both females (N = 320) and males (N = 121) are shorter and lighter than their U S . counterparts. Mean weight in the sample is 53.4 * 8.5 kilos for females and 58.8 k 6.5 kilos for males. Mean height is 160.4 * 5.7 cm for females and 171.3 ? 6.6 cm for males. The data for height in males are very similar to those reported from other surveys in Mali, and show no evidence for a positive secular trend in height. Mean body mass index (BMI) is 20.8 for females and 20.0 for males. These are lower than U.S. averages, but well above suggested cutoff points for malnutrition in adults. Average arm circumference is 26.5 cm for females and 26.4 cm for males. Females have relatively large arm circumferences due, in part, to the heavy manual labor they perform. Average head circumference is 53.0 cm for females and 54.8 cm for males. For both sexes, these values are more than 1 standard deviation (SD) below the US . means. Adult values for anthropometric measurements reflect childhood stresses of malnutrition and disease, and a lifetime of accommodation to a high-carbohydrate, low-protein diet, and hard physical labor. Females are significantly closer to the US . standards than males for weight, height, BMI, and arm circumference; these findings support the idea that females are buffered from environmental stresses relative to males. In addition, females exhibit significantly more variability than males for weight, arm circumference, and head circumfer- ence, but not for height, suggesting that variability in adult height does not reflect the presence o r absence of female buffering or the level of environmen- tal adversity. o 1992 Wiley-Liss, Inc.
Children under 5 years of age usually rep- resent the subpopulation most likely to suf- fer inadequate growth and high levels of mortality due to malnutrition and disease in populations living under conditions of envi- ronmental stress. However, birth weight and early childhood growth are also affected by maternal size and nutritional status. Studies of adult nutritional status in such populations can provide information about the long-term effects of early childhood growth deficits, as well as the impact of these deficits on the growth of subsequent generations. In addition, data on adults can be used to examine the issues of whether
females are “buffered” from environmental stress relative to males in terms of final adult body size, and the impact of such buff- ering (the equivalent of living in a better environment) on within-population variabil- ity in body size.
Although the mechanisms are not well un- derstood, there is substantial evidence that, given similar treatment in terms of access to dietary resources and health care, females exhibit lower levels of malnutrition (and, consequently, patterns of growth more simi-
Received August 10, 1990; accepted January 22, 1992.
0 1992 WILEY-LISS, INC
310 K.A. DETTWYLER
lar to U S . standards), morbidity, and mor- tality than males. In cases where males fare better than females for any of these factors, it is usually possible to document cultural preferences for male children. The concept of physiological “buffering” of females has been proposed as a proximate explanation of these findings (Eveleth, 1975; Stini, 1985; Stinson, 1985). According to Eveleth (1975), under adverse environmental circum- stances, the phenomenon of female buffer- ing will lead to reduced sexual dimorphism in adults. Stinson (1985) reviews the growth and development literature on this topic, cit- ing evidence both for and against the con- cept.
The related question of whether adverse environmental conditions would lead to more or less variability has likewise re- ceived attention in the recent literature. Stini (19851, building on the concept of fe- male buffering, concludes that the males in any population should be more variable than the females, because they are affected more by environmental stresses. Comparing populations from different environments, Schmitt and Harrison (1988) have proposed what Bogin (1991) calls the “environmental adversity hypothesis,” predicting that ad- verse environments will lead to greater vari- ability for height and weight among adults. Comparing children’s growth in affluent and poor societies, this prediction has been confirmed for height and height velocity (Harrison and Schmitt, 1989). However, Bo- gin (1991:285), using Guatemalan data on growth, found that “degree of environmental adversity does not correlate uniformly with growth variability.” Bogin (1991) suggests that the degree of variability reflects envi- ronmental heterogeneity, rather than envi- ronmental quality.
For adults, however, Schmitt and Harri- son’s (1988) survey of 62 anthropometric studies found that height variability was not associated with environmental quality, and weight variability was greatest under favor- able environmental conditions.
If adverse environmental conditions do lead to greater variability (Stini, 1985; Har- rison and Schmitt, 19891, then adults in pop- ulations living under such conditions
should, in general, be more variable than their U S . counterparts. Additionally, if evi- dence for female buffering is present in the population, then males should be more vari- able than females. Conversely, following Schmitt and Harrison (19881, one would pre- dict that the levels of variability in adult height in populations living under adverse environmental conditions will not differ sig- nificantly from levels of variability in US . populations; in addition, if evidence for fe- male buffering is present, females should be the more variable sex for weight and other anthropometric measures related to weight, such as body mass index (BMI) and arm cir- cumference, but not for height.
The purpose of this paper is to present data from a cross-sectional anthropometric survey of 6 rural villages in Dogo Arrondis- sement (district) in southern Mali (West Af- rica). During the survey, conducted in 1989, a total of 1,132 individuals were measured. In this paper, data on the adults (N = 441) are reported and analyzed, and used to eval- uate the 2 sets of predictions outlined above. These data can also serve as a baseline for future evaluations of the Association Mali- enne pour 1’Insertion Professionnelle des Je- unes (AMIPJ) project’s impact on the nutri- tional status of the population, and provide comparative data for assessments of adult nutritional status in other populations in Mali and other regions of Africa.
MATERIALS AND METHODS In 1987, AMIPJ, a Malian private volun-
tary organization, began a rural develop- mentkredit program in the remote rural vil- lages of Dogo Arrondissement in southern Mali. AMIPJ provides small loans and edu- cation in business management to groups of village women for income-generating activi- ties (Freedom From Hunger Foundation, 1989). The project was designed to eventu- ally include a nutrition education compo- nent, which is intended to help translate the profits from the entrepreneurial activities of the women into better nutritional status and health for all the villagers.
Dogo Arrondissement is part of the Circle of Bougouni, in the Region of Sikasso, in southern Mali. It is located approximately
NUTRITIONAL STATUS IN MALI 311
388 mi - \ T imbuktu
r , ~Kayes MOI
I’ BAMAKO
nncn
MALI
Population 8.9 Million
Area [sq mi) 478,764
City Population
0 Over i,eee,eefl Over see,eee
0 Over iee,eee Under iee,eee
e Capitol
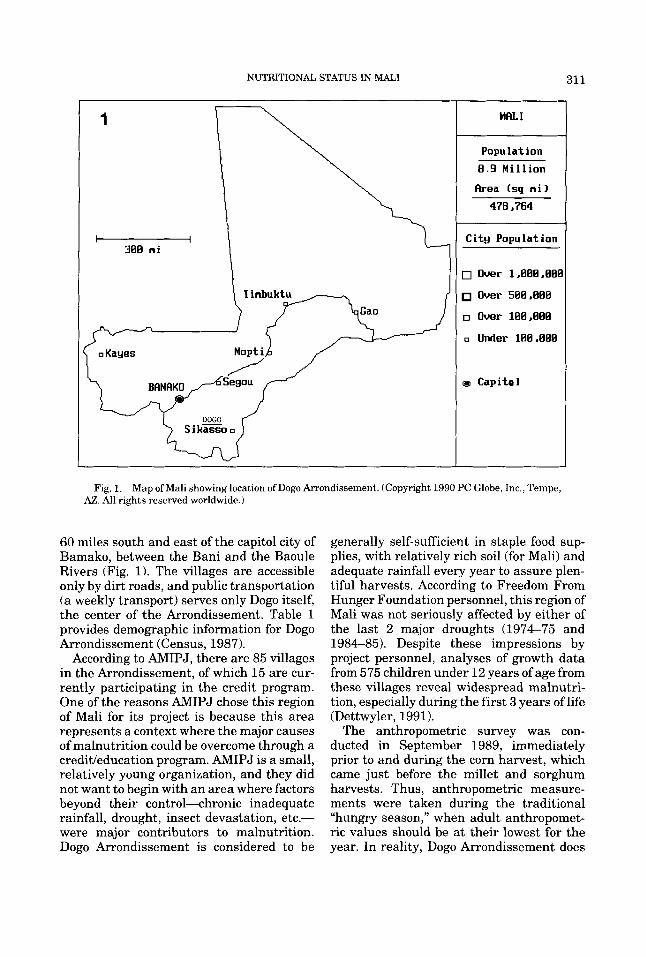
Fig. 1. Map of Mali showing location of Dogo Arrondissement. (Copyright 1990 PC Globe, Inc., Tempe, AZ. All rights reserved worldwide.)
60 miles south and east of the capitol city of Bamako, between the Bani and the Baoule Rivers (Fig. 1). The villages are accessible only by dirt roads, and public transportation (a weekly transport) serves only Dogo itself, the center of the Arrondissement. Table 1 provides demographic information for Dogo Arrondissement (Census, 1987).
According to AMIPJ, there are 85 villages in the Arrondissement, of which 15 are cur- rently participating in the credit program. One of the reasons AMIPJ chose this region of Mali for its project is because this area represents a context where the major causes of malnutrition could be overcome through a credit/education program. AMIPJ is a small, relatively young organization, and they did not want to begin with an area where factors beyond their control-chronic inadequate rainfall, drought, insect devastation, etc.- were major contributors to malnutrition. Dogo Arrondissement is considered to be
generally self-sufficient in staple food sup- plies, with relatively rich soil (for Mali) and adequate rainfall every year to assure plen- tiful harvests. According to Freedom From Hunger Foundation personnel, this region of Mali was not seriously affected by either of the last 2 major droughts (1974-75 and 1984-85). Despite these impressions by project personnel, analyses of growth data from 575 children under 12 years of age from these villages reveal widespread malnutri- tion, especially during the first 3 years of life (Dettwyler, 1991).
The anthropometric survey was con- ducted in September 1989, immediately prior to and during the corn harvest, which came just before the millet and sorghum harvests. Thus, anthropometric measure- ments were taken during the traditional “hungry season,” when adult anthropomet- ric values should be a t their lowest for the year. In reality, Dogo Arrondissement does
312 K.A. DE'M'WYLER
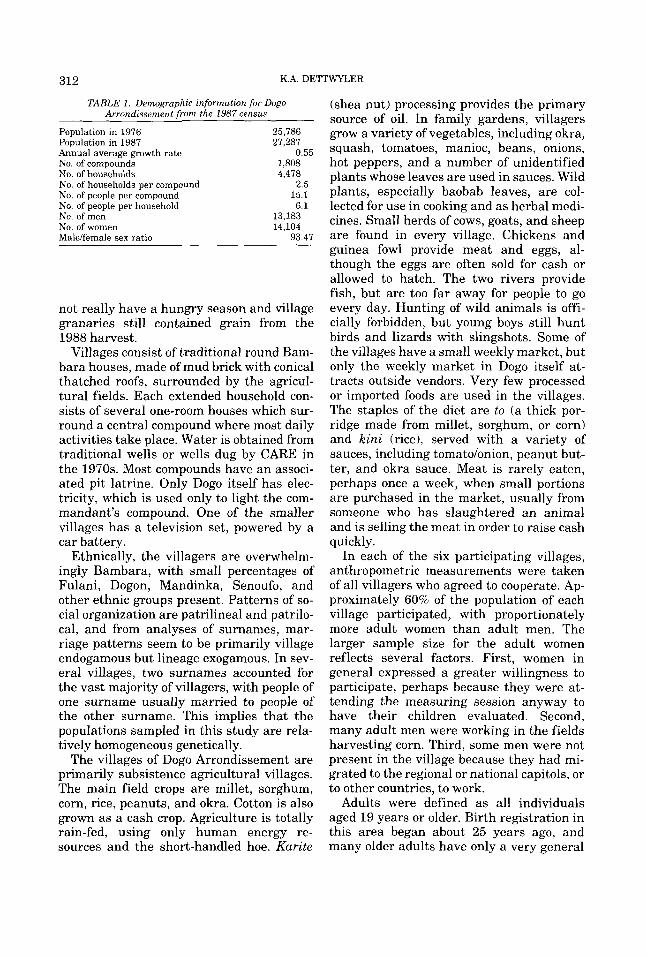
TABLE 1. Demographic information for Dogo Arrondissement from the I987 census
Population in 1976 Population in 1987 Annual average growth rate No. of compounds No. of households No. of households per compound No. of people per compound No. of people per household No. of men No. of women Malelfemale sex ratio
25,786 27,287
1,808 4,478
0.55
2.5 15.1 6.1
13,183 14,104
93.47
not really have a hungry season and village granaries still contained grain from the 1988 harvest.
Villages consist of traditional round Bam- bara houses, made of mud brick with conical thatched roofs, surrounded by the agricul- tural fields. Each extended household con- sists of several one-room houses which sur- round a central compound where most daily activities take place. Water is obtained from traditional wells or wells dug by CARE in the 1970s. Most compounds have an associ- ated pit latrine. Only Dogo itself has elec- tricity, which is used only to light the com- mandant's compound. One of the smaller villages has a television set, powered by a car battery.
Ethnically, the villagers are overwhelm- ingly Bambara, with small percentages of Fulani, Dogon, Mandinka, Senoufo, and other ethnic groups present. Patterns of so- cial organization are patrilineal and patrilo- cal, and from analyses of surnames, mar- riage patterns seem to be primarily village endogamous but lineage exogamous. In sev- eral villages, two surnames accounted for the vast majority of villagers, with people of one surname usually married to people of the other surname. This implies that the populations sampled in this study are rela- tively homogeneous genetically.
The villages of Dogo Arrondissement are primarily subsistence agricultural villages. The main field crops are millet, sorghum, corn, rice, peanuts, and okra. Cotton is also grown as a cash crop. Agriculture is totally rain-fed, using only human energy re- sources and the short-handled hoe. Karite
(shea nut) processing provides the primary source of oil. In family gardens, villagers grow a variety of vegetables, including okra, squash, tomatoes, manioc, beans, onions, hot peppers, and a number of unidentified plants whose leaves are used in sauces. Wild plants, especially baobab leaves, are col- lected for use in cooking and as herbal medi- cines. Small herds of cows, goats, and sheep are found in every village. Chickens and guinea fowl provide meat and eggs, al- though the eggs are often sold for cash or allowed to hatch. The two rivers provide fish, but are too far away for people to go every day. Hunting of wild animals is offi- cially forbidden, but young boys still hunt birds and lizards with slingshots. Some of the villages have a small weekly market, but only the weekly market in Dogo itself at- tracts outside vendors. Very few processed or imported foods are used in the villages. The staples of the diet are to (a thick por- ridge made from millet, sorghum, or corn) and kini (rice), served with a variety of sauces, including tomatolonion, peanut but- ter, and okra sauce. Meat is rarely eaten, perhaps once a week, when small portions are purchased in the market, usually from someone who has slaughtered an animal and is selling the meat in order to raise cash quickly.
In each of the six participating villages, anthropometric measurements were taken of all villagers who agreed to cooperate. Ap- proximately 60% of the population of each village participated, with proportionately more adult women than adult men. The larger sample size for the adult women reflects several factors. First, women in general expressed a greater willingness to participate, perhaps because they were at- tending the measuring session anyway to have their children evaluated. Second, many adult men were working in the fields harvesting corn. Third, some men were not present in the village because they had mi- grated to the regional or national capitols, or to other countries, to work.
Adults were defined as all individuals aged 19 years or older. Birth registration in this area began about 25 years ago, and many older adults have only a very general
NUTRITIONAL STATUS IN MALI 313
idea of their ages. Elderly individuals are rare in these populations. Estimates made by the author place most of the adults in the sample between 19 and 50 years of age, but more precise estimates of adult ages were not attempted.
All of the measurements were taken by the author and recorded by one of the field assistants. Height was measured using a portable adult height measuring board man- ufactured by Perspective Enterprises of Kalamazoo, Michigan. The measuring board is calibrated to the nearest .10 cm, and was checked for accuracy several times daily. Bathroom scales, calibrated to the nearest .10 kg, were used to measure weight. The scales were always placed on a flat, hard surface, and their accuracy was also checked several times daily. All subjects were bare- foot and wore similar lightweight clothing; weights have not been adjusted for clothing. Arm and head circumferences were mea- sured with a plastic coated, non-stretchable measuring tape.
In the sample of 320 women, 27 reported that they were pregnant and 293 reported that they were not pregnant. It was not pos- sible to confirm these statements. Running the analyses both with and without the “ad- mittedly pregnant” women did not change the results, so all women have been included in the analyses.
Interpretation of adult anthropometric data is somewhat problematic because of the lack of standards for U.S. adults comparable to the National Center for Health Statistics (NCHS) standards available for U.S. chil- dren. Many of the comparative data sets for US. adults are broken down by ages in de- cades andlor by “race” (e.g., Frisancho, 1990). Accurate ages are not available for adults in this study. In addition, the use of “US. black reference standards is not par- ticularly appropriate, since “US. black pop- ulations are based, for the most part, on de- scendants of people from various regions of Africa, with varying and often unknown amounts of admixture from European gene
An alternative, followed in this study, is to use the NCHS reference data on weight and height for 18 year olds for comparison
pools.
(Hamill et al., 1979). According to Tanner (1990:19):
“For practical purposes, however, it is useful to have an age at which we may say that growth in stature virtually ceases, i.e., after which only some 2% is added. At present in North America and northwest Europe the average boy stops growing, in this sense, at 17.5 years and the average girl at 15.5 years. There is a normal range of variation amongst individuals, amounting to about 2 years, on either side of these averages.”
The adult head circumference data ob- tained in this study are compared to the Roche et al. (1987) standards for head cir- cumference developed from the Fels Longi- tudinal Study. In accordance with Tanner’s (1990) claim for height, but with reference to head circumference standards, Roche et al. (1987:708) state: “The present data will al- low interpretation of head circumference values for parents, using 18-year values as reference data.”
The arm circumference reference stan- dards used in this study are those of Roche and Malina (1983:1076), derived from U.S. data from Cycles I1 and I11 of the Health Examination Survey conducted by the NCHS in 1963-65 and 1966-70. These stan- dards end at age 17 years for both males and females.
Comparable standards do not exist for BMI. BMI, defined as weight in kilos divided by the square of height in meters, is often used as a measure of obesity in adults. For example, Burton and Foster (1985) define a standard BMI of 22.4 for females and 22.7 for males, which they describe as a “weight goal” for Americans. Values of 26.9 for fe- males and 27.2 for males represent 20% overweight, and values of 31.4 for females and 31.8 for males represent 40% over- weight (Burton and Foster, 1985). There is less consensus about which BMI values should be used as cutoff points for malnutri- tion in adults. Pryer and Crook (1988:12-13) cite studies which report BMI values of around 22 for Britain, Norway, and the United States, and state “those with a BMI below 20 have a greater risk of mortality.” They (Pryer and Crook, 1988:13) also cite studies in India and Java which report aver- age BMI values of 19 or 20, and state “for
314 K.A. DETTWYLER
TABLE 2. Comparison of weight, height, BMI, arm circumference, and head circumference by sex and uillage
Mean Mean Mean Mean Mean weight (SD) height (SD) BMI (SD) arm circ (SDP head circ (SD) Village
(N) Females Males Females Males Females Males Females Males Females Males
Torokoro 53.2 60.5 159.5 173.3 20.9 20.2 26.4 26.7 52.8 55.4 (64F, 23M) (7.0) (3.8) (5.0) (5.7) (2.3) (1.5) (2.3) (1.2) (1.5) (1.3)
Merediela 52.7 58.9 160.1 170.1 20.6 20.4 26.2 26.4 53.1 54.5 (65F, 26M) (6.2) (5.9) (6.2) (6.6) (1.9) (1.5) (2.3) (1.5) (1.3) (1.7)
Ntenkoni 55.6 58.2 161.1 170.9 21.3 19.9 28.1 26.2 52.6 54.3 (35F, 14M) (12.7) (7.5) (5.8) (8.3) (4.0) (2.1) (4.2) (2.3) (1.6) (1.8)
Famabougou 51.5 57.3 159.3 170.3 20.3 19.7 26.2 26.0 52.9 54.6 (34F, 23M) (6.9) (6.6) (5.4) (6.9) (2.3) (1.9) (2.3) (1.9) (1.5) (1.4)
Dogo 55.2 60.4 161.8 173.2 21.0 20.1 26.5 27.0 53.2 55.4 (93F, 16M) (9.4) (5.8) (5.8) (5.2) (3.2) (1.4) (2.7) (1.5) (1.5) (1.2)
Siramana 51.8 57.8 159.1 170.4 20.4 19.8 25.9 26.3 52.7 54.7 129F, 19M) (7.3) 19.21 (5.4) (6.6) (2.6) (2.2) (2.3) (3.0) (1.6) (1.4)
Combined 53.6 58.8 160.4 171.3 20.8 20.0 26.5 26.4 53.0 54.8 (320F. 121M) (8.5) (6.5) (5.7) (6.6) (2.8) (1.8) (2.6) (1.8) (1.5) (1.51
‘The only significant differences found between villages were for females for arm circumferences (P = ,014). The women of Ntenkoni have significantly greater arm circumferences than the women of Torokoro, Merediela, and Siramana.
such populations it has been tentatively suggested that a lower BMI cutoff point of 18 be used as an index of adult malnutrition.” Finally, Waterlow (1986) has recommended that a BMI of 15 be the lowest acceptable limit for adequately nourished humans.
RESULTS Village comparisons
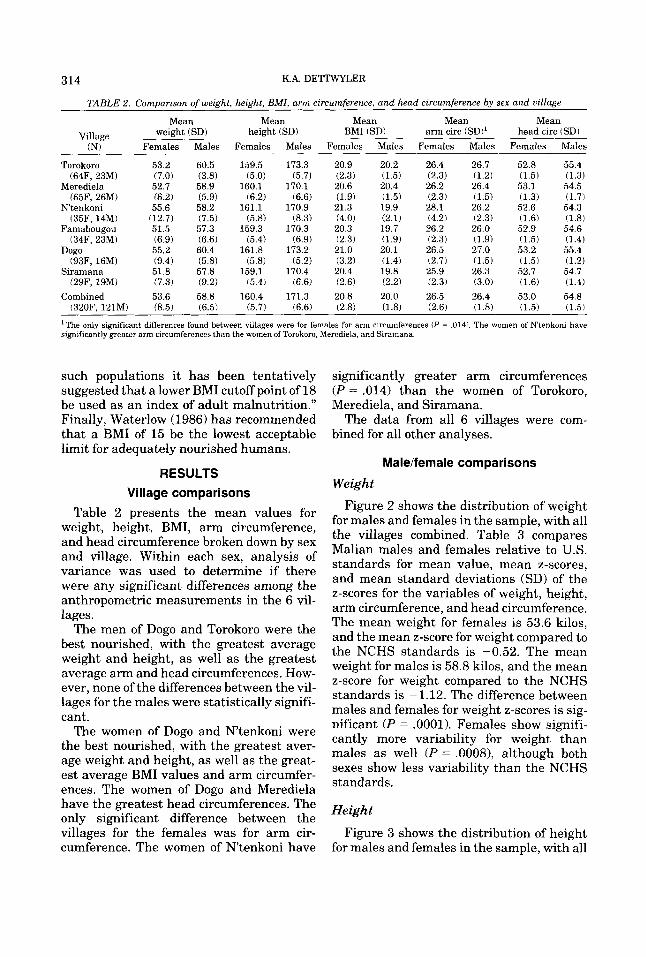
Table 2 presents the mean values for weight, height, BMI, arm circumference, and head circumference broken down by sex and village. Within each sex, analysis of variance was used to determine if there were any significant differences among the anthropometric measurements in the 6 vil- lages.
The men of Dogo and Torokoro were the best nourished, with the greatest average weight and height, as well as the greatest average arm and head circumferences. How- ever, none of the differences between the vil- lages for the males were statistically signifi- cant.
The women of Dogo and Ntenkoni were the best nourished, with the greatest aver- age weight and height, as well as the great- est average BMI values and arm circumfer- ences. The women of Dogo and Merediela have the greatest head circumferences. The only significant difference between the villages for the females was for arm cir- cumference. The women of N’tenkoni have
significantly greater arm circumferences (P = ,014) than the women of Torokoro, Merediela, and Siramana.
The data from all 6 villages were com- bined for all other analyses.
Male/female comparisons
Weight
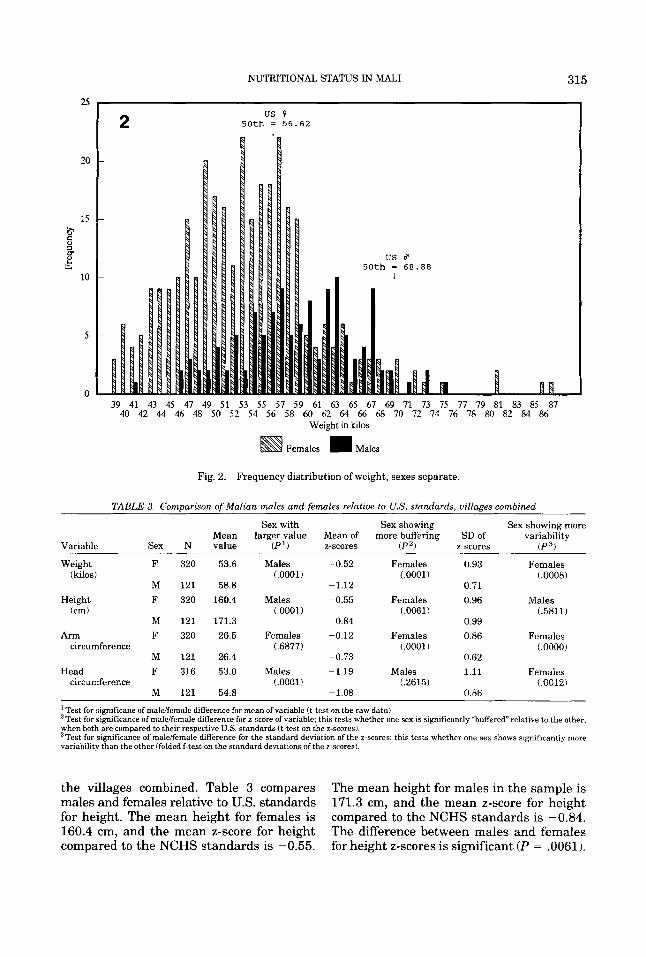
Figure 2 shows the distribution of weight for males and females in the sample, with all the villages combined. Table 3 compares Malian males and females relative to U S . standards for mean value, mean z-scores, and mean standard deviations (SD) of the z-scores for the variables of weight, height, arm circumference, and head circumference. The mean weight for females is 53.6 kilos, and the mean z-score for weight compared to the NCHS standards is -0.52. The mean weight for males is 58.8 kilos, and the mean z-score for weight compared to the NCHS standards is -1.12. The difference between males and females for weight z-scores is sig- nificant (P = .0001). Females show signifi- cantly more variability for weight than males as well (P = .0008), although both sexes show less variability than the NCHS standards.
Height
Figure 3 shows the distribution of height for males and females in the sample, with all
NUTRITIONAL STATUS IN MALI 315
25
20
15 E 1 0-
L e
10
5
0
2 us P 50th = 5 6 . 6 2
I
d 6 8 . 8 8
us d 50th = 6 8 . 8 8
w 39 41 43 45 41 49 51 53 55 51 59 61 63 65 61 69 11 I 3 I5 I7 19 81 83 85 81
40 42 44 46 48 50 52 54 56 58 60 62 64 66 68 70 12 14 16 78 80 82 84 86 Weight in kilos
Females Males
Fig. 2. Frequency distribution of weight, sexes separate.
TABLE 3. Comuarison of Malian males and females relative to US. standards, villages combined
Variable
Weight (kilos!
Height (cmJ
Arm circumference
Head circumference
Sex
F
M F
M F
M F
M
~
N 320
121 320
121 320
121 316
121
Mean value
53.6
58.8 160.4
171.3 26.5
26.4 53.0
54.8
~
Sex with larger value
(P')
Males (.0001)
Males (.0001)
Females (6877)
Males (.0001)
Mean of z-scores
-0.52
-1.12 -0.55
-0.84 +0.12
-0.73 -1.19
-1.08
Sex showing Y
more buffering ( P 2 )
Females (.0001!
Females (.0061)
Females (.0001)
Males (.2615!
SD of z-scores
0.93
0.71 0.96
0.99 0.86
0.62 1.11
0.86
Sex showing more variability
( P 3 )
Females (.0008)
Males (.5811J
Females (.OOOOJ
Females (.0012)
'Test for signlficane of maldfemale difference for mean of variable (t-test on the raw data) 2Test for significance of malelfemale difference for z-score of variable; this tests whether one sex is significantly "buffered" relative to the other, when both are compared to their respective US. standards (t-test on the z-scores). 3Test for significance of maldfemale difference for the standard deviation of the z-scores; this tests whether one sex shows significantly more variability than the other (folded f-test on the standard deviations of the z-scores).
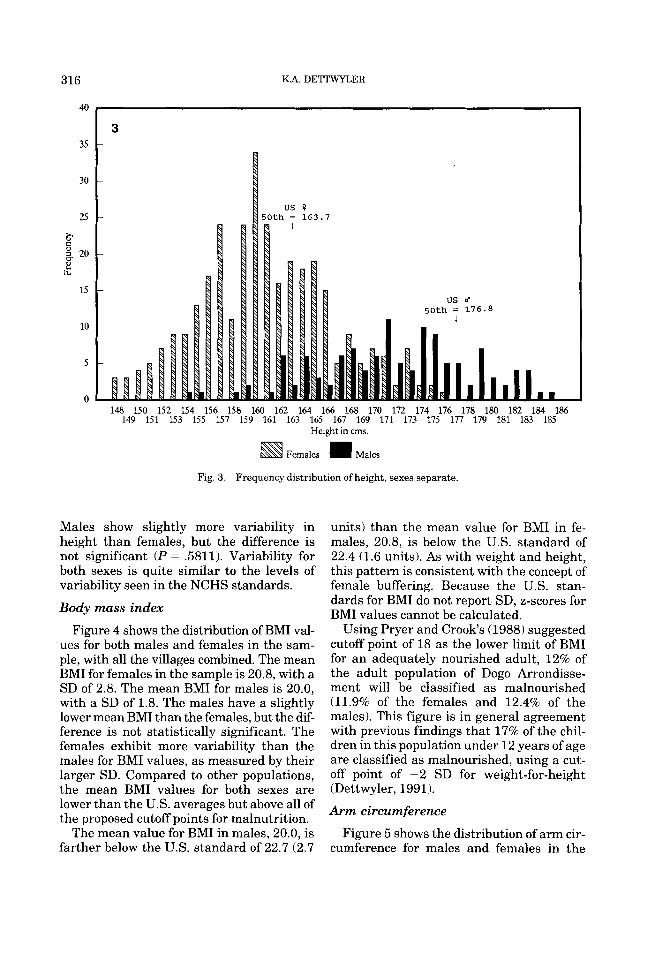
the villages combined. Table 3 compares males and females relative to U.S. standards for height. The mean height for females is 160.4 cm, and the mean z-score for height compared to the NCHS standards is -0.55.
The mean height for males in the sample is 171.3 cm, and the mean z-score for height compared to the NCHS standards is -0.84. The difference between males and females for height z-scores is significant (P = .0061).
K.A. DETTWYLER 316
40
35
30
25
6 5 20 e
I&
15
3
us 0 50th = 163.7
I ' us ap
50th = 176.8
148 150 152 154 156 158 160 162 164 166 168 170 172 174 176 178 180 182 184 186 149 151 153 155 157 159 161 163 165 167 169 171 173 175 177 179 181 183 185
Height in cms.
Females m Males
Fig. 3. Frequency distribution of height, sexes separate
Males show slightly more variability in height than females, but the difference is not significant (P = .5811). Variability for both sexes is quite similar to the levels of variability seen in the NCHS standards.
Body mass index
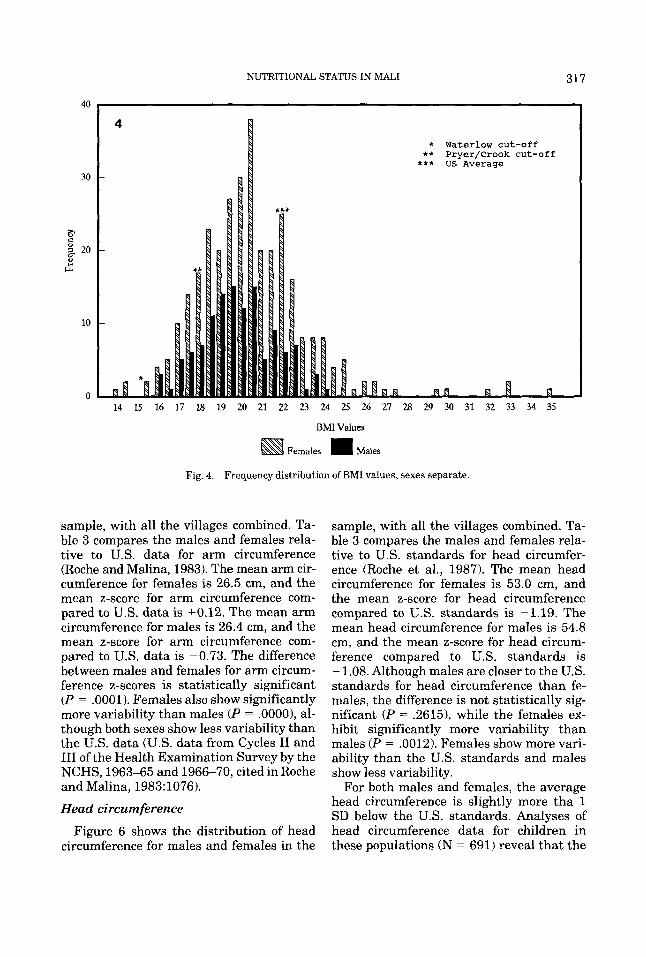
Figure 4 shows the distribution of BMI val- ues for both males and females in the sam- ple, with all the villages combined. The mean BMI for females in the sample is 20.8, with a SD of 2.8. The mean BMI for males is 20.0, with a SD of 1.8. The males have a slightly lower mean BMI than the females, but the dif- ference is not statistically significant. The females exhibit more variability than the males for BMI values, as measured by their larger SD. Compared to other populations, the mean BMI values for both sexes are lower than the US . averages but above all of the proposed cutoff points for malnutrition.
The mean value for BMI in males, 20.0, is farther below the US. standard of 22.7 (2.7
units) than the mean value for BMI in fe- males, 20.8, is below the U S . standard of 22.4 (1.6 units). As with weight and height, this pattern is consistent with the concept of female buffering. Because the U.S. stan- dards for BMI do not report SD, z-scores for BMI values cannot be calculated.
Using Pryer and Crooks (1988) suggested cutoff point of 18 as the lower limit of BMI for an adequately nourished adult, 12% of the adult population of Dogo Arrondisse- ment will be classified as malnourished (11.9% of the females and 12.4% of the males). This figure is in general agreement with previous findings that 17% of the chil- dren in this population under 12 years of age are classified as malnourished, using a cut- off point of -2 SD for weight-for-height (Dettwyler, 1991).
Arm circumference
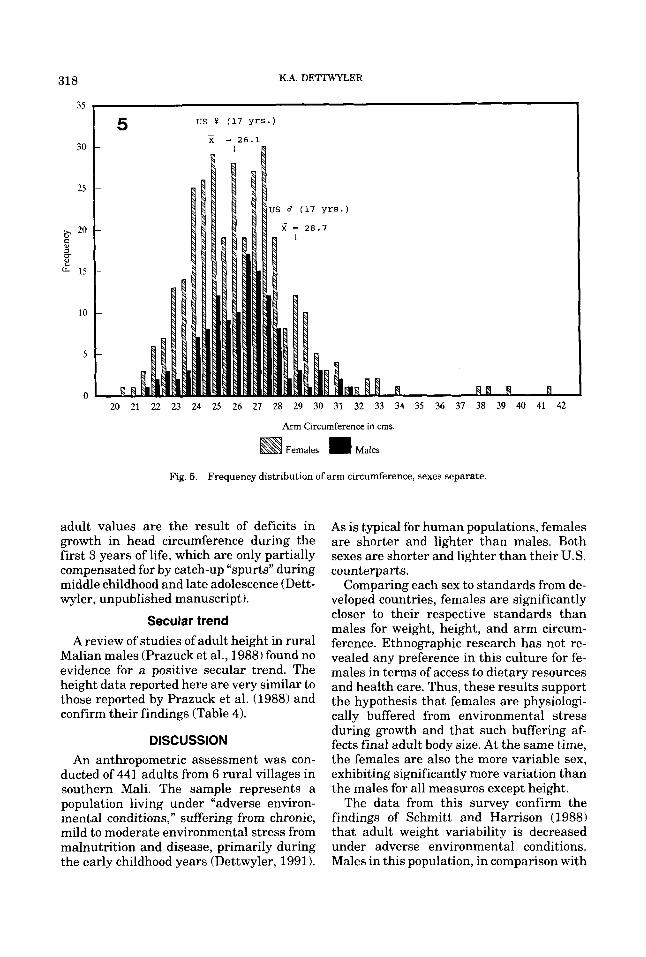
Figure 5 shows the distribution of arm cir- cumference for males and females in the
NUTRITIONAL STATUS IN MALI 317
40
30
$ 5 20 E LI,
4 * Waterlow cut-off
** Pryer/Crook cut-off *** US Average
14 15 16 17 18 19 20 21 22 23 24 25 26 27 28 29 30 31 32 33 34 35
BMI Values
Females Males
Fig. 4. Frequency distribution of BMI values, sexes separate.
sample, with all the villages combined. Ta- ble 3 compares the males and females rela- tive to U.S. data for arm circumference (Roche and Malina, 1983). The mean arm cir- cumference for females is 26.5 cm, and the mean z-score for arm circumference com- pared to U S . data is +0.12. The mean arm circumference for males is 26.4 cm, and the mean z-score for arm circumference com- pared to U.S. data is -0.73. The difference between males and females for arm circum- ference z-scores is statistically significant (P = .0001). Females also show significantly more variability than males (P = .OOOO), al- though both sexes show less variability than the U.S. data (U.S. data from Cycles I1 and 111 of the Health Examination Survey by the NCHS, 1963-65 and 1966-70, cited in Roche and Malina, 1983:1076).
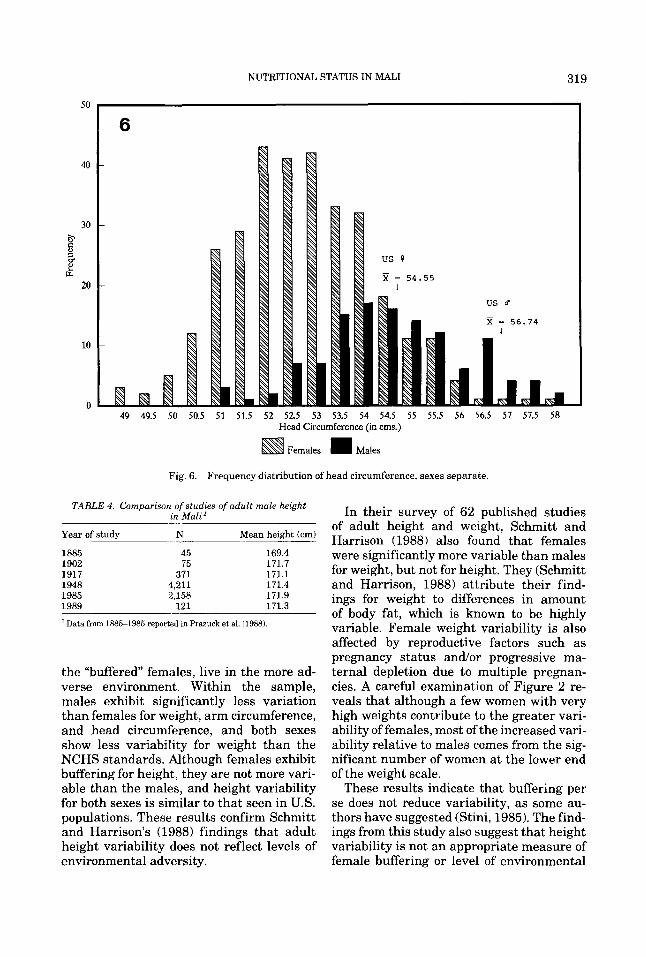
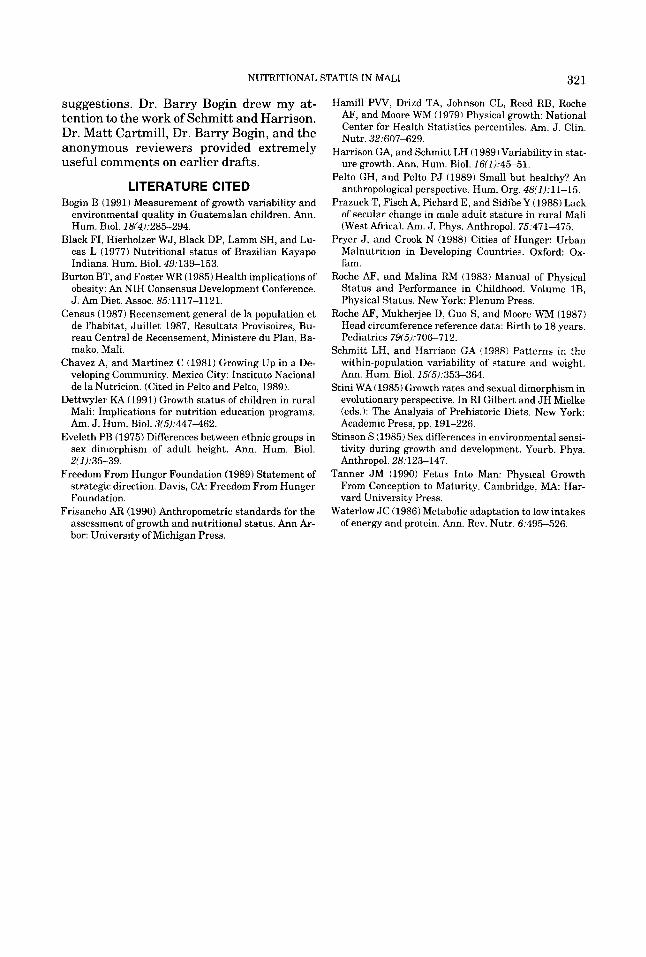
Head circumference
Figure 6 shows the distribution of head circumference for males and females in the
sample, with all the villages combined. Ta- ble 3 compares the males and females rela- tive to U.S. standards for head circumfer- ence (Roche et al., 1987). The mean head circumference for females is 53.0 cm, and the mean z-score for head circumference compared to U S . standards is -1.19. The mean head circumference for males is 54.8 cm, and the mean z-score for head circum- ference compared to U.S. standards is - 1.08. Although males are closer to the U.S. standards for head circumference than fe- males, the difference is not statistically sig- nificant (P = .2615), while the females ex- hibit significantly more variability than males (P = .0012). Females show more vari- ability than the US. standards and males show less variability.
For both males and females, the average head circumference is slightly more tha 1 SD below the US . standards. Analyses of head circumference data for children in these populations (N = 691) reveal that the
318
35
30
25
6 2o 5 E u+ 15
10
5
K.A. DE’ITWYLER
5 US 0 (17 yrs.)
X = 26.1 -
20 21 22 23 24 25 26 21 28 29 30 31 32 33 34 35 36 3 1 38 39 40 41 42
Arm Circumference in cms.
Females m Males
Fig. 5. Frequency distribution of arm circumference, sexes separate.
adult values are the result of deficits in growth in head circumference during the first 3 years of life, which are only partially compensated for by catch-up “spurts” during middle childhood and late adolescence (Dett- wyler, unpublished manuscript).
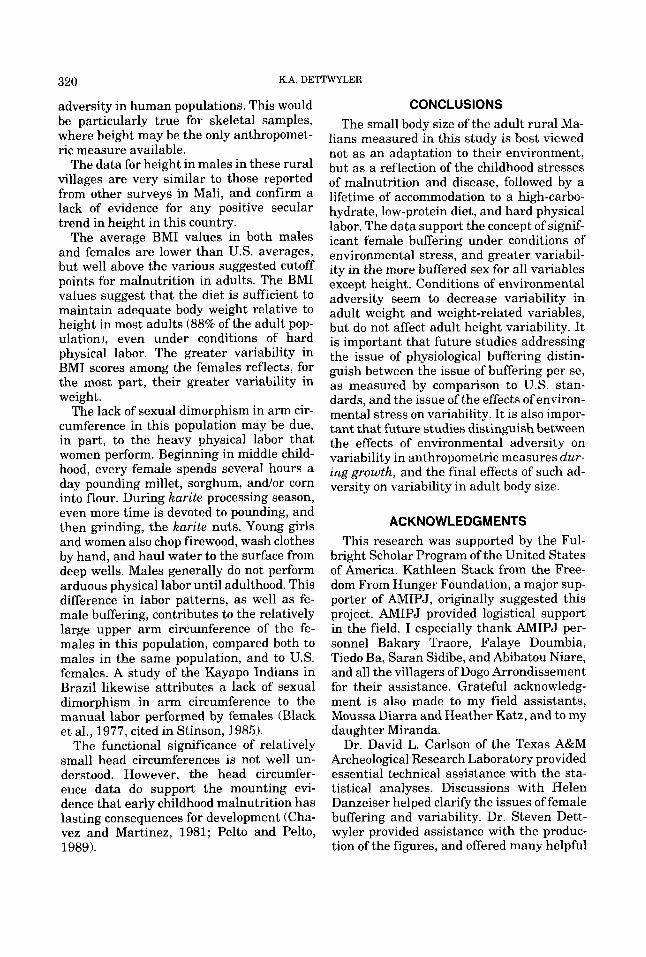
Secular trend Areview of studies of adult height in rural
Malian males (Prazuck et al., 1988) found no evidence for a positive secular trend. The height data reported here are very similar to those reported by Prazuck et al. (1988) and confirm their findings (Table 4).
DISCUSSION An anthropometric assessment was con-
ducted of 441 adults from 6 rural villages in southern Mali. The sample represents a population living under “adverse environ- mental conditions,” suffering from chronic, mild to moderate environmental stress from malnutrition and disease, primarily during the early childhood years (Dettwyler, 1991).
As is typical for human populations, females are shorter and lighter than males. Both sexes are shorter and lighter than their U.S. counterparts.
Comparing each sex to standards from de- veloped countries, females are significantly closer to their respective standards than males for weight, height, and arm circum- ference. Ethnographic research has not re- vealed any preference in this culture for fe- males in terms of access to dietary resources and health care. Thus, these results support the hypothesis that females are physiologi- cally buffered from environmental stress during growth and that such buffering af- fects final adult body size. At the same time, the females are also the more variable sex, exhibiting significantly more variation than the males for all measures except height.
The data from this survey confirm the findings of Schmitt and Harrison (1988) that adult weight variability is decreased under adverse environmental conditions. Males in this population, in comparison with
NUTRITIONAL STATUS IN MALI 319
50
40
30
I U
L i2
20
10
6
us 9
x = 54.55 -
I
us d X = 5 6 . 7 4 -
1
49 49.5 50 50.5 51 51.5 52 525 53 53.5 54 54.5 55 55.5 56 56.5 57 57.5 58 Head Circumference (in cms.)
Females Males
Fig. 6. Frequency distribution of head circumference, sexes separate.
TABLE 4. Comparison of studies of adult male height in Mali’
Year of study N Mean height (cm)
1885 45 169.4 1902 75 171.7 1917 371 171.1 1948 4.211 171.4 1985 2;158 171.9 1989 121 171.3
’ Data from 1885-1985 reported in Prazuck e t al. (1988)
the “buffered” females, live in the more ad- verse environment. Within the sample, males exhibit significantly less variation than females for weight, arm circumference, and head circumference, and both sexes show less variability for weight than the NCHS standards. Although females exhibit buffering for height, they are not more vari- able than the males, and height variability for both sexes is similar to that seen in U.S. populations. These results confirm Schmitt and Harrison’s (1988) findings that adult height variability does not reflect levels of environmental adversity.
In their survey of 62 published studies of adult height and weight, Schmitt and Harrison (1988) also found that females were significantly more variable than males for weight, but not for height. They (Schmitt and Harrison, 1988) attribute their find- ings for weight to differences in amount of body fat, which is known to be highly variable. Female weight variability is also affected by reproductive factors such as pregnancy status and/or progressive ma- ternal depletion due to multiple pregnan- cies. A careful examination of Figure 2 re- veals that although a few women with very high weights contribute to the greater vari- ability of females, most of the increased vari- ability relative to males comes from the sig- nificant number of women at the lower end of the weight scale.
These results indicate that buffering per se does not reduce variability, as some au- thors have suggested (Stini, 1985). The find- ings from this study also suggest that height variability is not an appropriate measure of female buffering or level of environmental
320 K.A. DETTWYLER
adversity in human populations. This would be particularly true for skeletal samples, where height may be the only anthropomet- ric measure available.
The data for height in males in these rural villages are very similar to those reported from other surveys in Mali, and confirm a lack of evidence for any positive secular trend in height in this country.
The average BMI values in both males and females are lower than U.S. averages, but well above the various suggested cutoff points for malnutrition in adults. The BMI values suggest that the diet is sufficient to maintain adequate body weight relative to height in most adults (88% of the adult pop- ulation), even under conditions of hard physical labor. The greater variability in BMI scores among the females reflects, for the most part, their greater variability in weight.
The lack of sexual dimorphism in arm cir- cumference in this population may be due, in part, to the heavy physical labor that women perform. Beginning in middle child- hood, every female spends several hours a day pounding millet, sorghum, and/or corn into flour. During karite processing season, even more time is devoted to pounding, and then grinding, the karite nuts. Young girls and women also chop firewood, wash clothes by hand, and haul water to the surface from deep wells. Males generally do not perform arduous physical labor until adulthood. This difference in labor patterns, as well as fe- male buffering, contributes to the relatively large upper arm circumference of the fe- males in this population, compared both to males in the same population, and to US. females. A study of the Kayapo Indians in Brazil likewise attributes a lack of sexual dimorphism in arm circumference to the manual labor performed by females (Black et al., 1977, cited in Stinson, 1985).
The functional significance of relatively small head circumferences is not well un- derstood. However, the head circumfer- ence data do support the mounting evi- dence that early childhood malnutrition has lasting consequences for development (Cha- vez and Martinez, 1981; Pelto and Pelto, 1989).
CONCLUSIONS The small body size of the adult rural Ma-
lians measured in this study is best viewed not as an adaptation to their environment, but as a reflection of the childhood stresses of malnutrition and disease, followed by a lifetime of accommodation to a high-carbo- hydrate, low-protein diet, and hard physical labor. The data support the concept of signif- icant female buffering under conditions of environmental stress, and greater variabil- ity in the more buffered sex for all variables except height. Conditions of environmental adversity seem to decrease variability in adult weight and weight-related variables, but do not affect adult height variability. It is important that future studies addressing the issue of physiological buffering distin- guish between the issue of buffering per se, as measured by comparison to U.S. stan- dards, and the issue of the effects of environ- mental stress on variability. It is also impor- tant that future studies distinguish between the effects of environmental adversity on variability in anthropometric measures dur- ing growth, and the final effects of such ad- versity on variability in adult body size.
ACKNOWLEDGMENTS This research was supported by the Ful-
bright Scholar Program of the United States of America. Kathleen Stack from the Free- dom From Hunger Foundation, a major sup- porter of AMIPJ, originally suggested this project. AMIPJ provided logistical support in the field. I especially thank AMIPJ per- sonnel Bakary Traore, Falaye Doumbia, Tiedo Ba, Saran Sidibe, and Abibatou Niare, and all the villagers of Dogo Arrondissement for their assistance. Grateful acknowledg- ment is also made to my field assistants, Moussa Diarra and Heather Katz, and to my daughter Miranda.
Dr. David L. Carlson of the Texas A&M Archeological Research Laboratory provided essential technical assistance with the sta- tistical analyses. Discussions with Helen Danzeiser helped clarify the issues of female buffering and variability. Dr. Steven Dett- wyler provided assistance with the produc- tion of the figures, and offered many helpful
NUTRITIONAL STATUS IN MALI 321
suggestions. Dr. Barry Bogin drew my at- tention to the work of Schmitt and Harrison. Dr. Matt Cartmill, Dr. Barry Bogin, and the anonymous reviewers provided extremely useful comments on earlier drafts.
LITERATURE CITED Bogin B (1991) Measurement of growth variability and
environmental quality in Guatemalan children. Ann. Hum. Biol. 18(4):285-294.
Black FI, Hierholzer WJ, Black DP, Lamm SH, and Lu- cas L (1977) Nutritional status of Brazilian Kayapo Indians. Hum. Biol. 49:139-153.
Burton BT, and Foster WR (1985) Health implications of obesity: An NIH Consensus Development Conference. J. Am Diet. Assoc. 85t1117-1121.
Census (1987) Recensement general de la population et de I’habitat, Juillet 1987, Resultats Provisoires, Bu- reau Central de Recensement, Ministere du Plan, Ba- mako, Mali.
Chavez A, and Martinez C (1981) Growing Up in a De- veloping Community. Mexico City: Instituto Nacional de la Nutricion. (Cited in Pelto and Pelto, 1989).
Dettwyler KA (1991) Growth status of children in rural Mali: Implications for nutrition education programs. Am. J. Hum. Biol. 3f5Jt447-462.
Eveleth PB (1975) Differences between ethnic groups in sex dimorphism of adult height. Ann. Hum. Biol.
Freedom From Hunger Foundation (1989) Statement of strategic direction. Davis, C A Freedom From Hunger Foundation.
Frisancho AR (1990) Anthropometric standards for the assessment of growth and nutritional status. Ann Ar- bor: University of Michigan Press.
2/1Jr35-39.
Hamill P W , Drizd TA, Johnson CL, Reed RB, Roche AF, and Moore WM (1979) Physical growth: National Center for Health Statistics percentiles. Am. J. Clin. Nutr. 32:607-629.
Harrison GA, and Schmitt LH (1989) Variability in stat- ure growth. Ann. Hum. Biol. 16(11:45-51.
Pelto GH, and Pelto PJ (1989) Small but healthy? An anthropological perspective. Hum. Org. 48/1Jt11-15.
Prazuck T, Fisch A, Pichard E, and Sidibe Y (1988) Lack of secular change in male adult stature in rural Mali (West Africa). Am. J. Phys. Anthropol. 75t471-475.
Pryer J , and Crook N (1988) Cities of Hunger: Urban Malnutrition in Developing Countries. Oxford: Ox- fam.
Roche AF, and Malina RM (1983) Manual of Physical Status and Performance in Childhood. Volume lB, Physical Status. New York: Plenum Press,
Roche AF, Mukherjee D, Guo S, and Moore WM (1987) Head circumference reference data: Birth to 18 years. Pediatrics 79/5/:706-712.
Schmitt LH, and Harrison GA (1988) Patterns in the within-population variability of stature and weight. Ann. Hum Biol. 15(5):353-364.
Stini WA f 1985) Growth rates and sexual dimorphism in evolutionary perspective. In RI Gilbert and J H Mielke (eds.): The Analysis of Prehistoric Diets. New York: Academic Press, pp. 191-226.
Stinson S (1985) Sex differences in environmental sensi- tivity during growth and development. Yearb. Phys. Anthropol. 28t123-147.
Tanner JM (1990) Fetus Into Man: Physical Growth From Conception to Maturity. Cambridge, MA: Har- vard University Press.
Waterlow JC (1986) Metabolic adaptation to low intakes of energy and protein. Ann. Rev. Nutr. 6t495-526.