Embed Size (px)
Citation preview

NWPMA2017 Conference
Concrete Pavement Design Tools
Jim Powell, P.E. Executive Director
American Concrete Pavement Association, Northwest Chapter
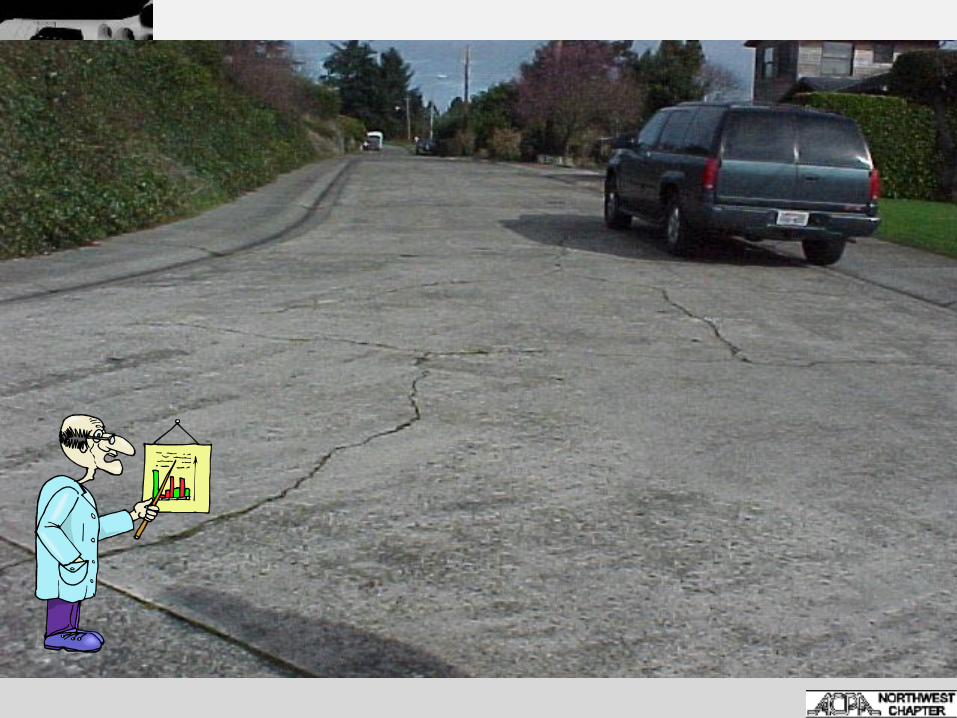
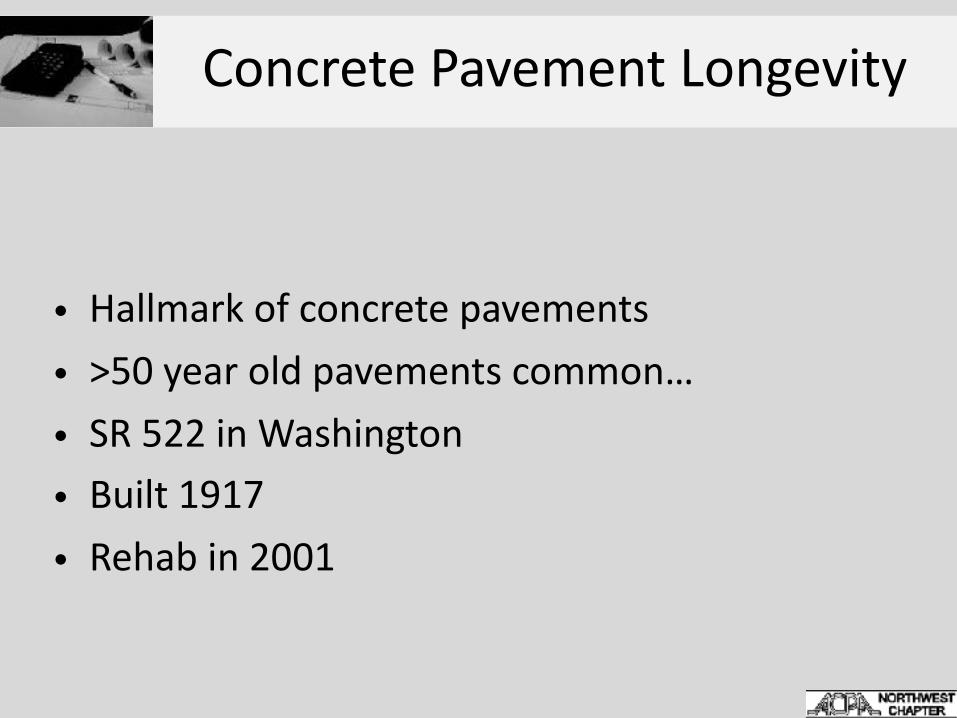
Concrete Pavement Longevity
• Hallmark of concrete pavements • >50 year old pavements common… • SR 522 in Washington • Built 1917 • Rehab in 2001
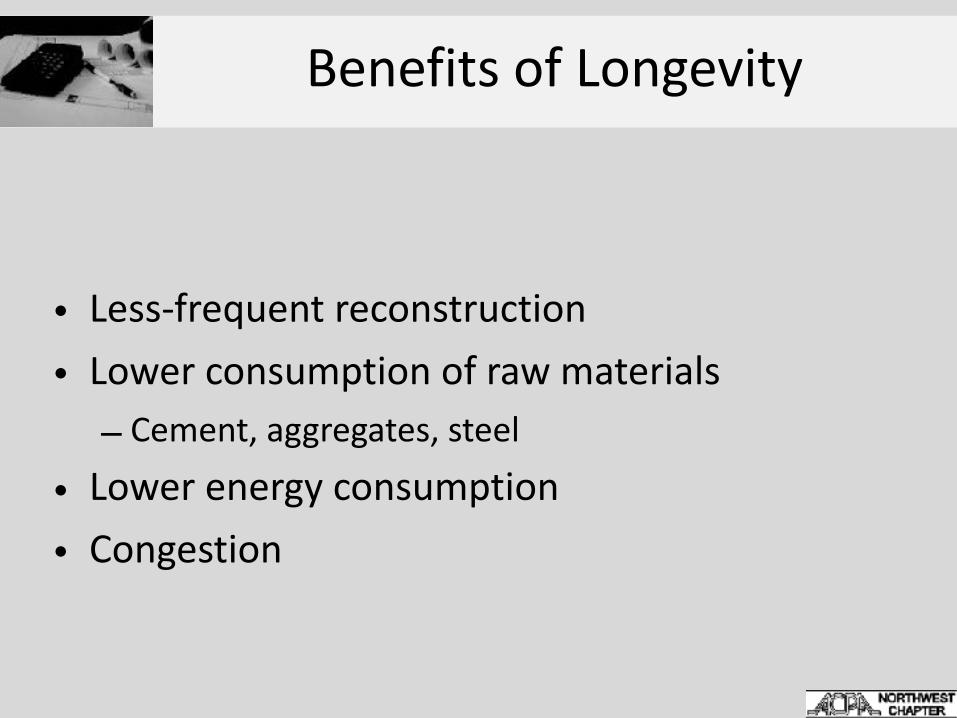
Benefits of Longevity
• Less-frequent reconstruction • Lower consumption of raw materials
– Cement, aggregates, steel
• Lower energy consumption • Congestion
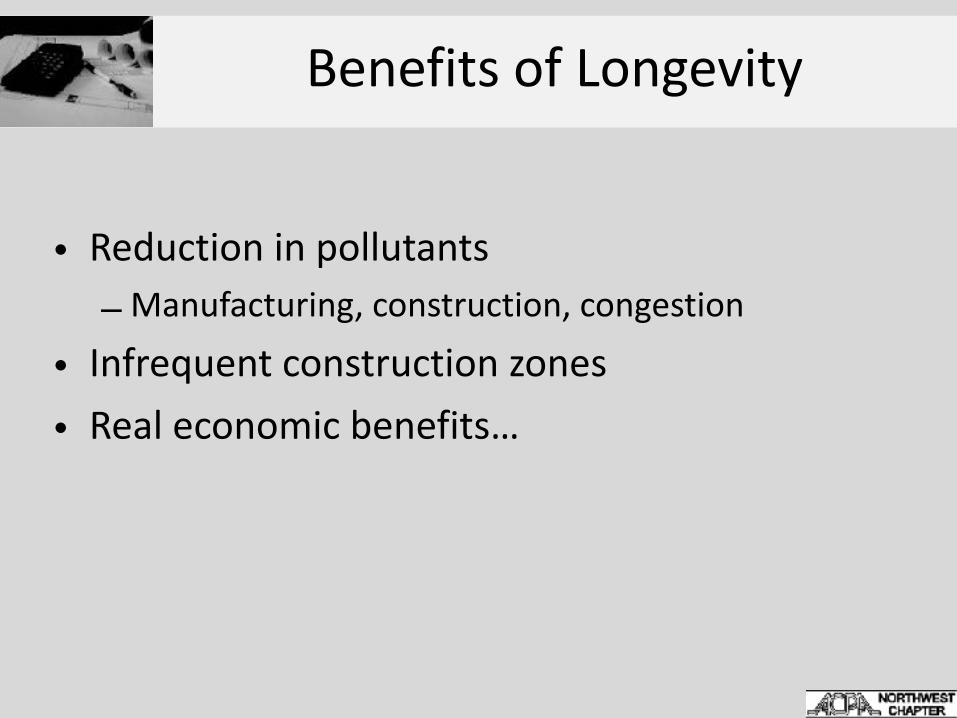
Benefits of Longevity
• Reduction in pollutants – Manufacturing, construction, congestion
• Infrequent construction zones • Real economic benefits…
Pavement Design !!
PAVEMENT DESIGN
NCHRP 1-26 Phase II Final Report
The new pavement will be built in the future, on subgrades often not yet exposed or accessible; using materials not yet manufactured from sources not yet identified; by a contractor who submitted the successful "low dollar" bid, employing unidentified personnel and procedures under climatic conditions that are frequently less than ideal.
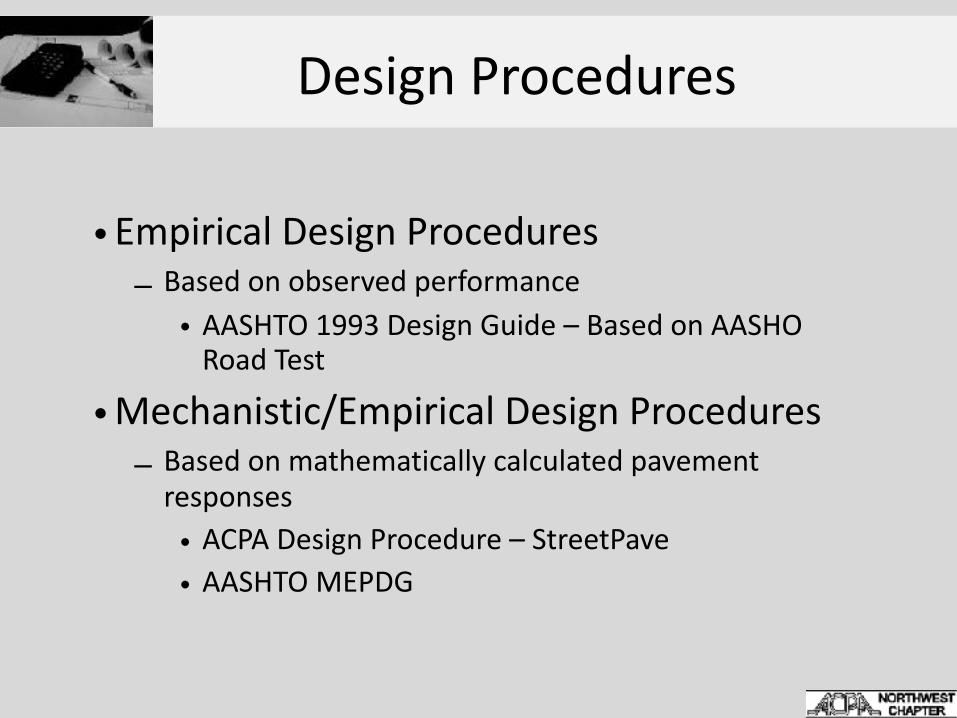
Design Procedures
• Empirical Design Procedures – Based on observed performance
• AASHTO 1993 Design Guide – Based on AASHO Road Test
• Mechanistic/Empirical Design Procedures – Based on mathematically calculated pavement
responses • ACPA Design Procedure – StreetPave • AASHTO MEPDG
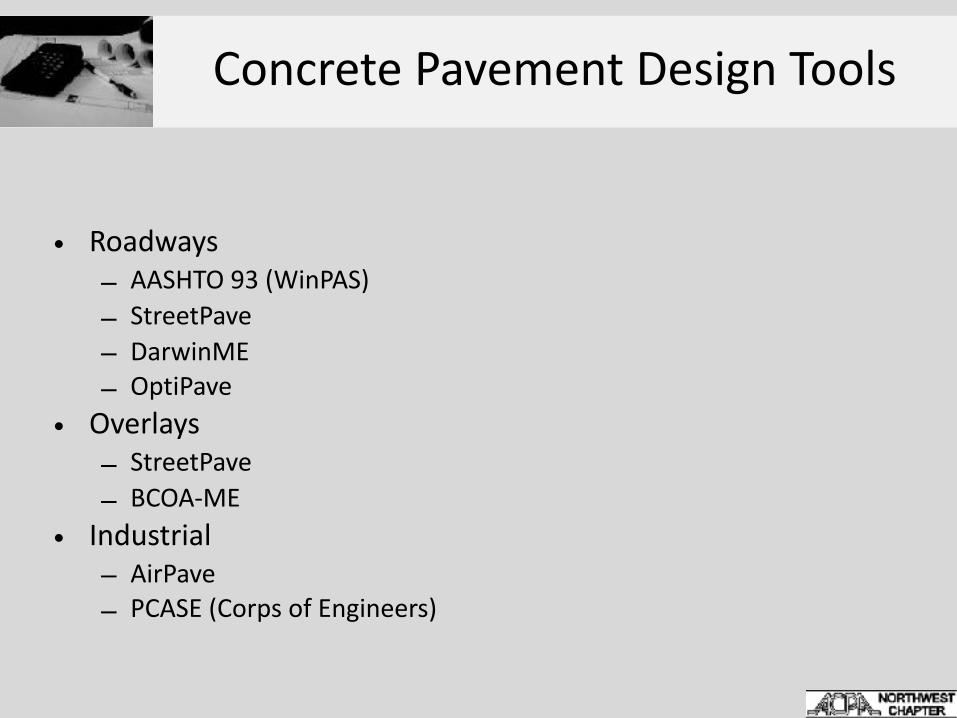
Concrete Pavement Design Tools
• Roadways – AASHTO 93 (WinPAS) – StreetPave – DarwinME – OptiPave
• Overlays – StreetPave – BCOA-ME
• Industrial – AirPave – PCASE (Corps of Engineers)
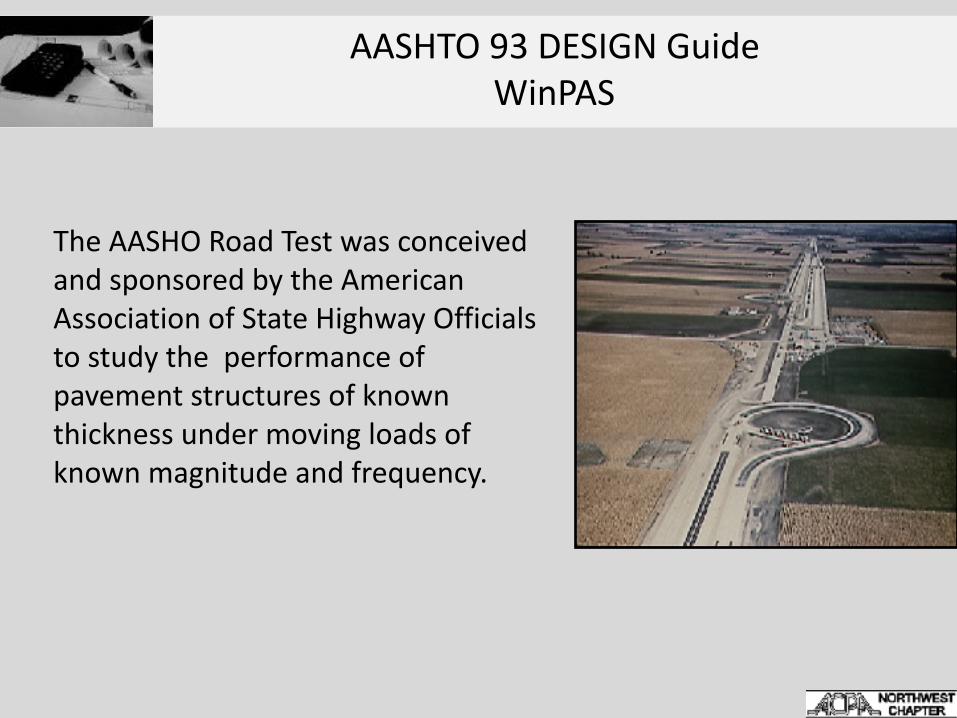
AASHTO 93 DESIGN GuideWinPAS
The AASHO Road Test was conceived and sponsored by the American Association of State Highway Officials to study the performance of pavement structures of known thickness under moving loads of known magnitude and frequency.
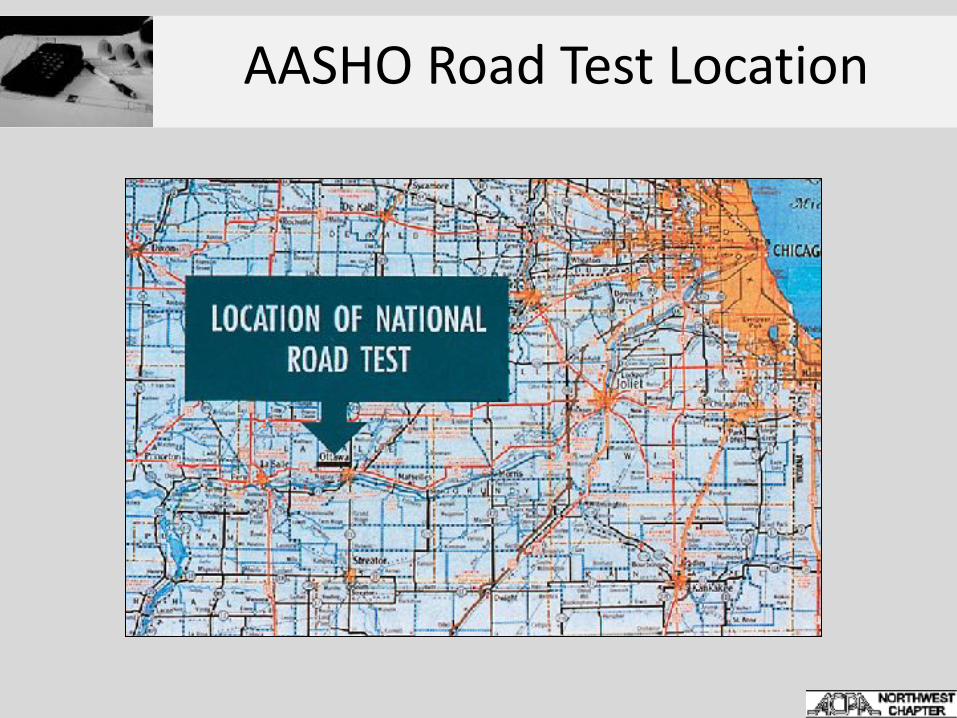
AASHO Road Test Location
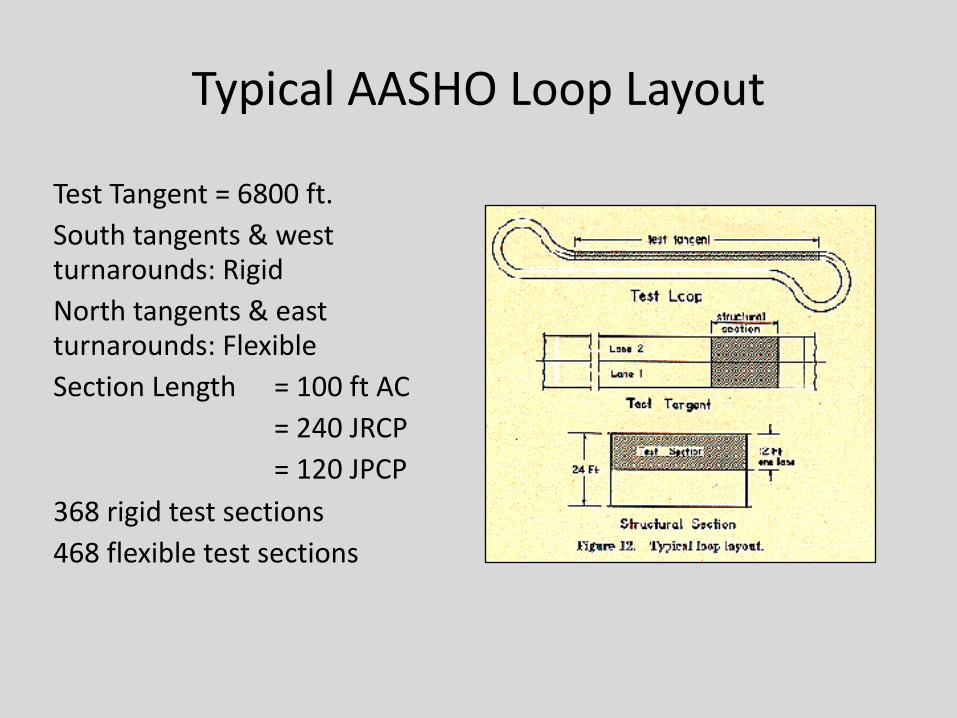
Typical AASHO Loop Layout
Test Tangent = 6800 ft. South tangents & west turnarounds: Rigid North tangents & east turnarounds: Flexible Section Length = 100 ft AC = 240 JRCP = 120 JPCP 368 rigid test sections 468 flexible test sections
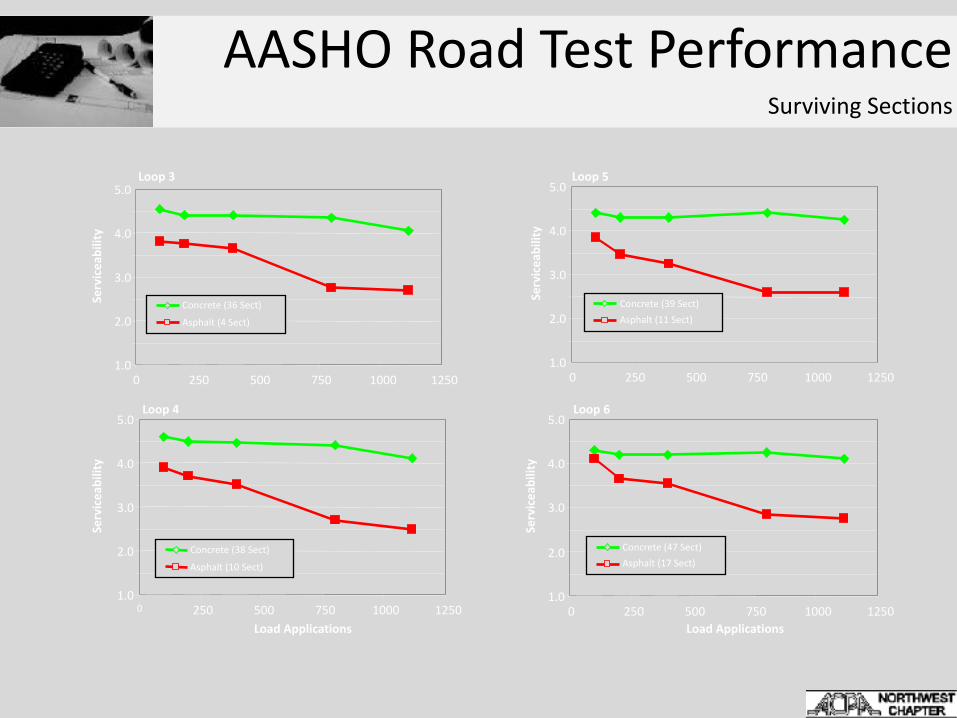
AASHO Road Test PerformanceSurviving Sections
Loop 3
1.0
2.0
3.0
4.0
5.0
0 250 500 750 1000 1250
Serv
icea
bilit
y
Concrete (36 Sect)
Asphalt (4 Sect)
Loop 4
1.0
2.0
3.0
4.0
5.0
0 250 500 750 1000 1250Load Applications
Serv
icea
bilit
y
Loop 5
1.0
2.0
3.0
4.0
5.0
0 250 500 750 1000 1250
Serv
icea
bilit
y
Loop 6
1.0
2.0
3.0
4.0
5.0
0 250 500 750 1000 1250Load Applications
Serv
icea
bilit
yConcrete (38 Sect)
Asphalt (10 Sect)
Concrete (39 Sect)Asphalt (11 Sect)
Concrete (47 Sect)Asphalt (17 Sect)
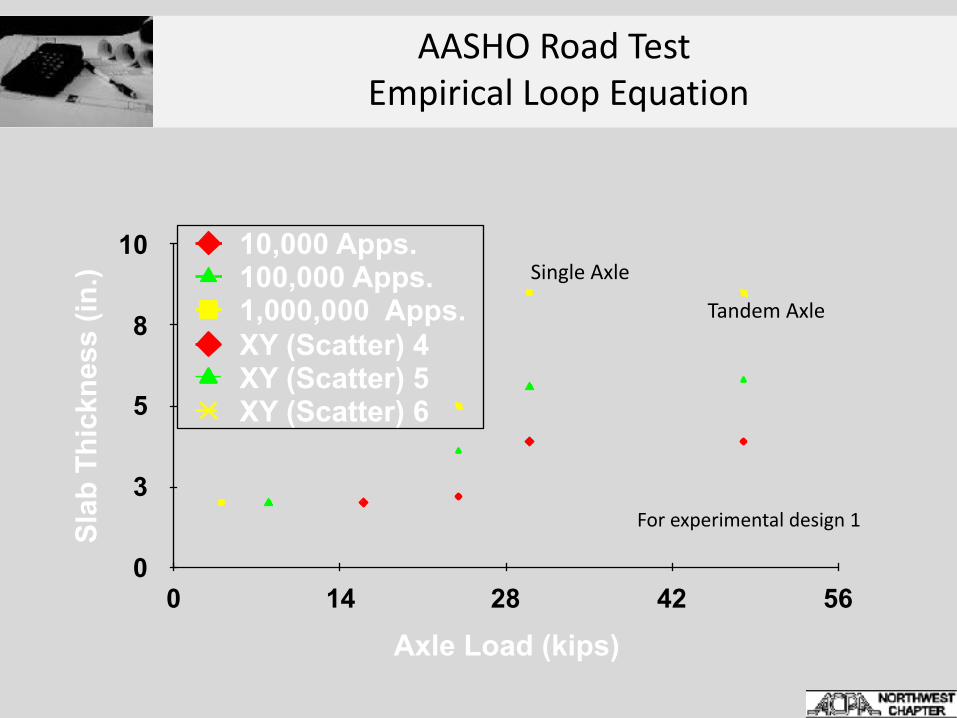
AASHO Road Test Empirical Loop Equation
Slab
Thi
ckne
ss (i
n.)
0
3
5
8
10
Axle Load (kips)0 14 28 42 56
10,000 Apps.100,000 Apps.1,000,000 Apps.XY (Scatter) 4XY (Scatter) 5XY (Scatter) 6
Single Axle
Tandem Axle
For experimental design 1
AASHO Road Test Extended Design Equation
• Empirical Loop Equation only good for conditions at the AASHO Road Test
• Researchers wanted to extend equation to other sites with different:
• Materials • Subgrades • Climates • Traffic Loadings
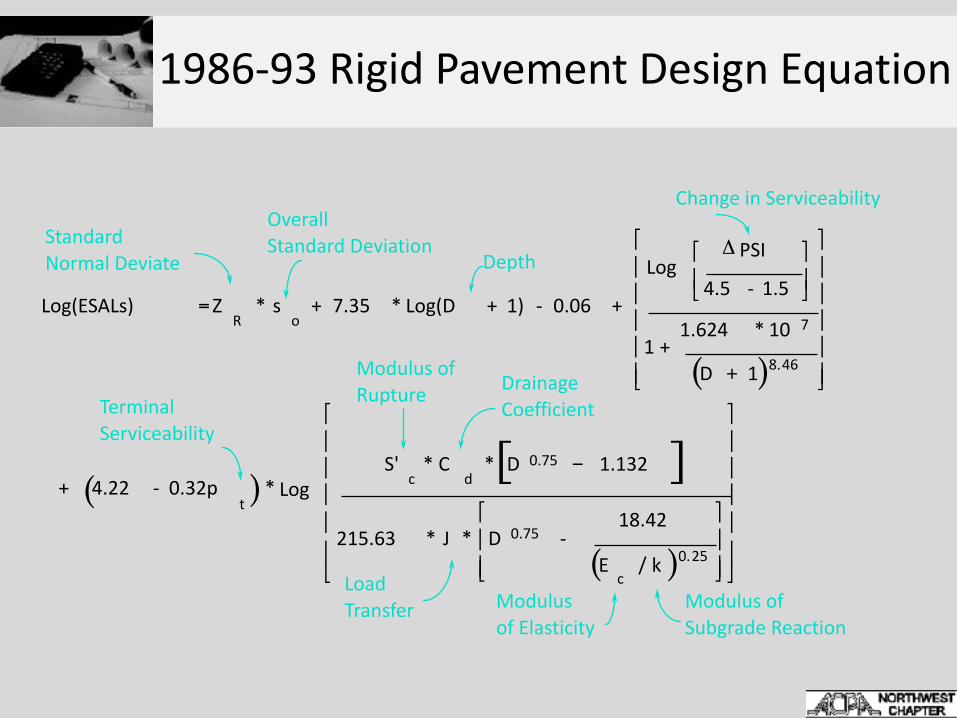
Log(ESALs) Z * s + 7.35 * Log(D + 1) - 0.06R o
=
( )
+
LogPSI
4.5 - 1.5
1 +1.624 * 10
D
7
⎡
⎣⎢⎤
⎦⎥
+
⎡
⎣
⎢⎢⎢⎢⎢
⎤
⎦
⎥⎥⎥⎥⎥
Δ
1 8 46.
Standard Normal Deviate
Overall Standard Deviation
Depth
( )+ 4.22 - 0.32pt
*[ ]
( )
LogS' C D 1.132
215.63 * J * D - 18.42
E / k
c d0.75
0.75
c
−
⎡
⎣
⎢⎢
⎤
⎦
⎥⎥
⎡
⎣
⎢⎢⎢⎢⎢
⎤
⎦
⎥⎥⎥⎥⎥0 25.
* *
Change in Serviceability
Terminal Serviceability
DrainageCoefficient
Load Transfer
Modulus of Rupture
Modulus of Elasticity
Modulus of Subgrade Reaction
1986-93 Rigid Pavement Design Equation
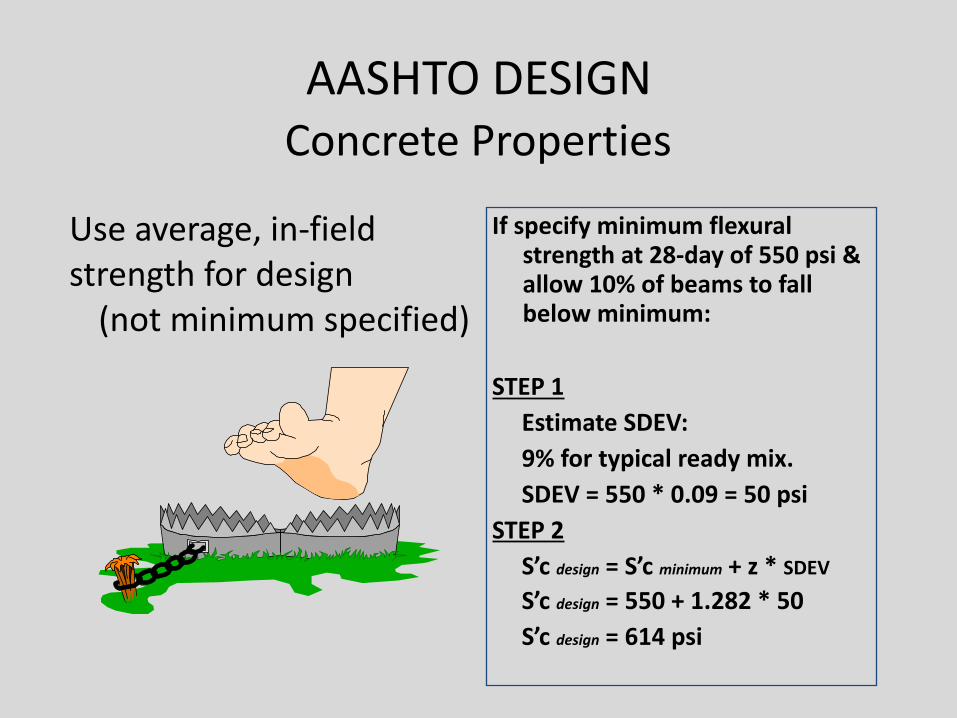
AASHTO DESIGNConcrete Properties
Use average, in-field strength for design (not minimum specified)
If specify minimum flexural strength at 28-day of 550 psi & allow 10% of beams to fall below minimum:
STEP 1 Estimate SDEV: 9% for typical ready mix. SDEV = 550 * 0.09 = 50 psi STEP 2 S’c design = S’c minimum + z * SDEV S’c design = 550 + 1.282 * 50 S’c design = 614 psi
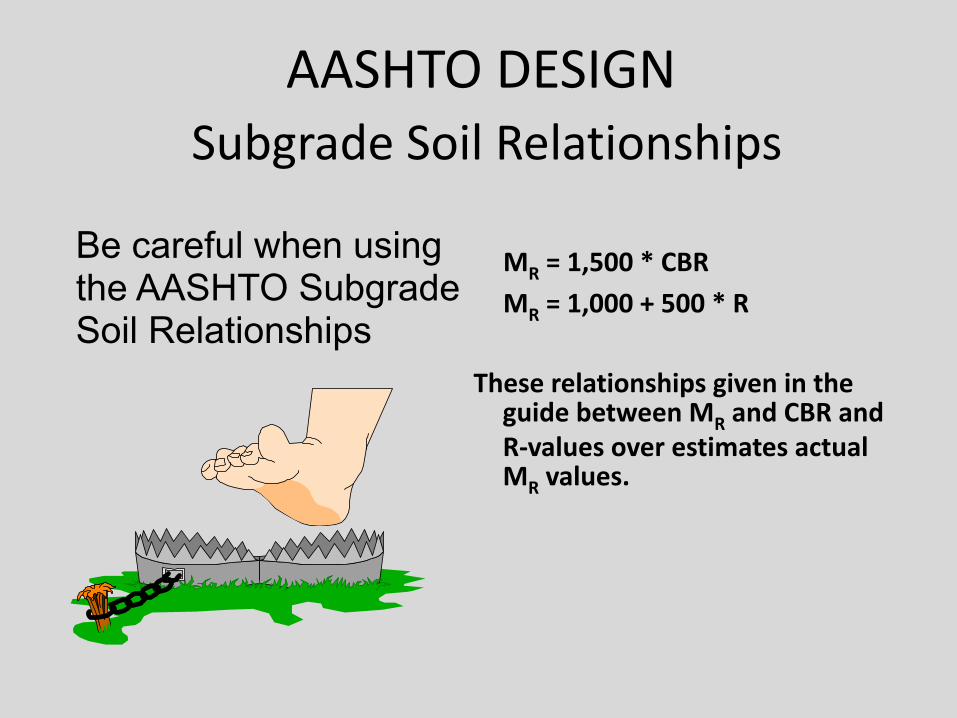
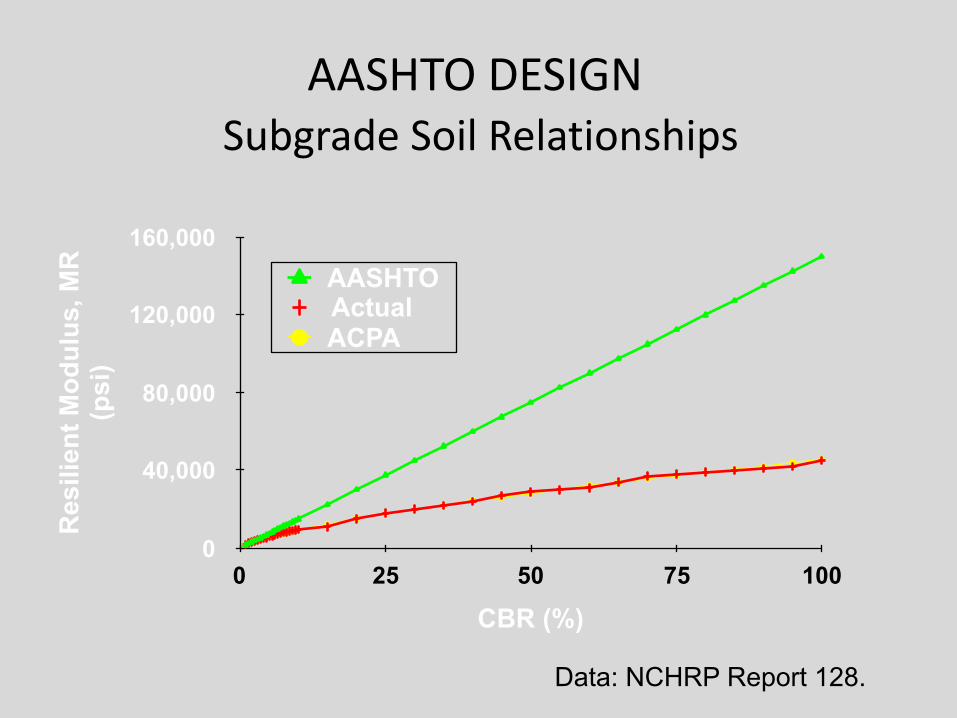
AASHTO DESIGN Subgrade Soil Relationships
MR = 1,500 * CBR MR = 1,000 + 500 * R
These relationships given in the guide between MR and CBR and R-values over estimates actual MR values.
Be careful when using the AASHTO Subgrade Soil Relationships
AASHTO DESIGN Subgrade Soil Relationships
Res
ilien
t Mod
ulus
, MR
(p
si)
0
40,000
80,000
120,000
160,000
CBR (%)0 25 50 75 100
AASHTOActual ACPA
Data: NCHRP Report 128.
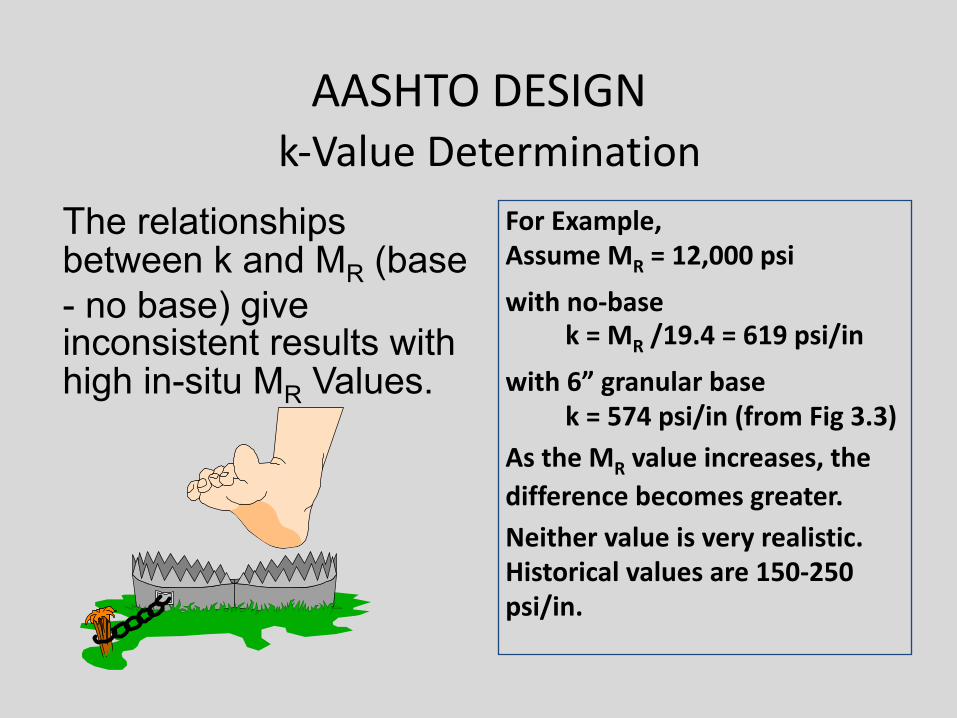
AASHTO DESIGN k-Value Determination
The relationships between k and MR (base - no base) give inconsistent results with high in-situ MR Values.
For Example, Assume MR = 12,000 psi with no-base k = MR /19.4 = 619 psi/in with 6” granular base k = 574 psi/in (from Fig 3.3) As the MR value increases, the difference becomes greater. Neither value is very realistic. Historical values are 150-250 psi/in.
AASHTO DESIGN Loss of Support
Reduces k-value due to expected erosion of subgrade. LOS = 0 models conditions at the AASHO road test. Upper 3 feet were required to be:
AASHO A-6 (clay) Group Index = 9-13 Plastic Index = 11-15 Liquid Limit 27-32 80-85% passed the #200 Sieve
AASHTO DESIGNSubgrade Strength
Use Loss of Support = 0 (otherwise your using a huge fudge factor)
All cracking of rigid pavements at the AASHO road test were preceded by the pumping of material from underneath the slab.
The primary mode of failure at the road test was loss of support in the poor clay soil.
Therefore, AASHTO design equations already account for support loss.
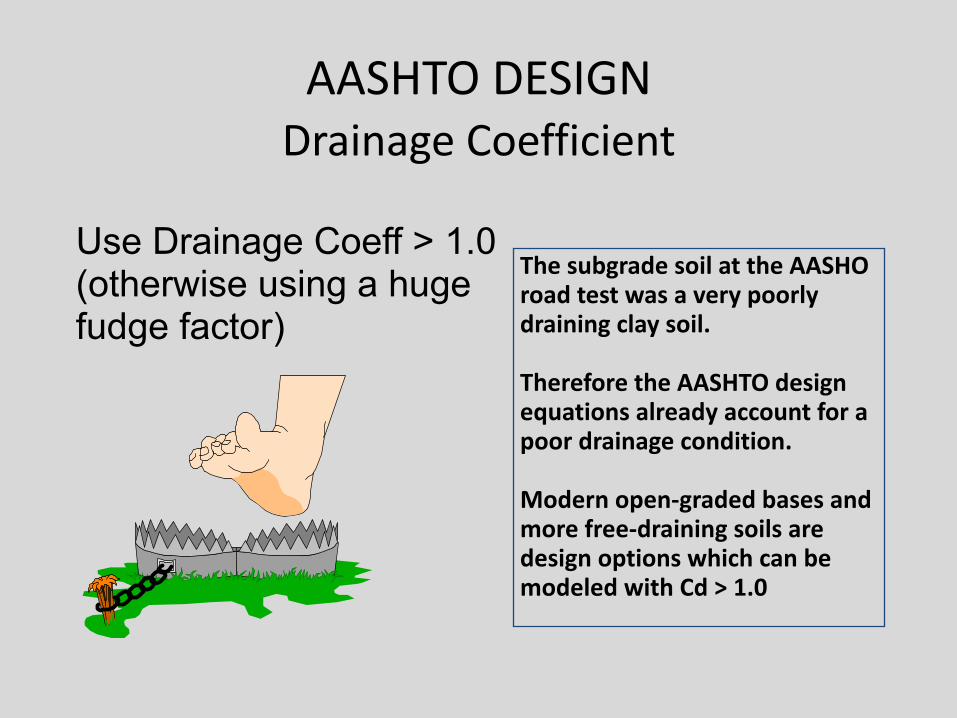
AASHTO DESIGNDrainage Coefficient
The subgrade soil at the AASHO road test was a very poorly draining clay soil.
Therefore the AASHTO design equations already account for a poor drainage condition. Modern open-graded bases and more free-draining soils are design options which can be modeled with Cd > 1.0
Use Drainage Coeff > 1.0 (otherwise using a huge fudge factor)
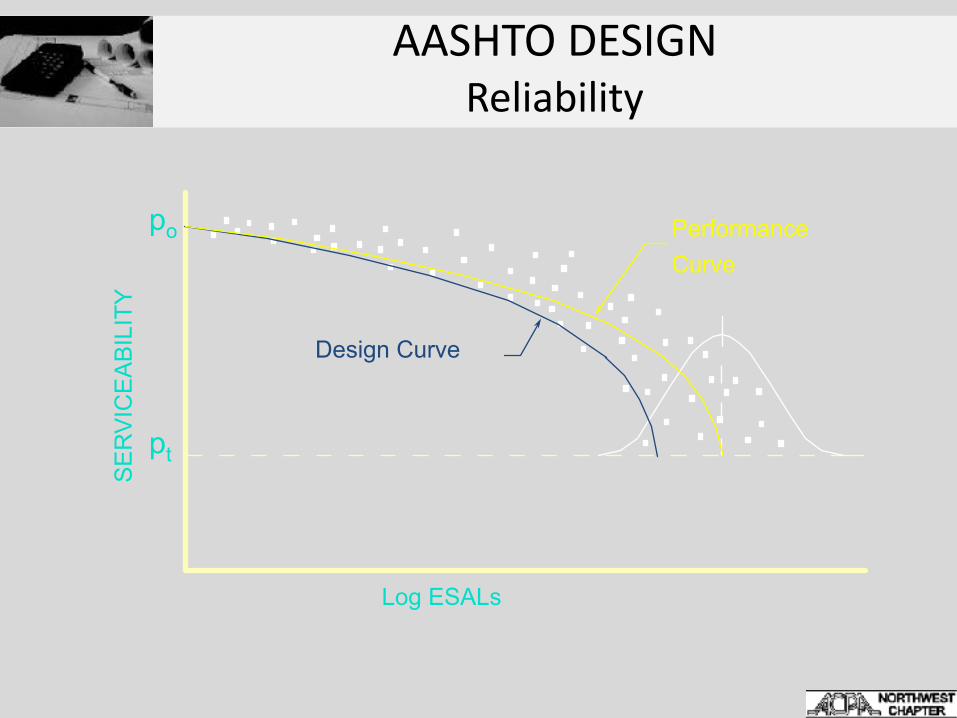
AASHTO DESIGNReliability
Log ESALs
SE
RV
ICE
AB
ILIT
Y
pt
po
Design Curve
PerformanceCurve
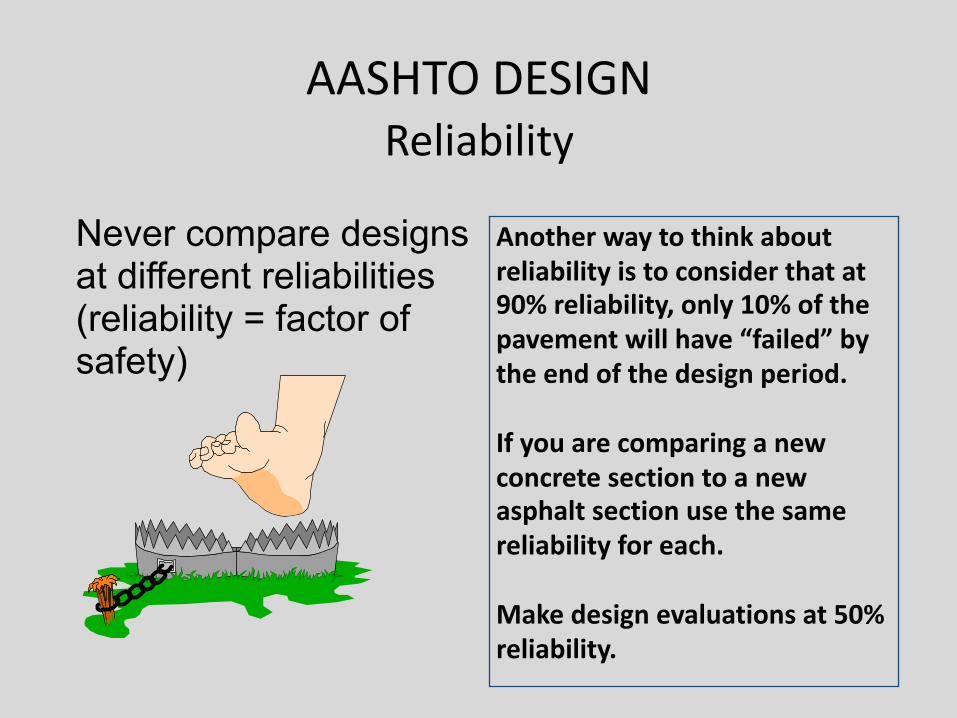
AASHTO DESIGNReliability
Another way to think about reliability is to consider that at 90% reliability, only 10% of the pavement will have “failed” by the end of the design period.
If you are comparing a new concrete section to a new asphalt section use the same reliability for each.
Make design evaluations at 50% reliability.
Never compare designs at different reliabilities (reliability = factor of safety)
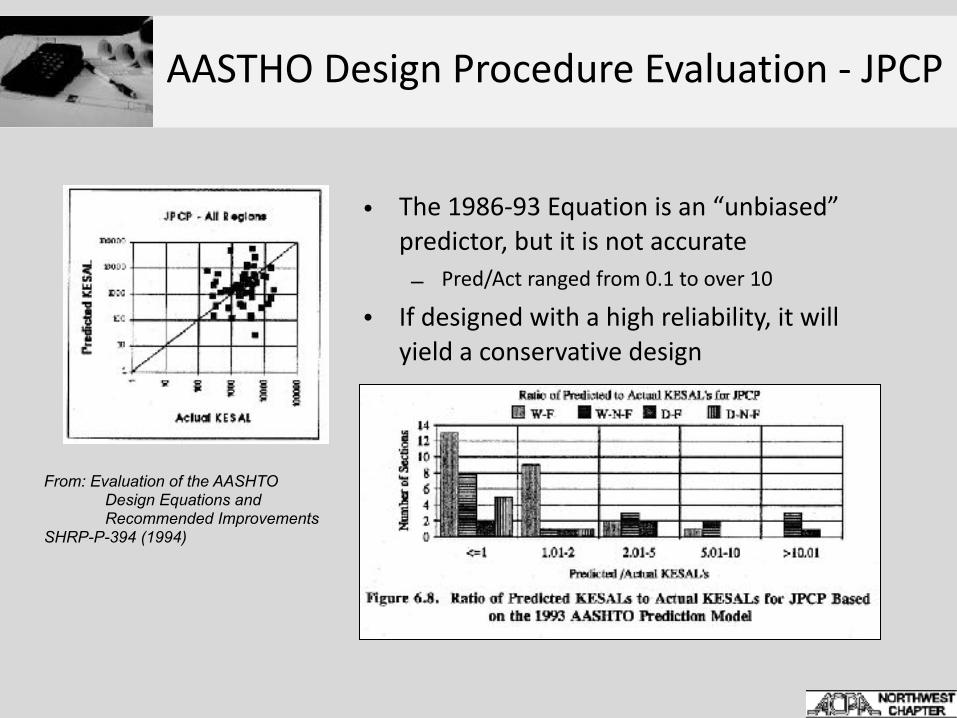
AASTHO Design Procedure Evaluation - JPCP
• The 1986-93 Equation is an “unbiased” predictor, but it is not accurate – Pred/Act ranged from 0.1 to over 10
• If designed with a high reliability, it will yield a conservative design
From: Evaluation of the AASHTO Design Equations and Recommended Improvements
SHRP-P-394 (1994)
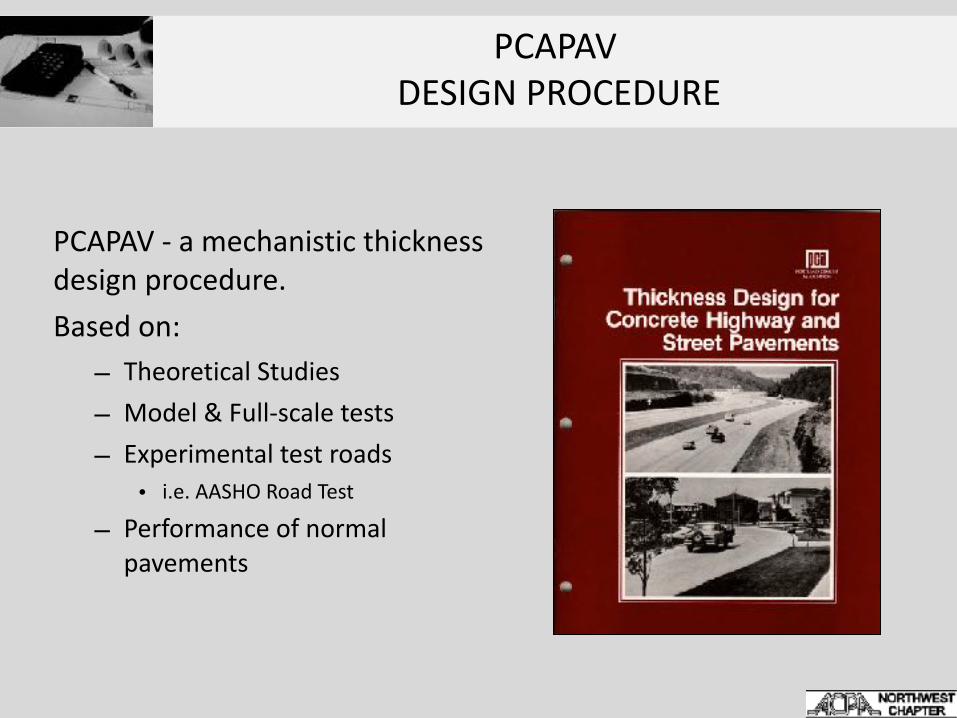
PCAPAV DESIGN PROCEDURE
PCAPAV - a mechanistic thickness design procedure. Based on:
– Theoretical Studies – Model & Full-scale tests – Experimental test roads
• i.e. AASHO Road Test – Performance of normal
pavements
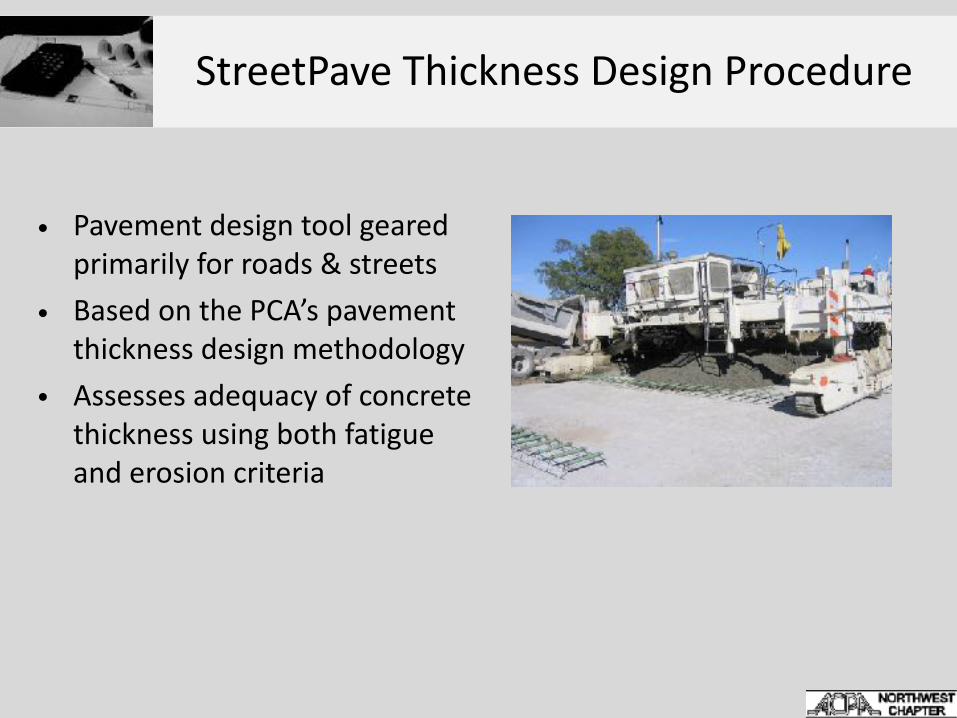
StreetPave Thickness Design Procedure
• Pavement design tool geared primarily for roads & streets
• Based on the PCA’s pavement thickness design methodology
• Assesses adequacy of concrete thickness using both fatigue and erosion criteria
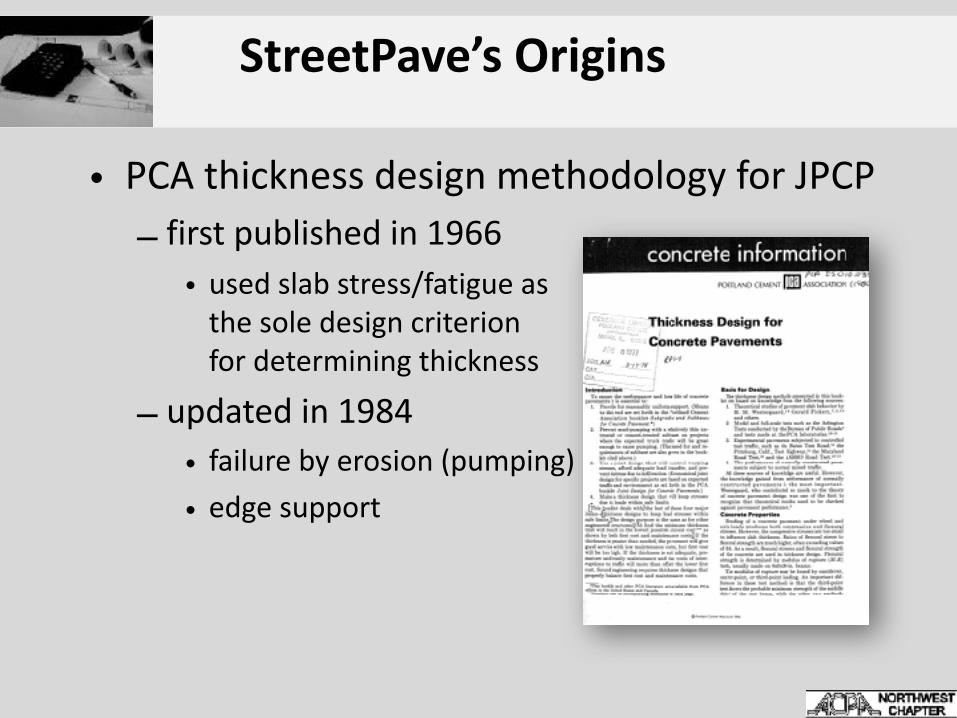
StreetPave’s Origins
• PCA thickness design methodology for JPCP – first published in 1966
• used slab stress/fatigue asthe sole design criterion for determining thickness
– updated in 1984 • failure by erosion (pumping) • edge support
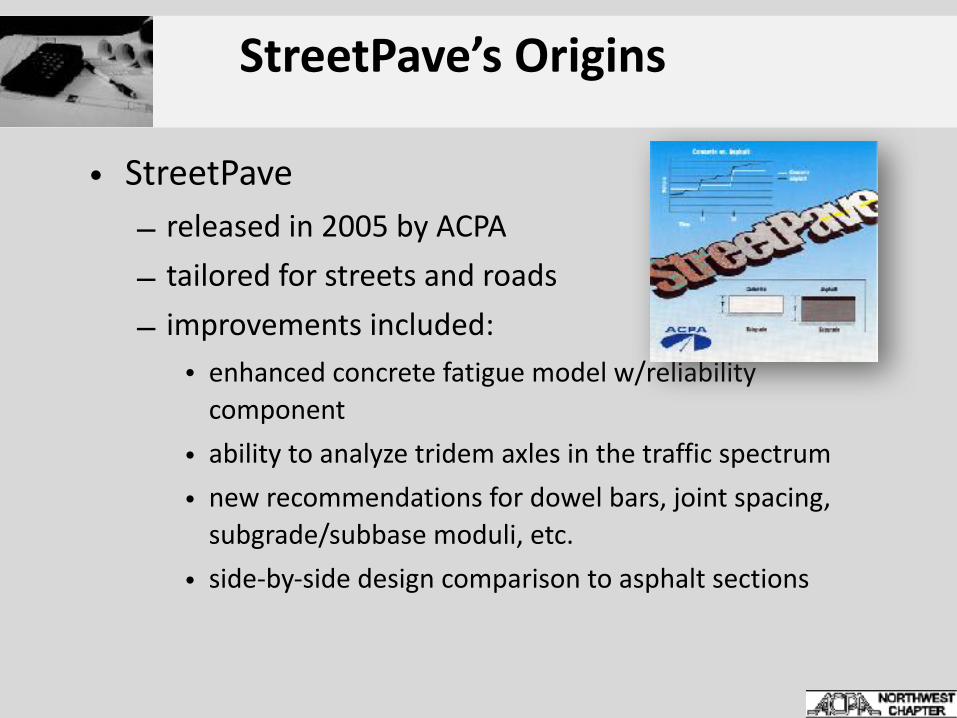
StreetPave’s Origins
• StreetPave – released in 2005 by ACPA – tailored for streets and roads – improvements included:
• enhanced concrete fatigue model w/reliability component
• ability to analyze tridem axles in the traffic spectrum
• new recommendations for dowel bars, joint spacing, subgrade/subbase moduli, etc.
• side-by-side design comparison to asphalt sections
Fatigue – Total Damage
• Cumulative damage:
where, FDtotal = total fatigue damage, % FDsingle = fatigue damage from single axle loads, % FDtandem = fatigue damage from tandem axle loads, % FDtridem = fatigue damage from tridem axle loads, %
!�"�#�$�#�%�&� = !�"�(�)�*�+�&�,� + !�"�#�%�*�.�,�/� + !�"�#�0�)�.�,�/�
MECHANISTIC DESIGN … but validated
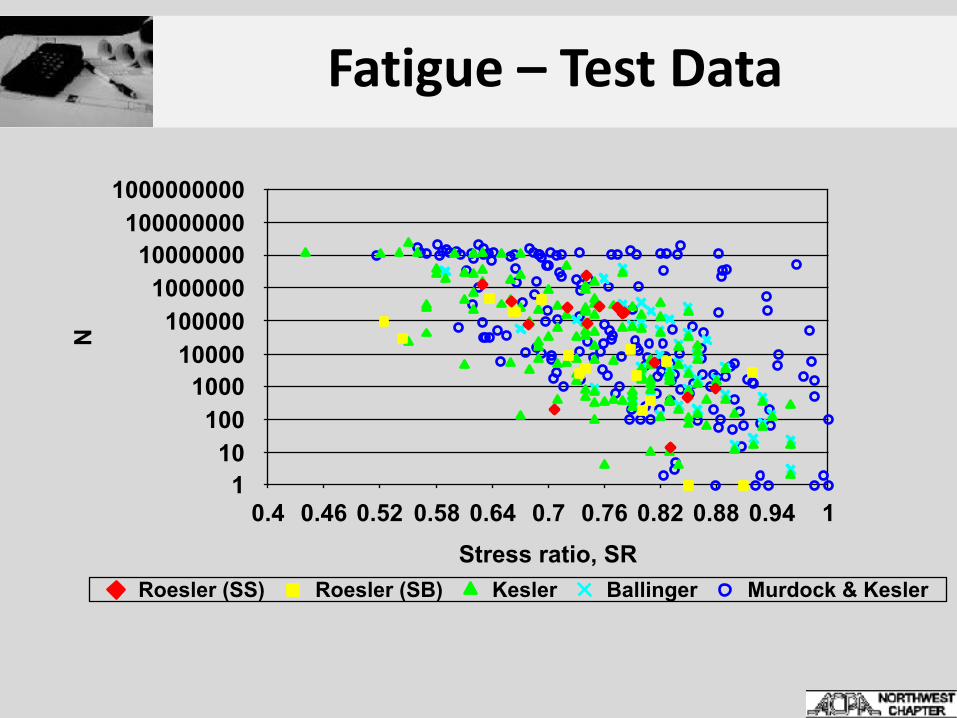
Fatigue – Test DataN
110
1001000
10000100000
100000010000000
1000000001000000000
Stress ratio, SR0.4 0.46 0.52 0.58 0.64 0.7 0.76 0.82 0.88 0.94 1
Roesler (SS) Roesler (SB) Kesler Ballinger Murdock & Kesler
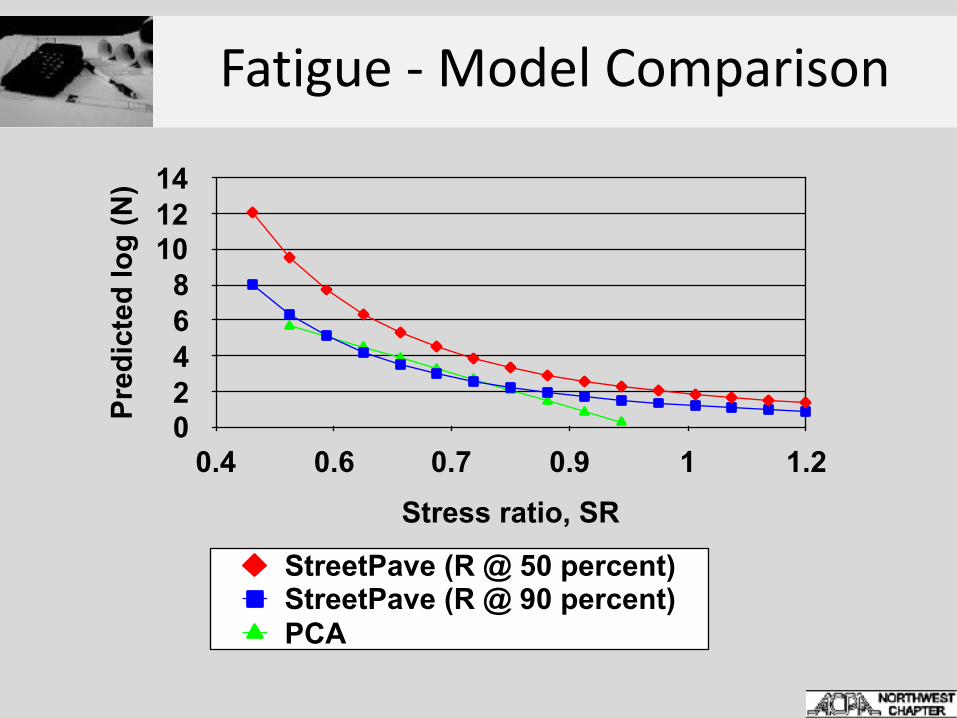
Fatigue - Model ComparisonPr
edic
ted
log
(N)
02468
101214
Stress ratio, SR0.4 0.6 0.7 0.9 1 1.2
StreetPave (R @ 50 percent)StreetPave (R @ 90 percent)PCA
!�"�#�$�#�%�&� = !�"�(�)�*�+�&�,� + !�"�#�%�*�.�,�/� + !�"�#�0�)�.�,�/�
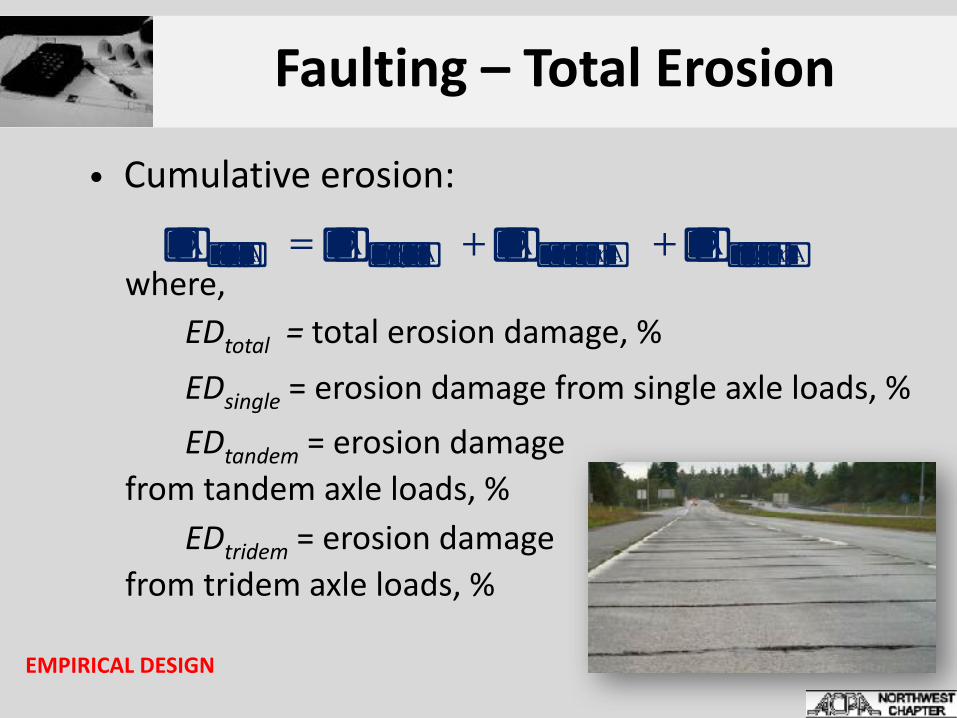
Faulting – Total Erosion
• Cumulative erosion:
where, EDtotal = total erosion damage, % EDsingle = erosion damage from single axle loads, % EDtandem = erosion damage
from tandem axle loads, % EDtridem = erosion damage
from tridem axle loads, %
EMPIRICAL DESIGN
Faulting – Erosion per Load Group
• Erosion damage (ED) for each load group is computed per Miner’s damage hypothesis:
where, n = number of load applications Ne = allowable
applications to erosion failure
!�"� = $�%�&�
Faulting – Power
• Rate or work or power:
where, δeq = equivalent corner deflection, in. k = composite k-value of subgrade/subbase • Idea is that, for a unit area, a thinner pavement
with a shorter deflection basin (e.g., smaller radius of relative stiffness) will receive a faster punch
!�"�#�$�%� = 268.7 ,-�1.27 ∗ 0�$�1�2
ℎ3�4
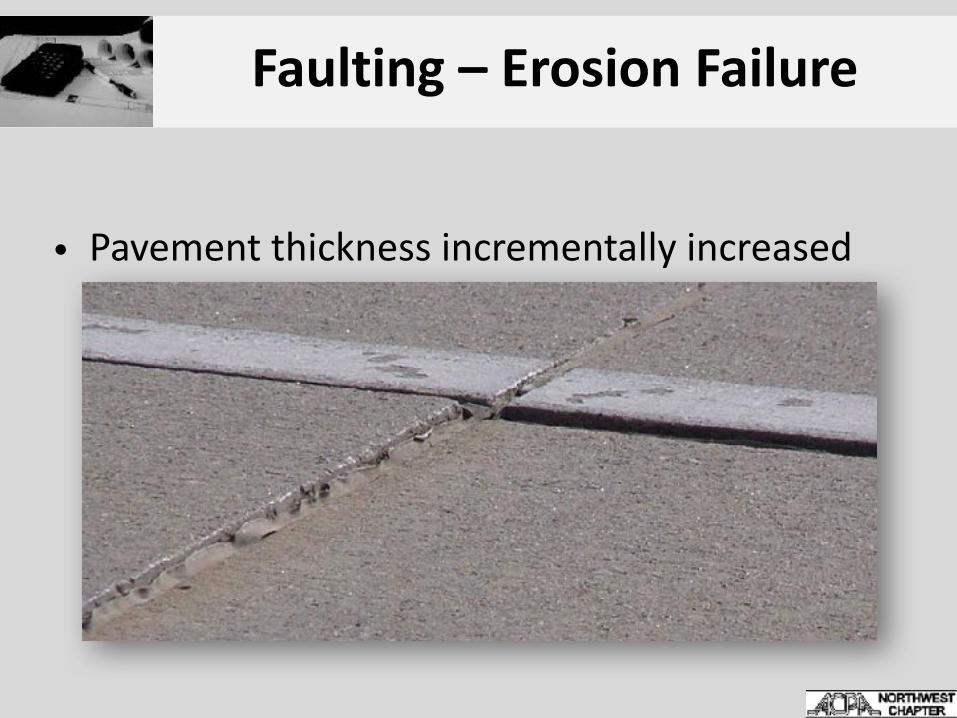
Faulting – Erosion Failure
• Pavement thickness incrementally increased and EDtotal calculated until it reaches 100 percent
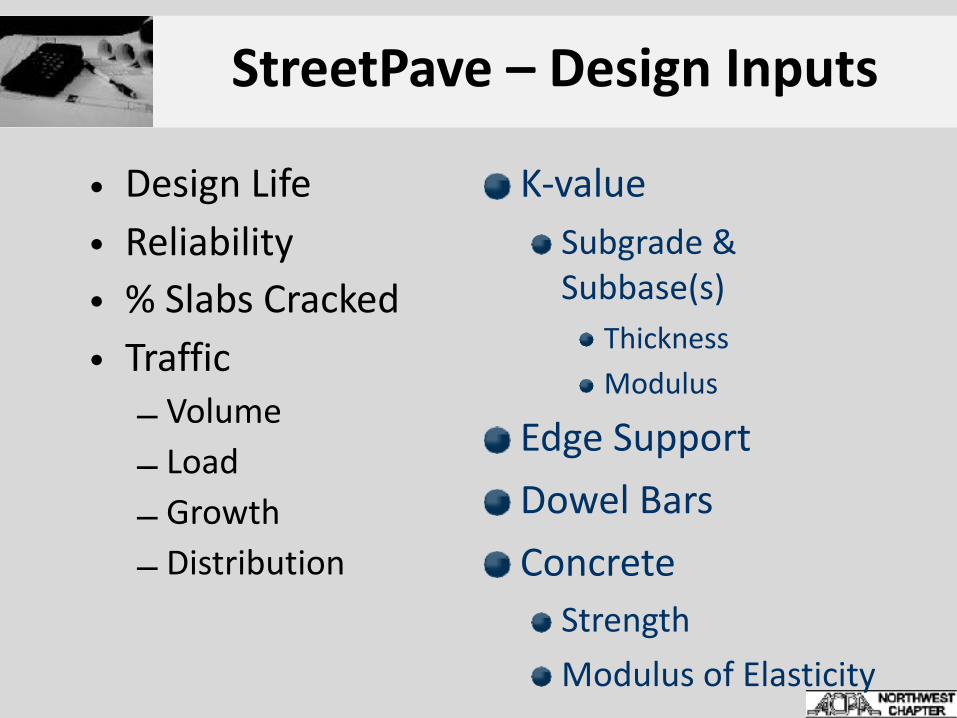
StreetPave – Design Inputs
• Design Life • Reliability • % Slabs Cracked • Traffic
– Volume – Load – Growth – Distribution
K-value Subgrade & Subbase(s)
Thickness Modulus
Edge Support Dowel Bars Concrete
Strength Modulus of Elasticity
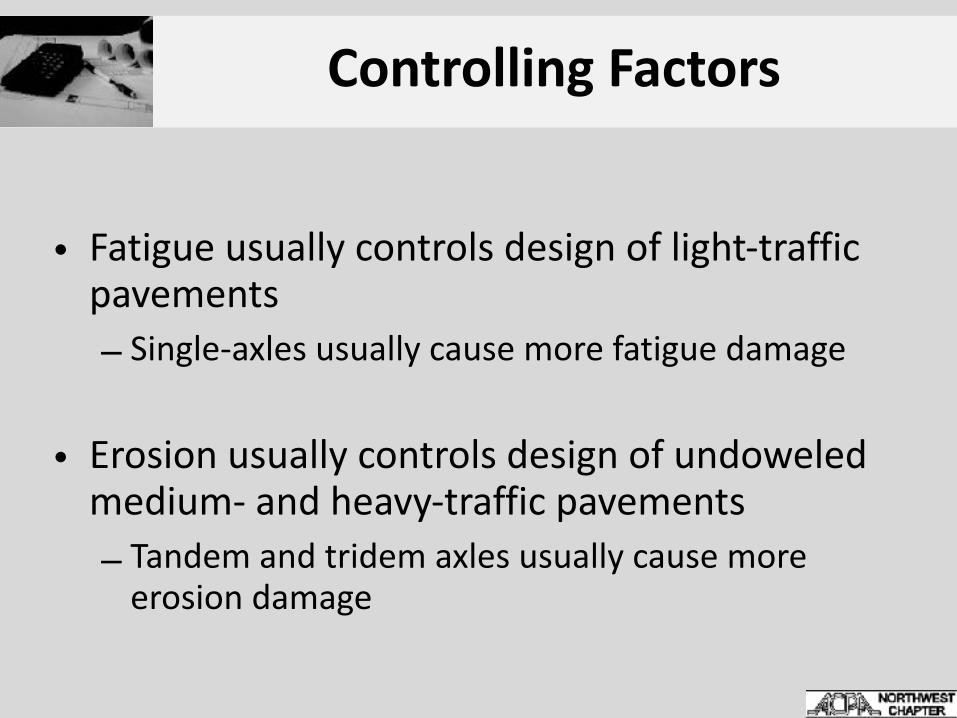
Controlling Factors
• Fatigue usually controls design of light-traffic pavements – Single-axles usually cause more fatigue damage
• Erosion usually controls design of undoweled medium- and heavy-traffic pavements – Tandem and tridem axles usually cause more
erosion damage
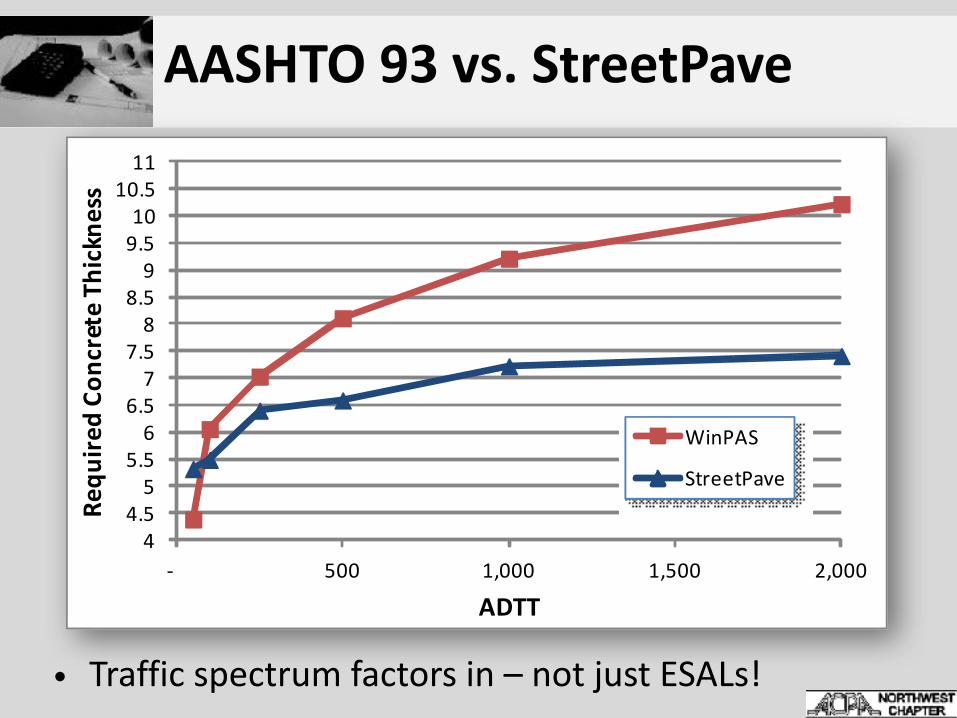
AASHTO 93 vs. StreetPave
• Traffic spectrum factors in – not just ESALs!
44.5
55.5
66.5
77.5
88.5
99.510
10.511
- 500 1,000 1,500 2,000
Requ
ired
Conc
rete
Thi
ckne
ss
ADTT
WinPAS
StreetPave
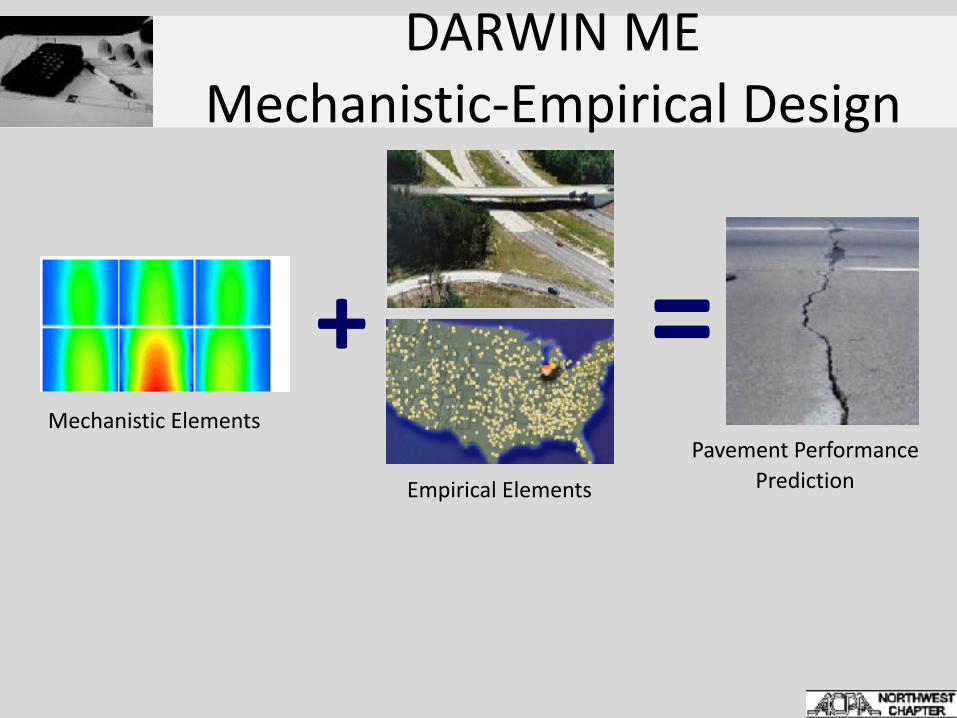
DARWIN ME Mechanistic-Empirical Design
=+Mechanistic Elements
Empirical Elements
Pavement Performance Prediction
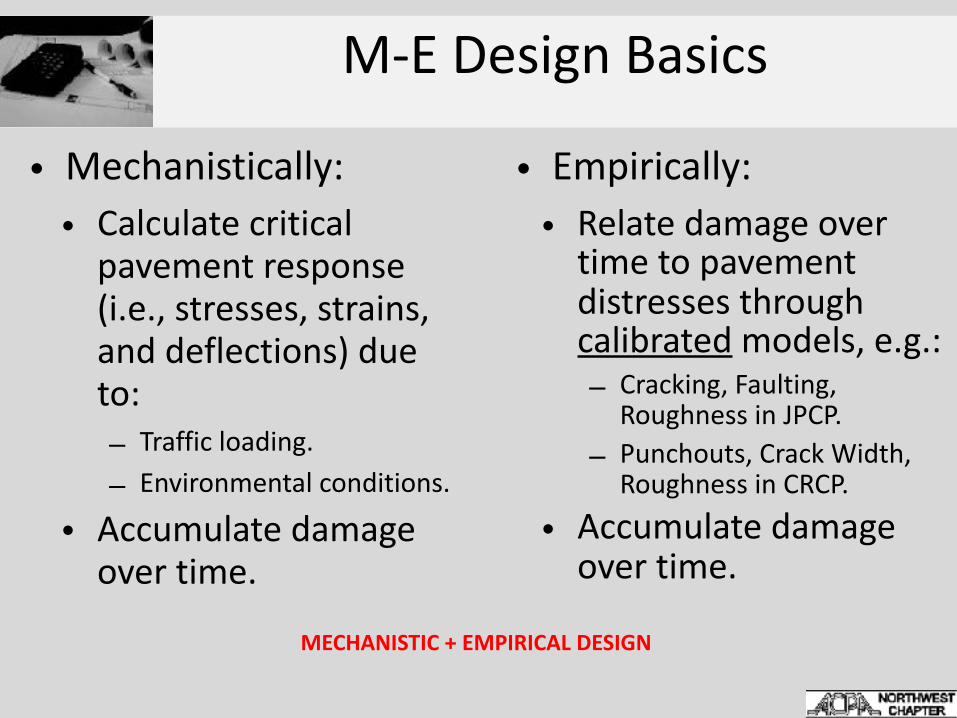
M-E Design Basics
• Calculate critical pavement response (i.e., stresses, strains, and deflections) due to: – Traffic loading. – Environmental conditions.
• Accumulate damage over time.
• Mechanistically: • Empirically:• Relate damage over
time to pavement distresses through calibrated models, e.g.: – Cracking, Faulting,
Roughness in JPCP. – Punchouts, Crack Width,
Roughness in CRCP. • Accumulate damage
over time.
MECHANISTIC + EMPIRICAL DESIGN
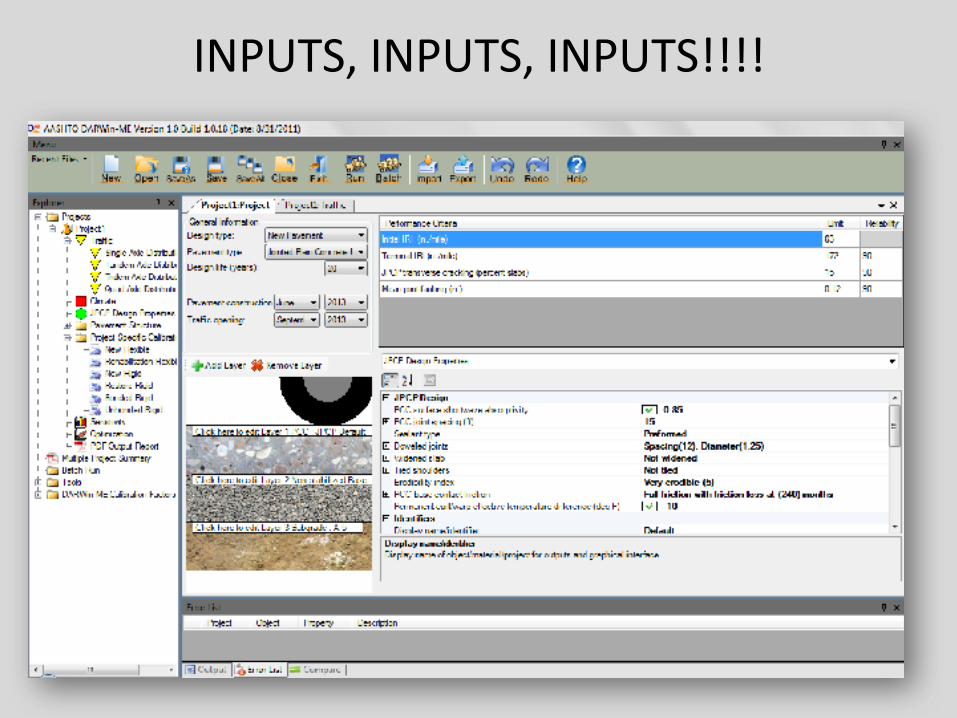
INPUTS, INPUTS, INPUTS!!!!
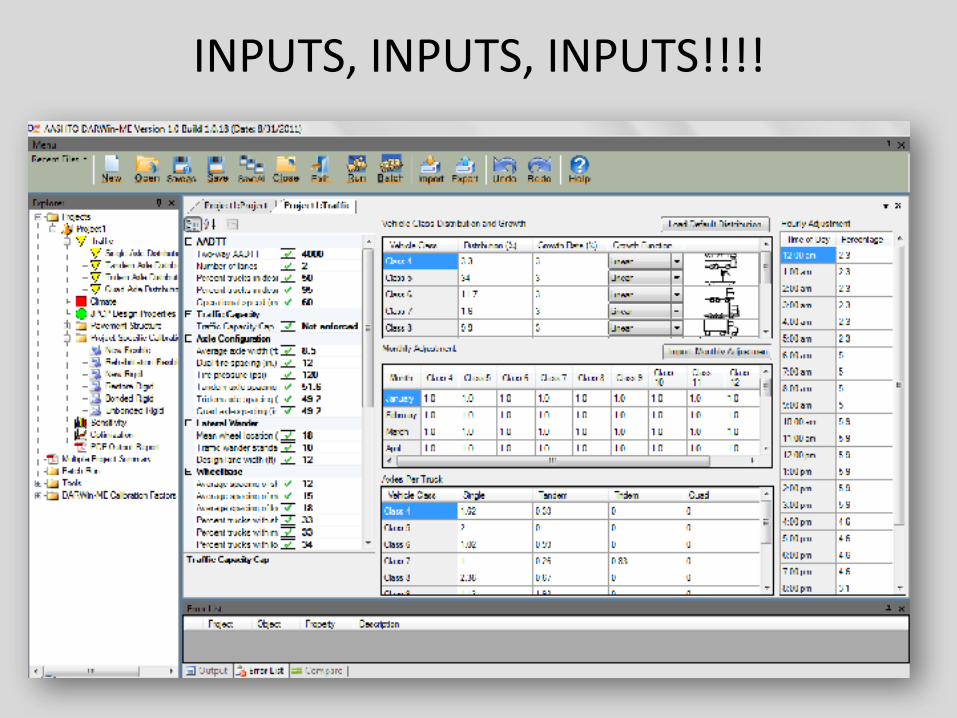
INPUTS, INPUTS, INPUTS!!!!
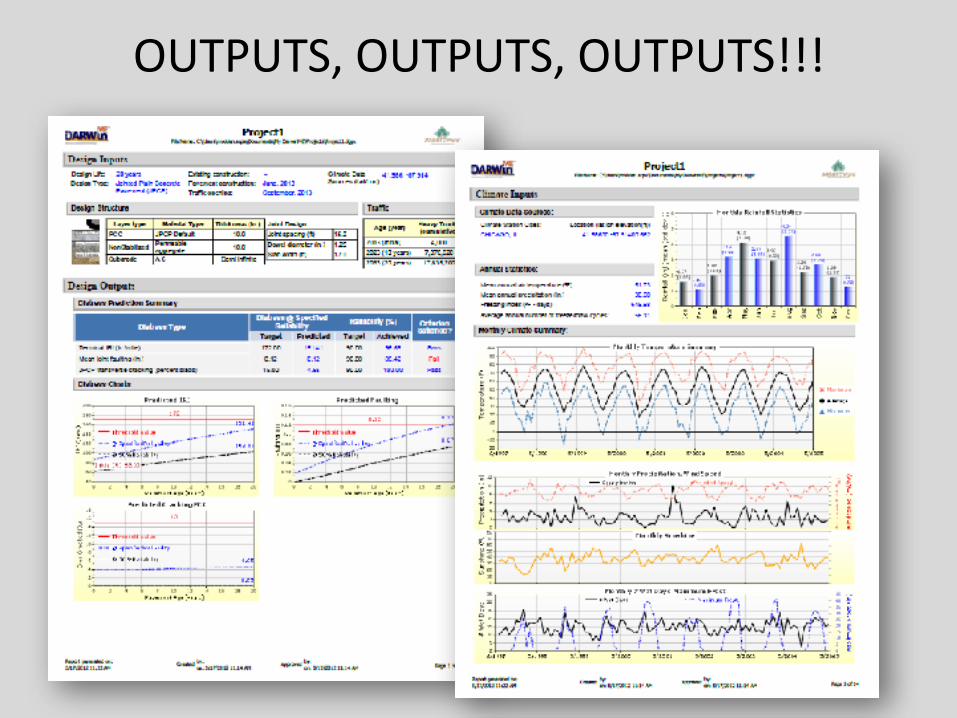
OUTPUTS, OUTPUTS, OUTPUTS!!!
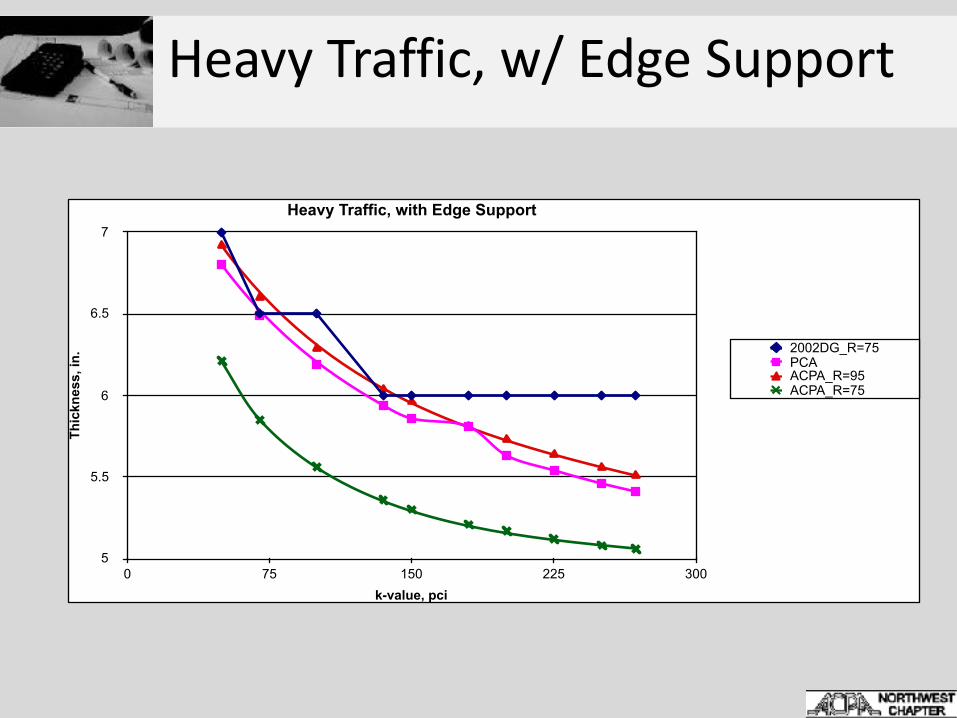
Heavy Traffic, w/ Edge Support
Heavy Traffic, with Edge Support
Thic
knes
s, in
.
5
5.5
6
6.5
7
k-value, pci0 75 150 225 300
2002DG_R=75PCAACPA_R=95ACPA_R=75
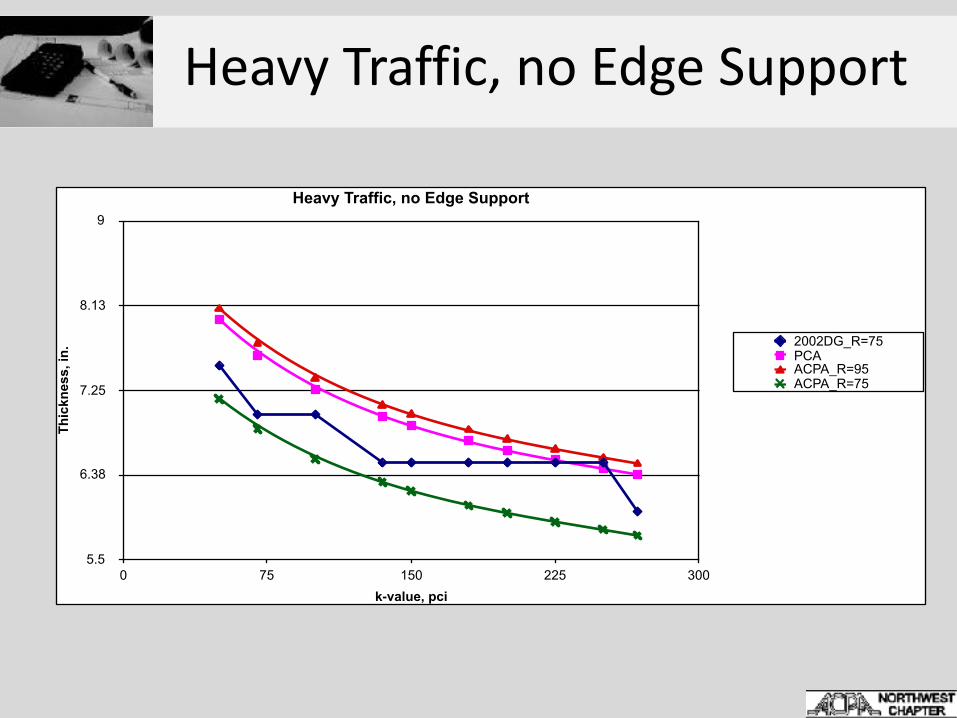
Heavy Traffic, no Edge Support
Heavy Traffic, no Edge Support
Thic
knes
s, in
.
5.5
6.38
7.25
8.13
9
k-value, pci0 75 150 225 300
2002DG_R=75PCAACPA_R=95ACPA_R=75
Summary / Conclusions
• At heavy traffic levels: – ME Design Guide is still fairly close to PCA and
ACPA at 95% reliability – ME Design Guide not as sensitive to edge
support condition
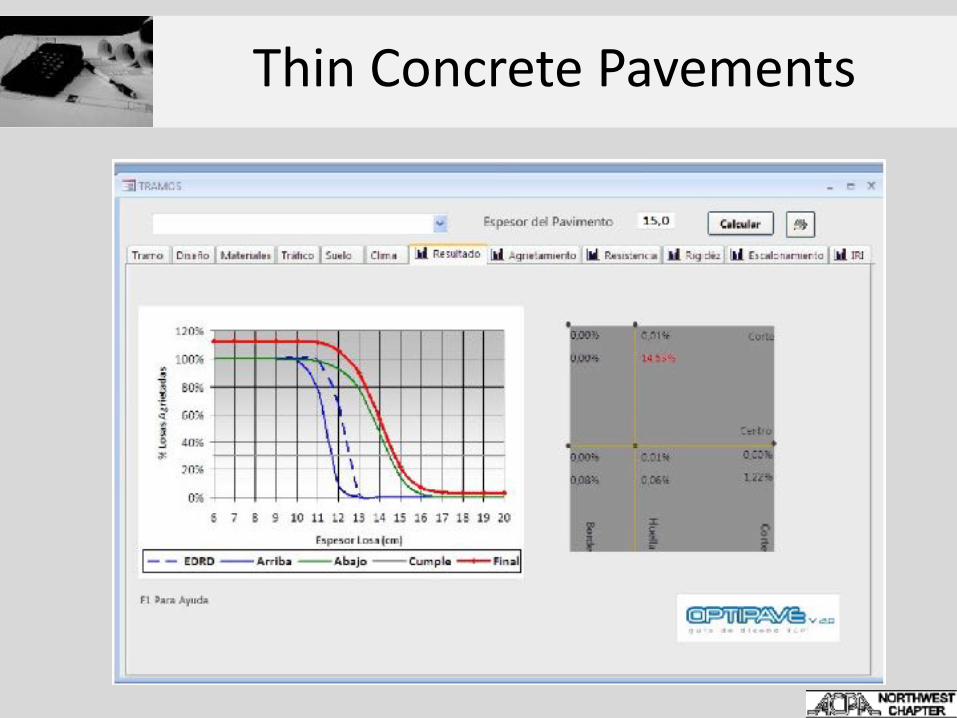
Thin Concrete Pavements
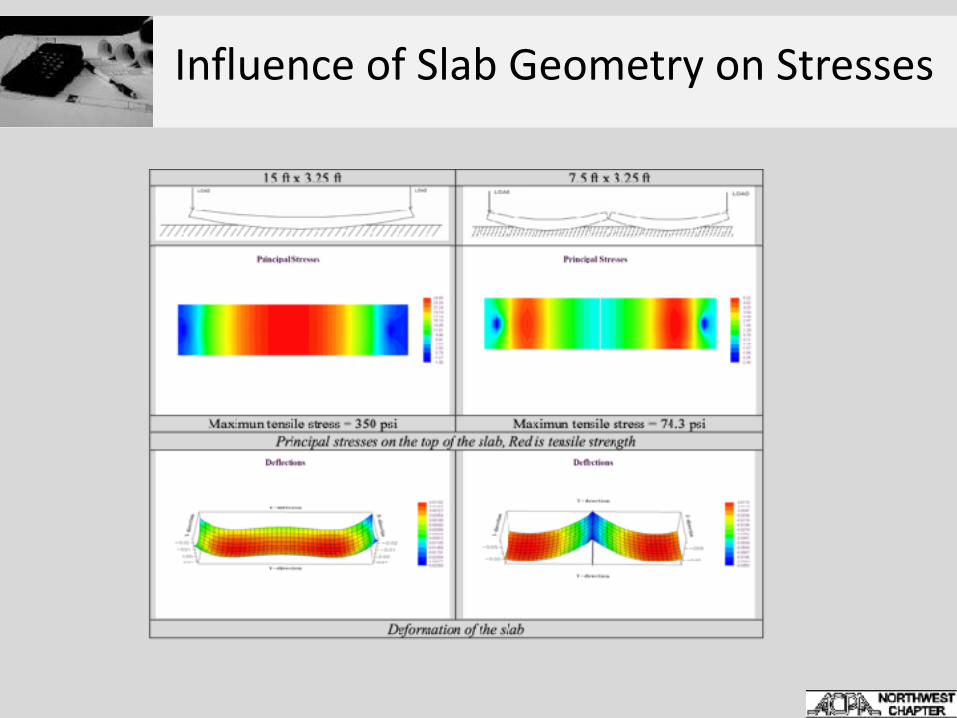
Influence of Slab Geometry on Stresses
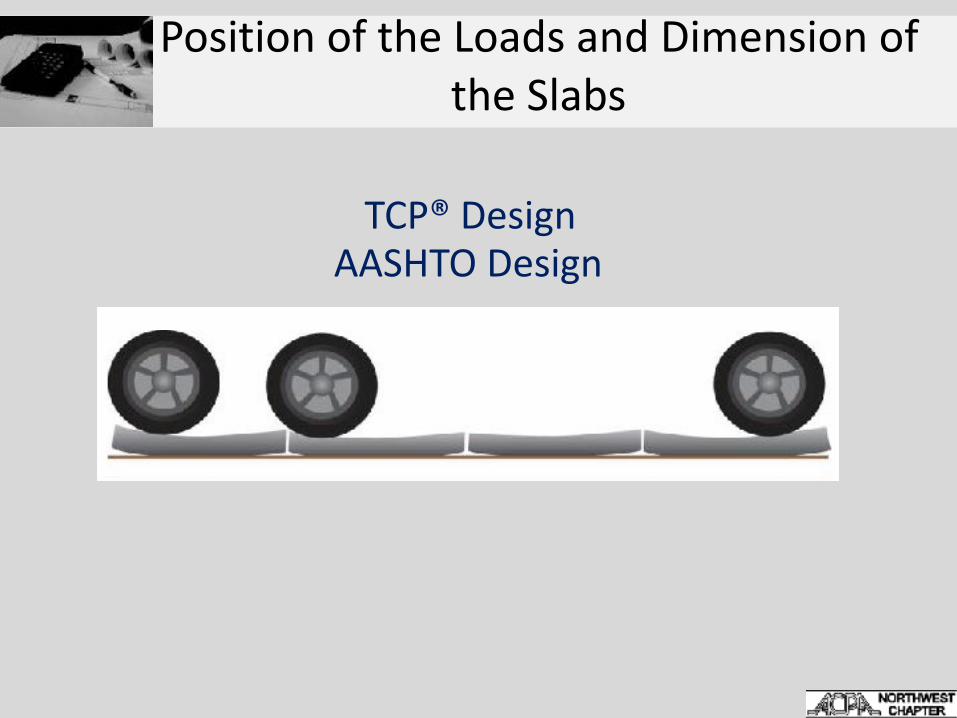
Position of the Loads and Dimension of the Slabs
AASHTO DesignTCP® Design
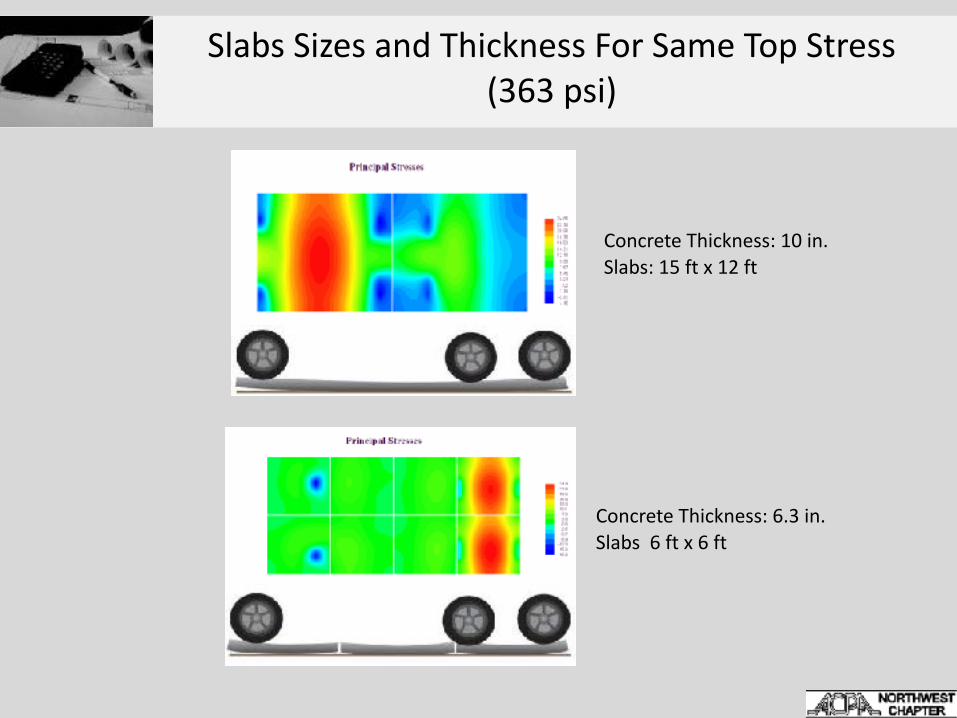
Slabs Sizes and Thickness For Same Top Stress (363 psi)
Concrete Thickness: 10 in.
Slabs: 15 ft x 12 ft
Concrete Thickness: 6.3 in. Slabs 6 ft x 6 ft
Characteristics of TCP Design
• Small slabs (1.4 to 2.4) meters long (5ft-8ft) • Less curl/warp; smaller crack width
• Granular base (fines < 8%) 15 cm thick • Less pumping/faulting potential
• Normal or fiber reinforced concrete • Geotextile between the subgrade and base, if needed • Thin joint cut (<2.5 mm wide) • No joints sealing • Optimized dowel bar system or no dowels • Lateral confinement with curb, shoulder , vertical steel
pins or FRC • Widened outer lane
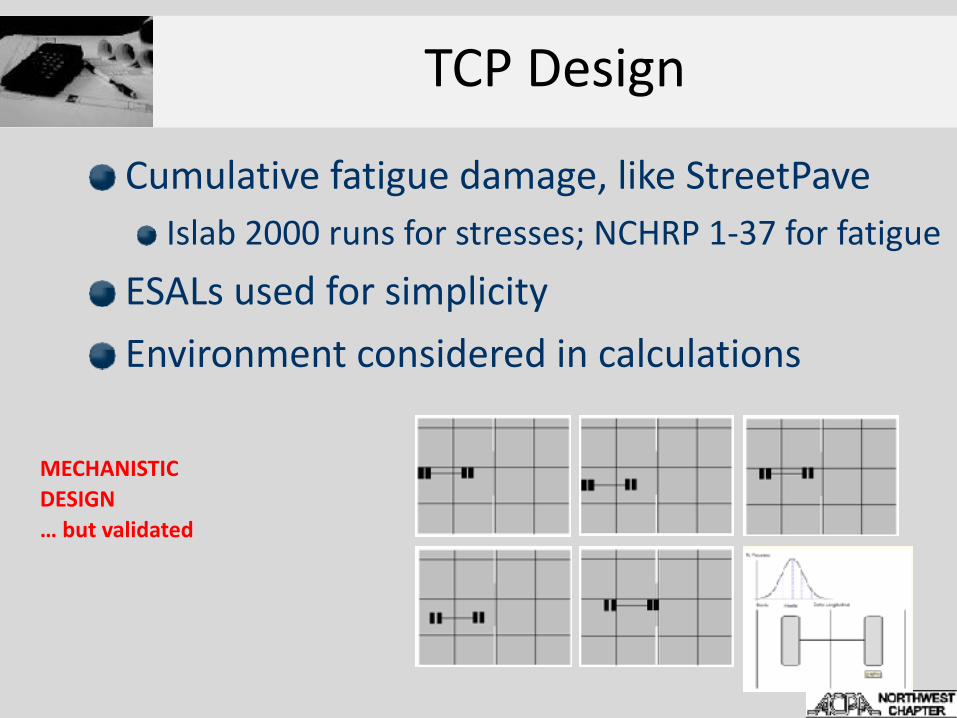
TCP Design
Cumulative fatigue damage, like StreetPave Islab 2000 runs for stresses; NCHRP 1-37 for fatigue
ESALs used for simplicity Environment considered in calculations
MECHANISTIC DESIGN … but validated

Non-Standard Loads
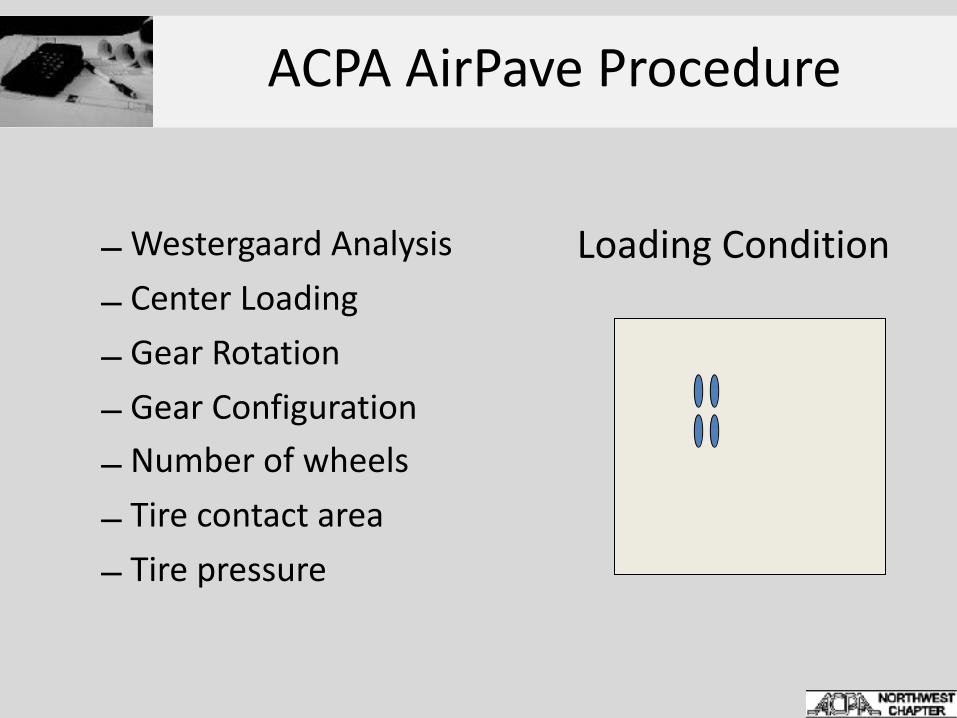
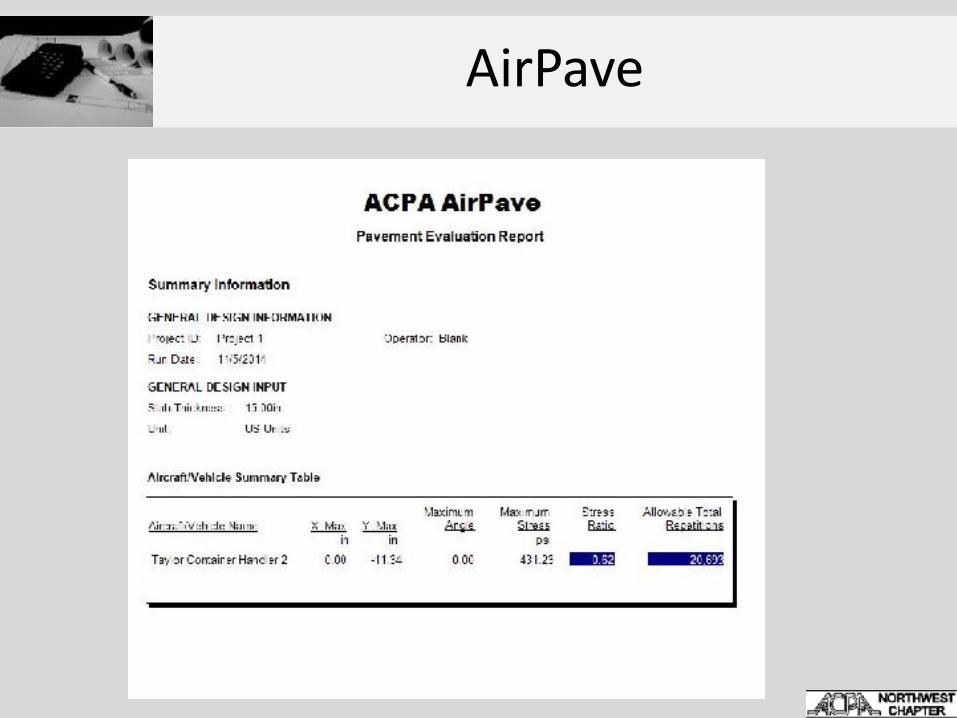
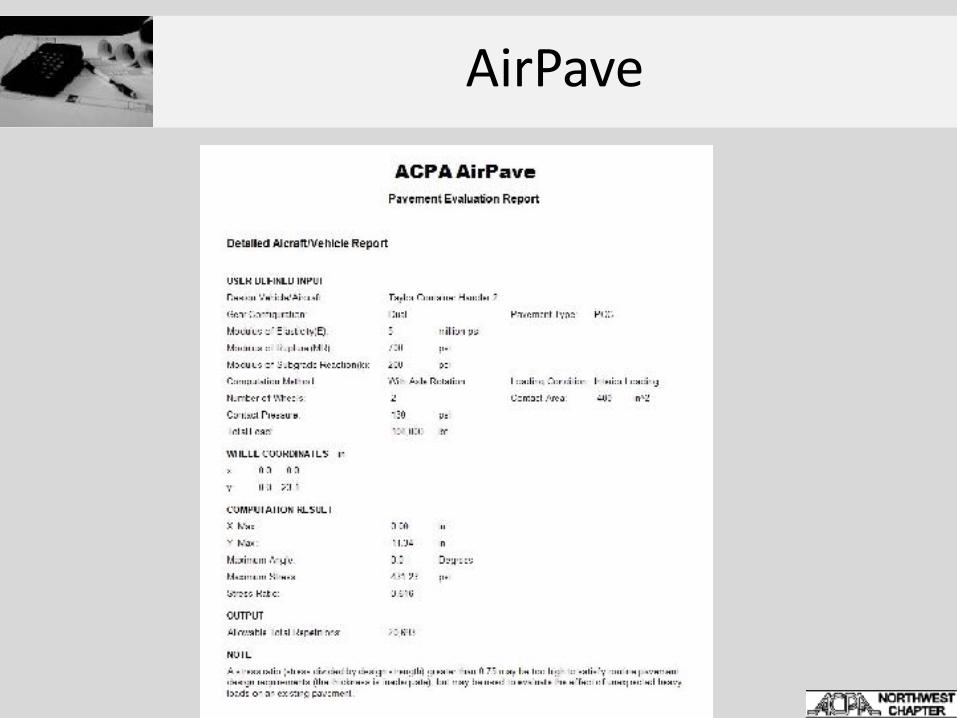
ACPA AirPave Procedure
– Westergaard Analysis – Center Loading – Gear Rotation – Gear Configuration – Number of wheels – Tire contact area – Tire pressure
Loading Condition
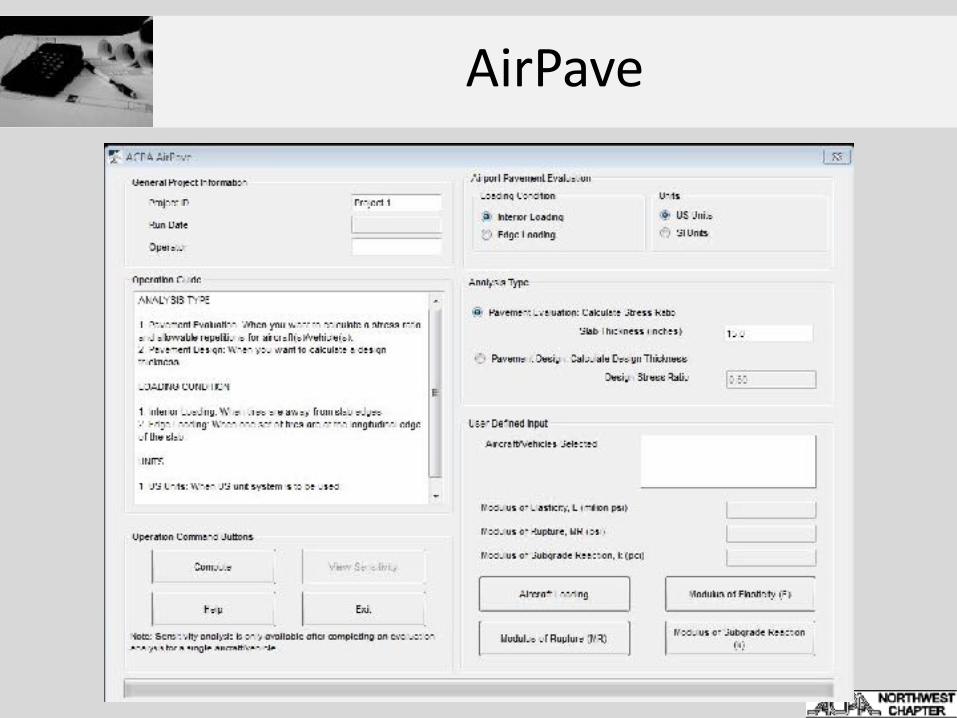
AirPave
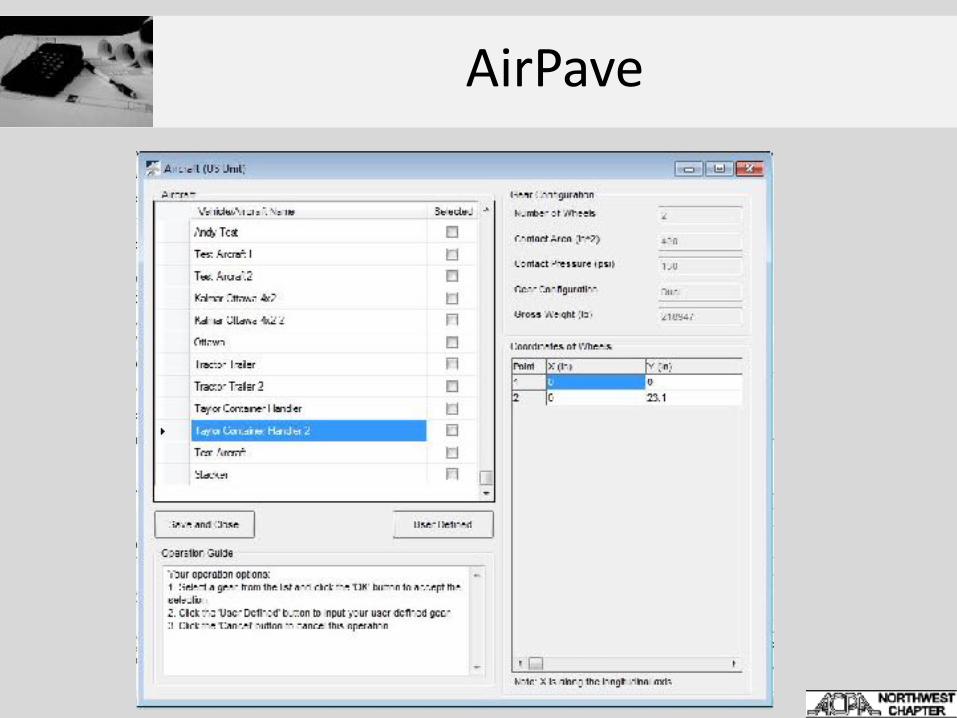
AirPave
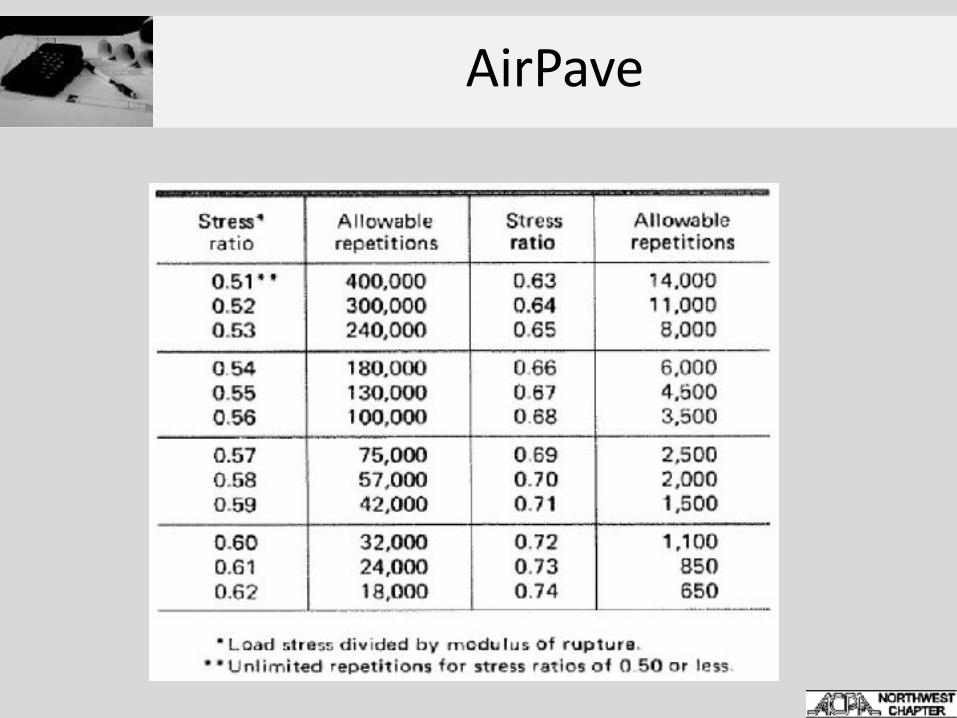
AirPave
AirPave
AirPave
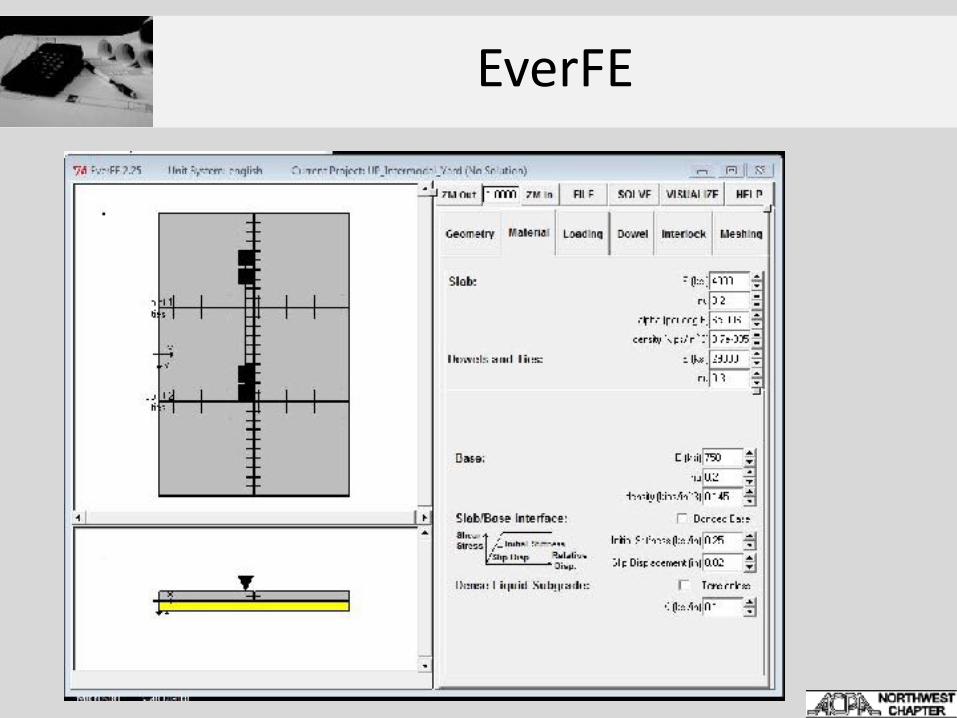
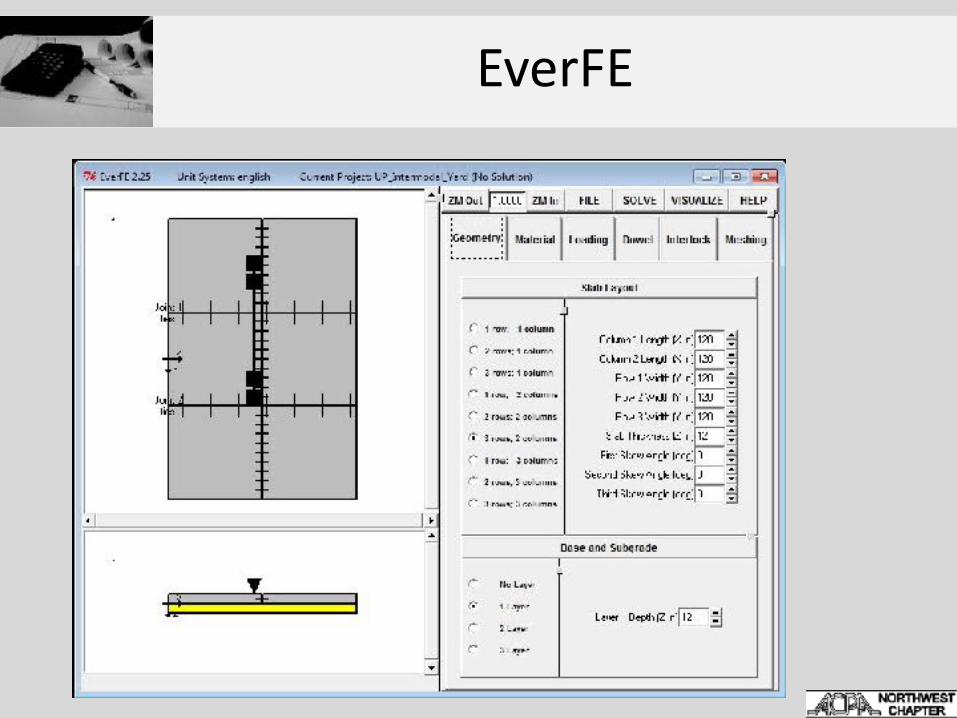
EverFE
EverFE
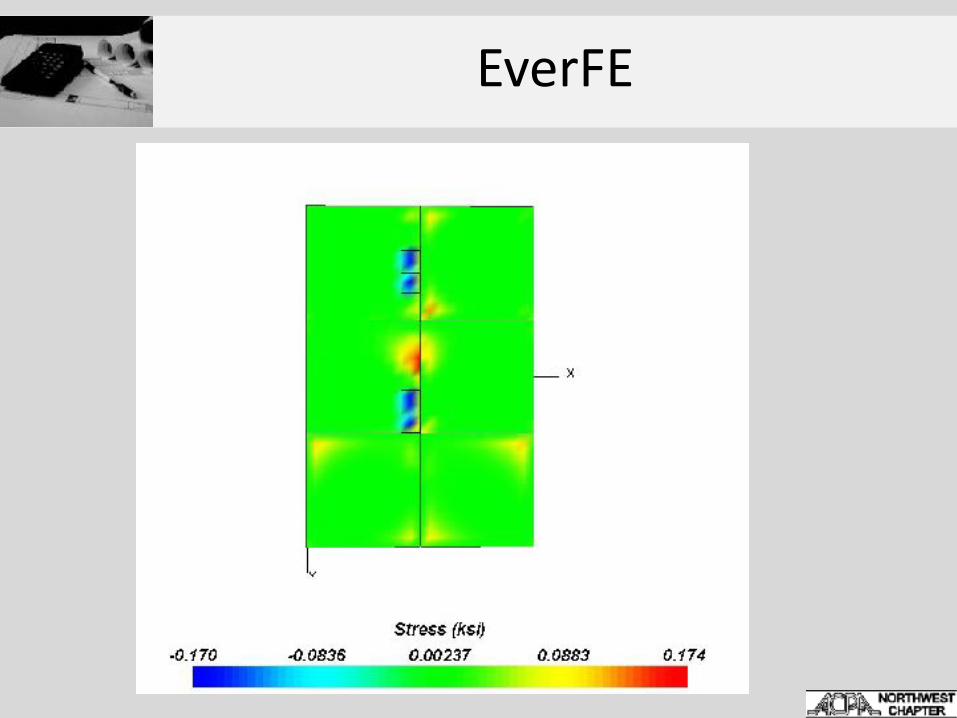
EverFE
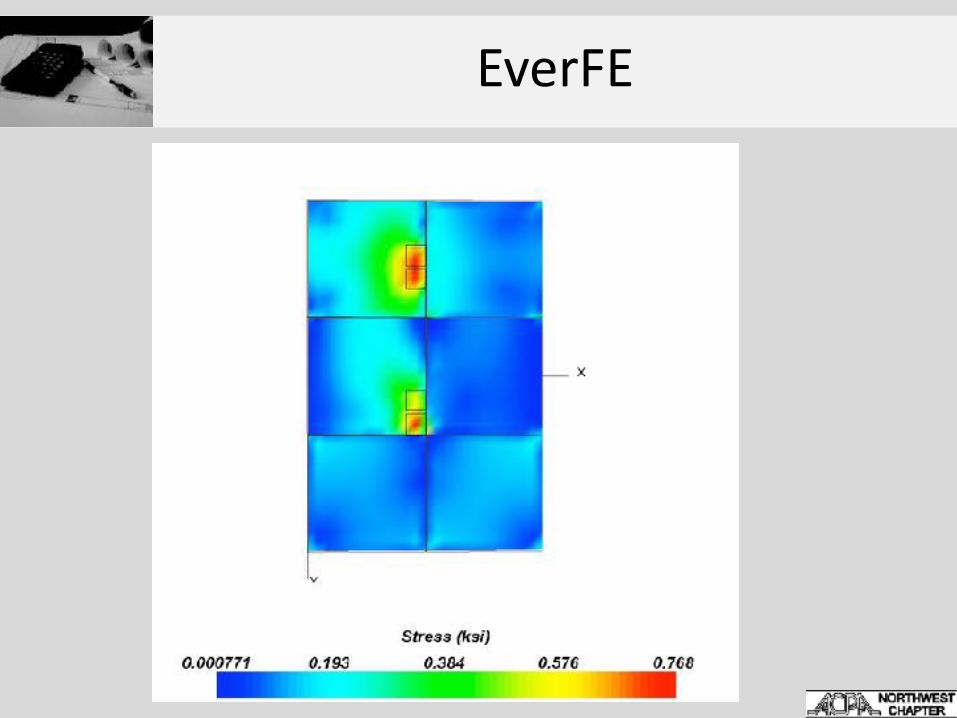
EverFE
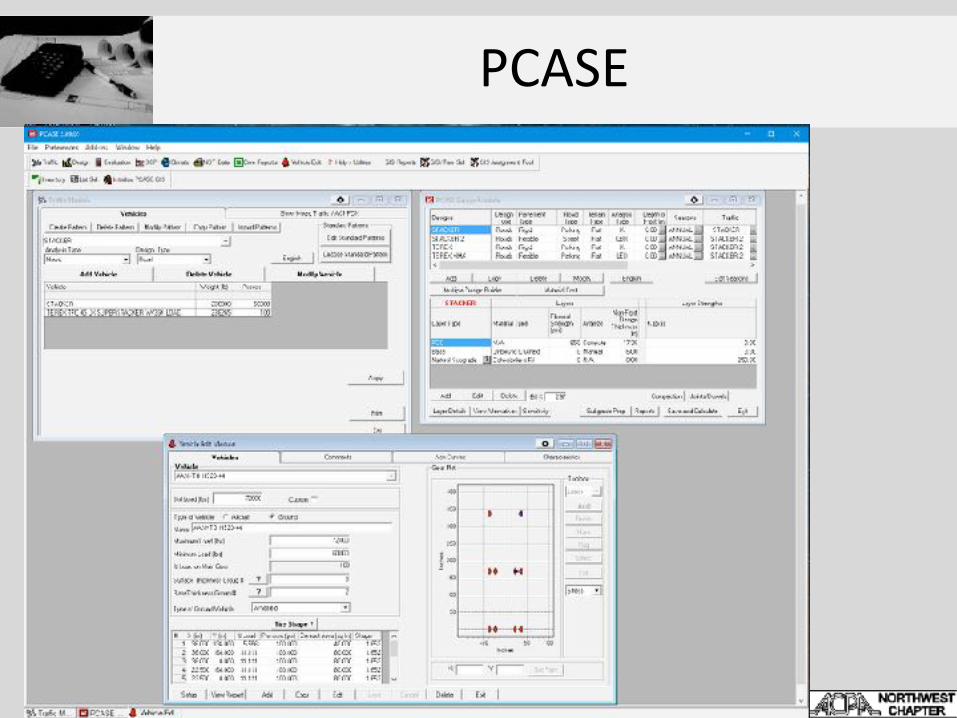
PCASE
Overlay Experiences
• Spokane, WA – 3 sections on I-90, 3”, 4”, 5” – Constructed in 2004 – Eastbound AADT 40,000 – Excellent performance in 4” and 5” sections – Reconstructed in 2011
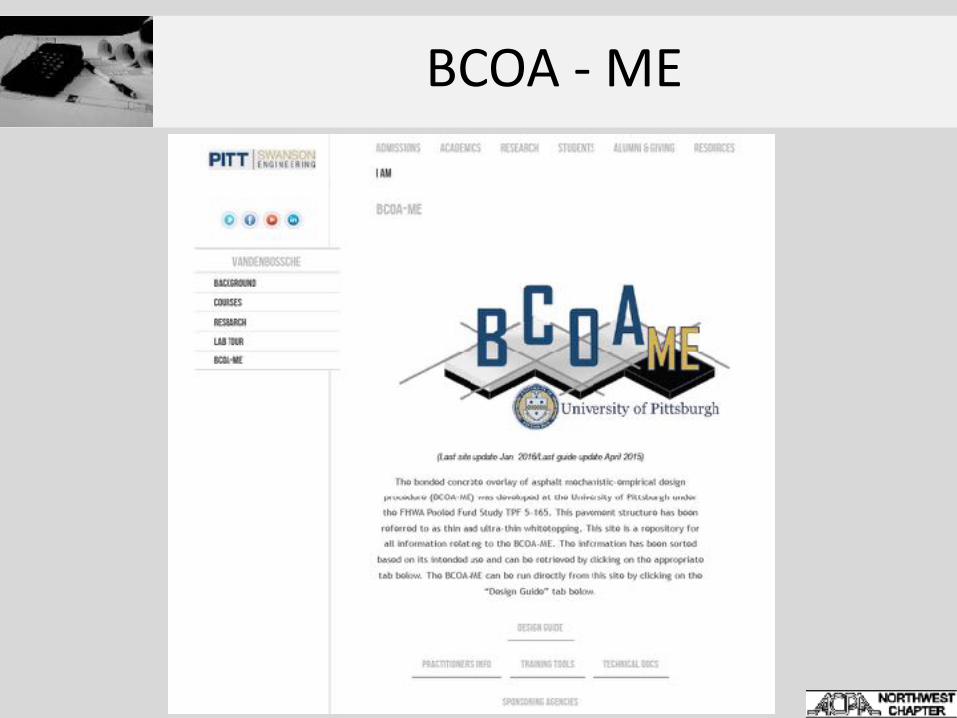
BCOA - ME
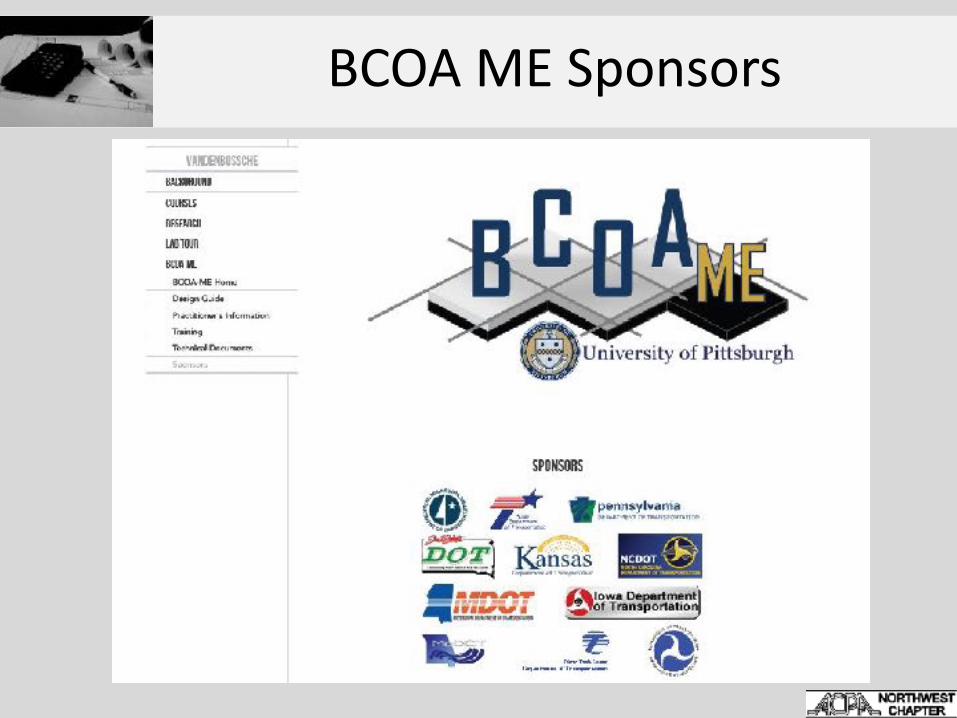
BCOA ME Sponsors

BCOA ME Main Screen
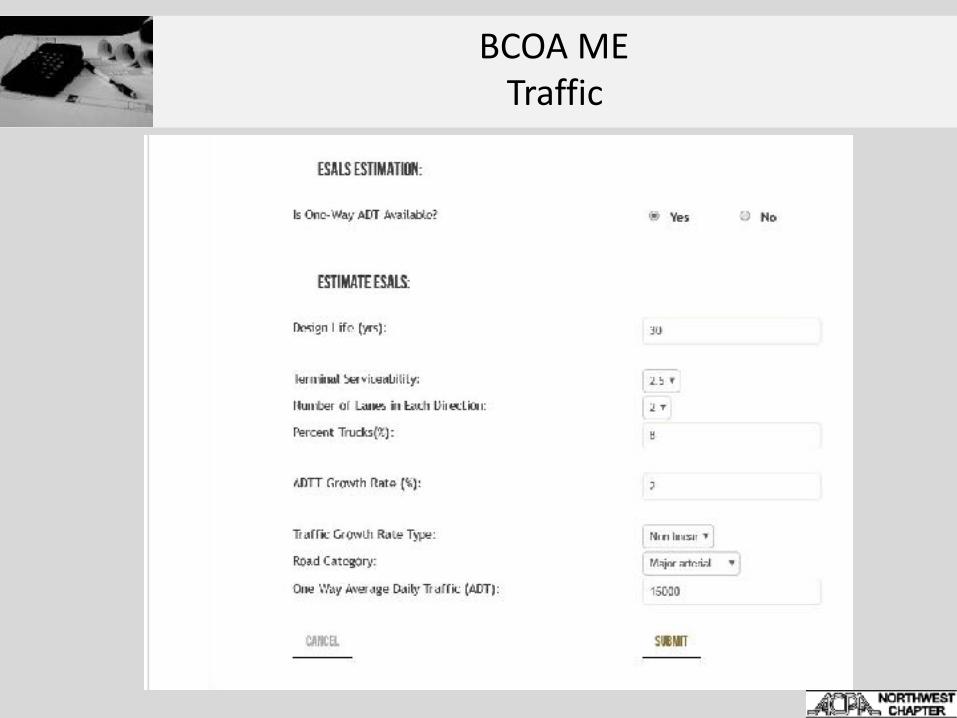
BCOA ME Traffic
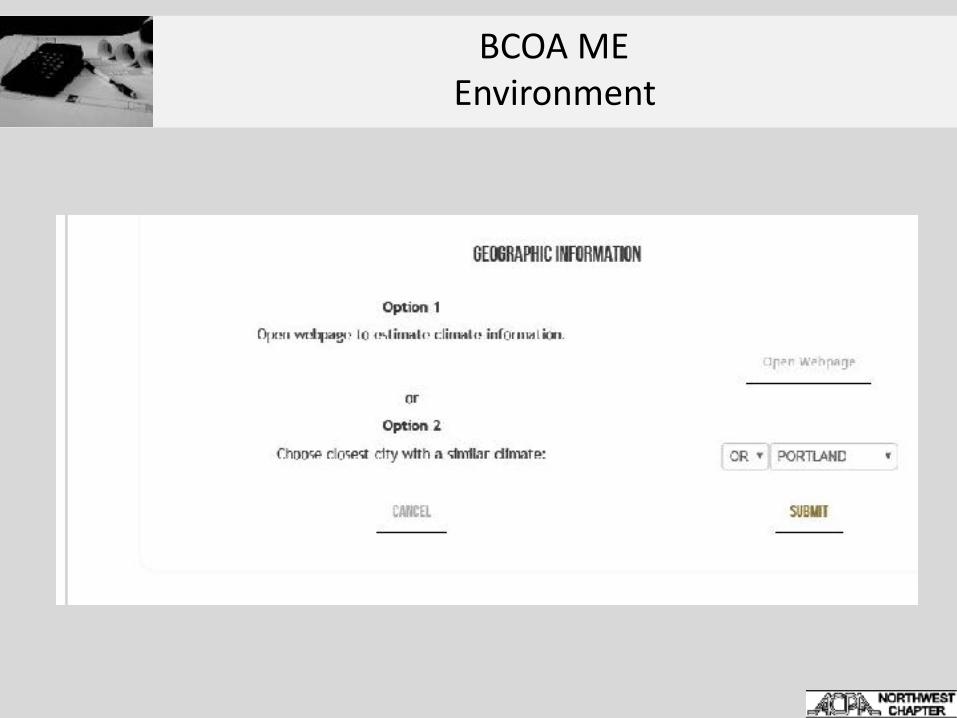
BCOA ME Environment
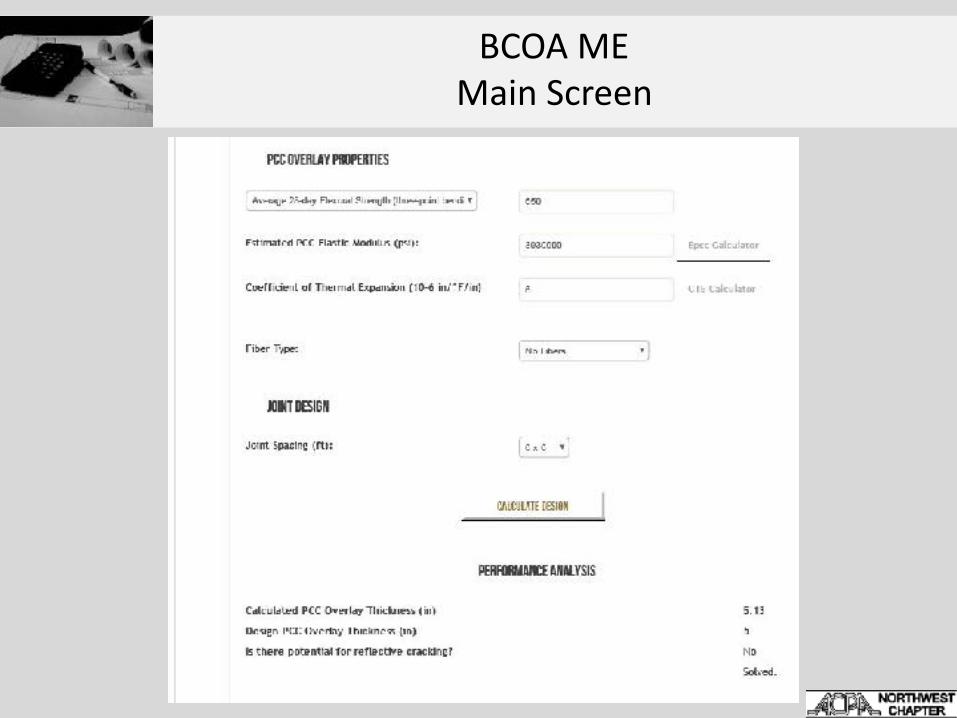
BCOA ME Main Screen
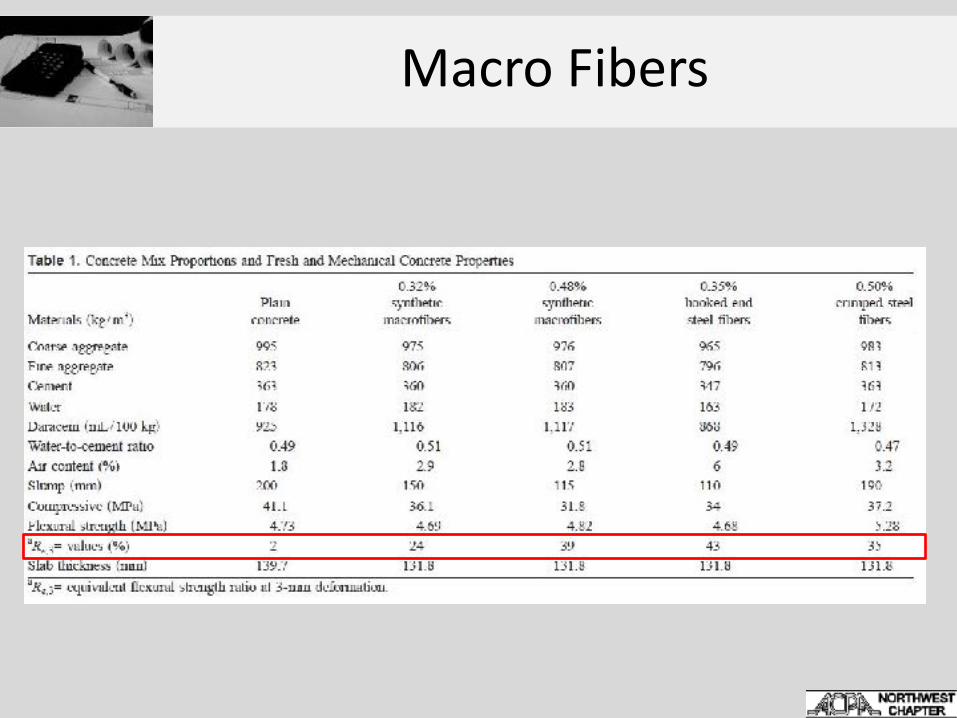
Macro Fibers
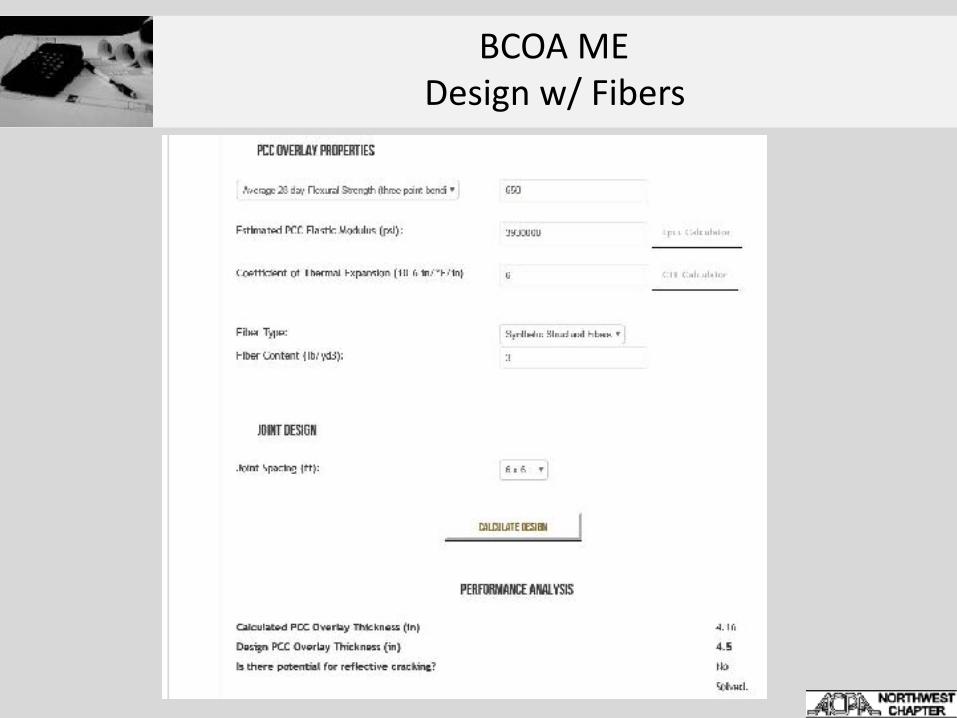
BCOA ME Design w/ Fibers
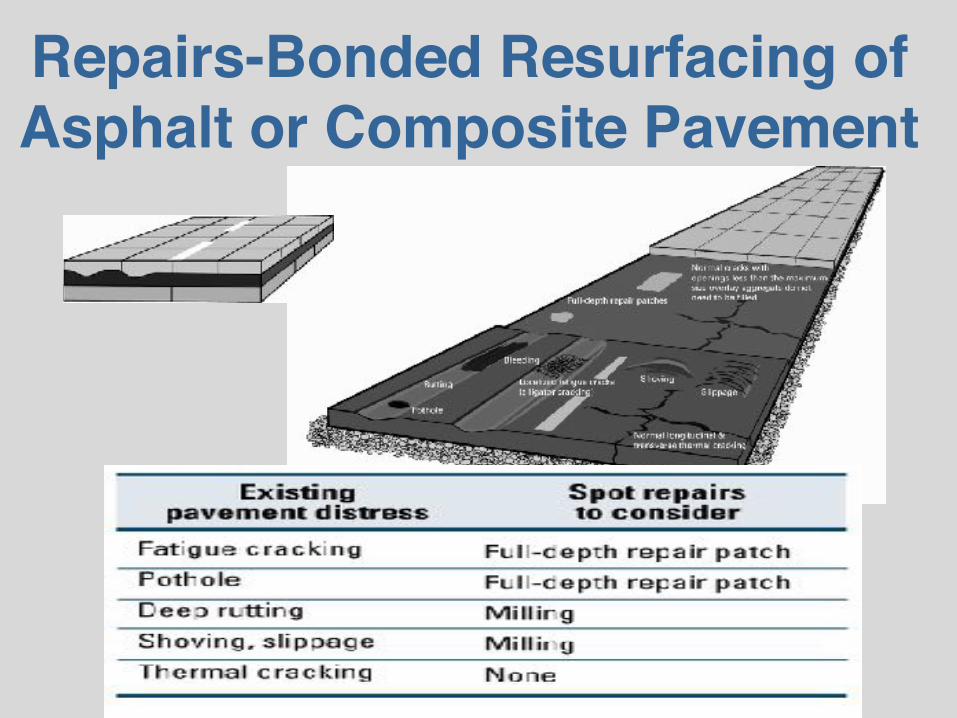
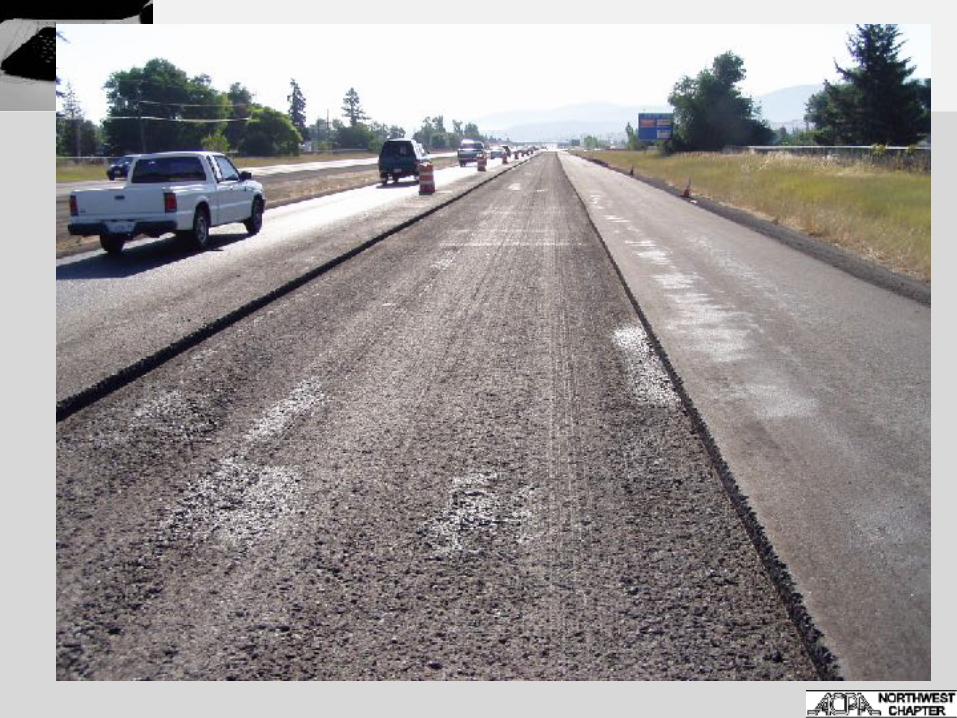
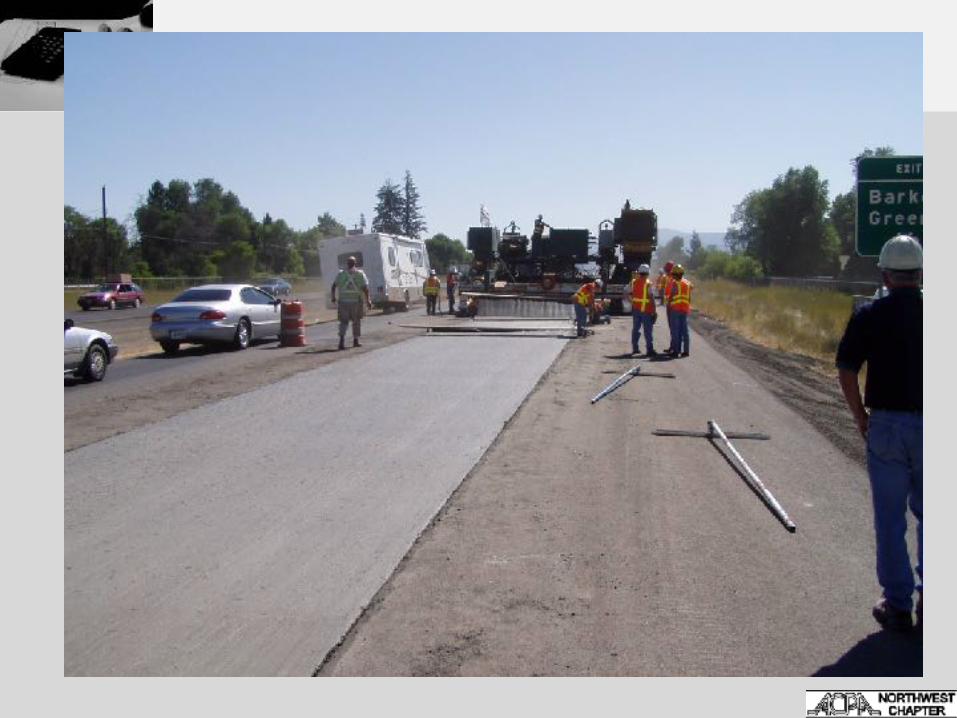
Repairs-Bonded Resurfacing of Asphalt or Composite Pavement
Milling: Bonded Resurfacingof Asphalt or Composite Pavements
The three main objectives of milling:
1. to remove significant surface distortions that contain soft asphalt material, resulting in an inadequate bonding surface
2. to reduce high spots to help ensure minimum resurfacing depth and reduce the quantity of concrete needed to fill low spots; and
3. to roughen a portion of the surface to enhance bond development between the new concrete overlay and the existing asphalt. (don’t leave a thin lift)
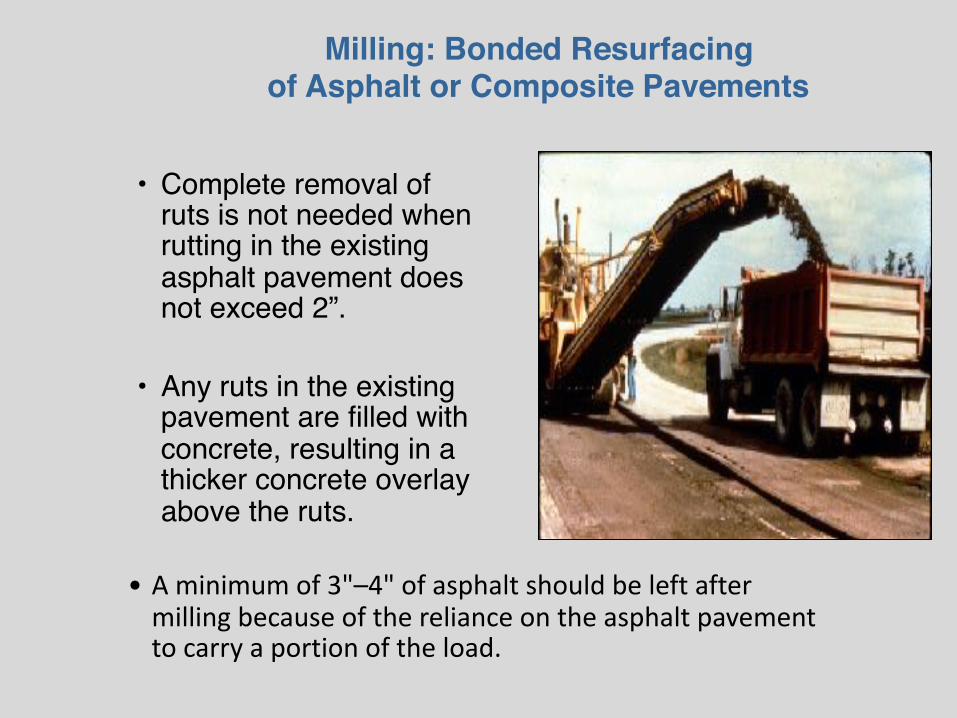
Milling: Bonded Resurfacingof Asphalt or Composite Pavements
• Complete removal of ruts is not needed when rutting in the existing asphalt pavement does not exceed 2”.
• Any ruts in the existing pavement are filled with concrete, resulting in a thicker concrete overlay above the ruts.
• A minimum of 3"–4" of asphalt should be left after milling because of the reliance on the asphalt pavement to carry a portion of the load.
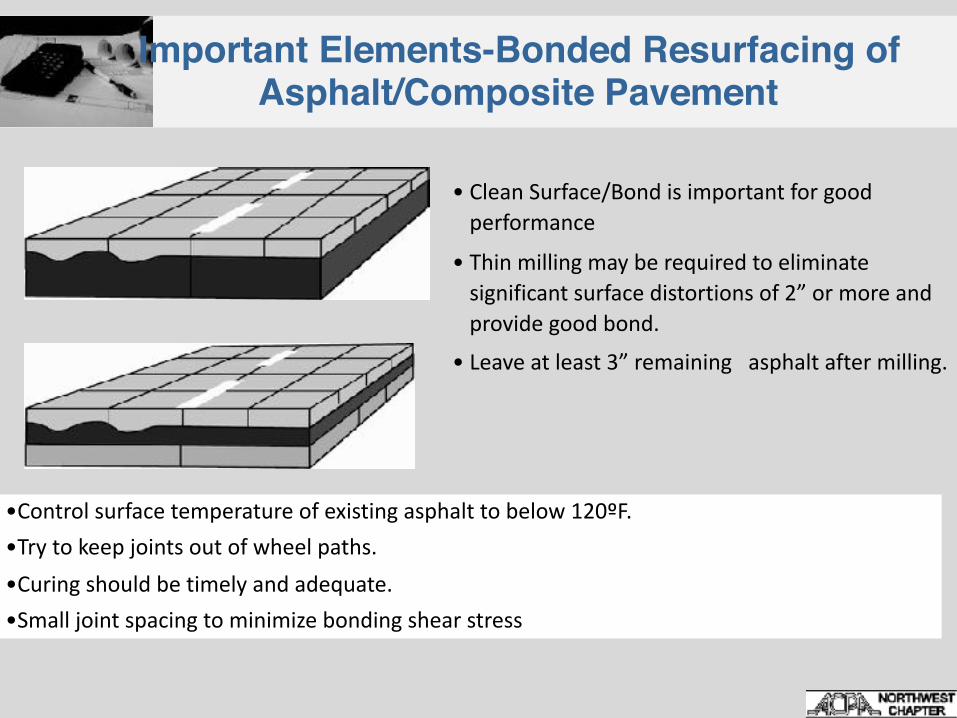
Important Elements-Bonded Resurfacing of Asphalt/Composite Pavement
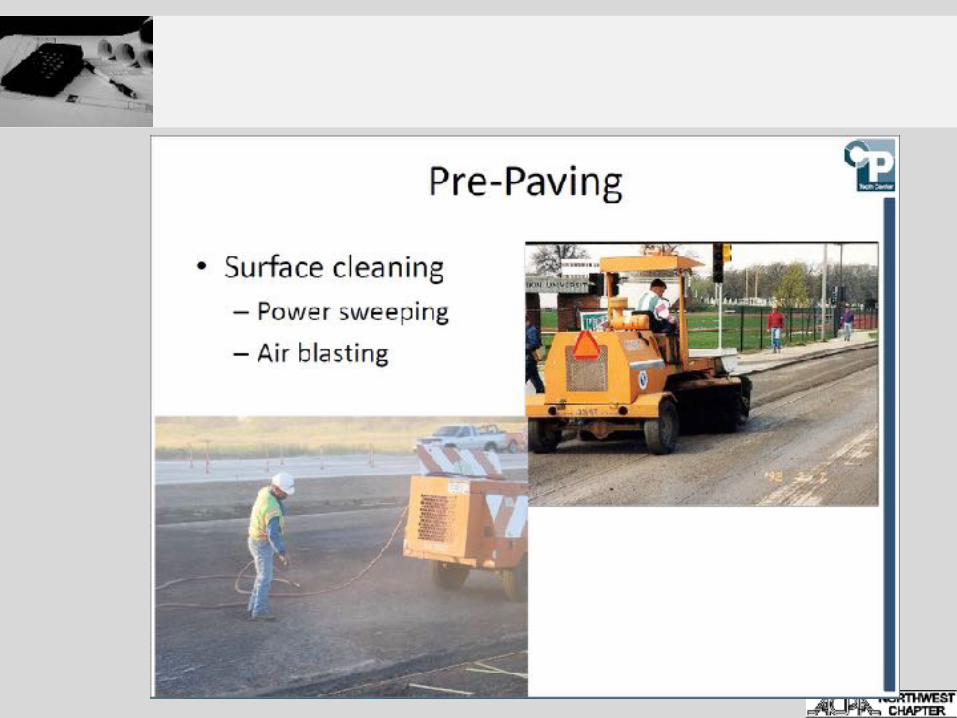
• Clean Surface/Bond is important for good performance
• Thin milling may be required to eliminate significant surface distortions of 2” or more and provide good bond.
• Leave at least 3” remaining asphalt after milling.
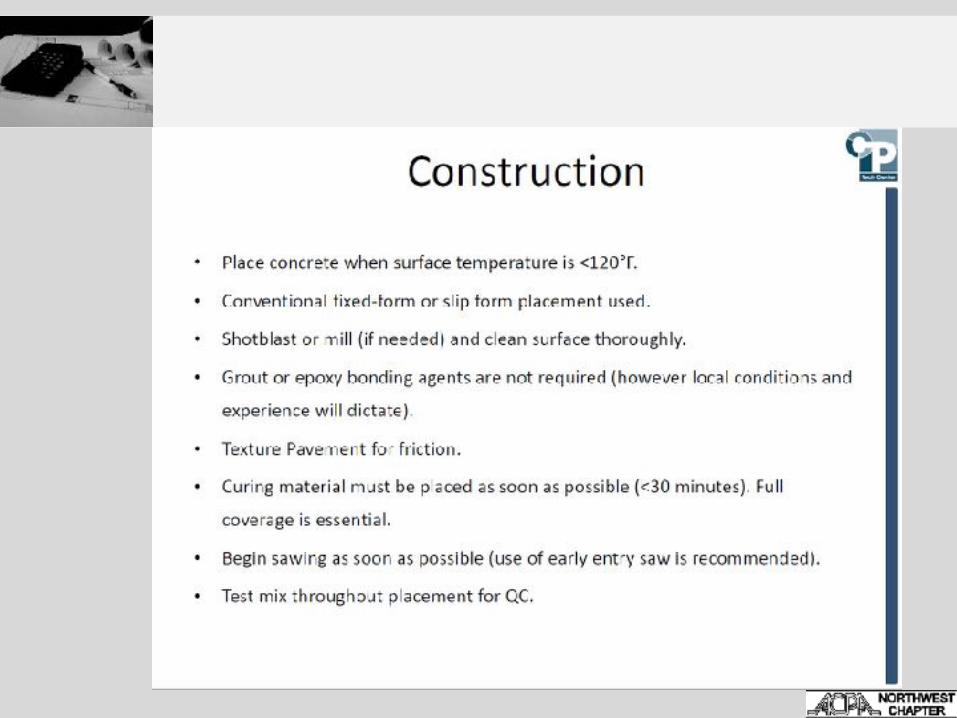
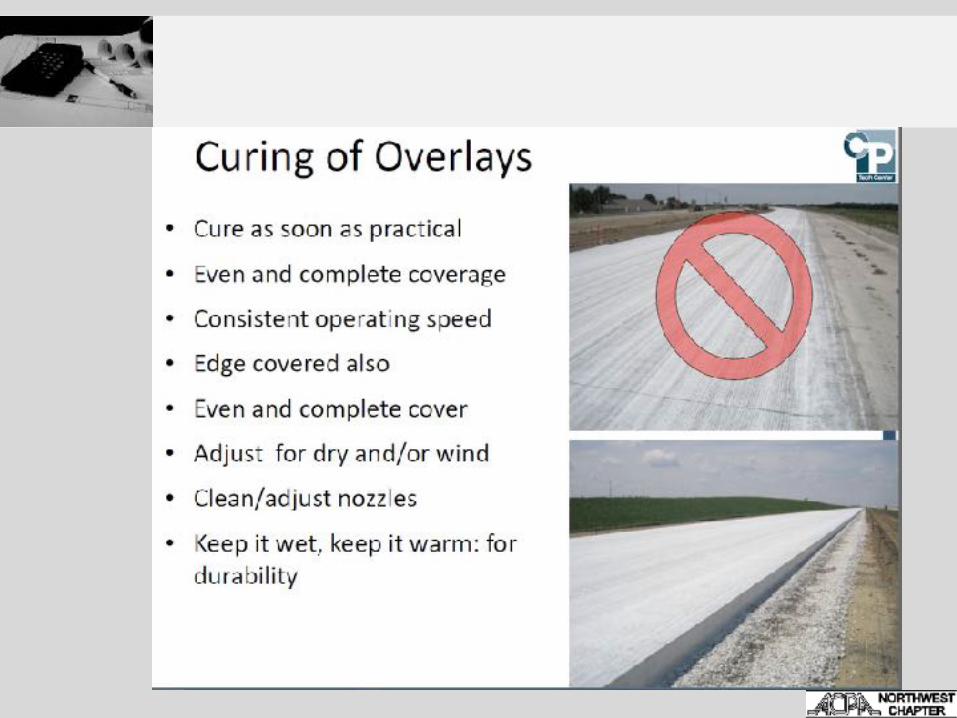
•Control surface temperature of existing asphalt to below 120ºF. •Try to keep joints out of wheel paths. •Curing should be timely and adequate. •Small joint spacing to minimize bonding shear stress
Overlay Experiences
• Kalispell – 5” on ?”-5” of HMA – 6’ joint spacing – 18,000 ADT in 2000 – 30% Trucks – Built in 2000 – Performing very well
Overlay Experiences
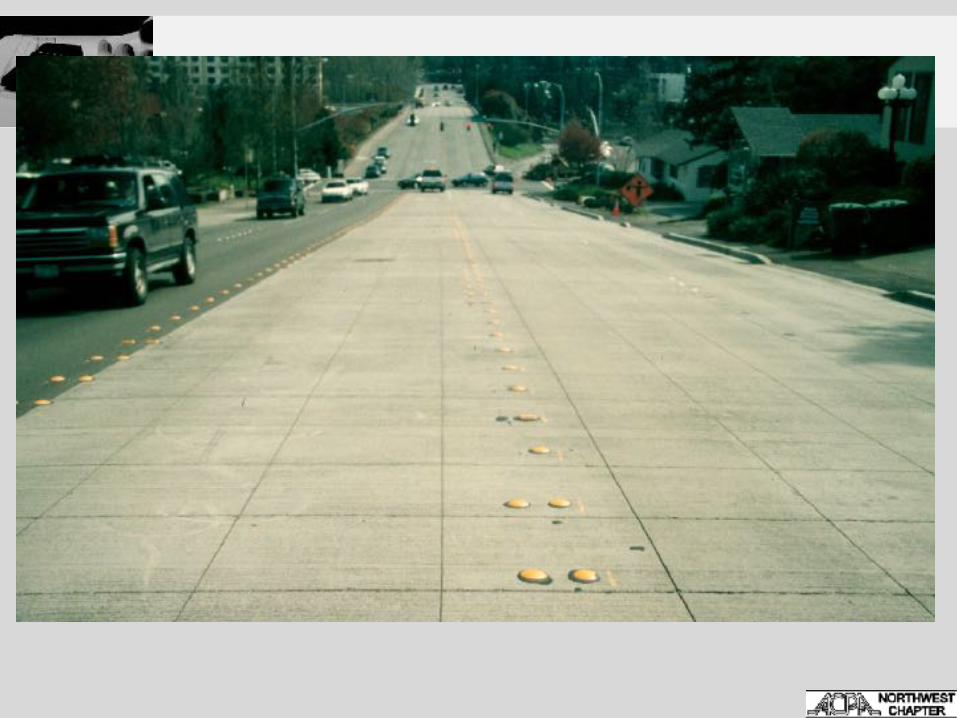
• Bellevue – 3” PCC on 3” AC – Built 1998 – Still in service – Cracking in edge panels due to lack of
support. Edge panels have been replaced.
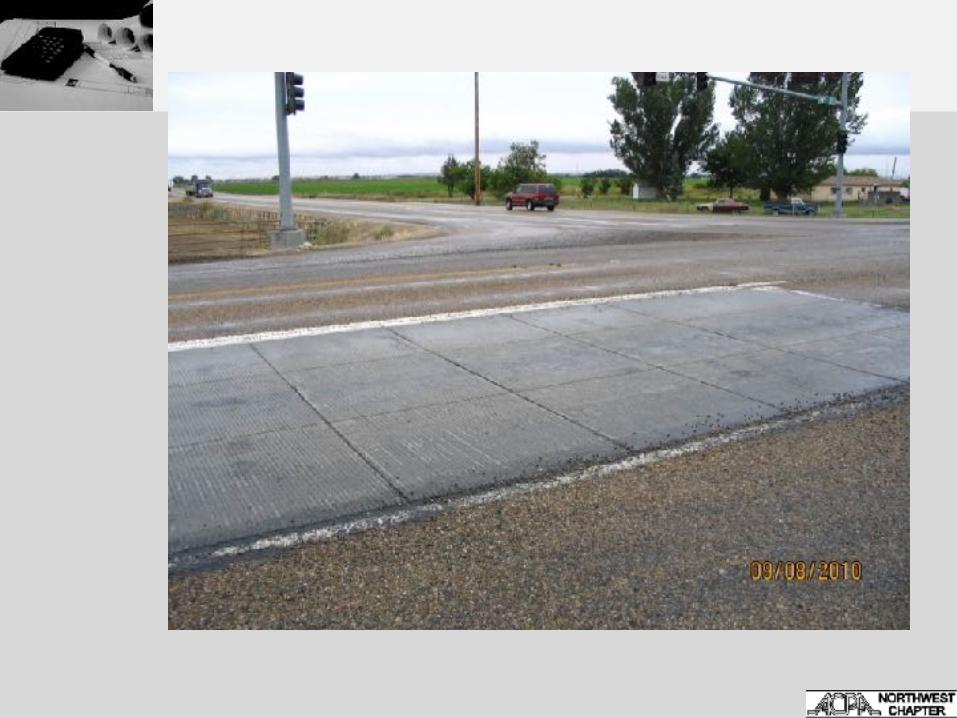
Overlay Experiences
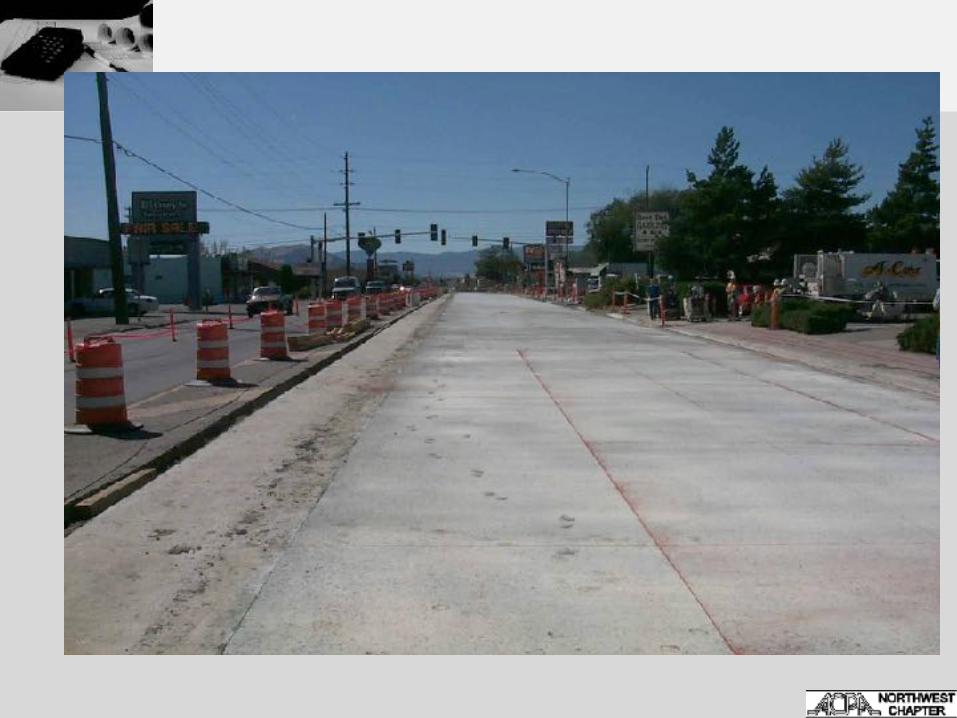
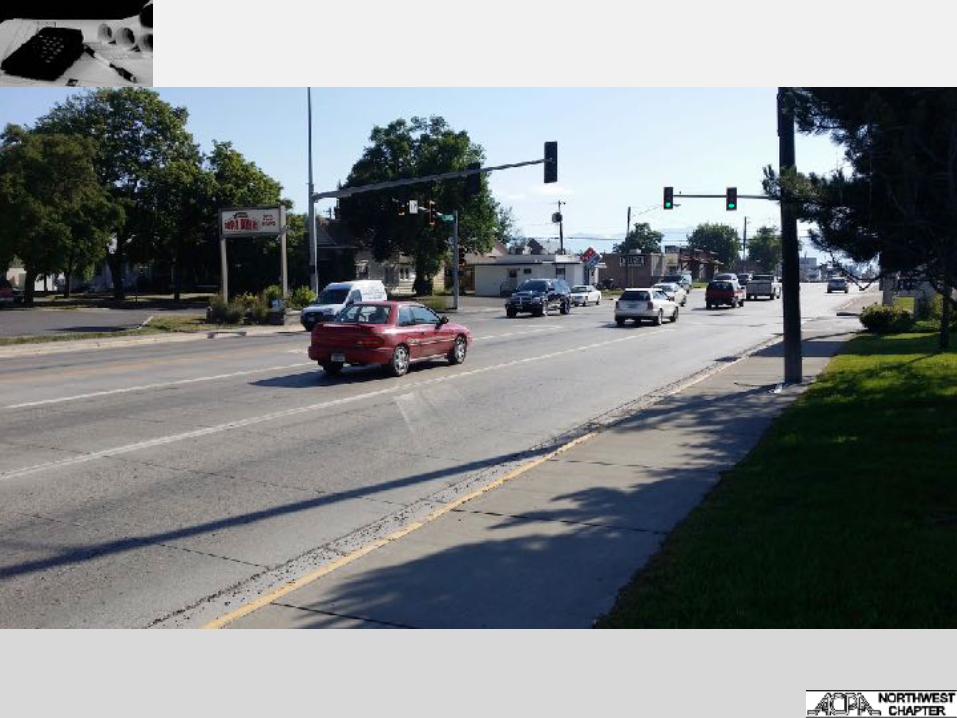
• US 20/26 & Middleton Road • Built in 2005 • 4” on 4” • Still in service • Excellent performance
Other NW Projects
• Portland – NE Columbia Blvd.
• 4” – 6” PCC on 0” – 4” Asphalt – N. Denver Avenue
• 2.5” PCC on Variable Sections
• Eugene – Coburg Rd. – 6” PCC on 4” Asphalt
• Yakima – 40th and Knob Hill – 6” PCC on 2” – 4” Asphalt
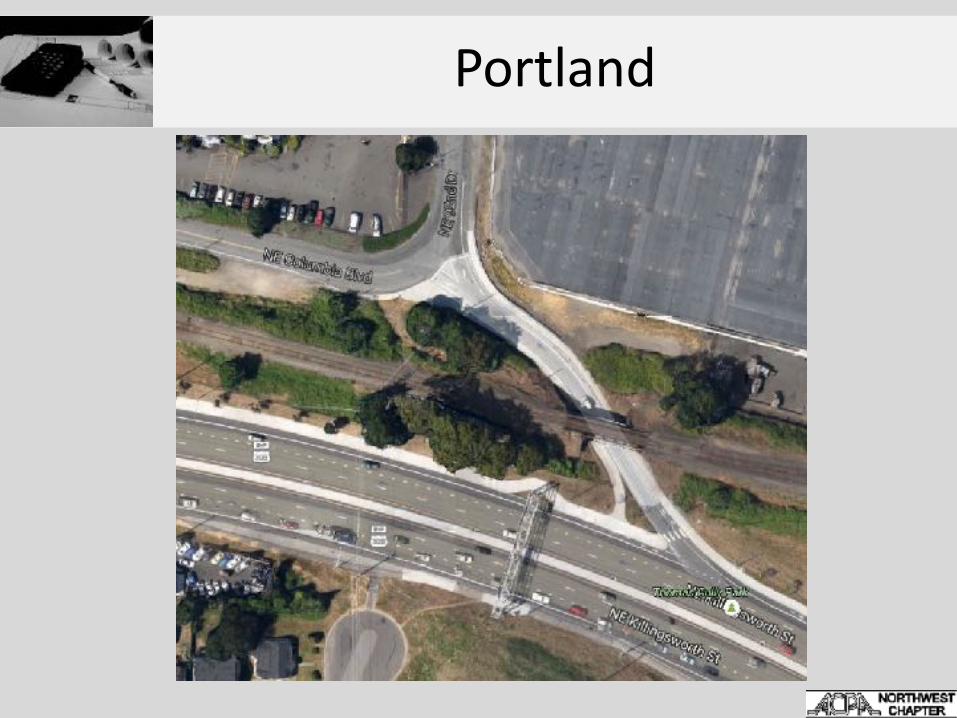
Portland
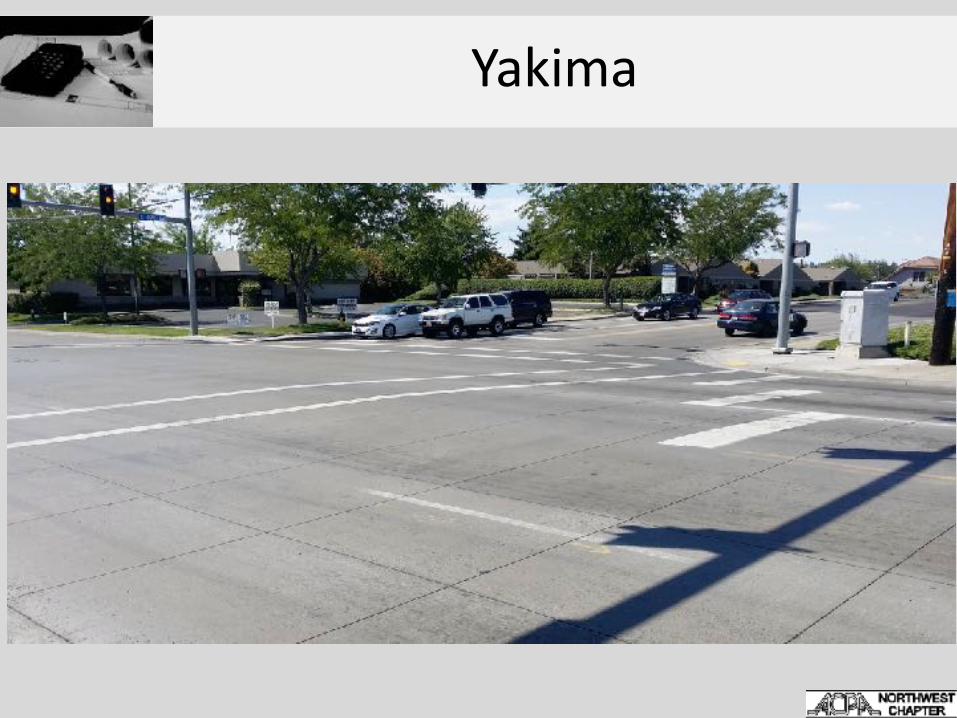
Yakima

QUESTIONS?