Embed Size (px)
Citation preview
NWS Wilmington, OhioMarch 2020
Regional Climate Summary
Regional Climate Summary
The weather pattern in March got a jumpstart on a spring like feel, as warmer and wetter than normal conditions evolved through
much of the month for the region. In fact, most areas (especially north of the Ohio River) received 2-3” more rain than is typical for the month of March (with some spots 4-5” above normal), leading
to soggy grounds as the calendar flips to April.
1
Temperatures
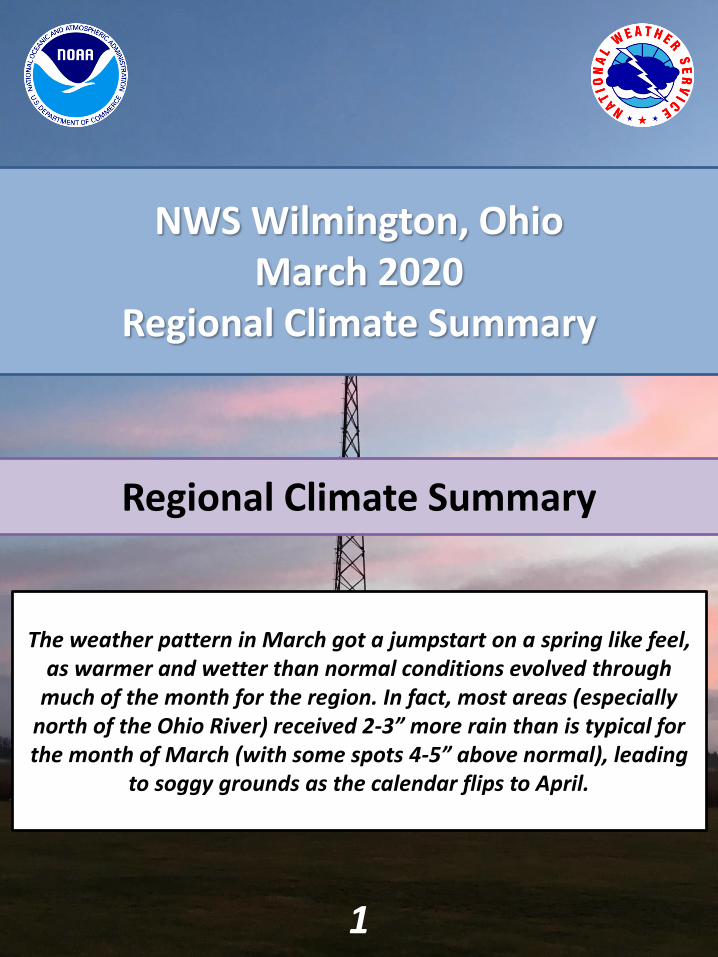
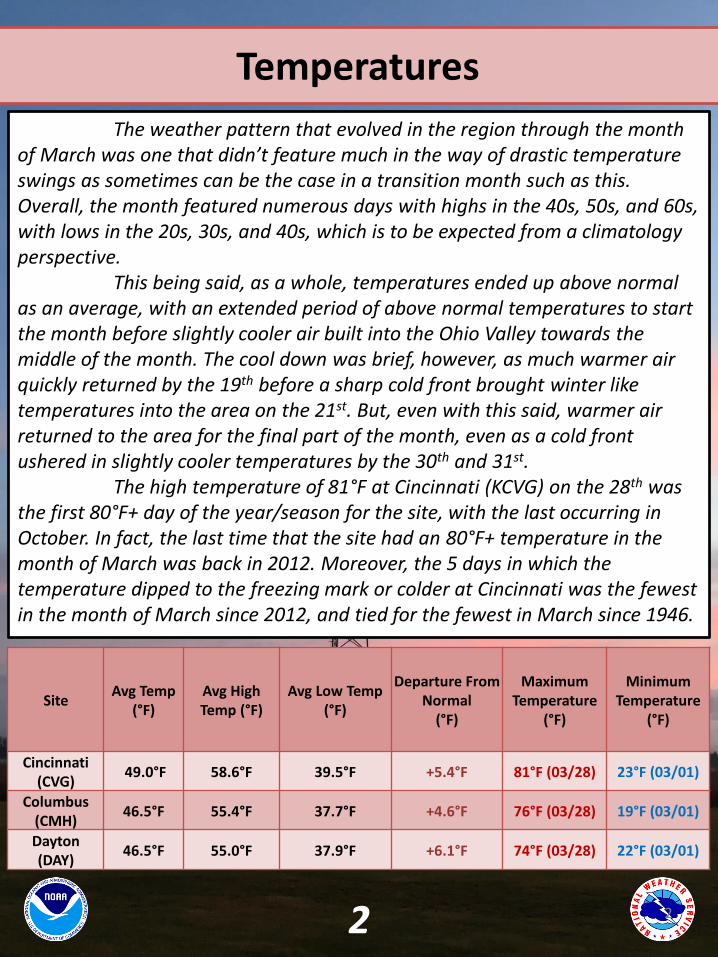
The weather pattern that evolved in the region through the month of March was one that didn’t feature much in the way of drastic temperature swings as sometimes can be the case in a transition month such as this. Overall, the month featured numerous days with highs in the 40s, 50s, and 60s, with lows in the 20s, 30s, and 40s, which is to be expected from a climatology perspective.
This being said, as a whole, temperatures ended up above normal as an average, with an extended period of above normal temperatures to start the month before slightly cooler air built into the Ohio Valley towards the middle of the month. The cool down was brief, however, as much warmer air quickly returned by the 19th before a sharp cold front brought winter like temperatures into the area on the 21st. But, even with this said, warmer air returned to the area for the final part of the month, even as a cold front ushered in slightly cooler temperatures by the 30th and 31st.
The high temperature of 81°F at Cincinnati (KCVG) on the 28th was the first 80°F+ day of the year/season for the site, with the last occurring in October. In fact, the last time that the site had an 80°F+ temperature in the month of March was back in 2012. Moreover, the 5 days in which the temperature dipped to the freezing mark or colder at Cincinnati was the fewest in the month of March since 2012, and tied for the fewest in March since 1946.
SiteAvg Temp
(°F)Avg High Temp (°F)
Avg Low Temp(°F)
Departure From Normal
(°F)
Maximum Temperature
(°F)
Minimum Temperature
(°F)
Cincinnati (CVG)
49.0°F 58.6°F 39.5°F +5.4°F 81°F (03/28) 23°F (03/01)
Columbus (CMH)
46.5°F 55.4°F 37.7°F +4.6°F 76°F (03/28) 19°F (03/01)
Dayton (DAY)
46.5°F 55.0°F 37.9°F +6.1°F 74°F (03/28) 22°F (03/01)
22
Temperatures (Continued)
33
Precipitation
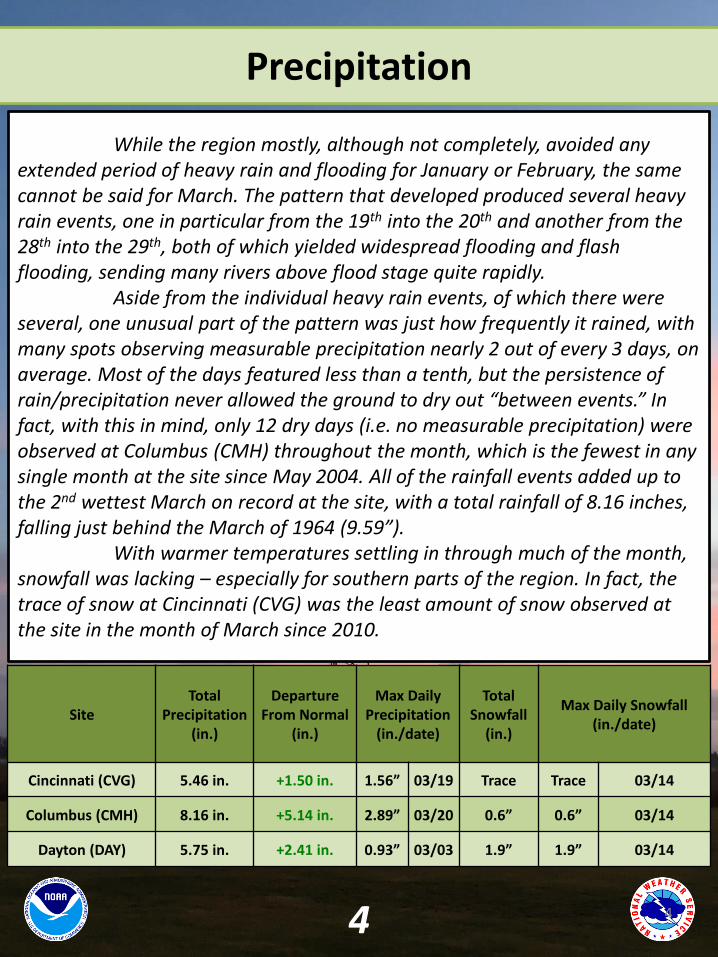
While the region mostly, although not completely, avoided any extended period of heavy rain and flooding for January or February, the same cannot be said for March. The pattern that developed produced several heavy rain events, one in particular from the 19th into the 20th and another from the 28th into the 29th, both of which yielded widespread flooding and flash flooding, sending many rivers above flood stage quite rapidly.
Aside from the individual heavy rain events, of which there were several, one unusual part of the pattern was just how frequently it rained, with many spots observing measurable precipitation nearly 2 out of every 3 days, on average. Most of the days featured less than a tenth, but the persistence of rain/precipitation never allowed the ground to dry out “between events.” In fact, with this in mind, only 12 dry days (i.e. no measurable precipitation) were observed at Columbus (CMH) throughout the month, which is the fewest in any single month at the site since May 2004. All of the rainfall events added up to the 2nd wettest March on record at the site, with a total rainfall of 8.16 inches, falling just behind the March of 1964 (9.59”).
With warmer temperatures settling in through much of the month, snowfall was lacking – especially for southern parts of the region. In fact, the trace of snow at Cincinnati (CVG) was the least amount of snow observed at the site in the month of March since 2010.
SiteTotal
Precipitation(in.)
DepartureFrom Normal
(in.)
Max Daily Precipitation
(in./date)
TotalSnowfall
(in.)
Max Daily Snowfall(in./date)
Cincinnati (CVG) 5.46 in. +1.50 in. 1.56” 03/19 Trace Trace 03/14
Columbus (CMH) 8.16 in. +5.14 in. 2.89” 03/20 0.6” 0.6” 03/14
Dayton (DAY) 5.75 in. +2.41 in. 0.93” 03/03 1.9” 1.9” 03/14
44
Precipitation (Continued)
55
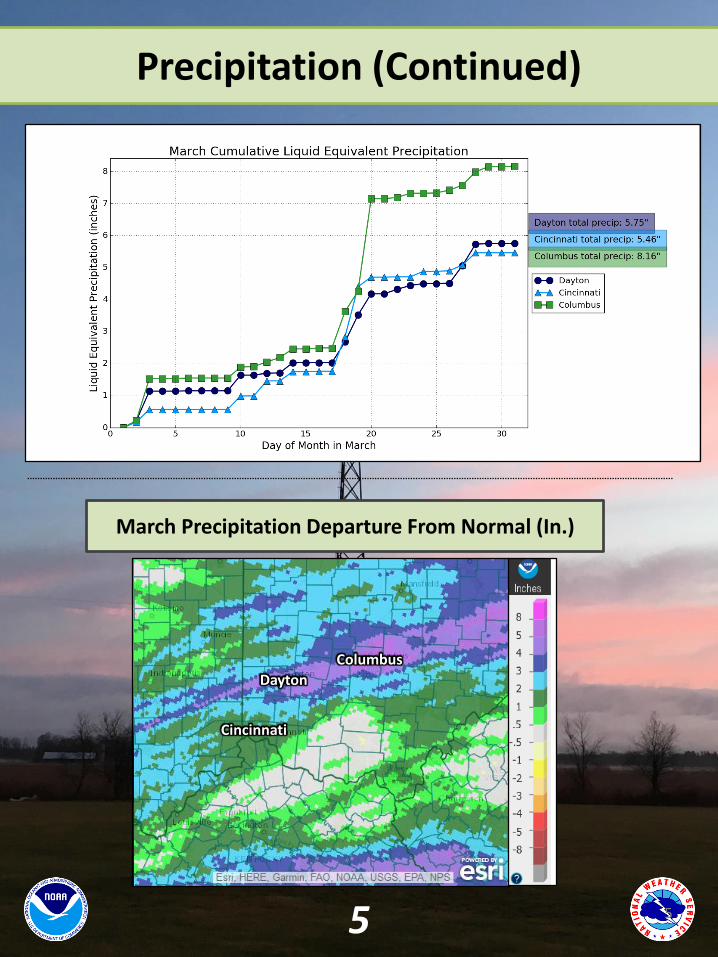
March Precipitation Departure From Normal (In.)
Columbus
Dayton
Cincinnati
Flooding and Severe Weather: March 19-20
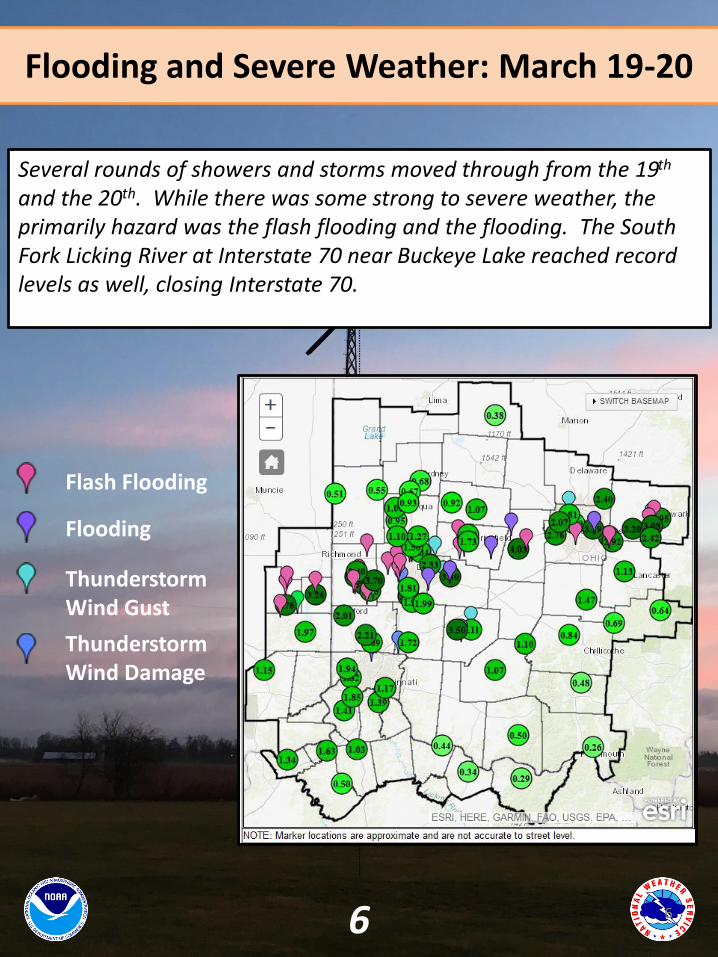
Several rounds of showers and storms moved through from the 19th
and the 20th. While there was some strong to severe weather, the primarily hazard was the flash flooding and the flooding. The South Fork Licking River at Interstate 70 near Buckeye Lake reached record levels as well, closing Interstate 70.
66
Flash Flooding
Flooding
ThunderstormWind Gust
ThunderstormWind Damage
Flooding and Severe Weather: March 28-29
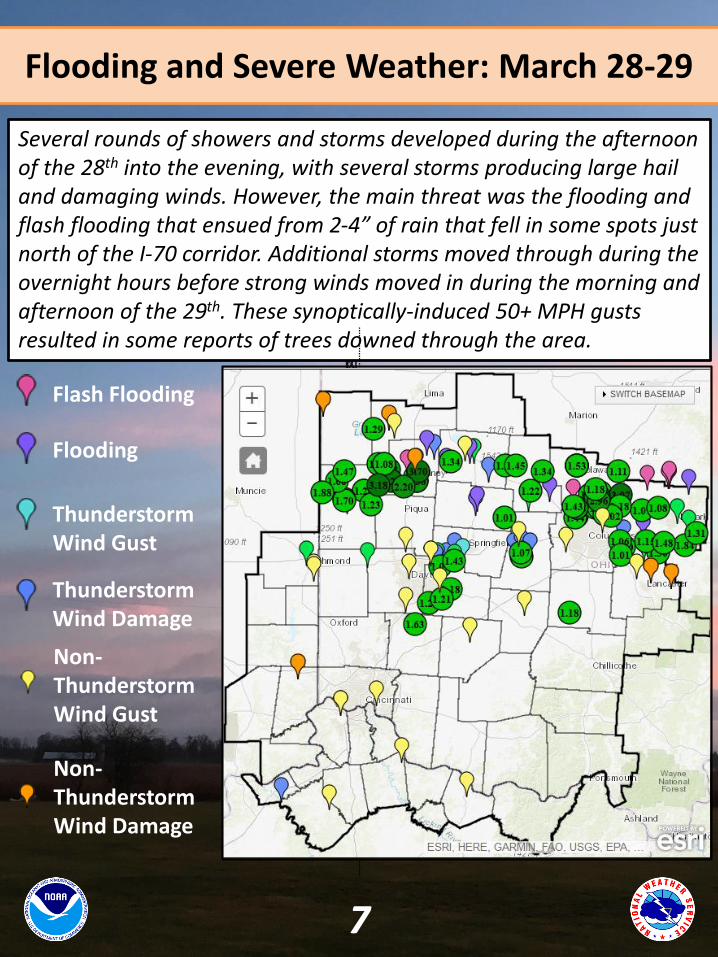
Several rounds of showers and storms developed during the afternoon of the 28th into the evening, with several storms producing large hail and damaging winds. However, the main threat was the flooding and flash flooding that ensued from 2-4” of rain that fell in some spots just north of the I-70 corridor. Additional storms moved through during the overnight hours before strong winds moved in during the morning and afternoon of the 29th. These synoptically-induced 50+ MPH gusts resulted in some reports of trees downed through the area.
77
Flash Flooding
Flooding
ThunderstormWind Gust
ThunderstormWind Damage
Non-Thunderstorm Wind Gust
Non-Thunderstorm Wind Damage
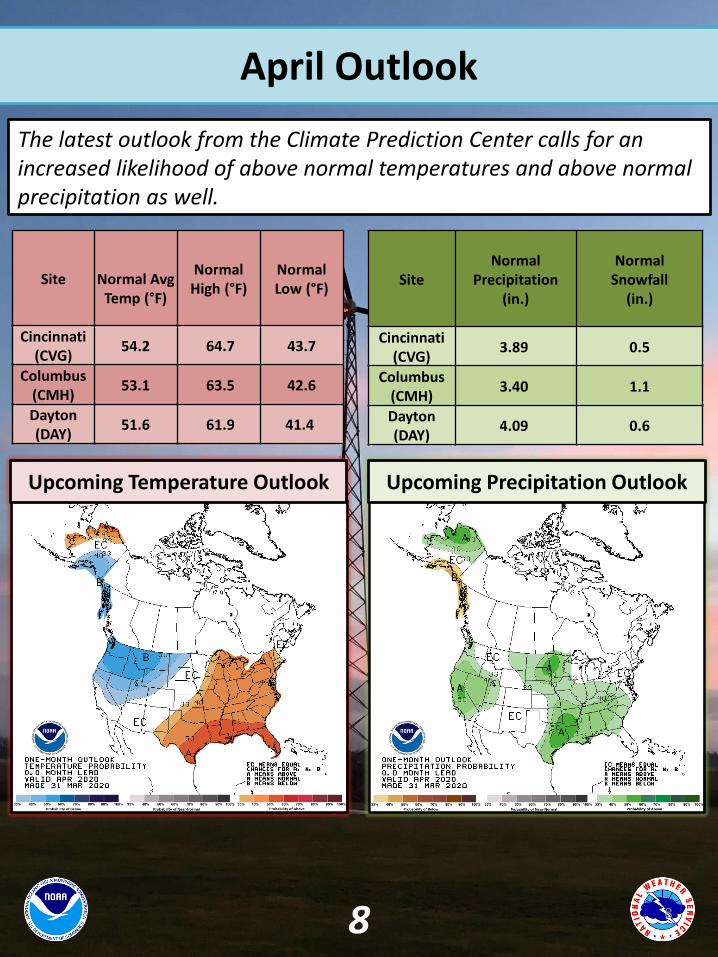
April Outlook
The latest outlook from the Climate Prediction Center calls for an increased likelihood of above normal temperatures and above normal precipitation as well.
Site Normal AvgTemp (°F)
Normal High (°F)
NormalLow (°F)
Cincinnati (CVG)
54.2 64.7 43.7
Columbus (CMH)
53.1 63.5 42.6
Dayton (DAY)
51.6 61.9 41.4
SiteNormal
Precipitation(in.)
Normal Snowfall
(in.)
Cincinnati (CVG)
3.89 0.5
Columbus (CMH)
3.40 1.1
Dayton (DAY)
4.09 0.6
Upcoming Temperature Outlook Upcoming Precipitation Outlook
88
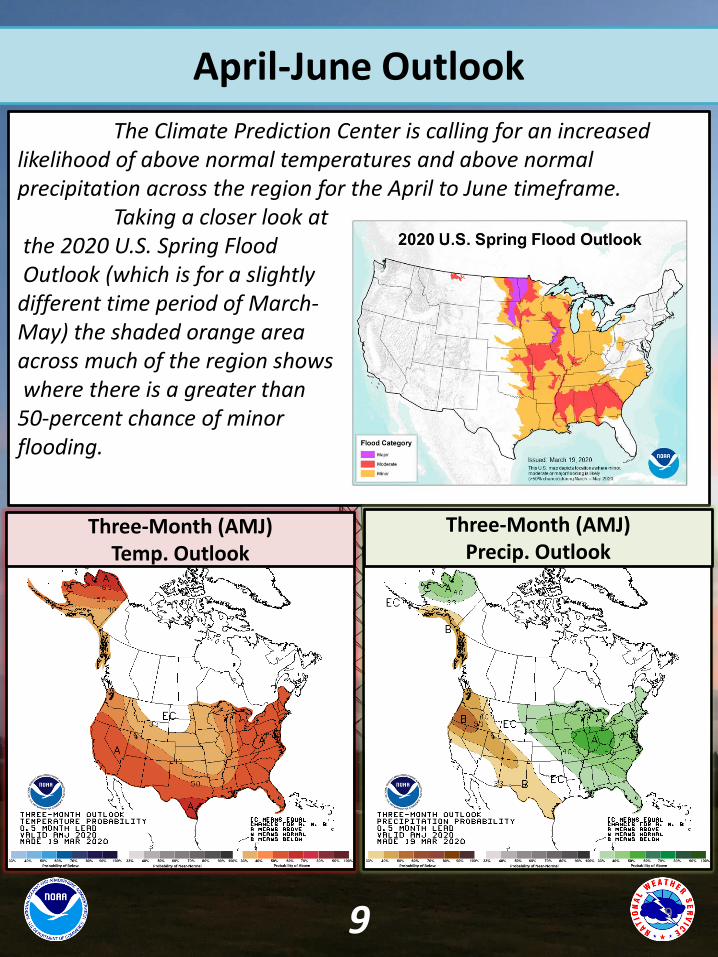
April-June Outlook
The Climate Prediction Center is calling for an increased likelihood of above normal temperatures and above normal precipitation across the region for the April to June timeframe.
Taking a closer look atthe 2020 U.S. Spring FloodOutlook (which is for a slightly
different time period of March-May) the shaded orange area across much of the region showswhere there is a greater than
50-percent chance of minor flooding.
Three-Month (AMJ) Temp. Outlook
Three-Month (AMJ) Precip. Outlook
99