Embed Size (px)
Citation preview
NWT Input-Output Model
– An Overview –
NWT Bureau of Statistics Government of the Northwest Territories
June 2006

Table of Contents A. Introduction ......................................................................................................................... 1 B. Overview of the NWT Input-Output Model ........................................................................... 1 C. Model Structure ................................................................................................................... 1 Commodities....................................................................................................................... 1 Producer Price Measurement .......................................................................................... 2 Input and Output Tables ..................................................................................................... 3 Final Demand Table ........................................................................................................... 5 IO Table Inter-Relationships .............................................................................................. 5 Mathematical Structure ...................................................................................................... 7 D. Model Utility ........................................................................................................................ 8 Purpose and Uses ............................................................................................................. 8 Limitations of the Input-Output Model ................................................................................. 8 The Open and Closed Models ........................................................................................... 9 Closed Model: Examples of Bias and Overstatement ...................................................... 9 E. IO Model Outputs ................................................................................................................ 10 F. Appendix ............................................................................................................................. 11

NWT Bureau of Statistics Page 1 of 11
A. Introduction The purpose of this document is to give the reader a general overview of the input-output (IO) tables produced by Statistics Canada – what the tables look like, the information found in the tables, and how the tables are inter-related – and how the tables are used in the Bureau of Statistics’ IO model. The document provides a very simplified and brief description of the Northwest Territories IO model, its uses and limitations, along with an appendix of frequently used terms. B. Overview of the NWT Input-Output Model The NWT Bureau of Statistics has maintained an input-output (IO) model since the early 1990’s. The model is based on the same structure employed by Statistics Canada1, and is updated periodically by the Bureau of Statistics using data from Statistics Canada. Starting in 1996, Statistics Canada began releasing updated IO information on an annual basis. The most recent release in November 2005 provided preliminary 2002 IO information. The Bureau of Statistics' IO model is a structural model of the NWT economy. The core of the IO model is a set of three tables (Input, Output and Final Demand) that present the most detailed accounting of the NWT economy available. The tables together detail the supply and disposition of individual commodities, the commodity composition of the output of industries, and the complete costs of production of NWT industries. The tables comprise detailed information obtained from Statistics Canada's surveys of establishments and enterprises, and from administrative data sources. In essence, the input-output tables provide a snapshot of the complete economy and all of its industrial interconnections at a specific point in time. IO tables are produced at various levels of aggregation: The least detailed set of tables are presented at the small level (s-level) of aggregation, representing 25 industries and 57 commodities. The most detailed aggregation is the worksheet level (w-level), which represents 300 industries and 727 commodities. The worksheet level IO information is shared with the NWT Bureau of Statistics by Statistics Canada under strict data-sharing provisions to protect confidentiality, and is the information used in the NWT IO model. C. Model Structure As indicated, at the core of the IO model is a set of three tables, or matrixes, that together detail the supply and disposition of individual commodities. Discussion of the IO tables from here on will reference the w-level of aggregation. Commodities The 727 commodities are common to all three IO tables. The last eight commodities (720-727) are referred to as primary commodities, or primary factors. These eight primaries are: subsidies on products, indirect taxes on products, subsidies on production, indirect taxes on production, wages and salaries, supplementary labour income, mixed income and other operating surplus.
1 For a detailed description of IO model structural specifications, see Statistics Canada Technical Series [publication] #18-E: Specification of Parameters for the National Input-Output Model, December 1991.
NWT Bureau of Statistics Page 2 of 11
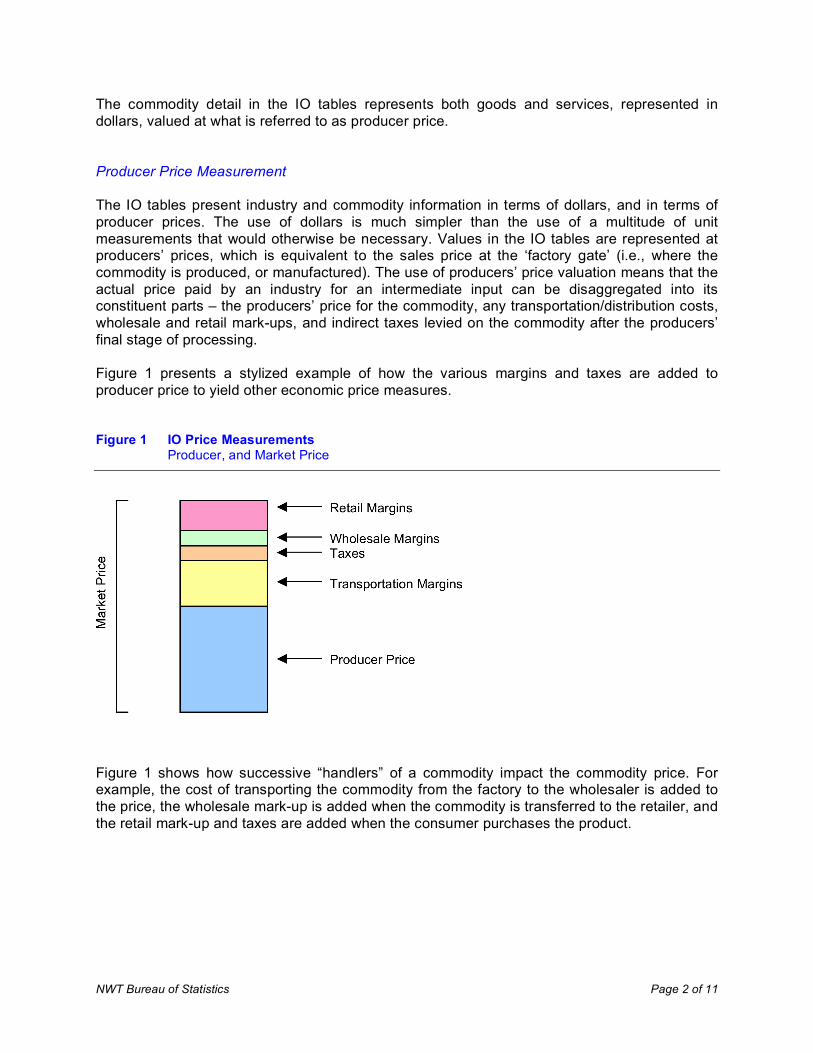
The commodity detail in the IO tables represents both goods and services, represented in dollars, valued at what is referred to as producer price. Producer Price Measurement The IO tables present industry and commodity information in terms of dollars, and in terms of producer prices. The use of dollars is much simpler than the use of a multitude of unit measurements that would otherwise be necessary. Values in the IO tables are represented at producers’ prices, which is equivalent to the sales price at the ‘factory gate’ (i.e., where the commodity is produced, or manufactured). The use of producers’ price valuation means that the actual price paid by an industry for an intermediate input can be disaggregated into its constituent parts – the producers’ price for the commodity, any transportation/distribution costs, wholesale and retail mark-ups, and indirect taxes levied on the commodity after the producers’ final stage of processing. Figure 1 presents a stylized example of how the various margins and taxes are added to producer price to yield other economic price measures. Figure 1 IO Price Measurements Producer, and Market Price
Figure 1 shows how successive “handlers” of a commodity impact the commodity price. For example, the cost of transporting the commodity from the factory to the wholesaler is added to the price, the wholesale mark-up is added when the commodity is transferred to the retailer, and the retail mark-up and taxes are added when the consumer purchases the product.
NWT Bureau of Statistics Page 3 of 11
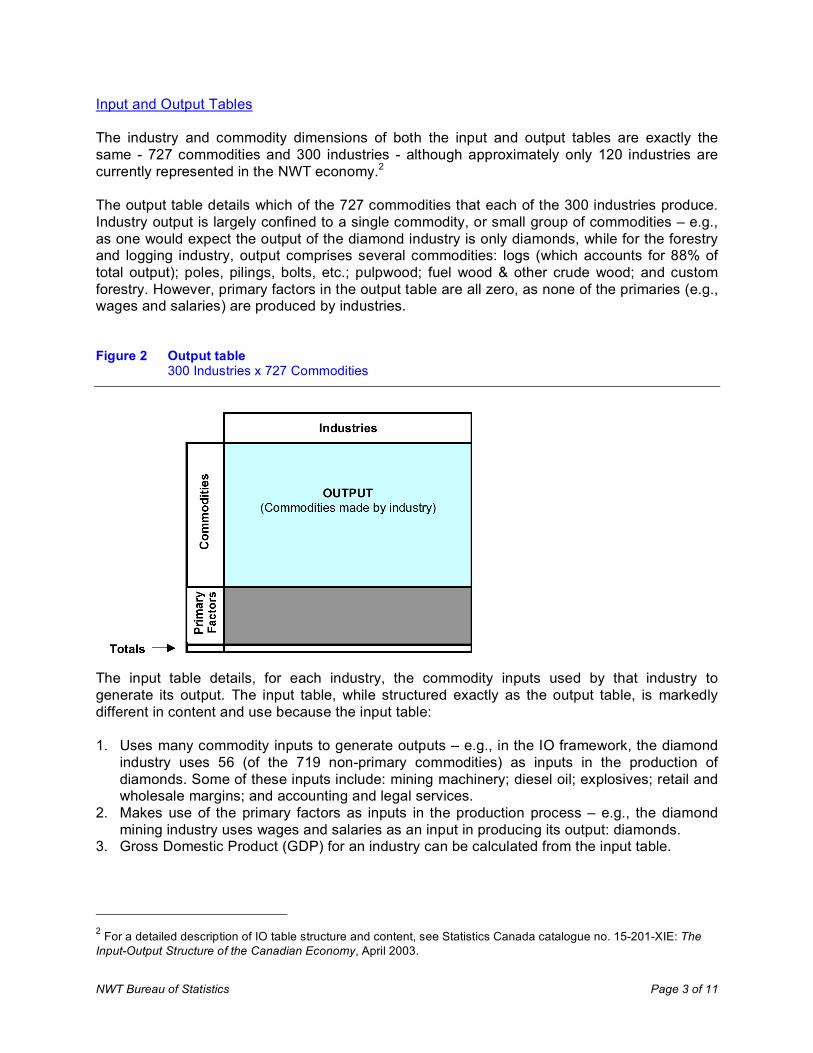
Input and Output Tables The industry and commodity dimensions of both the input and output tables are exactly the same - 727 commodities and 300 industries - although approximately only 120 industries are currently represented in the NWT economy.2 The output table details which of the 727 commodities that each of the 300 industries produce. Industry output is largely confined to a single commodity, or small group of commodities – e.g., as one would expect the output of the diamond industry is only diamonds, while for the forestry and logging industry, output comprises several commodities: logs (which accounts for 88% of total output); poles, pilings, bolts, etc.; pulpwood; fuel wood & other crude wood; and custom forestry. However, primary factors in the output table are all zero, as none of the primaries (e.g., wages and salaries) are produced by industries. Figure 2 Output table 300 Industries x 727 Commodities
The input table details, for each industry, the commodity inputs used by that industry to generate its output. The input table, while structured exactly as the output table, is markedly different in content and use because the input table: 1. Uses many commodity inputs to generate outputs – e.g., in the IO framework, the diamond
industry uses 56 (of the 719 non-primary commodities) as inputs in the production of diamonds. Some of these inputs include: mining machinery; diesel oil; explosives; retail and wholesale margins; and accounting and legal services.
2. Makes use of the primary factors as inputs in the production process – e.g., the diamond mining industry uses wages and salaries as an input in producing its output: diamonds.
3. Gross Domestic Product (GDP) for an industry can be calculated from the input table.
2 For a detailed description of IO table structure and content, see Statistics Canada catalogue no. 15-201-XIE: The Input-Output Structure of the Canadian Economy, April 2003.
NWT Bureau of Statistics Page 4 of 11
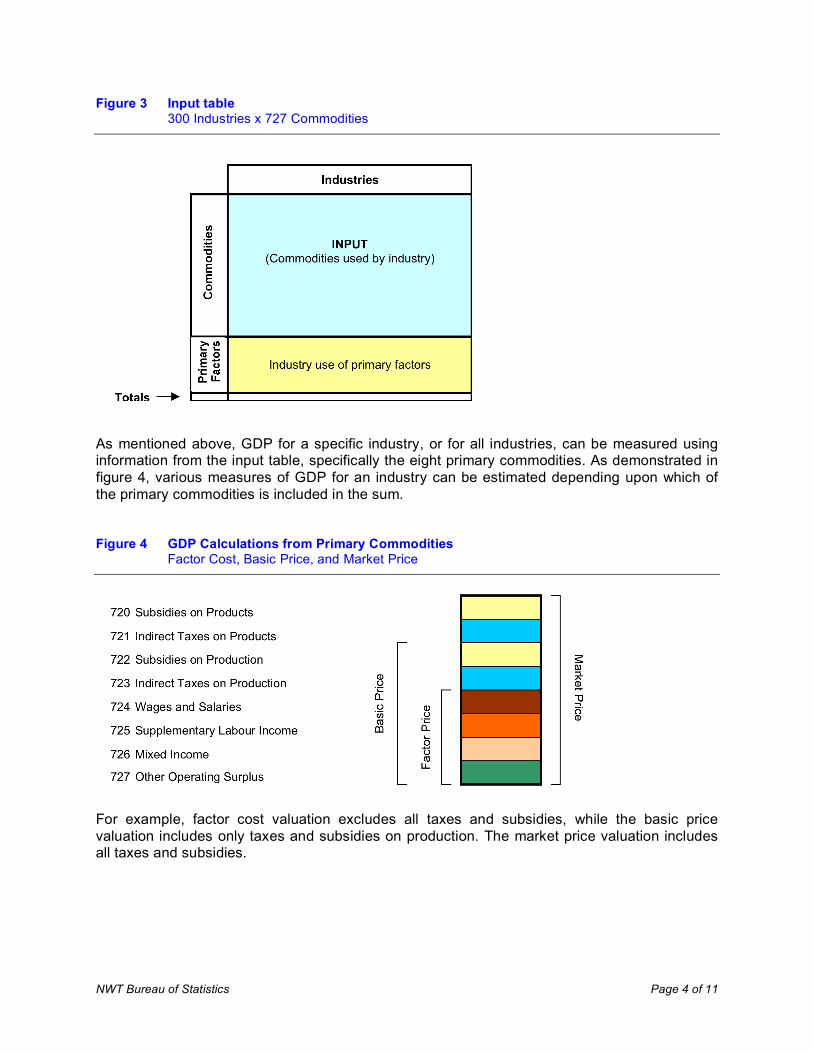
Figure 3 Input table 300 Industries x 727 Commodities
As mentioned above, GDP for a specific industry, or for all industries, can be measured using information from the input table, specifically the eight primary commodities. As demonstrated in figure 4, various measures of GDP for an industry can be estimated depending upon which of the primary commodities is included in the sum. Figure 4 GDP Calculations from Primary Commodities Factor Cost, Basic Price, and Market Price
For example, factor cost valuation excludes all taxes and subsidies, while the basic price valuation includes only taxes and subsidies on production. The market price valuation includes all taxes and subsidies.
NWT Bureau of Statistics Page 5 of 11
Final Demand Table The final demand table, unlike the input and output tables, is made up of final demand sectors rather than industries. There are 170 final demand sectors that correspond to the following six aggregate groupings: personal, government, investment, inventory, export and imports. These six groupings will be familiar to anyone who has taken an introductory economics course, as the these individual component can be used to determine expenditure-basis GDP:
PE + GE + I + INV +(X - M) = GDP The final demand table only factors into the workings of the IO model in determining induced impacts. However, the final demand table is key in determining GDP across both income and expenditure approaches. Figure 5 Final Demand Table 170 Sectors x 727 Commodities
IO Table Inter-Relationships There are a number of inter-relationships among the three IO tables that are interesting and useful for analytical purposes. These relationships are stylistically represented and summarized in figure 6.
NWT Bureau of Statistics Page 6 of 11
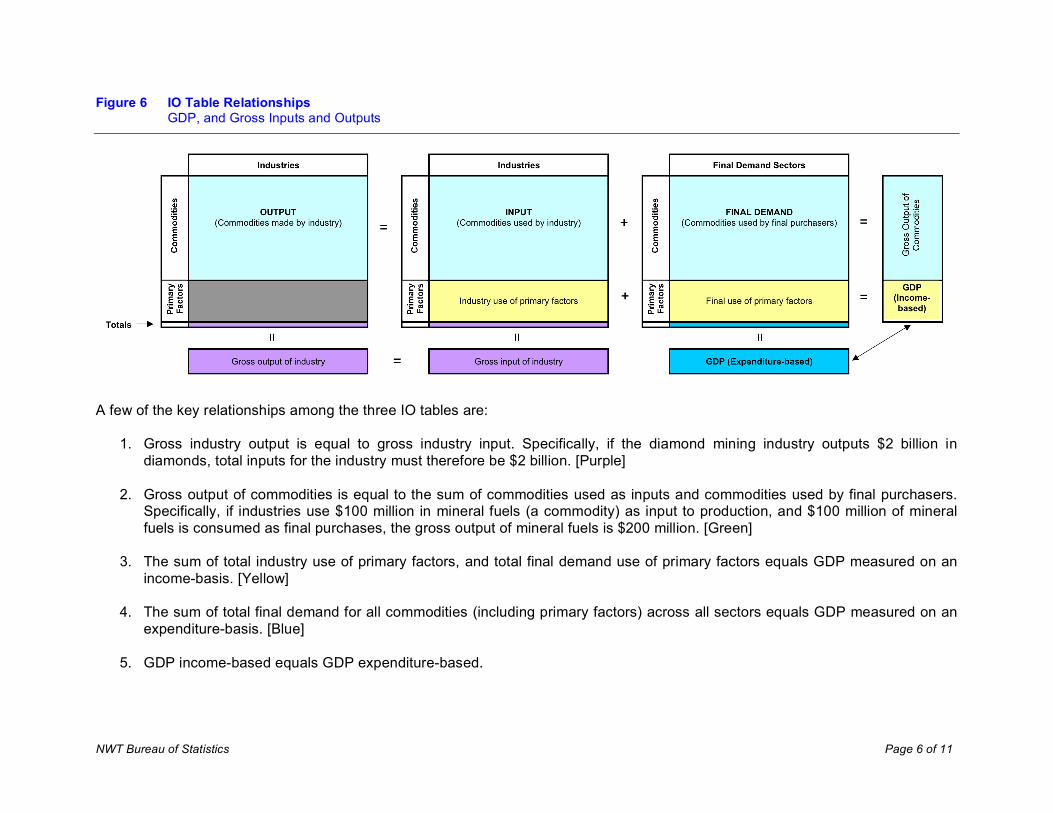
Figure 6 IO Table Relationships GDP, and Gross Inputs and Outputs
A few of the key relationships among the three IO tables are:
1. Gross industry output is equal to gross industry input. Specifically, if the diamond mining industry outputs $2 billion in diamonds, total inputs for the industry must therefore be $2 billion. [Purple]
2. Gross output of commodities is equal to the sum of commodities used as inputs and commodities used by final purchasers.
Specifically, if industries use $100 million in mineral fuels (a commodity) as input to production, and $100 million of mineral fuels is consumed as final purchases, the gross output of mineral fuels is $200 million. [Green]
3. The sum of total industry use of primary factors, and total final demand use of primary factors equals GDP measured on an
income-basis. [Yellow]
4. The sum of total final demand for all commodities (including primary factors) across all sectors equals GDP measured on an expenditure-basis. [Blue]
5. GDP income-based equals GDP expenditure-based.
NWT Bureau of Statistics Page 7 of 11
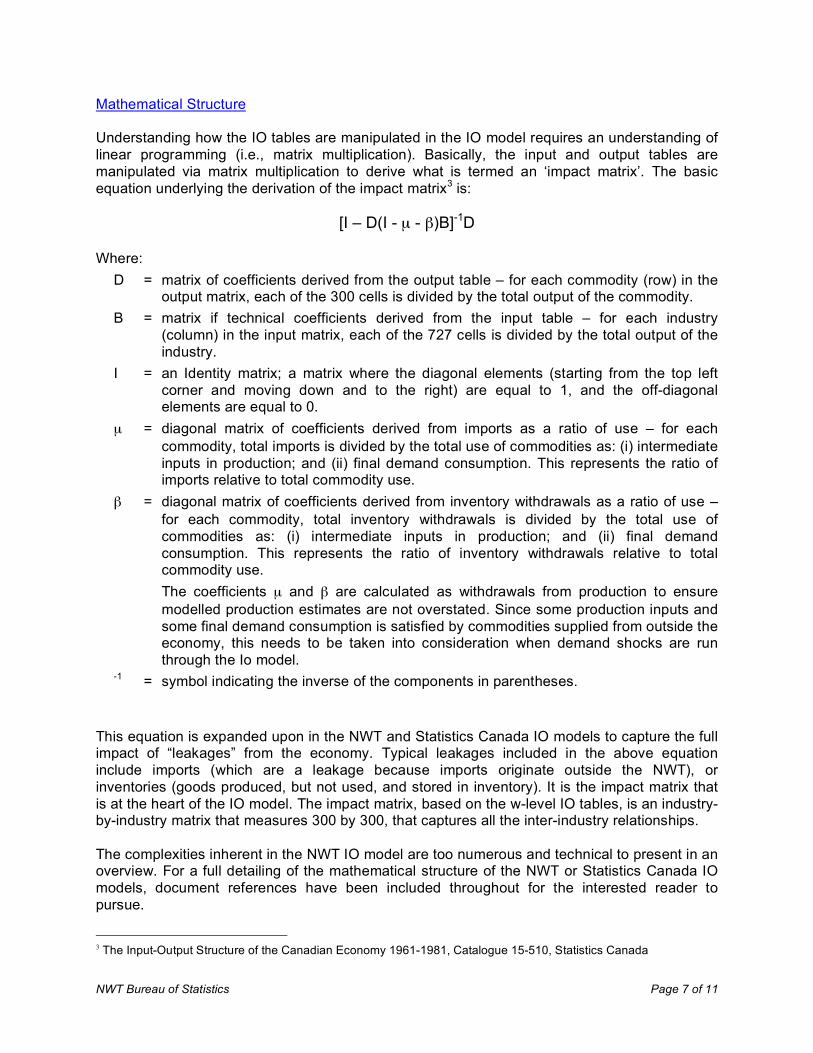
Mathematical Structure Understanding how the IO tables are manipulated in the IO model requires an understanding of linear programming (i.e., matrix multiplication). Basically, the input and output tables are manipulated via matrix multiplication to derive what is termed an ‘impact matrix’. The basic equation underlying the derivation of the impact matrix3 is:
[I – D(I - µ - β)B]-1D Where:
D = matrix of coefficients derived from the output table – for each commodity (row) in the output matrix, each of the 300 cells is divided by the total output of the commodity.
B = matrix if technical coefficients derived from the input table – for each industry (column) in the input matrix, each of the 727 cells is divided by the total output of the industry.
I = an Identity matrix; a matrix where the diagonal elements (starting from the top left corner and moving down and to the right) are equal to 1, and the off-diagonal elements are equal to 0.
µ = diagonal matrix of coefficients derived from imports as a ratio of use – for each commodity, total imports is divided by the total use of commodities as: (i) intermediate inputs in production; and (ii) final demand consumption. This represents the ratio of imports relative to total commodity use.
β = diagonal matrix of coefficients derived from inventory withdrawals as a ratio of use – for each commodity, total inventory withdrawals is divided by the total use of commodities as: (i) intermediate inputs in production; and (ii) final demand consumption. This represents the ratio of inventory withdrawals relative to total commodity use.
The coefficients µ and β are calculated as withdrawals from production to ensure modelled production estimates are not overstated. Since some production inputs and some final demand consumption is satisfied by commodities supplied from outside the economy, this needs to be taken into consideration when demand shocks are run through the Io model.
-1 = symbol indicating the inverse of the components in parentheses.
This equation is expanded upon in the NWT and Statistics Canada IO models to capture the full impact of “leakages” from the economy. Typical leakages included in the above equation include imports (which are a leakage because imports originate outside the NWT), or inventories (goods produced, but not used, and stored in inventory). It is the impact matrix that is at the heart of the IO model. The impact matrix, based on the w-level IO tables, is an industry-by-industry matrix that measures 300 by 300, that captures all the inter-industry relationships. The complexities inherent in the NWT IO model are too numerous and technical to present in an overview. For a full detailing of the mathematical structure of the NWT or Statistics Canada IO models, document references have been included throughout for the interested reader to pursue.
3 The Input-Output Structure of the Canadian Economy 1961-1981, Catalogue 15-510, Statistics Canada

NWT Bureau of Statistics Page 8 of 11
D. Model Utility With a cursory understanding of the tables and mathematics that make up the IO model, it is also important to dwell on the uses and limitations of IO analysis. Purpose and Uses The purpose of an IO model is to estimate the total economic impact of a project, or economic shock, by presenting estimates of direct, indirect and induced impacts associated with the project or shock. Based on the observed inter-connection between industries in the economy, the multiplying of demand is traced through these industrial linkages to yield a set of aggregate impacts. One of the most common uses of the IO model is to simulate the impact of a demand shock on the economy – shock, meaning any change or departure from the status quo. Any increase in consumption of goods and services will generate direct, indirect and induced economic production. Limitations of the Input-Output Model Although the input-output model can be a very useful tool in the decision making process, users should be aware of the limitations of input-output analysis. Some of the limitations that should be taken into consideration when using IO models are: 1. Technical coefficients (the B matrix described in section C) are assumed to be fixed: that is,
the amount of each input necessary to produce one unit of each output is constant. The amount of input purchased by a sector is determined solely on the level of output. No consideration is made to price effects, substitution, changing technology or economies of scale.
2. It is assumed that there are no constraints on resources; supply is infinite and perfectly
elastic (elasticity is an economic measure of responsiveness – being characterized as perfectly elastic implies a very high level of responsiveness, while inelasticity is non responsive).
3. It is assumed that all local employment resources are efficiently used and at full capacity,
there is no underemployment of resources. 4. IO models are flow models; stocks are not explicitly represented, which implicitly assumes
that goods can be produced without additions to capital stock. 5. The industrial structure and linkages of the represented economy are based on information
that lags the current economy - typically a 3 to 4 year lag in Canada. When estimating economic impacts, it is preferable to use economic multipliers to make relative, rather than absolute, comparisons. Economic multiplier analysis is more properly used to determine which of several activities would have the largest economic impact rather than to estimate the absolute level of economic impact for a single activity. Where economic multipliers
NWT Bureau of Statistics Page 9 of 11
are used to estimate the impacts of a single activity, the results should be treated as general estimates only, indicating the order of magnitude of the impacts rather than exact levels. The Open and Closed Models The open version of the Bureau of Statistics’ input-output model provides estimates of direct and indirect economic effects on the territorial economy. Direct effects are the first round of impacts resulting from an economic shock, the impact on those industries that expand production to satisfy the increased demand for a commodity. Indirect impacts result from backwards linkages in the economy, when the firms producing the commodity purchase additional inputs from other firms. For the closed version of the input-output model, along with direct and indirect impacts, induced impacts are also estimated. Induced impacts result from the spending of increased household income that results from the change in economic activity. To derive induced impacts, the household sector is treated as a production sector. Here, the input for the household sector is consumer expenditure on goods and services while its output is labour income, which comprises wages and salaries, supplementary labour income and mixed income. It is assumed that households spend their incomes on consumer goods and services after withdrawing a portion of earnings for savings and taxes. Closing an input-output model to households in this manner serves to increase the interdependence within the system and results in higher impacts on the variables of the model compared to those in the open version. Closed model, or induced, results are sometimes criticized for the potential to introduce bias, or the potential for overstatement in assessing economic impacts. Care must be taken when interpreting closed model results. Closed Model: Examples of Bias and Overstatement First, consider the case where two projects have the same purchased inputs and the same level of direct GDP, but where one project has a higher proportion of labour income and the other a higher proportion of other operating surplus (e.g., corporate profits). In this case, the closed model will estimate a larger economic impact for the project with the higher proportion of labour income. This particular result occurs because the model has been closed to the household spending, but not to profits, and the induced impacts predicted by the model are related to the level of household income rather than profits (the model assumes that profits are not reinvested in the NWT). Therefore, caution should be used when interpreting closed model results because of this potential bias. Second, to generate induced impacts associated with the operation of a new diamond mine is appropriate since a new mine expands economic activity and injects new labour income (increasing household income) into the economy. However, there are circumstances where modeling the full induced impact of an activity will lead to an overstatement of impacts. In the NWT, for example, where some mine workers are non-residents (e.g., fly-in/fly-out workers), it is incorrect to assume that the labour income of these workers has an induced impact on the NWT. In part because of these reasons, Statistics Canada does not close the national or inter-provincial IO models and does not produce closed multipliers. The Bureau of Statistics, while

NWT Bureau of Statistics Page 10 of 11
recognizing the potential for bias and the overstatement of impacts, also acknowledges the need to estimate induced impacts and therefore closes the NWT model. E. IO Model Outputs One of the standard outputs from most IO models is a set of industry multipliers. Multipliers allow convenient, non-technical access to a standard set of industry impact information without having to actually use, or even understand, the IO model. Industry multipliers are most commonly used to estimate the economic impacts associated with establishing a new firm in a particular industry or with the expansion, contraction or closure of existing firms. The Bureau of statistics annually produces a table on industry multipliers based on the latest available set of input-output tables. For additional information and access to the multipliers, see publication NWT Economic Multipliers: Overview and Results on the Bureau of Statistics’ website at www.stats.gov.nt.ca/statinfo/economic.html
NWT Bureau of Statistics Page 11 of 11
F. Appendix Glossary of Frequently Used Terms in IO Analysis Basic Price is a valuation that adds to the factor cost measure taxes on production (such as property and payroll taxes, but not federal or provincial sales taxes), and subtracts production subsidies (such as labour-related subsidies, but not product-related subsidies). It is a measure between factor cost and market price. See factor cost, market price. Direct effects are the initial impacts; the impact on those industries, which expand production to satisfy the increased demand for a commodity. Factor cost is a valuation reflecting the cost of the factors of production (labour and capital). It corresponds to the value remaining after the deduction from market prices of all applicable taxes and subsidies. See market prices. Gross Domestic Product (GDP) is the total unduplicated value of the goods and services produced in the economic territory of a country, or region during a given period. GDP can be measured in three ways: as total incomes earned in current production; as total final sales of current production; or as total net values added in current production. GDP can be valued at factor cost, basic prices, or market value. Indirect effects result from backwards linkages in the economy; when the firms producing a commodity purchase additional inputs from other firms. Induced effects result from the spending of increased household income. Labour income is the sum of wages and salaries and supplementary labour income. See supplementary labour income. Market price is a valuation expressed in terms of the prices actually paid by the purchaser, that is, after all applicable taxes and subsidies have been added. Mixed income represents or includes the net income of unincorporated businesses. Other operating surplus is primarily composed on pre-tax corporate profits, investment income, capital cost allowance, and any inventory valuation adjustment. Producers’ price is the equivalent of sales price at the ‘factory gate’ (i.e., where the commodity is produced, or manufactured). See purchasers’ price. Purchasers’ price is the valuation of a commodity that includes trade and transportation margins (to move the commodity from the producers’ ‘factory gate’ to the purchaser), and commodity taxes levied after leaving the producers’ plant. See producers’ price. Supplementary labour income is the employers’ social contributions, either compulsory or voluntary. It includes retirement allowances, and contributions to employment insurance, CPP and QPP, other pension plans, workers’ compensation, medical and dental plans, short- and long-term disability insurance, etc.


![Model - FoxESS · Model INPUT OUTPUT Max. Recommended DC power Max. DC voltage E}u]vo } vPÀ}o P Max. input current (input A/input B) Max. short circuit current (input A/input B)](https://img.pdfslide.net/doc/110x75/5f175383bee8604c5a21b5db/model-foxess-model-input-output-max-recommended-dc-power-max-dc-voltage-euvo.jpg)