Embed Size (px)
Citation preview

Prepared by
NY Green Bank
Market Transformation Study
Mosaic, Inc. Case Study
March 2019 Albany, New York
asdlfkasf
F
February
30 January 2019
Notice
This report was prepared by DNV GL in the course of performing work contracted for and
sponsored by the New York State Energy Research and Development Authority (hereafter
“NYSERDA”). The opinions expressed in this report do not necessarily reflect those of
NYSERDA or the State of New York, and reference to any specific product, service, process, or
method does not constitute an implied or expressed recommendation or endorsement of it.
Further, NYSERDA, the State of New York, and the contractor make no warranties or
representations, expressed or implied, as to the fitness for particular purpose or merchantability
of any product, apparatus, or service, or the usefulness, completeness, or accuracy of any
processes, methods, or other information contained, described, disclosed, or referred to in this
report. NYSERDA, the State of New York, and the contractor make no representation that the
use of any product, apparatus, process, method, or other information will not infringe privately
owned rights and will assume no liability for any loss, injury, or damage resulting from, or
occurring in connection with, the use of information contained, described, disclosed, or referred
to in this report.
NYSERDA makes every effort to provide accurate information about copyright owners and
related matters in the reports it publishes. Contractors are responsible for determining and
satisfying copyright or other use restrictions regarding the content of reports that they write, in
compliance with NYSERDA’s policies and federal law. If you are the copyright owner and
believe a NYSERDA report has not properly attributed your work to you or has used it without
permission, please email [email protected].
Information contained in this document, such as web page addresses, are current at the time of
publication
i
Table of Contents
1 NY GREEN BANK – MOSAIC, INC. WAREHOUSE CREDIT FACILITY: CASE STUDY OVERVIEW ............................................................................. 1
2 RESIDENTIAL SOLAR LOAN AGGREGATION: THE MOSAIC WAREHOUSE
CREDIT FACILITY ............................................................................... 4
2.1 Warehouse Credit Facilities in the Residential Solar Industry 4
2.2 The Residential Solar Finance Market 5
2.3 Case Study: NY Green Bank and the Mosaic Solar Loan 7
2.4 Assessment of Market Effects 10
APPENDIX: TABLE OF MARKET INDICATORS ..................................................... 16

1
1 NY GREEN BANK – MOSAIC, INC. WAREHOUSE CREDIT
FACILITY: CASE STUDY OVERVIEW
NY Green Bank. NY Green Bank (“NYGB”) is a $1.0 billion
investment fund designed to accelerate clean energy
deployment in NYS and is globally recognized as a leading
sustainable infrastructure investor. NYGB’s participation in a
growing number of transactions spurs clean energy
development in New York State (“NYS” or the “State”), with
benefits for New York residents and more broadly. NYGB is a
division of the New York State Energy Research and
Development Authority (“NYSERDA”).
Since its formation, NYGB has worked to increase the size,
volume and breadth of sustainable infrastructure investment
activity throughout the State, expand the base of investors
focused on NYS clean energy and increase market
participants’ access to capital on commercial terms. To
achieve these objectives, NYGB collaborates with the private
sector to develop transaction structures and methodologies that
overcome typical clean energy investment barriers. These
barriers include challenges in evaluating risk and addressing
the needs of distributed energy and efficiency projects where
underwriting may be oriented toward larger opportunities
and/or toward groups of somewhat homogeneous investments
that make up larger portfolios.
NYGB invests where there are limited precedents, less
familiar asset structures and/or deal structuring complexities
that require specialized skillsets. NYGB applies project and
structured finance transaction approaches that isolate project
assets, allocate, and protect against downside risks to the
greatest possible extent and monetize low volatility project-
generated cash flows to generate appropriate risk-adjusted
returns.
NYGB focuses on opportunities that create attractive
precedents, standardized practices, and roadmaps that capital
providers can readily replicate and scale. As funders “crowd
in” to a particular area within the sustainable infrastructure
landscape, NYGB moves on to other areas that have received
less investor interest.
Mosaic Case Study. DNV GL developed this case study of
NYGB’s participation in a warehouse credit facility for
Mosaic, Inc. (“Mosaic”) as one aspect of the first independent
Initiated Operations: 2014
First Financing Transaction: 2015
Financings through 2018: 44
Number of Counterparties: 55
Capital Committed: $637.6 million
Cost of Projects Financed: $1.51 – 1. billion
WAREHOUSE CREDIT FACILITY CASE STUDY
2015: NYGB participates with one other bank in first, major unrated credit warehouse to support innovative residential solar loan product: $50 mill ion for NY State projects.
2017: Mosaic uses the initial credit facility to demonstrate success of its business model and achieve an A rated term securitization. This transaction was oversubscribed by institutional investors, refinancing the warehouse to be used for further project loan aggregation.
201 – 2019 Financial institutions respond favorably to subsequent opportunities. Mosaic issues five rated securitizations in 2017 – 2019 totaling over $1.1 billion to support lending volumes of $40 - $50 million/month.
Over 30 financial institutions participate in Mosaic securitized financings.
In 2018, Mosaic assumes national lead in volume of residential solar installations financed, with a 14% market share.
2
assessment of NYGB’s impacts, conducted as part of customary and ongoing evaluations by
NYSERDA with respect to its programs and divisions. The purpose of this and other case
studies is to provide a more detailed narrative of NYGB’s involvement in individual transactions
and to identify the impact of those transactions on the State’s clean energy sector and
participants more broadly, including project developers and the financiers that support their
activities.
Mosaic is a specialty financing company focused on residential solar PV installation. In 2014,
Mosaic launched a novel business model that greatly reduced the high customer acquisition and
financing costs that had begun to inhibit growth in the solar PV industry. By mid-2015, Mosaic
sought an infusion of capital to support its loans to homeowners through a nationwide network
of participating dealers. The credit risk of the portfolio was unknown because the performance
history of the underlying loans was unknown. In early 2016, after extensive due diligence and
credit underwriting activities to assess the viability of Mosaic’s approach, NYGB joined one
other bank and committed $50 million in two stages to a warehouse credit facility.1 This credit
facility grew to $270 million with the addition of two other lending institutions, once the initial
facility had developed a track record and evidenced success.
Mosaic used the credit and operating experience gained with the warehouse credit facility to
support the development of a credit-rated securitization, which was immediately oversubscribed.
Mosaic issued four additional securitizations over the next 20 months with progressively more
favorable borrowing terms, raising over $1.1 billion from more than 30 banks and investor
groups. After only four years in the market, the Mosaic Solar Loan program commands 14% of
the national market for residential solar project financing, by capacity installed.
The Mosaic transaction represents an instance of NYGB’s early involvement in support of what
was, in 2015, an innovative approach to residential solar installation financing. Since that time,
Mosaic has grown to be the largest US residential solar finance provider, and its strategies have
been adopted by other market participants. Mosaic executives identify NYGB’s involvement in
this transaction as a key factor driving the company’s growth and success.
1 Mosaic had earlier established a small ($20 million) warehouse facility prior to the transaction in which NYGB
participated.
“Mosaic, with the help of NY Green Bank, has paved the way for the industry.
There is an entire [financial] ecosystem that benefits everyone.” – Alex Kaplan:
Director of Capital Markets, Mosaic, Inc.

3
Market Effects Assessment. DNV GL identified strong and consistent evidence of NYGB’s
influence on the development of clean energy finance markets through the case study of
NYGB’s investment in a credit warehouse credit facility for Mosaic, Inc., as summarized in
Table 1.
Table 1. Evidence of NY Green Bank Effects on the Market for Residential Solar PV
Financing
Market Indicators
Evidence
Increase in volume of similar clean energy projects in NY
• The pace of residential solar installations in NYS increased through 2016 faster than in other states with advanced solar markets and did not decrease as much through 2018.
• NYGB counterparties installed or financed 38% of the residential solar capacity installed in New York during the period 2016 – 2018.
Replication of demonstrated financing arrangements by other developers
• By the end of 2018, loans had displaced leases and Power Purchase Agreements (“PPAs”) as the most frequently-used vehicle for financing residential solar installations, in terms of MW capacity installed.
• Several national competitors have adopted the business model first developed by Mosaic, with support at a critical juncture from NYGB.
Increase in the scale of transactions of the type supported by NYGB
• The average size of all residential solar aggregation transactions increased from $250 million in 2015 to over $320 million by 2018. Subsequent transactions were oversubscribed.
Increase in the volume of similar transactions
• The annual volume of residential solar project securitizations issued industry-wide increased from $250 million in 2015 to $2.6 billion in 2018.
• Mosaic issued 35% of the total securitization volume between 2017 – 18.
Increase in number of financial firms in similar transactions
• NYGB was joined by only one other financial institution in Mosaic’s initial warehouse credit facility. Twenty-nine banks and financial institutions participated in Mosaic’s loan securitizations issued in 2018.
Increased awareness of investment opportunities among financial institutions
• Industry observers report there are 40 – 50 institutional investors active in financing residential solar aggregations.
4
The remainder of this case study describes NYGB’s involvement with Mosaic and discusses the
indicators of NYGB’s impact on Mosaic’s success and the development of the market for
residential solar financing more broadly.
2 RESIDENTIAL SOLAR LOAN AGGREGATION: THE MOSAIC
WAREHOUSE CREDIT FACILITY
2.1 Warehouse Credit Facilities in the Residential Solar Industry
Warehouse credit facilities advance funds to a
clean energy project developer or financing
company for the completion of qualifying projects
that aggregate into a sizable portfolio. These
portfolios may subsequently be marketed to
commercial lenders and other investors through the
process of securitization. In general, the
securitization process pools small transactions such
as credit card debt, auto loans, residential
mortgages and equipment leases, and sells claims
to cash flows, tax credits, and depreciation
deductions associated with those assets to third
party investors. The securitization process creates
liquidity in the marketplace by enabling a wide
range of investors to effectively participate in the
larger asset pool.
Large residential solar installers and lenders that
specialize in financing residential solar projects
have relied heavily on warehouse credit facilities
and securitization to grow their businesses. While
straightforward in concept, the operations of
warehouse credit facilities are complex. Loan or lease origination and payment processes must
be easy for borrowers to use and sufficiently standardized to handle thousands of transactions.
This ease of use for the borrower must be balanced against robust due diligence and credit
operations to assure investors that they will receive the returns they expect.
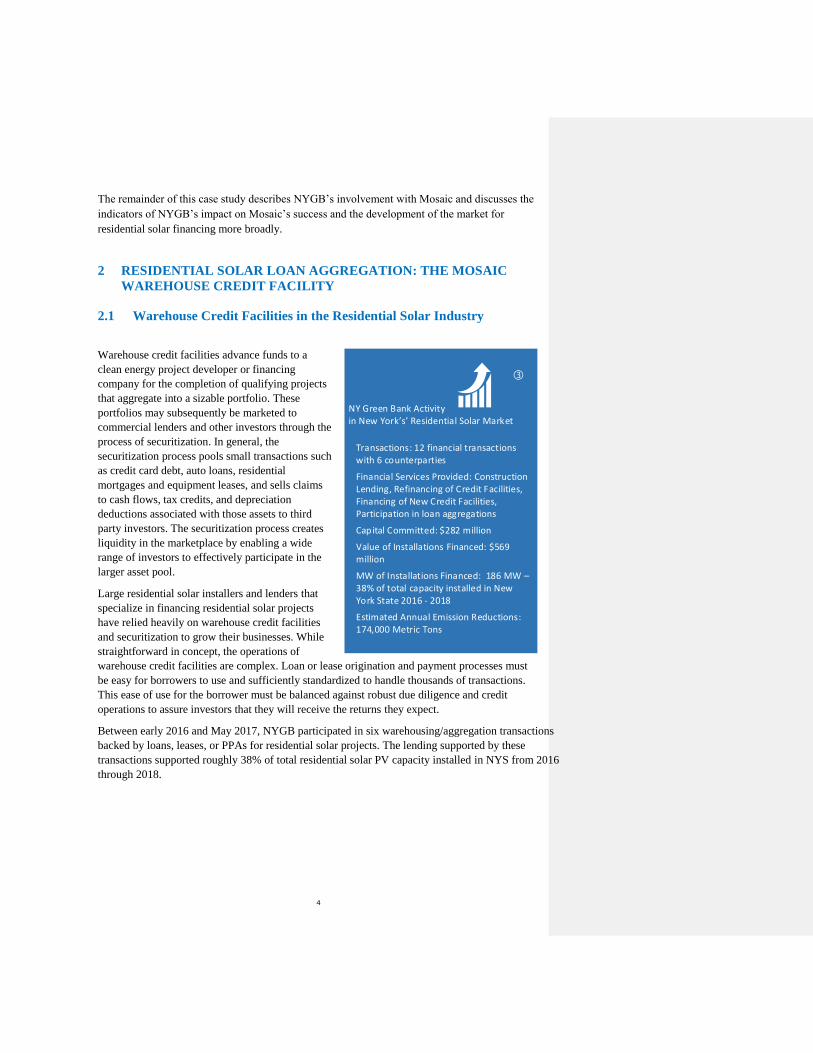
Between early 2016 and May 2017, NYGB participated in six warehousing/aggregation transactions
backed by loans, leases, or PPAs for residential solar projects. The lending supported by these
transactions supported roughly 38% of total residential solar PV capacity installed in NYS from 2016
through 2018.
NY Green Bank Activityin New York s Residential Solar Market
Transactions: 12 financial transactions with 6 counterparties
Financial Services Provided: Construction Lending, Refinancing of Credit Facilities, Financing of New Credit Facilities, Participation in loan aggregations
Capital Committed: $282 million
Value of Installations Financed: $569 million
MW of Installations Financed: 186 MW – 3 of total capacity installed in New York State 2016 - 2018
Estimated Annual Emission Reductions: 174,000 Metric Tons
5
2.2 The Residential Solar Finance Market
The annual volume of residential PV capacity installed nationwide increased nearly ten-fold
between 2010 and 2016.2 This rapid growth was driven by several factors, including:
• Steep decrease in the installed cost of residential PV systems. Between 2010 and
2016 the average cost per watt of capacity installed decreased roughly 60%, from $7.24
to $2.98. These cost reductions reflect decreases in the prices of panels, electronics and
rack mounting systems, and increased competition among installers.3
• Widespread introduction of net metering. By 2015, over 40 states had adopted net
metering provisions, which increased the economic value of PV installations to their
owners.
• Product and business model innovation coupled to third-party financing. Installed
costs for residential solar PV systems have typically ranged from $12,000 to $30,000
prior to application of tax credits and other incentives. Initial costs have been, and
continue to be, identified by homeowners as the major barrier to adoption of solar PV.
However, surveys of actual and potential PV system purchasers found that homeowners
were deterred from using conventional bank credit by several factors, including: lack of
confidence in the long-term financial benefits of PV, the perceived hassle of getting a
bank loan, and an unwillingness to place additional liens on their homes.4
To address these barriers, large solar installers including Solar City, Vivint, Sunrun, and
SunEdison created new products, including PPAs and leases with variable terms to
ensure positive cash flow to their customers. These customer arrangements were backed
by complex lease and aggregation transactions that entailed selling claims to the tax
credits and depreciation benefits associated with the PV systems to third-party investors.
To generate the scale needed to support the legal and accounting requirements of such
structures, these large installers spent heavily on customer acquisition, including door-
to-door sales in high-potential neighborhoods.
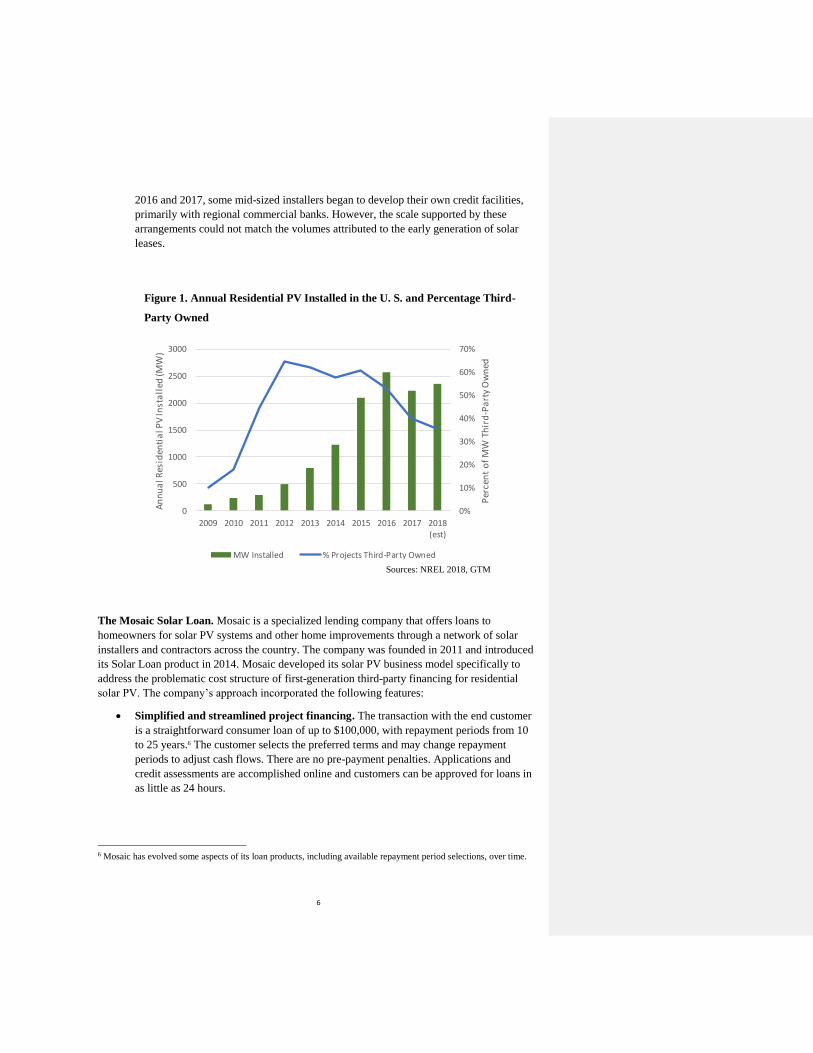
As depicted in Figure 1, this approach was associated with a rapid increase in the
volume of residential solar PV installed between 2009 and 2016. During this period, the
national market share of the three largest installers – Vivint, Solar City, and Sunrun –
grew to over 54%. However, the customer acquisition and financing costs associated
with the new business model proved to be unsustainable. By the end of 2016, customer
acquisition costs for the three largest installers amounted to 19% of the total cost of
installations, more than offsetting the operational efficiencies these larger firms could
achieve.5 SunEdison exited the residential market in 2016, and the market share for the
top three firms decreased as did the percentage of installations owned by third parties. In
2 Solar Energy Industry Association, 2018. U. S. Solar Market Insight Report. https://www.seia.org/us-solar-market-
insight. 3 R. Margolis, D. Feldman, and D. Boff. 2017. Q4 2016/Q1 2017 Solar Market Update. National Renewable Energy
Laboratory. https://www.nrel.gov/docs/fy17osti/68425.pdf. 4 Mitchell Rosenberg and Gomathi Sadhasivan. 2018. “Here Comes the Sun, Maybe”. Proceedings of the ACEEE
Summer Study on Energy Efficiency in Buildings. 5 Alison Mond, “Beyond SolarCity, Vivint Solar and Sunrun: Who Is Actually Growing in the Residential Solar
Market?” GTM Research. January 10, 2018. https://www.greentechmedia.com/articles/read/beyond-solarcity-
vivint-solar-and-sunrun-residential-solar-market-long-tail#gs.AVYaD=E.
Field Code Changed
Field Code Changed
Field Code Changed
6
2016 and 2017, some mid-sized installers began to develop their own credit facilities,
primarily with regional commercial banks. However, the scale supported by these
arrangements could not match the volumes attributed to the early generation of solar
leases.
Figure 1. Annual Residential PV Installed in the U. S. and Percentage Third-
Party Owned
The Mosaic Solar Loan. Mosaic is a specialized lending company that offers loans to
homeowners for solar PV systems and other home improvements through a network of solar
installers and contractors across the country. The company was founded in 2011 and introduced
its Solar Loan product in 2014. Mosaic developed its solar PV business model specifically to
address the problematic cost structure of first-generation third-party financing for residential
solar PV. The company’s approach incorporated the following features:
• Simplified and streamlined project financing. The transaction with the end customer
is a straightforward consumer loan of up to $100,000, with repayment periods from 10
to 25 years.6 The customer selects the preferred terms and may change repayment
periods to adjust cash flows. There are no pre-payment penalties. Applications and
credit assessments are accomplished online and customers can be approved for loans in
as little as 24 hours.
6 Mosaic has evolved some aspects of its loan products, including available repayment period selections, over time.
0%
10%
20%
30%
40%
50%
60%
70%
0
500
1000
1500
2000
2500
3000
2009 2010 2011 2012 2013 2014 2015 2016 2017 2018(est)
Per
cen
t o
f M
W T
hir
d-P
art
y O
wn
ed
An
nu
al R
esid
enti
al P
V In
sta
lled
(MW
)
MW Installed % Projects Third-Party Owned
Sources: NREL 2018, GTM
7
• Marketing through dealer networks. The Solar Loan product is marketed by the
employees of independent dealers. Over time, Mosaic has recruited over 230 such
companies into its network and trained over 1,800 sales staff to market the product.
• Standardized customer and dealer agreements. Mosaic has standardized its
agreements with end customers and dealers to simplify sales and administration. Some
customization is permitted to accommodate the needs of larger dealers.
• Streamlining of credit facility arrangements. Mosaic has not attempted to package
and sell tax credits and depreciation associated with the solar PV systems it finances,
which reduces legal and accounting complexity and cost. This approach enables the
company to maintain a relatively simple, low-cost credit facility.
As of December 2015, Mosaic was originating $25 to $30 million per month in loans through its
installer network. It had exhausted its initial rounds of funding and required an infusion of
project financing to maintain its rapid growth.
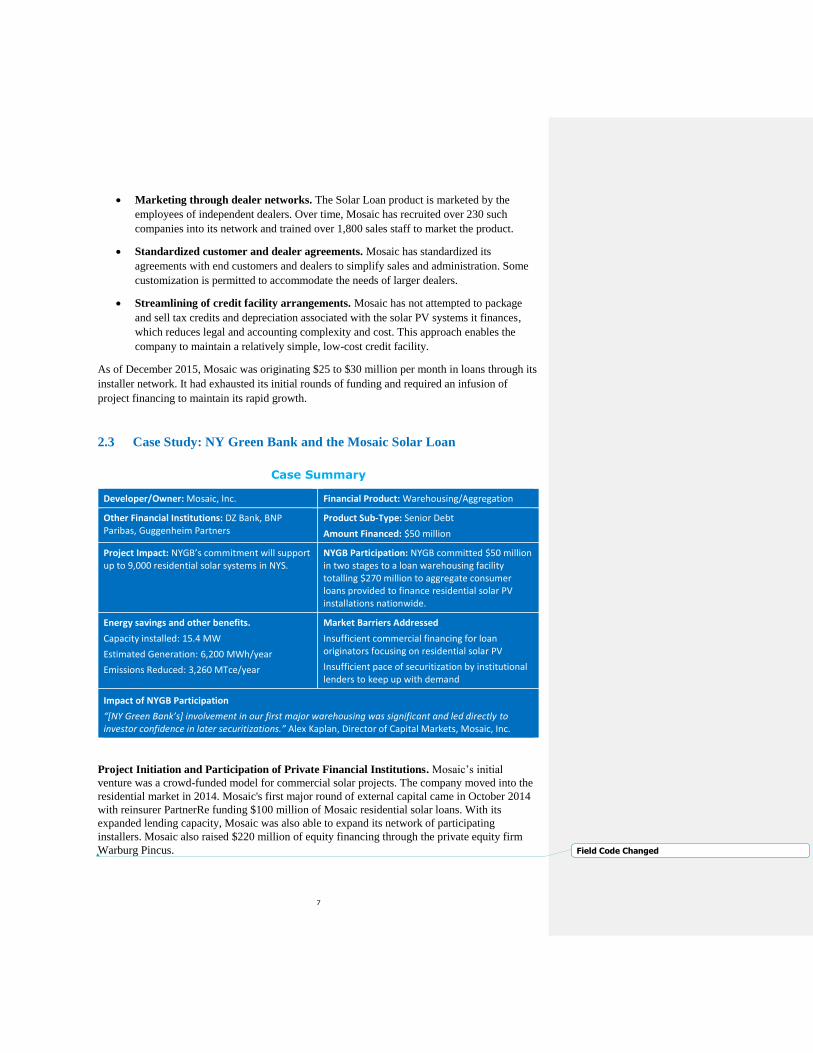
2.3 Case Study: NY Green Bank and the Mosaic Solar Loan
Case Summary
Developer/Owner: Mosaic, Inc. Financial Product: Warehousing/Aggregation
Other Financial Institutions: DZ Bank, BNP Paribas, Guggenheim Partners
Product Sub-Type: Senior Debt
Amount Financed: $50 million
Project Impact: NYGB’s commitment will support up to 9,000 residential solar systems in NYS.
NYGB Participation: NYGB committed $50 million in two stages to a loan warehousing facility totalling $270 million to aggregate consumer loans provided to finance residential solar PV installations nationwide.
Energy savings and other benefits.
Capacity installed: 15.4 MW
Estimated Generation: 6,200 MWh/year
Emissions Reduced: 3,260 MTce/year
Market Barriers Addressed
Insufficient commercial financing for loan originators focusing on residential solar PV
Insufficient pace of securitization by institutional lenders to keep up with demand
Impact of NYGB Participation
“[NY Green Bank’s] involvement in our first major warehousing was significant and led directly to investor confidence in later securitizations.” Alex Kaplan, Director of Capital Markets, Mosaic, Inc.
Project Initiation and Participation of Private Financial Institutions. Mosaic’s initial
venture was a crowd-funded model for commercial solar projects. The company moved into the
residential market in 2014. Mosaic's first major round of external capital came in October 2014
with reinsurer PartnerRe funding $100 million of Mosaic residential solar loans. With its
expanded lending capacity, Mosaic was also able to expand its network of participating
installers. Mosaic also raised $220 million of equity financing through the private equity firm
Warburg Pincus. Field Code Changed
8
Guggenheim Securities, a division of Guggenheim Partners, initiated the proposal to NYGB in
2015 to be an anchor participant in a credit facility for Mosaic that was undersubscribed by
traditional capital sources. NYGB’s initial commitment to the credit facility was $10 million of a
total $110 million, to be used exclusively to fund residential solar projects in NYS. In 2016, the
credit facility was expanded to $240 million; NYGB increased its commitment by an additional
$40 million specifically earmarked for NYS projects. BNP Paribas also joined the credit facility
at that time with a $90 million commitment.
The Credit Facility. The credit facility in which NYGB participated operates as follows:
1. Mosaic originates loans to customers to finance residential solar PV installations
through trained representatives employed by a network of independent solar installers.
2. Through a special purpose entity, Mosaic purchases the receivables created through the
loans, up to a contractually-specified fraction of the loan amount, known as the advance
rate. The remainder of the amount needed to purchase the receivables comes from the
equity of the parent company.7
3. Borrowers pay principal and interest to Mosaic LLC, which in turn pays principal and
interest on the money advanced by the lenders, as well as a return on equity to the parent
company.
Impact of NYGB Participation on Mosaic. According to Alex Kaplan, Director of Capital
Markets at Mosaic’s parent company, NYGB’s participation in Mosaic’s first large warehouse
credit facility helped the company address four critical growth challenges related to financial
markets: funding early growth, scaling operations, attracting new investors into securitized
transactions, and reducing the costs of borrowing. The following summarizes Mr. Kaplan’s
observations on the effect of NYGB’s participation in meeting these challenges:
• Funding early growth. In the year prior to the launch of its first warehouse credit facility in
April 2016, Mosaic had increased its monthly pace of solar loan initiation from $3.2 million
in December 2014 to $25.2 million by November 2015. NYGB was the second financial
institution to commit funds to the credit facility, with an initial tranche of $10 million.
NYGB quickly upsized its commitment by a further $40 million as loan originations gained
pace, which, according to Mr. Kaplan, was instrumental in attracting a third investor to the
initial warehousing facility in July 2016.
• Scaling operations. Mr. Kaplan noted that lending operations supported by this round of
funding enabled Mosaic to extend its dealer networks and improve its IT platforms, which in
turn increased efficiency and Mosaic’s ability to meet its financial obligations:
“NY Green Bank assisted our [efforts to scale operations], so that we had fewer
“foot faults.” We are more efficient now, enjoy greater flexibility, better
systems, which facilitates our scaling up. This is reflected in better execution of
our securitizations, so we can invest more in our business.”
7 The advance rate is an indicator of the lenders’ confidence in the credit of underlying loans. The higher the advance
rate, the more the lenders are exposed to risk of delinquencies or non-payment.

9
• Attracting investors into securitized transactions. In February 2017, Mosaic closed its
first credit-rated securitization for $140 million. The issue earned an “A” credit rating by the
Kroll Bond Rating Agency. This high rating reflected Kroll’s assessment of the quality of
the underlying credit. The issue was five times oversubscribed, meaning Mosaic received
over $700 million in qualified offers to purchase the securities. Between October 2017 and
January 2019, Mosaic issued four securitizations for $310 million, $235 million, $315
million, and $260 million respectively. These issues have attracted the participation of over
50 investors. 8 According to Mr. Kaplan, “That first major warehousing helped assure the
[subsequent securitizations] and facilitate future capital partnerships. We are now working
with lenders and capital providers comfortable with what is no longer a new concept. We no
longer have to explain distributed generation.”
Mr. Kaplan expressed the view that NYGB’s participation in the first major warehousing
facility was decisive in helping to attract other capital partners to subsequent securitizations.
For example, when asked about his satisfaction with NYGB’s role, Mr Kaplan reported:
“Yes, their involvement in [Mosaic’s] first major warehousing was significant and led to
investor confidence in later securitizations. NYGB led to involvement of other warehouse
lenders.”
• Reducing borrowing costs. Interest rates charged to Mosaic decreased continuously from
the first credit facility through the subsequent three securitizations. According to Mr.
Kaplan, “These lower interest costs enable us to invest more in our business and is a
reflection of investor confidence in our business due to our performance history. With our
better execution comes also a larger investor base.”
8 Allison Mond, 2017.’Solar securitizations expected to pass $1 billion in 2017”. Greentech Media. November 2017
https://www.greentechmedia.com/articles/read/solar-securitizations-expected-to-pass-1-billion-in-
2017#gs.QLp8fINu. Field Code Changed
10
2.4 Assessment of Market Effects
Working with NYGB, NYSERDA staff developed an evaluation approach designed to assess the
influence of NYGB’s early activities on the following NYS clean energy market characteristics:
1. Knowledge of and confidence in clean energy investments among financial institutions;
2. Number and type of financial institutions active in clean energy markets;
3. Availability of favorable terms in financing offered to clean energy projects and
companies;
4. Pace of clean energy project deployment; and
5. Volume of clean energy project financing.
DNV GL evaluated 14 indicators that NYSERDA expected to reflect the five clean energy
finance market characteristics listed above.9 Through the Mosaic case study, DNV GL identified
evidence of NYGB’s effect on six of the market indicators, as summarized in Table 1 above and
described in this section in greater detail.
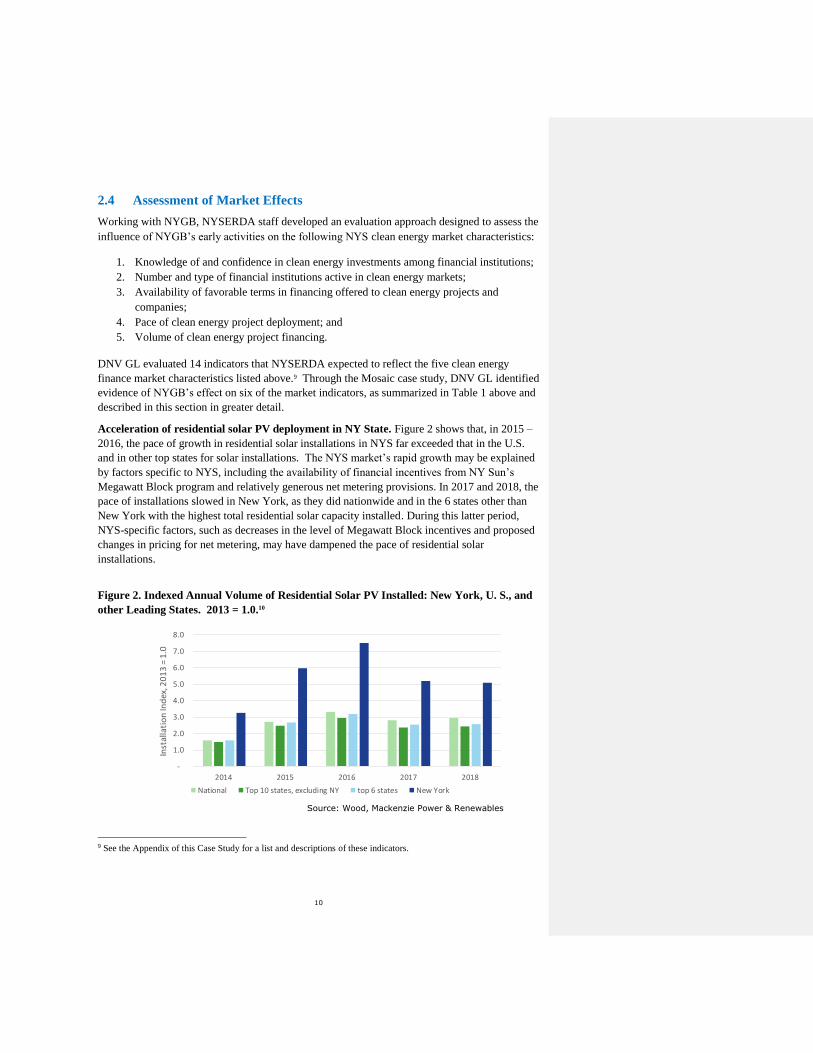
Acceleration of residential solar PV deployment in NY State. Figure 2 shows that, in 2015 –
2016, the pace of growth in residential solar installations in NYS far exceeded that in the U.S.
and in other top states for solar installations. The NYS market’s rapid growth may be explained
by factors specific to NYS, including the availability of financial incentives from NY Sun’s
Megawatt Block program and relatively generous net metering provisions. In 2017 and 2018, the
pace of installations slowed in New York, as they did nationwide and in the 6 states other than
New York with the highest total residential solar capacity installed. During this latter period,
NYS-specific factors, such as decreases in the level of Megawatt Block incentives and proposed
changes in pricing for net metering, may have dampened the pace of residential solar
installations.
Figure 2. Indexed Annual Volume of Residential Solar PV Installed: New York, U. S., and
other Leading States. 2013 = 1.0.10
9 See the Appendix of this Case Study for a list and descriptions of these indicators.
-
1.0
2.0
3.0
4.0
5.0
6.0
7.0
8.0
2014 2015 2016 2017 2018
Inst
alla
tio
n In
dex
, 20
13
= 1
.0
Annual Residential Solar PV Capacity Installed
National Top 10 states, excluding NY top 6 states New York
Source: Wood, Mackenzie Power & Renewables
11
NYGB closed its first transactions with residential solar installers in Q4 2015. Between early
2016 and the end of 2018, firms financed by NYGB installed or financed 186 MW or 38% of
total residential solar PV capacity installed in NYS.11
There were many other economic influences at work on the residential solar market in New
York during the period under review.
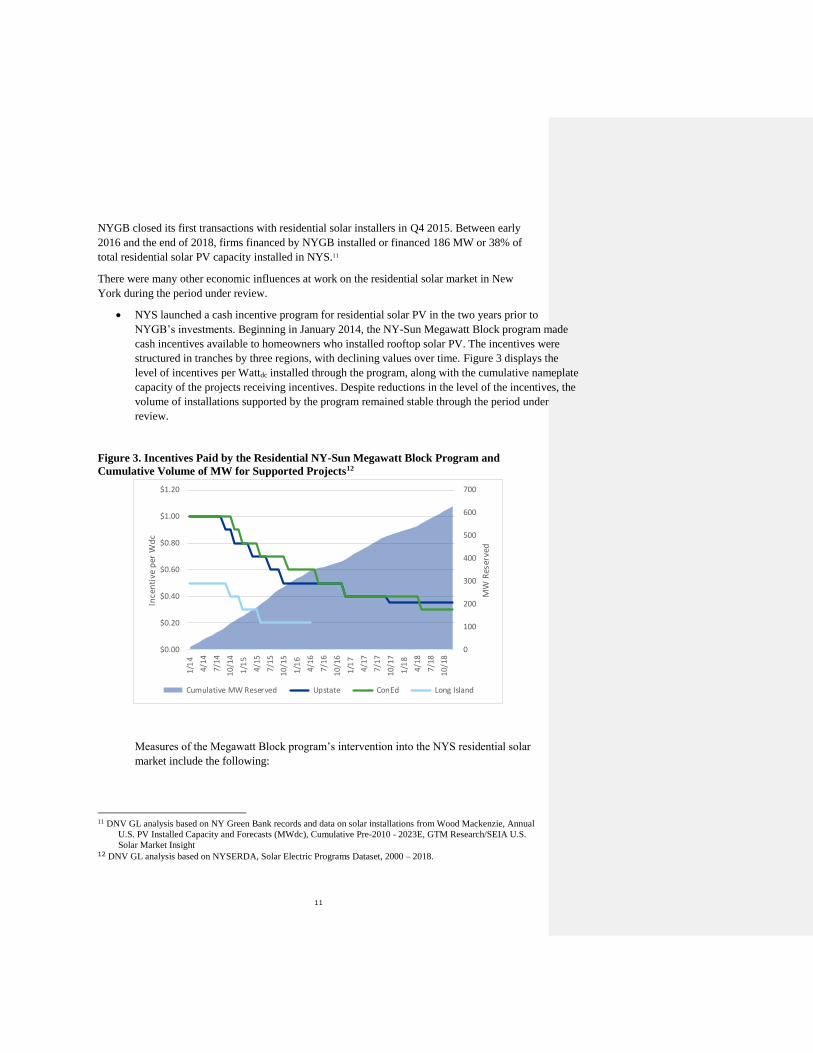
• NYS launched a cash incentive program for residential solar PV in the two years prior to
NYGB’s investments. Beginning in January 2014, the NY-Sun Megawatt Block program made
cash incentives available to homeowners who installed rooftop solar PV. The incentives were
structured in tranches by three regions, with declining values over time. Figure 3 displays the
level of incentives per Wattdc installed through the program, along with the cumulative nameplate
capacity of the projects receiving incentives. Despite reductions in the level of the incentives, the
volume of installations supported by the program remained stable through the period under
review.
Figure 3. Incentives Paid by the Residential NY-Sun Megawatt Block Program and
Cumulative Volume of MW for Supported Projects12
Measures of the Megawatt Block program’s intervention into the NYS residential solar
market include the following:
11 DNV GL analysis based on NY Green Bank records and data on solar installations from Wood Mackenzie, Annual
U.S. PV Installed Capacity and Forecasts (MWdc), Cumulative Pre-2010 - 2023E, GTM Research/SEIA U.S.
Solar Market Insight 12 DNV GL analysis based on NYSERDA, Solar Electric Programs Dataset, 2000 – 2018.
0
100
200
300
400
500
600
700
$0.00
$0.20
$0.40
$0.60
$0.80
$1.00
$1.20
1/1
4
4/1
4
7/1
4
10
/14
1/1
5
4/1
5
7/1
5
10
/15
1/1
6
4/1
6
7/1
6
10
/16
1/1
7
4/1
7
7/1
7
10
/17
1/1
8
4/1
8
7/1
8
10
/18
MW
Res
erve
d
Ince
nti
ve p
er W
dc
Cumulative MW Reserved Upstate ConEd Long Island
12
o NY-Sun paid out $152 million in incentives for residential projects during the Study
Period v. $282 million in investments in residential solar financing vehicles from
NYGB. Not all of these investments were deployed in NYS.
o The value of residential projects that received NY Sun incentives during the study
period was $1.75 billion v. $566 million for NYGB investments.
o NY-Sun incentives are limited and decrease in terms of $/watt over time, providing
customers with some urgency to act.
o Between 2014 and 2018, the Megawatt Block program paid incentives for 85% of
the total residential capacity installed in NYS.
• Uncertainty over net metering regime. Through a process initiated in 2015, the New
York Public Service Commission (“PSC”) significantly revised the State’s net metering
rules and pricing. These changes were summarized in a decision dated March 2017 and
implemented in an order dated September 2017.13 Most residential customers will
remain eligible for net metering through 2020. However, the uncertainty over the
outcome of the proceeding may have deterred some potential customers from installing
solar PV systems on their homes. Also, given that the pay-back periods of rooftop solar
systems are more than just a few years, uncertainty around the post-2020 economic
situation would also be expected to have a chilling effect until the succeeding principles
of the Value of Distributed Energy Resources (“VDER”) are well-understood in NYS.
The evidence of NYGB’s influence on the volume of residential solar PV installed in New York
during the Study Period was thus mixed.
Evolution of more favorable financing terms for developers. During the period 2015 to 2018,
several factors drove a reduction in borrowing costs for developers. These included:
• Decrease in interest rates. Nominal interest rates charged to all borrowers increased
over the period 2015 – 2018 as the recovery from the 2008 recession proceeded.
However, the spread charged above the benchmark LIBOR rate at which banks borrow
money decreased over that period for residential solar securitizations. According to
Keith Martin, project finance attorney at Norton Rose Fulbright LLP, the spread for
seven-year bank loans was 135 basis points (1.35%) in April 2018 versus an average of
200 basis points a year earlier. Construction loan rates also decreased.14
• Increase in the advance rate. The advance rate is the share of project financing
provided by investors in a securitization versus by the loan originator. The higher the
advance rate, the greater the share of risk assumed by the investors. The average
advance rate on securitizations increased from 62% in 2013 to 80% in 2017 and 2018.15
13 State of New York Public Service Commission. Order on Phase One Value of Distributed Energy Resources
Implementation Proposals, Cost Mitigation Issues, and Related Matters. Case 15E-0751 – In the Matter of the
Value of Distributed Energy Resources. September 14, 2017. 14 Brian Eckhouse, “Banks are Sweetening Their Terms for Solar as Confidence Rises”. Bloomberg New Energy
Media. April 19, 2018. 15 David Feldman and Paul Schwabe. Terms Trends and Insights on PV Project Finance in the United States, 2018.
National Renewable Energy Laboratory.

13
These trends in interest and advance rates suggest increased investor knowledge of, and
confidence in, the residential solar asset class.
Replication of financing arrangements. As discussed above, Mosaic’s approach to solar
lending reduced customer acquisition and transaction costs associated with financing residential
PV projects. As of the second half of 2018, loans had overtaken leases and PPAs as the most
frequently used approach to financing residential solar installations nationwide. Figure 4 shows
market share for the largest companies engaged in significant lending activity in the first half of
2018. All of these companies began offering loans after Mosaic launched its solar loan product,
and Mosaic remains the largest player in the market, with a 14% nationwide share.
Figure 4. Residential Solar Market Shares by Ownership Type and Issuer: Percentage of
Total Capacity Installed, First and Second Quarters 201816
16 John Weaver, “Cash is king in residential solar, long live the lease”, PV Magazine, November 14, 2018, https://pv-
magazine-usa.com/2018/11/14/cash-is-king-in-residential-solar-long-live-the-lease/.
Sunrun
Vivint
Sunpower
Sunnova
Tes la/Solar Ci ty
Spruce Finance
Al l others
Al l others
Solar Loans
Leases/PPAs
Cash (including PACE & bank loans direct to
consumers)
Mosaic
Dividend Finance
Sunl ight Finance
Loan Pal
Greensky Credit
Sungage Financial
Enerbank
0%
10%
20%
30%
40%
50%
60%
70%
80%
90%
100%
Leases/PPAs Residential Market Loans
14
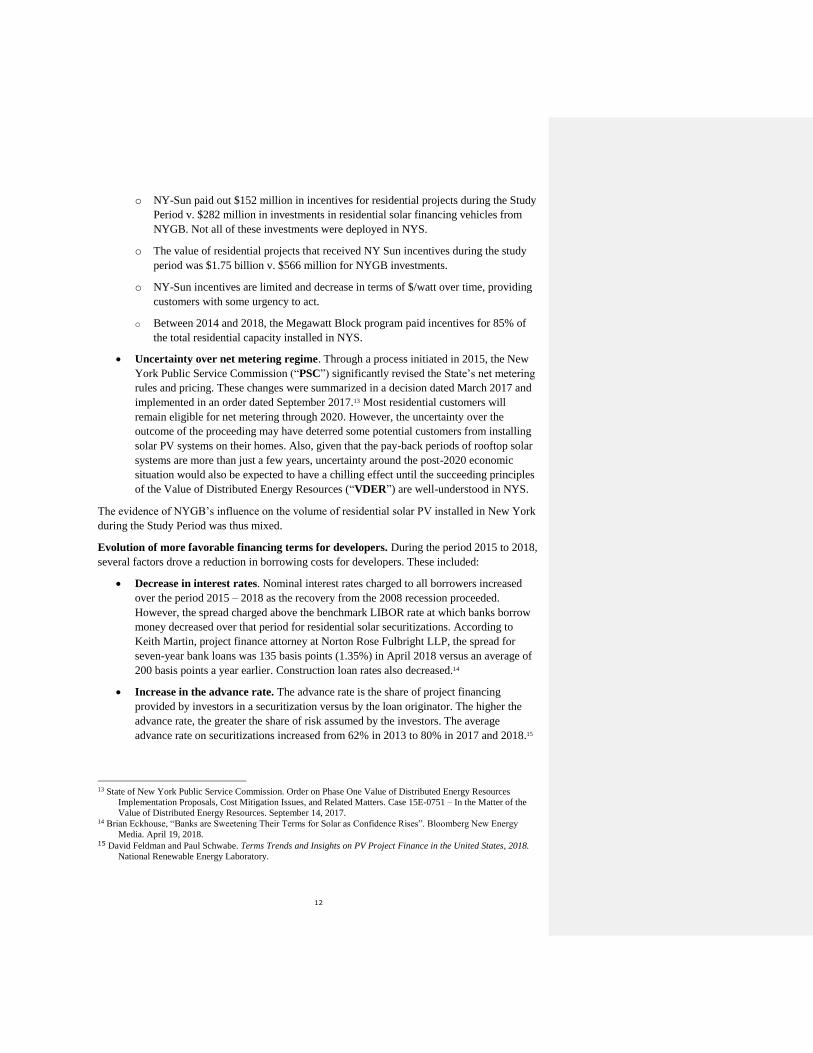
Increase in the scale and volume of residential solar loan aggregations. Figure 4 presents the
growth of residential solar aggregation transactions between 2013 and 2018. Solar loan products
drove the increase from $250 million in 2016 to $2.6 billion in 2018. Mosaic accounted for
nearly 40% of the volume of residential solar securitizations in 2017 and 2018.
Figure 4. Annual Residential Solar Securitizations by Number, Volume, and Asset Type
Increased number of financial firms in the market. The increase in the number of financial
institutions participating in Mosaic securitizations is consistent with industry trends. Financial
officers participating in the August 2017 Wall Street Renewable Energy Finance Forum reported
that the number of financial institutions participating in such transactions had increased from
roughly a dozen in 2015 to 40 – 50 at the time of the forum.17
Conclusion. NYGB provided capital to Mosaic at a critical juncture early in the development of
its business model. NYGB was one of only two participants in the first major warehouse credit
facility. The systems, experience, and volume Mosaic built using the credit facility enabled the
company to complete over $1 billion in securitized financing of its project receivables over the
subsequent two years. Since issuing its first securitization in early 2017, Mosaic has completed
the largest share of residential solar securitizations of any issuer in the market – about 40%.
According to a key Mosaic executive, NYGB’s participation in the early stages of the
development of Mosaic solar loans contributed significantly to the success of the product.
There is strong evidence that the success of the initial credit facility in which NYGB played a
key role influenced the development of the residential solar market. In addition to trends in the
17 Keith Martin. Proceedings of the 2017 Wall Street Renewable Energy Finance Forum, Norton Rose Fulbright LLP.
0
1
2
3
4
5
6
7
8
9
0
500
1000
1500
2000
2500
3000
2013 2014 2015 2016 2017 2018
# o
f Se
curi
tiza
tio
ns
Issu
ed/Y
ear
$ M
M
Res Leases/PPAs Non-Res Res Loans NumberSource: PV Magazine, Greentech Media
15
volume of securitizations, numbers of institutional investors participating, and advance rates and
interest rates, several other companies, including Dividend Finance and Vivint have adopted
elements of this model and financing strategy.
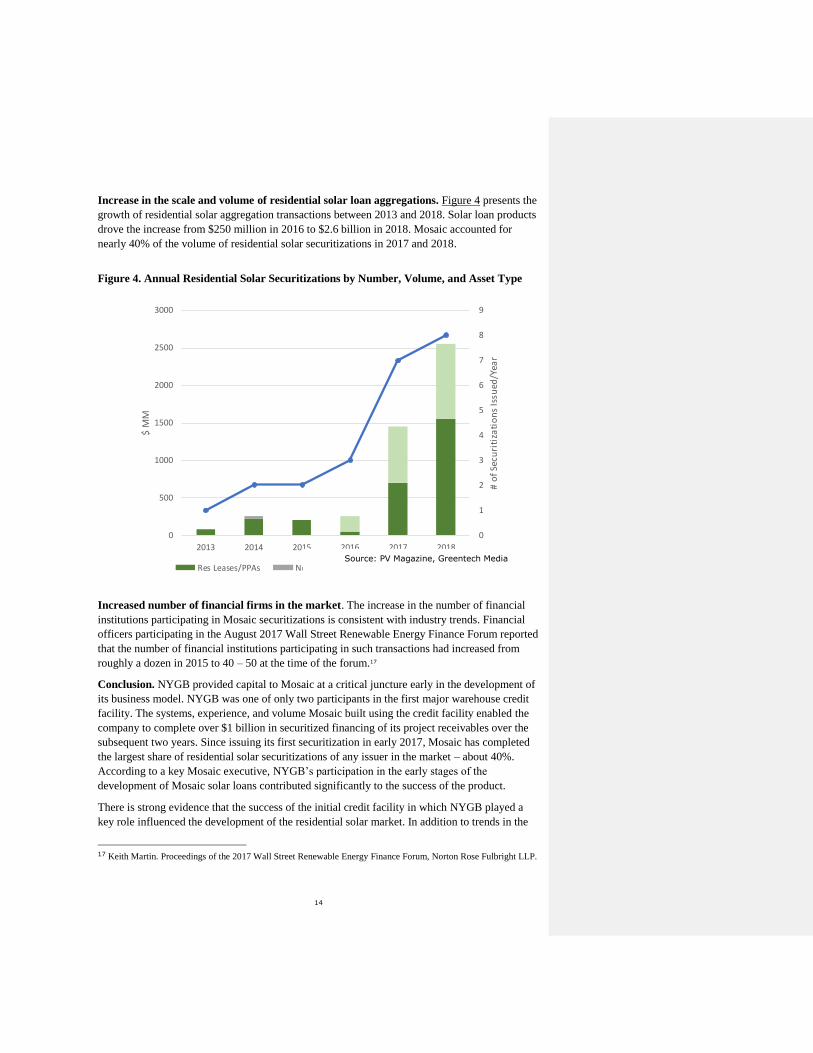
According to Alex Kaplan, Director of Capital Markets Mosaic, Inc:
“There is now widespread acceptance of solar among capital providers, a night
and day difference from my days [in the industry] in 2013. Now Mosaic, with
the help of NY Green Bank, has paved the way for the industry. There is an
entire ecosystem that benefits everyone.”
16
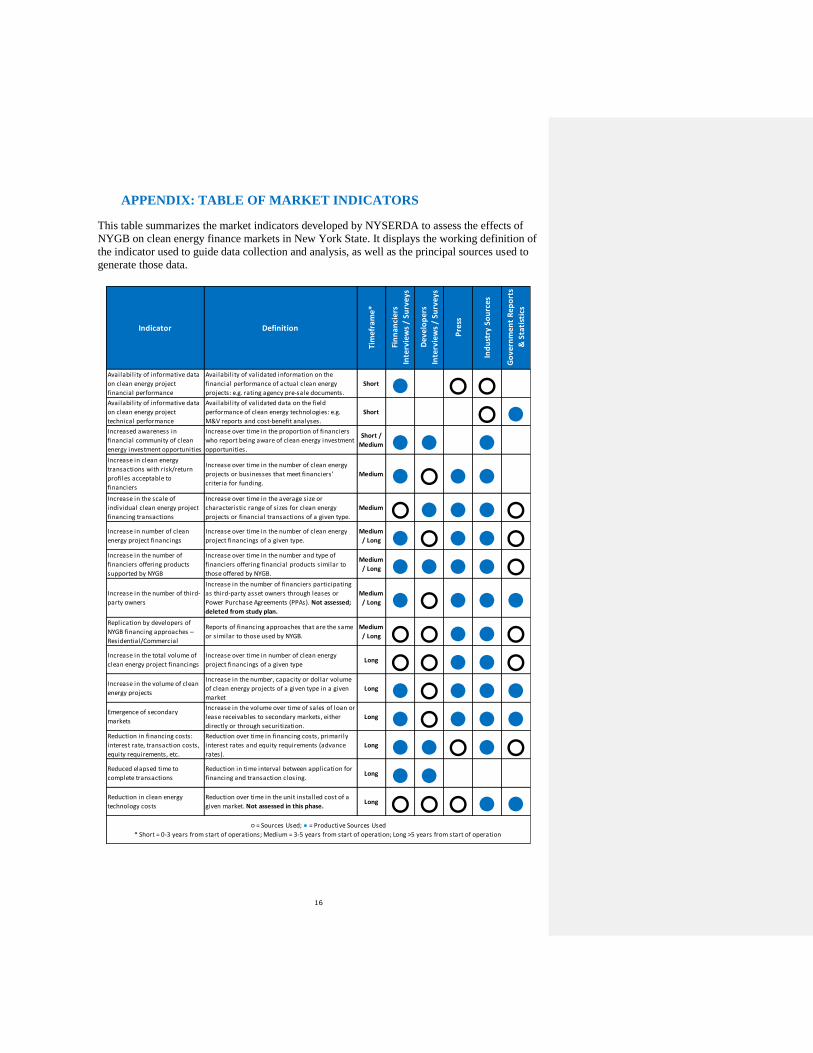
APPENDIX: TABLE OF MARKET INDICATORS
This table summarizes the market indicators developed by NYSERDA to assess the effects of
NYGB on clean energy finance markets in New York State. It displays the working definition of
the indicator used to guide data collection and analysis, as well as the principal sources used to
generate those data.
Indicator Definition
Tim
efr
ame
*
Fin
nan
cie
rs
Inte
rvie
ws
/ Su
rve
ys
De
velo
pe
rs
Inte
rvie
ws
/ Su
rve
ys
Pre
ss
Ind
ust
ry S
ou
rce
s
Go
vern
me
nt
Re
po
rts
& S
tati
stic
s
Availability of informative data
on clean energy project
financial performance
Availability of validated information on the
financial performance of actual clean energy
projects: e.g. rating agency pre-sale documents.
Short ● ○ ○Availability of informative data
on clean energy project
technical performance
Availability of validated data on the field
performance of clean energy technologies: e.g.
M&V reports and cost-benefit analyses.
Short ○ ●Increased awareness in
financial community of clean
energy investment opportunities
Increase over time in the proportion of financiers
who report being aware of clean energy investment
opportunities.
Short /
Medium ● ● ●Increase in clean energy
transactions with risk/return
profiles acceptable to
financiers
Increase over time in the number of clean energy
projects or businesses that meet financiers’
criteria for funding.
Medium ● ○ ● ●Increase in the scale of
individual clean energy project
financing transactions
Increase over time in the average size or
characteristic range of sizes for clean energy
projects or financial transactions of a given type.
Medium ○ ● ● ● ○Increase in number of clean
energy project financings
Increase over time in the number of clean energy
project financings of a given type.
Medium
/ Long ● ○ ● ● ○Increase in the number of
financiers offering products
supported by NYGB
Increase over time in the number and type of
financiers offering financial products similar to
those offered by NYGB.
Medium
/ Long ● ● ● ● ○Increase in the number of third-
party owners
Increase in the number of financiers participating
as third-party asset owners through leases or
Power Purchase Agreements (PPAs). Not assessed;
deleted from study plan.
Medium
/ Long ● ○ ● ● ●Replication by developers of
NYGB financing approaches –
Residential/Commercial
Reports of financing approaches that are the same
or similar to those used by NYGB.
Medium
/ Long ○ ○ ● ● ○Increase in the total volume of
clean energy project financings
Increase over time in number of clean energy
project financings of a given typeLong ○ ○ ● ● ○
Increase in the volume of clean
energy projects
Increase in the number, capacity or dollar volume
of clean energy projects of a given type in a given
market
Long ● ○ ● ● ●Emergence of secondary
markets
Increase in the volume over time of sales of loan or
lease receivables to secondary markets, either
directly or through securitization.
Long ● ○ ● ● ●Reduction in financing costs:
interest rate, transaction costs,
equity requirements, etc.
Reduction over time in financing costs, primarily
interest rates and equity requirements (advance
rates).
Long ● ● ○ ● ○Reduced elapsed time to
complete transactions
Reduction in time interval between application for
financing and transaction closing.Long ● ●
Reduction in clean energy
technology costs
Reduction over time in the unit installed cost of a
given market. Not assessed in this phase.Long ○ ○ ○ ● ●
○ = Sources Used; ● = Productive Sources Used
* Short = 0-3 years from start of operations; Medium = 3-5 years from start of operation; Long >5 years from start of operation