Embed Size (px)
Citation preview

Nyack College
Master of Business Administration
Submitted to: Professor Joseph Reid
Submitted by: Christopher Knott-Craig
110 W. 76th
Street Apt BR
NY, NY 10023
Work Phone: 310-923-5975
Home/Cell Phone: 310-923-5975
Email: [email protected]
Course Location: NCMC
Submission Date: September 30, 2015
Capstone Project Title:
EZESOFT DUBAI
CERTIFICATE OF AUTHORSHIP: I certify that I am the author of this paper and that any assistance I receive in its preparation is fully
acknowledged and disclosed in this paper. I have also cited any sources from which I used data,
ideas, or works, either quoted directly or paraphrased. I also certify that this paper was prepared by
me specifically for this course.
Student’s E-Signature:
Invalid signature
X Christopher Knott-Craig
Christopher Knott-Craig
Associate Director of Consulting
Signed by: [email protected]
Adviser’s Comments:

1
EzeSoft Dubai – A Business Proposal
September 2015
EzeSoft Dubai
Christopher Knott-Craig
A Capstone Research Project
Submitted in partial fulfillment
of the requirements for the degree
Master in Business Administration
School of Business and Leadership
Nyack College
September 30, 2015
Capstone Project Committee:
Dr. Gerard Becker, MBA Director
Professor Joseph Reid, Capstone Advisor
2
EzeSoft Dubai – A Business Proposal
September 2015
Table of Contents
Executive Summary ................................................................................................................ 6
Mission, Vision, Core Values ................................................................................................ 7
EzeSoft Mission Statement ......................................................................................... 7
EzeSoft Vision Statement ........................................................................................... 7
EzeSoft Principles ....................................................................................................... 8
EzeSoft Dubai Core Values ........................................................................................ 9
Industry and Proposed Company ............................................................................................ 10
Competitive Advantage .............................................................................................. 11
Complexity .................................................................................................................. 12
PEST Analysis ............................................................................................................ 12
Products and Services ............................................................................................................ 14
Product Description ................................................................................................... 14
Differentiation ............................................................................................................. 15
Product Delivery ......................................................................................................... 15
Potential Obstacles ...................................................................................................... 16
Future Growth ............................................................................................................. 16
Market Analysis ...................................................................................................................... 17
Market Size ................................................................................................................. 17
Growth Trends ............................................................................................................ 19
Economics of the Business ..................................................................................................... 20
Break-Even ................................................................................................................. 21
Competitor Intrusion ................................................................................................... 21

3
EzeSoft Dubai – A Business Proposal
September 2015
Marketing Plan ........................................................................................................................ 22
Strategic Partnership ................................................................................................... 22
Value Proposition............................................................................................ 23
Local Market Knowledge ............................................................................... 23
Direct Access to Customers ............................................................................ 23
Promotional Strategy .................................................................................................. 25
Brand Awareness ............................................................................................ 25
Client Prospecting ........................................................................................... 26
Decision to Purchase ....................................................................................... 26
Promotional Budget ........................................................................................ 27
Design and Development Plan ................................................................................................ 28
Manufacturing and Operations Plan ....................................................................................... 29
Location ...................................................................................................................... 29
Alignment ................................................................................................................... 31
Performance and Productivity ..................................................................................... 31
Profitability ..................................................................................................... 32
Customer Satisfaction ..................................................................................... 32
Consulting Return on Investment ................................................................... 33
Transparency ............................................................................................................... 34
Management Team.................................................................................................................. 36
Hiring .......................................................................................................................... 36
Reporting Structure ..................................................................................................... 37
4
EzeSoft Dubai – A Business Proposal
September 2015
Compensation and Benefits ........................................................................................ 37
Unexpected Departures ............................................................................................... 38
Overall Schedule ..................................................................................................................... 39
Phase 0: Ramp-Up ...................................................................................................... 39
Phase I: Go-Live ........................................................................................................ 40
Phase II: Growth Strategy ........................................................................................... 40
Critical Risks, Problems and Assumptions ............................................................................. 41
Internal Risks .............................................................................................................. 41
External Risks ............................................................................................................. 42
The Financial Plan .................................................................................................................. 44
Sales Forecasts ............................................................................................................ 44
Operating Costs ........................................................................................................... 46
Cash Flow Analysis .................................................................................................... 47
Profitability ................................................................................................................. 48
Proposed Funding Requirements ............................................................................................ 49
References ............................................................................................................................... 50
Appendix A ............................................................................................................................. 53
Appendix B ............................................................................................................................. 54
Appendix C ............................................................................................................................. 55
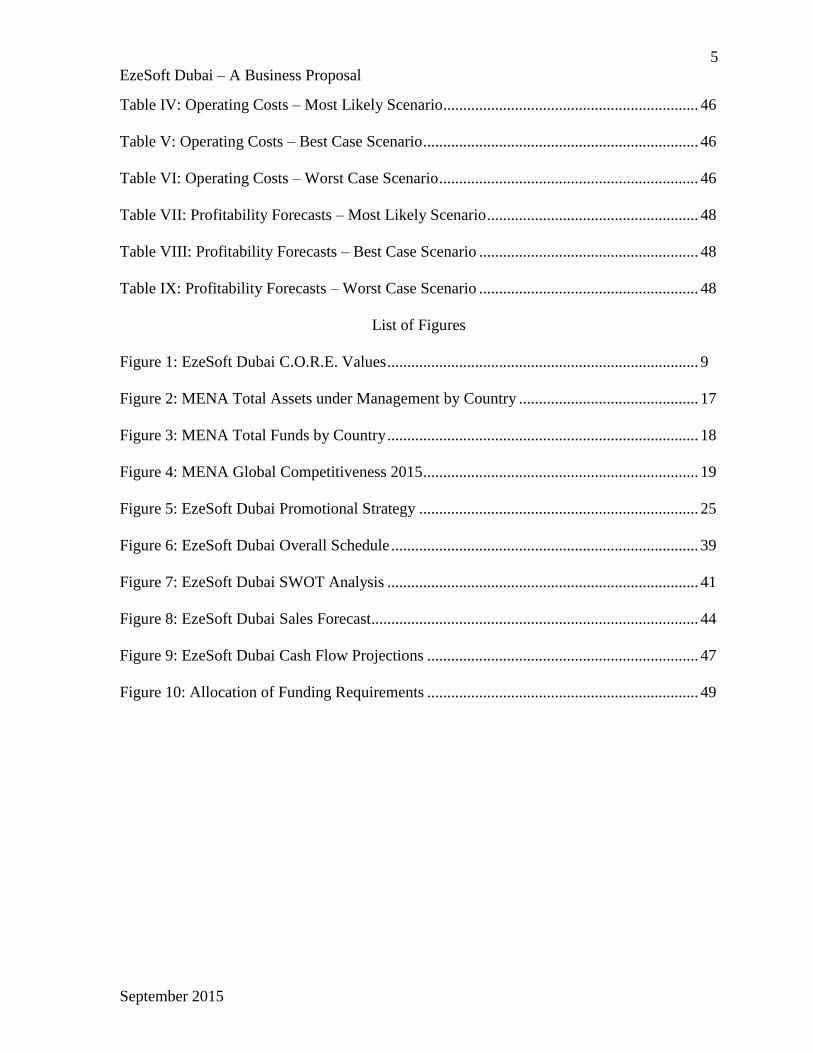
List of Tables
Table I: EzeSoft Company Principles ..................................................................................... 8
Table II: EzeSoft Corporate Pricing Policy ............................................................................ 22
Table III: EzeSoft Dubai Promotional Budget ........................................................................ 27
5
EzeSoft Dubai – A Business Proposal
September 2015
Table IV: Operating Costs – Most Likely Scenario ................................................................ 46
Table V: Operating Costs – Best Case Scenario ..................................................................... 46
Table VI: Operating Costs – Worst Case Scenario ................................................................. 46
Table VII: Profitability Forecasts – Most Likely Scenario ..................................................... 48
Table VIII: Profitability Forecasts – Best Case Scenario ....................................................... 48
Table IX: Profitability Forecasts – Worst Case Scenario ....................................................... 48
List of Figures
Figure 1: EzeSoft Dubai C.O.R.E. Values .............................................................................. 9
Figure 2: MENA Total Assets under Management by Country ............................................. 17
Figure 3: MENA Total Funds by Country .............................................................................. 18
Figure 4: MENA Global Competitiveness 2015 ..................................................................... 19
Figure 5: EzeSoft Dubai Promotional Strategy ...................................................................... 25
Figure 6: EzeSoft Dubai Overall Schedule ............................................................................. 39
Figure 7: EzeSoft Dubai SWOT Analysis .............................................................................. 41
Figure 8: EzeSoft Dubai Sales Forecast.................................................................................. 44
Figure 9: EzeSoft Dubai Cash Flow Projections .................................................................... 47
Figure 10: Allocation of Funding Requirements .................................................................... 49

6
EzeSoft Dubai – A Business Proposal
September 2015
Executive Summary
The Eze Software Group is entering an exciting and challenging new era of growth
marked by revenue and earnings goals for each of the next five years. This aggressive growth
strategy has spawned several, separate top-down initiatives stretching the short, medium, and
long-term with varying levels of success. With the increasingly competitive landscape in
EzeSoft’s primary markets of New York, London and Hong Kong, the firm has already
decided to pivot on the highly anticipated migration from on-premise to cloud-based
architecture in favor of alternative strategies requiring less time and fewer resources.
In order to achieve the ambitious growth, the firm should explore new geographic
markets as a potential for capturing additional market share and generating sustainable new
revenue streams. Ideal opportunities would only require limited planning and oversight from
senior management and the executive committee given their focus on large-scale initiatives
underway.
Such an opportunity can be created by expanding into the rapidly-growing United
Arab Emirates market and launching a new regional branch office in the Dubai International
Financial Centre. The manageable risks are easily justified by the impact of establishing a
strong foothold in this developing yet unchallenged market. With less than 1% of the 2016
R&D budget, EzeSoft Dubai will be operational by January 1, 2016, with a 9-month break-
even and 35% operating margins at the end of the three-year period including repayment of
startup funding.

7
EzeSoft Dubai – A Business Proposal
September 2015
Mission, Vision, Core Values
The Dubai regional office (EzeSoft Dubai) will embody the corporate mission, vision
and guiding principles of the Eze Software Group to ensure alignment with the company’s
culture and values.
EzeSoft Mission Statement
The corporate mission of the Eze Software Group is to “be a partner, not a vendor”.
EzeSoft Dubai will also strive for meaningful, lasting customer relationships by partnering
alongside every client to deliver inspiration, efficiency and opportunity through exceptional
products, services and experiences.
EzeSoft Vision Statement
The corporate vision of the Eze Software Group is “to be a leading global technology-
enabled solution provider for the financial services industry’s entire investment lifecycle.”
EzeSoft Dubai will embrace the same corporate vision is to become the unanimous global
leader in financial service technologies by fostering enduring, transformative growth at the
individual, team and organizational levels.
8
EzeSoft Dubai – A Business Proposal
September 2015
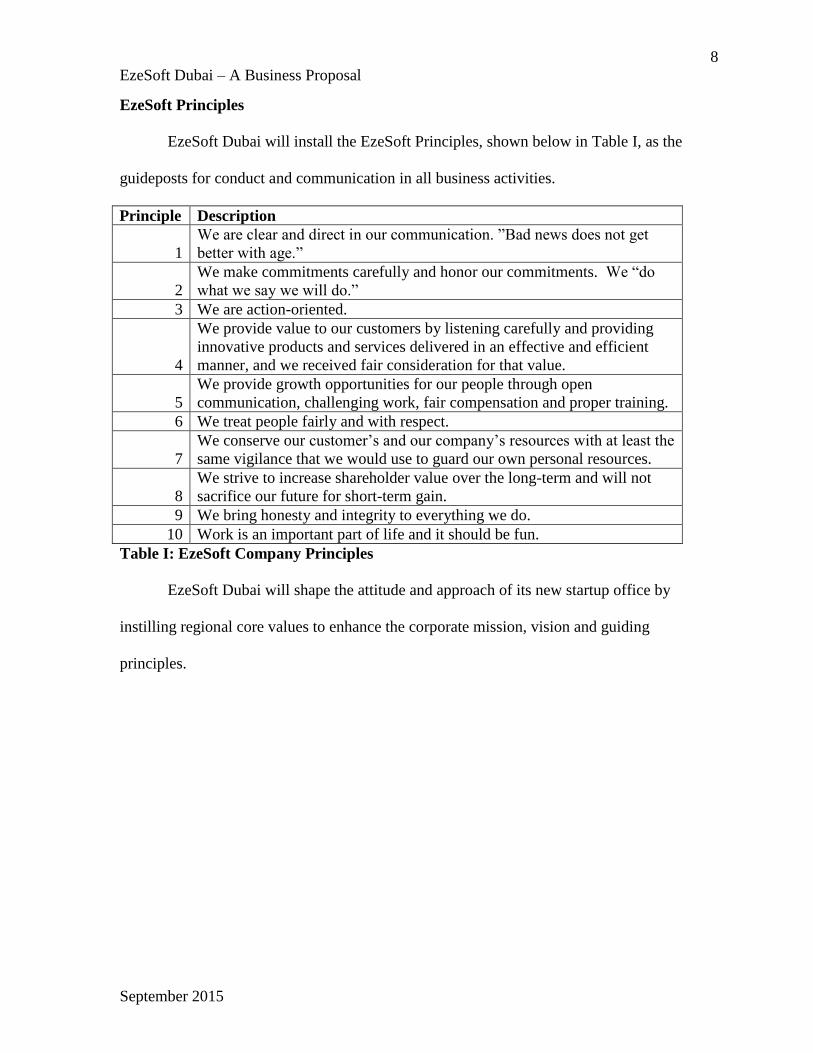
EzeSoft Principles
EzeSoft Dubai will install the EzeSoft Principles, shown below in Table I, as the
guideposts for conduct and communication in all business activities.
Principle Description
1
We are clear and direct in our communication. ”Bad news does not get
better with age.”
2
We make commitments carefully and honor our commitments. We “do
what we say we will do.”
3 We are action-oriented.
4
We provide value to our customers by listening carefully and providing
innovative products and services delivered in an effective and efficient
manner, and we received fair consideration for that value.
5
We provide growth opportunities for our people through open
communication, challenging work, fair compensation and proper training.
6 We treat people fairly and with respect.
7
We conserve our customer’s and our company’s resources with at least the
same vigilance that we would use to guard our own personal resources.
8
We strive to increase shareholder value over the long-term and will not
sacrifice our future for short-term gain.
9 We bring honesty and integrity to everything we do.
10 Work is an important part of life and it should be fun.
Table I: EzeSoft Company Principles
EzeSoft Dubai will shape the attitude and approach of its new startup office by
instilling regional core values to enhance the corporate mission, vision and guiding
principles.
9
EzeSoft Dubai – A Business Proposal
September 2015
EzeSoft Dubai Core Values
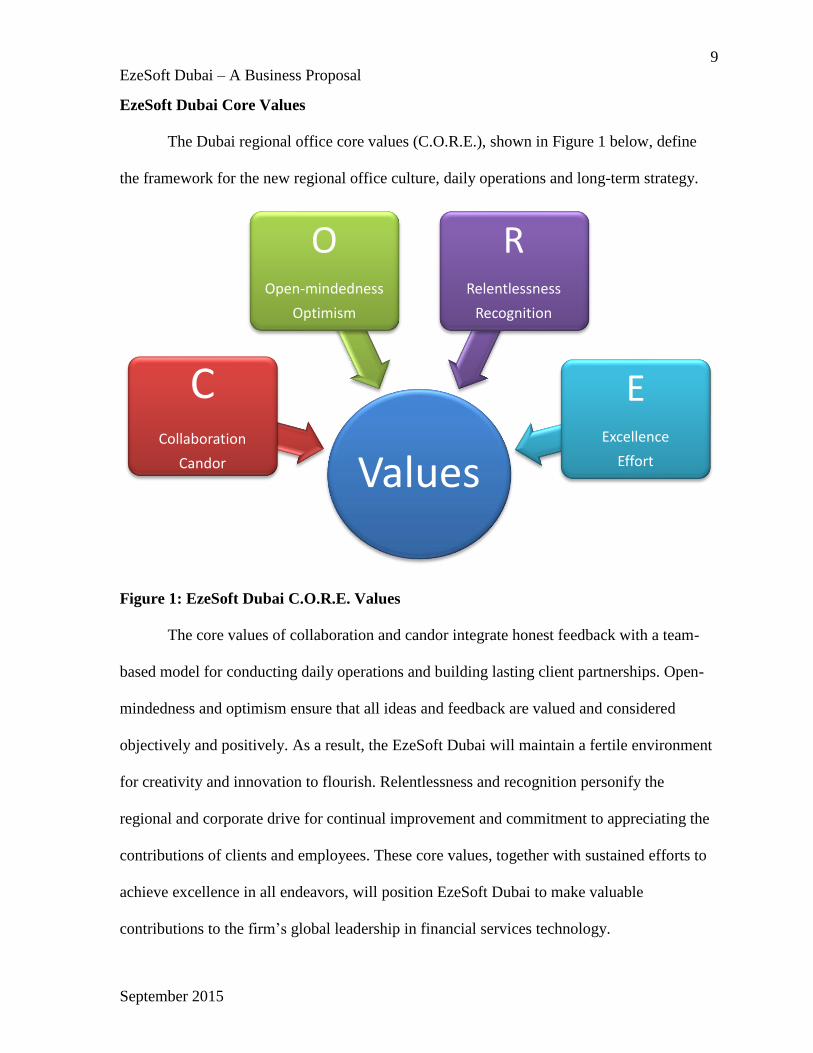
The Dubai regional office core values (C.O.R.E.), shown in Figure 1 below, define
the framework for the new regional office culture, daily operations and long-term strategy.
Figure 1: EzeSoft Dubai C.O.R.E. Values
The core values of collaboration and candor integrate honest feedback with a team-
based model for conducting daily operations and building lasting client partnerships. Open-
mindedness and optimism ensure that all ideas and feedback are valued and considered
objectively and positively. As a result, the EzeSoft Dubai will maintain a fertile environment
for creativity and innovation to flourish. Relentlessness and recognition personify the
regional and corporate drive for continual improvement and commitment to appreciating the
contributions of clients and employees. These core values, together with sustained efforts to
achieve excellence in all endeavors, will position EzeSoft Dubai to make valuable
contributions to the firm’s global leadership in financial services technology.
Values
C Collaboration
Candor
O Open-mindedness
Optimism
R Relentlessness
Recognition
E Excellence
Effort

10
EzeSoft Dubai – A Business Proposal
September 2015
Industry and Proposed Company
In a recent study, Price Waterhouse Cooper estimated that as of 2012 the global
investment management industry managed a total of $64 trillion across pension funds,
mutual funds, insurance funds, alternative funds and wealth funds (Shooler, 2014). Further
analysis by Boston Consulting Group estimated that global assets under management
increased to $68.7 trillion in 2013, with similar increases in operating margins from 37% in
2012 to 39% in 2013 (Bartletta et al., 2014). General market sentiments agree that similar
increases can be expected in the assets under global investment management over the next 10
years. Furthermore, hedge fund participation in stock markets has accelerated considerably
over the last decade (Bianchi & Drew, 2010). Recent data from Hedge Fund Research
illustrates that total assets under management (AUM) have expanded to a record USD2.85trn,
with inflows of $71.2 billion into the largest number of active hedge funds (10,119) since the
initial onset of the global financial crisis in 2007. (Corporate Financing Week, Feb 2015).
With both fund inflows and the total number of funds on the rise, hedge fund AUM is
expected to reach a record high by year-end (2015).
The Eze Software Group is already well-positioned to benefit from this forecasted
growth in the firm’s established and emerging regional offices; however, stiff competition in
the primary markets in U.S. and Europe have required sales teams to become more
aggressive on pricing, reducing margins on new client sales. EzeSoft has recognized the
potential for additional revenue streams by strategically deploying local resources in
underserviced geographic regions with heightened growth expectations.
EzeSoft’s detailed internal market analysis revealed the United Arab Emirates (UAE)
as one of the strongest candidates for a new regional office, with over $80 billion in assets

11
EzeSoft Dubai – A Business Proposal
September 2015
under management and a greater concentration of funds – approximately 140 – than any
other nation in the Middle East (Eze Software Group, 2014). Additionally, the UAE boasts
over $600 billion in sovereign wealth fund assets available to invest in local hedge funds
(Research Monitor, 2015). Several Middle East and North Africa (MENA) industry experts
oblige that the UAE can capture the greatest market share in the $3.5 trillion global hedge
fund industry by continuing to promote local fund development through domestically
managed funds (Corporate Financing Week, Feb 2015).
Competitive Advantage
In terms of competitive threats, EzeSoft and the competitors currently conduct UAE
sales efforts remotely; however, EzeSoft internal market analysis revealed minimal on-the-
ground competition in the UAE (Eze Software Group, 2014). The nearest primary competitor
is located in Mumbai, India, which is approximately five hours closer by air than EzeSoft’s
Hong Kong and London regional offices. EzeSoft stands to gain a substantial competitive
advantage as the first buy-side technology provider to establish a branch office in the heart of
the Dubai International Financial Center, requiring less than a half-hour to visit prospective
and existing client offices. EzeSoft’s local presence can instantly boost the value proposition
and closing potential for the six local sales prospects in the immediate pipeline. Additionally,
the local office provides new opportunities to unlock new value and strengthen partnerships
with EzeSoft’s five existing UAE clients, who are currently serviced remotely by the London
and Hong Kong consulting teams.

12
EzeSoft Dubai – A Business Proposal
September 2015
Complexity
Compared with EzeSoft’s recent regional office launches in Brazil and Australia, the
prospect of a UAE office is substantially more appealing. Both Brazil and Australia have
proven to be substantially complex markets for EzeSoft to penetrate. In each emerging
region, new clients require lengthy, resource-intensive implementation plans including
several custom developments to accommodate client workflows unique to each region.
In contrast, the majority of UAE hedge funds are simple long-only equity or fixed
income funds and can be fully supported with the canned functionality available in the
EzeSoft platforms (Eze Software Group, 2014). Each of EzeSoft’s five existing UAE clients
was implemented without any custom development required and minimal support after go-
live.
PEST Analysis
The World Economic Forum (WEF) ranked the UAE as the best country globally in
terms of overall financial policies, with the government shaping fiscal policy to expand the
market through tax-free business zones and aggressive investing in infrastructure (2014). The
UAE boasts the strongest economy in the region, boosted by Dubai’s emerging reputation as
the next time zone hub to bridge Europe and Asia, and the country currently ranks 12th
on the
WEF’s Global Competitiveness Index (2014). A new generation of technology-focused,
sophisticated and open-minded locals, combined with a large ex-pat community, provides a
large talent pool for potential clients and employees (Euromonitor International, 2015). From
a technology standpoint, the UAE is leading the charge in Information and Communication
Technology (ICT) and continues to invest heavily in ICT infrastructure (2015). Furthermore,
the nation already owns the highest broadband penetration rates in the world (2015).

13
EzeSoft Dubai – A Business Proposal
September 2015
In summary, the UAE represents a largely underrepresented region with minimal
competition and substantial revenue potential through a large and growing pool of
prospective hedge fund clients. By establishing a local presence in the UAE, the Eze
Software Group can create instant opportunities to strengthen existing client partnerships and
accelerate the decision to purchase for active and future sales prospects. Reasonable growth
estimates extrapolated from the firm’s internal market analysis suggest that EzeSoft can
capture over 20% of the available market share in the UAE within three years of launching
the new EzeSoft Dubai office.

14
EzeSoft Dubai – A Business Proposal
September 2015
Products and Services
It is widely accepted that hedge funds today receive pressure from investors to
demonstrate active management and mitigation of operational risk in their day-to-day
processes. Along the same lines, it is increasingly common for investors to perform their own
due diligence before investing in hedge funds (Waksman, 2009). Consequently, hedge funds
are finding greater incentives to rely on third party software and services to facilitate daily
operational workflows and ensure alignment with industry best practices. Of the software
platforms available across the investment lifecycle, the order management system is single-
most valuable offering for hedge funds, providing a central hub for position analysis, PL
monitoring, order entry and execution, downstream transmission for settlement purposes, and
end of day reconciliation and reporting (cite). The order management system is used across
all business functions within the typical hedge fund structure, including portfolio managers,
analysts, traders, risk and compliance officers, and operations teams. As such, EzeSoft stands
to make the greatest impact on the UAE region by entering the market with its most
competitive offering and launching the EzeOMS as the primary product.
Product Description
The Eze Software Group established its foothold in the industry in the late nineties by
marketing its first product – the Eze order management system (EzeOMS) - to basic, long-
only equity funds. Similarly, the UAE hedge fund target market consists primarily of vanilla,
long-only investment strategies (Eze Software Group, 2014). As a result, EzeSoft will enter
the UAE market by promoting its most mature, competitive and relevant product – the
EzeOMS.

15
EzeSoft Dubai – A Business Proposal
September 2015
While the EzeOMS product offering remains attractive to various firms in the hedge
fund community, the product positioning and key differentiator versus competitors are
personified by the software consulting services and support included with the product. These
services enable the EzeSoft mission to be a partner, not just a vendor, and the unlimited
consulting support available to new clients is the heart of the EzeOMS value proposition.
Differentiation
The financial services industry includes a plethora of vendors with order management
system offerings; however, virtually all competitors charge clients separately for
implementation costs and bill clients at hourly rates for ongoing project management and
consulting services. The distinguishing factor between EzeSoft and other market competitors
lies in EzeSoft’s availability of experienced, collaborative consulting services that come with
the product. The new regional office provides EzeSoft with the local consulting presence
necessary for new local clients to take full advantage of the unlimited consulting resources
that are included with the EzeOMS licensing costs. Ultimately EzeSoft’s local presence in
the UAE will enable the firm to forge lasting partnerships with every existing and future
client, integrating client needs and requirements into the ongoing roadmap for industry best
practice.
Product Delivery
The delivery plan will align with EzeSoft’s corporate LEAN initiative, which targets
a seven week deadline for delivery, excluding any setbacks or delays from the client-side.
The aggressive implementation timeline starts as soon as the new client’s IT provides
EzeSoft with server access. Substantial tools and scripts have been created by EzeSoft’s
Consulting Strategy unit to automate the initial configuration of new client environments in
16
EzeSoft Dubai – A Business Proposal
September 2015
line with organizational best practice. In addition to system configuration, new client
implementations will adhere to EzeSoft’s current standard implementation plan to ensure
client on boarding is on track or ahead of schedule.
Potential Obstacles
The only potential obstacle regarding new client implementations revolves around the
unnecessary consulting support burden that arises when new clients are implemented with
poor workflow automation, inadequate user training or a failed adherence to best practice.
EzeSoft’s Consulting Strategy department has proactively countered these risks through
detailed documentation of the current Consulting-wide standards for new implementations. If
the new implementation standards and guidelines are followed, EzeSoft Dubai can mitigate,
if not eliminate, this overhead risk to consulting resources.
Future Growth
EzeSoft Dubai’s expansion strategy will promote the EzeOMS as the flagship product
during the initial launch; however, the firm’s historical performance has validated the
opportunity for continued growth by upselling existing EzeOMS clients with additional
offerings in the product suite, including EzeRisk, EzeTCA, EzeCompliance, EzeInterfacing
and EzeLocates. Each of these supplemental products integrates seamlessly with the
EzeOMS and requires minimal consulting resources to activate. EzeSoft Dubai is also
favorably positioned for long-term growth potential by expanding into neighboring markets
of Oman, Qatar and Saudi Arabia.
17
EzeSoft Dubai – A Business Proposal
September 2015
Market Analysis
With regional offices in the U.S., Brazil, Europe, Hong Kong, Singapore and
Australia, the established global presence of the Eze Software Group affords convenient
access to most of the leading financial markets. EzeSoft identified the Middle East and North
Africa (MENA) as a highly underrepresented region and key focus for geographic expansion.
The MENA region accounts for 15% market share of hedge fund assets under management,
with no local presence from any of EzeSoft’s largest competitors (Eze Software Group,
2014).
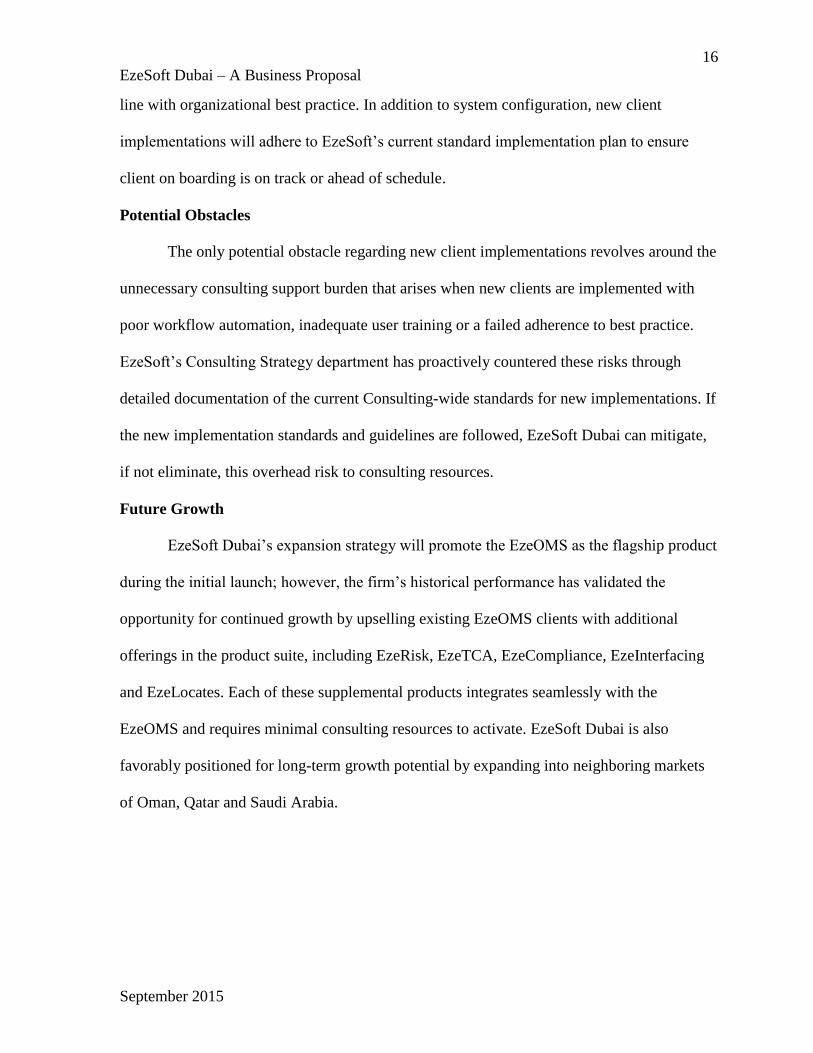
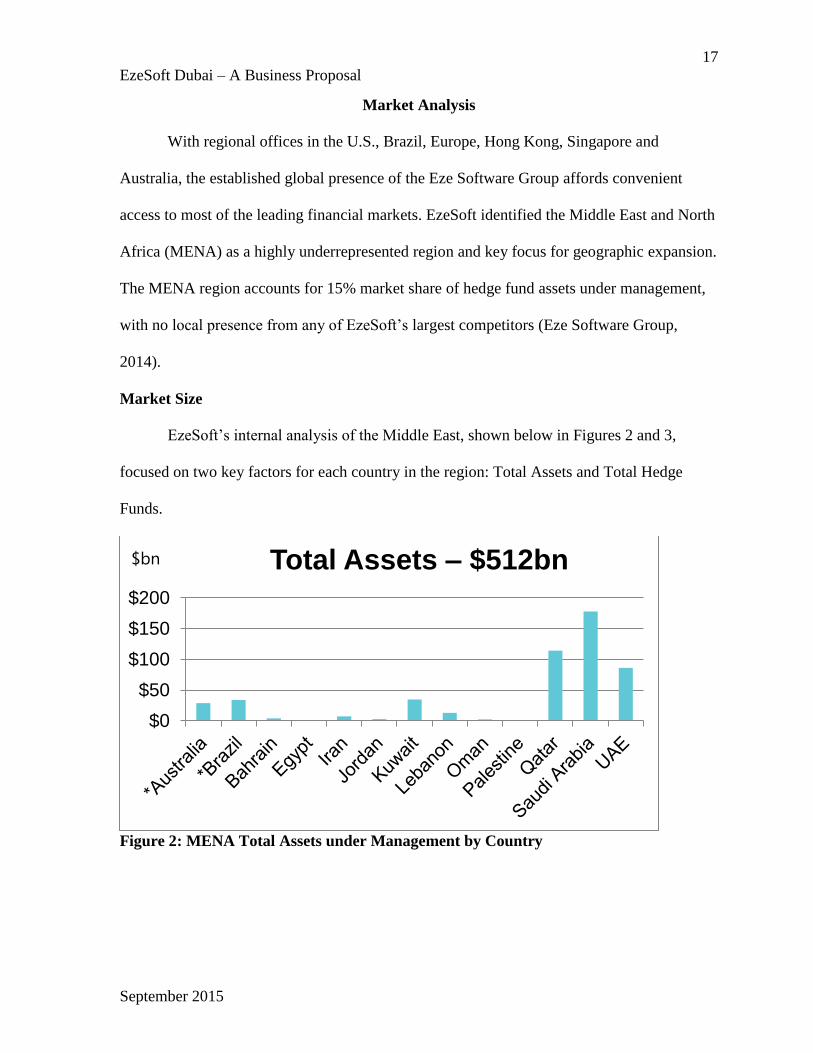
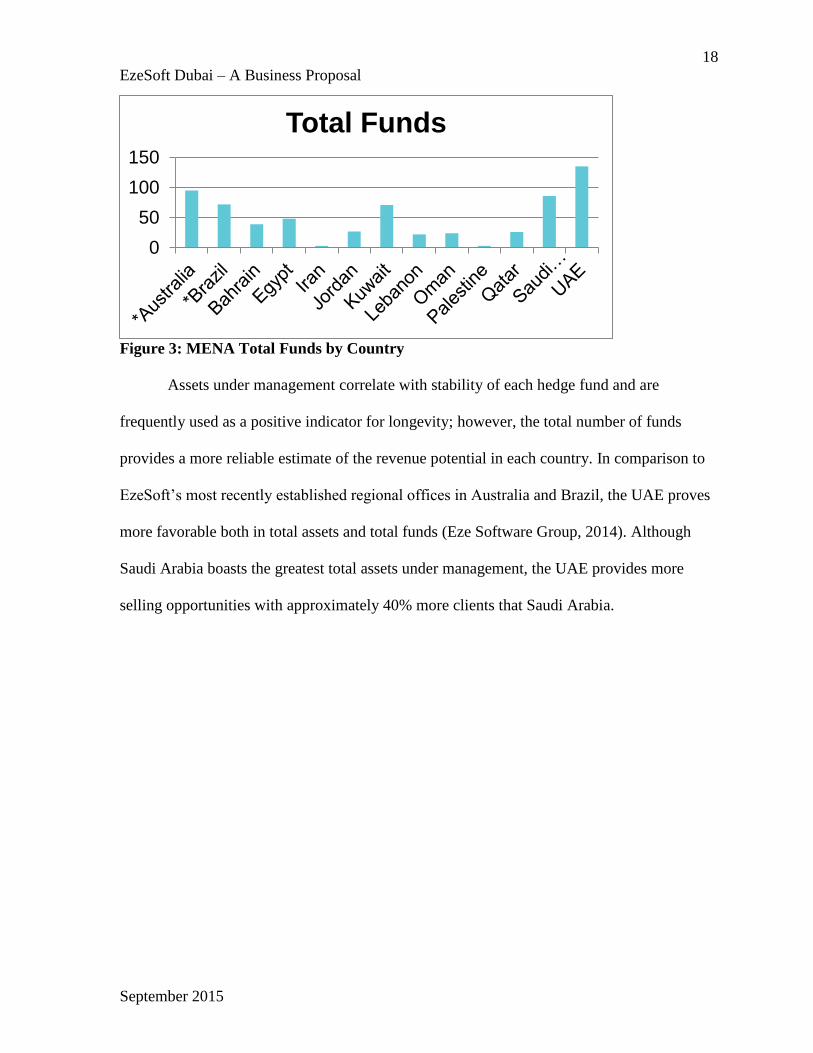
Market Size
EzeSoft’s internal analysis of the Middle East, shown below in Figures 2 and 3,
focused on two key factors for each country in the region: Total Assets and Total Hedge
Funds.
Figure 2: MENA Total Assets under Management by Country
$0
$50
$100
$150
$200
Total Assets – $512bn $bn
18
EzeSoft Dubai – A Business Proposal
September 2015
Figure 3: MENA Total Funds by Country
Assets under management correlate with stability of each hedge fund and are
frequently used as a positive indicator for longevity; however, the total number of funds
provides a more reliable estimate of the revenue potential in each country. In comparison to
EzeSoft’s most recently established regional offices in Australia and Brazil, the UAE proves
more favorable both in total assets and total funds (Eze Software Group, 2014). Although
Saudi Arabia boasts the greatest total assets under management, the UAE provides more
selling opportunities with approximately 40% more clients that Saudi Arabia.
0
50
100
150
Total Funds

19
EzeSoft Dubai – A Business Proposal
September 2015
Growth Trends
Since the global financial crisis, the UAE has aggressively worked to diversify the
national economy away from oil and real estate sectors by targeting aggressive growth in the
financial services, textiles and industrial sectors (Research Monitor, 2015). These efforts
have accelerated the UAE’s recovery and expanded appeal to the global economy, as
illustrated in Figure 4 below.
Figure 4: MENA Global Competitiveness 2015
The UAE currently ranks 12th
in terms of global competitiveness, outperforming all
other countries in the region and gaining ground year over year (World Economic Forum,
2015). The future outlook for wealth management is equally promising. Over the next five
years, the UAE is expected to double the world average in annual growth of investment
inflows, due in part to Dubai’s growing reputation as a major global center for finance
(Manyika et al., 2014). These inflows and Dubai’s rise as a finance hub are only a subset of
the various indicators supporting general expert sentiments that the nation is poised to see
further acceleration of growth and prosperity in the next five years.
20
EzeSoft Dubai – A Business Proposal
September 2015
Economics of the Business
The economics of the EzeSoft Dubai regional office have been determined by
conducting a historical analysis of the firm’s annual sales targets, average revenue per client,
average client support difficulty and average consulting hours per client across all major
regions globally. The analysis and cost estimates also emphasized the simple long-only fund
structure and low support burden of the five existing clients in the UAE. This historical
analysis was integrated with the existing UAE sales pipeline and EzeSoft market analysis to
generate three-year sales forecasts for the most likely, best-case and worst-case scenarios.
The sales targets for each distinct scenario were then used to extrapolate corresponding
projections for the total number of employees and associated fixed and marginal labor costs
required to service the region, including the implementation of new clients and ongoing
support of the expected client base expansion. Detailed estimates of the annual overhead
costs for the leasing office space, equipment and utilities were similarly derived from
EzeSoft’s internal market analysis and actual overhead cost figures from other recent
regional expansions. The firm’s internal analysis also incorporated the additional budget
required for initial and ongoing back-office functions including operations, finance,
accounting, marketing and legal to service the Dubai regional office. Finally, revenue
estimates for each scenario were generated based on sales targets, EzeSoft’s globally
standardized pricing schedule and the average revenue per existing client across all regions.
All revenue estimates leverage cash-based accounting and incorporate both aged receivables
and an allowance for doubtful accounts.
21
EzeSoft Dubai – A Business Proposal
September 2015
Break-Even
Based on the above-mentioned annual sales goals and estimated operating costs, a
three-year outlook of the most-likely scenario achieves break-even status in nine months,
with a 75% operating margin and 20% of the current client market share at the end of year
three. Similarly, the best case scenario reaches break-even in seven months, with 80%
operating margins and 25% market share after year three. Finally, the worst-case scenario
surpasses the break-even mark in fourteen months and ends the three-year outlook with a
61% operating margin and 12% of the hedge fund market. Detailed sales forecasts and break-
even analysis for each scenario are listed in Appendix A and Appendix B, respectively.
Competitor Intrusion
When EzeSoft competes against other vendors for new business, pricing often plays a
secondary role to reliability of the product and the quality of service. While EzeSoft’s
EzeOMS has been an award-winning product for over a decade, the firm’s partnership
framework and high-touch customer service model continues to serve as the key
differentiator. EzeSoft remains one of the industry’s most highly-valued buy-side technology
providers because no other competitors – large or small – have been able to mirror the firm’s
customer service model without disadvantageous pricing increases (Eze Castle Integration,
2015). While competitors may attempt to copy the EzeSoft Dubai strategy by entering the
UAE market, they will encounter the same challenges in matching customer service
excellence while staying competitive on pricing. Additionally, since the UAE business
environment operates on a trust basis, EzeSoft Dubai’s first mover advantage provides a head
start to establish trust and build local loyalty networks. This further limits the effectiveness of
any competitive intrusions into the UAE market.

22
EzeSoft Dubai – A Business Proposal
September 2015
Marketing Plan
The marketing plan for EzeSoft Dubai aligns with the organizational standards in
several areas; however, the success of the new regional office depends heavily on several key
region-specific elements.
EzeSoft Dubai will follow the model for all other regional offices by leveraging the
existing systems, tools and business processes available at the firm level. Similarly, product
pricing and contract negotiations, shown below, will remain standardized across the
organization. As with all other regions, the pricing and contract terms will continue to be
managed by EzeSoft’s global sales and business development functions.
User Count Annual License Fee Minimum Contract Length (Years)
1 100,000 3
6 200,000 3
11 275,000 3
16 325,000 3
Table II: EzeSoft Corporate Pricing Policy

23
EzeSoft Dubai – A Business Proposal
September 2015
Strategic Partnerships
With the right strategic partner, the sales team can gain immediate access to new
prospects in the region and accelerate sales efforts. EzeSoft’s existing alliance with Apex
Fund Service provides the best opportunity to achieve this based on the following
qualification criteria:
1. Value Proposition for Apex Fund Services
2. Demonstrated Local Market Knowledge and Experience
3. Direct Access to Local Customer Base
Value Proposition
Apex Fund Services and the EzeSoftware Group have already established a
healthy, collaborative relationship through a subset of mutual clients. While Apex Fund
Services has established a strong presence in the Middle East region, the firm faces stiffer
competition in the larger financial markets such as New York, London and Hong Kong.
EzeSoft’s sizeable footprint in these larger markets provides a substantial opportunity for
Apex Fund Services to expand their revenue streams through EzeSoft client referrals.
EzeSoft’s vast network of vendor relationships can be extended to Apex Fund Services,
allowing Apex to streamline electronic interfacing and integration with the auxiliary
platforms of other financial technology providers.
Local Market Knowledge
EzeSoft Dubai will need to build on existing knowledge of the client base in order to
continue providing excellence customer service and striving to be a partner, not just a vendor.
EzeSoft Dubai can benefit greatly from Apex Fund Services’ extensive experience and
proven success in the Middle East region and the UAE in particular through mutual
24
EzeSoft Dubai – A Business Proposal
September 2015
knowledge-sharing and education on best practice. Apex Fund Services has also established
key relationships with local governments and regulatory bodies in the region, from which the
EzeSoft Dubai office may benefit further.
Direct Access to Customers
Apex Fund Services has built up a healthy client base in the region over the last
decade. EzeSoft Dubai can substantially reduce sales timelines for new customer sales by
leveraging leads and referrals from Apex Fund Services. Similarly, EzeSoft Dubai and Apex
Fund Services can mutually benefit by packaging offerings together for prospective clients.
In summary, by establishing a strategic alliance with Apex Fund Services,
EzeSoftware Group provides a clear value proposition for our partner’s business offerings. In
return, EzeSoft Dubai may gain traction with the local customer base and acquire essential,
local market insights to better cope with the social, cultural, and organizational nuances
specific to the region. This in turn will help EzeSoft Dubai respond quickly to MENA
customer needs, thereby fulfilling our overarching corporate strategy of delivering top-tier
customer service. Overall, EzeSoft Dubai’s strategic partnership with Apex Fund Services
will allow each firm to secure greater competitive advantages in the MENA region while co-
creating additional long-term viability through additional growth opportunities globally.

25
EzeSoft Dubai – A Business Proposal
September 2015
Promotional Strategy
Before deploying resources on the ground, a four month promotional strategy will
enhance brand awareness and establish meaningful relationships with local market
participants. EzeSoft Dubai has identified three key communications objectives, shown
below in Figure 5.
Figure 5: EzeSoft Dubai Promotional Strategy
The promotional strategy has been formulated with specific components to address
each critical communications objective during the startup phase. A separate promotional
budget has been drawn up based on the anticipated costs of each promotional component.
Brand Awareness
The EzeSoftware Group’s Public Relations (PR) team will strategically target
regionally established electronic and print publications with an official press release of the
EzeSoft Dubai initiative. The firm will outsource to local PR experts to craft targeted
communications to local government and financial regulatory bodies in the region with the
intent of establishing new relationships with agency stakeholders participating in the
registration process for new hedge funds and asset management firms. EzeSoft will also
engage with existing UAE clients for guidance and assistance in raising awareness. These
relationships will be pursued further by the on-the-ground sales force to enhance brand
26
EzeSoft Dubai – A Business Proposal
September 2015
awareness. Print collateral, company supplies and other marketing material will be created
for sales teams to distribute as needed.
Client Prospecting
EzeSoft Dubai will appoint existing new client sales expert to ramp up the customer
base in during the first three years. Despite the abovementioned objective of enhancing brand
awareness through strategic networking and relationship building, the primary role of the
sales champion will be to prospect for new clients, close potential clients and engage existing
clients for referrals and leads. The EzeSoftware Group’s global cold-calling sales team may
augment local client prospecting efforts by cold-calling to set up meetings with potential
clients. A discretionary sales incentive will also be awarded to the sales representative for
exceeding the first-year sales goal.
Decision to Purchase
EzeSoft Dubai’s dedicated sales champion will be the primary component for moving
potential clients through the sales pipeline and converting prospects into new clients. In an
effort to accelerate growth of the client base, the sales member and global sales director will
have greater flexibility for aggressive pricing in order to close new client sales. If the sales
team requires additional pricing discounts in order to close the deal, the promotional
discounts will be noted in EzeSoft Dubai’s Microsoft Dynamics CRM and debited to EzeSoft
Dubai’s promotional budget under the sales incentives line item.

27
EzeSoft Dubai – A Business Proposal
September 2015
Promotional Budget
EzeSoft Dubai has estimated a total promotion budget of $350,000 for the first year to
cover all major components of the promotion strategy, illustrated in the table below.
Table III: EzeSoft Dubai Promotional Budget
While the final promotion budget encompasses planned expenditures for promotional
PR, marketing collateral and sales incentives, the running public relations and personal
selling components will remain separate from promotion budgeting and are incorporated into
EzeSoft Dubai’s annual overhead cost estimates. While sales incentives are limited to the
first year of expansion, EzeSoft Dubai will extend a slightly lower public relations and
marketing collateral budget year over year in order to further solidify the firm’s brand
awareness and secure the trust of local asset management participants.
Promotional Activity Year 1 Year 2 Year 3
Public Relations 130,000.00$ 100,000.00$ 100,000.00$
Collateral & Marketing Supplies 20,000.00$ 20,000.00$ 20,000.00$
Sales Incentives 200,000.00$ - -
Total Budget 350,000.00$ 120,000.00$ 120,000.00$

28
EzeSoft Dubai – A Business Proposal
September 2015
Design and Development Plan
The Eze Software Group has a fully viable product in the EzeOMS, with multiple
existing clients using the product for all daily operational needs. Each of the five existing
UAE clients was implemented without any custom development required and minimal
support after go-live. This fully substantiates that the local client base can be fully supported
with the canned functionality available. No further design and development will be required.
29
EzeSoft Dubai – A Business Proposal
September 2015
Manufacturing and Operations Plan
As a global competitor in the arena of financial technology providers, the chief
objective of the EzeSoft Dubai operations plan is to realize the unique strategic advantages
arising from establishing a local presence in the UAE. The proposed Dubai office does not
require any warehousing, plant facilities or manufacturing equipment and will consist solely
of client-facing business consultants and the local sales force for new client sales and
business development. While the EzeSoftware Group currently centralizes all Research and
Development (R&D), Quality Assurance (QA) and Tier II support functions, cost estimates
and planning have been conducted to ensure the Dubai regional office launches as scheduled
on January 1st, 2016. The relevant costs and planning and milestones are outlined in the
Overall Schedule section of the proposal.
The remainder of the operations plan will briefly expound on the rationale for
selecting Dubai as the UAE office location. The operations plan will then highlight the
regional strategy, Key Performance Indicators (KPIs) for measuring productivity, along with
the underlying business processes and transparencies required to sustain employee
motivation, maintain productivity and ensure regional alignment with the overarching
regional strategy.
Location
Research has shown that customer service oriented enterprises participating in the
financial services technology space can strategically benefit from establishing regional office
locations in close proximity to high-density customer bases. For technology providers, such
as the Eze Software Group, proximity to client offices promotes greater overall customer
30
EzeSoft Dubai – A Business Proposal
September 2015
satisfaction, existing client referrals, existing client sales, and new client sales (Cagliano, De
Marco, Rafele & Arese, 2012).
EzeSoft has already established a strong global presence, with regional offices in San
Francisco, Chicago, New York, Boston, London, Hong Kong, Singapore, Sydney, and Sao
Paolo. Despite the existing global presence, however, the sales strategy unit identified the
Middle East and North Africa as an underrepresented region with strong potential for new
client sales. The United Arab Emirates (UAE), and Dubai in particular, experienced notable
losses during the global financial crisis of 2008, especially in the financial industry and real
estate markets (Euromonitor International, 2015). Since the crisis, however, the UAE has
seen recoveries in both sectors along with a return to consistent economic growth (2015).
The recovery is being shaped primarily by a shift in government policy to reduce the UAE’s
dependency on oil by boosting growth in non-oil industries, especially manufacturing and
industrials, tourism, and the financial industry (Buckley & Hanieh, 2014). The UAE’s
financial development – the growth of local exchanges, institutions and banking sectors – has
produced a significant positive impact on economic growth, attracting hedge funds and other
institutional asset managers to the region (Masoud & Hardaker, 2012).
In summary, Dubai represents an invaluable geographic opportunity to establish
proximity to an under-represented, growing customer base of buy-side investment managers.
Furthermore, Dubai’s emergence as a transportation and tourism hub promote easy access to
neighboring markets within the MENA region.

31
EzeSoft Dubai – A Business Proposal
September 2015
Alignment
Over the years, extensive academic research has added credence to the notion that the
alignment of corporate and business strategies with operations management is considered
imperative for organizational success (Mitra & Bhardwaj, 2010). This entails a strategic fit of
the organization’s competitive strategy and operations management strategy – all functioning
units within the business should be incentivized to and rewarded by achieving the common
goal (2010).
The primary objectives of Dubai regional office will align with the Eze Software
Group’s primary competitive strategies: delivering client-driven, cutting edge products and
solutions, maintaining the highest levels of customer satisfaction, and increasing annual
operating margins year over year. The development, integration and delivery of new products
and services falls primarily under the Research and Development (R&D) and Product
Management (PM) business functions; however, the Dubai business consulting and sales
team holds the key to success in contributing to revenue targets and establishing and
maintaining superior customer satisfaction as EzeSoft establishes its presence in the UAE
region.
Performance and Productivity
Competitiveness favors those organizations that can continuously monitor and
improve the effectiveness of production and personnel alike, in addition to being able to
predict and act on new trends quickly (Prahalad & Krishnan, 2008). These abilities are
contingent upon structured measurement metrics, dynamic business processes and real-time
performance analytics (2008). Operations management teams rely on these critical elements

32
EzeSoft Dubai – A Business Proposal
September 2015
– performance measurement – in order to increase the productivity and profitability of the
enterprise (Domanović, Jakšić & Mimović, 2014).
Profitability
EzeSoft measures profitability using two Key Performance Indicators (KPIs):
Revenue and Earnings Before Interest, Taxes, Depreciation, and Amortization (EBITDA).
The overarching organizational strategy is contingent on the ambitious goal of improving
“operating leverage” by generating higher revenues without increasing operating expenses.
Firm-wide KPIs currently target annual growth of 12% revenue and 8% EBITDA for each of
the next three years. In the spirit of competition, the Dubai regional office aims to outperform
both corporate KPIs based on the most likely scenario sales forecasts. If the Dubai region is
lagging on the revenue target, consulting resources will be redirected to increase sales to
existing customers. Similarly, any drag in earnings (EBITDA) will require the
implementation of proactive expense management procedures to scale back on spending.
Customer Satisfaction
Customer satisfaction will be assessed using two independent KPIs: implementation
life cycles for the primary suite of order management software and annual client-wide
satisfaction surveys. The implementation life cycle KPI will target a seven week timeframe
for standard implementations. Delays will need to be documented and categorized as client-
delays, internal delays, or external third party delays. For internal delays, additional
documentation of the each contributing factor to the delay will be required and reviewed for
opportunities to mitigate or avoid during future implementations.
EzeSoft corporate headquarters will circulate annual client satisfaction questionnaire
across all clients, with invoice credits offered as an incentive for clients to fully complete the
33
EzeSoft Dubai – A Business Proposal
September 2015
survey. For each customer, individual question responses are input through a complex,
proprietary algorithm that returns a “Net Promoter Score” (NPS). The company-wide KPI
aims for customers to score above a 7 (out of 10). Any client returning a score below 7 is
labeled as a “detractor” and special focus is given to the client until the client trends
positively out of the “detractor” zone. Customers with a NPS greater than 7 are considered
promoters, and are petitioned individually for potential new client referrals.
Consulting Return on Investment
A third, auxiliary KPI will leverage an internal timecard logging system to track and
categorize the number of consulting hours required per client. On a daily basis, client-facing
business consultants will log the number of hours spent working on individual clients in 30
minute increments and label the nature of work under one of three possible (Core 3)
categories: Production Support, Project Management and Account/Relationship
Management. Detailed criteria have already been established and on-going training is
provided to help consultants discern the appropriate Core 3 category to use to specific tasks.
Weekly, automated timecard reports are delivered to individual consultants for review,
breaking down the total hours spent with each client, and the nature of work required by
client. The Dubai consulting region will receive automated timecard reports illustrating the
total consulting hours invested per client, with drilldown capabilities to breakdown the type
of work completed for each client.
There primary purpose for this auxiliary KPI is to assess the Consulting Return on
Investment (CROI) for each client. By measuring the number of consulting hours invested
against the revenue generated for each client, the Dubai consulting region can identify low-
revenue clients demanding high volumes of consulting support. As a result, operations

34
EzeSoft Dubai – A Business Proposal
September 2015
management teams will be empowered to prioritize low CROI clients when identifying
methods to improve efficiency by reducing consulting workloads.
Currently CROI across global consulting averages out at $4000 revenue per hour of
Consulting support for live clients. EzeSoft Dubai ambitiously seeks to double this efficiency
metric by establishing day one precedents for best practice in workflow automation, thorough
user training up front and strict policy enforcement of client ownership and accountability
when it comes to managing their data and processes.
Transparency
Each of the abovementioned KPIs will be communicated clearly and consistently to
the Dubai consulting teams in an effort to promote transparency into the effectiveness of new
software implementations, overall client satisfaction levels and efficiency of consulting
teams in supporting clients. Additionally, this transparency initiative will help participants in
the Dubai regional office attach significance and relevance to their day-to-day operational
activities and their contributions to the long-term viability of the Eze Software Group (Harris,
Componation & Farrington, 2010). Financial incentives and bonus compensation will be
tiered-based according to year-end numbers versus the KPIs, providing consultants with
tangible motivators for achieving the overarching corporate strategy.
Conclusion
In summary, the launching of a new Dubai regional consulting office will afford the
Eze Software Group new avenues for profitability and sustained the competitive advantage
through closer proximity to an underrepresented, growing consumer base. By aligning with
EzeSoft’s overarching corporate strategy, adopting specific KPIs to measure performance
and productivity, and embracing transparency at each level within the business unit, the

35
EzeSoft Dubai – A Business Proposal
September 2015
Dubai regional office will be well-positioned as a new, meaningful contributor to the long-
term success of the Eze Software Group.
36
EzeSoft Dubai – A Business Proposal
September 2015
Management Team
The EzeSoft Dubai office launch will require the creation of three initial positions:
Business Consultant, Associate Director of Sales and Regional Director of Consulting. The
position titles are standardized across the Eze Software Group, and the EzeSoft Dubai office
will follow the firm’s formal role descriptions and requirements to determine eligible
candidates for relocation and, if warranted, promotion. Candidates for the Regional Director
of Consulting and Associate Director of Sales roles will be required to make a three-year
commitment. A two-year commitment will be required for applicants to the Business
Consultant role. Based on EzeSoft Dubai’s forecasted sales and growth, an additional
Business Consultant will be necessary in the second year of operation. EzeSoft Dubai will
attempt to fill this role by hiring locally. If no qualified candidates are accessible from the
local talent pool, the role will be filled internally by following the above-mentioned process.
This second consultant role will only require a one-year commitment.
Hiring
A formal company-wide memorandum will announce the new roles and give eligible
employees the opportunity to apply. The Eze Software Group already provides employees
with similar opportunities to apply for temporary stints in overseas offices. These
opportunities generate large interest across the firm, and it is likely there will be several
qualified candidates to evaluate for the three primary roles. Regardless, senior management
will separately evaluate EzeSoft’s global talent pool in search of top candidates to promote
up to the EzeSoft Dubai team. In addition to the standard role requirements, evaluation
criteria will favor tenacious candidates with proven outperformance in any combination of
client sales, new client implementations and relationship management. Further preference

37
EzeSoft Dubai – A Business Proposal
September 2015
will be given to individuals with multi-cultural backgrounds or extensive international travel
experience. As will all other international stints, senior management will conduct the
interview and decision-making process; however, a preliminary review of eligible employees
suggests that EzeSoft Dubai will have the greatest likelihood of success with Chris Knott-
Craig overseeing as Regional Director of Consulting. Still, the executive committee will need
to approve this recommendation before Chris can be appointed to the role.
Reporting Structure
EzeSoft Dubai will follow the same reporting structure as the London regional office,
reporting up to the EMEA unit. The Dubai Regional Director of Consulting will report to the
EMEA Senior Director of Consulting, and the Dubai Associate Director of Sales will report
to the EMEA Director of Sales. The Dubai Business Consultant will report in directly to the
Dubai Regional Director of Consulting.
Compensation and Benefits
The Eze Software Group leverages highly confidential salary bands to manage
employee compensation across the firm. Since only senior management and executives have
access to these figures, employee compensation must adhere to these role-related salary
ranges and will be managed as part of the interview process. Similarly, EzeSoft’s centralized
Human Resources function manages a standard, international benefits package for all
employees abroad. The HR team will provide the same standard benefits to EzeSoft Dubai
employees.
Unexpected Departures
EzeSoft Dubai must be prepared to quickly fill vacancies should any members of the
initial staff break their commitment and leave the firm. In the event of an unexpected

38
EzeSoft Dubai – A Business Proposal
September 2015
departure at the Associate Director of Sales or Business Consultant role, the role can be
temporarily filled internally with a six-month “air support” stint while EzeSoft interviews
local candidates as potential replacements. If the firm fails to fill the roles with local hires,
the positions will be filled internally following the same process for initial hiring. Air support
stints can by cycled through every six months until permanent replacements are found.
In the unlikely event that the Dubai Regional Director of Consulting resigns
unexpectedly, the Business Consultant will be promoted as an interim Regional Director
Senior management and the executive committee can determine whether to promote the
interim Regional Director or evaluate other internal candidates to permanently fill the
Regional Director of Consulting role. The vacancy created at the Business Consultant
position will be temporarily augmented with air support and permanently filled with either a
local hire or internal relocation, as described above.

39
EzeSoft Dubai – A Business Proposal
September 2015
Overall Schedule
EzeSoft Dubai will be fully operational as of January 1, 2016. The overall schedule,
shown in the figure below, will consist of three separate phases to focus on the preparation,
execution and expansion of the new regional office.
Figure 6: EzeSoft Dubai Overall Schedule
Phase 0: Ramp-Up
Phase 0 includes all the prerequisite administration required for the new office
launch. In accordance with EzeSoft’s consolidation of all employees under a single U.S.
entity, the EzeSoft Dubai office will be structured as an onshore foreign branch office and
located in the Dubai International Financial Centre (DIFC).The DIFC is a free zone that
awards zero tax liabilities and exemption from all cultural traditions and local laws to
financial services entities operating in the zone. The Dubai International Financial Centre
(DIFC) has enhanced the appeal to foreign firms by creating a surprisingly simple and
efficient process for business registration as a foreign branch office that takes a maximum of
four weeks to complete. The Eze Software Group’s middle office and back office teams
estimate that the new region can be fully set up internally within eight weeks. The ramp-up
Phase 0: Ramp-Up - Sep 2015 through Dec 2015
Dubai Business Registration
EzeSoft Middle and Back Office Administration
Marketing - Ramp-Up Promotion Strategy
Relocation and Office Launch 4 weeks
Phase 1: Go-Live - Dec 2015 through Dec 2018
Existing UAE Clients - Coverage Transition from London to Dubai 1 week
Consulting Support of Existing UAE Clients
Marketing - Start-Up Promotion Strategy
Concentrated Sales Focus on New Clients in UAE (Dubai & Abu Dhabi)
New Client Implementations (Sales Dependent)
Phase 2: Growth Strategy - Jan 2019 and Beyond
Consulting Support of Existing Clients
Continued Sales Focus on New Clients in UAE
Expanded Sales Focus on New Clients in Neighboring Markets
(Qatar, Saudi Arabia, Oman)
New Client Implementations (Sales Dependent)
ongoing
ongoing
ongoing
ongoing
8 weeks
12 weeks
4 weeks
Timeline for Completion
Timeline for Completion
Timeline for Completion
1 year
3 years
3 years
3 years

40
EzeSoft Dubai – A Business Proposal
September 2015
promotional campaign will run the last 12 weeks of the year to generate publicity, enhance
brand awareness and enable the Sales team to hit the ground running. In the final eight weeks
of ramp-up, a series of cross-training sessions will be coordinated for all existing UAE
clients to ensure detailed and comprehensive documentation and transfer of account
knowledge between the London and Dubai teams. The ramp-up phase will conclude with the
setup of the new office and relocation of each EzeSoft Dubai employee during the last
month.
Phase I: Go-Live
Phase I focuses on the execution and establishment of the new office. During the first
week of operation in the new office, the existing UAE clients will be the top priority. All
members of the Dubai team will participate in on-site client transitions to meet the members
at each firm. The start-up promotion strategy will continue through the first year of operation
in Dubai to facilitate the sales effort to exceed goals and expand the client base. The sales
effort will concentrate solely on the UAE, with special focus on Dubai and Abu Dhabi as the
major nerve centers for hedge funds. Consulting resources will be limited to the support of
existing UAE clients until sales delivers new customers to implement.
Phase II: Growth Strategy
At the end of the three year mark, once the EzeSoft Dubai has established a strong
presence in the UAE, the organization may augment new client sales in the UAE by
allocating business development resources to upsell the existing client-base with product
add-ons to the EzeOMS. The high-impact growth strategy will expand sales efforts the
neighboring markets of Oman, Qatar and Saudi Arabia as a growth strategy for acquiring
additional market share.
41
EzeSoft Dubai – A Business Proposal
September 2015
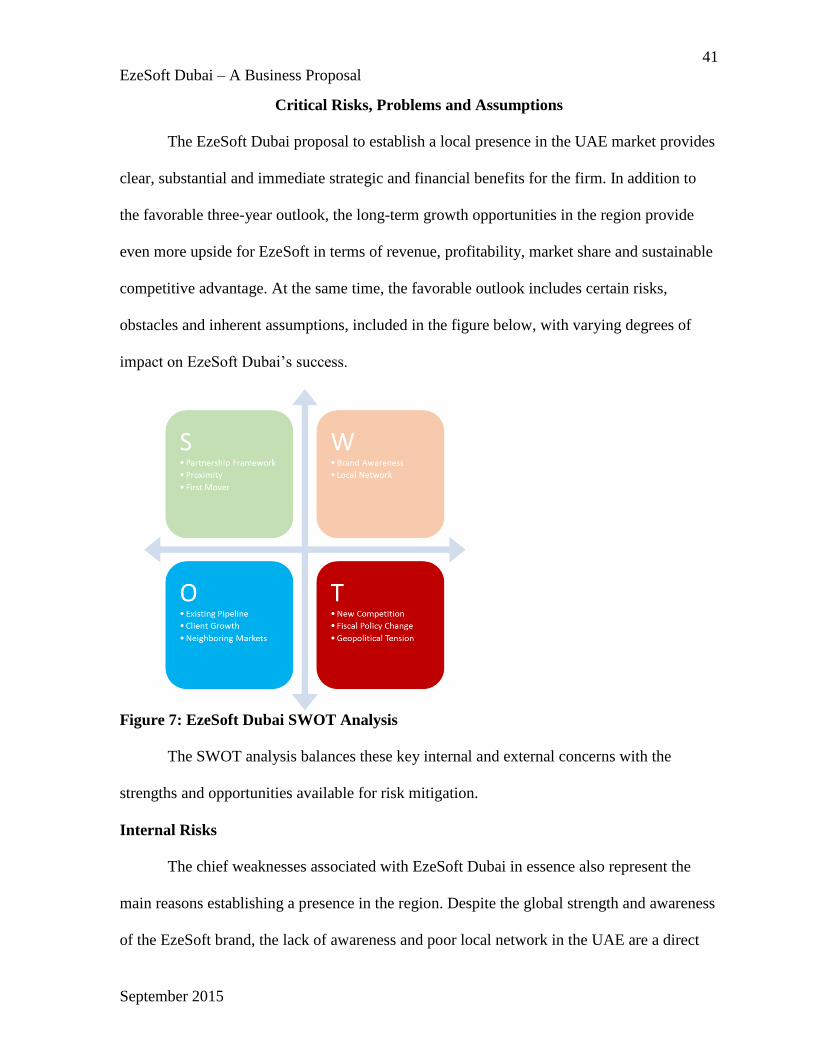
Critical Risks, Problems and Assumptions
The EzeSoft Dubai proposal to establish a local presence in the UAE market provides
clear, substantial and immediate strategic and financial benefits for the firm. In addition to
the favorable three-year outlook, the long-term growth opportunities in the region provide
even more upside for EzeSoft in terms of revenue, profitability, market share and sustainable
competitive advantage. At the same time, the favorable outlook includes certain risks,
obstacles and inherent assumptions, included in the figure below, with varying degrees of
impact on EzeSoft Dubai’s success.
Figure 7: EzeSoft Dubai SWOT Analysis
The SWOT analysis balances these key internal and external concerns with the
strengths and opportunities available for risk mitigation.
Internal Risks
The chief weaknesses associated with EzeSoft Dubai in essence also represent the
main reasons establishing a presence in the region. Despite the global strength and awareness
of the EzeSoft brand, the lack of awareness and poor local network in the UAE are a direct
42
EzeSoft Dubai – A Business Proposal
September 2015
result of the EzeSoft’s lack of a nearby regional office. EzeSoft’s closest offices – in London
and Hong Kong – are four time zones away and over seven hours away by air. This
separation greatly impedes EzeSoft’s partnership framework and client service excellence,
which hinge on being close to client offices to maximize face-time. By eliminating the time
zone differences and travel time, EzeSoft Dubai can efficiently concentrate local resources to
establish a strong, trust-based local network and build the brand awareness necessary to
exceed sales forecasts. These efforts also receive a boost from EzeSoft Dubai’s three year
marketing promotion strategy. If brand awareness and local networks do not progress as
expected, sales projections under the most likely scenario may not be achievable; however,
the worst-case scenario accounts for this potential risk and still generates positive financial
returns with additional market share worthy of consideration.
External Risks
The UAE’s free trade zones, including the DIFC, currently include a no-tax policy for
foreign companies. While there is a minor risk for tax (VAT) to be added in the next five
years, the VAT would be marginal and no more than 5% (McKinsey Global Institute, 2015).
Even though potential taxes would reduce operating margins, it is highly unlikely that sales
forecasts would be impacted.
The possibility of competitive intrusions into the UAE market must also be
considered, but EzeSoft’s core value proposition to clients – the partnership framework – can
be expected to mitigate competitive risk as it does in the primary global markets.
Furthermore, by being the first vendor on the ground, EzeSoft Dubai benefits from a head
start in joining local networks, building trust and establishing customer loyalty, which
represent the most valued elements for operating in the local business environment. EzeSoft

43
EzeSoft Dubai – A Business Proposal
September 2015
Dubai’s competitive advantage is also enhanced by the pricing incentives and discounts
included in the promotional strategy, which allow for more aggressive pricing in the first
year.
The most significant threat to EzeSoft Dubai’s success stems from uncertainty
regarding the region’s political climate. Islamic fundamentalist groups, notable ISIS, and
geopolitical instability in nearby countries such as Syria and Yemen remain unpredictable.
While the UAE currently falls in the low to moderate country risk tier, economic experts
generally agree that regional stability remains a concern even though the UAE is not
generally impacted by the social and political unrest in the region (A.M. Best Company,
2015). The UAE government in particular continues to distance itself from Arab protests by
tightening its political control and limiting refuge immigration (Coface, 2015). In the event
that tensions create an unjustifiable or unmanageable risk associated with EzeSoft’s UAE
presence, the firm may elect to temporarily or permanently shut down the EzeSoft Dubai
office, evacuate employees and service existing clients remotely via the London and Hong
Kong regional offices.

44
EzeSoft Dubai – A Business Proposal
September 2015
The Financial Plan
The EzeSoft Dubai financial plan provides a three-year performance outlook based on
projected sales for the most-likely scenario as well as the best and worst case scenarios. A
separate cash flow analysis, pro forma balance sheet and income statement for each the three
possible scenarios can be found in Appendix C. The financial forecasts include several
assumptions based on EzeSoft’s historical performance across all regional offices globally, as
well as experiences drawn from the most recent new office launches in Brazil and Australia.
Estimates also take into account EzeSoft’s internal analysis of the UAE market startup and
overhead costs.
Sales Forecasts
Three-year sales forecasts for each scenario are highlighted in the figure below.
Figure 8: EzeSoft Dubai Sales Forecast
Projects sales for each month were determined by incorporating both monthly
historical sales trends in new and existing markets, along with factors specific to the UAE
market. The forecasts assume no sales in the first two months in operation to allow the sales
team to establish sufficient trust with prospective funds. Analysis of EzeSoft’s historical
0
5
10
15
20
25
30
35
40
20
16
Jan Fe
bM
arA
pr
May Jun
Jul
Au
gSe
pO
ctN
ov
Dec
20
17
Jan Fe
bM
arA
pr
May Jun
Jul
Au
gSe
pO
ctN
ov
Dec
20
18
Jan Fe
bM
arA
pr
May Jun
Jul
Au
gSe
pO
ctN
ov
Dec
TOTA
L C
LIEN
TS
Three-Year Sales Forecast
Best Most Likely Worst

45
EzeSoft Dubai – A Business Proposal
September 2015
sales performance revealed that very few sales occur in December and January due to the
holidays, and as a result EzeSoft Dubai’s sales forecast projects minimal sales in either
month. The Muslim holiday of Ramadan occurs in June, and sales forecasts assume a similar
decline in June sales followed by a corresponding sales uptick in July of each year. Lastly,
the months of February, July and October have consistently proven to yield the higher sales
volumes annually for EzeSoft, and EzeSoft Dubai’s sales forecasts reflect this assumption in
the second and third year of operation.
46
EzeSoft Dubai – A Business Proposal
September 2015
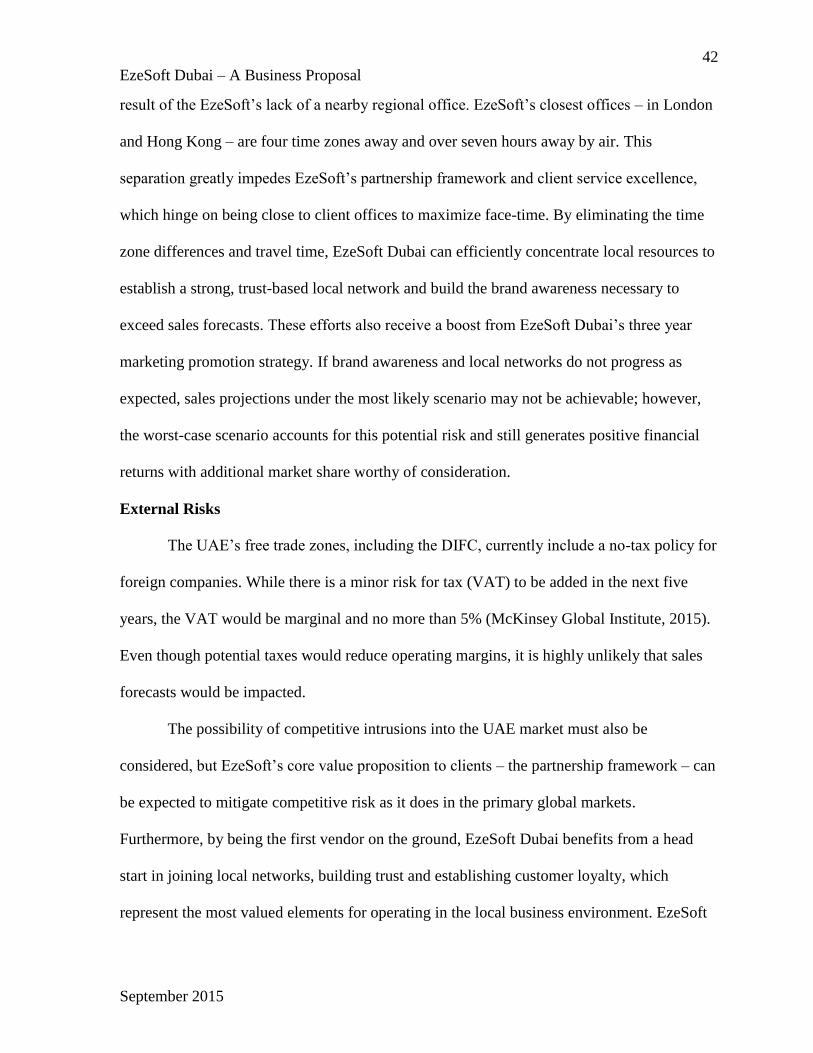
Operating Costs
A summary of the annual operating costs for each scenario are illustrated in the tables
below.
Table IV: Operating Costs – Most Likely Scenario
Table V: Operating Costs – Best Case Scenario
Table VI: Operating Costs – Worst Case Scenario
Startup costs and fixed costs remain constant across all scenarios. Variable costs
include a 5% sales commission paid upfront for each new client signing. Operating costs are
adjusted annually to allow for an estimated 5% raise for all non-commission employees. The
estimated variable costs also account for additional personnel required to service the growing
client base, with the assumption that a business consultant and support specialist will be
required for every twelve clients.
Totals: 2016 2017 2018
Total Cost 908,000$ 895,500$ 958,275$
Fixed Costs (848,000)$ (685,500)$ (701,775)$
Variable Costs (60,000)$ (210,000)$ (256,500)$
Most Likely
Totals: 2016 2017 2018
Total Cost 928,000$ 925,500$ 1,118,275$
Fixed Costs (848,000)$ (685,500)$ (701,775)$
Variable Costs (80,000)$ (240,000)$ (416,500)$
Best
Totals: 2016 2017 2018
Total Cost 878,000$ 715,500$ 911,775$
Fixed Costs (848,000)$ (665,500)$ (701,775)$
Variable Costs (30,000)$ (50,000)$ (210,000)$
Worst

47
EzeSoft Dubai – A Business Proposal
September 2015
Cash Flow Analysis
The figure below summarizes the real-time cash flow projections for each scenario.
Figure 9: EzeSoft Dubai Cash Flow Projections
In order to provide a more accurate representation of financial forecasts, the estimated
cash flows reflect recurring monthly payments instead of recognizing the full annual revenue
for new clients on the signing date. For additional precision, the cash flow analyses assume
that only 90% of expected receivables will be paid each month. This assumption was
influenced by a comprehensive assessment of EzeSoft clients’ payment history. A second
assumption treats the remaining 10% of unpaid invoices as uncollectible, and these aged
receivables are converted to an allowance for doubtful accounts on the pro forma balance
sheets at the end of each fiscal year.
$-
$1,000,000
$2,000,000
$3,000,000
$4,000,000
$5,000,000
$6,000,000
$7,000,0001
2/1
/20
15
3/1
/20
16
6/1
/20
16
9/1
/20
16
12
/1/2
01
6
3/1
/20
17
6/1
/20
17
9/1
/20
17
12
/1/2
01
7
3/1
/20
18
6/1
/20
18
9/1
/20
18
12
/1/2
01
8
Cash Flow Projections
Most Likely Best Worst

48
EzeSoft Dubai – A Business Proposal
September 2015
Profitability
Using the abovementioned sales forecasts, projected operating costs and
corresponding cash flow analysis, a summary of the profitability shown in the tables below
for each scenario.
Table VII: Profitability Forecasts – Most Likely Scenario
Table VIII: Profitability Forecasts – Best Case Scenario
Table IX: Profitability Forecasts – Worst Case Scenario
These tables demonstrate the strong profitability projections, high operating margins,
and additional market share even under the worst case scenario. The projected forecasts stand
to make a notable impact on EzeSoft’s bottom line at the firm level.
Totals: 2016 2017 2018
Tota l Cost 908,000$ 895,500$ 958,275$
Tota l Revenue 633,333$ 1,950,000$ 4,216,667$
Tota l Cash Receipts 570,000$ 1,755,000$ 3,795,000$
Profi t (Loss ) - Cash (338,000)$ 859,500$ 2,836,725$
Operating Margin -43% 54% 77%
Market Share 5% 11% 20%
Most Likely
Totals: 2016 2017 2018
Tota l Cost 928,000$ 925,500$ 1,118,275$
Tota l Revenue 866,667$ 2,816,667$ 5,566,667$
Tota l Cash Receipts 780,000$ 2,535,000$ 5,010,000$
Profi t (Loss ) - Cash (148,000)$ 1,609,500$ 3,891,725$
Operating Margin -7% 67% 80%
Market Share 6% 15% 26%
Best
Totals: 2016 2017 2018
Tota l Cost 878,000$ 715,500$ 911,775$
Tota l Revenue 300,000$ 1,133,333$ 2,350,000$
Tota l Cash Receipts 270,000$ 1,020,000$ 2,115,000$
Profi t (Loss ) - Cash (608,000)$ 304,500$ 1,203,225$
Operating Margin -193% 37% 61%
Market Share 2% 6% 12%
Worst

49
EzeSoft Dubai – A Business Proposal
September 2015
Proposed Funding Requirements
EzeSoft Dubai will require an initial investment of $900,000 in order to cover start-up
and operating costs for the first year. These funding requirements are relatively small when
compared against EzeSoft’s other planned capital and operating expenditures for 2016 – over
45 million dollars has been set aside for R&D alone. The figure below summarizes the
allocation of funding.
Figure 10: Allocation of Funding Requirements
The initial investment will be recouped within the first 18 months under the most
likely scenario, with a three-year return of 450% on the initial investment. Under the best
case scenario, the initial investment is recovered within the first 15 months with a three-year
return of approximately 680%. Even the worst case scenario yields a 180% return on the
initial investment.
12%
88%
Allocation of Funding
Start UpCosts
CashReserves

50
EzeSoft Dubai – A Business Proposal
September 2015
References
A.M. Best Company, Inc. (2015, August 18). Country Risk Report: United Arab Emirates.
Retrieved from www3.ambest.com/ratings/cr/reports/UnitedArabEmirates.pdf.
Bartletta, S., Beardsley, B., Donnadieu, H., Fages, R., Hapelt, C., Mace, B., Tang, T. (2014,
July 16). Global asset management 2014: Steering the course to growth.
bcg.perspectives. Retrieved from
https://www.bcgperspectives.com/content/articles/financial_institutions_global_asset
_management_2014_steering_course_growth/
Bianchi, R. J., & Drew, M. E. (2010). Hedge fund regulation and systemic risk. Griffith Law
Review, 19(1), 6-29. http://ezproxy.nyack.edu/login?url=
http://search.proquest.com/docview/747772859?accountid=38084
Buckley, M., & Hanieh, A. (2014). Diversification by urbanization: Tracing the property-
finance nexus in Dubai and the Gulf. International Journal Of Urban & Regional
Research, 38(1), 155-175. doi:10.1111/1468-2427.12084
Bunge, J., & Patterson, S. (2013, May 23). Regulator upgrades surveillance. Wall Street
Journal - Eastern Edition. pp. C1-C2
Cagliano, A. C., De Marco, A., Rafele, C., & Arese, M. (2012). A decision-making approach
for investigating the potential effects of near sourcing on supply chain. Strategic
Outsourcing: An International Journal,
\5(2), 100-120. doi:10.1108/17538291211257574
Cao, C., Liang, B., Lo, A. W., & Petrasek, L. (2014). Hedge fund holdings and stock market
efficiency. Finance and Economics Discussion Series, Division of Research &
Statistics and Monetary Affairs. Washington, DC: Federal Reserve Board.

51
EzeSoft Dubai – A Business Proposal
September 2015
Domanović, V., Jakšić, M., & Mimović, P. (2014). Balanced scorecard and analytic network
process in performance measurement and strategy evaluation: A case study. TEME:
Casopis Za Društvene Nauke, 38(4), 1457-1474.
Euromonitor International. (2015, January 23). United Arab Emirates: Country profile.
Retrieved from Global Market Information Database.
Fagel, M. J. (2014, August). Securities enforcement: 2014 mid-year securities enforcement
update. Insights, 28(8), 1-8.
Harris, G. A., Componation, P. J., & Farrington, P. A. (2010). An exploration of fisher's
framework for the alignment of supply chain strategy with product characteristics.
Engineering Management Journal, 22(4), 31-42.
Heidorn, T., Kaiser, D., & Lucke, D. (2012). The value added of hedge fund styles in multi-
asset portfolios: A new approach based on bull and bear market betas. Review of
Accounting and Finance, Vol. 12(1), 44-59. doi:10.1108/14757701311295827
Ivanov, D. (2010). An adaptive framework for aligning (re)planning decisions on supply
chain strategy, design, tactics, and operations. International Journal of Production
Research, 48(13), 3999-4017. doi:10.1080/00207540902893417
Masoud, N., & Hardaker, G. (2012). The impact of financial development on economic
growth. Studies in Economics and Finance, 29(3), 148-173.
doi:10.1108/10867371211246830
Mitra, A., & Bhardwaj, S. (2010). Alignment of supply chain strategy with business
strategy. IUP Journal of Supply Chain Management, 7(3), 49-65.
Partovi, D. (2014). Investment funds in the Dubai International Financial Centre: A lighter
touch coming? Jones Day.
52
EzeSoft Dubai – A Business Proposal
September 2015
Prahalad, C. K., & Krishnan, M. S. (2008). The new age of innovation: Driving co-created
value through global networks. New York: McGraw Hill.
Rogmans, T. (2013). Location and operation mode decision making in the Middle East: A
case study approach. Journal of Strategy and Management, 6(2), 190-206.
doi:10.1108/17554251311322440
Schroeder, R., Goldstein, S., & Rungtusanatham, M. J. (2013). Operations management in
the supply chain: Decisions and cases (6th
ed.). New York: McGraw Hill.
Shooler, L. (2014, February 10). PwC: Global assets under management (AuM) to exceed
$100 trillion by 2020 with nearly 50 percent residing in North America. Retrieved
from http://www.pwc.com/us/en/press-releases/2014/pwc-global-assets-under-
management.jhtml
United States. Congress. House of Representatives. (2009). Dodd-Frank Wall Street Reform
and Consumer Protection Act (H.R. 4173). Washington DC: U.S. Government
Printing Office.
Waksman, S. (2009, February 3). Firms team up on hedge-fund service. Wall Street Journal -
Eastern Edition. p. C3
World Economic Forum. (2014). Global Competitiveness Index Report 2014-15. Retrieved
from www.weforum.org

53
EzeSoft Dubai – A Business Proposal
September 2015
Appendix A
Sales Forecasts
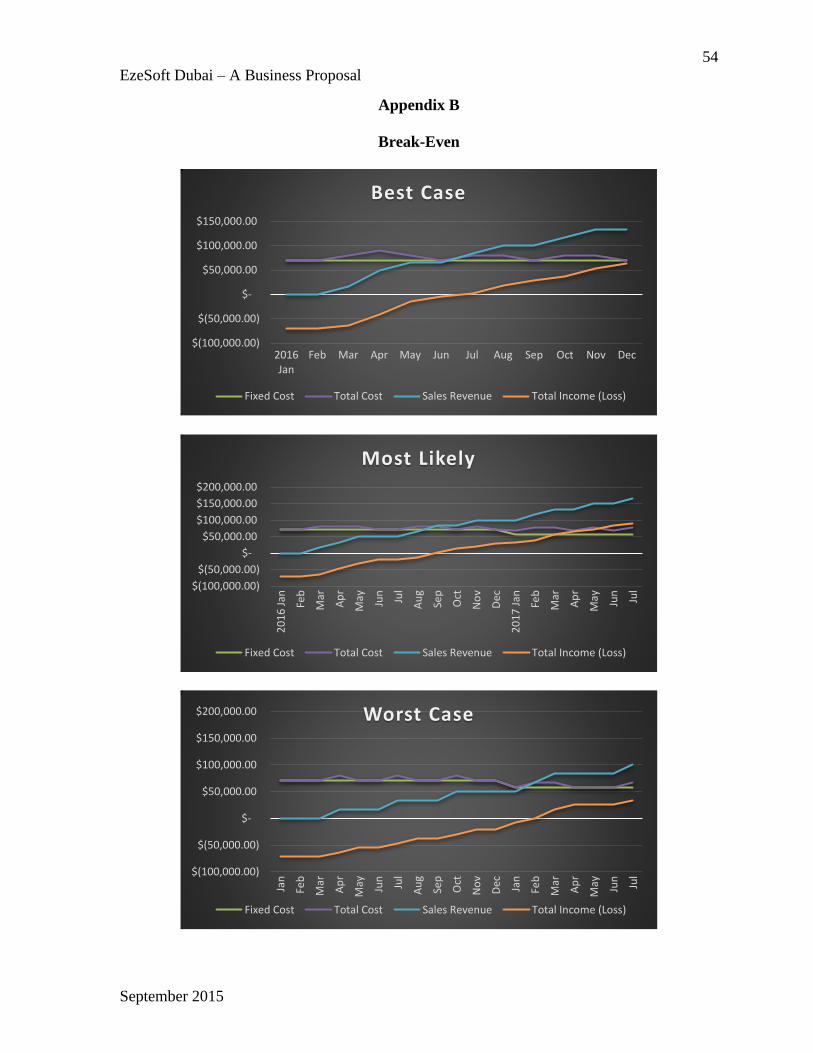
54
EzeSoft Dubai – A Business Proposal
September 2015
Appendix B
Break-Even
$(100,000.00)
$(50,000.00)
$-
$50,000.00
$100,000.00
$150,000.00
2016Jan
Feb Mar Apr May Jun Jul Aug Sep Oct Nov Dec
Best Case
Fixed Cost Total Cost Sales Revenue Total Income (Loss)
$(100,000.00)
$(50,000.00)
$-
$50,000.00
$100,000.00
$150,000.00
$200,000.00
20
16
Jan Fe
b
Mar
Ap
r
May Jun
Jul
Au
g
Sep
Oct
No
v
Dec
20
17
Jan Fe
b
Mar
Ap
r
May Jun
Jul
Most Likely
Fixed Cost Total Cost Sales Revenue Total Income (Loss)
$(100,000.00)
$(50,000.00)
$-
$50,000.00
$100,000.00
$150,000.00
$200,000.00
Jan
Feb
Mar
Ap
r
May Jun
Jul
Au
g
Sep
Oct
No
v
Dec Jan
Feb
Mar
Ap
r
May Jun
Jul
Worst Case
Fixed Cost Total Cost Sales Revenue Total Income (Loss)
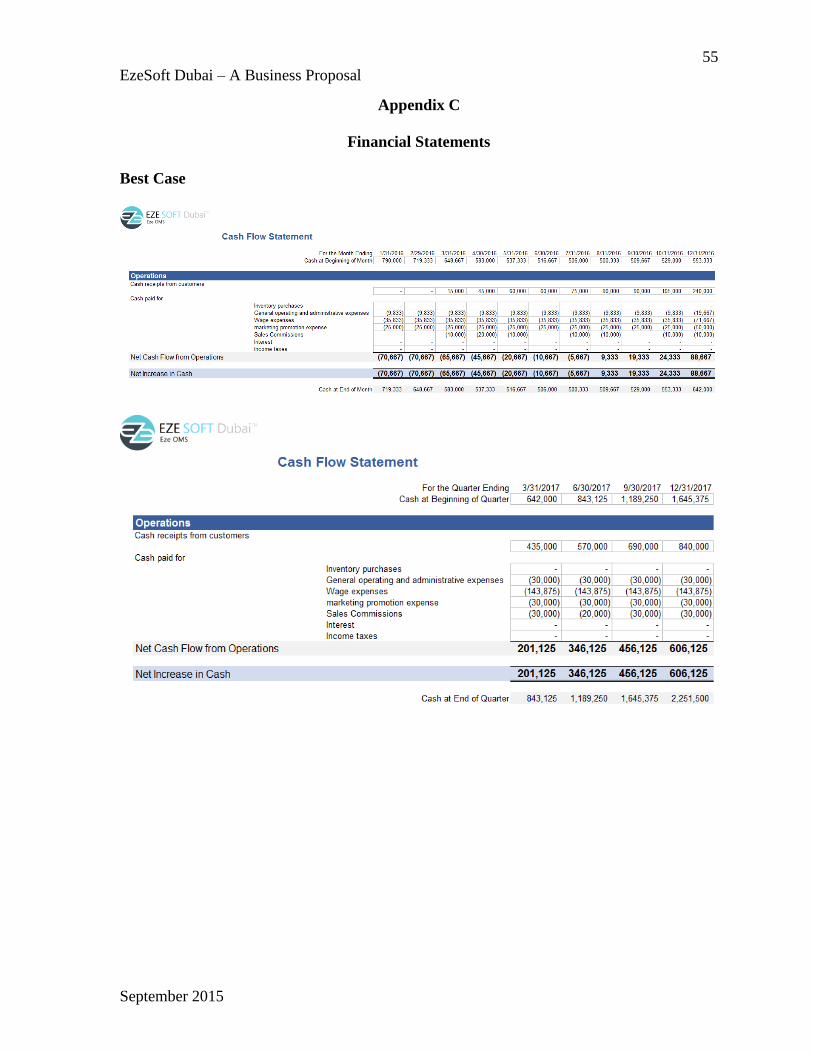
55
EzeSoft Dubai – A Business Proposal
September 2015
Appendix C
Financial Statements
Best Case

56
EzeSoft Dubai – A Business Proposal
September 2015
For the Year Ending 12/31/2018
Cash at Beginning of Year 2,251,500
OperationsCash receipts from customers
5,010,000
Cash paid for
Inventory purchases -
General operating and administrative expenses (120,000)
Wage expenses (728,275)
marketing promotion expense (120,000)
Sales Commissions (150,000)
Interest -
Income taxes -
Net Cash Flow from Operations 3,891,725
Net Increase in Cash 3,891,725
Cash at End of Year 6,143,225
Cash Flow Statement

57
EzeSoft Dubai – A Business Proposal
September 2015
Assets 2015 2016 2017 2018Current Assets
Cash 900,000 642,000 2,251,500 6,143,225
Accounts receivable - 86,667 281,667 556,667
Allowance for doubtful accounts - 86,667 368,334
Prepaid expenses
Short-term investments
Total current assets 900,000 728,667 2,619,834 7,068,226
Fixed (Long-Term) Assets
Long-term investments - - - -
Property, plant, and equipment - - - -
(Less accumulated depreciation) - - - -
Intangible assets - - - -
Total fixed assets - - - -
Other Assets
Deferred income tax
Other
Total Other Assets - - - -
Total Assets 900,000 728,667 2,619,834 7,068,226
Liabilities and Owner's EquityCurrent Liabilities
Accounts payable 110,000 - - -
Short-term loans -
Income taxes payable - - - -
Accrued salaries and wages - - -
Unearned revenue
Current portion of long-term debt
Total current liabilities 110,000 - - -
Long-Term Liabilities
Long-term debt - - -
Deferred income tax
Other
Total long-term liabilities - - - -
Owner's Equity
Owner's investment 790,000 728,667 900,000 900,000
Retained earnings - - 1,719,834 6,168,226
Other -
Total owner's equity 790,000 728,667 2,619,834 7,068,226
Total Liabilities and Owner's Equity 900,000 728,667 2,619,834 7,068,226 {42}
Common Financial RatiosDebt Ratio (Total Liabilities / Total Assets) 0.12 0.00 0.00 0.00
Current Ratio (Current Assets / Current Liabilities) 8.18
Working Capital (Current Assets - Current Liabilities) 790,000 728,667 2,619,834 7,068,226
Assets-to-Equity Ratio (Total Assets / Owner's Equity) 1.14 1.00 1.00 1.00
Debt-to-Equity Ratio (Total Liabilities / Owner's Equity) 0.14 0.00 0.00 0.00
Balance SheetFor the Years 2015-2018, Ending December 31
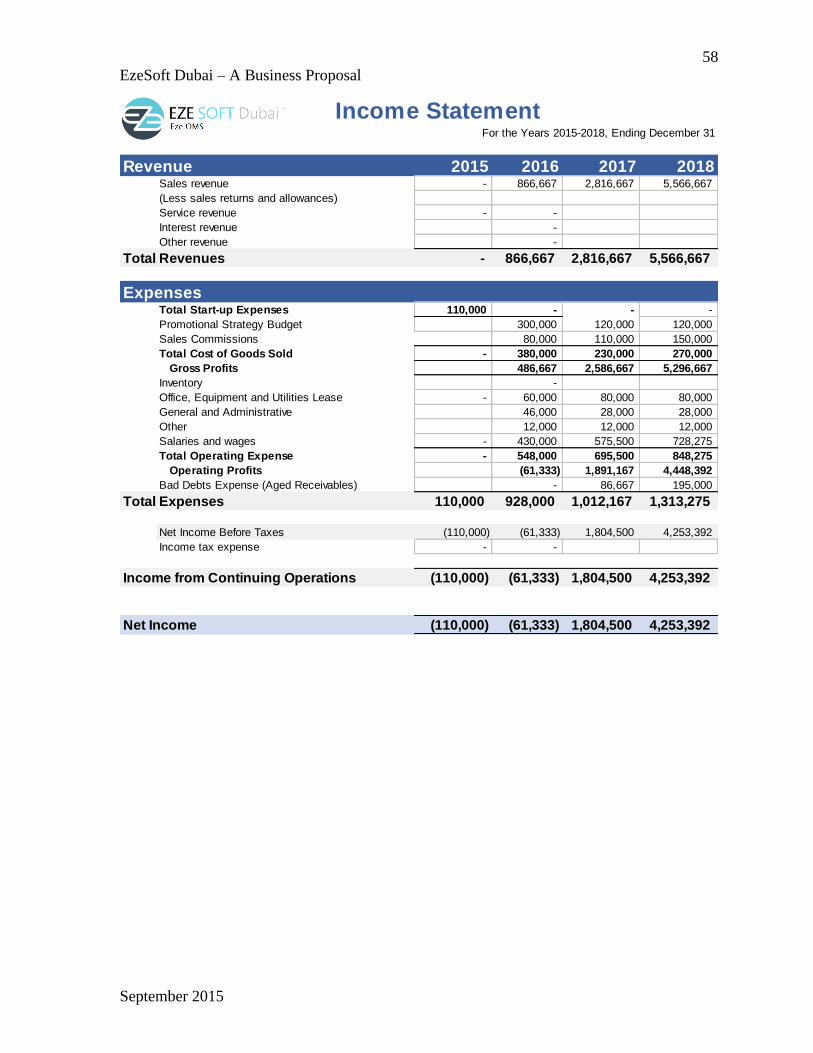
58
EzeSoft Dubai – A Business Proposal
September 2015
Revenue 2015 2016 2017 2018Sales revenue - 866,667 2,816,667 5,566,667
(Less sales returns and allowances)
Service revenue - -
Interest revenue -
Other revenue -
Total Revenues - 866,667 2,816,667 5,566,667 [42]
ExpensesTotal Start-up Expenses 110,000 - - -
Promotional Strategy Budget 300,000 120,000 120,000
Sales Commissions 80,000 110,000 150,000
Total Cost of Goods Sold - 380,000 230,000 270,000
Gross Profits 486,667 2,586,667 5,296,667
Inventory -
Office, Equipment and Utilities Lease - 60,000 80,000 80,000
General and Administrative 46,000 28,000 28,000
Other 12,000 12,000 12,000
Salaries and wages - 430,000 575,500 728,275
Total Operating Expense - 548,000 695,500 848,275
Operating Profits (61,333) 1,891,167 4,448,392
Bad Debts Expense (Aged Receivables) - 86,667 195,000
Total Expenses 110,000 928,000 1,012,167 1,313,275
Net Income Before Taxes (110,000) (61,333) 1,804,500 4,253,392
Income tax expense - -
Income from Continuing Operations (110,000) (61,333) 1,804,500 4,253,392 {42} [42]
Net Income (110,000) (61,333) 1,804,500 4,253,392
For the Years 2015-2018, Ending December 31
Income Statement
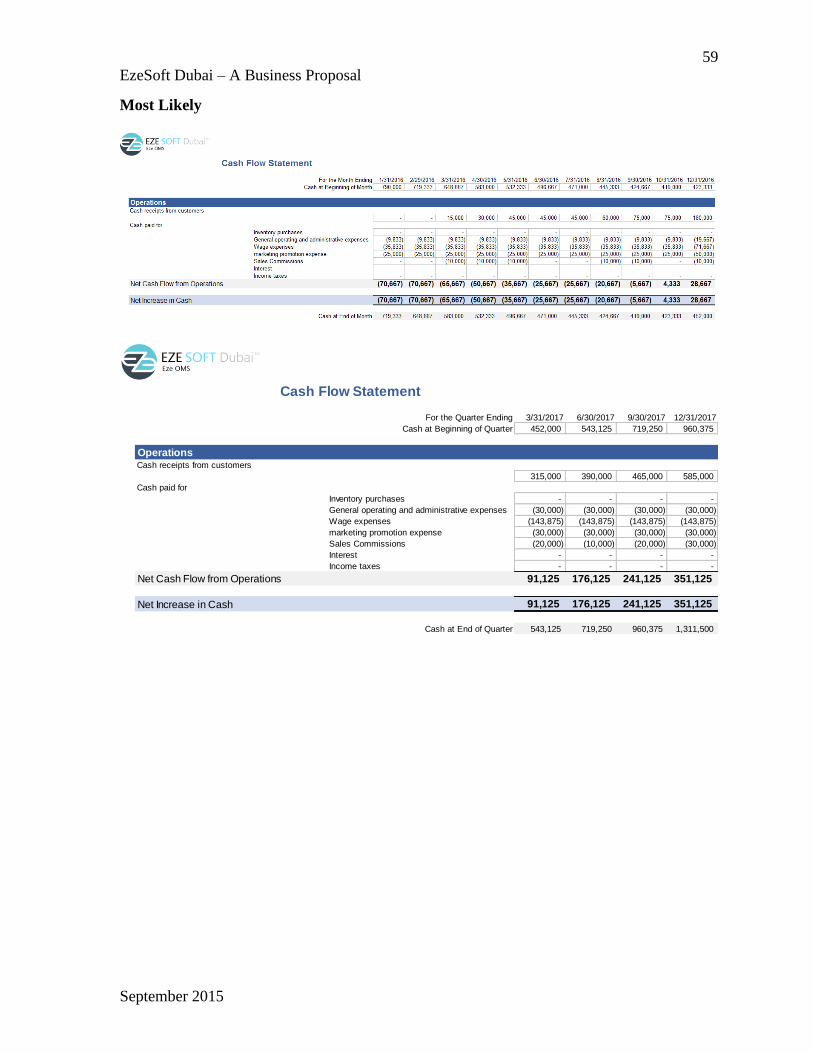
59
EzeSoft Dubai – A Business Proposal
September 2015
Most Likely
For the Quarter Ending 3/31/2017 6/30/2017 9/30/2017 12/31/2017
Cash at Beginning of Quarter 452,000 543,125 719,250 960,375
OperationsCash receipts from customers
315,000 390,000 465,000 585,000
Cash paid for
Inventory purchases - - - -
General operating and administrative expenses (30,000) (30,000) (30,000) (30,000)
Wage expenses (143,875) (143,875) (143,875) (143,875)
marketing promotion expense (30,000) (30,000) (30,000) (30,000)
Sales Commissions (20,000) (10,000) (20,000) (30,000)
Interest - - - -
Income taxes - - - -
Net Cash Flow from Operations 91,125 176,125 241,125 351,125
Net Increase in Cash 91,125 176,125 241,125 351,125
Cash at End of Quarter 543,125 719,250 960,375 1,311,500
Cash Flow Statement

60
EzeSoft Dubai – A Business Proposal
September 2015
For the Year Ending 12/31/2018
Cash at Beginning of Year 1,311,500
OperationsCash receipts from customers
3,795,000
Cash paid for
Inventory purchases -
General operating and administrative expenses (120,000)
Wage expenses (598,275)
marketing promotion expense (120,000)
Sales Commissions (120,000)
Interest -
Income taxes -
Net Cash Flow from Operations 2,836,725
Net Increase in Cash 2,836,725
Cash at End of Year 4,148,225
Cash Flow Statement
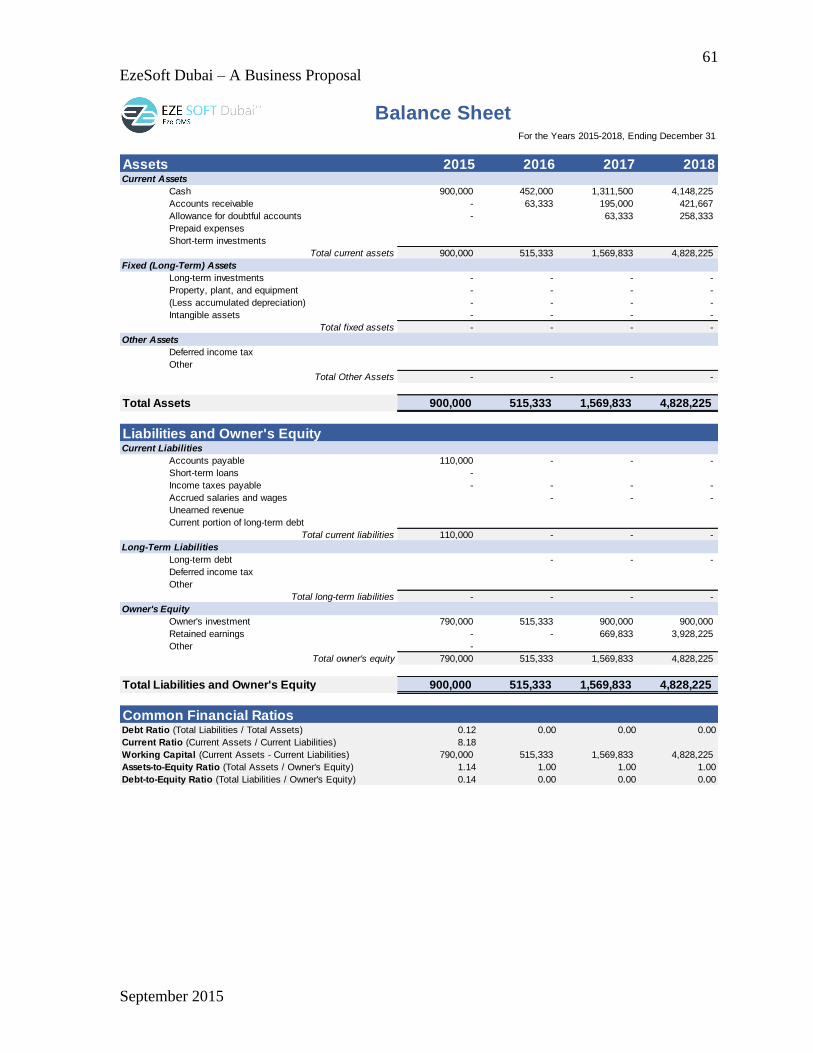
61
EzeSoft Dubai – A Business Proposal
September 2015
Assets 2015 2016 2017 2018Current Assets
Cash 900,000 452,000 1,311,500 4,148,225
Accounts receivable - 63,333 195,000 421,667
Allowance for doubtful accounts - 63,333 258,333
Prepaid expenses
Short-term investments
Total current assets 900,000 515,333 1,569,833 4,828,225
Fixed (Long-Term) Assets
Long-term investments - - - -
Property, plant, and equipment - - - -
(Less accumulated depreciation) - - - -
Intangible assets - - - -
Total fixed assets - - - -
Other Assets
Deferred income tax
Other
Total Other Assets - - - -
Total Assets 900,000 515,333 1,569,833 4,828,225
Liabilities and Owner's EquityCurrent Liabilities
Accounts payable 110,000 - - -
Short-term loans -
Income taxes payable - - - -
Accrued salaries and wages - - -
Unearned revenue
Current portion of long-term debt
Total current liabilities 110,000 - - -
Long-Term Liabilities
Long-term debt - - -
Deferred income tax
Other
Total long-term liabilities - - - -
Owner's Equity
Owner's investment 790,000 515,333 900,000 900,000
Retained earnings - - 669,833 3,928,225
Other -
Total owner's equity 790,000 515,333 1,569,833 4,828,225
Total Liabilities and Owner's Equity 900,000 515,333 1,569,833 4,828,225 {42}
Common Financial RatiosDebt Ratio (Total Liabilities / Total Assets) 0.12 0.00 0.00 0.00
Current Ratio (Current Assets / Current Liabilities) 8.18
Working Capital (Current Assets - Current Liabilities) 790,000 515,333 1,569,833 4,828,225
Assets-to-Equity Ratio (Total Assets / Owner's Equity) 1.14 1.00 1.00 1.00
Debt-to-Equity Ratio (Total Liabilities / Owner's Equity) 0.14 0.00 0.00 0.00
Balance SheetFor the Years 2015-2018, Ending December 31

62
EzeSoft Dubai – A Business Proposal
September 2015
Revenue 2015 2016 2017 2018Sales revenue - 633,333 1,950,000 4,216,667
(Less sales returns and allowances)
Service revenue - -
Interest revenue -
Other revenue -
Total Revenues - 633,333 1,950,000 4,216,667 [42]
ExpensesTotal Start-up Expenses 110,000 - - -
Promotional Strategy Budget 300,000 120,000 120,000
Sales Commissions 60,000 80,000 120,000
Total Cost of Goods Sold - 360,000 200,000 240,000
Gross Profits 273,333 1,750,000 3,976,667
Inventory -
Office, Equipment and Utilities Lease - 60,000 80,000 80,000
General and Administrative 46,000 28,000 28,000
Other 12,000 12,000 12,000
Salaries and wages - 430,000 575,500 598,275
Total Operating Expense - 548,000 695,500 718,275
Operating Profits (274,667) 1,054,500 3,258,392
Bad Debts Expense (Aged Receivables) - 63,333 195,000
Total Expenses 110,000 908,000 958,833 1,153,275
Net Income Before Taxes (110,000) (274,667) 991,167 3,063,392
Income tax expense - -
Income from Continuing Operations (110,000) (274,667) 991,167 3,063,392 {42} [42]
Net Income (110,000) (274,667) 991,167 3,063,392
For the Years 2015-2018, Ending December 31
Income Statement

63
EzeSoft Dubai – A Business Proposal
September 2015
Worst Case
For the Month Ending 1/31/2016 2/29/2016 3/31/2016 4/30/2016 5/31/2016 6/30/2016 7/31/2016 8/31/2016 9/30/2016 10/31/2016 12/31/2016
Cash at Beginning of Month 790,000 719,333 648,667 578,000 512,333 456,667 401,000 350,333 309,667 269,000 233,333
OperationsCash receipts from customers
- - - 15,000 15,000 15,000 30,000 30,000 30,000 45,000 90,000
Cash paid for
Inventory purchases - - - - - - - - - - -
General operating and administrative expenses (9,833) (9,833) (9,833) (9,833) (9,833) (9,833) (9,833) (9,833) (9,833) (9,833) (19,667)
Wage expenses (35,833) (35,833) (35,833) (35,833) (35,833) (35,833) (35,833) (35,833) (35,833) (35,833) (71,667)
marketing promotion expense (25,000) (25,000) (25,000) (25,000) (25,000) (25,000) (25,000) (25,000) (25,000) (25,000) (50,000)
Sales Commissions - - - (10,000) - - (10,000) - - (10,000) -
Interest - - - - - - - - - - -
Income taxes - - - - - - - - - - -
Net Cash Flow from Operations (70,667) (70,667) (70,667) (65,667) (55,667) (55,667) (50,667) (40,667) (40,667) (35,667) (51,333)
Net Increase in Cash (70,667) (70,667) (70,667) (65,667) (55,667) (55,667) (50,667) (40,667) (40,667) (35,667) (51,333)
Cash at End of Month 719,333 648,667 578,000 512,333 456,667 401,000 350,333 309,667 269,000 233,333 182,000
Cash Flow Statement
For the Quarter Ending 1/31/2017 2/28/2017 3/31/2017 6/30/2017 9/30/2017 12/31/2017
Cash at Beginning of Quarter 182,000 171,542 166,083 175,625 234,250 327,875
OperationsCash receipts from customers
45,000 60,000 75,000 225,000 270,000 345,000
Cash paid for
Inventory purchases - - - - - -
General operating and administrative expenses (8,333) (8,333) (8,333) (25,000) (25,000) (25,000)
Wage expenses (37,125) (37,125) (37,125) (111,375) (111,375) (111,375)
marketing promotion expense (10,000) (10,000) (10,000) (30,000) (30,000) (30,000)
Sales Commissions - (10,000) (10,000) - (10,000) (20,000)
Interest - - - - - -
Income taxes - - - - - -
Net Cash Flow from Operations (10,458) (5,458) 9,542 58,625 93,625 158,625
Net Increase in Cash (10,458) (5,458) 9,542 58,625 93,625 158,625
Cash at End of Quarter 171,542 166,083 175,625 234,250 327,875 486,500
Cash Flow Statement
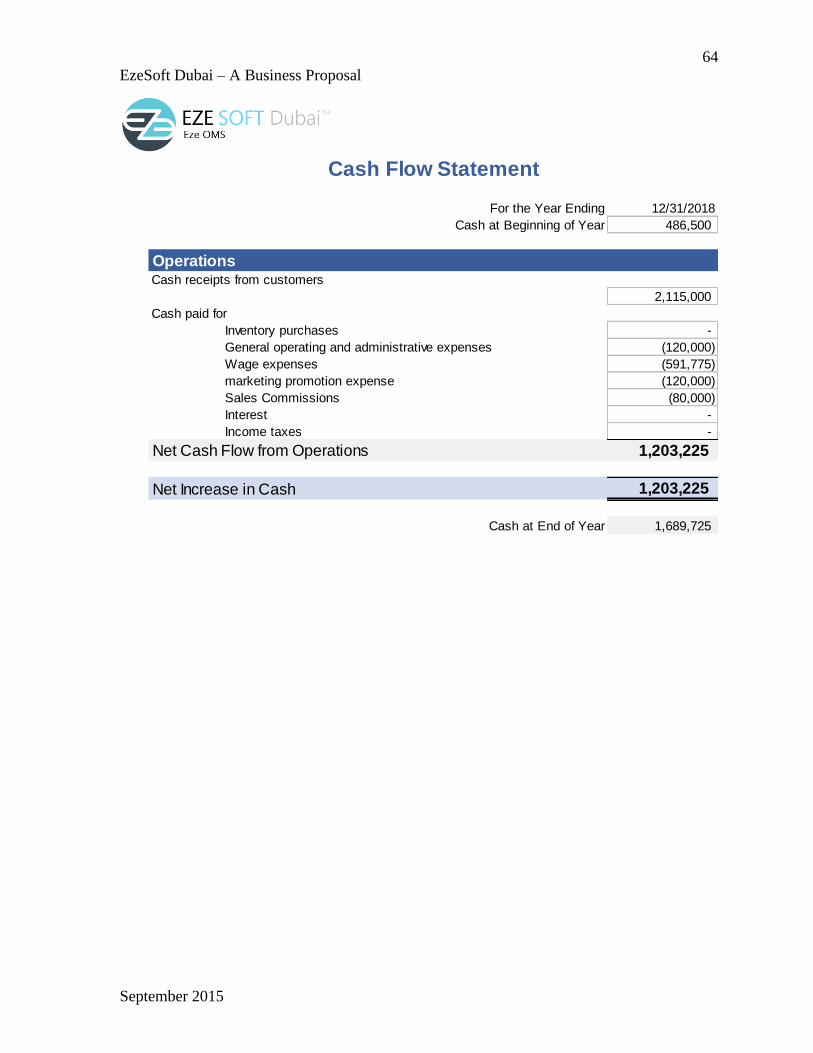
64
EzeSoft Dubai – A Business Proposal
September 2015
For the Year Ending 12/31/2018
Cash at Beginning of Year 486,500
OperationsCash receipts from customers
2,115,000
Cash paid for
Inventory purchases -
General operating and administrative expenses (120,000)
Wage expenses (591,775)
marketing promotion expense (120,000)
Sales Commissions (80,000)
Interest -
Income taxes -
Net Cash Flow from Operations 1,203,225
Net Increase in Cash 1,203,225
Cash at End of Year 1,689,725
Cash Flow Statement

65
EzeSoft Dubai – A Business Proposal
September 2015
Assets 2016 2015 2017 2018Current Assets
Cash 182,000 900,000 486,500 1,689,725
Accounts receivable 30,000 - 113,333 235,000
Allowance for doubtful accounts - - 30,000 143,333
Prepaid expenses - -
Short-term investments - -
Total current assets 212,000 900,000 629,833 2,068,058
Fixed (Long-Term) Assets
Long-term investments - - - -
Property, plant, and equipment - - - -
(Less accumulated depreciation) - - - -
Intangible assets - - - -
Total fixed assets - - - -
Other Assets
Deferred income tax - -
Other - -
Total Other Assets - - - -
Total Assets 212,000 900,000 629,833 2,068,058
Liabilities and Owner's EquityCurrent Liabilities
Accounts payable - 110,000 - -
Short-term loans -
Income taxes payable - - - -
Accrued salaries and wages - - -
Unearned revenue
Current portion of long-term debt
Total current liabilities - 110,000 - -
Long-Term Liabilities
Long-term debt - - -
Deferred income tax
Other
Total long-term liabilities - - - -
Owner's Equity
Owner's investment 212,000 790,000 629,833 900,000
Retained earnings - - - 1,168,058
Other -
Total owner's equity 212,000 790,000 629,833 2,068,058
Total Liabilities and Owner's Equity 212,000 900,000 629,833 2,068,058 {42}
Common Financial RatiosDebt Ratio (Total Liabilities / Total Assets) 0.00 0.12 0.00 0.00
Current Ratio (Current Assets / Current Liabilities) 8.18
Working Capital (Current Assets - Current Liabilities) 212,000 790,000 629,833 2,068,058
Assets-to-Equity Ratio (Total Assets / Owner's Equity) 1.00 1.14 1.00 1.00
Debt-to-Equity Ratio (Total Liabilities / Owner's Equity) 0.00 0.14 0.00 0.00
Balance SheetFor the Years 2015-2018, Ending December 31

66
EzeSoft Dubai – A Business Proposal
September 2015
Revenue 2015 2016 2017 2018Sales revenue - 300,000 1,133,333 2,350,000
(Less sales returns and allowances)
Service revenue - -
Interest revenue -
Other revenue -
Total Revenues - 300,000 1,133,333 2,350,000 [42]
ExpensesTotal Start-up Expenses 110,000 - - -
Promotional Strategy Budget 300,000 120,000 120,000
Sales Commissions 30,000 50,000 80,000
Total Cost of Goods Sold - 330,000 170,000 200,000
Gross Profits (30,000) 963,333 2,150,000
Inventory -
Office, Equipment and Utilities Lease - 60,000 60,000 80,000
General and Administrative 46,000 28,000 28,000
Other 12,000 12,000 12,000
Salaries and wages - 430,000 445,500 591,775
Total Operating Expense - 548,000 545,500 711,775
Operating Profits (578,000) 417,833 1,438,225
Bad Debts Expense (Aged Receivables) - 30,000 113,333
Total Expenses 110,000 878,000 745,500 1,025,108
Net Income Before Taxes (110,000) (578,000) 387,833 1,324,892
Income tax expense - -
Income from Continuing Operations (110,000) (578,000) 387,833 1,324,892 {42} [42]
Net Income (110,000) (578,000) 387,833 1,324,892
For the Years 2015-2018, Ending December 31
Income Statement

67
EzeSoft Dubai – A Business Proposal
September 2015
Disclaimer
The above business plan outline was developed and created from information gathered in the
text book “The New Venture Creation: Entrepreneurship for the 21st Century.” Details on
the entire content in this document can be reviewed on pages 256-266. This document was
intended as a tool or template to be used by Nyack Graduate School of Business and
Leadership students in the pursuit of the degree of MBA. Any comments, suggested
modifications or questions should be directed to the MBA Director.