Embed Size (px)
Citation preview

1
NY/NJ BAYKEEPER EASTERN OYSTER REINTRODUCTION FEASIBILITY STUDY
PREPARED BY RUTGERS CENTER FOR URBAN ENVIRONMENTAL SUSTAINABILITY (CUES)
FINAL REPORT (2007 – 2013)

2
The purpose of this research is to provide
NY/NJ Baykeeper with information related to
their mission to restore oyster-reef based habitat
within the Hudson-Raritan Estuary.
Year 7: 2013 YEAR END REPORT
FINAL Conservation Resources Inc. (CRI) Project Report

3
Contributors to this report include:
Rutgers University Center for Urban Environmental Sustainability
(CUES)
Beth Ravit, PhD Keith Cooper, PhD
Richard Lathrop, PhD Robert Miskewitz, PhD
Stephanie Quierolo Lauren Huey
Valentina Noto Sean Walsh
NY/NJ Baykeeper Contributors
Meredith Comi Frank Steimle Chrissy Lynn
Mike Aquafreda Captain Rick Jacks

4
EEXXEECCUUTTIIVVEE SSUUMMMMAARRYY
Beginning in the 1970’s, the passage of environmental regulations has resulted in waters
of the NY/NJ harbor estuary becoming progressively cleaner. The Harbor Estuary
Program, in collaboration with the U.S. Army Corps of Engineers, US Environmental
Protection Agency, US Fish & Wildlife, NOAA, the Port Authority of New York & New
Jersey, Hudson River Foundation, and NY/NJ Baykeeper, completed a Draft
Comprehensive Restoration Plan for the Hudson-Raritan Estuary (HRE), which
includes the goal to reestablish 200 acres of Eastern Oyster (Crassotrea virginica) reef by
2020. However, due to both historic and/or current anthropogenic activities and
contaminant inputs into the estuary, there are important issues to consider when
identifying the ideal location(s) for oyster reintroduction projects in Raritan Bay and the
HRE at large. The HRE oyster restoration goal is not to re-establish a commercial
fishery in waters where contaminated sediments are still present. Reintroduction of the
oyster is a mechanism to support continued improvements in water quality, to
reestablish and enhance habitat conducive to the survival of other aquatic species, and
to increase natural ‘green’ infrastructure that contributes to reduction in shoreline
erosion and sediment stabilization.
In brackish estuaries of the northern US, subtidal oyster beds were commonly an
important component of the benthic ecosystem. Oyster formation of dense
aggregations provides structural heterogeneity and vertical topography, which create
an ecologically complex habitat for all trophic levels. The ability to create this vertical
habitat feature, unique to oysters among local shellfish, is the reason these animals are
considered to be ecological engineers, a characteristic not attributed to other local
bivalve species.

5
The Hudson-Raritan Estuary has been identified as a “hot spot” with respect to relative
sea level rise (SLR). Measurements taken at The Battery, NY, Sandy Hook and Atlantic
City, NJ over the last 78 – 100 years indicate that sea levels in the region are rising at a
rate of up to 4 mm/yr, a much faster increase than the predicted global average. This
local rate of SLR is believed to be due to a confluence of three factors: overall ocean
volume expansion due to warming and an increase in ice melt; local subsidence of the
land caused by retreat of the last glacier; and changes in the Atlantic current circulation
patterns. Raritan Bay is also subject to frequent tropical storms and periodic hurricanes.
The devastation caused by SuperStorm Sandy is causing HRE communities to consider
resiliency options that address sea level rise-induced flooding, storm surges, and
shoreline erosion. Depending on site-specific conditions, the presence of an oyster reef
system might contribute to shoreline protection, providing an alternative to “hard-
edge” armoring of vulnerable shorelines.
In anthropogenically impacted urban estuaries such as the HRE, the absence of adult
oyster populations, insufficient larval densities, altered hydrology and/or the presence
of emerging and historic contaminants may overshadow physio-chemical factors
required to support oyster reintroduction goals. Habitat selection is a critical issue in
successful reintroductions, which often fail because ‘apparently similar’ habit is actually
unsuitable.
KKEEYYPPOORRTT HHAARRBBOORR
Prior to implementing large scale oyster reintroduction activities, it is critical to
understand the existing baseline conditions at a proposed reintroduction site. Two
western Raritan Bay locations approximately 4.5 miles apart (the NJDEP-permitted
Keyport Harbor and the non-NJDEP permitted Sayreville) were compared for their
ability to support oyster over-winter survival. Although visually similar, the
significantly higher survival and growth rates exhibited by oysters housed at the

6
Keyport site caused us to choose to focus reintroduction efforts on this location.
A ¼-acre oyster ‘reef’ was installed at Keyport Harbor in October, 2009 to test three
alternative oyster support structures – Reefblk™, Reefball™, and a Rutgers designed
‘Arch’ structure. After one year in situ, oyster survival and growth appear to be greatest
for spat-on-shell housed in the Reefblk™ structure. However, the research seed oysters
were approaching the NJ ‘market size’ of 2.5”, and in August, 2010 the NJDEP
rescinded Baykeeper’s required permits, causing the death of an estimated 30,000
oysters. Tissues of specimens sampled from this experiment were healthy and the
oysters appeared to be capable of spawning. Marine community diversity associated
with the oysters appeared to be much greater than adjacent waters without oysters.
However, since the research time frame was less than one year, it would be premature
to draw conclusions from the Keyport data.
OOYYSSTTEERR TTIISSSSUUEE AANNAALLYYSSEESS
To determine overall oyster health and fitness live samples were obtained from the
various Baykeeper oyster locations (Keyport Harbor, NYC Oyster Restoration Research
Project (ORRP) sites, Baykeeper NYC oyster garden sites), and the specimens were
analyzed. Oysters from Keyport Harbor, Soundview, Hastings on Hudson, and the
Gowanus Canal were also analyzed to determine metal concentrations in the body soft
tissues and shell. Total mean metal concentrations were lowest in the Keyport Harbor
samples and highest in oysters from the New York locations. Based on the experiments
conducted to date it is not possible to correlate oyster soft tissue damage with the
presence of specific metal contaminants. However, the overall health and fitness of the
oysters appears to be very site-specific.

7
Although oysters were able to survive and grow in the various locations we found that
overall oyster health and fitness as evaluated by the number of lesions observed in soft
tissues did not correlate to shell morphology (i.e. large shelled oysters could not
automatically be assumed to be healthy).
RREEIINNTTRROODDUUCCTTIIOONN HHAABBIITTAATT MMAAPPPPIINNGG PPRROOJJEECCTT
Survival and growth data, supported by soft tissue analyses, suggest that there are
locations in the historically contaminated HRE where oysters can indeed survive and
thrive. Potential oyster restoration sites identified in the CRP (2009) were determined by
considering four characteristics required for oyster larvae survival: dissolved oxygen
concentrations, total suspended solids, salinity, and bathymetry. However, our research
indicates that HRE environmental stressors are quite site-specific, and so the macro-
scale CRP (2009) map needs to be ‘ground-truthed’ at a more site-specific micro-scale.
An extensive, but inexpensive survey of the HRE is needed to identify sites that could
potentially contribute to meeting the CRP oyster restoration goals for the HRE. Twenty-
three characteristics that could affect oyster survival were identified and approximately
30 miles along the NJ Raritan Bayshore and the southern shore of Staten Island were
evaluated. Sites that achieved a high score in this evaluation were overlaid on NOAA
bathymetry maps to determine the associated acreage in the 3 to 10 feet depth range at
Mean Low Tide. This analysis indicates that the CRP (2009) goal of 200 acres of newly
reintroduced oyster habitat is achievable, depending on support from the NJ/NY
regulatory agencies.
A CUES-Baykeeper Oyster Restoration Site Selection Model was developed, which adds
an in situ biological evaluation to the current physio-chemical parameters commonly
employed to determine potential reintroduction sites.

8
NNAAVVAALL WWEEAAPPOONNSS SSTTAATTIIOONN EEAARRLLEE ((NNWWSSEE))
As an alternative to the NJDEP-prohibited Keyport oyster restoration site, the
Baykeeper oyster setting facility and reintroduction research have been transferred to
Naval Weapons Station Earle (NWSE) located in Middletown, NJ. Over-winter survival
rates (2011-2012) were abnormally high (90% survival of the oysters recovered), and so
the decision was made to expand the research footprint in two phases. The first phase is
to recreate the 18 field research plots originally established in Keyport Harbor, and if
successful, to expand oyster reintroduction up to the NJDEP-permitted 10-plus acre
footprint between the NWSE piers. The proposed installation and data monitoring plan
has been approved by the navy. After the navy sonar sweep of the area is complete, we
anticipate installation of the field plots in summer, 2014.
PPUUBBLLIICCAATTIIOONNSS
The Baykeeper oyster restoration project has resulted in publications related to
reintroduction of oysters into the Hudson-Raritan Estuary, including:
1. Eastern oysters (Crassostrea virginica) in the Hudson-Raritan Estuary: Restoration, research, and shellfishery Policy. B. Ravit, M. Comi, D. Mans, C. Lynn, F. Steimle, S. Walsh, R. Miskewitz, S. Quierolo. Environmental Practice. 2012.
2. Improving management support tools for reintroducing bivalve species in urban estuaries. B. Ravit, K. Cooper, B. Buckley, and M. Comi. Integrated Environmental Assessment and Management. Submitted.
3. 2011-2012: Raritan Bay Mapping Study: Pre-Superstorm Sandy. B. Ravit, M. Usarek-Witek, R. Lathrop, M. Comi., F. Steimle, M. Aquafreda. Submitted to USACE. 2013.
4. Citizen scientists, NGOs, and reintroduction of the eastern oyster in an urban estuary. Journal of Contemporary Water Research & Education. In Preparation.

9
We anticipate that the ongoing research at Naval Weapons Station Earle will continue to
increase knowledge related to reintroduction of an ‘ecologically extinct’ bivalve to an
urban estuary, and that this data will result in additional peer-reviewed publications.
CCOONNCCLLUUSSIIOONNSS
Research conducted in the HRE between 2007 – 2013 indicates that there are
viable locations, especially in Raritan Bay, where reintroduction of the Eastern
Oyster may be successful. However, the long-term sustainability of these
introductions will be quite site specific. Therefore, an inexpensive, but
thorough, evaluation is necessary prior to investing large sums of money and
time in order to ensure the locations selected will be successful.

10
II .. HHUUDDSSOONN--RRAARRIITTAANN OOYYSSTTEERR RREEIINNTTRROODDUUCCTTIIOONN:: BBAACCKKGGRROOUUNNDD AANNDD BBEENNEEFFIITTSS
NNYY//NNJJ HHAARRBBOORR EESSTTUUAARRYY RREESSTTOORRAATTIIOONN GGOOAALLSS
Human activities occurring in the 19th and 20th centuries negatively affected the
ecological integrity of numerous ecosystems in the New York/New Jersey (NY/NJ)
region (Jackson 2001), including the once vast Hudson-Raritan Estuary (HRE) oyster
fishery (McCay 1998). However, beginning in the 1970’s, passage of environmental
regulations has resulted in waters of the NY/NJ harbor estuary becoming progressively
cleaner. As a result of these improvements in water quality it is now possible that
aquatic species, which have been either ‘ecologically extinct’ from the region’s coastline
for decades or present in greatly reduced numbers, may now be restored in locations
where they were historically present. The active reintroduction of aquatic species that
were once abundant in waters of the HRE, particularly the Eastern Oyster (Crassotrea
virginica), could potentially support further improvements in water quality, contribute
to stabilization of coastal shorelines, and accelerate ecosystem level restoration
processes.
NY/NJ Baykeeper has been the lead non-governmental organization (NGO) focusing
on benthic habitat restoration, specifically reintroduction of the Eastern Oyster, in the
HRE. In 2007 Baykeeper was awarded a Supplemental Environmental Penalty in
compensation for environmental damages sustained in the Arthur Kill as the result of a
Chevron oil spill. The funds were dedicated to oyster restoration in western Raritan
Bay. The sustainable growth of oyster reefs could contribute to achieving Baykeeper’s
goal of Raritan Bay aquatic and benthic habitat restoration, providing estuarine habitat
for native fin fish and benthic species, and stabilizing the Raritan Bay shoreline.

11
However, due to both historic and/or current anthropogenic activities and contaminant
inputs into the estuary, there are important issues to consider with respect to human
and ecosystem health when identifying potential location(s) for oyster reintroduction
projects in the HRE.
The restoration of a variety of ecological systems within the HRE is conceptually
supported by a wide range of Harbor Estuary Program (HEP) partners (Bain et al. 2005,
TEC 2007), including Federal, State (NY and NJ), and NGOs. Partners in the HEP
program that participated with NY and NJ in developing the draft Comprehensive
Restoration Plan (CRP 2009) for the Hudson-Raritan Estuary include the US Army
Corps of Engineers, US Environmental Protection Agency, US Fish & Wildlife Service,
NOAA, the Port Authority of New York & New Jersey, Hudson River Foundation, and
NY/NJ Baykeeper. Meeting the CRP (2009) restoration goals will provide critical
habitat for native fin fish and benthic invertebrates, while contributing to continued
improvements in water quality and the overall quality of human life within the HRE.
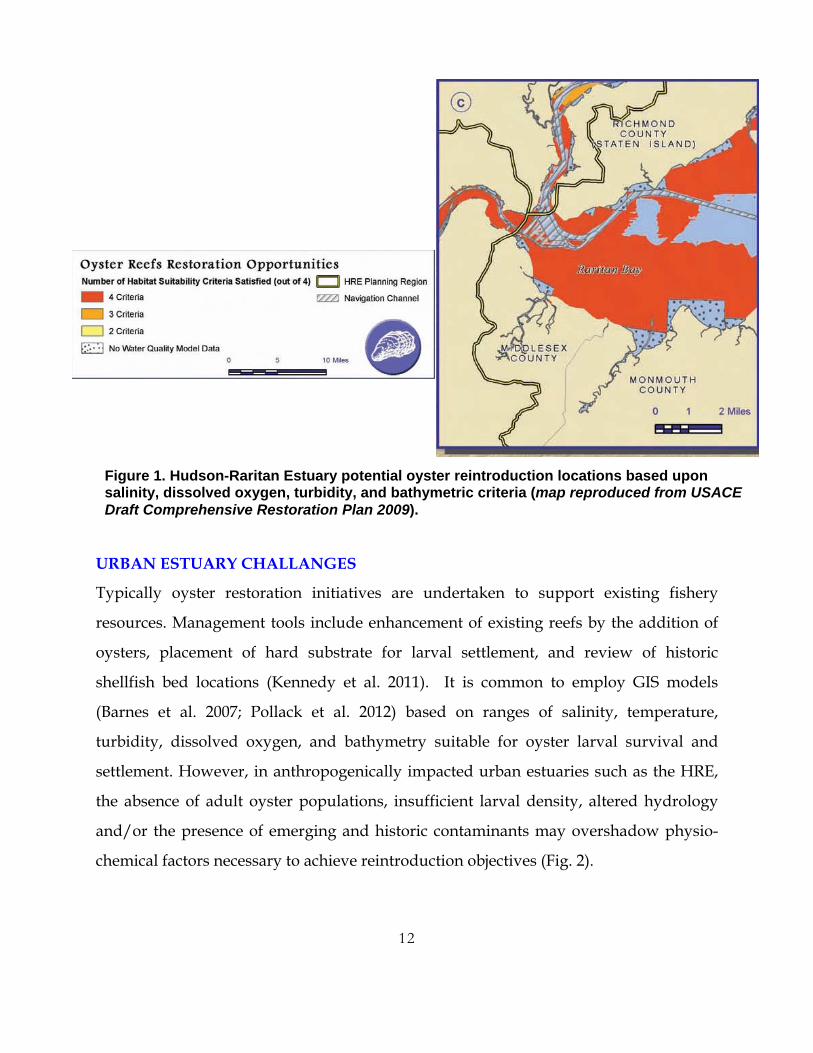
Large-scale oyster reintroduction is an important factor in achieving the long-term CRP
restoration targets, and the plan calls for reestablishment of 200-acres of oyster reef (Fig.
1) by 2020 (CRP 2009). There is anecdotal evidence that small wild oyster populations
are living in isolated locations within the HRE (T. Medley, personal communication).
Although restoration of benthic habitat is viewed by various constituencies as an
important goal, it is also one of the most difficult to achieve, due to both historic and
ongoing contamination within the HRE (CARP 2007). However, these restoration goals
are not to re-establish a commercial fishery in waters where contaminated sediments
are still present. Establishment of oyster reefs is a mechanism that, if successful, would
support continued improvements in water quality, reestablish and enhance habitat
conducive to the survival of other aquatic species, and increase natural ‘green’
infrastructure that contributes to reduction in shoreline erosion.
12
URBAN ESTUARY CHALLANGES
Typically oyster restoration initiatives are undertaken to support existing fishery
resources. Management tools include enhancement of existing reefs by the addition of
oysters, placement of hard substrate for larval settlement, and review of historic
shellfish bed locations (Kennedy et al. 2011). It is common to employ GIS models
(Barnes et al. 2007; Pollack et al. 2012) based on ranges of salinity, temperature,
turbidity, dissolved oxygen, and bathymetry suitable for oyster larval survival and
settlement. However, in anthropogenically impacted urban estuaries such as the HRE,
the absence of adult oyster populations, insufficient larval density, altered hydrology
and/or the presence of emerging and historic contaminants may overshadow physio-
chemical factors necessary to achieve reintroduction objectives (Fig. 2).
Figure 1. Hudson-Raritan Estuary potential oyster reintroduction locations based upon salinity, dissolved oxygen, turbidity, and bathymetric criteria (map reproduced from USACE Draft Comprehensive Restoration Plan 2009).

13
Habitat selection is a critical issue in successful animal reintroductions (Mihoub et al.
2009), which often fail because ‘apparently similar’ habit is actually unsuitable;
identifying successful reintroduction sites can be challenging, often due to
environmental changes since extinction of the target species (Hodder & Bullock 1997).
Additionally, the original food webs may be missing or replaced with a food supply
that does not meet the nutritional requirements of the reintroduced species. Under the
non-natural conditions common in urban estuaries, sites available for restoration are
typically limited (Simenstad et al. 2005).
HHUUDDSSOONN--RRAARRIITTAANN EESSTTUUAARRYY EEAASSTTEERRNN OOYYSSTTEERR RREEIINNTTRROODDUUCCTTIIOONN
Since placing shell on Liberty Flats in 1999, NY/NJ Baykeeper has been the lead NGO
focusing on oyster habitat reintroduction to the HRE. However, due to both historic
and/or current anthropogenic activities and contaminant inputs to the HRE, there are
important management questions to consider when identifying potential sites suitable
for reintroduction activities. Although shellfish water regulatory designations do not
Figure 2. Venn diagram illustrating the interaction of multiple environmental parameters
that determine oyster reintroduction success in an urban estuary.
14
take into account organic and metal contaminant loadings, due to the levels of fecal
coliform bacteria in western portions of Raritan Bay, much of the Bay’s waters are
categorized by the NJDEP Bureau of Marine Water Monitoring as “Special Restricted” or
“Prohibited” with respect to a commercial fishery. Shellfish surviving in “Prohibited”
waters cannot be harvested for sale or human consumption, and so the purpose of
reintroducing oysters in “Prohibited” waters is for habitat value only. However, creating
a critical mass of adult oysters in Raritan Bay could potentially result in larval
production sufficient to colonize existing substrate, both in the Bay and at other HRE
locations that were historically colonized by spat produced in the Great Beds of Raritan
Bay. The importance of a Raritan Bay population in restoring the Eastern Oyster to the
HRE (Fig. 1) was documented in the CRP (2009); the long-term presence of significant
acreage of Raritan Bay oyster reefs could potentially contribute to reestablishing and
sustaining an oyster population in the HRE at large.
OYSTER REEF HABITAT VALUE
In brackish estuaries of the northern US, subtidal and intertidal oyster beds were
commonly an important component of the benthic ecosystem (Bertness 1999). Oyster
formation of dense aggregations provides structural heterogeneity and vertical
topography, which create an ecologically complex habitat for all trophic levels (Harding
& Mann 1999, 2001). The ability to create this vertical habitat feature, unique to oysters
among HRE shellfish, is the reason these animals are considered to be ecological
engineers. For this reason, the Eastern Oyster is commonly referred to as a “keystone
species” (Coen et al. 2007), a characteristic not attributed to other local bivalve species.
Modern restoration efforts are now capitalizing on interconnections between multiple
species living in tidal estuarine habitats, and the importance of establishing
communities of species to achieve successful habitat development has been well

15
documented (Harding & Mann 1999, Bertness 1999, Brumbaugh et al. 2006). It is
estimated that the presence of bivalves can increase biomass and productivity of benthic
invertebrate fish prey species by 20-fold (Steimle et al. 2002). This increased prey
biomass can support an increase in fin fish and large crustacean biomass of up to 50 kg
per square meter of oyster reef habitat (Peterson et al. 2003).
Oyster building of reefs can reduce water flow velocities, while providing organic
material that serves as food for reef inhabitants (Kennish 2004). Oysters and other
members of the community that grow on the oyster shell substrate (such as sponges)
control overabundant micro-algae, which cause the algal blooms that lead to low
dissolved oxygen levels in bottom waters. The microalgae and organic particulate
matter the oysters remove from the water column are released as feces or psuedofeces
(particles collected on its gills that the oyster does not use as food). These oyster waste
products enhance the organic content of the adjacent soft bottom habitats, which
contributes to the benthic community productivity that is in turn used by other non-reef
fin fish and invertebrate species. This is an important bentho-pelagic coupling process
that supports both fish and shellfish productivity. In addition to providing habitat for
benthic organisms and transitory fish, oyster reefs serve as forage habitat for birds and
mammals (Kennish 2004). An adult oyster is also capable of filtering prodigious
amounts of water though its system. Unlike intertidal ribbed mussels (suggested by
some regulators as an alternative to oysters) this filtering activity takes place
continuously when oysters are placed in subtidal locations. This natural filtration
process helps to reduce water turbidity, allowing light transmission through the water
column and creating a habitat supportive of submerged sea grass growth (Bertness
1999), while improving overall water quality.
CHANGING CLIMATE AND RELATIVE SEA LEVEL RISE
The HRE has been identified as a “hot spot” with respect to relative sea level rise

16
(Gornitz et al. 2001; NRC 2007). Measurements taken at The Battery, Sandy Hook, and
Atlantic City over the last 78 – 100 years indicate that sea levels in the region are rising
at a rate of up to 4 mm/yr. This is a much faster rate than the predicted global average
and is believed to the due to a confluence of three factors: overall ocean volume
expansion due to warming and increased ice melt; local subsidence of the land caused
by retreat of the last glacier; and changes in the Atlantic current circulation patterns
(Kirshen et al. 2007).
Raritan Bay is also subject to frequent tropical storms and periodic hurricanes; it is
estimated that approximately 3.7 million cubic yards of sand have been placed on
Raritan Bay beaches for the purpose of flood protection (NRC 2007). The devastation
inflicted by SuperStorm Sandy is now causing HRE coastal communities to consider
resiliency options that address sea level rise-induced flooding, storm surges, and
shoreline erosion. The USACE is currently conducting an analysis of post-Sandy
shoreline conditions and potential actions to increase resilience to future extreme storm
events. Depending on site-specific conditions, the presence of an oyster reef system
could contribute to shoreline protection through reduction of wave energy, thus
providing an alternative to “hard-edge” armoring of vulnerable shorelines (Piazza et al.
2005).
Studies were designed to yield data related to local environmental conditions, oyster
survival and growth rates, and overall general oyster fitness in the hope that this data
could contribute to Baykeeper’s successful reintroduction of the Eastern Oyster to the
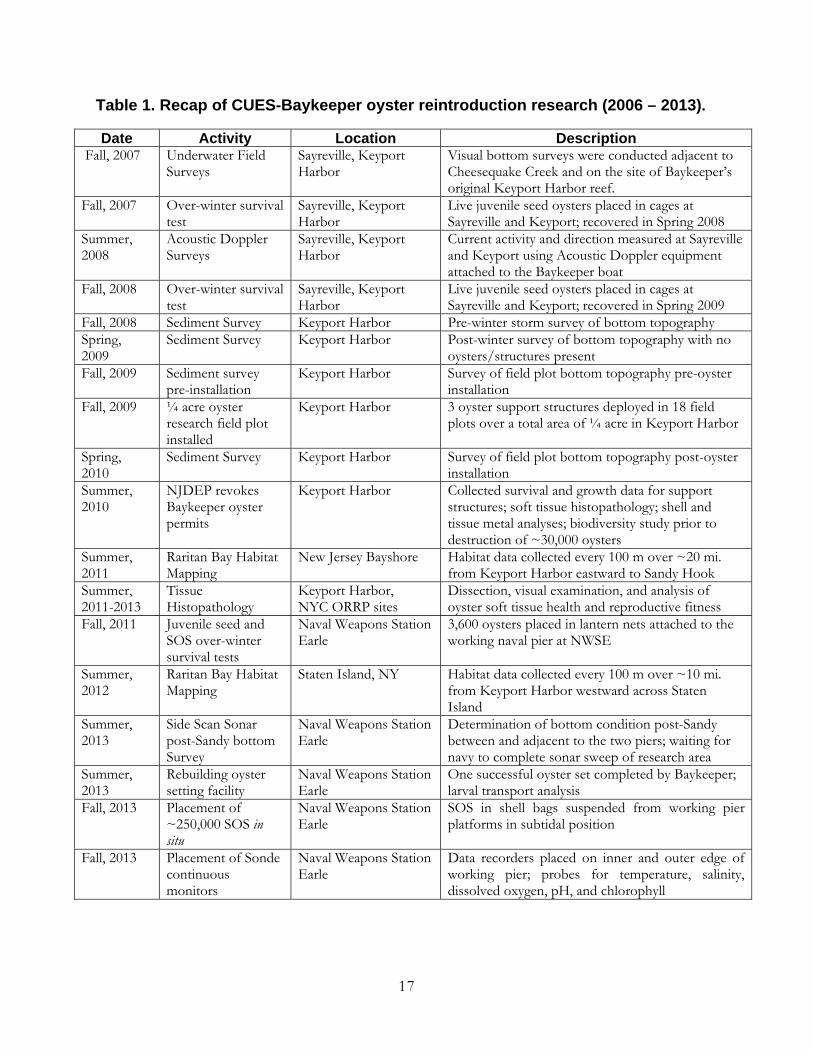
HRE. The research described in this report was conducted between 2007 – 2013 (Table
1).
17
Table 1. Recap of CUES-Baykeeper oyster reintroduction research (2006 – 2013).
Date Activity Location Description Fall, 2007 Underwater Field
Surveys Sayreville, Keyport Harbor
Visual bottom surveys were conducted adjacent to Cheesequake Creek and on the site of Baykeeper’s original Keyport Harbor reef.
Fall, 2007 Over-winter survival test
Sayreville, Keyport Harbor
Live juvenile seed oysters placed in cages at Sayreville and Keyport; recovered in Spring 2008
Summer, 2008
Acoustic Doppler Surveys
Sayreville, Keyport Harbor
Current activity and direction measured at Sayreville and Keyport using Acoustic Doppler equipment attached to the Baykeeper boat
Fall, 2008 Over-winter survival test
Sayreville, Keyport Harbor
Live juvenile seed oysters placed in cages at Sayreville and Keyport; recovered in Spring 2009
Fall, 2008 Sediment Survey Keyport Harbor Pre-winter storm survey of bottom topography Spring, 2009
Sediment Survey Keyport Harbor Post-winter survey of bottom topography with no oysters/structures present
Fall, 2009 Sediment survey pre-installation
Keyport Harbor Survey of field plot bottom topography pre-oyster installation
Fall, 2009 ¼ acre oyster research field plot installed
Keyport Harbor 3 oyster support structures deployed in 18 field plots over a total area of ¼ acre in Keyport Harbor
Spring, 2010
Sediment Survey Keyport Harbor Survey of field plot bottom topography post-oyster installation
Summer, 2010
NJDEP revokes Baykeeper oyster permits
Keyport Harbor Collected survival and growth data for support structures; soft tissue histopathology; shell and tissue metal analyses; biodiversity study prior to destruction of ~30,000 oysters
Summer, 2011
Raritan Bay Habitat Mapping
New Jersey Bayshore Habitat data collected every 100 m over ~20 mi. from Keyport Harbor eastward to Sandy Hook
Summer, 2011-2013
Tissue Histopathology
Keyport Harbor, NYC ORRP sites
Dissection, visual examination, and analysis of oyster soft tissue health and reproductive fitness
Fall, 2011 Juvenile seed and SOS over-winter survival tests
Naval Weapons Station Earle
3,600 oysters placed in lantern nets attached to the working naval pier at NWSE
Summer, 2012
Raritan Bay Habitat Mapping
Staten Island, NY Habitat data collected every 100 m over ~10 mi. from Keyport Harbor westward across Staten Island
Summer, 2013
Side Scan Sonar post-Sandy bottom Survey
Naval Weapons Station Earle
Determination of bottom condition post-Sandy between and adjacent to the two piers; waiting for navy to complete sonar sweep of research area
Summer, 2013
Rebuilding oyster setting facility
Naval Weapons Station Earle
One successful oyster set completed by Baykeeper; larval transport analysis
Fall, 2013 Placement of ~250,000 SOS in situ
Naval Weapons Station Earle
SOS in shell bags suspended from working pier platforms in subtidal position
Fall, 2013 Placement of Sonde continuous monitors
Naval Weapons Station Earle
Data recorders placed on inner and outer edge of working pier; probes for temperature, salinity, dissolved oxygen, pH, and chlorophyll

18
II IIII .. KKEEYYPPOORRTT HHAARRBBOORR RREESSEEAARRCCHH
SITE SUITABLITY TESTS
Prior to implementing large scale oyster reintroduction efforts it is critical to understand
the existing baseline conditions at a proposed reintroduction site. The initial research
questions were related to determining whether the western portion of Raritan Bay
would support the successful reintroduction of Eastern Oysters. Our research
methodology was to contrast environmental conditions at a potential reintroduction
location in western Raritan Bay (Sayreville) with conditions at the NJDEP-permitted
Keyport Harbor (Fig. 3)and Navesink River restoration sites (Note: Baykeeper’s permit
for the Navsink River site was subsequently revoked due to high fecal coliform counts).
4.5 miles
RARITAN BAY
New York
RARITAN BAY
New Jersey
Raritan River
Conaskonk Point
Keyport Harbor
Sandy Hook
**
Figure 3. Approximate locations of the Keyport Harbor NJDEP permitted oyster reef (green) a potential oyster reef restoration site in the western portion of Raritan Bay (red), and Naval Weapons Station Earle (yellow).
*

19
A visual assessment of the bottom substrate and adjacent shoreline conditions at the
Sayreville and Keyport Harbor sites was conducted on October 18, 2007 by Drs. B. Ravit
and R. Miskewitz, C. Alderson (NOAA), and Andrew Willner (NY/NJ Baykeeper) on
an incoming neap tide. The two sites were ~4.5 miles apart at the western end of Raritan
Bay. The inspection revealed that the bottom composition at both locations was hard
sand, littered with broken shells. A small number of live oysters were recovered from
the Keyport Harbor location, but no live oysters were observed at the Sayreville site.
The Keyport visual assessment revealed a bottom that was poorly colonized at the
MLW 6’ contour. The only macro marine organisms observed were relatively low
numbers of live oysters in combination with the broken clam shells at Keyport Harbor
and high numbers of sea squirts at Sayreville. While the shorelines appeared to be
similar (creek discharges, emergent Spartina alterniflora marshes forming), benthic grab
samples were dissimilar (visible benthic fauna in Keyport, depauperate community in
Sayreville).
Research was conducted to describe physical and ecological characteristics of the two
western Raritan Bay sites, including a hydrologic assessment that mapped current and
wave activity and a characterization of contaminant loadings. The site characterizations
describe various water quality parameters, including dissolved oxygen, temperature,
pH, salinity, nutrients and contaminants, and the presence of fecal coliform bacteria.
The goal was to identify similarities and differences between potential reintroduction
locations with respect to water quality parameters.
AA.. IINNIITTIIAALL SSIITTEE AASSSSEESSSSMMEENNTTSS
1. WATER QUALITY PARAMETERS
Water column samples were collected by Dr. Ravit and analyzed in NJDEP certified
laboratories. The samples were collected from Sayreville and Keyport Harbor under dry

20
conditions on an outgoing low tide on September 25, 2007; samples were collected from
the Navesink River Baykeeper reef site under the same conditions on September 27,
2007. Water samples at all locations were obtained from a depth of approximately one
meter by lowering a bucket into the water column from the deck of a boat and then
transferring the water into sample collection containers. Oyster tissue samples at the
Navesink Reef were obtained by tonging and transferring 3 live animals to the
laboratory on ice. A subsequent set of water samples was collected on October 12, 2007
from Sayreville and Keyport Harbor to test for differences in fecal coliform levels under
high flow conditions; the amount of rainfall recorded during the preceding storm was 1
- 2 inches in the Raritan Bay estuary (NOAA). These samples were collected from a
depth of approximately one meter by walking into the water from the shore and placing
collection bottles directly into the water column. After collection all samples were
placed on ice and maintained at 4 0C until processed. The holding time for fecal
coliform samples did not exceed 6 hours. Water column samples were analyzed for the
presence of heavy metals at the Environmental & Occupational Health & Safety
Institute (EOHSI), Rutgers University, New Brunswick, NJ; water and oyster tissue
samples were analyzed for the presence of fecal coliform colony forming units (CFUs) at
NJ Analytical Laboratories (NJDEP ID #11005); water samples were analyzed for
nutrients (nitrogen, phosphorous) at the Rutgers EcoComplex, Bordentown, NJ. Dr.
Ravit also obtained water monitoring data from NJDEP that characterizes Raritan Bay
water quality parameters during the time period of 2000-2007 at 53 locations, including
western portions of the Bay. The NJDEP data is from a minimum of 5 samples collected
after heavy precipitation events that historically result in elevated coliform levels – a
“worst case scenario” shellfish condition with respect to human health.
Concentrations of ammonia (Table 2) in Sayreville exceed the NJDEP water quality
standards for saline estuaries; Keyport Harbor ammonia concentrations exceed the
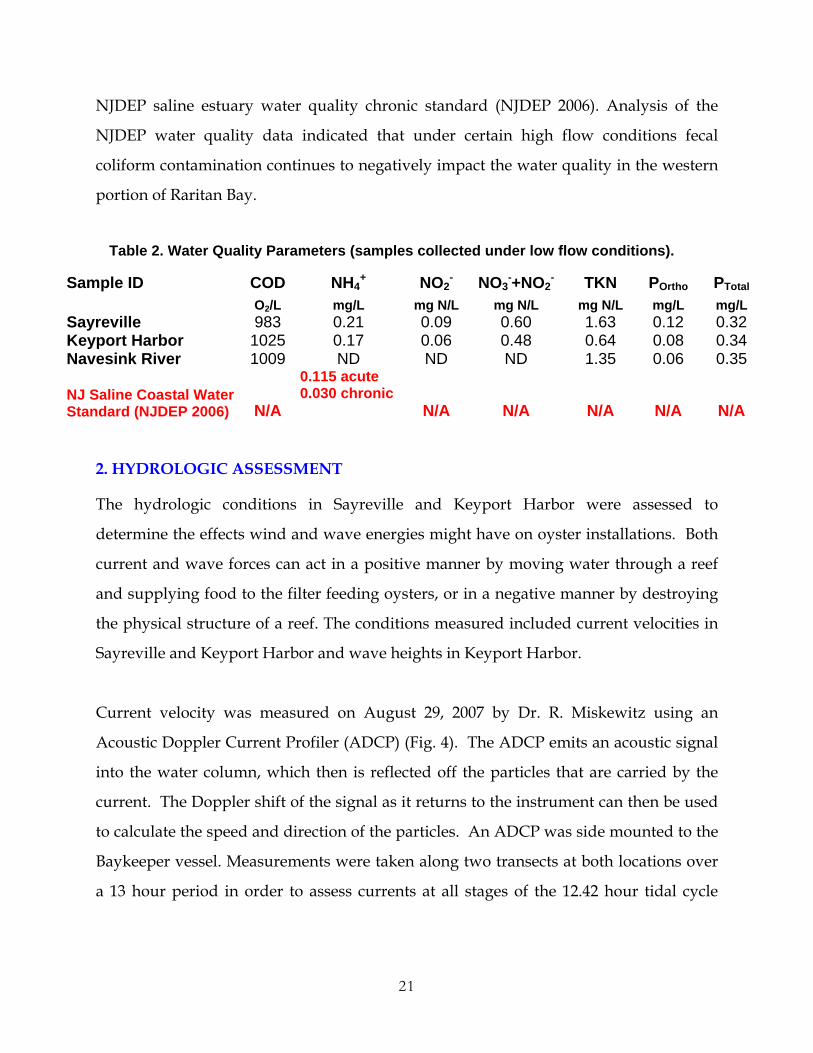
21
NJDEP saline estuary water quality chronic standard (NJDEP 2006). Analysis of the
NJDEP water quality data indicated that under certain high flow conditions fecal
coliform contamination continues to negatively impact the water quality in the western
portion of Raritan Bay.
2. HYDROLOGIC ASSESSMENT
The hydrologic conditions in Sayreville and Keyport Harbor were assessed to
determine the effects wind and wave energies might have on oyster installations. Both
current and wave forces can act in a positive manner by moving water through a reef
and supplying food to the filter feeding oysters, or in a negative manner by destroying
the physical structure of a reef. The conditions measured included current velocities in
Sayreville and Keyport Harbor and wave heights in Keyport Harbor.
Current velocity was measured on August 29, 2007 by Dr. R. Miskewitz using an
Acoustic Doppler Current Profiler (ADCP) (Fig. 4). The ADCP emits an acoustic signal
into the water column, which then is reflected off the particles that are carried by the
current. The Doppler shift of the signal as it returns to the instrument can then be used
to calculate the speed and direction of the particles. An ADCP was side mounted to the
Baykeeper vessel. Measurements were taken along two transects at both locations over
a 13 hour period in order to assess currents at all stages of the 12.42 hour tidal cycle
Sample ID COD NH4+ NO2
- NO3-+NO2
- TKN POrtho PTotal O2/L mg/L mg N/L mg N/L mg N/L mg/L mg/L Sayreville 983 0.21 0.09 0.60 1.63 0.12 0.32 Keyport Harbor 1025 0.17 0.06 0.48 0.64 0.08 0.34 Navesink River 1009 ND ND ND 1.35 0.06 0.35
NJ Saline Coastal Water Standard (NJDEP 2006) N/A
0.115 acute 0.030 chronic N/A N/A N/A N/A N/A
Table 2. Water Quality Parameters (samples collected under low flow conditions).

22
(Fig. 4).
The velocity transects showed variation in the magnitude and direction of the current
flow, both over depth and across the transect. The average flow at Keyport Harbor was
to the southwest at low tide and to the southeast at high tide (Fig. 4b). At the Sayreville
location the average flow was northeast at both high and low tides (Fig. 4a). The
measurements collected during the current sampling event revealed depth averaged
mean current velocities of 7.5 cm per second at high tide, and 9 cm per second at low
tide. These measurements were collected on a relatively calm day and most likely
represent average conditions.
3. OVERWINTER SURVIVAL & GROWTH EXPERIMENT
Juvenile seed oysters were secured in June 2007 from J.M. Flowers (Oyster Bay, Long
Island) and placed in the Navesink River at Bahr’s landing docks for five months. On
November 23, 2007, after measuring the length and height of each animal (Fig. 5), 250
oysters averaging 50 mm long were placed in a plastic basket; this density was the
Figure 4. ADP Transects at a) Sayreville and b) Keyport Harbor taken on August 29, 2008.

23
equivalent of 1,000 oysters/meter squared, considered a high density under natural
conditions. The cages were secured shut with plastic ties and placed subtidally in
Sayreville and Keyport Harbor using lengths of rebar that protruded through the
enclosures, which were set into the hard sand bottom (Fig.6). The top of the each
enclosure was at the water surface during mean low tide. Each enclosure was marked
with a plastic buoy to identify its location.
The oyster cages in Sayreville and Keyport Harbor were visually inspected during low
tide in February, 2008. The cages were again inspected on June 3 (Keyport Harbor) and
June 16 (Sayreville). During the June inspection, the cages were opened and the
number of live versus dead oysters was determined. At the Keyport Harbor location,
approximately 70% of the oysters were alive; at the Sayreville location only 3% of the
oysters were found to be alive. Tissue analysis conducted by Dr. Pete Weis at UMDNJ
revealed that live animals sampled in June from the Keyport location were ready to
spawn; no eggs were observed in the 3 live oysters retrieved from the Sayreville
location. Upon opening the oyster cages in June 2008, we observed a thriving benthic
community at the Keyport site. This community consisted of crabs, shrimp, and snails,
numbering in the hundreds. We did not observe significant numbers of marine
Figure 5. Meredith & Andy Comi measuring oysters, November, 2007.
Figure 6. Meredith & Andy Comi placing oyster cage in Raritan Bay, November, 2007.

24
organisms associated with the cage at the Sayreville site. This may be due to the fact
that there were few surviving oysters at this location.
Test cages, each containing 100 juvenile seed oysters, were again placed in the Keyport
Harbor and Sayreville locations in October, 2008 and the overwinter experiment
repeated. The cages were retrieved during June, 2009 and the surviving and dead
oysters were separated and measured to determine length. Over-winter survival at the
Keyport Harbor reef was 65% and at the Sayreville location 53%. Although the
Sayreville survival rate was greater than in the 2007-2008 winter experiment, the length
of the Keyport live animals was almost 25% greater than the length of the Sayreville
oysters. We did not attempt to determine what was affecting the mortality or growth at
the Sayreville site, and recommended that Baykeeper’s continuing restoration efforts be
focused on the Keyport Harbor location where survival and growth were significantly
higher.
KKEEYYPPOORRTT HHAARRBBOORR FFIIEELLDD RREESSEEAARRCCHH PPLLOOTTSS
Based on the underwater field observations, the review of NJDEP water quality
monitoring data (2000-2007), and live oyster over-winter survival experiments it was
decided that Baykeeper would focus their reintroduction efforts on the original Keyport
Harbor location. Although the data indicated that the Keyport Harbor site could be
expanded, the wave, wind, and current energies in this location preclude merely
placing shell piles on the bottom. The reintroduction as originally designed consisted of
crushed shell and oysters piles placed in Keyport harbor by Baykeeper volunteers. The
visual inspection determined that this structure was dispersed across the hard sand
bottom and no longer viable as a self-sustaining oyster population. To provide the
support require for oysters to accrete vertically, some form of engineered structure is

25
needed. Such a support must be capable of withstanding the high energies generated
during storm conditions, resist scouring and retain stability, and potentially provide a
positive contribution to enhance sediment deposition on the shoreward side of the reef.
The structures must be fabricated from easily obtainable and inexpensive materials, and
should enhance oyster growth and survival, as well as the settlement of new spat.
The research plan for summer 2008 was to test four support structures at the Keyport
Harbor site and to assess oyster growth and mortality associated with each structure.
Baykeeper purchased support structures from two manufacturers (Reefblk™ and
Reefballs®). Two non-proprietary structures were also designed to be tested for
effectiveness under Keyport Harbor conditions (Rutgers “Arch” and Gaia “Lollipop”).
However, the reef ball larval set failed and the lollipop structures proved to be too
heavy for Baykeeper staff to handle. In September, 2008 it was decided to wait until the
following year to conduct a test of the various support structures.
In summer 2009 Baykeeper obtained Eastern Oyster larvae from Horn Point
Laboratories (Cambridge, MD) for setting in their Atlantic Highlands aquaculture
facility (Fig. 7a). Reefballs™ were placed in the setting tanks and the set was judged to
be successful (Fig. 7b). Eastern oyster larvae were also set in the Baykeeper aquaculture
facility on cured surf clam shells housed in mesh bags (Fig. 8). The spat-on-shell and the
Reefballs™ were removed from the setting tanks and placed in the “nursery” area of
Raritan Bay adjacent to the facility (Fig. 9) to allow the larvae to grow to between 15 and
30 mm prior to placement on the Keyport Harbor research “reef” site. In addition to the
set larvae, Baykeeper purchased juvenile seed Eastern Oysters approximately 25 mm in
length that were spawned in Long Island Sound (Aeros Cultured Oyster Co., Southold,
NY). These juvenile oysters were also placed in the Atlantic Highlands nursery area for
acclimation to Raritan Bay prior to placement on the Keyport Harbor research site.

26
The objectives of the Keyport Harbor research were to:
1. Estimate long-term rates of oyster survival and growth at the Keyport Harbor
site;
2. Identify the reef support structure(s) that:
a. Supported the highest oyster survival rates;
b. Supported the faster oyster growth rates;
c. Resisted high energy during winter storm events;
d. Facilitated sediment accretion on the shoreward side of the reef footprint;
and to
3. Characterize the biodiversity associated with the presence of live oysters in
Keyport Harbor.
In September, 2009 the individual seed oysters and spat set on shell (SOS) were
enclosed in polypropylene mesh bags, which were attached to either a Reefblk™ or
Arch support structure. A description of each structure tested follows.
Figure 7. Baykeeper a) larvae setting tanks in the Atlantic Highland aquaculture facility
and b) 2009 Reef Ball™ oyster set.
BA

27
Figure 8. Setting oyster spat-on-shell in Baykeeper’s aquaculture facility.
Figure 9. Baykeeper “nursery” in Atlantic Highlands, NJ.
Figure 10. Random Block Experimental Design for Keyport Harbor Research Plots.

28
OYSTER (REEF) BALL DIMENSIONS
Reefballs™ are individual concrete semi-spherical units designed to emulate and create
new oyster reef. The structure is formed using a fiberglass mold containing a central
Polyform buoy surrounded by various sized inflatable balls to make holes. The
structure is designed to contain holes that provide areas for the oysters to colonize,
while being heavy enough to remain stable in a high energy environment.
The approximate dimensions were:
Width: 1.5 feet (0.46 m)
Height: 1 foot (0.30 m)
REEF BLOCK
RUTGERS ARCH STRUCTURE
The Arch was designed to be a relatively inexpensive and simple framed rebar structure
that supports mesh bags filled with seed or SOS oysters. The arch was designed to
provide low resistance to water flows in the relatively high energy Raritan Bay system.
The structures are low lying, but provide vertical relief from the substrate for the
attached oysters.
Reefblks™ are prefabricated double framed rebar units
that hold mesh bags filled with seed or SOS oysters.
The structures emulate and create new artificial oyster
reef. It is also possible that they may provide some
immediate shoreline protection.
Arch designed by Dr. R. Miskewitz and S. Walsh.

29
Each research plot contained either a single type of structure (two rebar structures or
three Reefballs™), a mixture of one rebar structure with two adjacent Reefballs™, or
was left empty (Fig. 10). The Arch and Reefblk™ structures were stabilized at each
corner using rebar anchors driven at least 6” into the sediment substrate. When two
structures were installed in the same research plot, they were chained together to
increase stability. Reefballs™ were placed in sets of two or three and chained together
in order to prevent movement. Oysters were attached to the support structures in a
density of 1,000 oysters/meter sq, a healthy natural density (Mann et al. 2009).
Reefball™ density was not controllable since the set was random. In addition to the
oysters attached to the large supports, small caged subsets of 250 oysters in the same
density were attached to the top of the rebar support structures for retrieval during
future monitoring events. Subset oysters were measured (length and height) prior to
placement in the field plots. To obtain Reefball™ subsets, an area 2 ¼ meter sq. was
marked on the face of the Reefball™ where live oysters were measured (length) and any
dead shells were removed. Prior to placement in the research field plots, the following
measurements were taken:
1. Reefballs™: A 10 cm x 10 cm area on the face of the Reefball™ was marked and the
spat within this 100 cm2 area were counted and measured. The heights of each live
oyster were recorded (Day 0). This same area was again measured during the
summer of 2010 when the oysters were destroyed. However, these measurements
were obtained by volunteers under great duress, and so we do not have high
confidence in the Reefball™ survival and growth data.
2. Reefblk™ and Arch Structures:
A. Oyster Seed: Oysters were randomly selected and placed in ½” net heavy
plastic mesh bags. These bags were attached to the rebar support structures.
From the original oysters selected, a subset of 250 oysters was randomly

30
selected and placed in a separate mesh bag, which was also attached to the
rebar structure. The heights and widths of the randomly selected subset
oysters were measured and recorded. The mean of these measurements
describes the Day 0 size class. The subset oysters were re-measured during
summer of 2010 prior to destruction. Oyster survival and growth rates
associated with each structure were determined.
B. Oyster Spat-on-Shell: Cleaned and cured surf clam shells were placed in the
Baykeeper larvae setting tanks and the spat randomly set on the clam shells.
The mean number of oysters per shell is approximately 20-25, although there
is variability between shells in the number of oysters set. After the oyster spat
reached a height of at least 10 mm, the clam shells were placed in 1” net
heavy plastic mesh bags at approximately the same density as the oyster seed
subset (500 oysters/m2). These bags were attached to the rebar structures. A
subset of randomly selected shells containing approximately 250 oyster spat
was placed in a separate mesh bag, and this subset was also attached to the
structure. The heights of the randomly selected subset oysters were measured
and recorded. The mean of this measurement described the Day 0 size class.
The subset oysters were re-measured during the summer of 2010 prior to
destruction to determine oyster survival and growth rates associated with
each structure.
3. Oyster Survival: Using the Day 0 counts as the baseline for live oysters placed on
the reef, we recorded the number of surviving oysters in July, 2010. Dead shells
were measured and the number of dead oysters used to calculate annual mortality
rates associated with each structure.

31
During the July and August, 2010 monitoring events the numbers of surviving and
dead oysters attached to each rebar structure were recorded. The survival percentage
was calculated based on the number of all oysters recovered (34% of the initial subset
oyster population). We hypothesized that the loss of some juvenile oysters was a result
of their falling through the mesh cages due to their small size. However, we were
reluctant to use a smaller mesh size due to the potential decrease in water flows after
cage fouling. To compare survival rates in the subset samples versus the larger Arch
and Reefblk™ cages, 995 seed and SOS oysters were recovered from one Arch and one
Reefblk™ cage. Oyster survivorship and growth rates were calculated for the large
cages and compared to data collected from the subset attached to the same structure.
Oyster growth and survival were analyzed using two-factor Analysis of Variances
(ANOVAs) (STRUCTURE factor: Reefball™ vs. Reefblk™ vs. Arch, and TYPE factor:
Seed vs. Spat-on-Shell vs. Set; N=7,330 observations). All Summary Statistics and
ANOVAS were conducted using SAS GLM (SAS Software, Version 9.2). Relative
growth rates were calculated using the following formula (Hunt 1990): G = (Loge N2 –
Loge N1)/t where G = the mean rate of increase over the time interval; N = the average
length of oysters in mm; t = time (320 days). Captured species diversity (N = 20
sampling events) was compared by means of the Shannon Index of Diversity using the
following formula (Magurran 1988): H = -Σpiln(pi) where H = the sample diversity; pi =
the proportion of the number of a single species to the total number of individuals in
the sample; and ln = Loge. One-way ANOVA was conducted to test community
diversity differences between samples. Post hoc means were tested using Tukey’s HSD
method.
The support structure and the type of juvenile oyster produced significant differences in
survival patterns (Fig. 11). Significant differences in oyster growth were observed
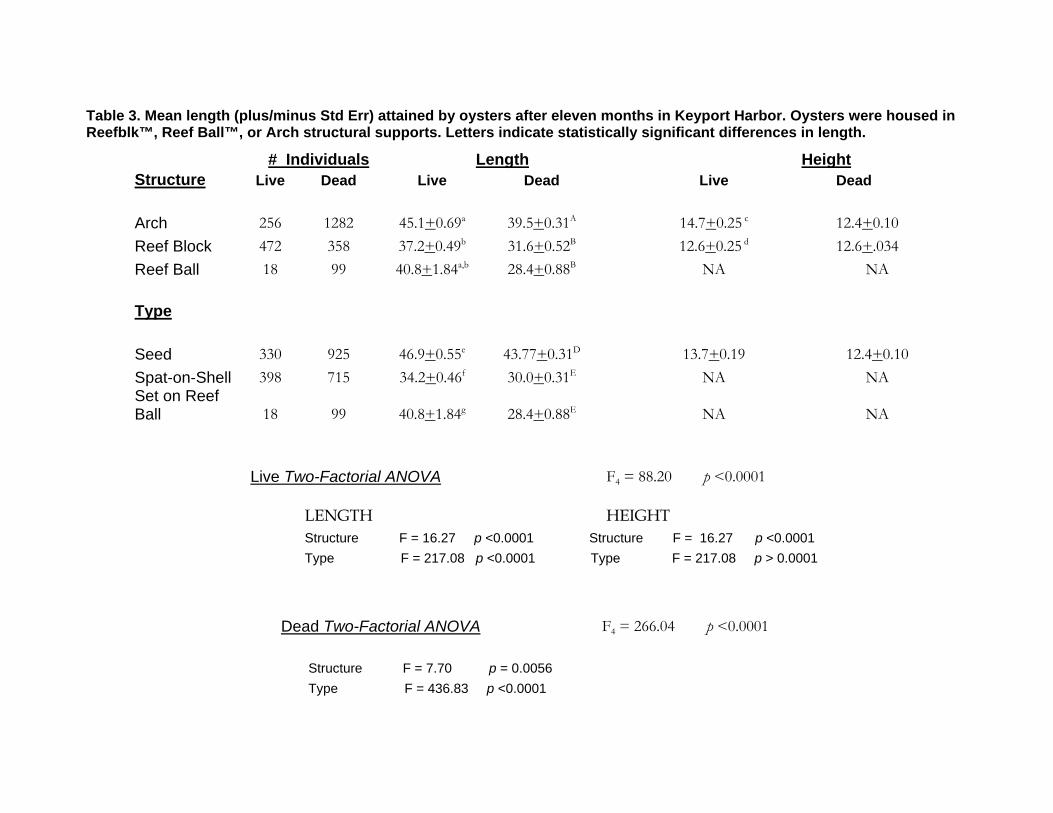
among the structures and between the types of juvenile oysters (Table 3). Live Arch

32
oysters were 22% larger than Reefblk™ oysters; dead Arch oysters were also
significantly larger than oysters housed on the other structures. Seed oysters (alive and
dead) were significantly longer than SOS or Reefball™ set oysters. Lengths of dead
oysters did not differ among the type of juvenile. No interaction affecting length was
seen between the structure and the type of juvenile oyster in the subset samples.
Conversely, two-factorial ANOVA of oyster lengths in the larger cages showed an
interaction between the structure and the type of juvenile for both live (F = 20.30, p <
0.0001) and dead (F = 22.96, p < 0.0001) oysters. Live oysters were significantly larger
than dead animals (mean Arch oyster length 46 mm, mean Reefblk™ oyster length 51
mm versus mean dead length of 36 mm). Mean length of seed oysters housed on
Reefblk™ was 48 mm versus a length of 36-38 mm for Arch seed oysters and SOS on
both structures.
The proportion of surviving oysters was greater in the subset samples than in the two
larger cages that we had time to sample. The difference seen in the Reefblk™
comparison may be due to the fact that the smaller subset bags were attached to the top
of the structure, and so were less subject to sedimentation impacts (Powers et al. 2009)
than the larger cage that came into contact with the bottom substrate. The SOS exhibited
the highest survival rate (approximately 40%) and the spat set on the Reefball™
exhibited the lowest (15%); the highest structure survival rate (almost 60%) was
associated with the Reefblk™ support (Table 3).
Differences in survival associated with the various structures within the ¼-acre research
site suggest that the specific support structure(s) chosen for a given location might
positively affect oyster survival rates. Based on the limited results of this study, the
most successful restoration approach in Keyport Harbor could be SOS housed in

33
Reefblk™ structures. However with only one year of data, it would be premature to
draw this conclusion, and additional longer-term research is needed to characterize
oyster survival and spawning patterns (Hawkins et al. 2002), and to observe whether
new oyster larvae produced ultimately set on the adult oyster shells in this location. It
is interesting to note the larger length of the oysters housed in the Arch structure. It is
possible that an increased water flow through this structure versus the other two
supports brought the oysters into greater contact with food sources. However, their
larger size did not result in higher survival rates. Further investigation that combines
desirable features of both the Arch and Reefblk™ structures might further improve
Figure 11. Proportion of living Eastern Oysters recovered from all subsets after one year in Keyport Harbor, NJ (September 2009 – August 2010). Cage types = Arch, Reefblk™ and Reefball™. Oyster types = Seed, Spat set on Shell (SOS), and Spat set directly on Reefballs™. S = subset sample; E = large cage sample (one each of an Arch and Reefblk™ large cage).

34
both growth and survival rates.
High mortality observed with the Reefballs™ may be due to sedimentation. We did
note large numbers of dead animals at the base of the Reefballs™ and sediment was
observed inside the dead shells. Although the Keyport substrate is gravel and hard
sand, this site experiences high turbidity during storm events and sedimentation is
known to be a major obstacle in restoring oyster populations (Powers et al. 2009). We
note that the monitoring of the Reefball™ structures was done by Baykeeper volunteers,
and occurred concurrently with destruction of the oysters in the research plots.
Therefore, we have low confidence in the accuracy of this data and believe this structure
needs to be retested.
35
Table 3. Mean length (plus/minus Std Err) attained by oysters after eleven months in Keyport Harbor. Oysters were housed in Reefblk™, Reef Ball™, or Arch structural supports. Letters indicate statistically significant differences in length.
# Individuals Length Height Structure Live Dead Live Dead Live Dead
Arch 256 1282 45.1+0.69a 39.5+0.31A 14.7+0.25 c 12.4+0.10
Reef Block 472 358 37.2+0.49b 31.6+0.52B 12.6+0.25 d 12.6+.034
Reef Ball 18 99 40.8+1.84a,b 28.4+0.88B NA NA Type
Seed 330 925 46.9+0.55e 43.77+0.31D 13.7+0.19 12.4+0.10
Spat-on-Shell 398 715 34.2+0.46f 30.0+0.31E NA NA Set on Reef Ball 18 99 40.8+1.84g 28.4+0.88E NA NA
Live Two-Factorial ANOVA F4 = 88.20 p <0.0001
LENGTH HEIGHT Structure F = 16.27 p <0.0001 Structure F = 16.27 p <0.0001
Type F = 217.08 p <0.0001 Type F = 217.08 p > 0.0001
Dead Two-Factorial ANOVA F4 = 266.04 p <0.0001 Structure F = 7.70 p = 0.0056
Type F = 436.83 p <0.0001
36
TISSUE ANALYSES
Histopathology
To qualitatively assess the health of the year old Keyport oysters, 10 adult oysters were
retrieved in June, 2010 prior to spawning and 10 were retrieved post-spawning on the
day the research plots were destroyed. The oysters were weighed, shucked, and
individual shell and wet body weights were measured (Table 4). The oysters were
preserved in 10% formalin and subsequently transferred to a 70% ethanol solution. The
oysters were then placed in a casing, which was immersed in a paraffin bath at a
temperature of 135o F (Reichert Histostat Rotary Microtome). After removal from the
bath the paraffin was allowed to solidify. The sample was then sliced into cross sections
6 m thin, placed on a microscope slide, and baked at 60o C for 30 min. to remove any
paraffin from the slide. The slide was then stained with lithium carbonate, which
colored the oyster tissues dark blue, allowing us to observe and evaluate the condition
of various soft tissues, including the mantle, gill, digestive, and reproductive systems. A
minimum of four slides were prepared for each sample.
Lesion Severity scores are commonly used to determine the degree of tissue damage
(Ray 1954; Ford & Tripp 1986). Tissue lesions, hyperplasia (an abnormal increase in the
number of cells), infiltration of macrophages, parasites, dysmorphic (misshapen) cell
and/or tissue structures were scored using a 3-point rating system where:
1 = normal appearance of oyster cell/tissue structure
2 = presence of some visible degree of oyster cell/tissue abnormality
3 = oysters cell/tissue appearance highly abnormal
Lesion Severity scores for 20 randomly selected adult Eastern Oysters (approximately
40 - 130 mm in length) were calculated for each tissue type based on this visual

37
histopathology evaluation system (Table 5). The typical 50:50 sex ratio of females to
males (Morton 1991) was observed in the Keyport oysters sampled. Oysters collected in
June were ripe and females appeared to be ready to spawn. The 10 oysters sampled
post-spawning two months later (August 2010) after the summer growth period
exhibited a more than double mean wet body weight and a mean total weight almost
three-fold greater (Table 4) than oysters sampled pre-spawning.
Table 4. Physical Characteristics of One-Year Old Keyport Harbor Eastern Oysters
In general, the Keyport Harbor oysters’ mantle, gill, and gonadal tissues appeared to be
normal. The shell gland, responsible for formation of the shell at its outer edges, also
appeared to be normal, although some minor localized edema was observed. Digestive
particles were present in the stomach and gastrointestinal tract of all samples and the
digestive gland appeared to be normal. The histopathology evaluation suggests that the
year old adult Keyport Harbor oysters able to survive in Raritan Bay appeared to be
healthy, ecologically fit, and capable of successful reproduction.
June_2010 August_ 2010 Parameter Length (cm) 4.7 + 0.27 6.1 + 0.38
Height (cm) 1.3 + 0.7 1.8 + 0.10
Width (cm) 3.6 + 0.19 4.5 + 0.19
Wet Body Wt (g) 2.8 + 0.51 6.1 + 0.75
Shell Thickness (mm) 2.0 + 0.20 3.4 + 0.30
Shell Wt (g) 7.9 + 1.20 23.0 + 2.28
Total Wt (g) 11.9 + 1.90 32.0 + 3.36
Post‐Spawn Pre‐Spawn

38
Table 5. Lesion Severity Scores for Year Old Keyport Harbor Oysters
A score of 1 = normal appearance and a score of 2 = some visible degree of abnormality.
METAL ANALYSES
Composited subsamples taken from the oysters evaluated for histopathology were
analyzed at the Rutgers Environmental & Occupational Health Sciences Institute
(EOHSI) to determine soft tissue and shell metal concentrations. The shell and body
tissues were separately digested using a MarsX microwave sample digester (CEM Corp,
Matthews, N.C.). Between 90-260 mg of air-dried sample was reacted with 0.5 ml of
nitric acid (EMD Omni Trace, ultra high purity). The samples were microwaved
repeatedly (300W, 75% power, 5 minutes at a time) until no further digestion occurred.
Another 0.25 ml of nitric acid was added and the samples were microwaved repeatedly
(300W, 100% power, up to 10 min). When no further digestion occurred, another 0.75 ml
of nitric acid was added and the samples were sonicated 1 hr, microwaved a final time
(300W, 100% power, 20 min), cooled to room temperature, and diluted to 30 ml (Milli-Q
ultra pure de-ionized water of 18.2 megaohms, Millipore Corp.) The samples were
centrifuged, a few ml of supernatant was removed and re-centrifuged prior to five-fold
dilution with 5% nitric acid. Samples were analyzed for metals with an inductive
Gonad 1.25 + 0.105
Gill 1.58 + 0.178
Labial Palps 1.33 + 0.333
Digestive Gland 1.28 + 0.109
Mantle 1.53 + 0.118
Abductor Muscle 1.00 + 0.000
Kidney 1.50+ 0.136
Connective Tissue 1.11 + 0.072
Heart 1.67 + 0.211

39
coupled plasma mass spectrometer (X5, Thermo Electron Corp.) using a multi-element
scan. This method required significant modification from the laboratory’s previous
microwave tissue digests (Buckley et al. 2003; Xie et al. 2007). The stepwise addition of
nitric acid allowed for complete digestion while keeping the sample volume low.
Although oyster soft tissue metal concentrations have been reported for individual
metals, our analysis included twenty-four metals, and so was more extensive than most
studies (Table 6). The total body metal concentration averaged 0.4% of body weight.
Only three soft tissue metal concentrations (aluminum, barium, titanium) were higher
than values reported from other urbanized estuaries; in general, the soft tissue metals
were lower than those observed in other studies.
Conversely, shell metal concentrations were higher than soft tissue concentrations for
eleven metals (aluminum, barium, cobalt, iron, lithium, magnesium, manganese, nickel,
strontium, titanium, vanadium), indicating the oysters’ ability to successfully transfer
metals to the shell. Off loading of metals into the shell, as seen in the Keyport oysters,
protects the animal from potentially harmful or lethal effects of metal exposure.

40
Metal (PPM) Keyport Oysters
Shell Soft Tissue Shell Soft Tissue Reference
Aluminum 194 + 47.2 140 + 8 6 ‐ 101 Sadig & Alam 1989
Arsenic 0.6 + 0.06 1.5 + 0.01
5 ‐ 21 0.5
3 ‐ 43
Volety 2008 Elston et al. 2005
NOAA 1987
Barium 7.0 + 0.5 2.5 + 0.10 <0.7 Sadig & Alam 1989
Cadmium 0 1.9 + 0.02
3 ‐ 16 0.7 ‐ 1.4
2.2 1.8 ‐ 16
Frazier 1975 Volety 2008
Guzman‐Garcia et al. 2009 Hayes et al. 1998
Chromium 0.5 + 0.09 2.2 + 0.25
3 ‐6 6 1
0.1 ‐ 5
Volety 2008 Guzman‐Garcia et al. 2009
Elston et al. 2005 NOAA 1987
Cobalt 0.8= + 0.07 0.3 + 0.00r
Copper 2.3 + 0.10 60 + 0.3 160
50 ‐ 225 500
98 ‐ 376 56 ‐ 212
31 15 ‐ 1,603
Frazier 1975 Frazier 1976 Volety 2008
Hayes et al. 1998 Elston et al. 2005
NOAA 1987
Gallium 0.3 + 0.03 0.2 + 0.01
Iron 402 + 56.2 139 + 3 19
200 ‐ 500 600
319 ‐ 628
Frazier 1975 Frazier 1976 Volety 2008
Lead 1.2 + 0.16 1.8 + 0.02x
0.7 ‐ 1.3 6
1.4 ‐ 15
Volety 2008 Guzman‐Garcia et al. 2009
Hayes et al. 1998
Lithium 1.8 + 0.13h 0.2 + 0.01z
Magnesium 2,346 + 110 485 + 13bb
Manganese 208 + 18.1 7.1 + 0.10
330 ‐ 520 505
5 ‐ 30 114
19 ‐ 25
Frazier 1975 Frazier 1976 Volety 2008
Table 6. One-Year-Old Keyport Harbor Eastern Oyster Shell and Soft Tissue Metal Concentrations.
Literature Values

41
KEYPORT BIODIVERSITY
To test whether the presence of the oysters and/or the rebar structures had an effect on
the Keyport Harbor marine community, fish traps (small mesh shrimp and minnow
trap and larger mesh semi-oval fish trap (Fig. 12), Memphis Net & Twine Co.) were
placed in pairs, either: 1) adjacent to the three support structures; 2) in empty research
plots; or 3) outside the eastern and western edges of the research footprint. These traps
were selected to test whether the density of motile marine organisms was greater in the
research plots containing oysters. After 24 hours, the traps were retrieved and the
captured animals identified at the genus and/or species level by F. Steimle and M.
Comi. A Shannon Diversity Index score for the various structures was calculated based
Metal (PPM) Keyport Oysters Literature Values
Shell Soft Tissue Shell Soft Tissue Reference
Nickel 5.0 + 0.3 1.8 + 0.03
0.6 ‐ 1.4 0.9
0.6 ‐ 13
Volety 2008 Elston et al. 2005
NOAA 1987
Potassium 0 1,234 + 9
Rubidium 0.3 + 0.08 0.6 + 0.02
Selenium 0.5 + 0.03 1.7 + 0.23
1 ‐ 1.8 0.4
0.9 ‐ 5.7
Volety 2008 Elston et al. 2005
NOAA 1987
Silver 0 2.8 + 0.04
1.2 ‐ 1.6 0.5
0.3 ‐ 7
Volety 2008 Elston et al. 2005
NOAA 1987
Strontium 1,386 + 76 12.2 + 0.58 9 ‐ 53 Sadig & Alam 1989
Titanium 43 + 1.0 17.6 + 0.80 0.9 ‐ 3 Sadig & Alam 1989
Uranium 0.1 + 0.01 0.2 + 0.00 2 ‐ 2.5 Akyil & Yusof 2007
Vanadium 0.8 + 0.14 0.4 + 0.01 0.5 ‐ 1.4 (shell/soft tissue) Blotcky et al. 1979
Zinc 0 1,886 + 51 2500
1,800 ‐ 5,000 1,495 ‐ 5,669 1,806 ‐ 2,902
478 300 ‐ 13,000
Frazier 1975, 1976 Volety 2008
Hayes et al. 1998 Elston et al. 2005
NOAA 1987
Table 6 (continued).

42
on the data collected during four sampling events which occurred between July 21, 2010
and July 29, 2010. Two additional sampling events (September 8 – 9, 2010) were
conducted after removal of the research animals to test the effect of only empty
structures with no oysters present on marine community composition.
Due to the small number of sampling events, no statistically significant differences in
the Shannon Index of Diversity among the various structures were observed. However,
the decrease in Shannon Diversity Scores when oysters were not present was
particularly noticeable for the Arch and Reefblk™ structures; the number of individuals
captured when the oysters were present was 2 to 3-fold greater than the numbers after
removal of the oysters (Table 7). Conversely, the empty plot diversity score actually
increased after oyster removal. The increased biodiversity associated with the presence
of the oysters was very encouraging and certainly warrants further research. We note
that this limited sampling timeframe did not capture biodiversity impacts related to
oyster presence on spring and fall transitory species.
Figure 12. Large mesh fish trap.

43
The crustaceans associated with the oysters are important fish prey, and during all
sampling events with oysters present fin fish were captured (Fig. 13). The two eel
species captured represent fisheries in decline in this region, and due to their complex
life cycle patterns, the eel’s use of estuaries and adequate measures to protect them are
not well understood. The American Eel is currently being evaluated by USFWS for
inclusion on the Federal Threatened & Endangered List. We hypothesize that the catch
data suggests the presence of oysters created and enhanced habitat structural
complexity, positively affecting prey density and abundances relative to higher trophic
levels in the marine food web.
Figure 13. July 9, 2010 diversity sampling with large mesh fish trap.

44
Species (common name)
Latin name Reefblk™With
ArchWith
Reef Ball™ With
EmptyWith
Reefblk™Without
Arch Without
Empty Without
American eel Anguilla rostrata 1 2 1 - - 1 - Blue Claw Crab Callinectes sapidus 17 7 8 7 4 2 4 Conger Eel Conger oceanus - 1 - 1 - - - Ctenophore Phylum Ctenophora 50 55 34 20 10 10 15 Grass Shrimp Palaemonetes 156 208 232 66 18 38 41 Hermit Crab Pagurus longicarpus 12 13 22 20 23 15 19 Mud Crab Neopanopeus 11 9 13 2 15 - 4 Mud Snail Ilyanassa obsoleta 159 205 113 48 - 27 103 Oyster Drill Urosalpinx cinerea 1 1 1 - - - - Pipefish Syngnathus fuscus 1 2 2 - - 1 - Spider Crab Libinia emarginata 3 - - 1 3 12 7 Spotfin Butterfly Fish Chaetodon ocellatus - - - - 1 - - Tautog Tautoga onitis - - - - 1 - - Toad Fish Opsanus tau - 1 1 1 - - - Total All Species 411 504 427 166 75 106 193 Shannon Diversity
Score
2.92
2.52
2.82
1.99
2.41
1.85
2.33
Table 7. Species and number of individuals observed in Keyport Harbor, NJ during 4 sampling events (July 21, 2010 – July 29, 2010) with oysters present and 2 sampling events after oysters were removed (September 8-9, 2010).

45
3. SEDIMENTATION
To determine whether the presence of oysters and their support structures influenced
sediment deposition patterns, bottom elevations were determined using laser surveying
equipment (CST/Berger Dual Beam Rotary Laser, Watseka, IL, USA) and standard
surveying methods (Lindeburg 1992). Sediment elevations at the four corners of the
individual plots were recorded during low tide in the fall of 2008. The surveys were tied
into NAD83 survey datum using the USGS benchmark located at the end of Walnut
Street in Keyport, NJ. Using the same procedure, the reef was again surveyed during
the summer of 2009 prior to installation of the research oysters and their support
structures. These two datasets provided a baseline for changes in Keyport Harbor
sediment elevations over the winter of 2008 prior to the installation of the oyster
research plots. The measurements were repeated in June, 2010 after the research oysters
and their support structures were in place for ten months to determine if: 1) sediment
elevation patterns differed with oysters present, and 2) the presence of the
oysters/structures increased scouring. Sediment elevation heights outside the research
plot footprint on the western and eastern sides served as “NO OYSTER” controls. Maps
were generated by entering the survey data into ArcMap. A raster image of the surface
was created using the Natural Neighbor toolbox function in ArcMap.
A comparison of changes in the topography of the reef footprint suggests that after the
2009 winter storm season the presence of the oysters and their cages might have
contributed to increased sediment stability (Fig. 14). While more seasonal data needs to
be collected to determine if these initial results are repeatable, the presence of the
oysters and their housing structures did not appear to increase sediment scouring.

46
B.
A.
Figure 14. Keyport Harbor, NJ over-winter change in sediment topography: A) with no oysters or structures present (2008-2009), and B) with oysters present (2009-2010).

47
KEYPORT HARBOR RESEARCH ENDED
Approximately 50,000 oysters were placed in Keyport Harbor on September 16, 2009.
On June 10, 2010, the New Jersey Department of Environmental Protection revoked the
decade-old permit that allowed Baykeeper to place oysters at this site in Raritan Bay.
An estimated 30,000 healthy oysters were destroyed on August 9, 2010. Due to the short
time interval allowed to remove the oysters, Reefballs™ were retrieved on the day the
research plots were destroyed. While volunteers attempted to collect subset data from
the Reefball™ structures, given the circumstances and time constraints, we believe the
Reefball™ portion of the data set to be less accurate than the data collected from the
rebar support structure subsets.
Typically oyster research is conducted at sites where existing populations are present
and often threatened. This study is unique in that it took place at research locations
where oysters are currently ecologically extinct. The success of the first and largest
oyster restoration research attempted to-date within the Hudson-Raritan Estuary is
evidenced by the decision of the NJDEP to rescind the project permit as the oysters
began to reach New Jersey’s market size of 2.5 inches. In addition to the oyster’s growth
and survival, healthy gametes signifying the survivors’ ability to spawn are also
indicative of the project’s success. Although the experiment was of very short duration
(eleven months), the fact that oysters were beginning to approach market size and that
their tissues appeared to be healthy indicate a majority of the animals could reach
market size in the three year timeframe that is considered typical of mid-Atlantic
waters.
48
IIVV.. NNYYCC OOYYSSTTEERR RREESSEEAARRCCHH
Oyster Restoration Research Project (ORRP) Histopathology
To qualitatively assess the health of year old oysters placed in NYC locations, year old
adult animals were retrieved on July 19-20, 2011 from the Hastings, Soundview, and
Staten Island ORRP research sites and from a Gowanus Canal site. In the Rutgers
University laboratories the oysters were weighed, shucked, and individual shell and
wet body weights were measured. The oysters were preserved in 10% formalin and
subsequently transferred to a 70% ethanol solution. The oysters were then placed in a
casing, which was immersed in a paraffin bath at a temperature of 135o F (Reichert
Histostat Rotary Microtome). After removal from the bath the paraffin was allowed to
solidify. The sample was then sliced into cross sections 6 m thin, placed on a
microscope slide, and baked at 60o C for 30 min. to remove any paraffin from the slide.
The slide was then stained with lithium carbonate, which colored the oyster tissues
dark blue, allowing us to observe and evaluate the condition of various soft tissues,
including the mantle, gill, digestive, and reproductive systems. A minimum of four
slides were prepared for each sample except those from Staten Island Raritan Bay,
where a limited number of live samples were recovered (N=3).
Lesion Severity scores for 20 randomly selected adult Eastern Oysters (approximately
70 mm in length) were calculated for each tissue type based on the visual
histopathology evaluation system (Table 8). The typical 50:50 sex ratio of females to
males (Morton 1991) was not observed in oysters sampled from the Staten Island shore
of Raritan Bay (100% male, N=3) or Soundview (research 100% male, N=5; native 80%
male, N=6). Conversely, oysters from Hastings-on-Hudson were 50% female (N=6).

49
However, we caution that these results were from a small number of samples, and so
should be considered within a very limited context.
Table 8. NY Oyster Histopathology Observations
Location Date of Collection
N General Comments on Histological Findings
Hudson River (Hastings, NY)
7/19/11 10 Oftheoysterswithgonadaltissue(N=8)50%werefemale.Bothmaleandfemalegonadswerefullydevelopedandreadytospawn.
Theoysterswereheavilyparasitizedwith“Dermo”;8/10hadvisiblesporesinthemantle,gillorconnectivetissue.
Thedamagewasevidentinallofthesetissueswithmacrophageinfiltrationandlossofglycogenrichconnectivetissue.
Therewasanincreaseingobletcellsliningboththewatertubesofthegillsandthemantleepithelium.Thisconditionindicatessometypeofchronicirritation.
Soundview Native
7/20/2011 6 Twooutofthesixoysterswerefemale(33%).Three(1Femaleand2Male)ofthesixoysterswerefullydevelopedandreadytospawn.Onemaleandonefemaleappearedtohavespawnedandonemalehaddelayedspermdevelopment.
“Dermo”wasnotevidentintheslides. Therewaslowtomoderategobletcellhyperplasia
alongthemantleepitheliumandthedigestiveglandducts.
Therewereminor/moderatestructuralabnormalitiesinafewoystersinvolvingthegillsandshellgland,butthesewererelativelyminor.
Soundview Research
7/20/2011 10 Eightofnineoystersweremaleinthisgroup.Therewasnogonadtissueforoneoysterpresentontheslide.Thesinglefemaleandtwooftheeightmaleoysterswerereadytospawn,whiletheothersixwereimmature
“Dermo”wasevidentinoneoyster Theoystersdiddisplaysomeminorgobletcell
proliferationalongthewatertubesofthegillandthedigestiveglandducts,buttheyweremuchlessinprevalenceandseveritythanthenativeoysters.
Inthemajorityofthetissuesexaminednosignificantlesionwasobservedinthisgroup.

50
Dominance of males does follow the sex ratio trend observed in the previously sampled
Hackensack research oysters (Ravit et al., 2013). Based on this histopathologic
evaluation, the healthiest oysters would be the Soundview Research followed by
Soundview Native, and the least healthy would be the Hudson River (Hastings, NY)
oysters. Although the Hastings oysters appeared able to spawn, the survival of the
adults due to “Dermo” infections would likely limit the population’s growth and
sustainability.
ORRP Oyster Metal Analysis
Composited subsamples taken from the oysters evaluated for histopathology were
analyzed at the Rutgers Environmental & Occupational Health Sciences Institute
(EOHSI) to determine soft tissue and shell metal concentrations. The shell and body
tissues were separately digested using a MarsX microwave sample digester (CEM Corp,
Matthews, N.C.). Between 90-260 mg of air-dried sample was reacted with 0.5 ml of
nitric acid (EMD Omni Trace, ultra high purity). The samples were microwaved
repeatedly (300W, 75% power, 5 minutes at a time) until no further digestion occurred.
Another 0.25 ml of nitric acid was added and the samples were microwaved repeatedly
(300W, 100% power, up to 10 min). When no further digestion occurred, another 0.75 ml
of nitric acid was added and the samples were sonicated 1 hr, microwaved a final time
(300W, 100% power, 20 min), cooled to room temperature, and diluted to 30 ml (Milli-Q
ultra pure de-ionized water of 18.2 megaohms, Millipore Corp.) The samples were
centrifuged, a few ml of supernatant was removed and re-centrifuged prior to five-fold
dilution with 5% nitric acid. Samples were analyzed for metals with an inductive
coupled plasma mass spectrometer (X5, Thermo Electron Corp.) using a multi-element
scan. Although oyster soft tissue metal concentrations have been reported for
individual nutrient metals and heavy metals of concern, our analysis of twenty-four

51
metals (Cu, Zn, K, Mg, Mn, As, Ag, Cd, Cr, Rb, Se, U, Ti, Sr, Co, Li, Fe, V, Al, Pb, Ni, Bi,
Ga, Cs) included soft tissue and shell concentrations and so was more extensive than
most studies.
Two-Factorial Analysis of Variance (ANOVA) was conducted to test differences in
metal uptake between the various research sites and between soft body and shell tissues
(SITE Factor Gowanus, Hastings, Soundview Native, Soundview Research; TISSUE
Factor Body vs. Shell). Oyster metal uptake varied by site, and interestingly, varied in
native oyster populations versus research seed oysters at the Soundview location (Fig.
15, Table 9). With the exception of strontium, the Soundview native oysters had
significantly lower concentrations of the metals tested, particularly in their soft body
tissues, versus metal concentrations in the research seed oysters placed at this location.
Sr body concentrations were almost thirty times greater (an order of magnitude) in
native Soundview oysters than in the research oysters sampled (15b, Table 9). There is
no long term data to determine whether restoration oysters placed at a specific location
will over time exhibit tissue metal concentrations that more closely mirror
concentrations found in a native population, although other research suggests this
might be the case (Frazer 1975, 1976). It is also not known if native oysters have evolved
metabolic defenses to mitigate the presence of historic heavy metal contaminants.
Oysters from the three NYC sites and two NJ sites were compared to determine total
mean metal concentrations in shells and soft body tissue (Fig. 16). Hastings and
Soundview oysters exhibited the highest mean total soft tissue metal concentrations
(25,000 PPM or greater), followed by Gowanus (~15,000 PPM), Hackensack (~10,000
PPM) and Keyport (<5,000 PPM) specimens. Shell mean metal concentrations exhibited
less variation, ranging from a low of ~3,300 PPM (Hackensack) to a high of ~5,500 PPM
(Hastings). However, based on the research to date it is not possible to know if/how
these metals might be affecting the oysters’ overall health or reproductive abilities.

52
B. Potentially toxic heavy metal concentrations (ppb)
A. ‘Nutrient’ metal concentrations (ppb)

53
Figure 15. Total PPB metal concentrations of: a) seven ‘Nutrient’ metals (Cu, Fe, K, Mg, Mn, Se, Z); b) nine potentially toxic Heavy Metals (Ag, Al, As, Cd, Cr, Ni, Pb, Sr, Ti); and c) eight metals of unknown effect (Bi, Co, Cs, Ga, Li, U, V) observed in three replicate samples from the Gowanus Canal, Hastings-on-Hudson and Soundview research sites. Note order of magnitude differences in Y axis concentrations.
C. ‘Unknown effects’ metal concentrations (ppb)
Figure 16. Mean total metal concentrations (PPM) in: a) shell and b) soft body tissues observed in oysters sampled from two NJ (Keyport, Hackensack) and three NY (Gowanus Hastings, Soundview) locations. Note the order of magnitude difference in the Y axes.
A. B.

54
Table 9. Metal concentrations (ppb) in Eastern Oyster shell and body tissue from NYC
restoration test locations. N= Native population; R= Research seed oysters.
Location Nutrients Heavy Metals
Non‐Essential?
Tot_Shell Tot_Body Tot_Shell Tot_Body Tot_Shell Tot_Body
Gowanus R 2709686 19210204 1413807 192345 3834 2898
Gowanus R 2747868 15382692 1430592 127874 4191 2580
Gowanus R 3235529 13217083 1415958 123559 4706 3089
Hastings N 3835293 30140703 1913771 595120 3457 12711
Hastings N 3858218 22859817 1929148 537715 4873 12075
Hastings N 3270037 32328737 1855338 418786 3297 11172
Soundview N 3060209 2868468 1334382 1395292 4265 4136
Soundview N 2532601 3058341 1231823 1389679 3383 4434
Soundview N 2940633 3101717 1294250 1368302 3904 4299
Soundview R 28694547 27265881 563336 264249 13481 11556
Soundview R 37728356 27289995 253183 335771 13858 12617
Soundview R 30648914 27146144 342029 419676 13261 12022
NYC Oyster Histopathology (2013)
Oysters sampled from three Baykeeper oyster gardening sites at the mouth of the
Arthur Kill (Tottenville) and Richmond County Yacht Club (Staten Island), and
Canarsie, Brooklyn (Fig. 17) were analyzed to determine the health of gardened oyster
at these locations. Measurements included oyster length, width, height, total weight,
body weight, shell weight, shell thickness, number of lesions observed on the whole
animal and on the cellular level, and growth rates. Using this numerical data, as well as
visual observations of the individual oysters sampled, we concluded that oysters placed
at the Canarsie, Brooklyn site appeared to be the healthiest. An exact comparison could
not be made between the Richmond County oysters and those from the two other sites
due to age differences (two years old versus one year old adult oysters, respectively).

55
The oyster gardening sites at Tottenville , Richmond County Yacht Club, and Canarsie
were sampled on 6/27, 6/28, and 7/2, respectively. Fourteen live specimens were
collected from the Tottenville and Canarsie sites and fifteen specimens were collected
from the Richmond County Yacht club, of which five were kept alive in the lab for other
experimental purposes. In total, 38 oysters were processed. Each oyster was cleaned of
barnacles, mud, and other fouling before being weighed. Specimen length (from hinge
to lip), width (ventrally/dorsally across the greatest distance), and height (across the
two valves) were measured. Each oyster was then shucked, retaining as much fluid as
possible, and the soft tissue and shell weighed separately. Each organism was
transected on a slight diagonal from posterior to anterior and the two halves
Figure 17. Three Baykeeper New York City oyster gardening sites and Soundview reintroduction site.

56
preserved in formalin. Shells were measured for thickness and any abnormalities of the
shell or soft tissues were noted. After at least 48 hours soft tissues were transferred to
70% ethanol and sliced for preparing histopathology slides. Special attention was paid
to include sections of the gills and mantle edge; other tissues of interest included
kidneys, digestive organs, gonads, and the heart.
Shell thickness was calculated using Frazier’s (1976) formula for shell surface area (SA):
SA=(2.5h)1.56 where h= shell height (hinge to lip)
Surface area was then used to calculate the shell thickness in grams per square
centimeter by dividing shell weight by surface area.
Oyster growth rates were calculated by dividing change in shell length by time in days.
Change in shell length was determined by subtracting the average shell length of the
seed oysters as reported on the Baykeeper website (3/4”, or 19.05 mm) from the shell
length of the sampled oysters. The time in days was the number of days since the seed
oysters were released to the gardeners until the day of sample collection. Differences
between oysters collected from the three sites are shown in the following graphs (Figs.
18-26). Morphological measurements (total weight, shell weight, body weight, and
width), exhibited a significant difference between oysters collected from Richmond
County and the other sites because Richmond County oysters were a year older than
the Tottenville and Canarsie oysters. Length and shell thickness of the Tottenville
oysters were significantly shorter and thicker, respectively, than the Canarsie oysters.
The number of lesions on each oyster varied within each site, but the Richmond County
oysters had more lesions than the Canarsie oysters (p <.05). Growth rates of the
Canarsie oysters were significantly higher (p<.005) than at the other two sites.
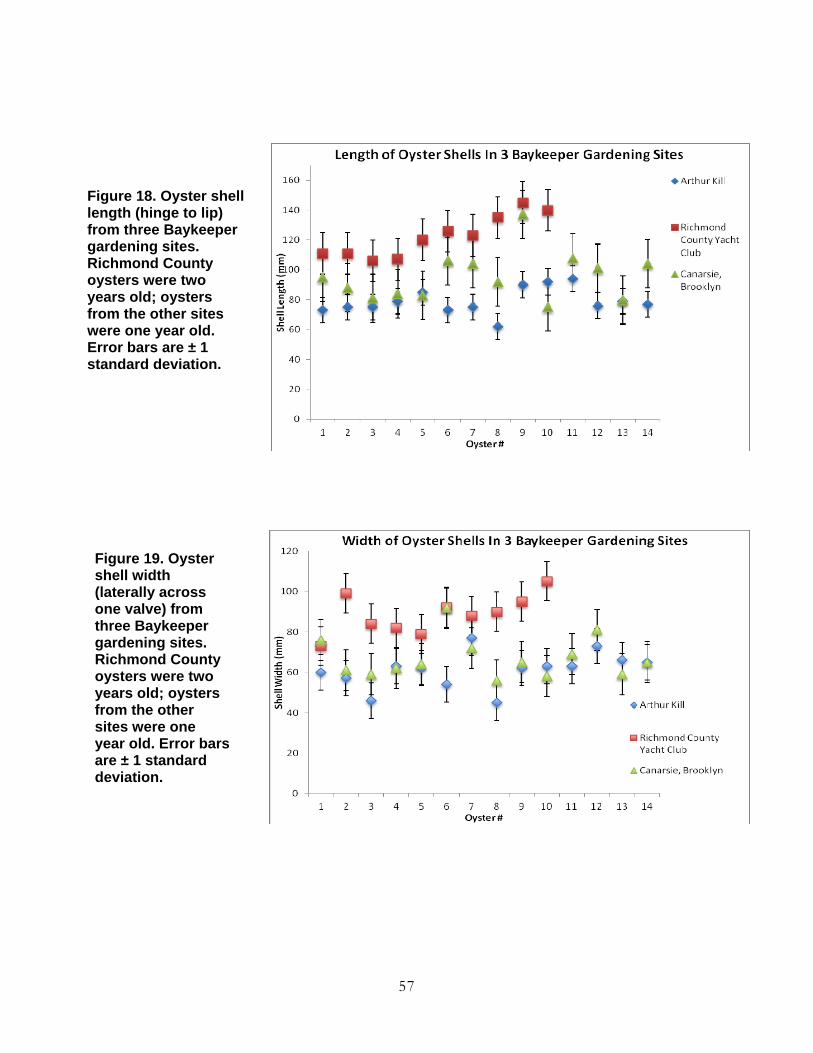
57
Figure 18. Oyster shell length (hinge to lip) from three Baykeeper gardening sites. Richmond County oysters were two years old; oysters from the other sites were one year old. Error bars are ± 1 standard deviation.
Figure 19. Oyster shell width (laterally across one valve) from three Baykeeper gardening sites. Richmond County oysters were two years old; oysters from the other sites were one year old. Error bars are ± 1 standard deviation.

58
Figure 20. Oyster shell height (across both valves) from Baykeeper gardening sites. Richmond County oysters were two years old; oysters from the other sites were one year old. Error bars are ± 1 standard deviation.
Figure 21. Total weight of oysters from Baykeeper gardening sites. Richmond County oysters were two years old; oysters from the other sites were one year old. Error bars are ± 1 standard deviation.
Figure 22. Soft tissue weight of oysters from Baykeeper gardening sites. Richmond County oysters were two years old; oysters from the other sites were one year old. Error bars are ± 1 standard deviation.

59
Figure 23. Shell weight of oysters from Baykeeper gardening sites. Richmond County oysters were two years old; oysters from the other sites were one year old. Error bars are ± 1 standard deviation.
Figure 24. Shell thickness of oysters from Baykeeper gardening sites. Richmond County oysters were two years old; oysters from the other sites were one year old. Error bars are ± 1 standard deviation.
Figure 25. Shell and soft tissue lesions observed in oysters from Baykeeper gardening sites. Richmond County oysters were two years old; oysters from the other sites were one year old. Error bars are ± 1 standard deviation.

60
The number of lesions observed in soft tissues and shells are shown in Figure 27 and
Table 10. A high diversity in the type of body lesions was observed in oysters from
Canarsie and a high occurrence of a pale mantle lining was seen in Richmond County
oysters. There was also a high incidence of chalky white deposits and yellowing in shell
lesions in specimens from all sites. Canarsie oysters had the lowest percentage (50%) of
yellow shell discolorations, while all of the Arthur Kill and Richmond County oysters
exhibited yellowing. Approximately 90% of the Richmond County specimens exhibited
mud blisters compared to 20% to 30%of specimens from the other sites.
Figure 26. Growth rates of oysters from Baykeeper gardening sites. Richmond County oysters were two years old; oysters from the other sites were one year old. Error bars are ± 1 standard deviation.
Figure 27. Percentage of oysters from three Baykeeper gardening sites with: a) body and b) shell lesions. Richmond County oysters were two years old; oysters from the other sites were one year old.

61
Comparisons were made to assess the relationship between shell morphological factors
(length, width, height) and oyster weight. As an indicator of overall shell size
irrespective of age, the length of the shell was multiplied by height and width; shell
weight, body weight, and shell thickness were then compared with the shell size (Figs.
28-33). The number of lesions was also compared with shell size (Fig. 34). Shell weight
and body weight exhibited a strong correlation with shell size ( R2 values of .821 and
.835, respectively), but shell thickness and the number of lesions did not show a
significant correlation with shell size (Fig. 35).
Figure 28. Shell weight versus overall shell size of oysters from three Baykeeper gardening sites. Richmond County oysters were two years old; oysters from the other sites were one year old.
Figure 29. Regression analysis of shell weight versus overall shell size of oysters from three Baykeeper gardening sites. Richmond County oysters were two years old; oysters from the other sites were one year old. Sample size = 38 oysters.

62
Figure 30. Body weight versus overall shell size of oysters from three Baykeeper gardening sites. Richmond County oysters were two years old; oysters from the other sites were one year old.
Figure 31. Regression analysis of body weight versus overall shell size of oysters from three Baykeeper gardening sites. Richmond County oysters were two years old; oysters from the other sites were one year old. Sample size = 38 oysters.

63
Figure 32. Shell thickness versus overall shell size of oysters from three Baykeeper gardening sites. Richmond County oysters were two years old; oysters from the other sites were one year old.
Figure 33. Regression analysis of shell thickness versus overall shell size of oysters from three Baykeeper gardening sites. Richmond County oysters were two years old; oysters from the other sites were one year old. Sample size = 38 oysters.

64
Figure 34. Shell lesions versus overall shell size of oysters from three Baykeeper gardening sites. Richmond County oysters were two years old; oysters from the other sites were one year old.
Figure 35. Regression analysis of shell lesions versus overall shell size of oysters from three Baykeeper gardening sites. Richmond County oysters were two years old; oysters from the other sites were one year old. Sample size = 38 oysters.

65
Table 10: Summary of oyster histopathology from Baykeeper gardening sites. NSL = No Significant Lesions; Abnormal = Lesions present; NP = Organ not present on the slide. Oysters sampled from Canarsie exhibited the lowest number of lesions; Richmond
County oysters exhibited the highest number of lesions per specimen (Fig. 36 and Table
10). Percentage of females ranged from 43% to 57% at Tottenville and Canarsie,
Site Tissue NSL Abnormal NP Female Male %
Female
Tottenville Epithelium/Mantel 5 8 1
(Arthur Kill) Connective 7 7 ‐
N = 14 Heart 4 2 8
Gastrointestinal 10 1 3
Labial Palps 4 4 6
Digestive 11 3 ‐
Kidney 3 2 9
Gills 6 7 1
Gonads 13 1 ‐ 6 8 43%
Richmond County Epithelium/Mantel 2 7 1
N = 10 Connective 2 7 1
Heart 6 1 3
Gastrointestinal 6 2 2
Labial Palps ‐ ‐ 10
Digestive 7 2 1
Kidney 2 3 8
Gills 4 5 1
Gonads 4 6 ‐ 5 4 50%
Canarsie Epithelium/Mantel 10 3 ‐
N = 14 Connective 11 1 2
Heart 12 ‐ 2
Gastrointestinal 9 ‐ 5
Labial Palps 4 ‐ 10
Digestive 14 ‐ ‐
Kidney 5 ‐ 9
Gills 11 ‐ 3
Gonads 14 ‐ ‐ 8 6 57%

66
respectively. The main abnormality exhibited by the Canarsie oysters was their
significantly thinner shells.
The physical measurements indicate that shell morphological measurements are not
indicative of tissue or reproductive health. It is not possible to comment on whether
the Arthur Kill oysters exhibited more lesions because they were in situ for a year longer
than oysters from the other sites. We do note that SuperStorm Sandy caused extensive
damage to the Richmond County Yacht Club and extensive sediment dredging was
required during the rebuilding process, which could have exposed oysters at this
location to resuspended sediments. The Richmond County Yacht Club also docks a
Figure 36. Proportion of oyster that exhibited no significant lesions (NSL), 1 – 4 lesions. Richmond County oysters were two years old; oysters from the other sites were one year old. Sample size = 38 oysters. AK = Arthur Kill/Tottenville (N = 14); RC = Richmond County Yacht Club (N = 10); CB = Canarsie, Brooklyn (N = 14).

67
large number of boats with motors, which could result in exposure of the oysters to
associated pollution. Concentrations of hydrocarbons, metals, solvents, and surfactants
are higher in marinas due to normal boat activity, and it is certainly possible that these
pollutants could have had an effect on the oysters’ growth and development
(http://www.epa.gov/owow/nps/mmsp/index.html).
The data suggest that some physical characteristics, such as shell weight and body
weight are correlated with shell size. However, it also appears that overall oyster size is
not highly correlated with the health or fitness of the oyster, and so evaluating tissue
histopathology is a necessary tool in assessing the suitability of a reintroduction site
with respect to long-term oyster population sustainability.
RRUUTTGGEERRSS--NNYY//NNJJ BBAAYYKKEEEEPPEERR ‘‘CCIITTIIZZEENN--SSCCIIEENNTTIISSTT’’ SSIITTEE SSEELLEECCTTIIOONN MMOODDEELL
Implementing an oyster restoration project is expensive, with costs ranging from
$200,000 to $2,000,000 per acre. USACE restorations cost billions and NOAA places the
cost at $1.5 million per mile of constructed oyster reef1. From a management point of
view the question becomes where should a reintroduction(s) be located in order to
achieve long-term sustainability and maximize costly reintroduction efforts? In an
estuary lacking a significant oyster population, where there is a high uncertainty of
reintroduction success, relying solely on management methods used to maintain an
existing fishery is problematic.
Although overall water quality in the HRE is improving, the presence of historic
environmental contaminants can have site-specific affects on successful reintroduction
of Eastern Oysters. HRE environmental constraints can diminish successful restoration
1 http://www.habitat.noaa.gov/pdf/tnc_oyster_economics_factsheet.pdf
68
outcomes and it is important to test proposed oyster reintroduction sites using low-cost
screening techniques prior to implementation of large-scale and expensive restoration
activities. We propose the Rutgers-Baykeeper Site Selection Model for pre-testing of
sites (Fig. 37) to identify locations with a higher likelihood of oyster survival and
reproductive fitness. This model could increase the possibility of long-term restoration
success, while lowering restoration costs. The first step in evaluating a proposed HRE
restoration site is to place juvenile oysters in locations where physio-chemical
parameters are within a range that supports oyster survival to determine over-winter
survivorship rates. This initial screening can be done easily and cheaply by utilizing
‘citizen scientist’ volunteers. If over-winter survivorship meets pre-set targets at a given
location, histopathology analyses of year old oysters should be conducted to determine
the animals’ overall health and reproductive fitness. Based on the results of this rapid
and inexpensive screening, expanded restoration activities can commence at HRE
locations where survival rates are high and oyster health appears normal. Conversely,
at locations where survivorship is low and/or oysters exhibit abnormal histopathology,
restoration activities should be re-directed to another location, and research to identify
the source(s) of environmental stressors that would inhibit successful oyster
reintroduction should be conducted.

69
Potential Oyster Restoration Location
Over-Winter in situ Survival Test
Physio-chemical Characterization
Histopathology Analyses (Year old Adults)
Eliminate Site
LOW H
IGH
NORMAL RANGE
ABNORMA
Expand Restoration Activities
NORMAL Eliminate Site
Figure 37. Schematic representation of the proposed Rutgers-Baykeeper Site Screening Model to
identify HRE sites with high potential for long-term oyster restoration success.

70
VV.. RRAARRIITTAANN BBAAYY HHAABBIITTAATT MMAAPPPPIINNGG PPRROOJJEECCTT
In an effort to further refine the CRP (2009) map of potential oyster reintroduction sites,
during the summers of 2011 and 2012, NY/NJ Baykeeper Oyster Program Staff and
Rutgers University scientists lead groups of ‘citizen-scientist’ volunteers in an effort to
survey the NJ Raritan Bayshore (2011) and the southern shore of Staten Island, NY
(2012). The goal of the Mapping Project was to document environmental parameters
that could serve as positive or negative indicators when evaluating the potential of a
specific location to support reintroduction of the Eastern Oyster into Raritan Bay by
fine-tuning the oyster restoration maps (Fig. 1) included in the CRP (2009). These
original maps were developed based on only four (4) criteria known to be significant in
the survival of spawned oyster eggs and larvae (salinity, dissolved oxygen, turbidity,
bathymetry).
Sampling sites were located approximately 100 meters apart, beginning at Keyport
Harbor municipal dock and extending eastward to the northern tip of Sandy Hook and
westward along the southern shoreline of Staten Island. Twenty-three (23) habitat
parameters (Table 11) were selected and evaluated at sampling locations covering
approximately 30 miles along NJ’s and NY’s Raritan Bayshore (Fig. 37). At each
sampling location water column and substrate data were collected approximately 12”
below the water surface in 3 ft. of water during a time period between two hours before
to two hours after mean low tide. Shoreline observations were made at the location
which was at a direct right angle to the water column sampling point and digital photos
were taken of all shoreline data collection points. The collected data were uploaded and
stored in hand-held Magellen Arc GIS units. The data were downloaded at the Rutgers
Center for Remote Sensing and Spatial Analysis (CRSSA), where data analysis and
mapping was completed.

71
Factor Rank Criteria Score Comments Bulkhead Negative Presence ‐1 Non‐natural Oyster Drill Negative Presence ‐1 Potential predator Armored Negative Presence ‐2 Potential attractive nuisance Roadway Negative Presence ‐3 Runoff potential toxic effects Soft clam Live Negative Presence ‐4 Existing species Substrate Silt Negative Presence ‐4 Potential to smother oysters Ulva mats Negative Presence ‐4 Potential to smother oysters Water Salinity Negative Below 10 ‐4 Too fresh Hard clam Negative Presence ‐5 Existing species High Energy Negative Presence ‐5 Unstable conditions for accretion Substrate Soupy Mud Negative Presence ‐5 Potential to smother oysters Dissolved oxygen Negative Below 4 ‐10 Summer conditions Blue Mussel Live Positive Presence 1 Indication of food & water quality Oyster Dead Positive Presence 1 Substrate Rock Positive Presence 1 Substrate Sand Beach Positive Presence 1 Natural shoreline Gravel Positive Presence 2 Potential substrate
Eel Grass Positive Present at shore 3 Good water quality
Spartina Positive Presence 4 Natural, lower energy Water Salinity Positive Above 10 4 Dissolved oxygen Positive Above 4 5 Summer conditions Firm Hard Sand Positive Presence 5 Live Oysters Positive Presence 5 Supportive conditions for survival
Oyster spat Positive Presence 5 Food & Water Quality supportive of oysters
Dock Neutral Presence
Mussel Bed Neutral Present at shore
Phragmites Neutral Shoreline Razor clam Live Neutral Red Seaweed Neutral Riprap Neutral Presence May be positive (substrate) or negative Shell Hash Neutral Presence Water Temperature Neutral Summer sampling
Table 11. Environmental factors employed to create the Raritan Bay Oyster Restoration Survey Map.

72
An Oyster Restoration Index Score (ORIS) based on the environmental data was
calculated for each sampling location. The final score was a compilation of the favorable
and unfavorable scores (ranked +1 through +5; ranked -1 through -5 and -10 for
dissolved oxygen below 4 mg/L, respectively) associated with each attribute sampled.
A map was generated using the ORIS (Fig. 38), which shows the overall ranking for
each sampling location. A link to an interactive version of the map can be found on at
http://cues.rutgers.edu/benthic/index.html. The interactive map allows the user to
connect to photographs documenting the shoreline condition and to view all the data
collected at any specific location. These maps are a first attempt to eliminate sites that
appear to be unsuitable for oyster reintroduction at this time, and to focus attention
toward locations that may have a greater chance of supporting long-term oyster
restoration success. A report describing this study and the data collected was submitted
to the USACE in December, 2013 to aide in their post-Sandy evaluation research.
Using the locations where the overall ORIS was positive, we employed a NOAA
bathymetry map to calculate the adjacent subtidal acreage in a depth range of 3 – 10 ft
(Figure 39). These maps were created to address the question of whether the goal of
200-acres of reestablished oyster reef is feasible under existing HRE conditions. Using
the criteria described, we estimate that over 1,000 subtidal acres could be considered for
future oyster restoration evaluation. We emphasize that these Maps are a starting
point only, and further scientific vetting is required before any of these high scoring
locations could be considered as appropriate for long-term oyster reintroduction
activities.

73
Figure 38. Oyster Restoration Index Score Map (ORIS).

74
Figure 39. Potential subtidal acreage (3 to 10 ft. depth range) adjacent to high scoring ORIS sampling sites.

75
VVII .. NNAAVVAALL WWEEAAPPOONNSS SSTTAATTIIOONN EEAARRLLEE
EEAARRLLEE PPRROOJJEECCTT OOVVEERRVVIIEEWW
As an alternative to the prohibited Keyport oyster restoration site, the NJDEP agreed in
September, 2011 to issue the required permits for Baykeeper to resume oyster research
within the confines of the Naval Weapons Station Earle (NWSE) pier complex. NWSE
waters are patrolled 24/7, and this location offers a unique opportunity to continue
HRE oyster reintroduction research under conditions that are protective of human
health. This NGO-military model will be the first of its kind in the HRE and offers a
way forward to continue to expand beneficial habitat restoration initiatives while
addressing health issues considered important by various regulatory agencies. The goal
was to replicate Keyport Harbor research in a safe and secure Raritan Bay site which
could sustainably support these living marine resources. The NWSE project is an
important component of the Baykeeper's long-term HRE benthic habitat/near shore
restoration strategy. In order to re-establish Eastern Oyster populations that become
self- sustaining natural systems it will be necessary to construct reefs in multiple sites
throughout the HRE. The data gained at NWSE will be invaluable in evaluating the
potential for successful reintroduction at other locations.
To determine Eastern Oyster over-winter survival at NWSE, 18 lantern nets containing
a total of 3,600 animals were attached to six locations on the NWSE working pier. Live
juvenile oysters were measured (length, height) prior to their placement in Earle waters
on October 1, 2011. Five-tier lantern nets (Fig. 40), each containing 200 juvenile oysters
(100 SOS; 100 seed), were placed subtidally and then attached directly to the naval pier
at 6 locations (3 on the western Raritan Bay side of the pier and 3 on the eastern Sandy
Hook Bay side of the pier). Three lantern nets at each location were anchored to a
cinder block resting on the bottom substrate.

76
We report the results of these research installations, but include the caveat that the
oysters only spent approximately one year in situ at NWSE prior to Hurricane Sandy
destroying many of the research cages. The oyster survival rates must be viewed with
caution because a large number of oysters were lost due to lantern net damage and loss
of the net cages. It appeared some predator(s) was able to damage the lantern nets, and
so we were only able to recover 25% of the animals placed at NWSE in September 2011
(902 out of 3,600 original oysters). We hypothesized that the physical loss of 75%of the
animals was the result of predation and the lack of protection afforded by the lantern
nets. We note that the off-the-shelf lantern nets were selected due to the limited amount
of time we had to set up the initial research field samples after the Baykeeper permit
application was approved. We recommend that this net not be employed again in the
HRE system for research purposes.
Figure 40. Three nets attached to the Earle naval pier (a); and five-tier lantern net containing 200 Eastern Oysters (b).
B.
A.

77
Two monitoring events were conducted in June and October, 2012. During both events
the numbers and sizes of surviving and dead oysters were recorded. Survival
percentages were calculated based on the number of total oysters recovered rather than
the number of oysters that were originally placed at NWSE. During the July monitoring
event any damaged nets were removed and their oysters consolidated into plastic
containers for greater security. Undamaged lantern nets remained in place. Due to the
lantern net damage, most oysters did not remain in their original positions on the net
shelves.
Over-winter survival for the 675 recovered oysters was very high – 90% were found to
be alive. We note that this is not a normal survival rate and may be due to an inaccurate
count due to the low sample recovery or the result of an abnormally mild winter (Fig.
41).
During the July, 2012 monitoring event live oysters were on average 30% longer than
Figure 41. New Jersey 2011 temperatures averaged some of the warmest since 1895. http://climate.rutgers.edu/stateclim_v1/images/nj_temp.jpg

78
dead animals; the lengths of live and dead oysters in October were similar (Fig. 42). The
greater length of the live July animals suggests that mortality occurred relatively early
after the winter ended, prior to the growth period that occurs when feeding rates
increase. Seed oysters were approximately 40% longer than SOS in July and 30% longer
in October.
During the July monitoring event 50 dead animals were removed from the cages and
the 625 live oysters were placed back in the water (Table 12). During the October
monitoring event only 373 animals were recovered (60%). Some loss was again due to
damage of the lantern nets. We also lost the three lantern nets attached to location #5,
Platform R-6, in the middle position on the eastern Sandy Hook Bay side of the pier.
The survival rate of recovered oysters was much lower (35%) than that observed in July.
This lower rate could have resulted because less fit animals that would normally die off
Figure 42. Eastern Oyster mean lengths at time of placement (Sept. 2011), and lengths observed during the July and October, 2012, monitoring events.

79
over the winter survived under a milder temperature regime, but then died later in
their first year of life. The lower survival rate could also be inaccurate due to the 252
oysters lost (40%). To obtain accurate survival rates at NWSE secure aquaculture cages
and longer term monitoring of the oysters housed in those cages is needed. A survey by
NWSE personal post-Hurricane Sandy (October 29-30) and post a nor’easter (Nov 7-8,
2012) found that four of the six pier locations no longer had oyster cages attached.
TABLE 12. Recovered Live and Dead NWSE Oysters – 2012
NWSE Biodiversity
Fin fish species found inside the oyster enclosures included juvenile Black Sea Bass, Eel,
Cunner, Cling Fish, and Freckled Goby. Invertebrate marine species included Grass
Shrimp, Oyster Drills, Spider Crabs, Mud Crabs, Blue Mussels, Barnacles, Red Beard
Sponge, Slipper Shells, Blood Worms, Asian Shore Crabs, and Blue Claw Crabs. Empty
lantern nets did not exhibit comparable biodiversity and were relatively empty of other
marine species.
Baykeeper decided that the overwinter NWSE survival rate warranted additional
research and that restoration efforts at NWSE should be expanded to a ¼-acre research
footprint containing 18 plots. It was recommended by Earle staff that the expanded
research should be conducted between the working and non-working piers (Fig. 43).
This location ensures that Baykeeper activities do not impinge on the naval mission,
while at the same time providing a location that would be completely inaccessible to
Date Type Live Dead # Lost Jul-12 Seed 407 34 1359 Jul-12 SOS 218 16 1566
Oct-12 Seed 51 119 237 Oct-12 SOS 78 125 15

80
poaching activity. Baykeeper received final approval in late 2012 for the required
NJDEP permits to install Phases II and III, consisting of a ¼-ace research footprint
followed by expansion of oyster reintroduction up to the permitted 10-plus acres.
However, the Baykeeper Atlantic Highlands facility was destroyed by SuperStorm
Sandy, and so Summer 2013 was devoted to reassembling the setting tank facility at
NWSE. The Navy also required that the research area be swept with side scan sonar
post-Sandy in order to detect any unexploded ordinance prior to Baykeeper and
Rutgers personnel entering the water. This navy scan is now scheduled for completion
in spring 2014.
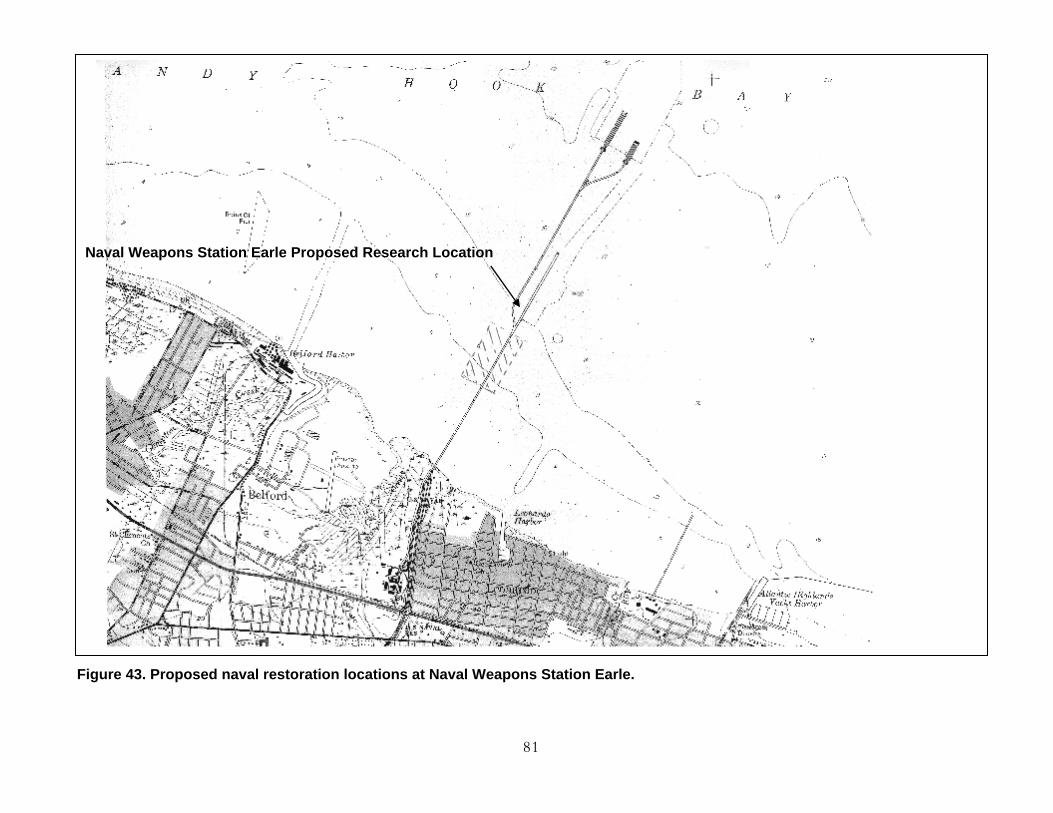
81
Naval Weapons Station Earle Proposed Research Location
Figure 43. Proposed naval restoration locations at Naval Weapons Station Earle.

82
OYSTER REEF RESTORATION RESEARCH – PHASE II (2014-2017)
The nest phase of the NWSE research (regulated by NJDEP Scientific Collection,
Tideland, and Waterfront Development Permits) will include the testing of three
different oyster enclosures to determine which supports the highest oyster survival and
growth rates. The structures will be placed subtidally so 2 – 3 ft. of water will cover the
oysters during the lowest portion of the tidal cycle. We have found this positioning to
be beneficial for oyster survival and subtidal placement also reduces the possibility of
facilitating illegal poaching activity (although based on the naval patrols protecting the
working pier, poaching is a very highly unlikely occurrence at NWSE). We will initially
test 3 support structures to determine their potential to withstand winter storm energies
encountered in Raritan Bay waters and support oyster survival and growth: Reefblk™
triangular rebar structures, Reef Ball™ concrete supports, and heavy duty wire mesh
cages (Figure 44). SOS oyster densities of ~1,000 oysters per meter sq (Mann et al. 2009)
will be housed in heavy duty polypropylene aquaculture mesh cages affixed to rebar
support structures (Reefblk™); set directly onto concrete Reef Balls™; and placed into
heavy duty wire mesh cages atop a layer of cured clam shell ~2 ft deep. The research
field plots will cover the ¼‐acre footprint, and will mirror the Keyport Harbor random
block design (Figure 45). As requested by the NWSE staff, the test cages will not be
anchored directly into the bottom sediments. Therefore, we will need to attach the rebar
and metal cages to the naval piers in order to eliminate the possibility of movement of
the test structures. The Reef Balls™ will be placed in between the metal structures.
Based on over‐winter survival and growth rates, one of these three structures will be
chosen to support the NWSE oyster research reef population.

83
OYSTER (REEF) BALL DIMENSIONS
REEF BLOCK™ METAL MESH CAGE
Reefballs™ are individual concrete semi-spherical units designed to emulate and create oyster reef. The structure is formed using a fiberglass mold containing a central Polyform buoy surrounded by various sized inflatable balls to make holes. The structure is designed to contain holes that provide areas for the oysters to colonize, and be heavy enough that it will not move in a high energy environment.
Reefblks™ are prefabricated double framed steel units which hold polypropylene aquaculture cages filled with juvenile oysters. The structures will be attached to the pier supports. It is hypothesized that they may provide some immediate shoreline protection. The triangular structure is 3 ft on each side.
The navy will supply the wire metal cage, which will contain a minimal 3 ft bottom layer of cured surf clams. Oyster eyed larvae spat will be set on cured surf clams and allow to grow out to a minimum length of 10 mm. The spat-on-shell (SOS) will then be placed on top of the surf clam base.
Figure 44. Descriptions of the Baykeeper NWSE Oyster Support Structures

84
To evaluate each structure, oyster subsets will be measured prior to placement at NWSE
during late summer 2014, and subsequently monitored during the summer of 2015
when the subsets will be recovered from the field plots, the animals re‐measured, and
live animals returned to the research plots. The 2015 monitoring will be done pre‐ and
post‐spawning (June and September). In addition to monitoring the oysters, we will
utilize temporary placement of fish traps to determine marine biodiversity associated
with the oyster research footprint. A set of two fish traps will be placed next to each
type of support structure and left in place for 24 hours. Upon recovery, the species and
number of each individuals collected in the traps will be documented. This sampling
will minimally occur at least once during the fall, summer, winter, and spring seasons.
To obtain water quality physiochemical parameters two continuous YSI Sonde probes
(salinity, temperature, pH, dissolved oxygen, turbidity, chlorophyll) will be installed.
Two Sonde installations were tested in October, 2013 – January, 2014 (Table 13). One
probe appears to be working properly, but the second probe did not record data.
Temperature and pH ranges were typical of a mid‐Atlantic estuary during the late
fall/winter time period. One very low dissolved oxygen event was recorded (10//18/13),
but this was the first day that the probe was in place and could therefore be an
inaccurate reading. Turbidity exhibited wide fluctuations and was often high.
Table 13. Minimum, Maximum, and Mean NWSE Water Quality Parameters 10/18/13-1/4/14.
Date Temp (oC) Dissolved O2 (mg/L) pH Turbidity (NTU) Chl (mg/L)
10/18‐11/21/13 5.6‐22.6 1.98‐19.8 6.2‐7.8 0‐238 0.3‐150
Mean 11.4 9.6 7.1 4.8 8.1
11/21/13‐1/4/14 ‐1 to 8 10‐19 6.4‐7.6 1‐902 0.8‐66
Mean 4.3 14 7.1 9 17

85
Figure 45. NWSE Research Schematic representation.
N
E
SHORE LINE
NWS E
ReefBlk
Reef Blk
1
Reef Ball
7
Reef Blk
Metal Cage
Metal Cage
14
Reef Ball
10
ReefBlk
4
ReefBlk
5
ReefBlk
6
Reef Ball
8
Reef Ball
9 11
Reef Ball
12
Metal Cage
13
Metal Cage
16
Metal Cage
17
Metal Cage
18
2 3
15
Non-Working Pier
Working Pier

86
PPRROOPPOOSSEEDD NNWWSSEE MMOONNIITTOORRIINNGG WWOORRKK PPLLAANN
TASK 1.0 ENVIRONMENTAL COMPLIANCE NY/NJ Baykeeper will be responsible for Scientific Collecting Permits, Tidelands, and
Waterfront Development applications to NJDEP. Installation and monitoring activities
would be conducted on the Earle research site during the months of May through
October, subject to approval of the permits and in coordination with a monitoring
schedule approved by Earle.
TASK 2.0
WATER QUALITY Permanently installed YSI Sonde probes (a minimum of two attached at pier interior
and exterior locations) will measure dissolved oxygen, salinity, pH, turbidity,
chlorophyll, and temperature.
TASK 3.0 REEF BIODIVERSITY Biodiversity associated with the research plots and adjacent to the research area will be
monitored using various sizes of crab and fish traps. Proposed sampling devices and
sampling schedule will be submitted to the Naval Weapons Station Earle for pre-
approval prior to commencement of research activities. The traps will be placed at the
research site during the May – October period for 24 hour intervals. Species collected in
the traps will be identified and this data will be used to characterize marine biodiversity
associated with the various support structures and the presence/absence of live oysters.
TASK 4.0 OYSTER GROWTH & SURVIVORSHIP

87
The goal of the Earle Oyster Reef Restoration Project is to determine restoration
methods that support long-term vertical accretion of oyster reef habitat. Oyster growth,
survivability, spat settlement, and associated marine community composition will be
monitored for a minimum two year period to determine the ability of Eastern Oysters to
survive and thrive in this location and to assess the effect of the oysters’ presence on the
local marine community. The Earle monitoring program will follow the methods used
in our Keyport Harbor study. Attached to the structures will be retrievable 0.1 m2
baskets housing randomly selected subsets of 100 oysters. These baskets will be
monitored to determine oyster growth, mortality, and marine species associated with
the reef. These baskets and the overall structures will also be monitored to determine
the degree (if any) of new spat recruitment. Oyster tissues will be evaluated annually to
determine histopathology (Dr. Keith Cooper, Rutgers toxicology lab) and tested at the
Rutgers Haskins Shellfish Laboratories to determine the intensity of MSX and Dermo
infection(s). Under the direction of Baykeeper staff and Rutgers University researchers,
volunteers may be involved in the monitoring process (measuring, recording data,
visual inspections). Volunteers will participate in the NY/NJ Baykeeper oyster training
workshop prior to joining the monitoring team.
TASK 5.0 PROJECT MONITORING & REPORTING A monitoring report will be compiled at the conclusion of each year’s monitoring
activities. Data collected will be housed on the Rutgers University server
(www.cues.rutgers.edu) and will be available to all project partners. The results of this
restoration project will be communicated to the general public, regulatory agencies, and
academic researchers through meeting presentations and papers submitted to
restoration publications and peer-review journals. A project overview will be available
through the Rutgers University website.
88
ADDITIONAL NWSE AREAS OF RESEARCH
Larval settlement on the adult oysters placed at NWSE is a critical component of long‐
term population sustainability. An initial mapping of potential NWSE larval transport
patterns was completed based upon existing Raritan Bay current and flow data
obtained from Dr. Bob Chant, Rutgers Institute of Marine and Coastal Sciences. This
analysis indicates that fertilized larvae produced by adult oysters located at Earle could
potentially remain in the general vicinity of the Earle piers over the 2 – 3 week period
the larvae remain in the water column. Should this larval transport projection be
correct, it would indicate the strong possibility of the larvae attaching to the adult
oysters at the Earle piers. This model prediction will be field verified if the 2015 year
old adults spawn. We note that the research seed oysters recovered from the Richmond
County Yacht Club location were observed to spawn while being held in the Rutgers
laboratories, and so are hopeful that Earle oysters will also be able to spawn after a year
in situ.
A further area of research should be to attempt to determine the effects that placement
of oysters/cage enclosures have on sediment and shoreline stability; research initiatives
that address this question should be introduced as part of future NWSE data collection
activities. The substrate between the working and non-working piers and adjacent to
the pier area where the oyster research field plots will be installed was surveyed (Figure
46) by James Nickels (Monmouth University) in July, 2013, post-SuperStorm Sandy.
Debris from Sandy-inflicted pier damage was observed in the general area where the
research plots will be located, but this debris was not extensive; debris appeared denser
adjacent to the wooden non-working pier (eastern side of the field plots). We had
anticipated that this survey would provide substrate detail prior to research cage

89
installations in fall, 2013. However, the navy has not yet completed their own sonar
survey and therefore the cages will not be installed until summer, 2014. Since the
substrate could be affected by winter storms, the results of the 2013 survey should not
be used as a baseline comparison of conditions pre-oyster installation.
Additional NWSE research may include installation of oysters in Ware Creek, located
west of the pier on naval property, and in front of the eroding sand beach adjacent to
the creek. This project has been proposed as part of a larger Ware Creek wetland
restoration effort and funding is currently pending.

90
Figure 46. Side scan sonar survey of the substrate under and adjacent to the NWSE pier where research plots will be installed.

91
VVIIII .. BBAAYYKKEEEEPPEERR OOYYSSTTEERR RREESSTTOORRAATTIIOONN:: CCOONNCCLLUUSSIIOONNSS
The survival and histopathology data obtained from research Eastern Oysters placed in
Keyport Harbor, at Baykeeper oyster gardening sites, and at NWSE Earle for
approximately one year suggest that there are indeed locations within the HRE where
oysters could potentially survive. However, it is NOT known how many of these
locations exist or where they are located, and so a large-scale. An inexpensive survey
and testing of potential restoration sites is need in order to meet the Oyster Restoration
targets set out in the Draft Hudson-Raritan Estuary Comprehensive Restoration Plan.
Based on the Raritan Bayshore habitat survey, it appears that there are locations in the
Bay that show promise of being able to support oyster populations, and that if
successful, these sites could indeed contribute to meeting the CRP (2009) goal of
reestablishing 200 acres of oyster reef in the short term and 5,000 acres by 2050. Keyport
Harbor and preliminary NWSE data suggest that achieving the CRP oyster restoration
targets would indeed be supportive of increased biodiversity in the HRE.
This report highlights the amount of data that is not yet known, but which is needed to
ensure successful HRE oyster reintroduction, as well as the great need for further basic
(and inexpensive) research prior to investing large amounts of restoration dollars.
Tissue abnormalities were not correlated with oyster size or weight, illustrating the
need for a biological in situ biomarker to aide in determining overall oyster health and
fitness at a specific reintroduction location. The CUES-Baykeeper Site Selection Model
provides a basis for such an analysis.
The Earle collaboration demonstrates that there is an opportunity to conduct oyster
research in the HRE under conditions that do not increase the potential for illegal
poaching activity. Identification of other secure sites in NY and NJ should be
undertaken and conversations with the site owners should be initiated. Once owner and
regulatory consent is obtained, the Site Selection Model should be followed and the

92
process of testing over-winter survival at other secure locations should begin. This
approach may include initial site selection in heavily patrolled waters (such as Earle) or
in locations where all harvesting of shellfish is prohibited, which would make
regulatory control and oversight much simpler. We also note that no further Raritan
Bay restoration research can occur without the cooperation of the NJDEP or NYDEC.
Conducting oyster restoration research activities at Naval Weapons Station Earle should
address regulatory fears that poaching would occur. This location supports the
continuation of ongoing long-term research, while addressing the regulatory
management issues associated with oyster reintroduction.
It is our hope that further Baykeeper oyster reintroduction research will elucidate the
actions required to ultimately reestablish a sustainable Eastern Oyster population in the
Hudson-Raritan Estuary.

93
REFERENCES CITED
1. Akyil, S., and A.M. Yusof. 2007. The distribution of uranium and thorium in samples
taken from different polluted marine environments. Journal of Hazardous Materials
144:564-569.
2. Bain, M., D. Suszkowski, J. Lodge, and X. Lijie. 2005. Setting Targets for Restoration of
the Hudson-Raritan Estuary. Report of an Interdisciplinary Workshop. Hudson River
Foundation. New York, NY.
3. Barnes, T.K., Volety, A.K., Chartier, K., Mazzotti, F.J., Pearlstine, L. 2007. A habitat
suitability index model for the eastern oyster (Crassostrea virginica), a tool for
restoration of the Caloosahatchee estuary, Florida. Jour Shellfish Res 26(4):949-959.
4. Bertness, M. D. 1999. The Ecology of Atlantic Shorelines. Sinauer Associates, Inc.
Sunderland MA.
5. Blotcky, A.J., C. Falcone, V.A. Medina, and E.P. Rack. 1979. Determination of trace-
level vanadium in marine biological samples by chemical neutron activation analysis.
Analytic Chemistry 51:178-182.
6. Brumbaugh, R.D., Beck, M.W., Coen, L.D., Craig, L., Hicks, P. 2006. A Practitioner’s
Guide to the Design and Monitoring of Shellfish Restoration Projects: An Ecosystem
Services Approach. The Nature Conservancy. Arlington, VA.
7. Buckley, B., Johnson, W., Fischer, E., Tu Q.and Heintz, M. 2003. Measurement of
Heavy Metals in Biological and Environmental Matrices Using Microwave Extraction,
Inductively Coupled Plasma Mass Spectrometry and Ion Chromatography for
Assessing Potential Risk to Human Health, (Chinese) Journal of Environmental and
Occupational Medicine, 20(6): 418-421.
8. CARP. 2007. http://www.carpweb.org/main.html. Downloaded 3/31/11.
9. Coen, L.D., R.D. Brumbaugh, D. Bushek, R. Grizzle, M.W. Luckenbach, M.H. Posey,
S.P. Powers, and S.G. Tolley. 2007. Ecosystem services related to oyster restoration.
Marine Ecology Progress Series 341:303-307.

94
10. CRP. 2009. Draft Hudson-Raritan Estuary Comprehensive Restoration Plan.
http://www.nan.usace.army.mil/harbor/index.php?crp. Downloaded 9/28/10.
11. Elston, R., E.W. Cake Jr., K. Humphrey, W.C. Isphording, and J.E. Rensel. 2005. Dioxin
and heavy-metal contamination of shellfish and sediments in St. Louis Bay,
Mississippi and adjacent marine waters. Journal of Shellfish Research 24:227-241.
12. Ford, S.E., Tripp, M.R. 1996. Diseases and Defense Mechanisms. In Kennedy, V.S.,
Newell, R.I.E., Eble, A.F. (eds) The Eastern Oyster: Crassostrea virginica. p. 581-660.
13. Frazier, J.M. 1975. The dynamics of metals in the American Oyster, Crassostrea
virginica. I. Seasonal Effects. Chesapeake Science 16(3):162-171.
14. Frazier, J.M. 1976. The dynamics of metals in the American Oyster, Crassostrea
virginica. II. Environmental effects. Chesapeake Science 17(3): 188-197.
15. Gornitz, V., Couch, S., Hartig, E.K. 2001. Impacts of sea level rise in the New York City
metropolitan area. Global and Planetary Changes 32:61-88.
16. Guzman-Garcia, X., A.V. Botello, L. Martinez-Tabche, and H. Gonzalez-Marquez.
2009. Effects of heavy metals on the oyster (Crassostrea virginica) at Mandinga Lagoon,
Veracruz, Mexico. Rev. Biol. Trop. 57:955-962.
17. Harding, J.M. and R. Mann. 1999. Fish species richness in relation to restored oyster
reefs. Bulletin of Marine Science 65(1):289-300.
18. Harding, J.M. and R. Mann. 2001. Oyster reefs as fish habitat: Opportunistic use of
restored reefs by transient fishes. Journal of Shellfish Research 20(3):951-959.
19. Hawkins, S.J., Gibbs, P.E., Pope, N.D., Burt, G.R., Chesman, B.S., Bray, S., Proud, S.V.,
Spence, S.K., Southward, A.J., Langston, W.J. 2002. Recovery of polluted ecosystems:
the case for long-term studies. Marine Ecology Progress Series54:215-222.
20. Hayes, W.J., I.J. Anderson, M.Z. Gaffor, and J. Hurtado. 1998. Trace metals in oysters
and sediments of Botany Bay, Sydney. Science of the Total Environment 212:39-47.
21. Hodder, K.H. Bullock, J.M. 1997. Translocations of native species in the UK:
Implications for biodiversity. Jour App Ecol 34:547-565.

95
22. Jackson, J.B.C. 2001. What was natural in the coastal oceans? Proceedings of the
National Academy of Sciences. 98(10):5411-5418.
23. Kennedy, V.S., Breitburg, D.L., Christman, M.C., Luckenbach, M.W., Paynter, K.,
Kramer, J., Sillner, K.G., Dew-Baxter, J., Keller, C., Mann, R. 2011. Lessons learned
from efforts to restore oyster populations in Maryland and Virginia, 1999 to 2007. Jour
Shellfish Res 30(3):719-731.
24. Kennish, M.J. 2004. Estuarine Research, Monitoring, and Resource Protection. CRC
Press, Boca Raton, FL.
25. Kimbrough, K.L., W.E. Johnson, G.G. Lauenstein, J.D. Christensen, and D.A. Apeti.
2008. An Assessment of two decades of contaminant monitoring in the nation’s coastal
zone. Silver Spring, MD. NOAA Technical Memorandum MOS NCCOS 74. 105 pp.
26. Kirshen, P., Watson, C., Douglas, E., Gontz, A., Lee, J., Tian, Y. 2007. Coastal flooding
in the northeastern United States due to climate change. Mitigation and Adaptation
Strategies for Global Change as part of the Special Issue entitled: “Northeast United
States Climate Change Impact Assessment”.
27. Lindeburg, M.R. 1992. Civil Engineering Reference Manual. 6th Ed. Professional
Publications, Inc. Belmont, CA.
28. Mann, R., M. Southworth, J.M. Harding, and J.A. Wesson. 2009. Population studies of
the native eastern oyster, Crassostrea virginica (Gmelin, 1791) in the James River,
Virginia, U.S.A. Journal of Shellfish Research 28(2):193-220.
29. McCay, B. J. 1998. Oyster Wars and the Public Trust: Property, Law, and Ecology in
New Jersey History. University of Arizona Press. Tucson, AZ.
30. Mihoub, J-B., P. Le Gouar, Sarrazin, F. 2009. Breeding habitat selection behaviours in
heterogeneous environments: implications for modeling reintroduction. Oikos
118:663-674.
31. Morton, B. 1991. Do the bivalvia demonstrate environment-specific sexual strategies?
A Hong Kong model. Journal of the Zoological Society of London 223:131-142.
32. NJDEP. 2006. Surface Water Quality Standards (N.J.A.C. 7:9B). Trenton, NJ.

96
33. NOAA. 1987.
34. NRC. 2007. Coastal Sensitivity to Sea Level Rise: A Focus on the Mid-Atlantic Region.
http://www.epa.gov/climatechange/effects/coastal/pdfs/CCSP_chapter8.pdf.
Downloaded 3/6/2012.
35. Peterson, C.H., Grabowski, J.H., Powers, S.P. 2003. Estimated enhancement of fish
production resulting from restoring oyster reef habitat: quantitative valuation. Marine
Ecology-Progress Series 264:249-264.
36. Piazza, B.P., Banks, P.D., La Peyre, M.K. 2005. The potential for created oyster shell
reefs as a sustainable shoreline protection strategy in Louisiana. Restoration Ecology
13(3):499-506.
37. Pollack, J.B., Cleveland, A., Palmer, T.A., Reisinger, A.S., Montagna, P.A. 2012. A
restoration
suitability index model for eastern oyster (Crassostrea virginica) in the Mission-Aransas
estuary, TX, USA. PlosOne 7:e40839.
38. Powers, S.P., C.H. Peterson, J.H. Grabowski, and H.S. Lenihan. 2009. Success of
constructed oyster reefs in no-harvest sanctuaries: implications for restoration. Marine
Ecology Progress Series 389:159-170.
39. Ravit, B., Cooper, K., S., Buckley, B., Comi, M. 2013. Improving management support
tools for reintroducing bivalve species in urban estuaries. Integrated Environmental
Assessment & Management. Submitted.
40. Ray, S.M. 1954. Biological studies of Dermocystidium marinum, a fungus parasite of
oysters. Rice Inst. Pam. Spec. Issue Nov. 1954. Monograph Biol. 114p.
41. Sadig, M., and I. Alam. 1989. Metal concentrations in Pearl Oyster, Pinctada radiate,
collected from Saudi Arabian coast of the Arabian Gulf. Bulletin of Environmental
Contamination & Toxicology 42:111-118.
42. Simenstad, C., C. Tanner, C. Crandell, J. White, Cordell, J. 2005. Challenges of Habitat
Restoration in a Heavily Urbanized Estuary: Evaluating the Investment. Jour Coastal
Res Special Issue 40:6-23.

97
43. Steimle, F., Foster, K., Kropp, R., Conlin, B. 2002. Benthic macrofauna productivity
enhancement by an artificial reef in Delaware Bay, USA. Journal of Marine Science
59:S1200-S105.
44. TEC. 2007. Target Ecosystem Characteristics for the Hudson Raritan Estuary:
Technical Guidance for Developing a Comprehensive Restoration Plan. A report to
the Port Authority of New York and New Jersey. New York, NY.
45. Volety, A.K. 2008. Effects of salinity, heavy metals and pesticides on health and
physiology of oysters in the Caloosahatchee Estuary, Florida. Ecotoxicology 17:579-
590.
46. Xie, R., Johnson, W., Rodriguez,, L., Gounder, M., Hall, G. and Buckley, B. 2007. A
Study Of The Interactions Between Carboplatin And Blood Plasma Proteins Using
Size Exclusion Chromatography Coupled To Inductively Coupled Plasma Mass
Spectrometry, Anal. and Bioanal. Chem. 387:2815–2822.