Embed Size (px)
Citation preview
NYSERDA: Offshore Wind Climate Adaptation and Resilience Study
Final Report | Report Number 21-04 | February 2021

NYSERDA’s Promise to New Yorkers: NYSERDA provides resources, expertise, and objective information so New Yorkers can make confident, informed energy decisions.
Our Vision:New York is a global climate leader building a healthier future with thriving communities; homes and
businesses powered by clean energy; and economic opportunities accessible to all New Yorkers.
Our Mission:Advance clean energy innovation and investments to combat climate change, improving the health,
resiliency, and prosperity of New Yorkers and delivering benefits equitably to all.
Cover Image: Shutterstock
NYSERDA: Offshore Wind Climate Adaptation and Resiliency Study
Final Report
Prepared for:
New York State Energy Research and Development Authority
Albany, NY
Adrienne Downey Principal Engineer
Prepared by:
ICF International, Inc.
Fairfax, VA 22031
Neil Weisenfeld Senior Energy Resilience Expert
Brenda Dix Senior Managing Consultant
Mason Fried Managing Consultant, Climate Scientist
Garrett Moran Wind Generation Senior Manager
Claire Phillips Climate Resilience Researcher
Matia Whiting Climate Resilience Researcher
NYSERDA Report 21-04 NYSERDA Contract 123055 February 2021
ii
Notice This report was prepared by ICF International, Inc. in the course of performing work contracted
for and sponsored by the New York State Energy Research and Development Authority (hereafter
“NYSERDA”). The opinions expressed in this report do not necessarily reflect those of NYSERDA
or the State of New York, and reference to any specific product, service, process, or method does not
constitute an implied or expressed recommendation or endorsement of it. Further, NYSERDA, the
State of New York, and the contractor make no warranties or representations, expressed or implied,
as to the fitness for particular purpose or merchantability of any product, apparatus, or service, or
the usefulness, completeness, or accuracy of any processes, methods, or other information contained,
described, disclosed, or referred to in this report. NYSERDA, the State of New York, and the contractor
make no representation that the use of any product, apparatus, process, method, or other information will
not infringe privately owned rights and will assume no liability for any loss, injury, or damage resulting
from, or occurring in connection with, the use of information contained, described, disclosed, or referred
to in this report.
NYSERDA makes every effort to provide accurate information about copyright owners and related
matters in the reports we publish. Contractors are responsible for determining and satisfying copyright
or other use restrictions regarding the content of reports that they write, in compliance with NYSERDA’s
policies and federal law. If you are the copyright owner and believe a NYSERDA report has not properly
attributed your work to you or has used it without permission, please email [email protected]
Information contained in this document, such as web page addresses, are current at the time
of publication.
Preferred Citation New York State Energy Research and Development Authority (NYSERDA). 2021. “Offshore
Wind Climate Adaptation and Resiliency Study,” NYSERDA Report Number 21-04. Prepared by
ICF International, Inc., Fairfax, VA. nyserda.ny.gov/publications
iii
Abstract New York State will increasingly face challenges from a rapidly changing climate in the years ahead
and is undertaking comprehensive climate action to mitigate the impacts of and increase resiliency to
climate change. Offshore wind (OSW) represents a critical component in achieving the State objective
of achieving a 100% clean electricity portfolio by 2040.
While OSW farms are already designed to withstand many climate hazards, climate change has the
potential to stretch design and operational limits, exposing equipment to potentially harsher and more
variable conditions than anticipated under conventional design paradigms.
Work accomplished under this NYSERDA project aggregated, refined, and distilled climate adaptation
and resiliency considerations that pertain to offshore wind for New York State and in the broader North
Eastern Atlantic region of the United States. The report identifies climate factors that are meaningful to
OSW operations and reliability and examines the range of options to build resilience to climate change,
including revisions to planning and design processes, technology solutions, and improvements to
operational strategies.
Keywords offshore wind resilience, wind turbine resilience, OSW, offshore wind resilience, climate change
Table of Contents Notice .........................................................................................................................................ii Preferred Citation ......................................................................................................................ii Abstract ....................................................................................................................................iii Keywords ..................................................................................................................................iii List of Figures ..........................................................................................................................vi List of Tables ...........................................................................................................................vii Acronyms and Abbreviations ................................................................................................vii Executive Summary ............................................................................................................ ES-1
1 Introduction: Climate Considerations for Offshore Wind Systems ................................1
iv
1.1 Offshore Wind Systems ............................................................................................................ 1 1.2 Offshore Wind and Climate Considerations .............................................................................. 3
1.2.1 Overview of Key Relevant Climate Factors ....................................................................... 3 1.2.2 Basics of Wind Turbine Operation ..................................................................................... 4 1.2.3 International Wind Turbine Design Standards ................................................................... 6 1.2.4 Climate Factors Impacting Offshore Wind Performance .................................................... 7
1.2.4.1 Wind: Velocity, Shear, Turbulence, Direction, Geographic Distribution, Temperature, and Moisture ....................................................................................................................................... 7 1.2.4.2 Wind Velocity (Including Frequency Distribution and Variation) ......................................... 8 1.2.4.3 Wind Direction .................................................................................................................. 9 1.2.4.4 Turbulence Intensity ....................................................................................................... 10 1.2.4.5 Wind Shear .................................................................................................................... 10 1.2.4.6 Wind Geographic Distribution ......................................................................................... 12 1.2.4.7 Air Temperature ............................................................................................................. 12 1.2.4.8 Air Moisture .................................................................................................................... 12
1.2.5 Climate Factors Impacting Offshore Wind System Reliability ........................................... 13 1.2.5.1 High Winds above Operating Limits ................................................................................ 13 1.2.5.2 Ocean Waves ................................................................................................................. 13 1.2.5.3 Precipitation ................................................................................................................... 15 1.2.5.4 Sea Level Rise ............................................................................................................... 15 1.2.5.5 Ice and Frozen Precipitation ........................................................................................... 16 1.2.5.6 Extreme Storms.............................................................................................................. 16
1.2.6 Onshore Electrical Infrastructure ..................................................................................... 17 1.2.7 Coastal Infrastructure and Ports ...................................................................................... 17 1.2.8 Human Stressors ............................................................................................................ 18
1.2.8.1 Hacking .......................................................................................................................... 18 1.2.8.2 Vandalism and Terrorism ................................................................................................ 19
1.2.9 Project Financing ............................................................................................................ 20
2 Projected Changes to Climate Factors and Potential Impacts .....................................22 2.1 Projected Climate Factor Changes ......................................................................................... 23
2.1.1 Wind Velocity, Frequency, and Variation ......................................................................... 23 2.1.2 Wind Shear and Geographic Distribution ........................................................................ 24 2.1.3 Extreme Weather and Wind Turbulence .......................................................................... 25 2.1.4 Hurricanes ...................................................................................................................... 25 2.1.5 Nor’easters ..................................................................................................................... 26
v
2.1.6 Precipitation.................................................................................................................... 27 2.1.7 Sea Level Rise ............................................................................................................... 27 2.1.8 Storm Surge ................................................................................................................... 29
3 Impacts of Climate Change on Wildlife and Communities from Offshore Wind ..........30 3.1 Wildlife ................................................................................................................................... 31
3.1.1 Offshore Wind Impacts on Wildlife .................................................................................. 31 3.1.1.1 Avian Wildlife: Bird and Bat Fatalities .............................................................................. 32 3.1.1.2 Marine Wildlife: Underwater Sound and/or Habitat Alteration .......................................... 33 3.1.1.3 Climate Change and Impacts of Offshore Wind on Wildlife .............................................. 34
3.2 Community Impacts ................................................................................................................ 34 3.2.1 Turbine Sound and Human Perception ........................................................................... 39 3.2.2 Coastal Dynamics ........................................................................................................... 39
3.3 Maritime Commerce ............................................................................................................... 40 3.3.1 Shipping ......................................................................................................................... 40 3.3.2 Commercial and Recreational Fisheries .......................................................................... 40
4 Evolving Opportunities for Offshore Wind Resilience ..................................................42 4.1.1 Wind Speed .................................................................................................................... 43 4.1.2 Wind Consistency and Geographic Distribution ............................................................... 47
4.1.2.1 Directional Consistency and Predictability ....................................................................... 47 4.1.2.2 Geographic Distribution .................................................................................................. 48
4.1.3 Wind Shear .................................................................................................................... 48 4.1.4 Sea Level Rise ............................................................................................................... 49 4.1.5 Extreme Weather ............................................................................................................ 49 4.1.6 Waves ............................................................................................................................ 51 4.1.7 Precipitation.................................................................................................................... 51
4.1.7.1 Rain, Water, and Ice ....................................................................................................... 51 4.2 Coastal Infrastructure and Ports ............................................................................................. 52 4.3 Electrical Infrastructure ........................................................................................................... 54
4.3.1 Ocean-Based Electrical Infrastructure ............................................................................. 54 4.3.2 Onshore Electrical Infrastructure ..................................................................................... 56
4.4 Human Stressors ................................................................................................................... 56 4.4.1 Hacking, Vandalism, and Terrorism ................................................................................ 56
4.5 Project Financing ................................................................................................................... 58
5 Conclusions .....................................................................................................................59
vi
6 References .......................................................................................................................60
Appendix A. Location Maps ................................................................................................. A-1
Appendix B. NYSERDA Environmental Research Offshore Wind Activities .................... B-1
Endnotes ............................................................................................................................ EN-1
List of Figures Figure 1. Offshore Wind System .................................................................................................2 Figure 2. Offshore Wind Port and Port Infrastructure Example ....................................................2 Figure 3. Turbine Wind Power Curve ..........................................................................................4 Figure 4. Graphical Profile of Vertical Wind Shear ....................................................................11 Figure 5. Offshore Wind Foundations ........................................................................................14 Figure 6. U.S. Wind Energy Potential Based on Average Wind Speeds at 300 Feet .................24 Figure 7. Tide Gauge Locations and Regional Settings .............................................................28 Figure 8: Potential Environmental Justice Areas .......................................................................36 Figure 9: Map of New York City Flooding from Hurricane Sandy, October 29, 2012..................37 Figure 10: Air Quality in New York State Metropolitan Area ......................................................38 Figure 11: Resiliency Risk Analysis Framework ........................................................................42 Figure 12. Close-Ups of Lift Modification Devices .....................................................................45 Figure 13 Offshore Inter-Array Cable Configurations.................................................................54 Figure 14. Wind Turbine Burglary Protection Door ....................................................................57
vii
List of Tables Table 1. The IEC 61400-1 Ed 4 Wind Turbine Classes ...............................................................6 Table 2. NYSERDA ClimAID Sea Level Rise Projections for New York State ...........................29 Table 3. NYSERDA’s Current Environmental Research Offshore Wind Activities and
Associated Categories ...................................................................................................31 Table 4. Summary of Relative Risk of Factors Associated with Climate Change to NYSERDA
Offshore Wind Development ..........................................................................................59
Acronyms and Abbreviations ABS American Bureau of Shipping ACPARS Atlantic Coast Port Access Route Study AEP Annual Energy Production AWEA American Wind Energy Association BOEM Bureau of Ocean Energy Management CLCPA Climate Leadership and Community Protection Act CMIP5 Coupled Model Intercomparison Project DLC Design Load Cases DOE Department of Energy EERE Energy Efficiency & Renewable Energy EIA Environmental Impact Assessment EIS Environmental Impact Statement EPA Environmental Protection Agency GCM Global Climate Model GHG greenhouse gas HVAC high voltage alternating current HVDC high voltage direct current IEC International Electrical Commission IPC individual pitch control IPCC Intergovernmental Panel on Climate Change LEE leading edge erosion LIDAR Light Detection and Ranging MARIPARS Massachusetts and Rhode Island Port Access Route Study NCA4 Fourth National Climate Assessment NEPA National Environmental Policy Act NNBF natural and nature-based features
viii
NOAA National Oceanic and Atmospheric Administration NREL National Renewable Energy Laboratory NWS National Weather Service NYC New York City NYS New York State NYSERDA The New York State Energy Research and Development Authority OEM original equipment manufacturers OREC Offshore Wind Renewable Energy Certificate OSW offshore Wind PARS Port Access Route Studies RCP Representative Concentration Pathways SCADA supervisory control and data acquisition SME subject matter expert USCG U.S. Coast Guard
ES-1
Executive Summary The purpose of this study is to aggregate, build knowledge of, and distill climate adaptation and
resiliency considerations that pertain to offshore wind (OSW) for New York State and to identify
resilient design strategies that the New York State Energy Research and Development Authority
(NYSERDA) can implement to support meeting its OSW development objectives. Published in
support of NYSERDA's goals under its 2020–2023 Strategic Outlook: Toward a Clean Energy Future,
this study aims to build awareness and drive resilient outcomes to implement the goals outlined in the
New York State Climate Leadership and Community Protection Act (CLCPA) as well as to ensure a
just transition, bringing energy efficiency, community resilience, and clean energy jobs to our State. This
study represents a first industry sector in depth investigation into the topic of resiliency and serves as a
harbinger of more concentrated action from NYSERDA in the months ahead on this strategic focus area.
Given that New York State’s OSW resource is situated in federal waters spanning the coast from New
England through southern New Jersey, resiliency considerations for the State may also be relevant for
the broader Northeastern Atlantic Region. For the purposes of this study, we consider resilience as the
planning, design, operational, and financial considerations that facilitate meeting performance objectives
under a broad range of conditions today as well as in the future. There are several performance objectives
for OSW, including project economics (e.g., energy generated, operations, and maintenance costs),
technical performance criteria (e.g., mechanical availability), climate change mitigation (e.g., avoided
tons of carbon), and the consideration of these objectives differs depending on a given stakeholder.
New York State will face challenges from a rapidly changing climate in the years ahead. In response,
the State is undertaking comprehensive climate action at an unprecedented rate in our nation to deliver
a range of projects and initiatives to decarbonize our economy, mitigate impacts and increase resiliency
to climate change. The CLCPA seeks to mitigate climate change impacts by requiring NYS to have a
net zero carbon economy by 2050, including a 100% clean electricity portfolio by 2040. Offshore
wind represents a critical component to meet this mandate and improve climate resiliency in the State.
Accordingly, NYS is supporting the development of at least 9 gigawatts (GW) of OSW energy by 2035
as a crucial step on the pathway to a carbon-neutral economy and an integral part in achieving the Clean
Energy Standard, whereby 70% electricity will come from renewable sources by 2030.
ES-2
While OSW developments are already designed to withstand many climate hazards, including
extreme winds and storm surge,1 climate change has the potential to stretch design and operational
limits, exposing equipment to potentially harsher and more variable conditions than anticipated under
conventional design paradigms. For example, climate change may exacerbate strong storms and sea
level rise, as well as drive changes in wind patterns and velocity that could affect reliability or the extent
to which the system provides output and avoids periods of temporary disruption. However, while climate
change is an acknowledged reality in New York State and around the globe, the extent and severity of
impacts related to climate change remains to be seen.
Mainland ports are also integral in the transport and staging of material used for construction of OSW
systems. Port infrastructure, such as warehouses, wharves, piers, cranes, and container storage yards, as
well as port operations, are potentially vulnerable to several of the climate factors described in this report.
Additionally, potential threats to resilience such as hacking, vandalism, and terrorism are considered,
though the strong remote monitoring software and challenge of physically accessing offshore turbines
mitigate the vulnerability to such attacks.
Since 2010 over much of North America, Europe, and Asia, global wind speeds have increased,
yielding an estimated 17% increase in potential wind energy for the average wind turbine (Zeng et al.
2019). Looking forward, changes to wind velocity, frequency, and variation due to climate change and
corresponding impacts to offshore wind performance and reliability in the Northeastern United States
remain uncertain. Projections regarding hurricanes indicate that by 2050, the frequency of hurricanes
will likely be similar to today, although the frequency of strong hurricanes is projected to increase.
Stronger hurricanes produce stronger winds, ocean waves and storm surge that could be detrimental
to offshore wind developments and coastal infrastructure.
All forms of energy generation have the potential to impact wildlife and communities. However, the
impact on wildlife and ecologies is far less significant from wind power generation than traditional
forms of energy production based on fossil fuels, because wind power does not require the same level
of resource extraction in manufacturing and construction or promote large-scale ecosystem pollution and
emissions during their up to 25-year operational lives (Carini, 2018; American Bird Conservancy, 2017).
Due to the uncertain nature of several likely future changes—such as changes in biodiversity patterns
ES-3
and future species redistribution—some impacts noted in this review are neither positive or negative,
but rather trends that NYSERDA is aware of and will seek to understand potential technical and design
adaptations to promote sensitivity to a changing climate in its efforts to support the responsible and cost-
effective advancement of this industry and projects supplying New York State with clean energy.
The common potential community impacts associated with offshore wind development—particularly
sound impacts experienced by nearby communities and coastal impacts such as turbine visibility—will
be significantly mitigated by the wind farm’s location more than 14 miles offshore (see Figure A-1) and
will not likely be significantly influenced by changes in climate (NYSERDA, 2013a). Conversely,
significant direct and indirect benefits to coastal communities in the State are anticipated through
offshore wind, including the responsible transition away from dirtier “peaker plants” (power plants
used to balance the fluctuating power requirements of the grid) to provide local energy while
meaningfully improving air quality in more vulnerable communities; investment in grid hardening
and resource diversity; port infrastructure investment that will enable maritime industries; and the
creation of 10,000 jobs by 2035. Where the CLCPA squarely recognizes the frontline experience
of disadvantaged communities2 in the fight against climate change, this study’s identified resiliency
considerations should be furthermore considered as a starting point to think of how users could best
intersect these initiatives with the delivery of benefits including workforce development, training,
jobs creation, and economic development broadly to disadvantaged communities, and the critical
partnerships to do so.
Current OSW design practices already consider a range of climate factors in OSW project site
assessments and characterizations. Indeed, these components are fundamentally designed to be
subjected to harsh conditions, and international OSW design standards account for storms and
extreme weather in the region of interest. However, under climate change, these factors will only
grow in importance. Recognizing the important new investments in technology to help support New
York State’s electricity grid that offshore wind will bring, NYSERDA recognizes the opportunity to
employ best efforts to ensure that the infrastructure built today is also cost-effective and responsible
for tomorrow.
This study identifies a range of options to build resilience into OSW systems. For example, wind turbines
can be made more robust with heavier or stiffer blades, or new radical designs such as split pitch and
two-bladed turbine layouts may enable turbines to more efficiently withstand extreme weather events
without damage (NREL, 2016; Kim et al, 2015). Turbines can incorporate technology that actively
ES-4
adjusts the blades to either improve performance in low-wind conditions or reduce loading in high-wind
conditions. Smart technologies can optimize operation in changing wind conditions by using lasers that
allow the turbine to register the wind approaching the turbine rotor, allowing the turbine to optimize
operation in changing wind conditions. This type of technology is becoming more commonplace in the
wind industry but is currently only offered as standard with wind turbines by one major turbine original
equipment manufacturer (OEM). Future scenarios of sea level rise can be incorporated into OSW system
planning through the design of the turbine foundations. Additionally, future climate conditions, such as
sea level rise and extreme weather, can be factored into the structural composition of and operations at
mainland ports that are associated with the OSW developments. In contemplating the anticipated changes
to the climate in the Northeast Atlantic and the various design or operational enhancements that are
emerging in the industry, NYSERDA and its selected OSW projects have the ability to make considered
decisions to support the incorporation of resilient design strategies into the development of 9 GW of
OSW by 2035, along with the associated mainland port infrastructure.
1
1 Introduction: Climate Considerations for Offshore Wind Systems Offshore wind infrastructure includes ocean-based and land-based assets as well as supporting assets such
as coastal ports and their associated supply chains. There are several climate factors that are meaningful
to offshore wind (OSW) operations. Some factors such as wind velocity, shear, turbulence, consistency
of direction, and geographic distribution affect the performance of OSW systems or their ability to deliver
the expected output of energy over their useful lives. Other climate factors such as high wind speeds,
storms, and waves may affect reliability or the extent to which the system provides output and avoids
periods of temporary disruption as a result of climatic conditions outside of the normal operating range.
This section covers those climate factors and describes the ways in which those factors impact OSW
reliability and performance. In addition, the section covers human factors such as hacking and terrorism
and the potential impact on offshore wind systems. Finally, the research team discusses how climate
change may impact project financing and the associated due diligence3 required.
1.1 Offshore Wind Systems
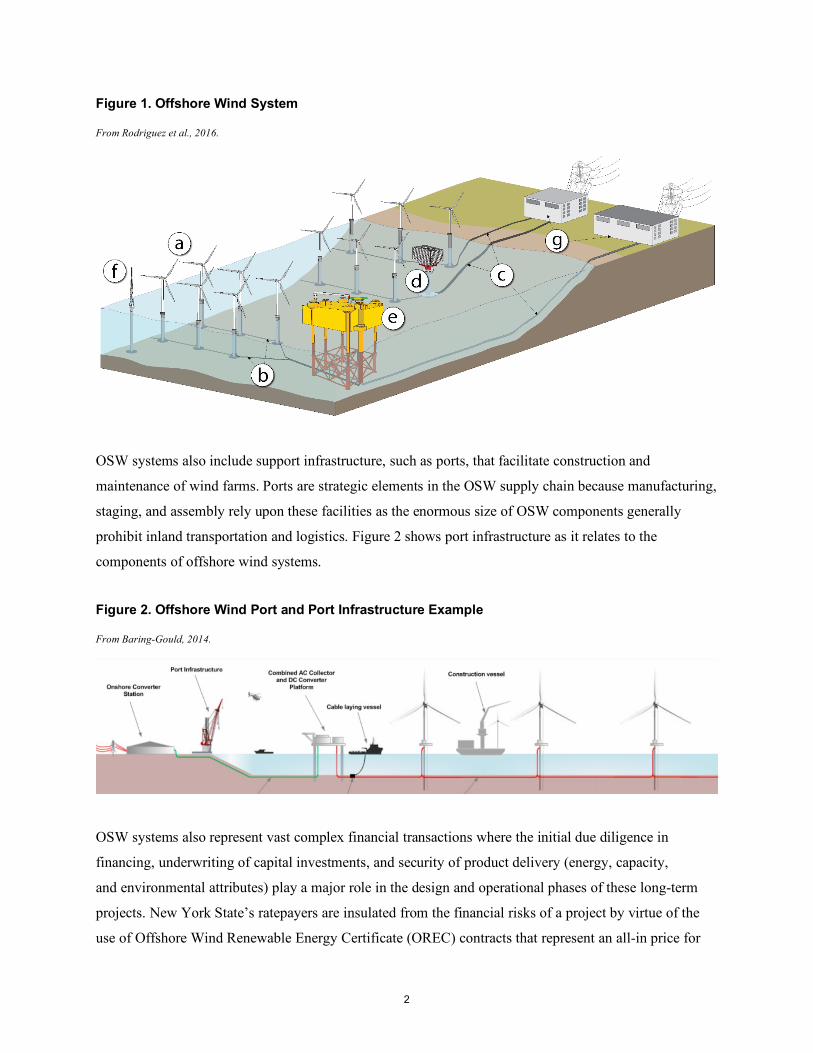
Offshore wind systems include ocean-based and land-based assets. Figure 1 shows a representative
offshore wind system. Ocean-based assets include (a) wind turbine generator, and its foundations, which
generates electricity from the wind, (b) collection or inter-array cables that electrically connect together,
(c) export cables which transmit the electricity to shore and include the cable landings where ocean-based
cable systems transition to underground land-based systems, (d) transformer stations which increase the
voltage of the electricity for transmission to shore, (e) converter stations that, in some installations,
convert the alternating current output of the wind turbines to direct current for transmission to shore, and
(f) meteorological masts which contain weather sensors. Land-based assets include (g) onshore stations
which receive the transmitted electricity and provide connection to the energy grid. At the OSW system
level, resilience is reflected in the fact that the output of the system is distributed across numerous wind
turbine generators, and the undersea electrical grid can be designed via a combination of series and
parallel connections to provide redundancy to allow continued output despite failures in the electrical
cables and substations.
2
Figure 1. Offshore Wind System
From Rodriguez et al., 2016.
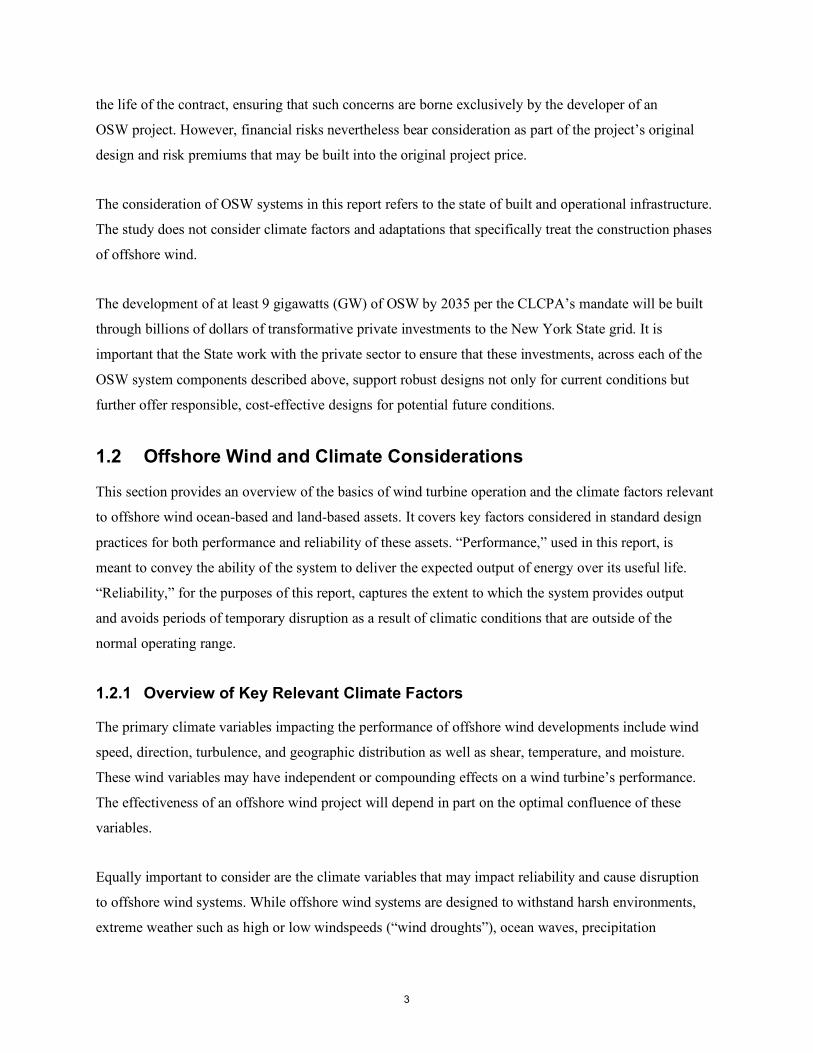
OSW systems also include support infrastructure, such as ports, that facilitate construction and
maintenance of wind farms. Ports are strategic elements in the OSW supply chain because manufacturing,
staging, and assembly rely upon these facilities as the enormous size of OSW components generally
prohibit inland transportation and logistics. Figure 2 shows port infrastructure as it relates to the
components of offshore wind systems.
Figure 2. Offshore Wind Port and Port Infrastructure Example
From Baring-Gould, 2014.
OSW systems also represent vast complex financial transactions where the initial due diligence in
financing, underwriting of capital investments, and security of product delivery (energy, capacity,
and environmental attributes) play a major role in the design and operational phases of these long-term
projects. New York State’s ratepayers are insulated from the financial risks of a project by virtue of the
use of Offshore Wind Renewable Energy Certificate (OREC) contracts that represent an all-in price for
3
the life of the contract, ensuring that such concerns are borne exclusively by the developer of an
OSW project. However, financial risks nevertheless bear consideration as part of the project’s original
design and risk premiums that may be built into the original project price.
The consideration of OSW systems in this report refers to the state of built and operational infrastructure.
The study does not consider climate factors and adaptations that specifically treat the construction phases
of offshore wind.
The development of at least 9 gigawatts (GW) of OSW by 2035 per the CLCPA’s mandate will be built
through billions of dollars of transformative private investments to the New York State grid. It is
important that the State work with the private sector to ensure that these investments, across each of the
OSW system components described above, support robust designs not only for current conditions but
further offer responsible, cost-effective designs for potential future conditions.
1.2 Offshore Wind and Climate Considerations
This section provides an overview of the basics of wind turbine operation and the climate factors relevant
to offshore wind ocean-based and land-based assets. It covers key factors considered in standard design
practices for both performance and reliability of these assets. “Performance,” used in this report, is
meant to convey the ability of the system to deliver the expected output of energy over its useful life.
“Reliability,” for the purposes of this report, captures the extent to which the system provides output
and avoids periods of temporary disruption as a result of climatic conditions that are outside of the
normal operating range.
1.2.1 Overview of Key Relevant Climate Factors
The primary climate variables impacting the performance of offshore wind developments include wind
speed, direction, turbulence, and geographic distribution as well as shear, temperature, and moisture.
These wind variables may have independent or compounding effects on a wind turbine’s performance.
The effectiveness of an offshore wind project will depend in part on the optimal confluence of these
variables.
Equally important to consider are the climate variables that may impact reliability and cause disruption
to offshore wind systems. While offshore wind systems are designed to withstand harsh environments,
extreme weather such as high or low windspeeds (“wind droughts”), ocean waves, precipitation
4
(especially in the form of rain and ice), and sea level changes can potentially have a detrimental impact
on wind energy production and OSW system assets. All these factors are accounted for in international
design standards, such as the International Electrical Commission (IEC) 61400-3 standard, which outlines
the minimum design requirements for offshore wind turbines, including such considerations as acute
maximum loads and long-term fatigue performance. Offshore wind systems are designed to maximize
performance and minimize disruptions to power production.
1.2.2 Basics of Wind Turbine Operation
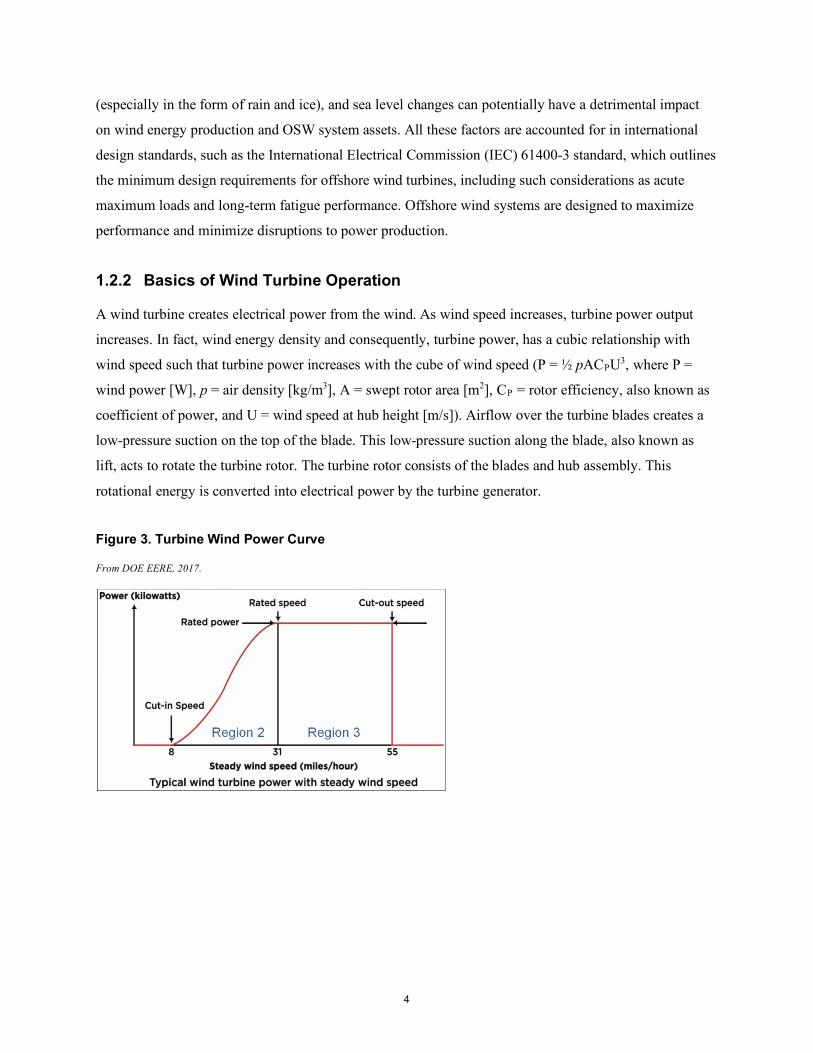
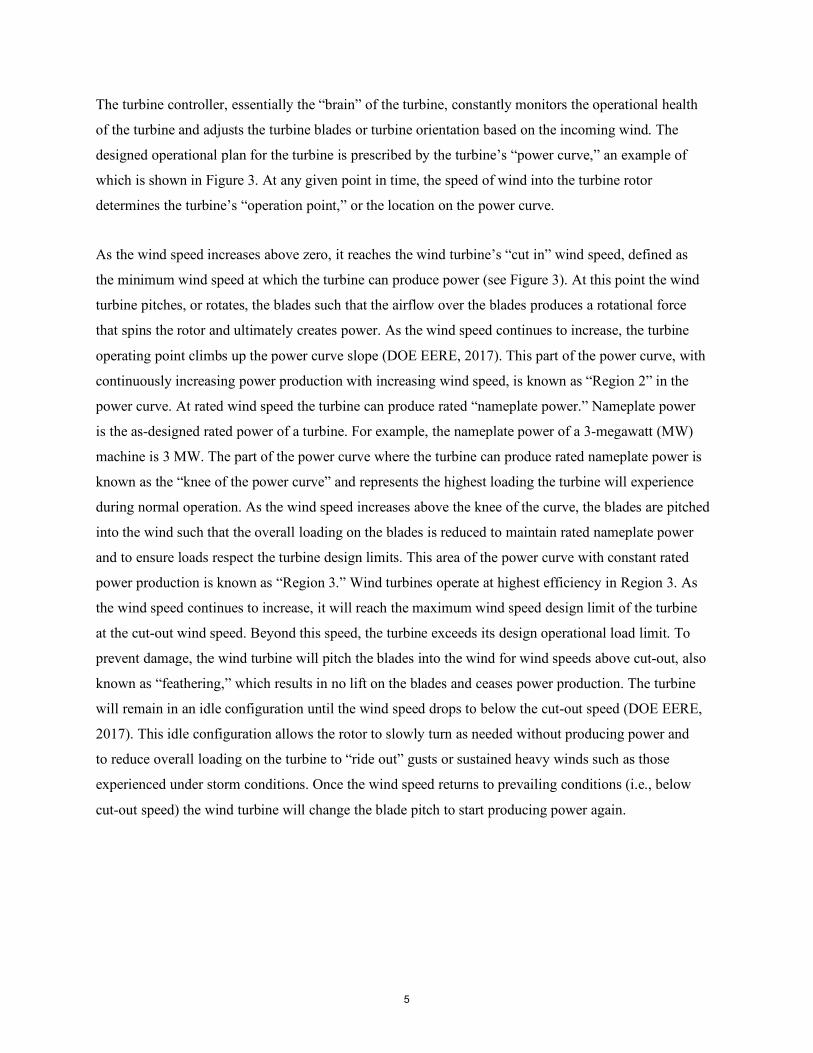
A wind turbine creates electrical power from the wind. As wind speed increases, turbine power output
increases. In fact, wind energy density and consequently, turbine power, has a cubic relationship with
wind speed such that turbine power increases with the cube of wind speed (P = ½ pACPU3, where P =
wind power [W], p = air density [kg/m3], A = swept rotor area [m2], CP = rotor efficiency, also known as
coefficient of power, and U = wind speed at hub height [m/s]). Airflow over the turbine blades creates a
low-pressure suction on the top of the blade. This low-pressure suction along the blade, also known as
lift, acts to rotate the turbine rotor. The turbine rotor consists of the blades and hub assembly. This
rotational energy is converted into electrical power by the turbine generator.
Figure 3. Turbine Wind Power Curve
From DOE EERE, 2017.
5
The turbine controller, essentially the “brain” of the turbine, constantly monitors the operational health
of the turbine and adjusts the turbine blades or turbine orientation based on the incoming wind. The
designed operational plan for the turbine is prescribed by the turbine’s “power curve,” an example of
which is shown in Figure 3. At any given point in time, the speed of wind into the turbine rotor
determines the turbine’s “operation point,” or the location on the power curve.
As the wind speed increases above zero, it reaches the wind turbine’s “cut in” wind speed, defined as
the minimum wind speed at which the turbine can produce power (see Figure 3). At this point the wind
turbine pitches, or rotates, the blades such that the airflow over the blades produces a rotational force
that spins the rotor and ultimately creates power. As the wind speed continues to increase, the turbine
operating point climbs up the power curve slope (DOE EERE, 2017). This part of the power curve, with
continuously increasing power production with increasing wind speed, is known as “Region 2” in the
power curve. At rated wind speed the turbine can produce rated “nameplate power.” Nameplate power
is the as-designed rated power of a turbine. For example, the nameplate power of a 3-megawatt (MW)
machine is 3 MW. The part of the power curve where the turbine can produce rated nameplate power is
known as the “knee of the power curve” and represents the highest loading the turbine will experience
during normal operation. As the wind speed increases above the knee of the curve, the blades are pitched
into the wind such that the overall loading on the blades is reduced to maintain rated nameplate power
and to ensure loads respect the turbine design limits. This area of the power curve with constant rated
power production is known as “Region 3.” Wind turbines operate at highest efficiency in Region 3. As
the wind speed continues to increase, it will reach the maximum wind speed design limit of the turbine
at the cut-out wind speed. Beyond this speed, the turbine exceeds its design operational load limit. To
prevent damage, the wind turbine will pitch the blades into the wind for wind speeds above cut-out, also
known as “feathering,” which results in no lift on the blades and ceases power production. The turbine
will remain in an idle configuration until the wind speed drops to below the cut-out speed (DOE EERE,
2017). This idle configuration allows the rotor to slowly turn as needed without producing power and
to reduce overall loading on the turbine to “ride out” gusts or sustained heavy winds such as those
experienced under storm conditions. Once the wind speed returns to prevailing conditions (i.e., below
cut-out speed) the wind turbine will change the blade pitch to start producing power again.

6
1.2.3 International Wind Turbine Design Standards
IEC 61400-1 and IEC 61400-3
There are a number of international design standards that give guidance on the design of wind turbines,
and all wind turbines sold internationally are certified to have been designed per these international
design standards. Two of the most common and widely used standards are the IEC 61400-1, which
outlines the design of onshore wind turbines, and the IEC 61400-3, which outlines the design of
offshore wind turbines. Both design standards set a list of Design Load Cases (DLC) which simulate
various loading conditions a wind turbine may experience. In order to achieve international certification,
a wind turbine design must meet or exceed all DLC requirements.
Both IEC wind turbine standards categorize the operational environments for which a wind turbine
should be designed. Table 1 contains the IEC wind classes, as defined in IEC 61400-1.
Table 1. The IEC 61400-1 Ed 4 Wind Turbine Classes
Source: Liu et al, 2018.
Wind Turbine Class I II III S Vave (m/s) 10 8.5 7.5
Values specified by the designer
Vref (m/s) 50 42.5 37.5
Tropical (m/s) Vref,T 57 57 57 A+ Iref (-) 0.18 A Iref (-) 0.16 B Iref (-) 0.14 C Iref (-) 0.12
The parameter values apply at hub height: Vave is the annual average wind speed Vref is the reference wind speed average over 10 min Vref,T is the reference wind speed average over 10 min applicable for areas subject to tropical cyclones Iref is a reference value of the turbulence intensity A+ designates the category for very high turbulence characteristics A designates the category for higher turbulence characteristics B designates the category for medium turbulence characteristics C designates the category for lower turbulence characteristics
The IEC 61400-3 combines the above table with wave and current loading as well as sea level to develop
a full-offshore design load case set for the design of offshore wind turbines.

7
The reader should note the S class on the top right of Table 1. The S stands for “site specific.” In the early
days of the wind industry, wind turbines were generally designed for a specific wind class per the IEC,
such as IA or IIIB, which defines the average and reference wind speeds as well as the turbulence level.
Since wind farm designers would select the next higher wind class for their project site, the result was that
turbine designs would include a level of margin by virtue of these discrete classes. However, it is
becoming increasingly common for modern wind turbines to be designed for S-class or site-specific wind,
which is unique for each wind farm location. This means smaller wind speed, load, and design margins
resulting in turbines operating closer to their ultimate design limits than older models. Accordingly, there
may be less additional design margin to absorb an increase in loads that may occur due to climate change,
requiring designers to better understand the impact of climate change to site-specific loading conditions.
The international design standards provide design guidance for the development of onshore and offshore
wind turbine systems to withstand all reasonably expected loading, including extreme weather events.
Given the potential for climate change to affect the severity and probability of occurrence of extreme
weather, there is a potential for increased damage and/or reduced productive life due to extreme weather
loading. Accordingly, the wind industry continues to research solutions to improve resilience in
extreme weather.
1.2.4 Climate Factors Impacting Offshore Wind Performance
1.2.4.1 Wind: Velocity, Shear, Turbulence, Direction, Geographic Distribution, Temperature, and Moisture
The following sections discuss factors that are common inputs to site assessments, characterizations,
and yield estimates for wind turbines. With climate change, these factors will continue to be important
and may change wind turbine calculations and performance.
Offshore wind site conditions are particularly optimal for wind energy production with less turbulent
and more consistent wind flow conditions and higher overall energy levels than those onshore. As such,
offshore wind farms exhibit great potential to power much of future electrical demand in coastal regions,
particularly those close to highly populated areas with high-electrical demand.
8
1.2.4.2 Wind Velocity (Including Frequency Distribution and Variation)
Wind velocity, which accounts for wind speed and direction, has the most significant impact on
wind turbine performance. Site assessments typically consider annualized mean wind speed, wind
speed frequency distributions, and seasonal as well as diurnal variations in velocity.
As mentioned previously, wind energy density is directly proportional to the cube of wind speed (E = ½
pU3, where E = energy density [W/m2], p = air density [kg/m3], and U = wind speed at hub height [m/s]).
As such, small changes in average wind speed will significantly impact turbine power production (Pryor
and Barthelmie, 2010). If average wind speed increases, there will be more total energy in the wind and
the average operating point for the turbine will shift to the right on the power curve. It is typical for a
turbine to operate in Region 2 for most of its life. In this case, an increase in average wind speed will
shift the operating point to the right on the power curve, climbing up Region 2. The wind turbine will
operate at maximum power output capacity if the shift is sufficient to push the turbine to rated wind
speed and into Region 3. Conversely, decreasing average wind speed may shift the turbine average
operating point out of Region 3 and into Region 2, or, at extremely low-wind speeds, below cut-in
speed, decreasing overall power production.
The “capacity factor” of a wind turbine is a measure of the amount of electricity the turbine produces
over a given period relative to its nameplate power level (American Wind Energy Association). A
turbine’s capacity factor depends on the quality of the wind at a given site in addition to its intended
operating level and design criteria. Capacity factor is important to the overall economics of a wind
turbine and wind farm as the main characterization of a project’s net energy production over a period
of time. For a project to be profitable, the value of the net energy produced must exceed all costs by
an amount equal to or greater than the desired rate of return for the project. Annualization means wind
speed has a direct impact on turbine capacity factor.
Annual Energy Production (AEP) for a turbine or a wind project will be estimated based on knowledge
of meteorological conditions specific to the project site, taking into account typical variances in daily
and seasonal winds. For instance, if average wind speed increases or if high winds become more frequent,
the wind speed may be more likely to exceed a turbine’s designed cut-out speed, necessitating shutdown
(Pryor and Barthelmie, 2010). Prolonged periods of turbine shutdown could result in an overall decline
in AEP. Where climate change has the potential to alter common wind patterns, it is important to consider
how such changes could alter AEP.
9
The frequency distribution of wind speeds is important for planning offshore wind farms because
short-term wind speeds impact power output, extreme wind loading, and fatigue loading of the structural
elements. The frequency distribution of wind speeds is typically approximated by a Weibull Distribution,4
the parameters of which are determined according to wind speed measurements taken during
site assessments.
Wind speed also exhibits variation over longer time periods. Wind farms often experience a diurnal
wind effect, or consistent but different daytime and nighttime wind trends. This effect is accounted for
when planning the development and operation of future wind farms in terms of annual energy production
and expected downtime. The diurnal wind effect also impacts the timing and relationship between energy
production and energy consumption. Wind speeds off New York City show a peak during the late
afternoon and early evening hours (NYSERDA 2010). Seasonal wind variation is also considered in
the planning process. The strongest winds off New York City normally occur during the winter, while
the weakest winds occur during the summer.
1.2.4.3 Wind Direction
The directional distribution of wind is an important consideration when planning a wind project.
Consistency in wind direction is key for optimal turbine power production and longevity as it reduces
overall turbine wear and tear because the wind turbine yaw system—which rotates the turbine hub
horizontally to match the prevailing wind direction—needs to rotate less to track the wind and, as such,
suffers less wear and tear over the life of the project.
Consistent wind direction also allows for a more efficient wind farm layout with turbine placement
optimized for the prevailing wind direction. It likewise allows turbines to be located closer to each
other within wind farms, because wake effects5 can be better predicted and accounted for in the layout
design. Offshore sites often have more consistent winds than onshore sites (DOE EERE, N.d. B). Wind
consistency also has a direct relationship with wind turbine capacity factor.
Site assessments use directional wind plots (wind roses) to indicate the frequency of occurrence and
percentage of total energy from each direction sector. The resulting information is used to support the
site analysis and farm layout design.
10
1.2.4.4 Turbulence Intensity
Turbulence intensity conveys the fluctuations in the wind speed, recorded by instrumentation, in each
recording time interval as a fraction of the average speed (NYSERDA, 2010). Turbulence intensity
can have a negative effect on turbine performance and power production. As air flows over the turbine
blades, the blade shape creates a low-pressure suction that “lifts” the blade and causes the rotor to rotate,
in similar fashion to the way airplane wings lift the airplane for flight. Smooth, or “laminar,” air flow
over the turbine blades is required to properly create this lift for rotation and power production. If air is
“turbulent,” air flow may separate prematurely over the turbine blade and result in a loss of low pressure
and lift, reducing power production and increasing loads due to increased drag on the blade. In general,
smooth air flow is optimal to efficiently extract energy and produce power from the wind.
More frequent or intense events of high-wind turbulence will increase turbulent flow of wind over turbine
blades, diminishing turbine power production.
1.2.4.5 Wind Shear
Changes in wind speed and direction can be described in terms of “wind shear,” a measure that indicates
the amount of change in wind speed or direction over a given distance (Sanchez and Lundquist, 2020).
There are two main types of wind shear that affect wind turbines: vertical and horizontal. Vertical wind
shear is the variation of wind speed with elevation. Horizontal wind shear is a change in wind velocity or
direction as one moves laterally. Vertical shear is influenced by thermal differences within the air column
and by surface roughness interactions near the ground or water level. Horizontal shear is typically most
influenced by weather fronts and is similar between onshore and offshore locations. Vertical wind shear
has a much larger impact on overall wind turbine design than horizontal shear.
11
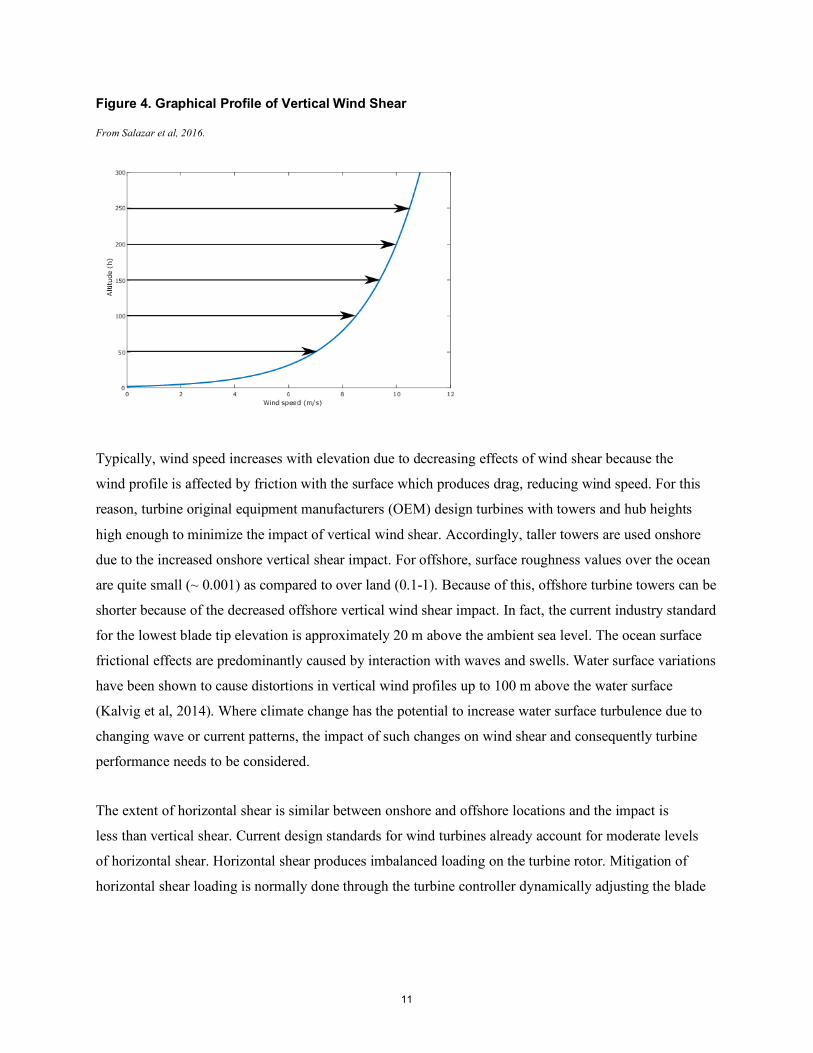
Figure 4. Graphical Profile of Vertical Wind Shear
From Salazar et al, 2016.
Typically, wind speed increases with elevation due to decreasing effects of wind shear because the
wind profile is affected by friction with the surface which produces drag, reducing wind speed. For this
reason, turbine original equipment manufacturers (OEM) design turbines with towers and hub heights
high enough to minimize the impact of vertical wind shear. Accordingly, taller towers are used onshore
due to the increased onshore vertical shear impact. For offshore, surface roughness values over the ocean
are quite small (~ 0.001) as compared to over land (0.1-1). Because of this, offshore turbine towers can be
shorter because of the decreased offshore vertical wind shear impact. In fact, the current industry standard
for the lowest blade tip elevation is approximately 20 m above the ambient sea level. The ocean surface
frictional effects are predominantly caused by interaction with waves and swells. Water surface variations
have been shown to cause distortions in vertical wind profiles up to 100 m above the water surface
(Kalvig et al, 2014). Where climate change has the potential to increase water surface turbulence due to
changing wave or current patterns, the impact of such changes on wind shear and consequently turbine
performance needs to be considered.
The extent of horizontal shear is similar between onshore and offshore locations and the impact is
less than vertical shear. Current design standards for wind turbines already account for moderate levels
of horizontal shear. Horizontal shear produces imbalanced loading on the turbine rotor. Mitigation of
horizontal shear loading is normally done through the turbine controller dynamically adjusting the blade
12
pitch and yaw of the turbine based on real-time information about rotor load imbalances. Turbine design
also includes a prescribed amount of margin in the design limits to account for rotor imbalance loads as
part of the international industry design standards, such as IEC 61400-3.
1.2.4.6 Wind Geographic Distribution
Large scale changes in the geographic distribution of wind could have significant negative impacts
on overall energy production for existing wind farms (Pryor, S. C., and R. J. Barthelmie. 2010).
Energy production will diminish if turbines are designed for wind patterns and speeds divergent from
those actually experienced by the wind turbines. Predictable and consistent wind patterns for a given
geographic area are required to accurately plan for and finance wind farm development, both onshore
and offshore.
1.2.4.7 Air Temperature
As discussed previously, wind energy and, consequently, wind turbine output, is directly proportional
to air density and air density is itself inversely proportional to air temperature. Thus, increases in air
temperature lead to slight declines in air density and wind turbine power output. At mean sea-level
pressure, an increase in air temperature of 5 degrees C would result in a decrease in air density of
1–2% with a similar, marginal change in wind energy (Pryor, S. C., and R. J. Barthelmie. 2010).
1.2.4.8 Air Moisture
Moisture in the air has the potential to impact the functionality of blades and will cause blade leading
edge erosion over time. Where turbine blades are designed for air flow to separate at specific areas of the
blade surface to ensure optimal lift and drag at all locations along the blade span, if air flow is disrupted
such that it separates from the blade prematurely, the resulting flow becomes turbulent. Erosion along the
front of a turbine blade, known as “leading edge erosion” (LEE), is one of the main causes of suboptimal
turbine blade performance (Liersch and Michael, 2014). LEE creates a rough surface along the front
of the blade which causes laminar airflow to detach prematurely and transition to turbulent airflow.
Turbulent airflow reduces lift and increases drag, ultimately reducing turbine power production (Corrigan
and Demiglio, 1985). Recent studies have shown that leading edge erosion is more likely to occur due
to a high volume of small mass impacts (e.g., mist or dirt) than to a low volume of high-mass impacts
13
(i.e., rain or bugs/Eisenberg et al., 2018). While offshore wind blades are designed with sacrificial layers
of coatings to combat the effects of LEE, offshore turbines are nevertheless susceptible to leading edge
erosion due to the wetter environment in which they operate. Operations and maintenance commonly
include efforts to inspect, prevent, and repair leading edge erosion.
1.2.5 Climate Factors Impacting Offshore Wind System Reliability
1.2.5.1 High Winds above Operating Limits
Wind turbines generate rated power at wind speeds in Region 3 (see Figure 3). Turbines are designed
to optimize power production efficiency and to minimize structural damage in this operating region. If,
in a given geographic location, the average wind velocities shift higher or high-wind events become
more frequent, turbines in that location may experience more frequent shutdowns, decreasing overall
power output.
1.2.5.2 Ocean Waves
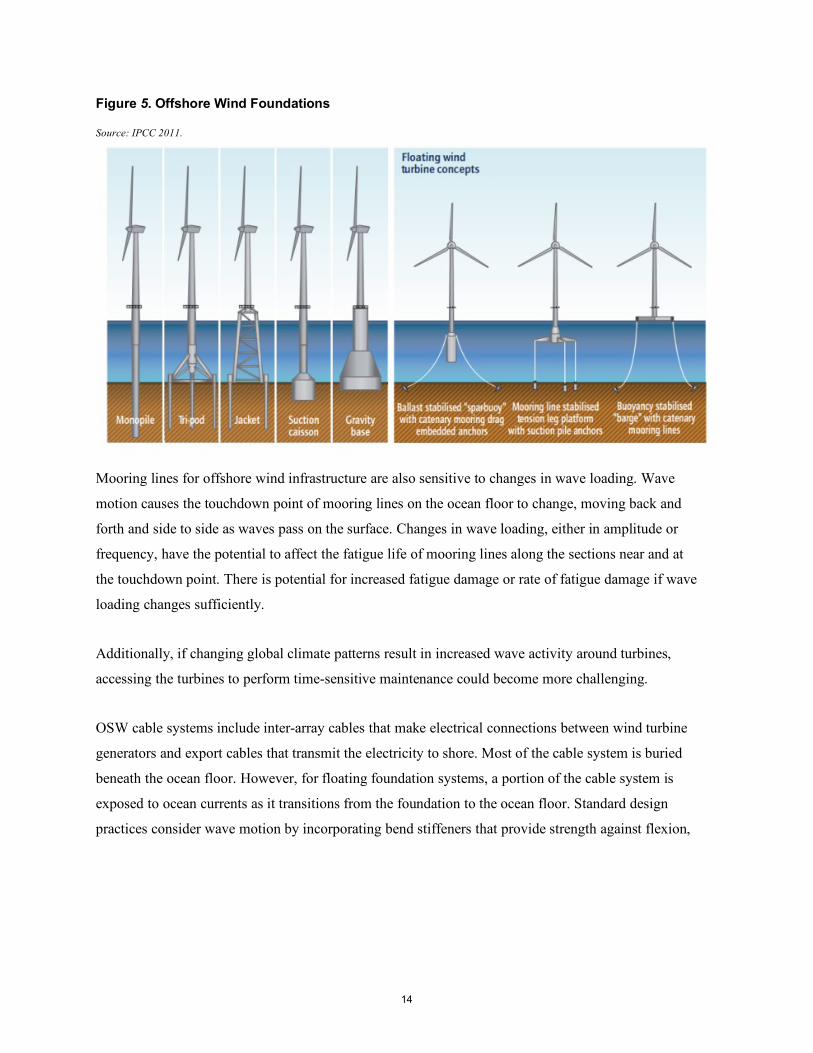
Ocean waves can affect OSW foundations, inter-array and export cables, and cable landings. Figure 5
shows the various types of offshore wind foundations that can be used for turbines, substations, and
converter stations. Ocean waves directly impact and influence foundation and tower loading for both
fixed and floating wind turbine, substation, and convertor station foundations (Kalvig et al., 2014).
Wave loading is accounted for in the design of offshore wind turbines and is combined with ocean
current as well as wind loads. Any increase in wave or current loading needs to be accounted for in
the turbine design to ensure that such loading does not exceed design limits. Severe wave loading
increases may exceed the foundation design load limits and result in turbine tower bottom and/or
foundation damage or failure.
Wave loading frequency can potentially match a tower’s first fundamental modes6 (side-side and
fore-aft). This includes a phenomenon called “ringing,” which occurs when choppy waves strike marine
structures. If these frequencies overlap, a resonance condition can occur where energy is continuously
loaded into those tower modes. In this configuration, waves will cause a sympathetic motion response
in the tower with tower and foundation displacement exceeding design limits.
14
Figure 5. Offshore Wind Foundations
Source: IPCC 2011.
Mooring lines for offshore wind infrastructure are also sensitive to changes in wave loading. Wave
motion causes the touchdown point of mooring lines on the ocean floor to change, moving back and
forth and side to side as waves pass on the surface. Changes in wave loading, either in amplitude or
frequency, have the potential to affect the fatigue life of mooring lines along the sections near and at
the touchdown point. There is potential for increased fatigue damage or rate of fatigue damage if wave
loading changes sufficiently.
Additionally, if changing global climate patterns result in increased wave activity around turbines,
accessing the turbines to perform time-sensitive maintenance could become more challenging.
OSW cable systems include inter-array cables that make electrical connections between wind turbine
generators and export cables that transmit the electricity to shore. Most of the cable system is buried
beneath the ocean floor. However, for floating foundation systems, a portion of the cable system is
exposed to ocean currents as it transitions from the foundation to the ocean floor. Standard design
practices consider wave motion by incorporating bend stiffeners that provide strength against flexion,
15
buoyancy modules that help maintain cable shape and reduce tension loads, and touchdown protection
that reduces the risk of damage where the cable transitions to a buried configuration. However, changes
in wave loading, either in amplitude or frequency, have the potential to affect the fatigue life of these
parts of the cable systems.
Inter-array, export cables, and cable landings can be impacted by waves through scour—erosion that
is caused by the turbulence from waves. Scour can wash away the underlying seabed, exposing buried
cables, allowing ocean currents to move the cables, potentially increasing the amount of stress on
the cables.
1.2.5.3 Precipitation
In general, precipitation tends to improve turbine performance by regularly cleaning the turbine blades.
This cleaning removes bugs and dirt that collect over time and improves blade performance and overall
turbine power production. However, extreme precipitation such as more energetic and/or more frequent
thunderstorms or torrential rainstorms, with a high level of water particles continuously striking the
turbine blades, increases the risk of blade leading edge erosion (Eisenberg et al., 2018). This happens
particularly with offshore turbines operating for frequent, extended periods of time in fog, mist, high
humidity, or rainy conditions. As previously described, leading edge erosion increases blade surface
roughness, which in turn, disrupts the airflow over the blade and causes premature flow separation.
This results in a loss in blade lift and ultimately reduced turbine power production. If precipitation
levels or events become increasingly extreme or frequent, accessing the turbine to perform operations
and maintenance could also become more challenging.
1.2.5.4 Sea Level Rise
Sea level rise is the gradual increase in the static level of the sea as opposed to storm surge which is
abnormal rise in seawater level during a storm. Sea level rise alone may threaten infrastructure and that
threat can be compounded by storm surge. Sea level rise has the potential to impact both fixed foundation
and floating foundation offshore turbines by increasing water damage and corrosion of non-resistant
components. For floating turbines, the impact would be less noticeable and would likely only show up
on mooring line length and tension. The mooring line or tether tension limits for floating turbines may
be exceeded due to the increase in elevation from sea level rise.
16
Sea level rise may also affect the corrosion rate of the offshore turbine foundations. If the sea level is
higher than expected, it may exceed the height of the corrosion-resistant section of the foundation and
come into contact with more sensitive parts of the structure. Sea level rise may also cause higher than
anticipated sea spray onto the underside of foundation top or at the tower base connection which could
also result in unwanted corrosion to these parts.
The offshore wind profile may also be affected by sea level rise and result in increased wear and tear on
turbines. As referenced earlier, water surface variations have been shown to cause distortions in vertical
wind profiles up to 100 m above the water surface (Kalvig et al, 2014). In this way, sea level rise could
distort or change the vertical wind profile and affect the shear loading into the offshore turbine. The shear
loading into the turbine directly affects the wear and tear rate on the pitch and yaw systems. Turbines
dynamically maintain loading balance using Individual Pitch Control (IPC). A change in the shear
loading could cause increased pitch activity and result in faster wear of the pitch bearings.
1.2.5.5 Ice and Frozen Precipitation
Ice and other frozen precipitation can pose risks to turbine health and performance. Ice can build up
on the blades and disrupt the airflow over the blades and cause weight imbalances in the rotor that will
trigger shutoff of an affected turbine, reducing project performance. Sea ice, while less likely to be a risk
off the coast of New York State, can damage foundations and tower bottoms. Hail or sleet, if severe, can
damage blades. If climate change causes a shift to colder weather patterns, there is an increased risk of
damage or under performance due to ice. Shifting weather patterns may cause increased operations and
maintenance (O&M) expense due to the need to retrofit existing turbines to prevent ice buildup.
1.2.5.6 Extreme Storms
Although extreme weather events are accounted for in the international design standards for wind
turbines, such as IEC 61400-1 (onshore) and IEC 61400-3 (offshore), standards do not account for
all possible levels of storms. Extreme storms have damaged turbines, caused failures, and resulted
in decreased output both during events and as a result of extended repair times.
If high-wind speeds increase due to an increase in the intensity and/or frequency of extreme weather
events, such as storm fronts, hurricanes, or typhoons, this may heighten the risk of turbine damage or
failure when they occur (Worsnop et al., 2017; Rose et al., 2012).
17
Extreme weather events are also likely to result in an increase in offshore wave loading. As discussed
above, a change in wave loading may dramatically affect the overall fatigue life of electrical cable
systems for offshore wind systems and mooring lines for floating system designs. Increased wave loading
may also increase the amount of scour (see discussion on ocean waves), which can uncover buried cable
systems. Standard practice includes assessing touchdown points and laydown shapes of all underwater
lines against the expected wave loading.
1.2.6 Onshore Electrical Infrastructure
Onshore electrical infrastructure includes onshore stations which receive the electricity from OSW
export cables and provide connection to the energy grid. The receiving station is typically a transmission
substation with operating voltages of 69 kilovolts (KV) or higher that is part of the larger energy grid and
transfers power from several sources including transmission feeders from other substations, conventional
generation, and renewable generation. These substations may be located near-shore but more often are
located inland. Transmission substations located near-shore may be vulnerable to both sea level rise
and storm surge while transmission substations inland may be vulnerable to inland flooding from heavy
precipitation events, particularly in areas of dense build-up. The vulnerability of transmission substations
is typically part of the operating utility’s considerations of climate change vulnerability across its broad
portfolio of assets rather than the scope of an OSW system design, but nevertheless bears mention.
1.2.7 Coastal Infrastructure and Ports
Due to the size of OSW components, ports are integral in the transport and staging of material used
for construction of OSW systems. Port infrastructure, such as warehouses, wharves, piers, cranes, and
container storage yards, as well as port operations, are potentially vulnerable to several of the climate
factors described above. Such climate factors include sea level rise, heavy precipitation, and storm
surge from coastal storms, and high winds and icing from hurricanes and nor’easters.
Sea level rise allows storm surge to travel further inland, compounding potential water damage to
ports infrastructure. Increased seawater flooding can increase metal corrosion of port equipment.
Higher sea levels also increase the risk that drainage systems could be overwhelmed by heavy
precipitation, leading to surface flooding. Flooding, from either ocean sources or from inland flooding
due to heavy precipitation, can damage shipping containers and their contents, as well as terminal
buildings and other port infrastructure. Flooding can also impact operations by limiting access to
roads and disrupting movement of cargo into and out of the port.
18
Storms can cause damage to marine port services by impairing visibility, disrupting the power and
communications networks, washing away channel buoys, and submerging debris in ship channels.
Channels may require more frequent, and more costly, dredging of debris and silt build-up following
severe storms. Waves can cause structural damage to wharves and piers and as well as vessels and
their cargo.
High wind speeds from storms can also damage port facilities and impact operations. High winds can
damage or destroy piers, wharves, cranes, and berths. Wind can also result in loss of markers, making
navigation channels temporarily inoperable.
1.2.8 Human Stressors
In addition to the climate factors described in earlier sections, there are several human factors that are
relevant to OSW systems and their resilience. Since OSW systems are remotely located and operate
“unmanned,” they require supervisory control and data acquisition (SCADA) systems to allow operators
to receive operating information about the system and to make control adjustments when necessary. This
dependence of OSW on SCADA systems creates a vulnerability to hacking. The remote location of OSW
systems makes it challenging to monitor the individual turbines and associated equipment, making such
systems vulnerable to vandalism and physical attack.
1.2.8.1 Hacking
Researchers from the University of Tulsa have demonstrated the ability to hack wind turbine control
systems after gaining physical access to an individual turbine. They were able to impact the power output
for the turbine they accessed as well as for other turbines in the wind farm. They also simulated actions
that would have been able to damage turbines (Greenberg, 2017). The researchers also built software
tools to demonstrate several concepts. One tool repeatedly engaged the turbine brakes to cause damage;
another tool demonstrated the ability for malware to spread from turbine to turbine, while a third tool
allowed hackers to hide the cyber-attack from plant operators. Researchers also examined the ability to
remotely hack into wind turbine systems. They found that the encryption used between operations centers
and wind farms was effective at limiting a hacker’s ability to remotely access wind turbine controls.
19
This successful attack by researchers required physical access to and breach of a wind turbine’s
structure. The current practice for security measures for wind farms include basic physical protection
such as locks as well as physical intrusion detection and alarm systems. Offshore wind systems have the
added protection of being relatively difficult to access because of their location and the need for ocean
transport to reach them.
A cyberattack on a renewable energy company in Utah resulted in a loss of communication between
the energy provider control center and wind turbine farms, denying operators the ability to control
around 500 megawatts of wind and solar generation, although the attack did not result in the loss of
generation to the grid (Sobczak, 2019). This attack was not aimed at the wind turbines directly but was
a denial-of-service attack,7 which flooded energy providers’ computers with fake traffic, eventually
crashing the devices. Denial-of-service attacks do not only affect energy generation systems but are
an increasing problem across many industries. The federal government as well as private industries
continue to be focused on this issue and continue to develop solutions.
1.2.8.2 Vandalism and Terrorism
Energy infrastructure assets have been the target of terrorist attacks in the past. One notable example
was the 2013 attack on the Pacific Gas & Electric Metcalf substation that damaged 17 transformers
(Behr, 2016). Vandals have also targeted transmission lines by shooting at insulators and even toppling
transmission towers. Transmission substations and transmission lines are targeted because they are
likely to be transfer points for significant amounts of power and are often remotely located and minimally
staffed. Offshore wind farms are also remotely located and minimally staffed. However, even a wind farm
with significant amounts of total generation is composed of individual turbines distributed across a large
area. Since the output of any single turbine is small relative to the farm’s total output, the value of
physically sabotaging any one unit is correspondingly small. In addition, as mentioned previously, the
electrical connections for OSW systems incorporate series and parallel connections to implement a level
of redundancy and allow continued operations despite failures of some components. Coupled with the
challenge in reaching the offshore site and the inability to access the transmission lines which are under
water, offshore wind sites do not appear to be an inviting target for terrorist attack.
20
1.2.9 Project Financing
As the energy industry continues to transition away from fossil fuels, investors are seeing increasing value
in renewable investment opportunities such as offshore wind. Offshore wind investments offer significant
certainty and transparency because much of the deployment is tied to government incentives. In addition,
relative to fossil fuel investments that have risk increases with the continued transition to a low-carbon
economy, the risk profile for OSW decreases as more projects come online and underscore the ability
for OSW to provide carbon free energy. These factors, as well as offshore wind’s value to mitigate the
effects of climate change, support estimates of over $200 billion in investment by 2025 (Lassen and
Evans, 2020).
In addition to considering transition risks,8 the project finance and due diligence processes consider
both chronic and acute physical risks. Chronic physical risks refer to longer-term shifts in climate such
as sea level rise while acute risks are those that are event-driven like extreme storms. Due diligence
relating to chronic physical risks caused by gradual climate shifts focuses on the potential for those risks
to negatively impact the long-term performance of OSW systems. Due diligence for event-driven physical
risks examines the likelihood of extreme weather events that cause damage to infrastructure that either
reduces its lifespan or results in catastrophic failure. Both chronic and acute physical risks have the
potential to affect the financial viability of projects by reducing revenues and increasing expenses
over the lifetime of a project.
The potential impact of climate change on project finances is based on the difference between the actual
future conditions (i.e., annualized mean wind speed, wind direction, sea level, storm frequency) and that
assumed in financial models. Project due diligence considers the potential financial impact on several
areas including revenues, expenditures, asset value, capital, and financing.
Revenues can be impacted by chronic physical risks such as lower than expected annualized wind speed
resulting in lower energy output from OSW facilities. Revenues can also be impacted by acute physical
risks such as storms that result in periods of time during which wind assets are unavailable.
Expenditures can be impacted by chronic physical risks such as greater horizontal wind shear, requiring
more frequent yaw adjustments, which increase maintenance costs, or icing, which could require more
frequent blade maintenance. Acute risks such as storms can require significant expenditures to repair
facilities that have been damaged. Higher expenses related to repair, and normalization of infrastructure
may also increase insurance fees.
21
Once in service, the asset value of OSW infrastructure may be impacted by the potential for chronic and
acute physical risks to shorten asset life and hence increase depreciation rates. The process of accounting
for the potential for climate change to impact OSW projects may increase forecasts for capital expenses,
costs of supplies and materials, and maintenance, all with potential implications to liabilities.
Climate-related physical risks have implications to rates of return and the cost of capital as well as
to long-term debt. Physical risks from climate change may be reflected in higher expected rates of
return from investors and higher costs of capital to developers to account for those risks, making it more
challenging to finance projects. Climate-driven increases in capital and operational expenses may, over
the life of a project, require an increase in debt, particularly if physical climate risks reduce cashflows
or increase expenses. In addition, the ability to raise or refinance debt may be affected by climate-related
physical risks by reducing project valuation which lowers attractiveness, increasing the difficulty in
raising capital.
The perception of climate risk is already reflected in the pressure coming from private equity firms,
banks, and their underwriters. For example, The Network for Greening the Financial System, a group
of central banks and financial supervisors, has expressed concern that financial risks related to climate
change are not fully reflected in the valuation of assets and has called for increased monitoring (NGFS
2019). The uncertainty around climate risk is also echoed in the pricing of offshore wind renewable
energy certificates (ORECs)9 in the form of risk premiums where developers are submitting lower
bids to mirror this uncertainty. The extent to which underwriters and developers will acknowledge
the potential for climate adaptations in OSW design to reduce risk is an evolving area in need of
further evaluation.
22
2 Projected Changes to Climate Factors and Potential Impacts New York State will face challenges from a rapidly changing climate in the years ahead. In response,
NYS is undertaking a range of projects and initiatives to mitigate impacts and increase resiliency to
climate change. The recent landmark CLCPA seeks to mitigate climate change impacts by requiring
NYS to have a net zero carbon economy by 2050, including a portfolio of 70% renewable energy by
2030. Offshore wind represents a critical component to meet these mandates and improve climate
resiliency in the State. To this end, the New York State Energy Research and Development Authority
(NYSERDA) has adopted a strategy to incorporate resilience considerations into planning and programs
to ensure that clean energy investments and infrastructure are protected and resilient against future
climate impacts over the long term.
Climate change has the potential to impact multiple aspects of offshore wind performance, functionality,
and reliability, encompassing both offshore development and coastal infrastructure. Global Climate
Models (GCM) provide numerical representations of the climate system (Hayhoe et al. 2017) and are
the primary tools to understand future climate change. Models are driven by changes in greenhouse gas
concentrations known as Representative Concentration Pathways (RCP), which consider both unabated
and mitigated greenhouse gas emissions through time and in response to different anthropogenic actions
such as business-as-usual emissions as well as social and political pathways to support aggressive global
decarbonization (IPCC, 2013). A standard set of GCMs and RCPs were developed for the most recent
Intergovernmental Panel on Climate Change Assessment (IPCC), which underpin our understanding of
future climate change and corresponding impacts (IPCC, 2013). The information provided in this report
largely draws on this existing body of research.
While offshore wind developments are already designed to withstand many climate hazards including
extreme winds and storm surge, climate change has the potential to stretch design and operational limits.
For example, climate change may exacerbate strong storms and sea level rise, as well as drive changes
in wind patterns and velocity. This section provides an overview of potential changes to climate factors
relevant to offshore wind performance and reliability because of climate change. Ultimately, the overview
aims to strengthen offshore wind developments to provide clean and resilient energy generation in NYS.
23
2.1 Projected Climate Factor Changes
2.1.1 Wind Velocity, Frequency, and Variation
The potential for offshore wind production in the northeastern United States, from the New Jersey coast
to the Gulf of Maine, is among the greatest in the country (e.g., Figure 6). Overall, average windspeeds
in the region range from 8.0 to nearly 10.0 m/s (approximately 18 to 22 mph) [Figure 6]. A range of
processes drive regional wind velocity, frequency, and variation, including the prevailing westerlies,
storm systems, and local sea breeze. A change to any of these drivers produces a corresponding impact
on regional windspeeds and, in turn, offshore wind performance.
Impacts to offshore wind performance from changes in windspeed depends, in part, on the sensitivity
of the wind turbine power curve (Figure 3). Wind turbines are designed to operate optimally under
specific wind conditions and turbines typically have small design margins. This means that small
changes in windspeed can result in reduced power production (Pryor and Barthelmie, 2010).
Looking forward, changes to wind velocity, frequency, and variation due to climate change and
corresponding impacts to offshore wind performance and reliability in the northeastern United States
remain uncertain (McInnes et al., 2011; NYSERDA, 2014a). Despite these unknowns, historical
observations help characterize future change, and new research provides insights into plausible
future conditions.
Variability in global windspeeds has impacted wind power generation in the past. Historical
observations show surface windspeeds declined after the 1970’s, during a period referred to as “global
stilling” (Vautard et al. 2010; Azorin‐Molina et al. 2017). This trend reversed in 2010 over much of
North America, Europe and Asia. Since then, global wind speeds have increased from about 3.1 to 3.3
m/s translating to a 17% increase in potential wind energy for the average wind turbine (Zeng et al. 2019).
At a global scale, natural climate variability such as changing ocean and atmosphere temperatures can
trigger decadal scale windspeed changes as observed in the past (Zeng et al. 2019; Harvey, 2019). While
the recent speed up could persist for several decades, natural variability may also yield future declines
(Zeng et al. 2019).
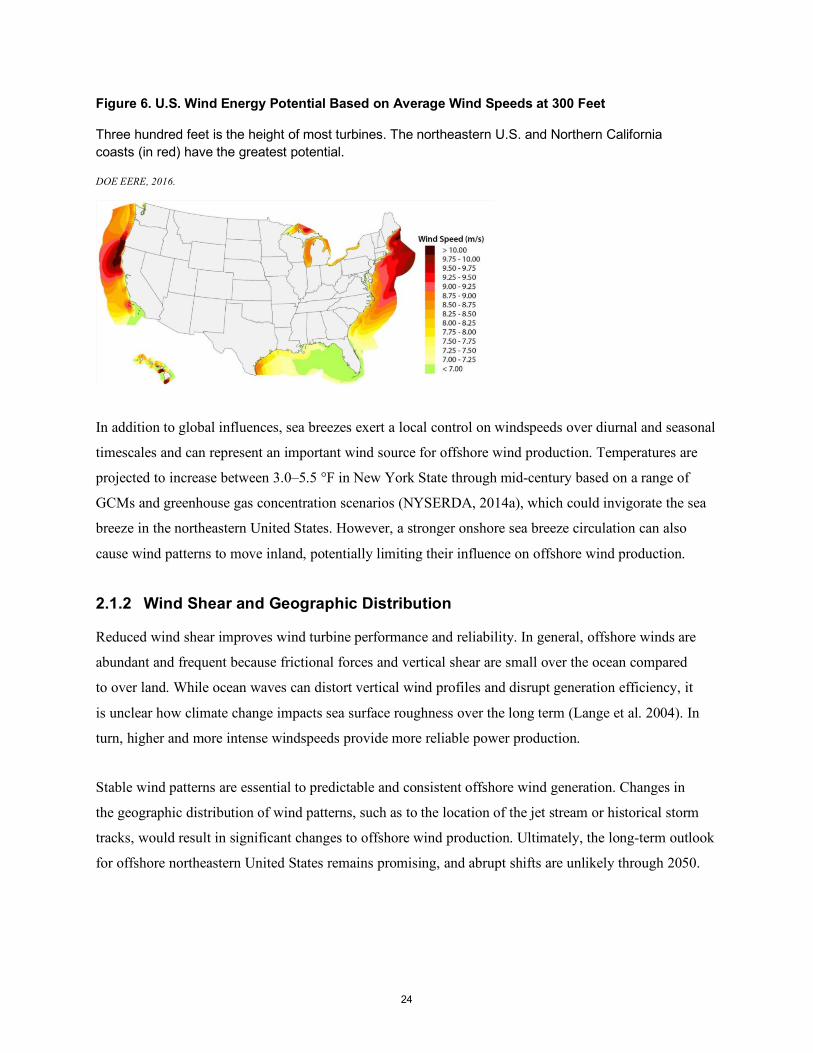
24
Figure 6. U.S. Wind Energy Potential Based on Average Wind Speeds at 300 Feet
Three hundred feet is the height of most turbines. The northeastern U.S. and Northern California coasts (in red) have the greatest potential.
DOE EERE, 2016.
In addition to global influences, sea breezes exert a local control on windspeeds over diurnal and seasonal
timescales and can represent an important wind source for offshore wind production. Temperatures are
projected to increase between 3.0–5.5 °F in New York State through mid-century based on a range of
GCMs and greenhouse gas concentration scenarios (NYSERDA, 2014a), which could invigorate the sea
breeze in the northeastern United States. However, a stronger onshore sea breeze circulation can also
cause wind patterns to move inland, potentially limiting their influence on offshore wind production.
2.1.2 Wind Shear and Geographic Distribution
Reduced wind shear improves wind turbine performance and reliability. In general, offshore winds are
abundant and frequent because frictional forces and vertical shear are small over the ocean compared
to over land. While ocean waves can distort vertical wind profiles and disrupt generation efficiency, it
is unclear how climate change impacts sea surface roughness over the long term (Lange et al. 2004). In
turn, higher and more intense windspeeds provide more reliable power production.
Stable wind patterns are essential to predictable and consistent offshore wind generation. Changes in
the geographic distribution of wind patterns, such as to the location of the jet stream or historical storm
tracks, would result in significant changes to offshore wind production. Ultimately, the long-term outlook
for offshore northeastern United States remains promising, and abrupt shifts are unlikely through 2050.
25
2.1.3 Extreme Weather and Wind Turbulence
Extreme weather presents outsized impact potential to offshore performance and reliability. In
particular, hurricanes and nor’easters drive a range of hazards relevant to offshore wind, including
extreme and turbulent winds, waves, storm surge, and icing. In addition, these storms can also impact
coastal infrastructure, including ports used to support offshore developments and transmission cables.
Elevated windspeeds and wave heights during storms can be particularly detrimental to offshore wind
infrastructure. Strong storms can produce winds causing physical damage, but also above cut-out and
operating limit speeds that curtail production (Pryor and Barthelmie, 2010). Storm-driven winds can be
turbulent and chaotic, which can cause turbines to rotate and yaw beyond design levels, affecting their
functionality or damaging them (Worsnop et al. 2017). Furthermore, wave activity can impact foundation
and tower loads and worsen blade functionality and leading edge erosion (Pryor and Barthelmie, 2010).
The sections below describe potential future changes in the frequency and intensity of these storms
and their associated hazards offshore the northeastern United States through the mid-century.
2.1.4 Hurricanes
Hurricanes are rapidly rotating low-pressure systems that produce extreme winds, waves, precipitation,
and storm surge. Since about 1980, hurricanes in the North Atlantic have increased in intensity, frequency
and duration, potentially in response to warming sea surface temperatures (Walsh et al. 2014). While
storm activity has increased overall, fewer storms have made landfall in recent decades, and prevailing
westerly winds generally steer hurricanes away from the coast as storms approach the northeastern United
States. As a result, locations further from shore are slightly more likely to experience strong storms than
nearshore locations. Regional changes in hurricane intensity and frequency depend on coincident changes
across a range of factors including sea surface temperatures and atmospheric conditions.
In the fall of 2020, Tropical Storm Isaias tracked up the Eastern Seaboard on a path which centered
approximately 100 miles from NYSERDA’s pair of offshore wind floating lidar buoys in the New
York Bight. Launched in September 2019, the buoys have been collecting data from prospective wind
energy development areas, the BOEM Hudson North and Hudson South Call Areas. As Isaias made its
way, wind speeds were tracked to show an average of 50 miles per hour (22.3 m/s), and a maximum of
93 miles per hour (41.5 m/s), well within the Class I design conditions (see Table 1). Where offshore
26
wind turbines are classed to survive maximum gusts of up to 155 miles per hour (70 m/s) gusts for
three-seconds, the in-situ data offers encouraging insights into the relative design standards anticipated
in the region’s eventual construction.10
Looking forward, climate model projections show that warming atmospheric and ocean conditions will
likely increase hurricane intensity, wind turbulence and the frequency of the strongest storms, including
Category 4 and 5 hurricanes, in the North Atlantic relative to historical conditions (Knutson et al. 2013,
IPCC, 2013). At the same time, models project that overall hurricane activity in the North Atlantic will
most likely remain the same or slightly diminish over the coming century (Knutson et al. 2013), although
other research projects marked increases globally (Emanuel, 2013) and more northward trajectories in the
Atlantic (Kossin et al. 2014; Baldini et al. 2016). Projections also show future hurricane tracks could
move offshore at the latitude of New York City, which could result in more direct impacts to offshore
wind developments in the New York Bight and offshore New England (Garner et al. 2017).
Overall, projections suggest that mid-century hurricane frequencies will likely be similar to today, but an
anticipated increase in the number of very strong hurricanes. Stronger hurricanes produce stronger winds,
ocean waves and storm surge detrimental to offshore wind developments and coastal infrastructure.
2.1.5 Nor’easters
Nor’easters differ from hurricanes in that they do not form in the tropics and most commonly occur
between November and April due to the convergence of cold polar air and warm air over the Atlantic
Ocean. These storms often track along the boundary of these air masses and drive a range of hazards
including hurricane-force winds, ocean waves, and storm surge. Nor’easters also produce a range of
precipitation types, including freezing rain and icing, depending on air temperatures at the time of
the storm.
While the future behavior of nor’easters is still largely unknown, some regional climate models provide
insights into the direction and magnitude of future change (Colle et al. 2015). Model simulations reveal
a potential 10% to 40% increase in the frequency of very strong storms and the density of storms along
the Atlantic Coast by end of the century (Colle et al. 2013). These results suggest a possible increase in
extreme winds and ocean waves with the potential to impact OSW.
27
2.1.6 Precipitation
Precipitation is both beneficial and detrimental to offshore wind turbines. Normal rainfall helps clean
turbine blades of dirt and other debris, which can increase turbine performance. In contrast, excessive
or long duration precipitation can increase the risk of leading edge erosion, as described in Section
1.2.5.3. Similarly, ice accretion can disrupt airflow around the turbine and decrease performance.
Climate change is expected to increase heavy precipitation events because a warmer atmosphere
holds more water vapor and drives stronger storms. Climate projections show large increases in the
frequency and magnitude of heavy precipitation in the northeastern United States. For example, the
amount of precipitation than falling during the heaviest events is projected to increase from 20%
to 40% by the late twenty-first century (Hayhoe et al. 2018). Similarly, both hurricanes and nor’easters
are projected to produce more precipitation during the previous century (e.g., Knutson et al., 2013).
Ice and other frozen precipitation can pose a risk to turbine health and performance. Climate model
projections show a decrease in the frequency of frozen precipitation over the twenty-first century
(Zarzycki, 2018), which will likely decrease the impact of icing on offshore wind turbines. However,
projected decreases are smaller for the larger storms, meaning that strong storms in the future may
produce more ice than present-day if atmospheric conditions are cold enough.
2.1.7 Sea Level Rise
Sea level rise is an important planning and design consideration for resilient infrastructure. In particular,
sea levels present potentially outsized impacts to coastal infrastructure through both long-term, chronic
tidal flooding and short-term, acute storm surge events.
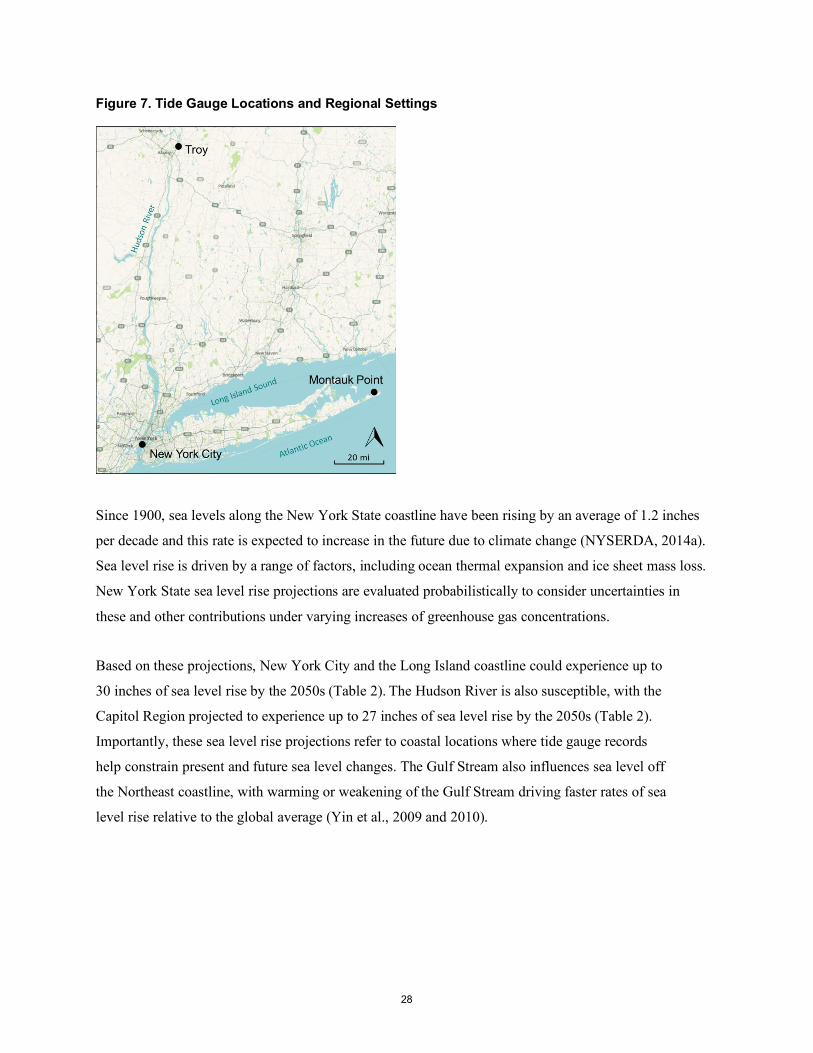
28
Figure 7. Tide Gauge Locations and Regional Settings
Since 1900, sea levels along the New York State coastline have been rising by an average of 1.2 inches
per decade and this rate is expected to increase in the future due to climate change (NYSERDA, 2014a).
Sea level rise is driven by a range of factors, including ocean thermal expansion and ice sheet mass loss.
New York State sea level rise projections are evaluated probabilistically to consider uncertainties in
these and other contributions under varying increases of greenhouse gas concentrations.
Based on these projections, New York City and the Long Island coastline could experience up to
30 inches of sea level rise by the 2050s (Table 2). The Hudson River is also susceptible, with the
Capitol Region projected to experience up to 27 inches of sea level rise by the 2050s (Table 2).
Importantly, these sea level rise projections refer to coastal locations where tide gauge records
help constrain present and future sea level changes. The Gulf Stream also influences sea level off
the Northeast coastline, with warming or weakening of the Gulf Stream driving faster rates of sea
level rise relative to the global average (Yin et al., 2009 and 2010).
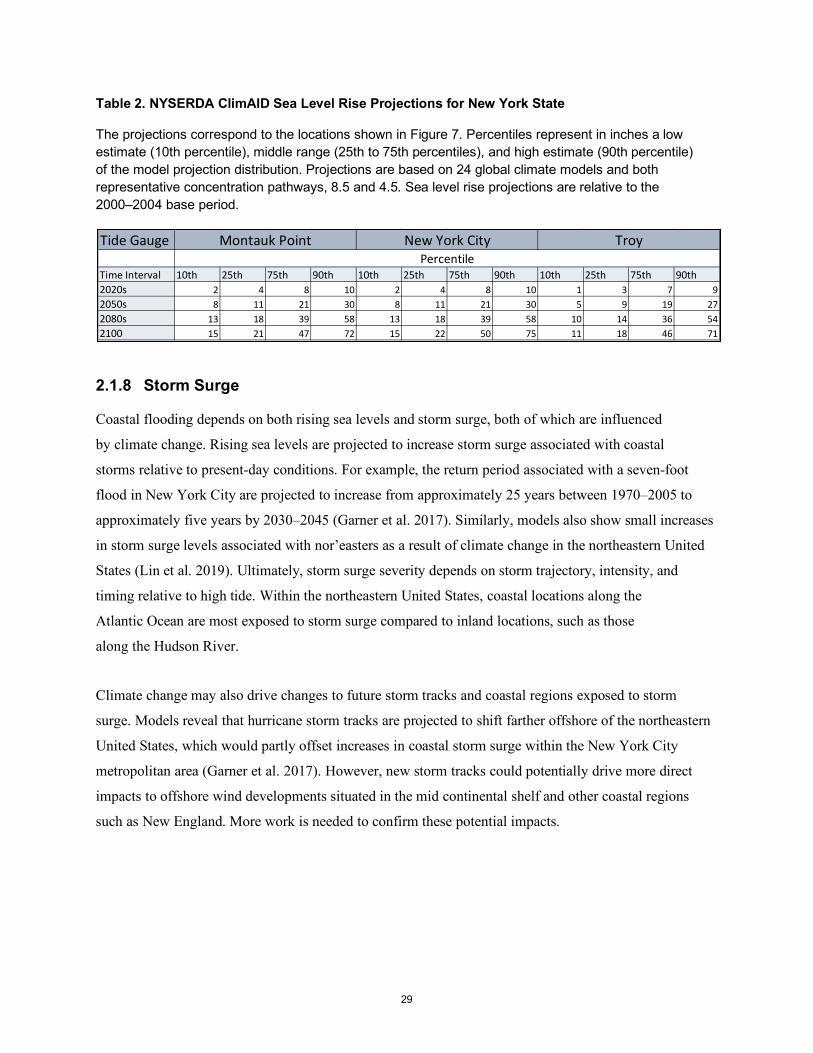
29
Table 2. NYSERDA ClimAID Sea Level Rise Projections for New York State
The projections correspond to the locations shown in Figure 7. Percentiles represent in inches a low estimate (10th percentile), middle range (25th to 75th percentiles), and high estimate (90th percentile) of the model projection distribution. Projections are based on 24 global climate models and both representative concentration pathways, 8.5 and 4.5. Sea level rise projections are relative to the 2000–2004 base period.
2.1.8 Storm Surge
Coastal flooding depends on both rising sea levels and storm surge, both of which are influenced
by climate change. Rising sea levels are projected to increase storm surge associated with coastal
storms relative to present-day conditions. For example, the return period associated with a seven-foot
flood in New York City are projected to increase from approximately 25 years between 1970–2005 to
approximately five years by 2030–2045 (Garner et al. 2017). Similarly, models also show small increases
in storm surge levels associated with nor’easters as a result of climate change in the northeastern United
States (Lin et al. 2019). Ultimately, storm surge severity depends on storm trajectory, intensity, and
timing relative to high tide. Within the northeastern United States, coastal locations along the
Atlantic Ocean are most exposed to storm surge compared to inland locations, such as those
along the Hudson River.
Climate change may also drive changes to future storm tracks and coastal regions exposed to storm
surge. Models reveal that hurricane storm tracks are projected to shift farther offshore of the northeastern
United States, which would partly offset increases in coastal storm surge within the New York City
metropolitan area (Garner et al. 2017). However, new storm tracks could potentially drive more direct
impacts to offshore wind developments situated in the mid continental shelf and other coastal regions
such as New England. More work is needed to confirm these potential impacts.
Tide Gauge
Time Interval 10th 25th 75th 90th 10th 25th 75th 90th 10th 25th 75th 90th2020s 2 4 8 10 2 4 8 10 1 3 7 92050s 8 11 21 30 8 11 21 30 5 9 19 272080s 13 18 39 58 13 18 39 58 10 14 36 542100 15 21 47 72 15 22 50 75 11 18 46 71
Montauk Point New York City TroyPercentile
30
3 Impacts of Climate Change on Wildlife and Communities from Offshore Wind The process for developing OSW projects includes assessing potential impacts on wildlife and
nearby communities. This section reviews how those impacts may be affected by climate change.
Each state that borders the Atlantic Ocean or Pacific Ocean has jurisdiction over submerged lands out
to a distance of three nautical miles offshore.11 Beyond three nautical miles, the jurisdiction to grant
leases, rights-of-way and easements lies with the federal Bureau of Ocean Energy Management (BOEM).
The OSW development process considers the potential impacts on wildlife and communities through the
Environmental Impact Assessment (EIA) process administered by BOEM pursuant to the federal National
Environmental Policy Act (NEPA) process.12
All forms of energy generation have the potential to impact wildlife and communities. However, the
impact on wildlife is far less significant from wind power generation than traditional forms of energy
production, such as those based on fossil fuels (Saidur et al., 2011; Sovacool, 2012). The relatively
low impact of OSW on surrounding wildlife is due to a range of factors, including the fact that wind
power does not require the same level of resource extraction, or promote large-scale ecosystem and
noise pollution as compared to traditional power generation projects (Jarvis, 2005). Additionally, many
of the potential adverse impacts to wildlife, including noise pollution and increased vessel traffic, are
significantly worse during the construction phase of offshore wind development, and will taper off during
operations (BOEM, 2020). Due to the uncertain nature of several likely future changes—such as changes
in biodiversity patterns and future species redistribution—some impacts noted in this review are neither
positive or negative, but rather trends that NYSERDA is aware of, is working with stakeholders—notably
through New York State’s Technical Working Groups—to support active research to better monitor and
understand environmental changes and the intersections with this evolving industry, and will prepare for
to the extent possible.13
Offshore wind also has the potential to influence waves and currents and therefore may in turn affect
how waves and currents impact coastal processes and consequently the shoreline. However, the proposed
locations of New York’s OSW developments, which are far from the coast and not closer than 14 miles
(see Figure A-1) from any New York State coastline, helps ameliorate many of the potential coastal and
community impacts discussed in the sections below and may even offer beneficial uses for wildlife in
addition to the anticipated benefits to humans through this new resource.
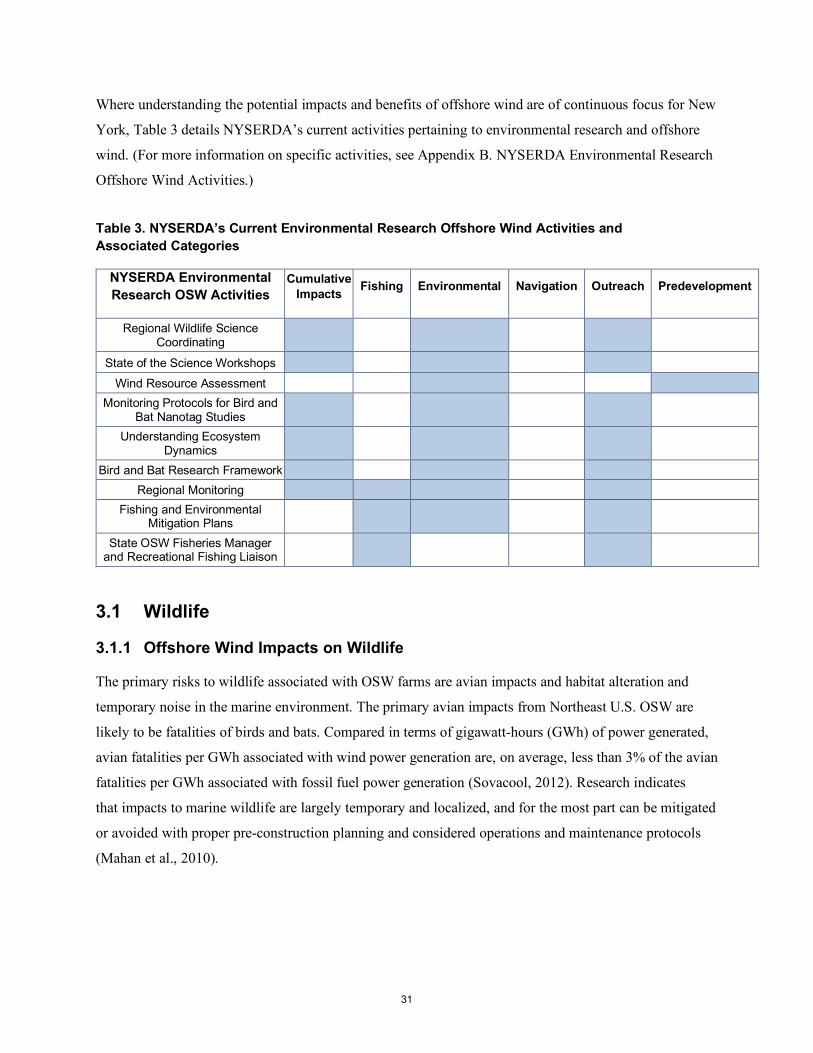
31
Where understanding the potential impacts and benefits of offshore wind are of continuous focus for New
York, Table 3 details NYSERDA’s current activities pertaining to environmental research and offshore
wind. (For more information on specific activities, see Appendix B. NYSERDA Environmental Research
Offshore Wind Activities.)
Table 3. NYSERDA’s Current Environmental Research Offshore Wind Activities and Associated Categories
NYSERDA Environmental Research OSW Activities
Cumulative Impacts Fishing Environmental Navigation Outreach Predevelopment
Regional Wildlife Science Coordinating
State of the Science Workshops Wind Resource Assessment
Monitoring Protocols for Bird and Bat Nanotag Studies
Understanding Ecosystem Dynamics
Bird and Bat Research Framework Regional Monitoring
Fishing and Environmental Mitigation Plans
State OSW Fisheries Manager and Recreational Fishing Liaison
3.1 Wildlife
3.1.1 Offshore Wind Impacts on Wildlife
The primary risks to wildlife associated with OSW farms are avian impacts and habitat alteration and
temporary noise in the marine environment. The primary avian impacts from Northeast U.S. OSW are
likely to be fatalities of birds and bats. Compared in terms of gigawatt-hours (GWh) of power generated,
avian fatalities per GWh associated with wind power generation are, on average, less than 3% of the avian
fatalities per GWh associated with fossil fuel power generation (Sovacool, 2012). Research indicates
that impacts to marine wildlife are largely temporary and localized, and for the most part can be mitigated
or avoided with proper pre-construction planning and considered operations and maintenance protocols
(Mahan et al., 2010).
32
NYSERDA has developed a wind siting and biodiversity evaluation tool14 that may be valuable to
weigh potential impacts to wildlife and communities alongside energy generation capacity at different
OSW sites under consideration (NYSERDA, 2014b). NYSERDA may also draw on regional habitat
information from habitat mapping analyses (e.g., Guida et al., 2017) as part of this effort. Further,
NYSERDA will conduct offshore wind development in compliance with the national and sub-national
regulatory framework governing wildlife and coastal protection (NYSERDA, 2017a). This framework
involves federal laws and regulations, state laws and regulations, and policies by state and regional
councils and commissions (NYSERDA, 2017a; DOE, 2012).
3.1.1.1 Avian Wildlife: Bird and Bat Fatalities
When compared with risks that other forms of energy generation pose to avian wildlife, fatalities
associated with wind turbines are significantly lower than those associated with other energy sources
(Sovacool, 2012). A comparison of fatalities per gigawatt-hour (GWh) of electricity generated found
that wind farms resulted in approximately 0.27 avian fatalities per GWh, compared to 0.6 fatalities
per GWh for nuclear power plants and 9.4 fatalities per GWh for fossil fuel power stations (Sovacool,
2012). At the California Altamont Pass wind farm, for example, where recorded avian mortality rates
appeared high, cost-benefit calculations that also included the benefits to avian populations of reduced
pollution associated with wind generation found the wind farm not only reduced avian mortality but
also benefited human health (Sovacool, 2012).
In general, a greater density of birds and bats around turbine sites is associated with higher mortality
rates. Additional research on bats’ offshore activities and how bats may interact with distant offshore
wind turbines is an area recognized by the offshore wind industry as warranting increased study. A
recent study reviewing existing research found that a variety of migrating and non-migrating bat
species may venture to offshore wind farms and predicted that the phenomenon of bats colliding
with onshore turbines could translate into an offshore phenomenon (Pelletier et al., 2013). However,
in New York State’s anticipated OSW environment, at greater than 14 miles offshore, the density of
birds and bats is low.
33
Both turbine design and siting and climate factors may influence avian risks. Similar turbine height and
elevation of local or migrating species’ flight zones, and turbines’ proximity to regions with high avian
concentration (e.g., migratory routes or along coastlines), are associated with higher fatality rates onshore;
locating turbines more than 14 miles offshore may therefore mitigate fatality risks (FWS, 2018). For
example, higher turbine height is correlated with greater numbers of bat fatalities due to flying patterns
(Barclay et al., 2017).
Climate factors that alter avian activity may also influence rates of avian mortality due to interaction with
OSW turbines. Specifically, warming temperatures may drive higher fatality rates on wind farms. A study
on bat activity on an onshore wind farm in the Mediterranean found avian fatality rates were positively
correlated with temperatures and relative humidity—authors theorized this was due to increased insect
activity driving increased bat activity in warmer temperatures—while fatalities were negatively correlated
with wind speed (Amorim et al., 2012).
Acoustic monitoring of avian calls—in particular, nocturnal flight calls—has been used to study avian
activity with the goal of assessing potential for avian fatalities at a given location, though there are
recognized limitations to this method (NYSERDA, 2012b).
3.1.1.2 Marine Wildlife: Underwater Sound and/or Habitat Alteration
Offshore wind impacts on marine wildlife, such as habitat alteration or displacement, addition of
underwater noise and vibration, and in some cases wildlife mortality, are concerns that NYSERDA
is considering in development of its offshore wind program.
Sounds associated with construction necessary for farm scoping and turbine installation may be
detrimental to marine fish and mammals, and other marine wildlife (Thomsen et al., 2006; Matuschek
and Betke, 2009). Techniques such as wildlife warning signals and “bubble curtains” can be used to
reduce noise levels and increase the distance of wildlife from the noise during the period of construction
(Mahan et al., 2010). Previous studies have also found that marine wildlife migrates away from farm
sites during construction when noise becomes significant, even without warning signals (Leonhard et al.,
2013). The main climate factor that affects how and where sound disperses underwater is water
temperature (NOAA, 2019).
34
Once built, wind farms may alter marine ecosystems and habitats through changes to local ecosystems
and/or development of “artificial reefs,” where underwater turbine structures attract mussels and fish
(ten Brink and Dalton, 2018). These “reefs” may lead to temporary fish aggregation, particularly of reef
fishes. Some studies have found that they do not significantly alter fishing opportunities in the area
(ten Brink and Dalton, 2018; Leonhard et al., 2013), while others have found local habitat and
biodiversity could be improved by the “reefs” (NYSERDA, 2017a).
3.1.1.3 Climate Change and Impacts of Offshore Wind on Wildlife
Climate change can modulate the relationship between OSW turbines and coastal wildlife. In particular,
climate change can cause ocean and atmospheric warming, corresponding changes in species distribution
and ecosystem function, and increased species endangerment and extinction. This section provides
information regarding these potential changes.
Climate change already drives global redistribution of species and alteration of migration patterns due
to changing environmental conditions such as air and water temperature, as well as shifts in ecosystem
function and resource availability (Pecl et al., 2017; Sugden, 2017; Horton et al., 2020; Dupigny-Giroux
et al., 2018). Climate change is also already causing faster endangerment and extinction of species and
is likely to continue to do so at an increasing rate in the future (Román-Palacios and Wiens, 2020).
Together, these climate stressors may intensify caution around risks to wildlife, including those
associated with OSW. Looking forward, the exact location and extent of future species endangerment
and redistribution, and potential associated changes in protection, are not known. The degree to which
these changes will be relevant to energy generation projects including OSW development are site-specific
as well as dependent on environmental and societal shifts.
Additionally, in relatively shallow ocean areas such as the middle continental shelf, changes in water
depth and density, acoustic properties of the sea floor, and wind and wave action due to climate change
may affect sound transmission (Lynch et al., 2018). Given the extent to which shallow water regions
vary, the resulting effect in a specific area will depend on local conditions proximal to wind turbines.
3.2 Community Impacts
The common potential community impacts associated with offshore wind development—particularly
noise and coastal impacts—will be significantly mitigated by the location of the wind farm being more
than 14 miles offshore with visibility limited to clear conditions and representing the equivalent size on
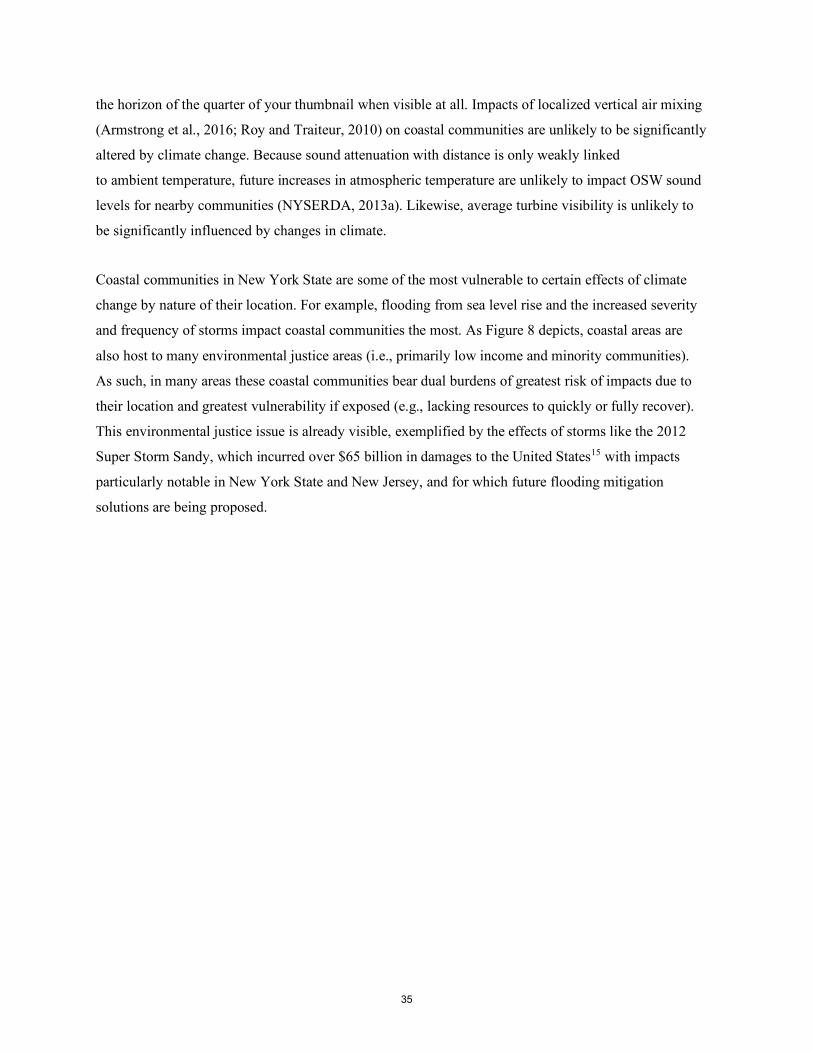
35
the horizon of the quarter of your thumbnail when visible at all. Impacts of localized vertical air mixing
(Armstrong et al., 2016; Roy and Traiteur, 2010) on coastal communities are unlikely to be significantly
altered by climate change. Because sound attenuation with distance is only weakly linked
to ambient temperature, future increases in atmospheric temperature are unlikely to impact OSW sound
levels for nearby communities (NYSERDA, 2013a). Likewise, average turbine visibility is unlikely to
be significantly influenced by changes in climate.
Coastal communities in New York State are some of the most vulnerable to certain effects of climate
change by nature of their location. For example, flooding from sea level rise and the increased severity
and frequency of storms impact coastal communities the most. As Figure 8 depicts, coastal areas are
also host to many environmental justice areas (i.e., primarily low income and minority communities).
As such, in many areas these coastal communities bear dual burdens of greatest risk of impacts due to
their location and greatest vulnerability if exposed (e.g., lacking resources to quickly or fully recover).
This environmental justice issue is already visible, exemplified by the effects of storms like the 2012
Super Storm Sandy, which incurred over $65 billion in damages to the United States15 with impacts
particularly notable in New York State and New Jersey, and for which future flooding mitigation
solutions are being proposed.
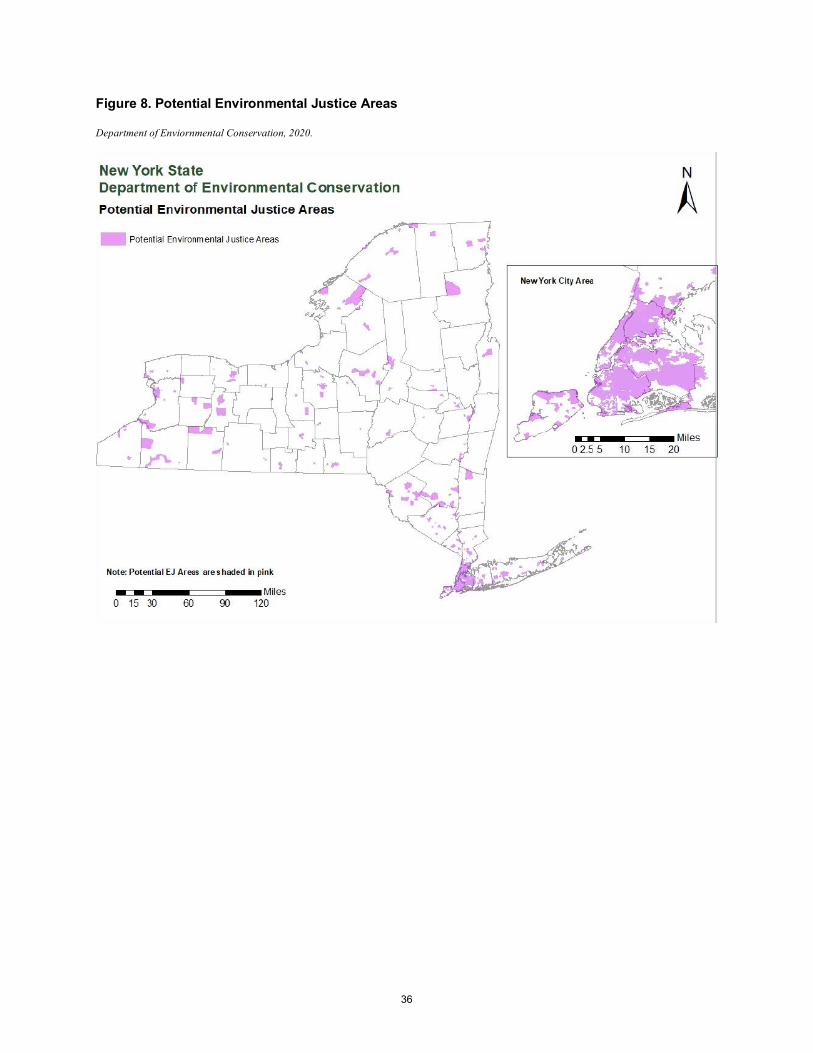
36
Figure 8. Potential Environmental Justice Areas
Department of Enviornmental Conservation, 2020.
37
Figure 9. Map of New York City Flooding from Hurricane Sandy, October 29, 2012
Dotted red lines show proposed future storm barriers.
Federal Emergency Management Agency, National Institute for Coastal & Harbor Infrastructure.
Moreover, many of these communities, notably in the New York City metropolitan area, also experience
higher concentrations of fine particulate matter (PM2.5) and ozone, which can lead to health impacts
including respiratory and cardiovascular disease. These high pollutant levels are estimated to be
associated with more than 2,000 premature deaths, 4,800 emergency department visits for asthma,
and 1,500 hospitalizations (NYSERDA, 2018). Further, most of the emissions from peaker plants
occur during the summer season, when pollution from ozone is already high, and urban heat island
effects compound the risks to health-vulnerable populations.
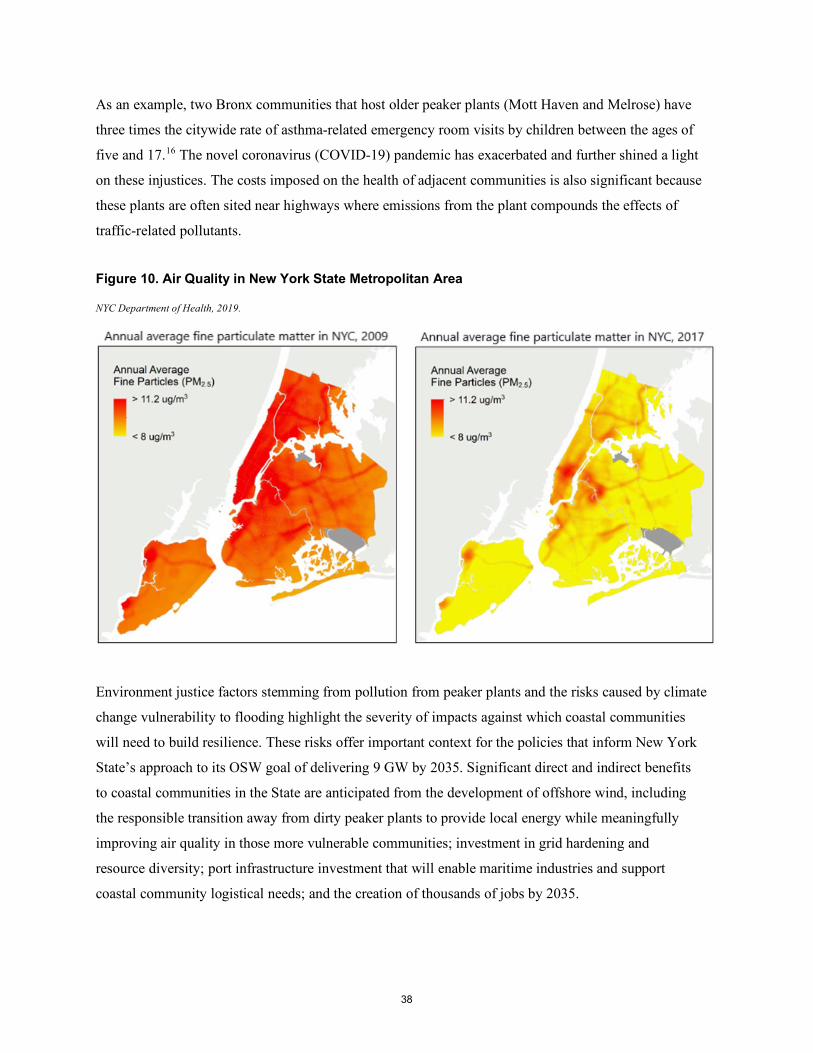
38
As an example, two Bronx communities that host older peaker plants (Mott Haven and Melrose) have
three times the citywide rate of asthma-related emergency room visits by children between the ages of
five and 17.16 The novel coronavirus (COVID-19) pandemic has exacerbated and further shined a light
on these injustices. The costs imposed on the health of adjacent communities is also significant because
these plants are often sited near highways where emissions from the plant compounds the effects of
traffic-related pollutants.
Figure 10. Air Quality in New York State Metropolitan Area
NYC Department of Health, 2019.
Environment justice factors stemming from pollution from peaker plants and the risks caused by climate
change vulnerability to flooding highlight the severity of impacts against which coastal communities
will need to build resilience. These risks offer important context for the policies that inform New York
State’s approach to its OSW goal of delivering 9 GW by 2035. Significant direct and indirect benefits
to coastal communities in the State are anticipated from the development of offshore wind, including
the responsible transition away from dirty peaker plants to provide local energy while meaningfully
improving air quality in those more vulnerable communities; investment in grid hardening and
resource diversity; port infrastructure investment that will enable maritime industries and support
coastal community logistical needs; and the creation of thousands of jobs by 2035.
39
3.2.1 Turbine Sound and Human Perception
Turbine sound affecting coastal communities can be mitigated through a range of factors, such
as compliance with local, federal, and international wind turbine sound limit guidelines, and siting
turbines far from the coast (NYSERDA, 2013a). The distance that turbine sound travels is affected
by a range of turbine-related (e.g., size, condition, and number of turbines) and climate-related
(e.g., wind speed and direction, air temperature, atmospheric conditions) factors (NYSERDA, 2013a).
The significant offshore distance associated with the planned developments likely means their impact
on adjacent coastal communities will be negligible. For example, several studies found that sound levels
were between 20 and 50 dBA17 at distances ranging from 0.30 to 0.40 miles from turbines, which are
similar to levels ranging from a whisper to typical sound levels inside a home (NYSERDA, 2013a).
At 10 miles or greater, turbine sound will be imperceptible to coastal communities.
3.2.2 Coastal Dynamics
Dynamic processes such as tides, waves, and currents influence coastal sediment transport through
longshore drift18 and erosion. OSW developments have the potential to influence waves and currents
and therefore may in turn affect how waves and currents impact coastal processes. An OSW project’s
Environmental Impact Assessment may include modeling of the potential impacts and revisions to design
parameters affecting ocean water transport such as the diameter of monopile foundations (ESTU, 2002).
Construction of different types of turbine foundations—such as monopile, gravity, tripod, and
floating—will have different impacts (ESTU, 2002) that can be considered in the project design phase.
One study investigating turbine foundations in the U.K. validated the ability to model coastal impacts
and did not find significant wave impacts or impacts on sediment transport processes, at large spatial
scales, for projects after completion (Lambkin et al., 2009). Design guidelines and environmental impact
assessments can incorporate the latest understanding of climate change driven changes in waves and
currents into coastal impact models.
With marine transportation offering an increasingly low-carbon alternative for coastal commerce
and logistics, investments in port capital infrastructure that will buttress these facilities against dynamic
coastal processes will not only enable supply chain activities related to offshore wind but also have
the potential to offer benefits to other industries and to service coastal community needs.
40
3.3 Maritime Commerce
3.3.1 Shipping
Wind farms and turbines are typically placed outside of main shipping routes to avoid infrastructure
damages such as transmission or mooring lines being snagged by passing vessels.
Though global shipping routes are projected to see significant changes due to climate change and Arctic
melt, the study team did not identify research linking these changes to the areas of the U.S. East Coast
under consideration for OSW development.
Conversations between government agencies and industry stakeholders on the interaction between
OSW farms and maritime shipping and navigation are currently underway. A 2017 NYSERDA study
on potential shipping and navigation risks to offshore wind farm development identified the primary
concern as proximity to shipping and traffic routes, particularly high-traffic or high-convergence routes
(NYSERDA, 2017b). The U.S. Bureau of Ocean Energy Management (BOEM) and Coast Guard (USCG)
are in discussion around how OSW energy and maritime industries such as fishing and shipping can
coexist well (BOEM, 2018). With this goal in mind, Port Access Route Studies (PARS) such as the
ACPARS and MARIPARS have been developed (e.g., ACPARS, 2015; Coast Guard, 2020); regulations
and guidelines around development and land management are under consideration; and at a recent
workshop, representatives from the responsible agencies as well as industry stakeholders discussed
their respective needs and roles, with the aim of continuing discussion (BOEM, 2018).
3.3.2 Commercial and Recreational Fisheries
Investment in renewable offshore wind energy has the potential to mitigate the release of greenhouse
gas emissions associated with nonrenewable energy sources and, in turn, mitigate species redistribution
caused by climate change (NYSERDA, 2017a).
Under ocean warming conditions associated with climate change, many fish are projected to move away
from their traditional habitats in seeking the same water temperatures they are used to. On the Northeast
coast of the United States, this will translate into fish moving north as Atlantic waters warm (Goldfarb,
2017). There remains uncertainty around exactly when and where different species will move (Pecl et al.,
2017; Sugden, 2017), and as such it is unclear exactly how this redistribution may enhance or stress
fisheries near the potential offshore wind developments.
41
Ocean waters off the northeastern United States are home to a range of fish species and, in turn,
recreational and commercial fisheries (NYSERDA, 2017a). An evaluation of the potential adverse
impacts to fish and fisheries that could be introduced by the development of an offshore wind
farm include (NYSERDA, 2017a) impacts pre-construction, during construction, and during
operation/following construction. Pre-construction, the primary impacts to fish, which may include
seafloor disturbance noise generated by survey equipment, could temporarily hamper local fishing
activities. During construction, impacts such as changes in water turbidity and suspended sediments,
disruption of habitat, and increased noise levels could temporarily displace local fish populations and
hamper local fishing activities. Local fisheries could be restricted during construction due to safety
concerns. Finally, after construction is complete and turbines are in operation, there may be a variety
of direct impacts to fisheries and indirect impacts to fisheries through impacts to fish populations.
Direct impacts to local fishing practices may include increased potential for damage to fishing gear
and vessels through contact; financial risk associated with increased risks to fishing materials, increased
complexity in fishing around the wind farms and increased competition in surrounding areas, and changes
in availability and species of local fish; and navigational challenges. Impacts to fish, which may affect
local fish stocks and fishing practices, may include sensory disturbances, development of new reef-like
habitats in what was previously open water, and shifts in fish availability and inter-species competition.
Offshore wind developments and management are engaging in a range of initiatives to mitigate potential
risks and ensure vital fisheries in the future. For example, NOAA Fisheries is working in conjunction
with BOEM and developers of offshore wind projects to ensure that the needs of marine habitats and
fisheries are involved in project development and partnering with regional and international fisheries
management councils (NOAA Fisheries, 2020).
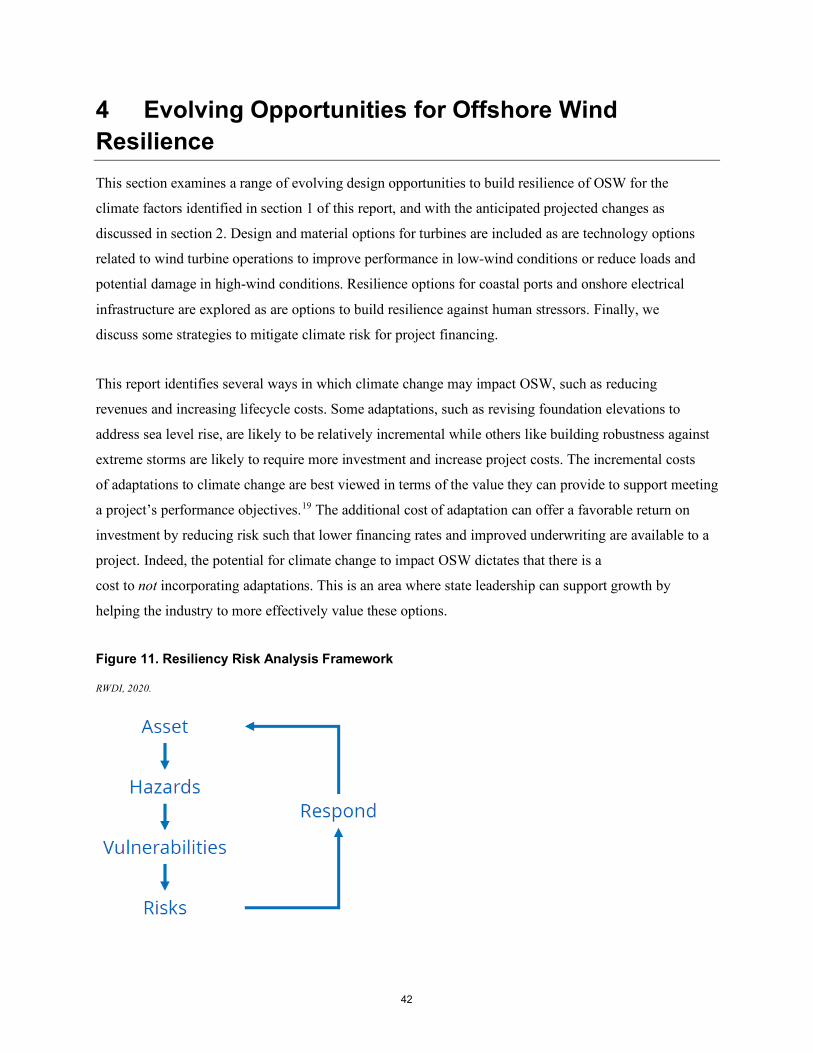
42
4 Evolving Opportunities for Offshore Wind Resilience This section examines a range of evolving design opportunities to build resilience of OSW for the
climate factors identified in section 1 of this report, and with the anticipated projected changes as
discussed in section 2. Design and material options for turbines are included as are technology options
related to wind turbine operations to improve performance in low-wind conditions or reduce loads and
potential damage in high-wind conditions. Resilience options for coastal ports and onshore electrical
infrastructure are explored as are options to build resilience against human stressors. Finally, we
discuss some strategies to mitigate climate risk for project financing.
This report identifies several ways in which climate change may impact OSW, such as reducing
revenues and increasing lifecycle costs. Some adaptations, such as revising foundation elevations to
address sea level rise, are likely to be relatively incremental while others like building robustness against
extreme storms are likely to require more investment and increase project costs. The incremental costs
of adaptations to climate change are best viewed in terms of the value they can provide to support meeting
a project’s performance objectives.19 The additional cost of adaptation can offer a favorable return on
investment by reducing risk such that lower financing rates and improved underwriting are available to a
project. Indeed, the potential for climate change to impact OSW dictates that there is a
cost to not incorporating adaptations. This is an area where state leadership can support growth by
helping the industry to more effectively value these options.
Figure 11. Resiliency Risk Analysis Framework
RWDI, 2020.
43
The approach taken by an offshore wind project and by the State in considering potential resiliency
adaptations should follow a form of recursive risk analysis that considers the detailed context of the
subject and its specific exposure, vulnerabilities, and risks to support an appropriate design response
(Figure 11). Where this study does not prescribe the adoption of any specific adaptations, it initiates a
dialogue with the industry and with stakeholders to promote awareness of resiliency approaches as a first
step to NYSERDA’s strategic focus on resiliency in keeping with NYSERDA's Strategic Plan, Toward a
Clean Energy Future: A Strategic Outlook 2020–2023.
Where the CLCPA squarely recognizes the front-line experience of Disadvantaged Communities in the
fight against climate change, the opportunities for offshore wind resiliency listed in this section should
be furthermore considered as an opportunity to consider how these adaptations can best intersect with the
delivery of benefits including workforce development, training, jobs creation, and economic development
broadly to Disadvantaged Communities, and the critical partnerships to advance such important benefits.
4.1.1 Wind Speed
As discussed in section 2, since 2010 global wind speeds have increased from about 3.1 to 3.3 m/s
translating to a 17% increase in potential wind energy for the average wind turbine (Zeng et al. 2019).
However, while the recent speed up could persist for several decades, natural variability may also yield
future declines (Zeng et al. 2019) and when considering the resiliency of OSW projects, planners should
acknowledge this uncertainty and potential impacts of natural climate variability on future windspeeds.
Recognizing the impact of wind speed on a turbine’s performance is discussed earlier in this report,
several things can be done to mitigate the impact of an increase or decrease of wind speed on overall
turbine power production and performance. In general, a decrease in wind speed results in reduced power
production and increased idle time while an increase in wind speed can result not only in reduced power
production but also in potential component damage or turbine system failure.
A variety of design options are available to mitigate the impact of wind speed on a turbine’s performance.
These lift modification devices use technologies that can be active (i.e., requiring dynamic activation
and/or electrical mechanisms) or passive to either improve performance in low-wind conditions or
reduce loads in high-wind conditions.
44
Passive technologies are used to “design in” changes in turbine performance based on operating
conditions. These technologies, such as vortex generators, gurney flaps, and stall strips, all work
to improve turbine performance in low-wind conditions. The following three images show how
these technologies are deployed on wind turbine blades (Figure 12). Gurney flaps act as chord extenders
on the inboard span of a blade and work to improve the aerodynamic performance of this section of
the blade (Giguère, Lemay and Dumas, 2012; Saenz-Aguirre, 2019; Nikoueeyan et al., 2015). Vortex
generators are installed on the suction side of blades and help to maintain laminar air flow over the
blade, thus improving the aerodynamic performance of the blade (Martinez et al., 2016; Hu et al., 2016),
and particularly to boost power production in low-wind conditions. Vortex generators can improve the
efficiency of turbines and increase annual energy production by 2–3% (Sharpley, 2015). Stall strips are
lift-modifying devices that are typically installed on the leading edge of portions of wind turbine blades
to modify the air flow around the airfoil shape so that stalling effects are adjusted, improving
performance-reducing loads in high-wind conditions (Tee et al., 2017).
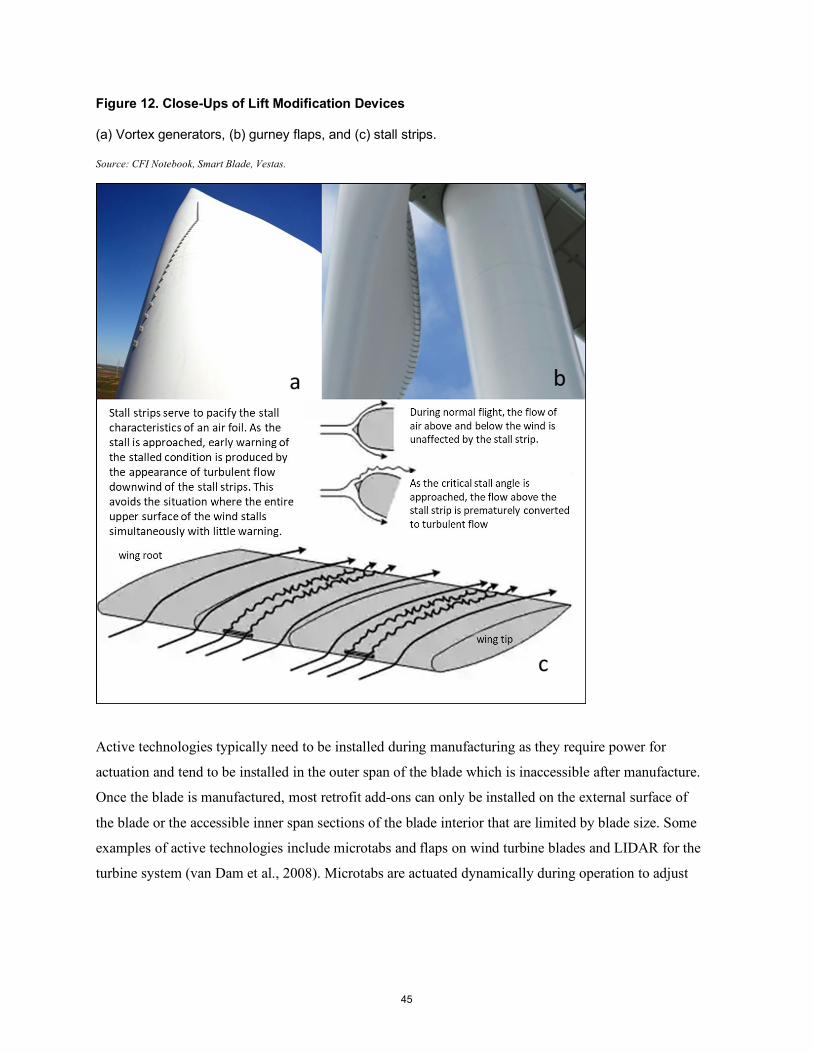
45
Figure 12. Close-Ups of Lift Modification Devices
(a) Vortex generators, (b) gurney flaps, and (c) stall strips.
Source: CFI Notebook, Smart Blade, Vestas.
Active technologies typically need to be installed during manufacturing as they require power for
actuation and tend to be installed in the outer span of the blade which is inaccessible after manufacture.
Once the blade is manufactured, most retrofit add-ons can only be installed on the external surface of
the blade or the accessible inner span sections of the blade interior that are limited by blade size. Some
examples of active technologies include microtabs and flaps on wind turbine blades and LIDAR for the
turbine system (van Dam et al., 2008). Microtabs are actuated dynamically during operation to adjust
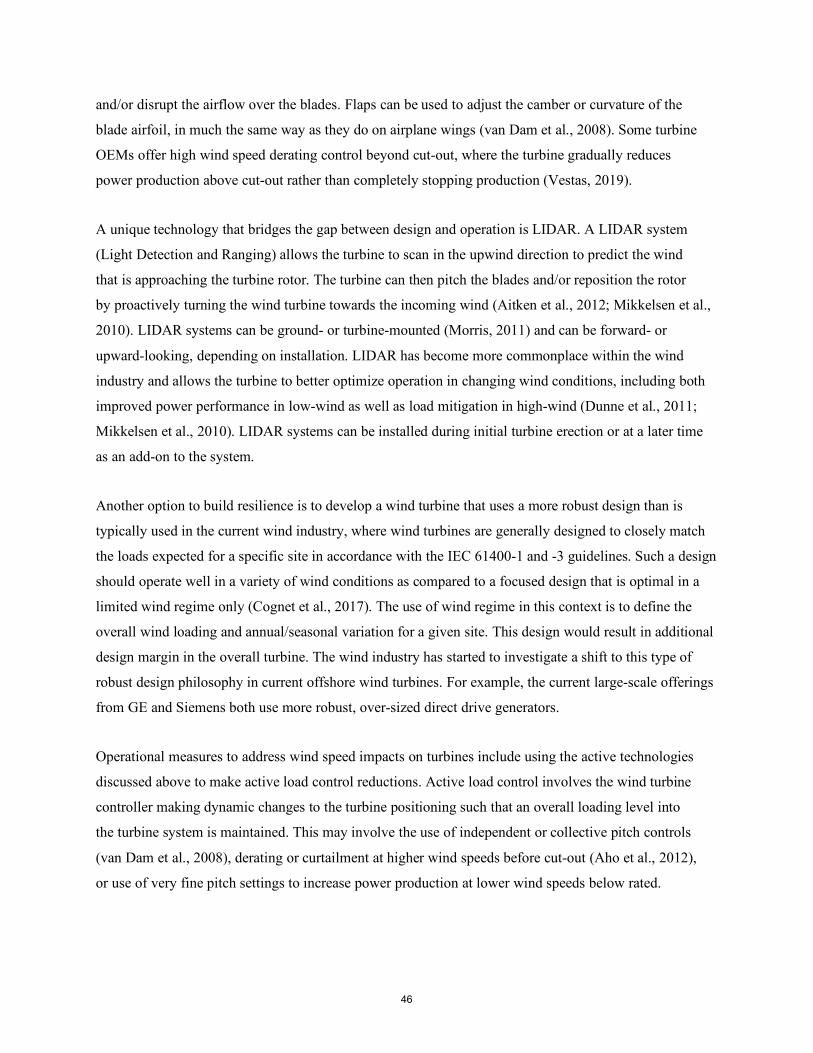
46
and/or disrupt the airflow over the blades. Flaps can be used to adjust the camber or curvature of the
blade airfoil, in much the same way as they do on airplane wings (van Dam et al., 2008). Some turbine
OEMs offer high wind speed derating control beyond cut-out, where the turbine gradually reduces
power production above cut-out rather than completely stopping production (Vestas, 2019).
A unique technology that bridges the gap between design and operation is LIDAR. A LIDAR system
(Light Detection and Ranging) allows the turbine to scan in the upwind direction to predict the wind
that is approaching the turbine rotor. The turbine can then pitch the blades and/or reposition the rotor
by proactively turning the wind turbine towards the incoming wind (Aitken et al., 2012; Mikkelsen et al.,
2010). LIDAR systems can be ground- or turbine-mounted (Morris, 2011) and can be forward- or
upward-looking, depending on installation. LIDAR has become more commonplace within the wind
industry and allows the turbine to better optimize operation in changing wind conditions, including both
improved power performance in low-wind as well as load mitigation in high-wind (Dunne et al., 2011;
Mikkelsen et al., 2010). LIDAR systems can be installed during initial turbine erection or at a later time
as an add-on to the system.
Another option to build resilience is to develop a wind turbine that uses a more robust design than is
typically used in the current wind industry, where wind turbines are generally designed to closely match
the loads expected for a specific site in accordance with the IEC 61400-1 and -3 guidelines. Such a design
should operate well in a variety of wind conditions as compared to a focused design that is optimal in a
limited wind regime only (Cognet et al., 2017). The use of wind regime in this context is to define the
overall wind loading and annual/seasonal variation for a given site. This design would result in additional
design margin in the overall turbine. The wind industry has started to investigate a shift to this type of
robust design philosophy in current offshore wind turbines. For example, the current large-scale offerings
from GE and Siemens both use more robust, over-sized direct drive generators.
Operational measures to address wind speed impacts on turbines include using the active technologies
discussed above to make active load control reductions. Active load control involves the wind turbine
controller making dynamic changes to the turbine positioning such that an overall loading level into
the turbine system is maintained. This may involve the use of independent or collective pitch controls
(van Dam et al., 2008), derating or curtailment at higher wind speeds before cut-out (Aho et al., 2012),
or use of very fine pitch settings to increase power production at lower wind speeds below rated.
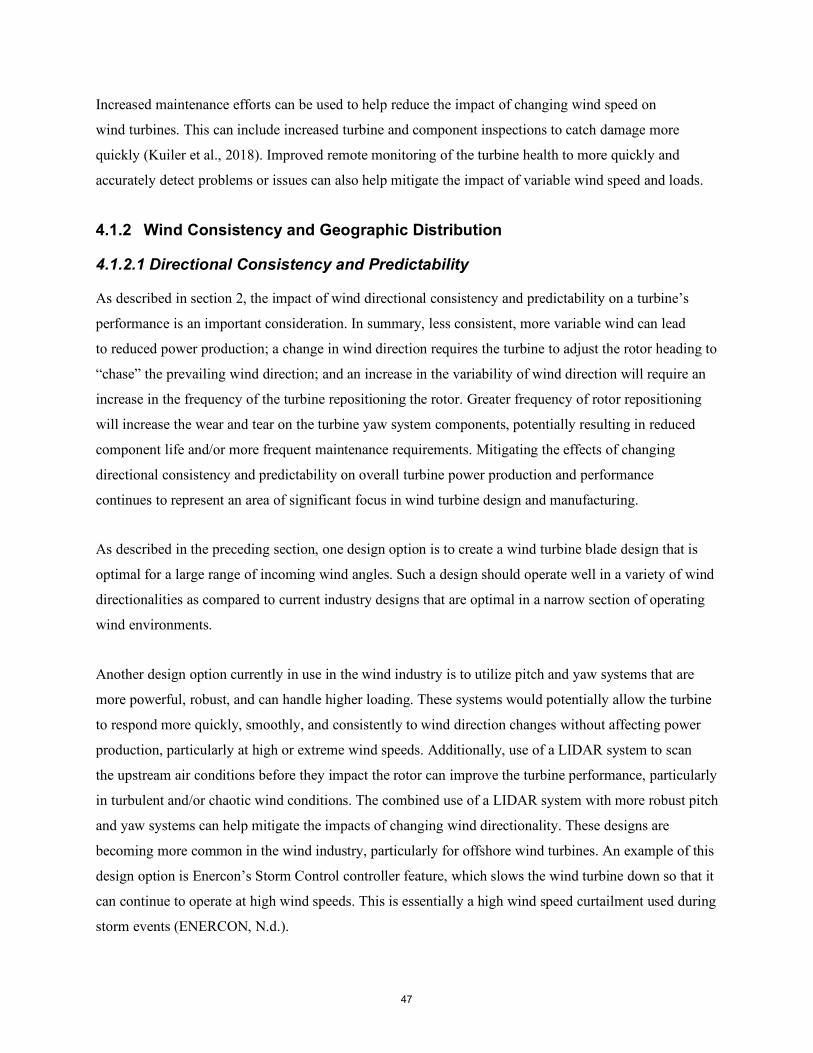
47
Increased maintenance efforts can be used to help reduce the impact of changing wind speed on
wind turbines. This can include increased turbine and component inspections to catch damage more
quickly (Kuiler et al., 2018). Improved remote monitoring of the turbine health to more quickly and
accurately detect problems or issues can also help mitigate the impact of variable wind speed and loads.
4.1.2 Wind Consistency and Geographic Distribution
4.1.2.1 Directional Consistency and Predictability
As described in section 2, the impact of wind directional consistency and predictability on a turbine’s
performance is an important consideration. In summary, less consistent, more variable wind can lead
to reduced power production; a change in wind direction requires the turbine to adjust the rotor heading to
“chase” the prevailing wind direction; and an increase in the variability of wind direction will require an
increase in the frequency of the turbine repositioning the rotor. Greater frequency of rotor repositioning
will increase the wear and tear on the turbine yaw system components, potentially resulting in reduced
component life and/or more frequent maintenance requirements. Mitigating the effects of changing
directional consistency and predictability on overall turbine power production and performance
continues to represent an area of significant focus in wind turbine design and manufacturing.
As described in the preceding section, one design option is to create a wind turbine blade design that is
optimal for a large range of incoming wind angles. Such a design should operate well in a variety of wind
directionalities as compared to current industry designs that are optimal in a narrow section of operating
wind environments.
Another design option currently in use in the wind industry is to utilize pitch and yaw systems that are
more powerful, robust, and can handle higher loading. These systems would potentially allow the turbine
to respond more quickly, smoothly, and consistently to wind direction changes without affecting power
production, particularly at high or extreme wind speeds. Additionally, use of a LIDAR system to scan
the upstream air conditions before they impact the rotor can improve the turbine performance, particularly
in turbulent and/or chaotic wind conditions. The combined use of a LIDAR system with more robust pitch
and yaw systems can help mitigate the impacts of changing wind directionality. These designs are
becoming more common in the wind industry, particularly for offshore wind turbines. An example of this
design option is Enercon’s Storm Control controller feature, which slows the wind turbine down so that it
can continue to operate at high wind speeds. This is essentially a high wind speed curtailment used during
storm events (ENERCON, N.d.).
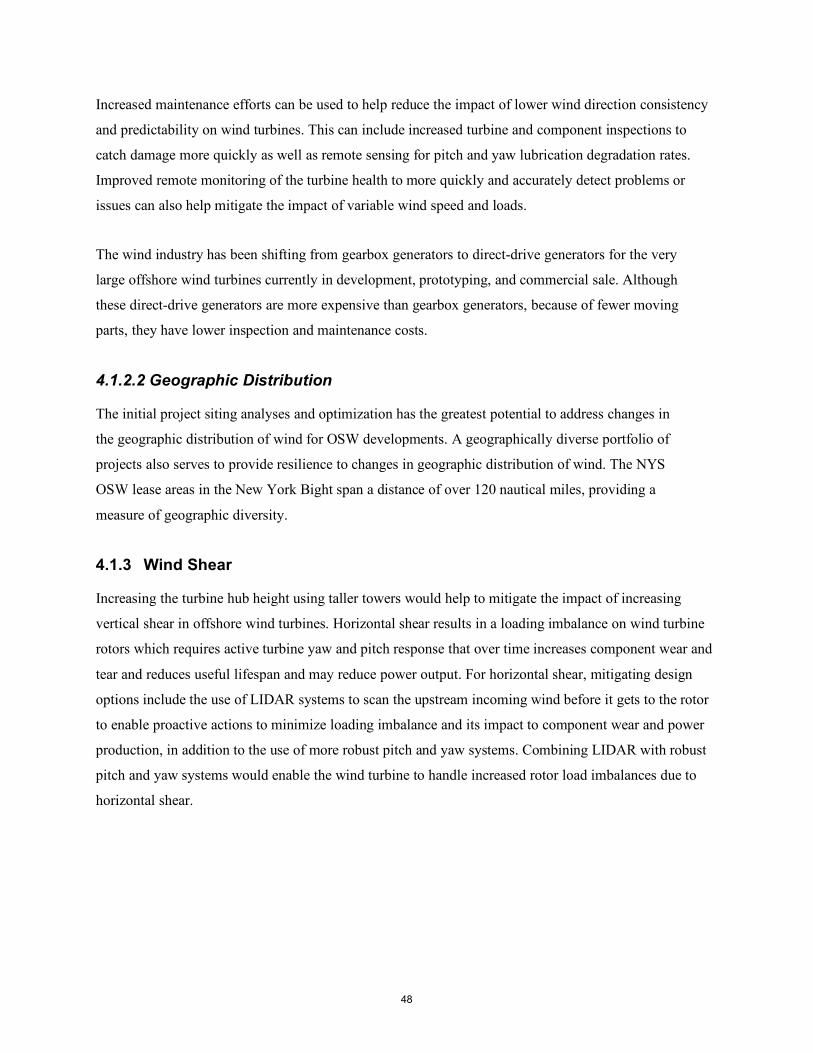
48
Increased maintenance efforts can be used to help reduce the impact of lower wind direction consistency
and predictability on wind turbines. This can include increased turbine and component inspections to
catch damage more quickly as well as remote sensing for pitch and yaw lubrication degradation rates.
Improved remote monitoring of the turbine health to more quickly and accurately detect problems or
issues can also help mitigate the impact of variable wind speed and loads.
The wind industry has been shifting from gearbox generators to direct-drive generators for the very
large offshore wind turbines currently in development, prototyping, and commercial sale. Although
these direct-drive generators are more expensive than gearbox generators, because of fewer moving
parts, they have lower inspection and maintenance costs.
4.1.2.2 Geographic Distribution
The initial project siting analyses and optimization has the greatest potential to address changes in
the geographic distribution of wind for OSW developments. A geographically diverse portfolio of
projects also serves to provide resilience to changes in geographic distribution of wind. The NYS
OSW lease areas in the New York Bight span a distance of over 120 nautical miles, providing a
measure of geographic diversity.
4.1.3 Wind Shear
Increasing the turbine hub height using taller towers would help to mitigate the impact of increasing
vertical shear in offshore wind turbines. Horizontal shear results in a loading imbalance on wind turbine
rotors which requires active turbine yaw and pitch response that over time increases component wear and
tear and reduces useful lifespan and may reduce power output. For horizontal shear, mitigating design
options include the use of LIDAR systems to scan the upstream incoming wind before it gets to the rotor
to enable proactive actions to minimize loading imbalance and its impact to component wear and power
production, in addition to the use of more robust pitch and yaw systems. Combining LIDAR with robust
pitch and yaw systems would enable the wind turbine to handle increased rotor load imbalances due to
horizontal shear.
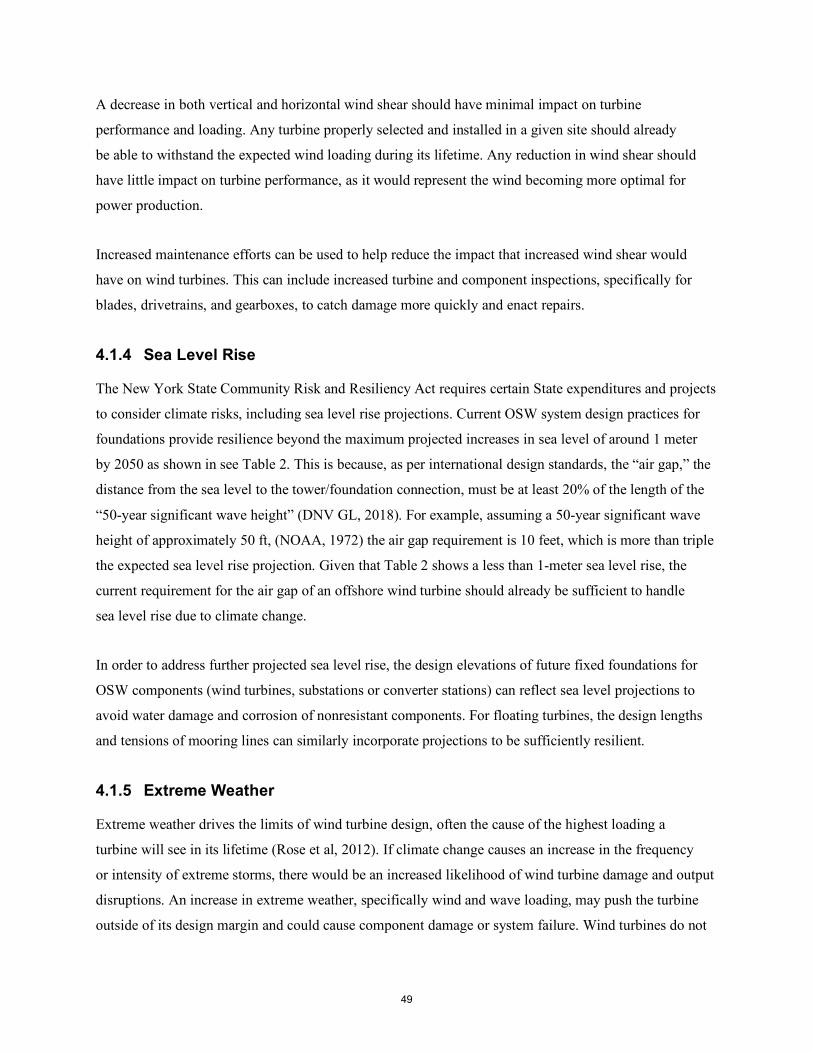
49
A decrease in both vertical and horizontal wind shear should have minimal impact on turbine
performance and loading. Any turbine properly selected and installed in a given site should already
be able to withstand the expected wind loading during its lifetime. Any reduction in wind shear should
have little impact on turbine performance, as it would represent the wind becoming more optimal for
power production.
Increased maintenance efforts can be used to help reduce the impact that increased wind shear would
have on wind turbines. This can include increased turbine and component inspections, specifically for
blades, drivetrains, and gearboxes, to catch damage more quickly and enact repairs.
4.1.4 Sea Level Rise
The New York State Community Risk and Resiliency Act requires certain State expenditures and projects
to consider climate risks, including sea level rise projections. Current OSW system design practices for
foundations provide resilience beyond the maximum projected increases in sea level of around 1 meter
by 2050 as shown in see Table 2. This is because, as per international design standards, the “air gap,” the
distance from the sea level to the tower/foundation connection, must be at least 20% of the length of the
“50-year significant wave height” (DNV GL, 2018). For example, assuming a 50-year significant wave
height of approximately 50 ft, (NOAA, 1972) the air gap requirement is 10 feet, which is more than triple
the expected sea level rise projection. Given that Table 2 shows a less than 1-meter sea level rise, the
current requirement for the air gap of an offshore wind turbine should already be sufficient to handle
sea level rise due to climate change.
In order to address further projected sea level rise, the design elevations of future fixed foundations for
OSW components (wind turbines, substations or converter stations) can reflect sea level projections to
avoid water damage and corrosion of nonresistant components. For floating turbines, the design lengths
and tensions of mooring lines can similarly incorporate projections to be sufficiently resilient.
4.1.5 Extreme Weather
Extreme weather drives the limits of wind turbine design, often the cause of the highest loading a
turbine will see in its lifetime (Rose et al, 2012). If climate change causes an increase in the frequency
or intensity of extreme storms, there would be an increased likelihood of wind turbine damage and output
disruptions. An increase in extreme weather, specifically wind and wave loading, may push the turbine
outside of its design margin and could cause component damage or system failure. Wind turbines do not
50
typically operate during extreme weather events (Worsnop et al., 2017; Rose et al., 2012). Any such
increases need to be accounted for in the turbine and wind farm design phases to ensure the design load
envelope anticipates these needs to the extent practicable (Rose et al., 2012). There are several options
available to improve a turbine’s resiliency to extreme weather and changes in extreme weather.
Design options to improve wind turbine resiliency to increases in extreme weather strength or frequency
can involve improving the robustness of the turbine system. Heavier or stiffer blades can endure higher
extreme loading (NREL, 2016). Stronger or additional pitch and yaw motors allow the wind turbine to
respond and change orientation under extreme weather. Other more radical designs such as split pitch
and two-bladed turbine layouts enable turbines to more efficiently “ride out” extreme weather events
without damage. Split pitch moves the pitching mechanisms out along the blade length, reducing the
load needed to pitch the blades. Two-bladed turbines can orient the blades tip-on into the wind to reduce
loading (Kim et al, 2015). These more radical designs are often designed to withstand hurricane
and/or typhoon loading, sometimes called “typhoon proof” in commercial materials (SME, 2020).
In addition, there are operational adjustments that can be made to improve the resiliency of offshore
wind turbines in extreme weather events. As mentioned before, wind turbines do not typically operate
in extreme weather. The turbine goes into an idle configuration, where blades are feathered into the
wind, the rotor is allowed to slow-roll, as needed, and power is not produced (DOE EERE, N.d. A).
Depending on the type of extreme weather, wind turbines can be programmed to adjust the turbine
orientation to minimize the extreme loading into the turbine system. For most traditional three-bladed
turbine machines, maintaining rotor orientation into the prevailing wind with blades feathered will
maintain the minimum possible loading given the environmental conditions. However, some turbines
designed for extreme offshore weather such as typhoons and hurricanes, can orient their rotors sideways,
edge-on to the wind to reduce overall loading. Other more radical turbine designs, such as down-wind
turbines, allow the rotors to “wind vane” with the wind to find the minimum loading condition. The term
“wind vane” means to allow the wind loading to adjust the yaw orientation of the turbine rotor passively.
This enables down-wind turbines to passively have optimal rotor positioning. All these operational
options enable the turbine system to withstand extreme loading conditions such as extreme weather
without sustaining damage.
51
Maintenance options to improve offshore turbine resiliency consist predominantly of increased and
improved inspections and monitoring. This can include increased turbine and component inspections
to catch damage more quickly as well as remote sensing for pitch and yaw lubrication degradation rates.
Improved remote monitoring of the turbine health to more quickly and accurately detect problems or
issues can also help mitigate the impact of variable wind speed and loads.
4.1.6 Waves
The impact of waves on offshore wind turbines is discussed in previous sections of this report. As with
a reduction in wind, a reduction in waves should have little to no effect on offshore wind turbines. An
increase in wave loading can impact foundation and tower bottom loads in addition to loading into
transmission and structural cabling (Kalvig et al., 2014).
Fixed foundations will be more susceptible to wave loading. Robust design options can be used to
improve offshore turbine resiliency to increases in wave loading. Heavier and more massive foundations,
larger tower bottoms, and larger and/or more numerous foundation bolts can be used to increase the
amount of wave loading a turbine can withstand (Bhattacharya, 2014).
Floating offshore foundations can potentially “ride” the wave amplitude loading better than fixed
alternatives. However, the frequency of the waves may impact the fatigue life of both types of
foundations, depending if the fundamental modes of the foundations are close to the frequency of
wave loading. Also, the structural cabling used to maintain general positioning of the floating turbine
may experience reduced fatigue life if the frequency of waves impacting the turbine system increases.
This potential reduction in fatigue life can be addressed in the design phase of the project. Operations
and maintenance actions have minimal ability to provide resilience; however, increased inspection
frequency and remote monitoring can be used to minimize damage caused by waves.
4.1.7 Precipitation
4.1.7.1 Rain, Water, and Ice
The impact of ice on offshore wind turbines is discussed in previous sections of this report. The following
paragraphs discuss options to improve offshore turbine resiliency to ice.
52
Wind turbine OEMs already offer several optional design additions for blades to address issues with
ice accumulation. These include hydrophobic blade coatings that diminish and/or prevent ice collection
as well as heating systems, both electrical and fluid-driven, to reduce or eliminate ice along the blades.
Typically, these are suggested for use in cold weather climates.
Real-time health monitoring of wind turbines can be used to monitor rotor imbalance as well as power
production. This can be used to determine when there is sufficient ice build-up on the blades to create a
mass imbalance and/or negatively affect power production. When such ice build-up occurs, the turbine
can deice the system by using heaters or pumping hot air or liquid throughout the at-risk components.
Increased maintenance efforts as well as the use of blade heating devices in areas that experience frequent
icing conditions can be used to help reduce the impact that ice has on wind turbines. This can include
increased turbine and component inspections, specifically for blades, to catch damage more quickly and
enact repairs. Remote visual inspections using drones may also help with increased turbine monitoring
and inspection.
4.2 Coastal Infrastructure and Ports
The extent to which port operators consider climate change impacts and adaptation in their
planning varies across the globe. A 2018 survey done by the United Nations Conference on Trade
and Development found that although 70% of ports had emergency response measures in place for
extreme events, 40% of respondents reported not having or planning relevant vulnerability assessments
and the same percentage had not yet carried out any work to identify and evaluate potential adaptation
measures (Asariotis, et al., 2018).
Resilience options for flooding due to sea level rise and storm surge include elevating port infrastructure,
using storm-resilient pier and wharf designs and building sea walls. Natural and nature-based features
(NNBF) (e.g., engineered wetlands, oyster reefs) can often provide flood protection and resilience for
coastal infrastructure while also providing additional benefits such as wildlife habitat and reduced coastal
erosion. Additional options are targeted protection of electrical and mechanical systems within buildings,
such as elevated platforms or waterproof rooms to house critical infrastructure. For flooding due to heavy
precipitation, drainage systems can be installed where needed and existing systems can be
53
expanded to accommodate the expected increase in water flow. Paved areas such as parking lots
can be designed with porous surface technologies that can absorb water and reduce flooding. Green
infrastructure can help minimize industrial runoff by collecting and managing rainwater and preventing
it from entering local sewer systems. This supports local water quality and reduces the burden on
combined sewer systems which is important for workforce and community resilience. Operational
measures include clearly defined protocols for moving materials out of harm’s way or temporarily
offsite when storms are anticipated. Maintenance actions may include more frequent dredging of
channels to keep them clear of debris and silt build-up following severe storms.20
Because of the significant land area occupied by ports, they provide an opportunity to help reduce
the urban heat island effect.21 Strategies for mitigating urban heat islands include increasing tree and
vegetation cover, green roofs, cool (mainly reflective) roofs and cool pavements. Tree and vegetation
cover lowers both surface and air temperatures by providing shade. Green roofs include a vegetative layer
to reduce roof temperatures which reduces nearby surface temperatures. Cool roofs are made of materials
or coatings that reflect sunlight and heat away from buildings. Cool pavements use materials that remain
cooler than conventional pavements by reflecting more solar energy and enhancing water evaporation.
For high-wind events, the initial design of permanent structures such as piers, berths, and buildings
can include consideration of high winds. Existing structures, to a practical extent, can be upgraded to
withstand the expected winds over the life of the infrastructure. Operational measures such as lowering
and securing cranes and other equipment may also be used to reduce risk during high-wind events.
Ports have the potential to impact air pollution and greenhouse gases (GHG) in the areas in which they
are located. The U.S. Environmental Protection Agency (EPA) has developed a Ports Initiative22 to
reduce air pollution and GHGs, to achieve environmental sustainability for ports, and improve air quality
for near-port communities. The initiative addresses emissions from major sources including ocean going
vessels, harbor craft, rail, cargo handling equipment and regional trucking. Emissions reduction strategies
include fuel economy improvements, low sulfur as well as hydrogen fuels, electrification, and emission
control technologies.
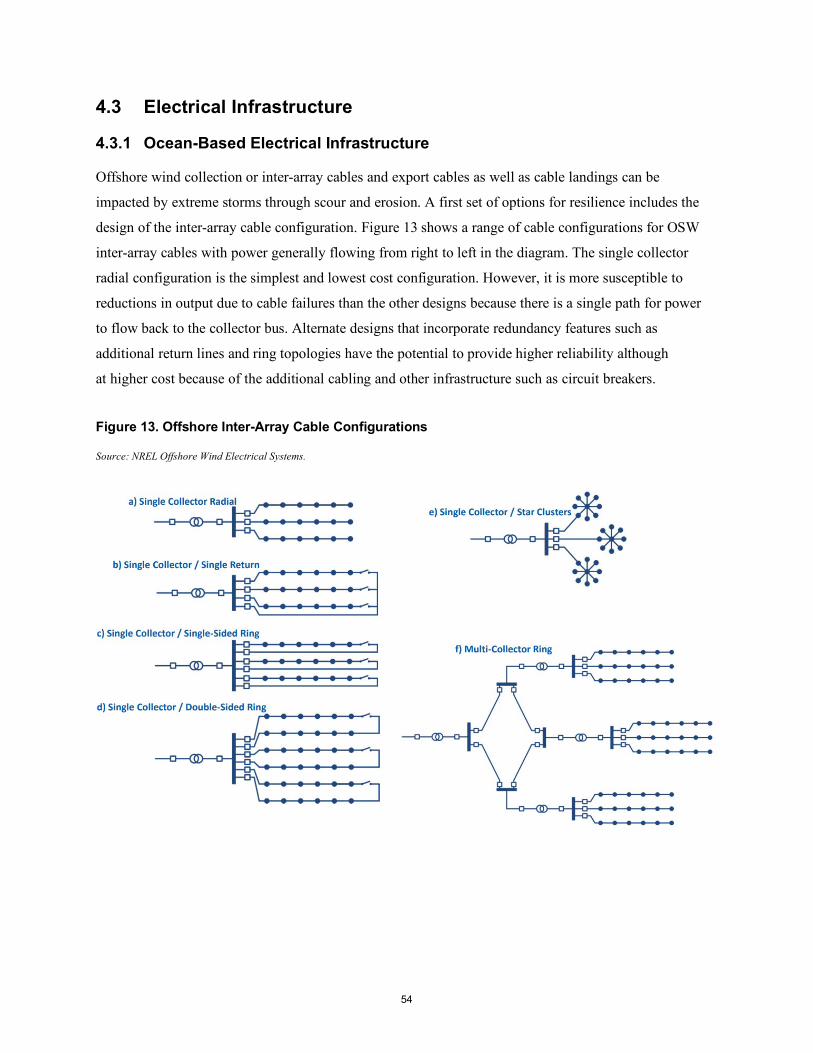
54
4.3 Electrical Infrastructure
4.3.1 Ocean-Based Electrical Infrastructure
Offshore wind collection or inter-array cables and export cables as well as cable landings can be
impacted by extreme storms through scour and erosion. A first set of options for resilience includes the
design of the inter-array cable configuration. Figure 13 shows a range of cable configurations for OSW
inter-array cables with power generally flowing from right to left in the diagram. The single collector
radial configuration is the simplest and lowest cost configuration. However, it is more susceptible to
reductions in output due to cable failures than the other designs because there is a single path for power
to flow back to the collector bus. Alternate designs that incorporate redundancy features such as
additional return lines and ring topologies have the potential to provide higher reliability although
at higher cost because of the additional cabling and other infrastructure such as circuit breakers.
Figure 13. Offshore Inter-Array Cable Configurations
Source: NREL Offshore Wind Electrical Systems.
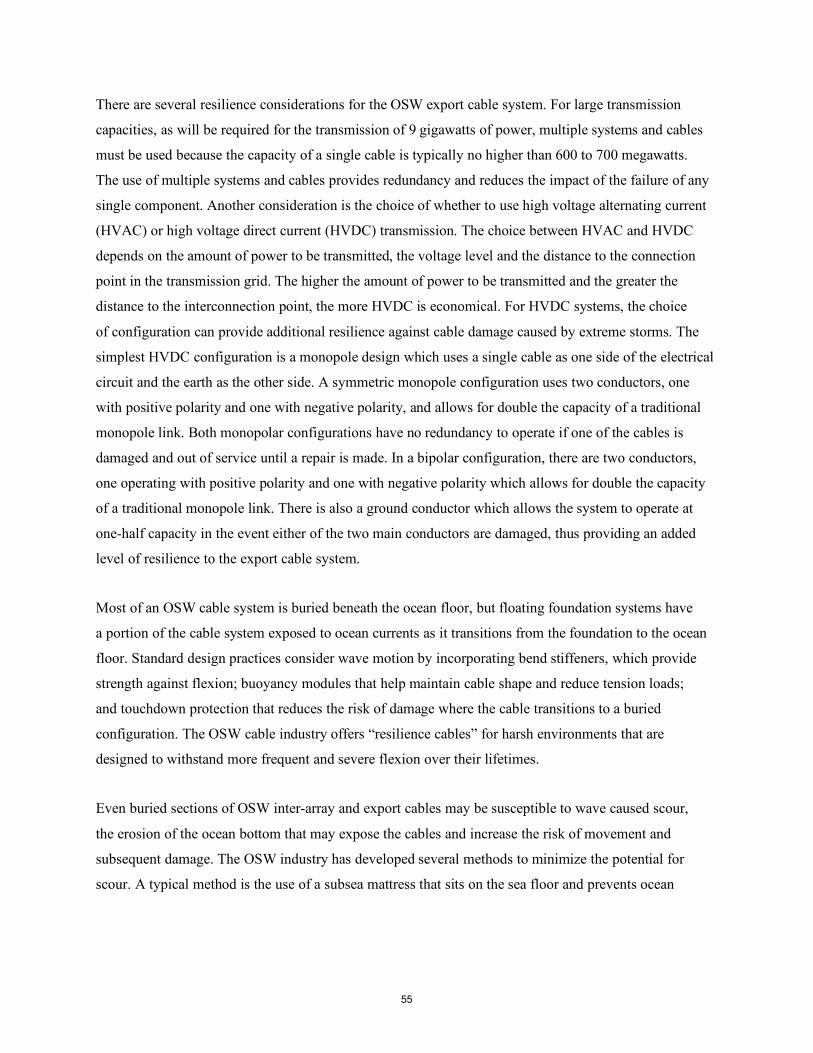
55
There are several resilience considerations for the OSW export cable system. For large transmission
capacities, as will be required for the transmission of 9 gigawatts of power, multiple systems and cables
must be used because the capacity of a single cable is typically no higher than 600 to 700 megawatts.
The use of multiple systems and cables provides redundancy and reduces the impact of the failure of any
single component. Another consideration is the choice of whether to use high voltage alternating current
(HVAC) or high voltage direct current (HVDC) transmission. The choice between HVAC and HVDC
depends on the amount of power to be transmitted, the voltage level and the distance to the connection
point in the transmission grid. The higher the amount of power to be transmitted and the greater the
distance to the interconnection point, the more HVDC is economical. For HVDC systems, the choice
of configuration can provide additional resilience against cable damage caused by extreme storms. The
simplest HVDC configuration is a monopole design which uses a single cable as one side of the electrical
circuit and the earth as the other side. A symmetric monopole configuration uses two conductors, one
with positive polarity and one with negative polarity, and allows for double the capacity of a traditional
monopole link. Both monopolar configurations have no redundancy to operate if one of the cables is
damaged and out of service until a repair is made. In a bipolar configuration, there are two conductors,
one operating with positive polarity and one with negative polarity which allows for double the capacity
of a traditional monopole link. There is also a ground conductor which allows the system to operate at
one-half capacity in the event either of the two main conductors are damaged, thus providing an added
level of resilience to the export cable system.
Most of an OSW cable system is buried beneath the ocean floor, but floating foundation systems have
a portion of the cable system exposed to ocean currents as it transitions from the foundation to the ocean
floor. Standard design practices consider wave motion by incorporating bend stiffeners, which provide
strength against flexion; buoyancy modules that help maintain cable shape and reduce tension loads;
and touchdown protection that reduces the risk of damage where the cable transitions to a buried
configuration. The OSW cable industry offers “resilience cables” for harsh environments that are
designed to withstand more frequent and severe flexion over their lifetimes.
Even buried sections of OSW inter-array and export cables may be susceptible to wave caused scour,
the erosion of the ocean bottom that may expose the cables and increase the risk of movement and
subsequent damage. The OSW industry has developed several methods to minimize the potential for
scour. A typical method is the use of a subsea mattress that sits on the sea floor and prevents ocean
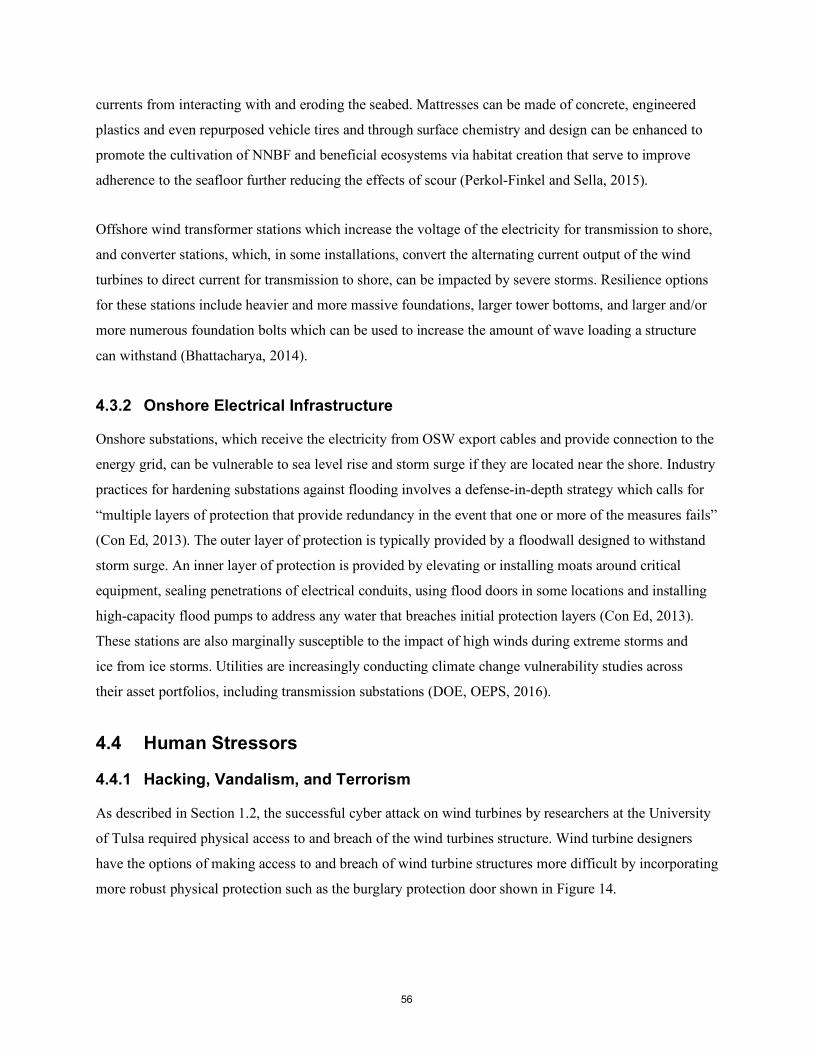
56
currents from interacting with and eroding the seabed. Mattresses can be made of concrete, engineered
plastics and even repurposed vehicle tires and through surface chemistry and design can be enhanced to
promote the cultivation of NNBF and beneficial ecosystems via habitat creation that serve to improve
adherence to the seafloor further reducing the effects of scour (Perkol-Finkel and Sella, 2015).
Offshore wind transformer stations which increase the voltage of the electricity for transmission to shore,
and converter stations, which, in some installations, convert the alternating current output of the wind
turbines to direct current for transmission to shore, can be impacted by severe storms. Resilience options
for these stations include heavier and more massive foundations, larger tower bottoms, and larger and/or
more numerous foundation bolts which can be used to increase the amount of wave loading a structure
can withstand (Bhattacharya, 2014).
4.3.2 Onshore Electrical Infrastructure
Onshore substations, which receive the electricity from OSW export cables and provide connection to the
energy grid, can be vulnerable to sea level rise and storm surge if they are located near the shore. Industry
practices for hardening substations against flooding involves a defense-in-depth strategy which calls for
“multiple layers of protection that provide redundancy in the event that one or more of the measures fails”
(Con Ed, 2013). The outer layer of protection is typically provided by a floodwall designed to withstand
storm surge. An inner layer of protection is provided by elevating or installing moats around critical
equipment, sealing penetrations of electrical conduits, using flood doors in some locations and installing
high-capacity flood pumps to address any water that breaches initial protection layers (Con Ed, 2013).
These stations are also marginally susceptible to the impact of high winds during extreme storms and
ice from ice storms. Utilities are increasingly conducting climate change vulnerability studies across
their asset portfolios, including transmission substations (DOE, OEPS, 2016).
4.4 Human Stressors
4.4.1 Hacking, Vandalism, and Terrorism
As described in Section 1.2, the successful cyber attack on wind turbines by researchers at the University
of Tulsa required physical access to and breach of the wind turbines structure. Wind turbine designers
have the options of making access to and breach of wind turbine structures more difficult by incorporating
more robust physical protection such as the burglary protection door shown in Figure 14.
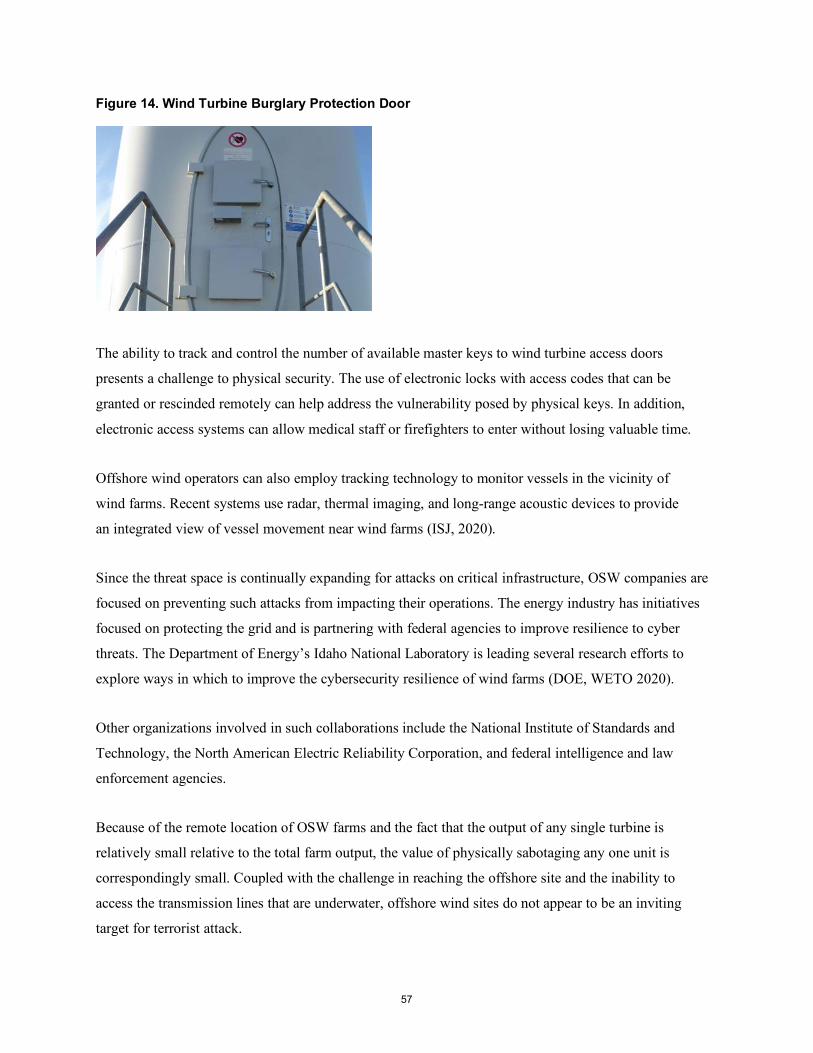
57
Figure 14. Wind Turbine Burglary Protection Door
The ability to track and control the number of available master keys to wind turbine access doors
presents a challenge to physical security. The use of electronic locks with access codes that can be
granted or rescinded remotely can help address the vulnerability posed by physical keys. In addition,
electronic access systems can allow medical staff or firefighters to enter without losing valuable time.
Offshore wind operators can also employ tracking technology to monitor vessels in the vicinity of
wind farms. Recent systems use radar, thermal imaging, and long-range acoustic devices to provide
an integrated view of vessel movement near wind farms (ISJ, 2020).
Since the threat space is continually expanding for attacks on critical infrastructure, OSW companies are
focused on preventing such attacks from impacting their operations. The energy industry has initiatives
focused on protecting the grid and is partnering with federal agencies to improve resilience to cyber
threats. The Department of Energy’s Idaho National Laboratory is leading several research efforts to
explore ways in which to improve the cybersecurity resilience of wind farms (DOE, WETO 2020).
Other organizations involved in such collaborations include the National Institute of Standards and
Technology, the North American Electric Reliability Corporation, and federal intelligence and law
enforcement agencies.
Because of the remote location of OSW farms and the fact that the output of any single turbine is
relatively small relative to the total farm output, the value of physically sabotaging any one unit is
correspondingly small. Coupled with the challenge in reaching the offshore site and the inability to
access the transmission lines that are underwater, offshore wind sites do not appear to be an inviting
target for terrorist attack.
58
4.5 Project Financing
Investors are broadening the scope of due diligence processes to include climate risk by identifying
the potential for chronic and acute physical climate risk to impact project revenues, expenditures, assets,
capital, and financing. The financial industry is increasingly recognizing and working to understand and
value climate risk to investments. Climate risk may be reflected in higher expected rates of return from
investors and higher costs of capital to developers to account for those risks, making it more challenging
to finance projects. The ability to raise or refinance debt may be affected by climate-related physical risks
by reducing project valuation which lowers attractiveness, increasing the difficulty in raising capital. This
report has outlined a range of options to help reduce climate risk to OSW projects in order to make them
more attractive to investors and lower the cost of capital to developers.
Two primary elements support reducing OSW project risk: understanding projected changes to
climate factors for the region in which the project is located and evaluating the adaptation options to
address projected climate risk. Section 2 of this report provides an overview of potential changes to
climate factors relevant to offshore wind for the Northeast. Updating the view of these changes as new
information and projections become available will support understanding the risk profile for OSW.
The options to build resilience to climate change, covered in this section of the report, demonstrate the
range of levers available to reduce the risk to both performance and reliability of OSW. Systematically,
evaluating the relative benefits of these resilience options and selecting those options that are suitable,
as an early part of the project planning process, will help reduce project climate risk and provide more
favorable project finance options.
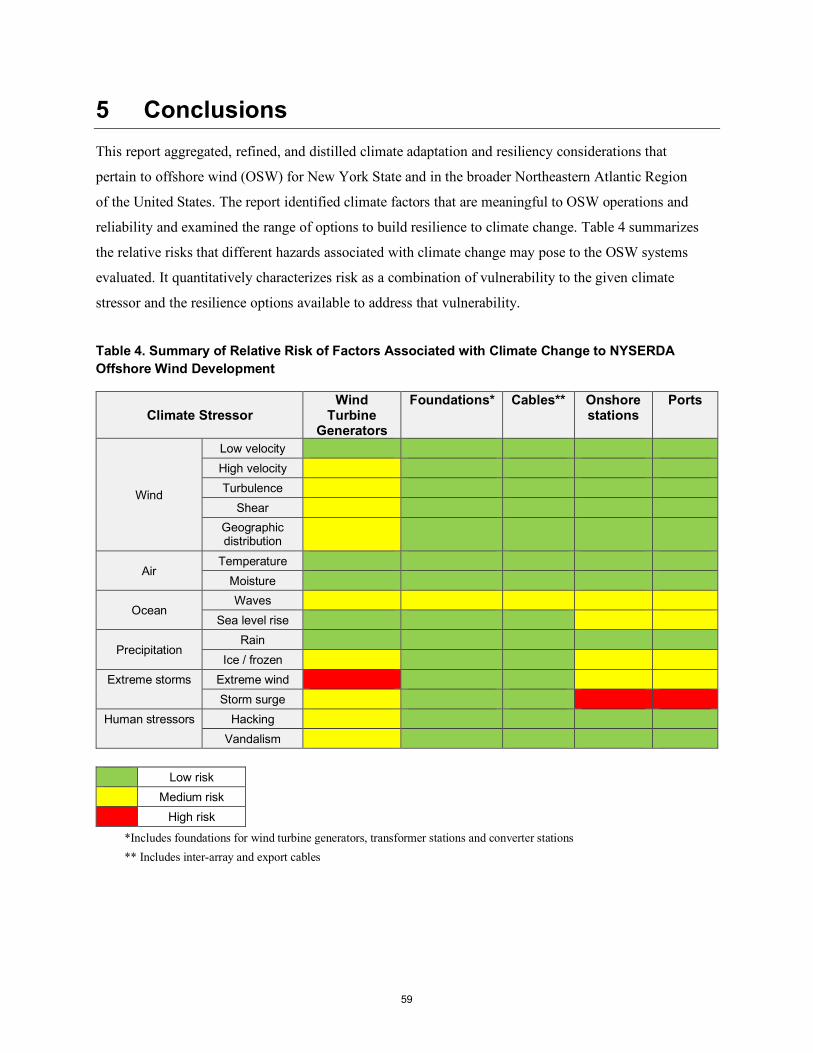
59
5 Conclusions This report aggregated, refined, and distilled climate adaptation and resiliency considerations that
pertain to offshore wind (OSW) for New York State and in the broader Northeastern Atlantic Region
of the United States. The report identified climate factors that are meaningful to OSW operations and
reliability and examined the range of options to build resilience to climate change. Table 4 summarizes
the relative risks that different hazards associated with climate change may pose to the OSW systems
evaluated. It quantitatively characterizes risk as a combination of vulnerability to the given climate
stressor and the resilience options available to address that vulnerability.
Table 4. Summary of Relative Risk of Factors Associated with Climate Change to NYSERDA Offshore Wind Development
Climate Stressor Wind
Turbine Generators
Foundations* Cables** Onshore stations
Ports
Wind
Low velocity High velocity Turbulence
Shear Geographic distribution
Air Temperature
Moisture
Ocean Waves
Sea level rise
Precipitation Rain
Ice / frozen Extreme storms Extreme wind
Storm surge Human stressors Hacking
Vandalism
*Includes foundations for wind turbine generators, transformer stations and converter stations ** Includes inter-array and export cables
Low risk Medium risk High risk

60
6 References Aho, J., Buckspan, A., Laks, J., Jeong, Y., Dunne, F., and Pao, L. 2012. “Tutorial of Wind Turbine
Control for Supporting Grid Frequency through Active Power Control: Preprint,” 14. Montreal, Canada. https://www.nrel.gov/docs/fy12osti/54605.pdf
Aitken, M. L., Rhodes, M., and Lundquist, J. 2012. “Performance of a Wind-Profiling Lidar in the Region of Wind Turbine Rotor Disks.” Journal of Atmospheric and Oceanic Technology 29, no. 3 (January 9, 2012): 347–55. https://doi.org/10.1175/JTECH-D-11-00033.1
American Bird Conservancy. 2017. “Wind Energy and Birds FAQ Part 1: Understanding the Threats.” https://abcbirds.org/wind-energy-threatens-birds/
Prepared by American Bureau of Shipping (ABS) and Submitted to the U.S. Department of the Interior. 2011. “Design Standards for Offshore Wind Farms.” U.S. Department of the Interior, Bureau of Ocean Energy Management, Regulation and Enforcement. https://www.bsee.gov/sites/bsee.gov/files/tap-technical-assessment-program/670aa.pdf
American Wind Energy Association (AWEA). N.d. “U.S. Offshore Wind Industry.” Awea.Org. https://www.awea.org/policy-and-issues/u-s-offshore-wind
American Wind Energy Associate (AWEA). N.d. “Basics of Wind Energy.” Awea.org. https://www.awea.org/wind-101/basics-of-wind-energy
Amorim, Francisco, Hugo Rebelo, and Luísa Rodrigues. 2012. “Factors Influencing Bat Activity and Mortality at a Wind Farm in the Mediterranean Region.” Acta Chiropterologica 14 (2). https://doi.org/info:doi/10.3161/150811012X661756
Armstrong, Alona, Ralph R Burton, Susan E Lee, Stephen Mobbs, Nicholas Ostle, Victoria Smith, Susan Waldron, and Jeanette Whitaker. 2016. “Ground-Level Climate at a Peatland Wind Farm in Scotland Is Affected by Wind Turbine Operation.” Environmental Research Letters 11 (4): 044024. https://doi.org/10.1088/1748-9326/11/4/044024
Asariotis, Regina & Benamara, Hassiba & Mohos Naray, Viktoria. 2018. Port Industry Survey on Climate Change Impacts and Adaptation. 10.13140/RG.2.2.28176.66569
Atlantic Coast Port Access Route Study (ACPARS) Workgroup. 2015. “Atlantic Coast Port Access Route Study: Final Report.” Docket Number USCG-2011-0351. https://navcen.uscg.gov/pdf/PARS/ACPARS_Final_Report_08Jul2015_Combined_Appendix_Enclosures_Final_After_LMI_Review.pdf Azorin‐Molina, Cesar, Sergio M. Vicente‐Serrano, Tim R. McVicar, Jesus Revuelto, Sonia Jerez, and Juan-I. López‐Moreno. 2017. “Assessing the Impact of Measurement Time Interval When Calculating Wind Speed Means and Trends under the Stilling Phenomenon.” International Journal of Climatology 37 (1): 480–92. https://doi.org/10.1002/joc.4720
61
Baldini, Lisa M., James U. L. Baldini, Jim N. McElwaine, Amy Benoit Frappier, Yemane Asmerom, Kam-biu Liu, Keith M. Prufer, et al. 2016. “Persistent Northward North Atlantic Tropical Cyclone Track Migration over the Past Five Centuries.” Scientific Reports 6 (1): 1–8. https://doi.org/10.1038/srep37522
Barclay, Robert M.R., E.F. Baerwald, and J.C. Gruver. 2007. “Variation in Bat and Bird Fatalities at Wind Energy Facilities: Assessing the Effects of Rotor Size and Tower Height.” Canadian Journal of Zoology 85 (3): 381–87. https://doi.org/10.1139/Z07-011
Baring-Gould, Ian. 2014. “Offshore Wind Plant Electrical Systems.” Presented at the BOEM Offshore Renewable Energy Workshop, July 29-30, 2014. https://www.boem.gov/sites/default/files/about-boem/BOEM-Regions/Pacific-Region/Renewable-Energy/6-Ian-Baring-Gould---BOEM-Offshore-Wind-Plant-Electrical-Systems-CA.pdf
Behr, Peter. 2016. “Substation Attack Is New Evidence of Grid Vulnerability.” E&E News. https://www.eenews.net/stories/1060043920
Bhattacharya, S. 2014. “Challenges in Design of Foundations for Offshore Wind Turbines.” Engineering & Technology Reference. https://doi.org/10.1049/etr.2014.0041
Bureau of Ocean Energy Management (BOEM). 2020. “Vineyard Wind 1 Offshore Wind Energy Project.” https://www.boem.gov/sites/default/files/documents/renewable-energy/Vineyard-Wind-1-Supplement-to-EIS.pdf
Bureau of Ocean Energy Management (BOEM). 2018. “Summary Report: Bureau of Ocean Energy Management’s Offshore Wind and Maritime Industry Knowledge Exchange.” https://www.boem.gov/sites/default/files/renewable-energy-program/BOEM-Maritime-Meeting-Summary-FINAL-%281%29.PDF
Carini, F. 2018. “Stop the Spin: Turbines Less Deadly Than Fossil Fuels.” Eco RI News. https://www.ecori.org/renewable-energy/2018/1/22/stop-the-spin-wind-turbines-kill-less-birds-than-fossil-fuels
Center for Hearing and Communication (CHC). N.d. “Common Environmental Noise Levels.” Center for Hearing and Communication. https://chchearing.org/noise/common-environmental-noise-levels/
CFI Notebook. N.d. “Graphics – Aerodynamics and Performance: Stall Strips.” https://www.cfinotebook.net/graphics/aerodynamics-and-performance/stall-strips.webp
Coast Guard, Department of Homeland Security (DHS). 2020. “Port Access Route Study: The Areas Offshore of Massachusetts and Rhode Island” (MARIPARS). https://www.federalregister.gov/documents/2020/01/29/2020-01522/port-access-route-study-the-areas-offshore-of-massachusetts-and-rhode-island
Cognet, V., Courrech du Pont, S., Dobrev, I., Massouh, F., and Thiria, B. 2017. “Bioinspired Turbine Blades Offer New Perspectives for Wind Energy.” Proceedings of the Royal Society A: Mathematical, Physical and Engineering Sciences 473, no. 2198 (February 28, 2017): 20160726. https://doi.org/10.1098/rspa.2016.0726
62
Colle, B.A., Zhang, Z., Lombardo, K. A., Change, E., Liu, P., & Zhang, M. 2013. Historical evaluation and future prediction of Eastern North American and Western Atlantic extratropical cyclones in the CMIP5 models during the cool season. Journal of Climate, 26, 6882-6903.
Colle, B. A., Booth, J. F., & Chang, E. K. M. 2015. A review of historical and future changes of extratropical cyclones and associated impacts along the US East Coast. Current Climate Change Reports. 1(3). 125-143.
Consolidated Edison (Con Ed). 2013. “Post Sandy Enhancement Plan.” https://www.coned.com/-/media/files/coned/documents/services-outages/post_sandy_enhancement_plan.pdf
Dam, C.P. van, Berg, D. E., and Johnson, S. J. 2008. “Active Load Control Techniques for Wind Turbines.” Sandia National Laboratories. https://doi.org/10.2172/943932
Department of Trade and Industry Energy Technology Support Unit (ESTU). 2002. “Potential Effects of Offshore Wind Developments on Coastal Processes.” https://tethys.pnnl.gov/sites/default/files/publications/Potential_Effects_of_Offshore_Wind_Developments_on_Coastal_Processes.pdf
DNV GL. 2018. “Support Structures for Wind Turbines: Standards.” https://rules.dnvgl.com/docs/pdf/DNVGL/ST/2018-07/DNVGL-ST-0126.pdf
Dunne, F., Simley, E., and Pao, L.Y. 2011. “LIDAR Wind Speed Measurement Analysis and Feed-Forward Blade Pitch Control for Load Mitigation in Wind Turbines: January 2010--January 2011.” https://doi.org/10.2172/1028529
Dupigny-Giroux, L.A., E.L. Mecray, M.D. Lemcke-Stampone, G.A. Hodgkins, E.E. Lentz, K.E. Mills, E.D. Lane, R. Miller, D.Y. Hollinger, W.D. Solecki, G.A. Wellenius, P.E. Sheffield, A.B. MacDonald, and C. Caldwell. 2018. Northeast. In Impacts, Risks, and Adaptation in the United States: Fourth National Climate Assessment, Volume II [Reidmiller, D.R., C.W. Avery, D.R. Easterling, K.E. Kunkel, K.L.M. Lewis, T.K. Maycock, and B.C. Stewart (eds.)]. U.S. Global Change Research Program, Washington, DC, USA, pp. 669–742. Hellodoi: 10.7930/NCA4.2018.CH18
Eichelberger, S., Bart Nijssen, James Mccaa, and A. W. Wood. 2008. “Climate Change Effects on Wind Speed.” North American Windpower. https://www.researchgate.net/publication/281611243_Climate_change_effects_on_wind_speed
Eisenberg, Drew, Steffen Laustsen, and Jason Stege. 2016. “Leading Edge Protection Lifetime Prediction Model Creation and Validation.” Presented at WindEurope Summit 2016, Hamburg, Germany
Eisenberg, Drew, Steffen Laustsen, and Jason Stege. 2018. “Wind Turbine Blade Coating Leading Edge Rain Erosion Model: Development and Validation.” Wind Energy 21 (10): 942–51. https://doi.org/10.1002/we.2200
ENERCON. N.d. “WEC Features - Configuration Specific to Site.” https://www.enercon.de/en/technology/wec-features/
63
Fox, A., and Petersen, I. 2019. “Offshore Wind Farms and Their Effects on Birds.”
Garner, Andra J., Michael E. Mann, Kerry A. Emanuel, Robert E. Kopp, Ning Lin, Richard B. Alley, Benjamin P. Horton, Robert M. DeConto, Jeffrey P. Donnelly, and David Pollard. 2017. “Impact of Climate Change on New York City’s Coastal Flood Hazard: Increasing Flood Heights from the Preindustrial to 2300 CE.” PNAS 114 (45). https://www.pnas.org/content/114/45/11861
Giguere, P., Lemay, J., and Dumas, G. 2012. “Gurney Flap Effects and Scaling for Low-Speed Airfoils.” In 13th Applied Aerodynamics Conference. American Institute of Aeronautics and Astronautics. https://doi.org/10.2514/6.1995-1881
Glegg, Stewart. N.d. “The Impact of Offshore Wind Turbines on Underwater Ambient Noise Levels.” Florida Atlantic University Center for Acoustics and Vibration. https://vtechworks.lib.vt.edu/bitstream/handle/10919/54723/Glegg.pdf?sequence=1&isAllowed=y
Goldfarb, Ben. 2017. “Feeling the Heat: How Fish Are Migrating from Warming Waters.” Yale E360. https://e360.yale.edu/features/feeling-the-heat-warming-oceans-drive-fish-into-cooler-waters
Greenberg, Andy. 2017. “Researchers Found They Could Hack Entire Wind Farms.” WIRED. https://www.wired.com/story/wind-turbine-hack/
Guida, V., A. Drohan, H. Welch, J. McHenry, D. Johnson, V. Kentner, J. Brink, D. Timmons, E. Estela-Gomez. 2017. Habitat Mapping and Assessment of Northeast Wind Energy Areas. Sterling, VA: US Department of the Interior, Bureau of Ocean Energy Management (BOEM). OCS Study BOEM 2017-088. 312 p. https://espis.boem.gov/final%20reports/5647.pdf
Haney, J. C., Jodice, P., Montevecchi, W., and Evers, D. C. 2017. “Challenges to Oil Spill Assessment for Seabirds in the Deep Ocean.” Archives of Environmental Contamination and Toxicology 73, no. 1: 33–39. https://doi.org/10.1007/s00244-016-0355-8
Harvey, Chelsea. 2019. “The World’s Winds Are Speeding Up.” Scientific American. November 19, 2019. https://www.scientificamerican.com/article/the-worlds-winds-are-speeding-up/
Hasager, C., F. Vejen, J. I. Bech, W. R. Skrzypiński, A. -M. Tilg, and M. Nielsen. 2020. “Assessment of the Rain and Wind Climate with Focus on Wind Turbine Blade Leading Edge Erosion Rate and Expected Lifetime in Danish Seas.” Renewable Energy 149 (April): 91–102. https://doi.org/10.1016/j.renene.2019.12.043
Hayhoe, K., J. Edmonds, R.E. Kopp, A.N. LeGrande, B.M. Sanderson, M.F. Wehner, and D.J. Wuebbles. 2017. “Climate models, scenarios, and projections.” In: Climate Science Special Report: Fourth National Climate Assessment, Volume I [Wuebbles, D.J., D.W. Fahey, K.A. Hibbard, D.J. Dokken, B.C. Stewart, and T.K. Maycock (eds.)]. U.S. Global Change Research Program, Washington, DC, USA, pp. 133-160, doi: 10.7930/J0WH2N54
64
Hayhoe, K., D.J. Wuebbles, D.R. Easterling, D.W. Fahey, S. Doherty, J. Kossin, W. Sweet, R. Vose, and M. Wehner. 2018. “Our Changing Climate.” In: Impacts, Risks, and Adaptation in the United States: Fourth National Climate Assessment, Volume II [Reidmiller, D.R., C.W. Avery, D.R. Easterling, K.E. Kunkel, K.L.M. Lewis, T.K. Maycock, and B.C. Stewart (eds.)]. U.S. Global Change Research Program, Washington, DC, USA, pp. 72–144. doi: 10.7930/NCA4.2018.CH2
Hoen, Ben, Jason P Brown, Thomas Jackson, Ryan Wiser, Mark Thayer, and Peter Cappers. 2013. “A Spatial Hedonic Analysis of the Effects of Wind Energy Facilities on Surrounding Property Values in the United States.” 58.
Horton, Kyle G., Frank A. La Sorte, Daniel Sheldon, Tsung-Yu Lin, Kevin Winner, Garrett Bernstein, Subhransu Maji, Wesley M. Hochachka, and Andrew Farnsworth. 2020. “Phenology of Nocturnal Avian Migration Has Shifted at the Continental Scale.” Nature Climate Change 10 (1): 63–68. https://doi.org/10.1038/s41558-019-0648-9
Horton, Radley, Christopher Little, Vivien Gornitz, Daniel Bader, and Michael Oppenheimer. 2015. “New York City Panel on Climate Change 2015 Report Chapter 2: Sea Level Rise and Coastal Storms.” Annals of the New York Academy of Sciences 1336 (1): 36–44. https://doi.org/10.1111/nyas.12593
Hu, H., Li, X., and Gu, B. 2016. “Flow Characteristics Study of Wind Turbine Blade with Vortex Generators.” International Journal of Aerospace Engineering (May 12, 2016): e6531694. https://doi.org/10.1155/2016/6531694
Hubbard, Harvey H. Shepherd. 2009. “Wind Turbine Acoustics.” https://ntrs.nasa.gov/search.jsp?R=20090026531
Intergovernmental Panel on Climate Change (IPCC). 2013. Summary for Policymakers, Technical Summary and Frequently Asked Questions. In: Climate Change 2013: The Physical Science Basis. [T. F. Stocker, D. Qin, G.-K. Plattner, M. Tignor, S. K. Allen, J. Boschung, A. Nauels, Y. Xia, V. Bex, & P. Midgley (Eds.)]. Cambridge, United Kingdom: Cambridge University Press, pp. 3–29.
Intergovernmental Panel on Climate Change (IPCC). 2011. Renewable Energy Sources and Climate Change Mitigation. [Ottmar Edenhofer, Ramón Pichs-Madruga, Youba Sokona, Kristin Seyboth, Patrick Matschoss, Susanne Kadner, Timm Zwickel, Patrick Eickemeier, Gerrit Hansen, Steffen Schloemer, Christoph von Stechow (Eds.)]. Cambridge University Press, Cambridge, United Kingdom and New York, NY, USA, pp. 535-608.
International Security Journal (ISJ). 2020. “RadarWatch protects Korean wind farm.” https://internationalsecurityjournal.com/cambridge-pixels-radarwatch-and-target-tracking-technology-protect-korean-offshore-wind-farm/
Jarvis, Christina M. 2005. “An Evaluation of the Wildlife Impacts of Offshore Wind Development Relative to Fossil Fuel Power Production.” University of Delaware Graduate College of Marine Studies. http://www.seaturtle.org/PDF/JarvisCM_2005_MSc.pdf
65
Kalvig, Siri, Eirik Manger, Bjørn H. Hjertager, and Jasna B. Jakobsen. 2014. “Wave Influenced Wind and the Effect on Offshore Wind Turbine Performance.” Energy Procedia, EERA DeepWind’ 2014, 11th Deep Sea Offshore Wind R&D Conference, 53 (January): 202–13. https://doi.org/10.1016/j.egypro.2014.07.229
Kanki, Barbara G., Jean-Francois Clervoy, and Gro Sandal. 2017. Space Safety and Human Performance. Butterworth-Heinemann.
Kim, T., Larsen, T. J., and Yde, A. 2015. “Investigation of potential extreme load reduction for a two‐bladed upwind turbine with partial pitch.” Wind Energy, 18: 1403– 1419. doi: 10.1002/we.1766
Kolundzic, Daniel. 2016. “Exploring the Impact of the Proposed Galloo Island Energy Project,” 31.
Kuiler, I., Adonis, M., and Raji, A. 2018. “Preventive Maintenance and Fault Detection for Wind Turbine Generators Using a Statistical Model.” Fault Detection and Diagnosis, November 5, 2018. https://doi.org/10.5772/intechopen.80071
Ernest Orlando Lawrence Berkeley National Laboratory (LBNL). 2013. “A Spatial Hedonic Analysis of the Effects of Wind Energy Facilities on Surrounding Property Values in the United States,” 58.
Lambkin, D.O., Harris, J.M., Cooper, W.S., Coates, T. 2009. “Coastal Process Modelling for Offshore Wind Farm Environmental Impact Assessment: Best Practice Guide.”
Lange, Bernhard, Søren Larsen, Jørgen Højstrup, and Rebecca Barthelmie. 2004. “Importance of Thermal Effects and Sea Surface Roughness for Offshore Wind Resource Assessment.” Journal of Wind Engineering and Industrial Aerodynamics 92 (11): 959–88. https://doi.org/10.1016/j.jweia.2004.05.005
Lassen, Søren, and Mhairidh Evans. 2020. “Why Offshore Wind Will Attract More than US$211 Billion between 2020 and 2025.” Wood Mackenzie. https://www.woodmac.com/news/opinion/why-offshore-wind-will-attract-more-than-us$211-billion-between-2020-and-2025/
Leonhard, S. B., Stenberg, C., Støttrup, J., Deurs, M. V., Christensen, A., & Pedersen, J. 2013. Fish benefits from offshore wind farm development. In Danish offshore wind - key environmental issues – a follow-up (pp. 31- 45). Danish Energy Agency. https://backend.orbit.dtu.dk/ws/portalfiles/portal/55080896/Havvindm_llebog.pdf
Letson, Frederick, Rebecca J. Barthelmie, and Sara C. Pryor. 2019. “RADAR-Derived Precipitation Climatology for Wind Turbine BladeLeading Edge Erosion.” Preprint. Design methods, reliability and uncertainty modelling. https://doi.org/10.5194/wes-2019-43
Liersch, J, and J Michael. 2014. “Investigation of the Impact of Rain and Particle Erosion on Rotor Blade Aerodynamics with an Erosion Test Facility to Enhancing the Rotor Blade Performance and Durability.” Journal of Physics: Conference Series 524 (June): 012023. https://doi.org/10.1088/1742-6596/524/1/012023
66
Lin, N., Marsooli, R. & Colle, B.A. 2019. Storm surge return levels induced by mid-to-late-twenty-first-century extratropical cyclones in the Northeastern United States. Climatic Change 154, 143–158. https://doi.org/10.1007/s10584-019-02431-8
Lindeboom, H. J., H. J. Kouwenhoven, M. J. N. Bergman, S. Bouma, S. Brasseur, R. Daan, R. C. Fijn, et al. 2011. “Short-Term Ecological Effects of an Offshore Wind Farm in the Dutch Coastal Zone; a Compilation.” Environmental Research Letters 6 (3): 035101. https://doi.org/10.1088/1748-9326/6/3/035101
Liu, J-H, Chen, J-C, Lai, W-J, Su, W-N. 2018. “Extreme Load Analysis of a 5MW Offshore Wind Turbine under Tropical Cyclone Wind Conditions. Research Gate.” https://www.researchgate.net/profile/Jui_Hung_Liu/publication/334494246_Extreme_Load_Analysis_of_a_5MW_Offshore_Wind_Turbine_under_Tropical_Cyclone_Wind_Conditions/links/5d2e035792851cf4408a179b/Extreme-Load-Analysis-of-a-5MW-Offshore-Wind-Turbine-under-Tropical-Cyclone-Wind-Conditions.pdf?origin=publication_detail
Lutzeyer, Sanja, Daniel J. Phaneuf, and Laura O. Taylor. 2017. “The Amenity Costs of Offshore Wind Farms: Evidence from a Choice Experiment.” Energy Economics 72: 621–39. https://doi.org/10.1016/j.eneco.2018.03.020
Lynch, J.F., G.G. Gawarkiewicz, Y.-T. Lin, T.F. Duda, and A.E. Newhall. 2018. Impacts of ocean warming on acoustic propagation over continental shelf and slope regions. Oceanography 31(2):174–181. https://doi.org/10.5670/oceanog.2018.219
Mahan, Simon, Isaac Pearlman, and Jacqueline Savitz. 2010. “Untapped Wealth: Offshore Wind Can Deliver Cleaner, More Affordable Energy and More Jobs than Offshore Oil.”
Martinez, J., Flaszynski, P., Doerffer, P., and Szulc, O. 2016. “Improvement of Wind Turbine Blade Performance by Means of Rod Vortex Generators.” In MARE-WINT: New Materials and Reliability in Offshore Wind Turbine Technology, edited by Wiesław Ostachowicz, Malcolm McGugan, Jens-Uwe Schröder-Hinrichs, and Marcin Luczak, 81–102. Cham: Springer International Publishing. https://doi.org/10.1007/978-3-319-39095-6_6
Matko, Maruša, Mojca Golobič, and Branko Kontić. 2016. “Integration of Extreme Weather Event Risk Assessment into Spatial Planning of Electric Power Infrastructure.” Urbani Izziv 27 (1): 95–112.
Matuschek, R, and K. Betke. 2009. “Measurements of Construction Noise During Pile Driving of Offshore Research Platforms and Wind Farms,” 4.
McInnes, Kathleen L., Timothy A. Erwin, and Janice M. Bathols. 2011. “Global Climate Model Projected Changes in 10 m Wind Speed and Direction Due to Anthropogenic Climate Change.” Atmospheric Science Letters 12 (4): 325–33. https://doi.org/10.1002/asl.341
Mikkelsen, T., Hansen, K., Angelou, N., Sjöholm, M., Harris, M., Hadley, P., Scullion, R., Ellis, G., and Vives, G. 2010. “Lidar Wind Speed Measurements from a Rotating Spinner.” EWEC 2010 Proceedings Online, 9.
67
Miller, G.E. 1995. “Comparative Performance Tests on the Mod-2, 2.5-MW Wind Turbine With and Without Vortex Generators.” In DASCON Engineering, Collected Papers on Wind Turbine Technology. 67-77.
Morris, L. 2011. “Second-Generation LIDAR Boosts Wind Power.” Power Engineering. https://www.power-eng.com/2011/02/01/second-generation-lidar-boosts-wind-power/
Musial, W, D Elliott, J Fields, Z Parker, G Scott, and C Draxl. 2013. “Assessment of Offshore Wind Energy Leasing Areas for the BOEM New Jersey Wind Energy Area.” National Renewable Energy Laboratory (NREL).
National Oceanic and Atmospheric Administration (NOAA) Environmental Data Service. 1972. “Environmental Guide for Seven U.S. Ports and Harbor Approaches.” https://books.google.com/books?id=oz8aAQAAMAAJ&lpg=PA44&dq=50%20yr%20significant%20wave%20height%20for%20new%20york%20coast&pg=PP5#v=onepage&q&f=false
National Oceanic and Atmospheric Administration (NOAA) Fisheries. 2020. “Offshore Wind Energy Development in New England/Mid-Atlantic Waters. https://www.fisheries.noaa.gov/content/offshore-wind-energy-development-new-england-mid-atlantic-waters
National Oceanic and Atmospheric Administration (NOAA) National Ocean Service. 2019. “How Far Does Sound Travel in the Ocean?” National Ocean Service Website. https://oceanservice.noaa.gov/facts/sound.html
National Renewable Energy Laboratory (NREL). 2016. “Hurricane Resilient Wind Plant Concept Study Final Report.”
National Weather Service (NWS). N.d. “Turbulence.” https://www.weather.gov/source/zhu/ZHU_Training_Page/turbulence_stuff/turbulence/turbulence.htm
Network for Greening the Financial System (NGFS). 2019. “A Call for Action. Climate Change as a Source of Financial Risk.” Paris.
New York State Energy Research and Development Authority (NYSERDA). 2010. “Pre-Development Assessment of Meteorological and Oceanographic Conditions for the Proposed Long Island – New York City Offshore Wind Project Area. https://www.nyserda.ny.gov/-/media/Files/EIBD/Research/LI-NYC-offshore-wind-climatology.pdf
New York State Energy Research and Development Authority (NYSERDA). 2012a. “An Evaluation of the Potential for Using Acoustic Monitoring to Remotely Assess Aerial Vertebrate Collision at Industrial Wind Energy Facilities.” 12–26.
New York State Energy Research and Development Authority (NYSERDA). 2012b. “Avian Acoustic Monitoring Study at the Maple Ridge Wind Project: 2007-2008.” 12–23.
New York State Energy Research and Development Authority (NYSERDA). 2013a. “Wind Turbine-Related Noise and Community Response.” 13–03b.
68
New York State Energy Research and Development Authority (NYSERDA). 2013b. “Wind Turbine-Related Noise: Current Knowledge and Research Needs.” 13–14.
New York State Energy Research and Development Authority (NYSERDA). 2014a. “Responding to Climate Change in New York State (ClimAID).” https://www.nyserda.ny.gov/About/Publications/Research%20and%20Development%20Technical%20Reports/Environmental%20Research%20and%20Development%20Technical%20Reports/Response%20to%20Climate%20Change%20in%20New%20York
New York State Energy Research and Development Authority (NYSERDA). 2014b. “Wind Power and Biodiversity in New York: A Tool for Siting Assessment and Scenario Planning at the Landscape Scale.” 14–46. https://www.nyserda.ny.gov/-/media/Files/Publications/Research/Environmental/Wind-Power-and-Biodiversity-in-New-York.pdf
New York State Energy Research and Development Authority (NYSERDA). 2016. “Wind Energy Guide, Section 1: Wind Energy Basics.” https://www.nyserda.ny.gov/Researchers%20and%20Policymakers/Power%20Generation/Wind/Large%20Wind/New%20York%20Wind%20Energy%20Guide%20Local%20Decision%20Makers
New York State Energy Research and Development Authority (NYSERDA). 2018. “New York State Offshore Wind Master Plan: Charting a Course to 2,400 Megawatts of Offshore Wind Energy.” 17–25. https://www.nyserda.ny.gov/-/media/Files/Publications/Research/Biomass-Solar-Wind/Master-Plan/Offshore-Wind-Master-Plan.pdf
New York State Energy Research and Development Authority (NYSERDA). 2017a. “New York State Offshore Wind Master Plan Fish and Fisheries Study.” 17–25. https://www.nyserda.ny.gov/-/media/Files/Publications/Research/Biomass-Solar-Wind/Master-Plan/17-25j-Fish-and-Fisheries-Study.pdf
New York State Energy Research and Development Authority (NYSERDA). 2017b. “New York State Offshore Wind Master Plan Shipping and Navigation Study.” 17–25. https://www.nyserda.ny.gov/-/media/Files/Publications/Research/Biomass-Solar-Wind/Master-Plan/17-25q-Shipping-and-Navigation.pdf
Nikoueeyan, P., Strike, J., Magstadt, A., Hind, M., and Naughton, J. 2015. “Aerodynamic Response of a Wind Turbine Airfoil to Gurney Flap Deployment.” https://doi.org/10.2514/6.2015-0995
Paradis, A., Elkinton, J., Hayhoe, K., & Buonaccorsi, J. 2008. Role of winter temperature and climate change on the survival and future range expansion of the hemlock woolly adelgid (Adelges tsugae) in eastern North America. Mitigation and Adaptation Strategies for Global Change, 13(5–6), 541–554. http://dx.doi.org/10.1007/s11027-007-9127-0
Pecl, Gretta T., Miguel B. Araújo, Johann D. Bell, Julia Blanchard, Timothy C. Bonebrake, I.-Ching Chen, Timothy D. Clark, et al. 2017. “Biodiversity Redistribution under Climate Change: Impacts on Ecosystems and Human Well-Being.” Science 355 (6332). https://doi.org/10.1126/science.aai9214
69
Pelletier, Steven K., Kristian S. Omland, Kristen S. Watrous, and Trevor S. Peterson. 2013. “Information Synthesis on the Potential for Bat Interactions with Offshore Wind Facilities.” OCS Study. Herndon, VA: U.S. Department of the Interior, Bureau of Ocean Energy Management (BOEM). https://espis.boem.gov/final%20reports/5289.pdf
Perkol-Finek, Shimrit and Ido Sella. 2015. “Harnessing urban coastal infrastructure for ecological enhancement.” Proceedings of the Institution of Civil Engineers. Maritime Engineering 168 September 2015 Issue MA3. Pages 102–110 http://dx.doi.org/10.1680/jmaen.15.00017
Powell, Mark. N.d. “Vertical Wind Profiles in Hurricanes.” NOAA Hurricane Research Division.
Pryor, S. C., and R. J. Barthelmie. 2010. “Climate Change Impacts on Wind Energy: A Review.” Renewable and Sustainable Energy Reviews 14 (1): 430–37. https://doi.org/10.1016/j.rser.2009.07.028
Robinson, Stephen. 2012. “Noise Issues for Offshore Windfarms. Basic Acoustics: What Needs to Be Measured and Why.” National Physical Laboratory (NPL). http://www.ewea.org/events/workshops/wp-content/uploads/2012/12/EWEA-Noise-Workshop-Oxford-2012-5-1-Stephen-Robinson.pdf
Rodrigues, Silvio, Carlos Restrepo, George Katsouris, Rodrigo Pinto, Maryam Soleimanzadeh, Peter Bosman, and P. Bauer. 2016. “A Multi-Objective Optimization Framework for Offshore Wind Farm Layouts and Electric Infrastructures.” Energies 9: 216. https://doi.org/10.3390/en9030216
Román-Palacios, Cristian, and John J. Wiens. 2020. “Recent Responses to Climate Change Reveal the Drivers of Species Extinction and Survival.” Proceedings of the National Academy of Sciences 117 (8): 4211–17. https://doi.org/10.1073/pnas.1913007117
Rose, Stephen, Paulina Jaramillo, Mitchell J. Small, and Jay Apt. 2012. “Quantifying the Hurricane Catastrophe Risk to Offshore Wind Power: Hurricane Catastrophe Risk to Offshore Wind Power.” Carnegic Mellon Electricity Industry Center 33 (12): 2126–41. https://doi.org/10.1111/risa.12085
Roy, Somnath Baidya, and Justin J. Traiteur. 2010. “Impacts of Wind Farms on Surface Air Temperatures.” Proceedings of the National Academy of Sciences 107 (42): 17899–904. https://doi.org/10.1073/pnas.1000493107
Saenz-Aguirre, A., Fernandez-Gamiz, U., Zulueta, E., Ulazia, A., and Martinez-Rico, J. 2019. “Optimal Wind Turbine Operation by Artificial Neural Network-Based Active Gurney Flap Flow Control.” Sustainability 11, no. 10: 2809. https://doi.org/10.3390/su11102809
Saidur, R., N.A. Rahim, M.R. Islam, and K.H. Solangi. 2011. “Environmental Impact of Wind Energy.” Renewable and Sustainable Energy Reviews 15, no. 5: 2423–30. https://doi.org/10.1016/j.rser.2011.02.024
Salcedo, S., F. Monge, F. Palacios, Fernando Gandia-Aguera, Angel Rodriguez-Sevillano, and Miguel Barcala-Montejano. 2006. “Gurney Flaps and Trailing Edge Devices for Wind Turbines” 2: 1180–86.
70
Sanchez Gomez, Miguel, and Julie K. Lundquist. 2020. “The Effect of Wind Direction Shear on Turbine Performance in a Wind Farm in Central Iowa.” Wind Energy Science 5 (1): 125–39. https://doi.org/10.5194/wes-5-125-2020
Sharpley, Nic. “Increasing Wind Turbine Efficiency with Vortex Generators.” 2015. Windpower Engineering & Development. https://www.windpowerengineering.com/increasing-wind-turbine-efficiency-with-vortex-generators/
Smart Blade. 2020. “Wind Energy Performance: Vortex Generators.” https://www.smart-blade.com/vortex-generators
Sobczak, Blake. 2019. “First-of-a-Kind U.S. Grid Cyberattack Hit Wind, Solar.” E&E News. https://www.eenews.net/stories/1061421301
Sovacool, Benjamin K. 2012. “The Avian and Wildlife Costs of Fossil Fuels and Nuclear Power.” Journal of Integrative Environmental Sciences 9, no. 4: 255–78. https://doi.org/10.1080/1943815X.2012.746993
Sugden, Andrew M. 2017. “Consequences of Shifting Species Distributions.” Science 355, no. 6332: 1386. https://doi.org/10.1126/science.355.6332.1386-j
Sullivan, Robert G., Leslie B. Kirchler, Jackson Cothren, and Snow L. Winters. 2013. “Research Articles: Offshore Wind Turbine Visibility and Visual Impact Threshold Distances.” Environmental Practice 15 (1): 33–49. https://doi.org/10.1017/S1466046612000464
Tee, W., Oumer, A.N., Shukrie, A., AbdulAziz, A., and Baheta, A. 2017. “Effect of Stall Strip Position, Size and Geometry on the Lift Coefficient of NACA 001 Aerofoil.” Edited by H. Sakidin, M.H. Yusof, N. Sa’ad, D. Ling Chuan Ching, and S.A. Abdul Karim. MATEC Web of Conferences 131: 04011. https://doi.org/10.1051/matecconf/201713104011
Ten Brink, Talya S., and Tracey Dalton. 2018. “Perceptions of Commercial and Recreational Fishers on the Potential Ecological Impacts of the Block Island Wind Farm (US).” Frontiers in Marine Science 5. https://doi.org/10.3389/fmars.2018.00439
Thomsen, Frank, Karin Lüdemann, Rudolf Kafemann, and Werner Piper. 2006. “Effects of Offshore Wind Farm Noise on Marine Mammals and Fish,” 62.
U.S. Department of Energy (DOE). 2012. “Final Environmental Impact Statement for the Proposed Cape Wind Energy Project, Nantucket Sound, Massachusetts (Adopted), DOE/EIS-0470.” U.S. Department of Energy. https://www.energy.gov/sites/prod/files/DOE-EIS-0470-Cape_Wind_FEIS_2012.pdf
U.S. Department of Energy (DOE) Office of Energy Efficiency & Renewable Energy (EERE). N.d. A “How do Wind Turbines Survive Extreme Storms?” https://www.energy.gov/eere/articles/how-do-wind-turbines-survive-severe-storms
U.S. Department of Energy (DOE) Office of Energy Efficiency & Renewable Energy (EERE). N.d. “Offshore Wind Research and Development.” Energy.Gov. https://www.energy.gov/eere/wind/offshore-wind-research-and-development
71
U.S. Department of Energy (DOE) Office of Energy Efficiency & Renewable Energy (EERE). 2016. “Computing America’s Offshore Wind Energy Potential.” Energy.Gov. September 9, 2016. https://www.energy.gov/eere/articles/computing-america-s-offshore-wind-energy-potential
U.S. Department of Energy (DOE) Office of Energy Efficiency & Renewable Energy (EERE). 2017. “How Do Wind Turbines Survive Severe Storms?” Energy.Gov. June 20, 2017. https://www.energy.gov/eere/articles/how-do-wind-turbines-survive-severe-storms
U.S. Department of Energy (DOE) Wind Energy Technologies Office (WETO). 2020. “Labs Coordinate to Protect Wind Power from Cyberattacks” Energy.Gov. June 20, 2017. https://www.energy.gov/eere/wind/articles/labs-coordinate-protect-wind-power-cyberattacks
U.S. Department of Energy (DOE) Office of Energy Policy and Systems Analysis (OEPS). 2016. “Review of Climate Change Vulnerability Assessments: Current Practices and Lessons Learned from DOE’s Partnership for Energy Sector Climate Resilience” https://www.energy.gov/sites/prod/files/2016/10/f33/A%20Review%20of%20Climate%20Change%20Vulnerability%20Assessments%20Current%20Practices%20and%20Lessons%20Learned%20from%20DOEs%20Partnership%20for%20Energy%20Sector%20Climate%20Resilience.pdf
U.S. Fish & Wildlife Service (FWS) Migratory Bird Program. 2018. “Wind Turbines.” April 18, 2018. https://www.fws.gov/birds/bird-enthusiasts/threats-to-birds/collisions/wind-turbines.php
Vautard, Robert, Julien Cattiaux, Pascal Yiou, Jean-Noël Thépaut, and Philippe Ciais. 2010. “Northern Hemisphere Atmospheric Stilling Partly Attributed to an Increase in Surface Roughness.” Nature Geoscience 3 (11): 756–61. https://doi.org/10.1038/ngeo979
Vestas. 2019. “Energy Boosting Upgrades and Lifetime Extension.” https://wfof.eu/files/2019/D2_R3_W2_FOFW2019_Vestas.pdf
Vestas. 2019. “Vestas High Wind Operation (HWO).” http://nozebra.ipapercms.dk/Vestas/Communication/Productbrochure/vestas-hwo/#/
Walsh, J., D. Wuebbles, K. Hayhoe, J. Kossin, K. Kunkel, G. Stephens, P. Thorne, R. Vose, M. Wehner, J. Willis, D. Anderson, S. Doney, R. Feely, P. Hennon, V. Kharin, T. Knutson, F. Landerer, T. Lenton, J. Kennedy, and R. Somerville. 2014. “Ch. 2: Our Changing Climate. Climate Change Impacts in the United States: The Third National Climate Assessment,” J. M. Melillo, Terese (T.C.) Richmond, and G. W. Yohe, Eds., U.S. Global Change Research Program, 19-67. doi:10.7930/J0KW5CXT
Windmanager. 2017. “Customized Burglary Protection for Wind Turbine Generators.” https://www.windmanager.de/en/customized-burglary-protection-for-wind-turbine-generators/
Worsnop, Rochelle P., Julie K. Lundquist, George H. Bryan, Rick Damiani, and Walt Musial. 2017. “Gusts and Shear within Hurricane Eyewalls Can Exceed Offshore Wind Turbine Design Standards.” Geophysical Research Letters 44 (12): 6413–20. https://doi.org/10.1002/2017GL073537
72
Yin, Jianjun, Michael E. Schlesinger, and Ronald J. Stouffer. 2009. “Model Projections of Rapid Sea-Level Rise on the Northeast Coast of the United States.” Nature Geoscience 2 (4): 262–66. https://doi.org/10.1038/ngeo462
Yin, Jianjun, Stephen M. Griffies, and Ronald J. Stouffer. 2010. “Spatial Variability of Sea Level Rise in Twenty-First Century Projections.” Journal of Climate 23 (17): 4585–4607. https://doi.org/10.1175/2010JCLI3533.1
Zeng, Zhenzhong, Alan D. Ziegler, Timothy Searchinger, Long Yang, Anping Chen, Kunlu Ju, Shilong Piao, et al. 2019. “A Reversal in Global Terrestrial Stilling and Its Implications for Wind Energy Production.” Nature Climate Change 9 (12): 979–85. https://doi.org/10.1038/s41558-019-0622-6
Zhang, Jun A., Robert F. Rogers, David S. Nolan, and Frank D. Marks. 2011. “On the Characteristic Height Scales of the Hurricane Boundary Layer.” Monthly Weather Review 139 (8): 2523–35. https://doi.org/10.1175/MWR-D-10-05017.1
Ziegler, L., Voormeeren, S., Schafhirt, S., & Muskulus, M. 2015. “Sensitivity of Wave Fatigue Loads on Offshore Wind Turbines under Varying Site Conditions.” Energy Procedia. 80, 193–200. https://doi.org/10.1016/j.egypro.2015.11.422
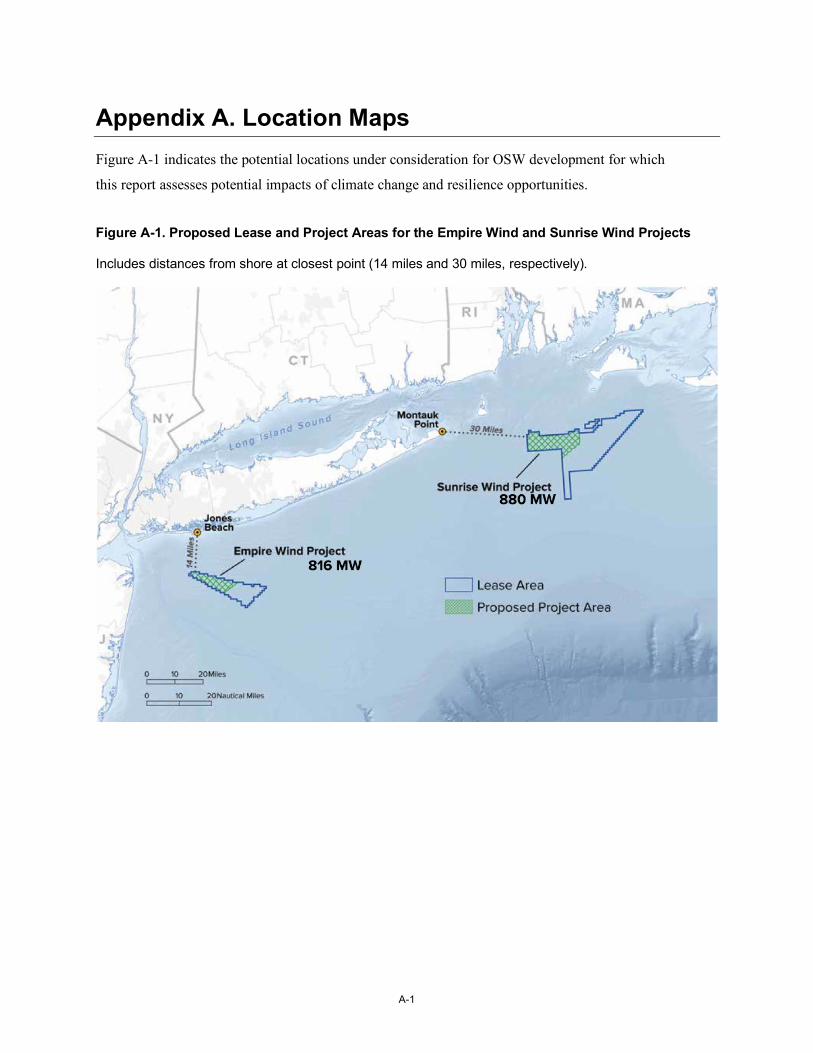
A-1
Appendix A. Location Maps Figure A-1 indicates the potential locations under consideration for OSW development for which
this report assesses potential impacts of climate change and resilience opportunities.
Figure A-1. Proposed Lease and Project Areas for the Empire Wind and Sunrise Wind Projects
Includes distances from shore at closest point (14 miles and 30 miles, respectively).
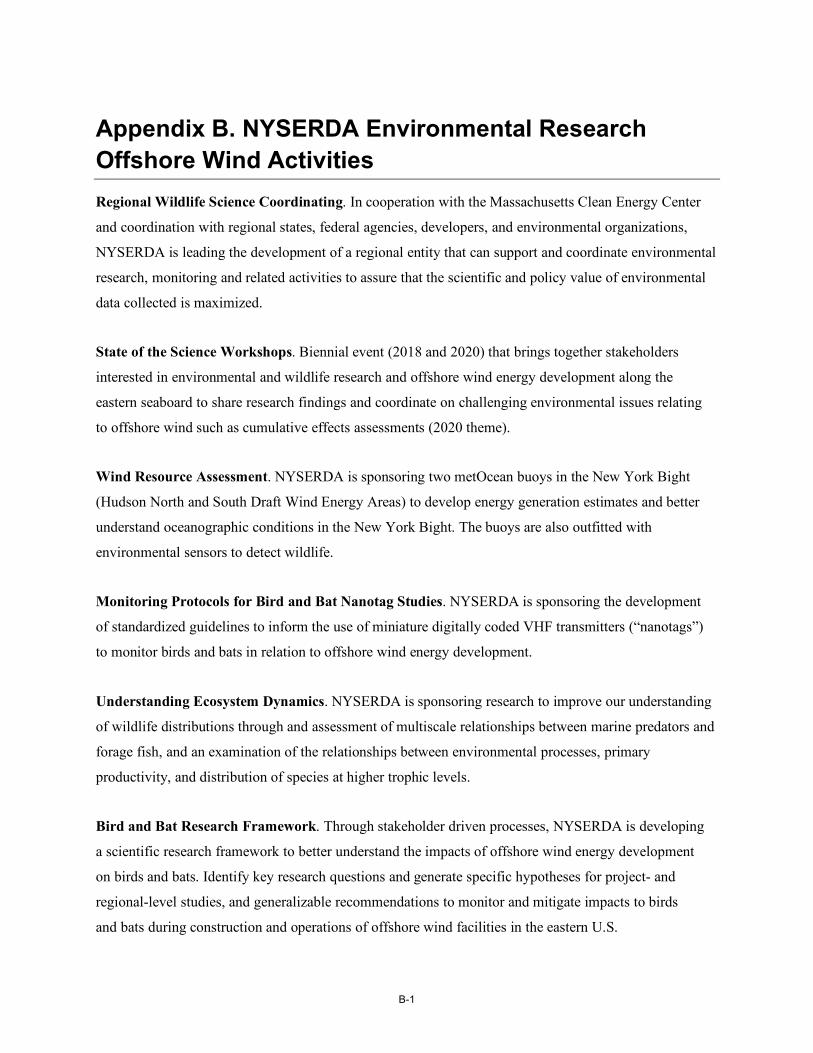
B-1
Appendix B. NYSERDA Environmental Research Offshore Wind Activities Regional Wildlife Science Coordinating. In cooperation with the Massachusetts Clean Energy Center
and coordination with regional states, federal agencies, developers, and environmental organizations,
NYSERDA is leading the development of a regional entity that can support and coordinate environmental
research, monitoring and related activities to assure that the scientific and policy value of environmental
data collected is maximized.
State of the Science Workshops. Biennial event (2018 and 2020) that brings together stakeholders
interested in environmental and wildlife research and offshore wind energy development along the
eastern seaboard to share research findings and coordinate on challenging environmental issues relating
to offshore wind such as cumulative effects assessments (2020 theme).
Wind Resource Assessment. NYSERDA is sponsoring two metOcean buoys in the New York Bight
(Hudson North and South Draft Wind Energy Areas) to develop energy generation estimates and better
understand oceanographic conditions in the New York Bight. The buoys are also outfitted with
environmental sensors to detect wildlife.
Monitoring Protocols for Bird and Bat Nanotag Studies. NYSERDA is sponsoring the development
of standardized guidelines to inform the use of miniature digitally coded VHF transmitters (“nanotags”)
to monitor birds and bats in relation to offshore wind energy development.
Understanding Ecosystem Dynamics. NYSERDA is sponsoring research to improve our understanding
of wildlife distributions through and assessment of multiscale relationships between marine predators and
forage fish, and an examination of the relationships between environmental processes, primary
productivity, and distribution of species at higher trophic levels.
Bird and Bat Research Framework. Through stakeholder driven processes, NYSERDA is developing
a scientific research framework to better understand the impacts of offshore wind energy development
on birds and bats. Identify key research questions and generate specific hypotheses for project- and
regional-level studies, and generalizable recommendations to monitor and mitigate impacts to birds
and bats during construction and operations of offshore wind facilities in the eastern U.S.
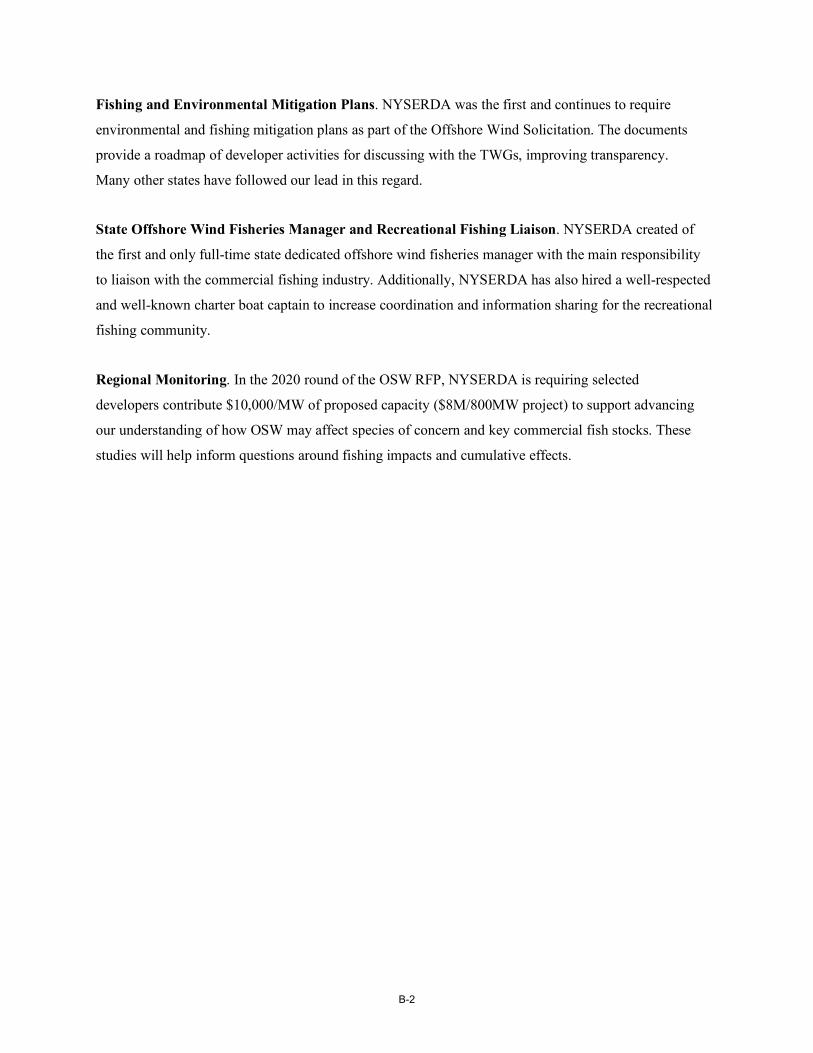
B-2
Fishing and Environmental Mitigation Plans. NYSERDA was the first and continues to require
environmental and fishing mitigation plans as part of the Offshore Wind Solicitation. The documents
provide a roadmap of developer activities for discussing with the TWGs, improving transparency.
Many other states have followed our lead in this regard.
State Offshore Wind Fisheries Manager and Recreational Fishing Liaison. NYSERDA created of
the first and only full-time state dedicated offshore wind fisheries manager with the main responsibility
to liaison with the commercial fishing industry. Additionally, NYSERDA has also hired a well-respected
and well-known charter boat captain to increase coordination and information sharing for the recreational
fishing community.
Regional Monitoring. In the 2020 round of the OSW RFP, NYSERDA is requiring selected
developers contribute $10,000/MW of proposed capacity ($8M/800MW project) to support advancing
our understanding of how OSW may affect species of concern and key commercial fish stocks. These
studies will help inform questions around fishing impacts and cumulative effects.
EN-1
Endnotes
1 An abnormal rise in seawater level during a storm. 2 Disadvantaged Communities are identified in the CLCPA as communities that bear burdens of negative public health
effects, environmental pollution, impacts of climate change, and possess certain socioeconomic criteria, or comprise high-concentrations of low- and moderate- income households.
3 The process of investigating, reviewing and verifying all relevant aspects of a project. 4 A probability distribution which reflects that most of the time wind speeds will be low to moderate and gales and
storms will be infrequent. 5 Turbine wake is the phenomenon in which wind turbines extract energy from the wind, making downstream wind
lower in energy and velocity than upstream wind. 6 Patterns of motion in which all parts of a system move concurrently, with the same frequency, often with an
undesirable result. 7 A cyberattack that disrupts a “targeted system” by causing thousands or millions of individual computers, often
personal computers of unwitting users, to simultaneously and repeatedly request superfluous information from the targeted system.
8 Risks that arise from the process of transitioning to a lower-carbon economy, such as changes in policy,technology, or investor sentiment.
9 Market-based instruments that represents the property rights to the environmental, social, and other non-power attributes of offshore wind renewable electricity generation. RECs are issued when one megawatt-hour (MWh) of electricity is generated and delivered to the electricity grid from a renewable energy resource.
10 DNV GL. Tropical Storm Isaias: What did it mean for the NY Bight? August 18, 2020. https://blogs.dnvgl.com/energy/tropical-storm-isaias-what-did-it-mean-for-the-ny-bight
11 Submerged Land Act of 1953. Texas, Florida, and Louisiana have jurisdiction over submerged lands in the Gulf of Mexico out to nine nautical miles offshore.
12 https://www.boem.gov/environment/environmental-assessment/nepa/national-environmental-policy-act-nepa 13 See further: https://www.nyserda.ny.gov/All-Programs/Programs/Offshore-Wind/Focus-Areas/Ocean-Environment 14 The New York Natural Heritage Program and The Nature Conservancy recently developed an online mapping tool
for NYSERDA to use to weigh biodiversity as part of turbine siting decisions. The tool includes data layers relevant to biodiversity and wind power, as well as a methodology to guide synthesis of that data to identify locations that maximize “energy development and biodiversity conservation” (NYSERDA, 2014b).
15 NOAA National Hurricane Center. 16 New York City Health Provider Partnership, Bronx Community Needs Assessment Report, September 25, 2014. 17 “A-weighted decibels,” express the relative loudness of sounds in air as perceived by the human ear. 18 The displacement of materials such as sand or rocks in the direction of the shoreline, typically by tidal forces. 19 Objectives include project economics (e.g., energy generated, operations and maintenance costs), technical
performance criteria (e.g., mechanical availability) climate change mitigation (e.g., avoided tons of carbon) and the consideration of these objectives differs depending on a given stakeholder.
20 See the Resilient Industry study (NYC Department of City Planning, 2018). 21 An urban area or metropolitan area that is significantly warmer than its surrounding rural areas due to
human activities. 22 https://www.epa.gov/ports-initiative/about-epa-ports-initiative
NYSERDA, a public benefit corporation, offers objective information and analysis, innovative programs, technical expertise, and support to help New Yorkers increase energy efficiency, save money, use renewable energy, and reduce reliance on fossil fuels. NYSERDA professionals work to protect the environment and create clean-energy jobs. NYSERDA has been developing partnerships to advance innovative energy solutions in New York State since 1975.
To learn more about NYSERDA’s programs and funding opportunities,
visit nyserda.ny.gov or follow us on Twitter, Facebook, YouTube, or
Instagram.
New York State Energy Research and
Development Authority
17 Columbia CircleAlbany, NY 12203-6399
toll free: 866-NYSERDAlocal: 518-862-1090fax: 518-862-1091

State of New York Andrew M. Cuomo, Governor
New York State Energy Research and Development AuthorityRichard L. Kauffman, Chair | Doreen M. Harris, Acting President and CEO