Embed Size (px)
Citation preview
o P-Nj--62 -PREDICTION OF TUSE-TUIESHEET GALVANIC CORROSION USING /LONG TERM ELECTROCH.. (U) DAVID TAYLOR RESEARCH CENTERMBETHESDA NO SHIP MATERIALS ENGIN.. J R SCULLY ET AL.
I7U SIFIED AR SI DTRC/SE-6-iiS F/G 11/6. HL
W i m 12 3j2
-2-0_18
.1.6
David Taylor Research CenterBethesda, MD 20084-5000
0 (0 DTRC/SE-86-110 March 1988
IL Ship Materials Engineering DepartmentResearch and Development Report
UU
za.0
U < PREDICTION OF TUBE-TUBESHEET GALVANIC CORROSION USINGLONG TERM ELECTROCHEMICAL POLARIZATION DATA
z
0 byJohn R. Scully and Harvey P. Hack
* 0z<
C-,,
0
DTICELECTEJN 0 71988
S-4 <
0'-Approved for public release; distribution unlimited.
j-4
... . ....
CODE 011 DIRECTOR OF TECHNOLOGY, PLANS AND ASSESSMENT
12 SHIP SYSTEMS INTEGRATION DEPARTMENT
14 SHIP ELECTROMAGNETIC SIGNATURES DEPARTMENT
15 SHIP HYDROMECHANICS DEPARTMENT
16 AVIATION DEPARTMENT
17 SHIP STRUCTURES AND PROTECTION DEPARTMENT
18 COMPUTATION, MATHEMATICS & LOGISTICS DEPARTMENT
19 SHIP ACOUSTICS DEPARTMENT
27 PROPULSION AND AUXILIARY SYSTEMS DEPARTMENT
28 SHIP MATERIALS ENGINEERING DEPARTMENT
DTRC ISSUES THREE TYPES OF REPORTS:
1. DTRC reports, a formal series, contain information of permanent technical value.They carry a consecutive numerical identification regardless of their classification or theoriginating department.
2. Departmental reports, a semiformal series, contain information of a preliminary,temporary, or proprietary nature or of limited interest or significance. They carry adepartmental alphanumerical identification.3. Technical memoranda, an informal series, contain technical documentation oflimited use and interest. They are primarily working papers intended for internal use. Theycarry an identifying number which indicates their type and the numerical code of theoriginating department. Any distribution outside OTRC must be approved by the head ofthe originating department on a case-by-case basis.
NOW-0TNSRDC 5602i51 (Rev 2-88)
SECURITY CLASSIFICATION OF THIS PAGE
REPORT DOCUMENTATION PAGEl. REPORT SECURITY CLASSIFICATION lb RESTRICTIVE MARKINGSUNCLASS IFIED
2a. SECURITY CLASSIFICATION AUTHORITY 3. DISTRIBUTION/AVAILABILITY OF REPORT
2b. DECLASSIFICATIONI'DOWNGRADING SCHEDULE Approved for public release; distributionunlimited.
4. PERFORMING ORGANIZATION REPORT NUMBER(S) S. MONITORING ORGANIZATION REPORT NUMBER(S)
DTRC/SME-86-II0
6. NAME OF PERFORMING ORGANIZATION 6b. OFFICE SYMBOL 7a. NAME OF MONITORING ORGANIZATION
David Taylor Research Center (If applicable)I Code 2813
6c. ADDRESS (City, State, and ZIP Code) 7b. ADDRESS (City, State, and ZIP Code)
Annapolis, MD 21402
8a. NAME OF FUNDING/SPONSORING J8b. OFFICE SYMBOL 9. PROCUREMENT INSTRUMENT IDENTIFICATION NUMBERORGANIZATIONI (If applicable)
NIAVSEA 05R25
8c. ADDRESS (City, State, and ZIP Code) 10. SOURCE OF FUNDING NUMBERSPROGRAM PROJECT TASK WORK UNIT
Washington, DC 20362 ELEMENT NO. NO. NO. ACCESSION NO.62761N 1-28 03-164
11. TITLE (Include Security Classficationj
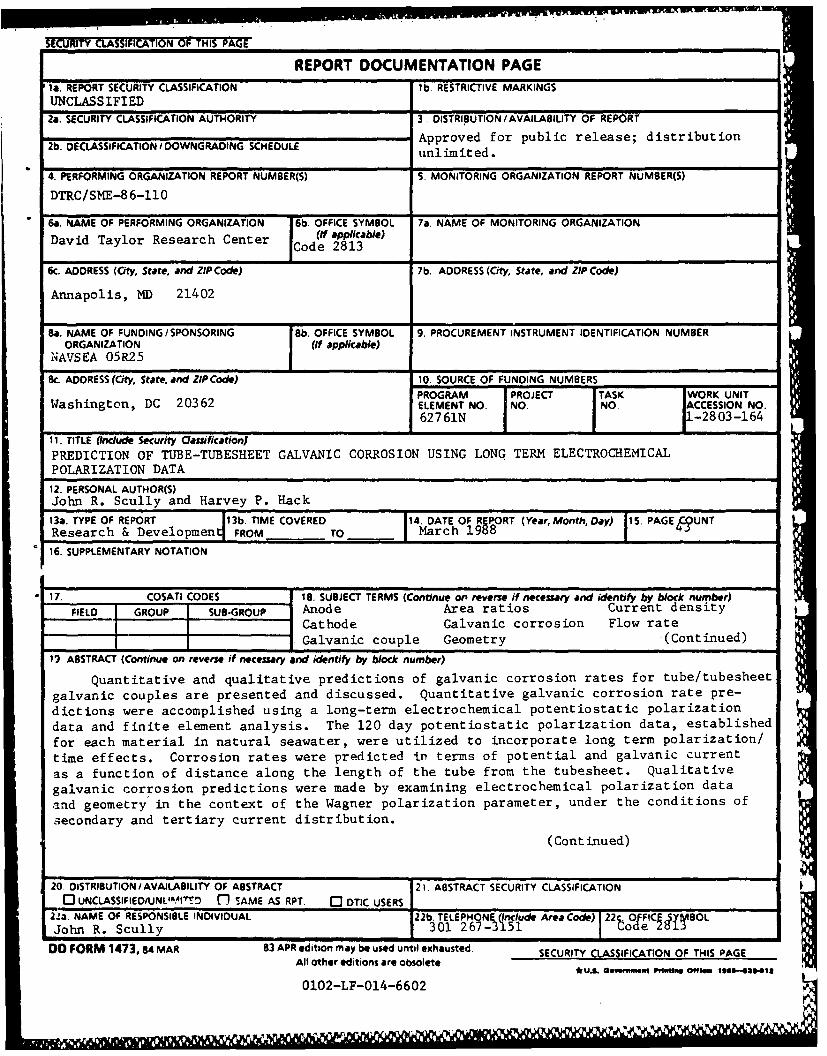
PREDICTION OF TUBE-TUBESHEET GALVANIC CORROSION USING LONG TERM ELECTROCHEMICALPOLARIZATION DATA
12. PERSONAL AUTHOR(S)John R. Scully and Harvey P. Hack
13a. TYPE OF REPORT 13b. TIME COVERED 14. DATE OF REPORT (Year, Month, Day) 15S. PAGE 4r_?UNTResearch & Development FROM TO ____ March 1988
16. SUPPLEMENTARY NOTATION
17. COSATI CODES 18. SUBJECT TERMS (Continue on reverse if necessary and identify by block number)FIELD GROUP SUB-GROUP Anode Area ratios Current density
Cathode Galvanic corrosion Flow rateGalvanic couple Geometry (Continued)
1. ABSTRACT (Continue on reverse if necessary and identify by block number)
Quantitative and qualitative predictions of galvanic corrosion rates for tube/tubesheet
galvanic couples are presented and discussed. Quantitative galvanic corrosion rate pre-dictions were accomplished using a long-term electrochemical potentiostatic polarization
data and finite element analysis. The 120 day potentiostatic polarization data, established
for each material in natural seawater, were utilized to incorporate long term polarization/
time effects. Corrosion rates were predicted in terms of potential and galvanic current
as a function of distance along the length of the tube from the tubesheet. Qualitative
galvanic corrosion predictions were made by examining electrochemical polarization data
and geometry in the context of the Wagner polarization parameter, under the conditions of
secondary and tertiary current distribution.
(Continued)
20 DISTRIBUTION/AVAILABILITY OF ABSTRACT 2). ABSTRACT SECURITY CLASSIFICATION
2 .' N A M E O F R E P O N S B L E N D V D U A L 2 2 b T E L E P H O N E I c u A re a C Z IJohn R. Scully 301 267-3151 o
DO FORM 1473, 84 MAR 83 APR edition may be used until exhausted. SECURITY CLASSIFICATION OF THIS PAGEA ll other ed itions are obso lete u I Ge "W' I I O k a f i -- 3 "I
0102-LF-014-6602
.... A,,r ,,v ' ( , ,V ', ',, _,,' ,,' ,K-
Block 18 (Continued)
Conductivity Concentration polarization primary current distributionPolarization behavior Mass transport Secondary current distributionTafel polarization Tube-tubesheet Tertiary current distribution
Block 19 (Continued)
Seawater exposures of each tube/tubesheet arrangement are compared and contrastedwith the predicted results. These exposures used segmented tubes connected in serieswith zero resistance ammeters. Material combinations exposed included a Monel alloy 400tubesheet coupled to a 90-10 copper-nickel tube, a 90-10 copper-nickel tube coupled to azinc anode at the position of the tubesheet, and a nickel-aluminum-bronze tubesheet coupledto an alloy 625 tube. Analysis was also conducted on a nickel-aluminum-bronze tubesheetcoupled to a titanium 50 tube, and comparisons are made with similar data reported inthe literature.
This paper is directed towards demonstrating the need for accurate electrochemicalpolarization data to get accurate predictions. The feasibility of finite element analysisfor accurate qualitative as well as quantitative galvanic corrosion prediction for thetube/tubesheet configuration is discussed.
Accession1 For
14TIS GRI&IDTIC TAB0
nannouncedJustifioatto
B
-
Distribution/
FDesio ti or
~AvailabilitY CodesU and or
IN S OP - c E ;D i s t S p e o i a lINPECTEIO
4
L2
CONTENTS
Page
ABDSTRTIV INFOR... ATION.........................................................1
ADINOTUCTIN..... TON............................................1
PNRVODUSTO WORK ...................................................... 3
NUMERICAL ANALYSIS FOR GALVANIC CORROSION......................................... 5
EXPERIMENTAL...................................................................... 6
TUBE/TUBESHEET EXPOSURE APPARATUS AND PROCEDURE............................. 6
POLARIZATION PROCEDURES AND REYNOLDS NUMBER COMPARISONS ...................... 6
FINITE ELEMENT ANALYSIS................................................. 7
RESULTS............................................................ 9
ALLOY 625-Ni-Al-BRONZE CONFIGURATION........................................ 9
90-10 Cu-Ni/MONEL ALLOY 400 CONFIGURATION................................... 11
90-10-Ni/ZINC CONFIGURATION ....................................... 13
OTHER MATERIAL COMBINATIONS........................................ 13
DISCUSSION ............. ... o..........o......... .... o.......... 14
QUANTITATIVE PREDICTION BY THE USE OF FINITE ELEMENT ANALYSIS ............... 14
QUALITATIVE PREDICTION BY THE USE OF WAGNER NUMBER ANALYSIS .................. 15
CONCLUSIONS....................................................................... 19
ACKNOWLEDGEMENTS................................................................. 19
REFERENCES........................ ............................................. 35
FIGURES
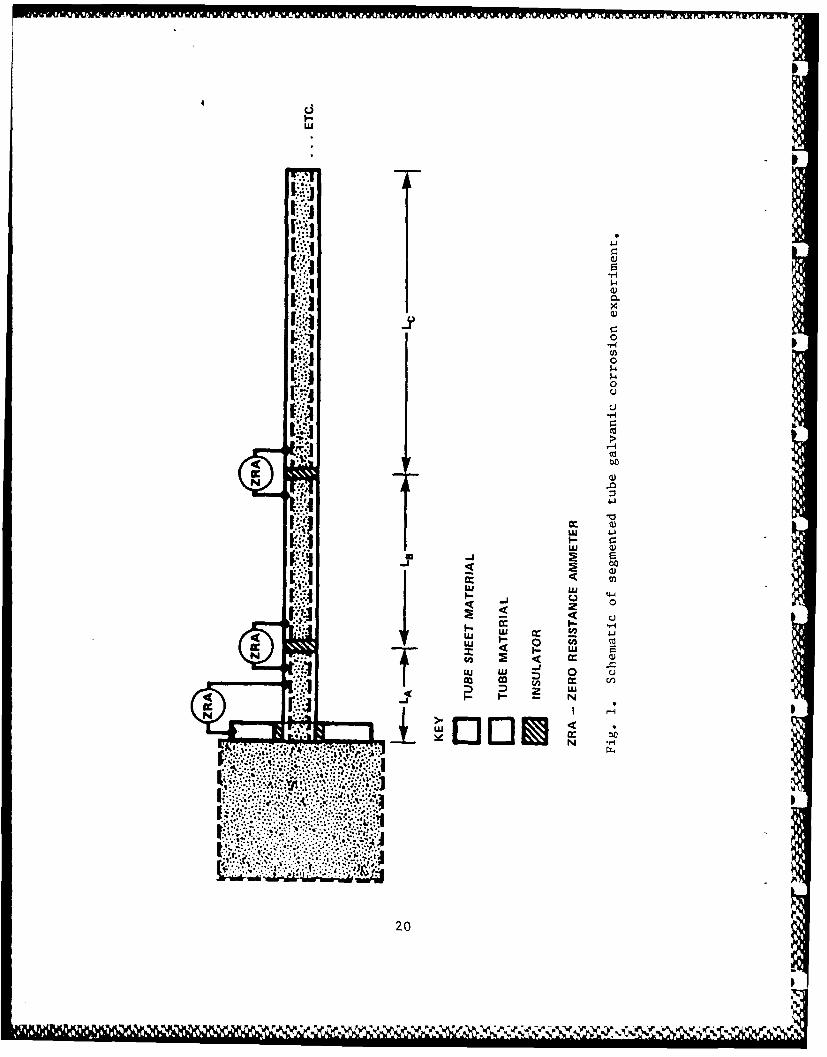
1. Schematic of segmented tube galvanic corrosirnn Pxperiment ..................... 20
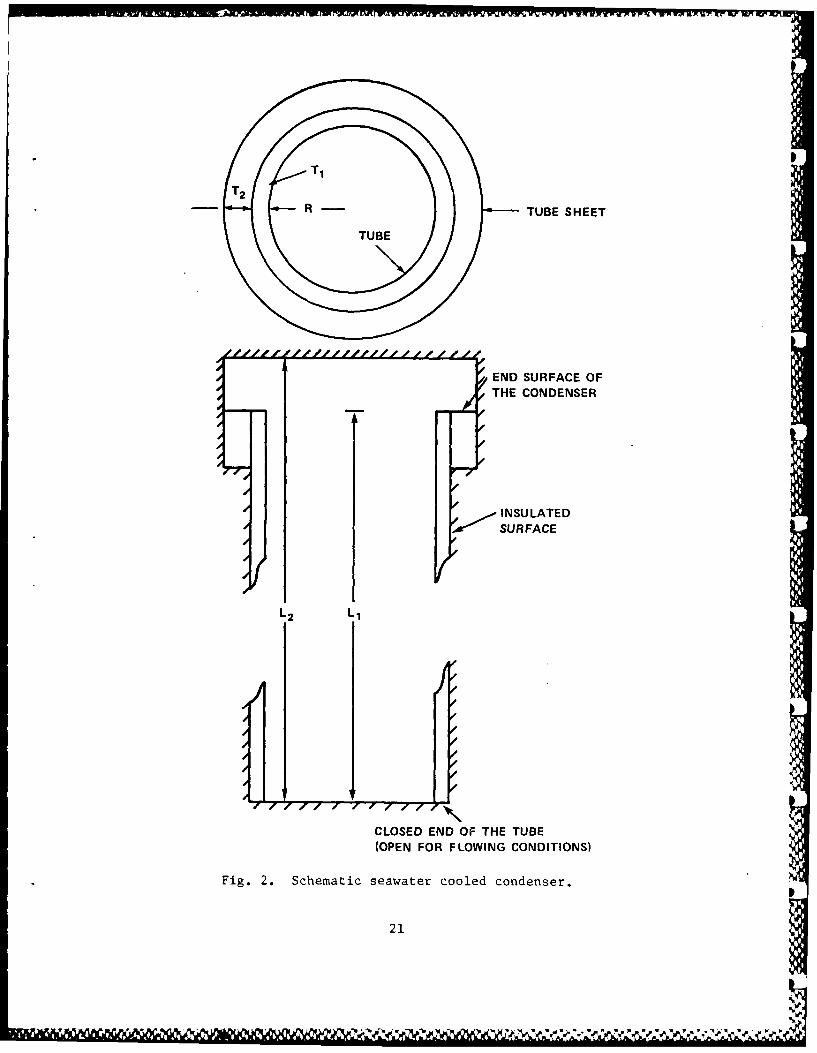
2. Schematic seawater cooled condenser.......................................... 21
FIGURES (Continued)
Page
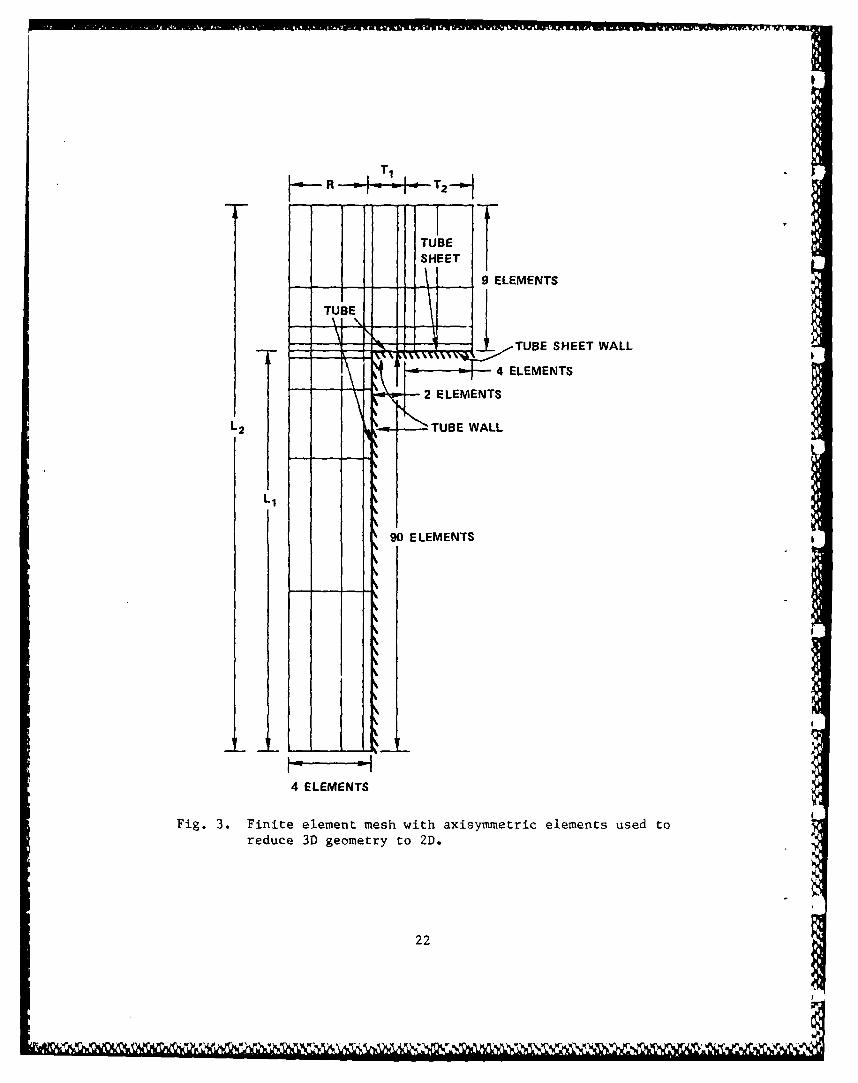
3. Finitie element mesh with axisymmetric elements used to reduce
3D geometry to 2D ......................................................... 22
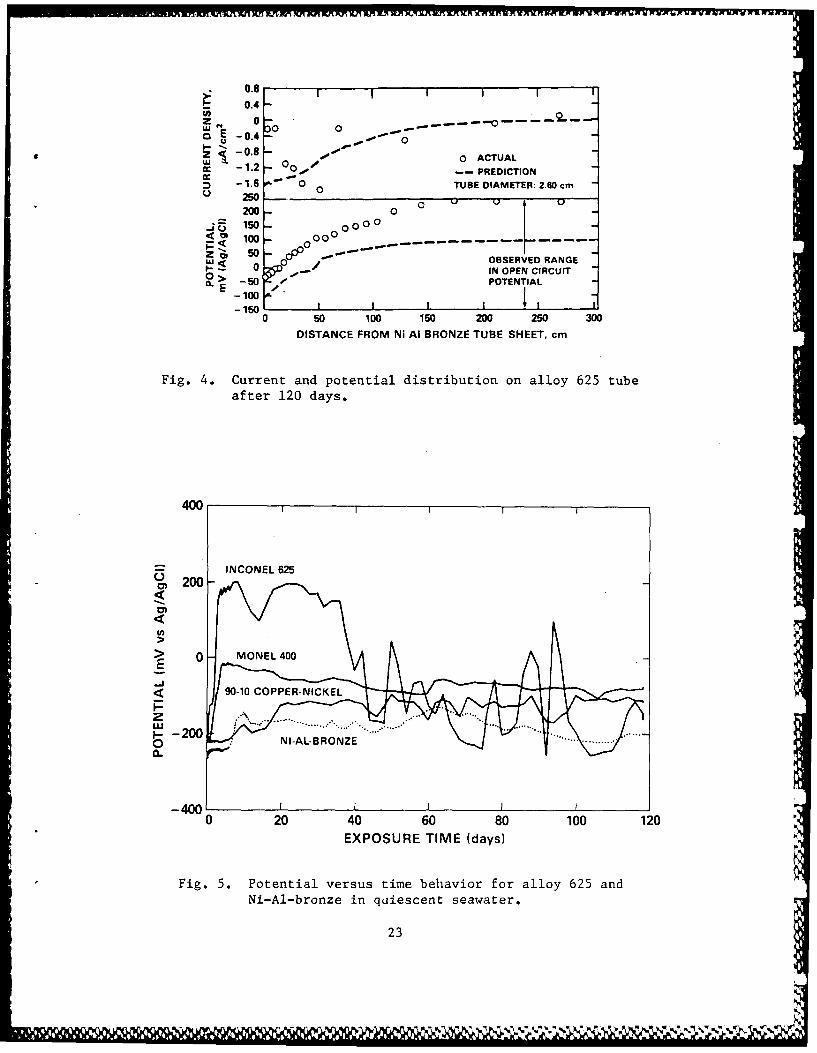
4. Current and potential distribution on alloy 625 tube after
120 days ............................................................. ... 23
5. Potential versus time behavior for alloy 625 and Ni-Al-bronze in
quiescent seawater ......................................................... 23
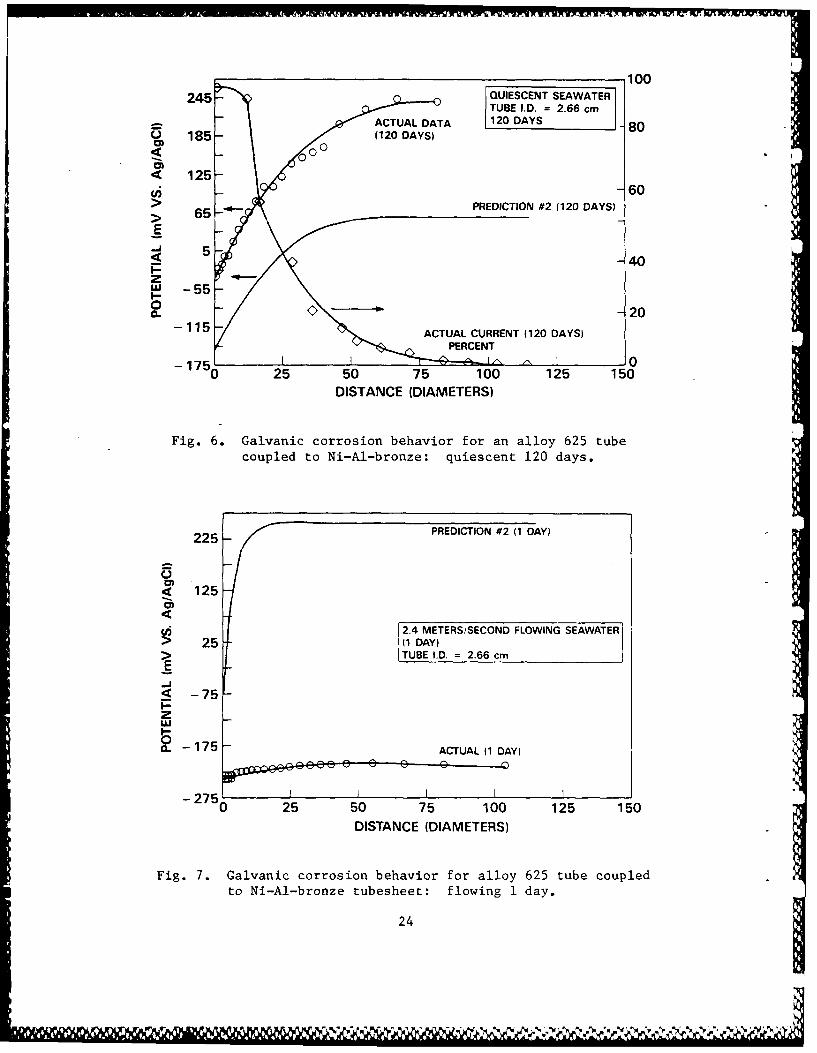
6. Galvanic corrosion behavior for an alloy 625 tube coupled to Ni-Al-
bronze: quiescent 120 days ................................................ 24
7. Galvanic corrosion behavior for alloy 625 tube coupled to Ni-Al-
bronze tubesheet: flowing I day .......................................... 24
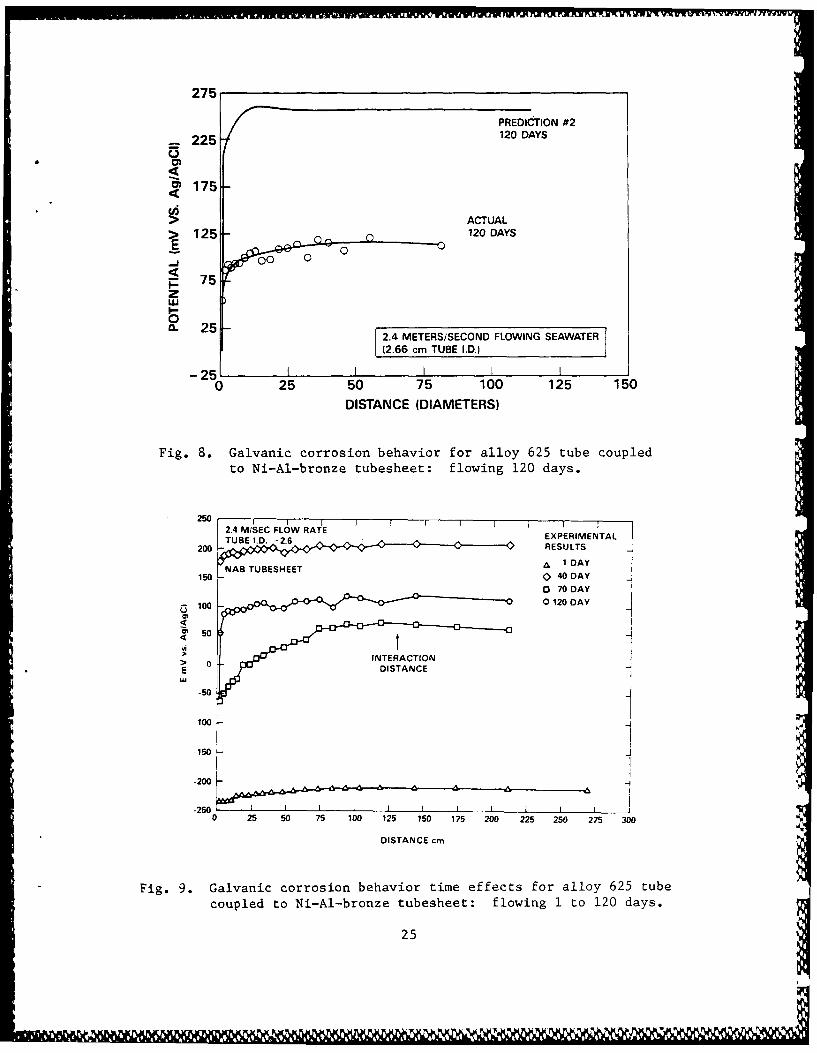
8. Galvanic corrosion behavior for alloy 625 tube coupled to Ni-Al-
bronze tubesheet: flowing 120 days ....................................... 25
9. Galvanic corrosion behavior time effects for alloy 625 tube coupled
to Ni-Al-bronze tubesheet: flowing I to 120 days ....................... 25
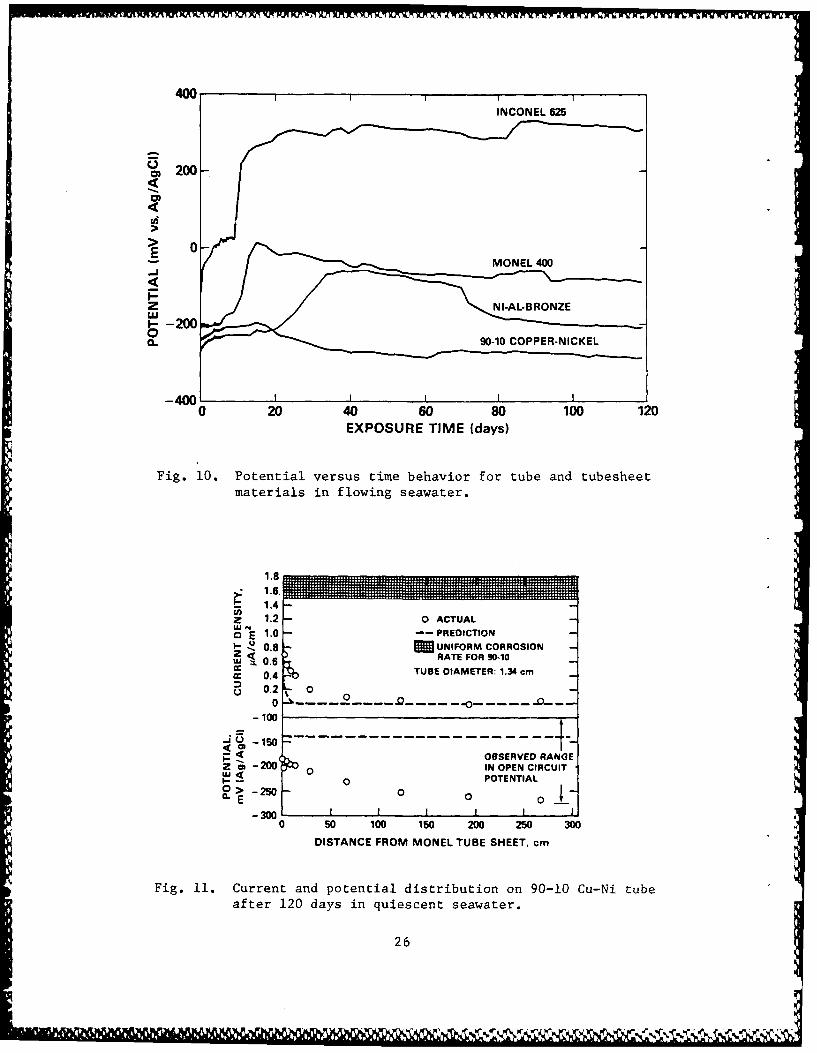
10. Potential versus time behavior for tube and tubesheet materials
in flowing seawater...................................................... 26
11. Current and potential distribution on 90-10 Cu-Ni tube after
120 days in quiescent seawater ............................................ 26
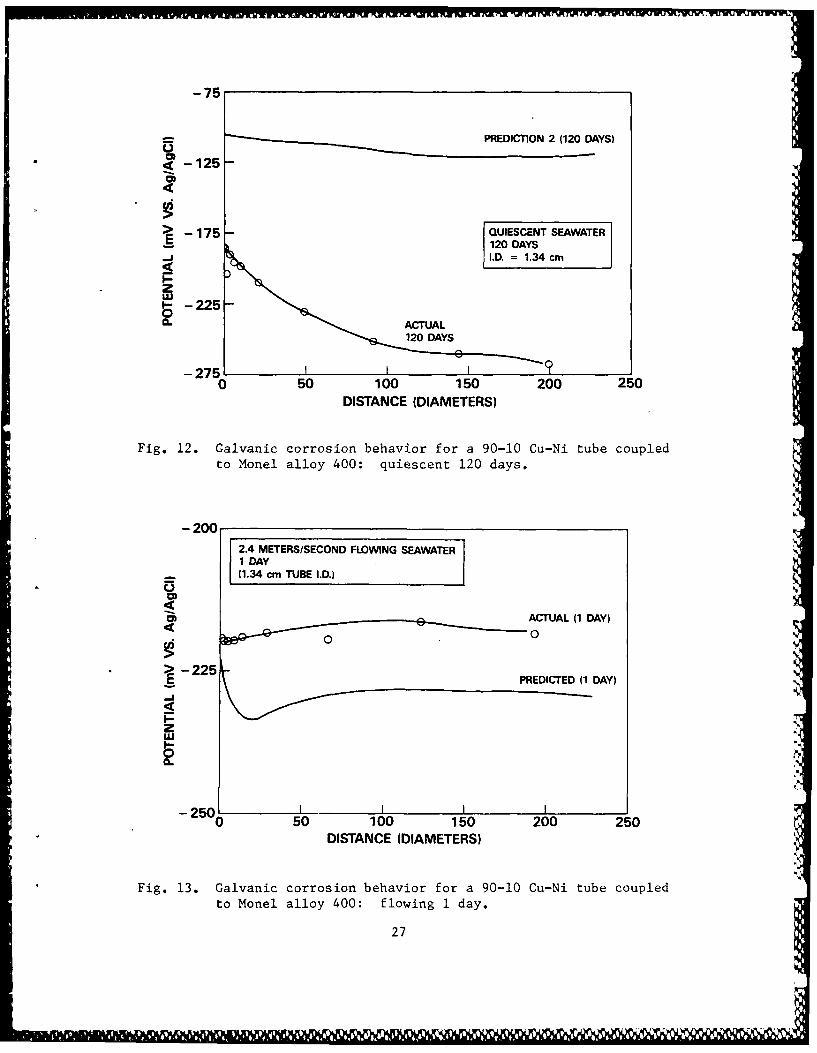
12. Galvanic corrosion behavior for a 90-10 Cu-Ni tube coupled to
Monel alloy 400: quiescent 120 days ........................................ 27
13. Galvanic corrosion behaivor for a 90-10 Cu-Ni tube coupled to
Monel alloy 400: flowing 1 day........................................... 27
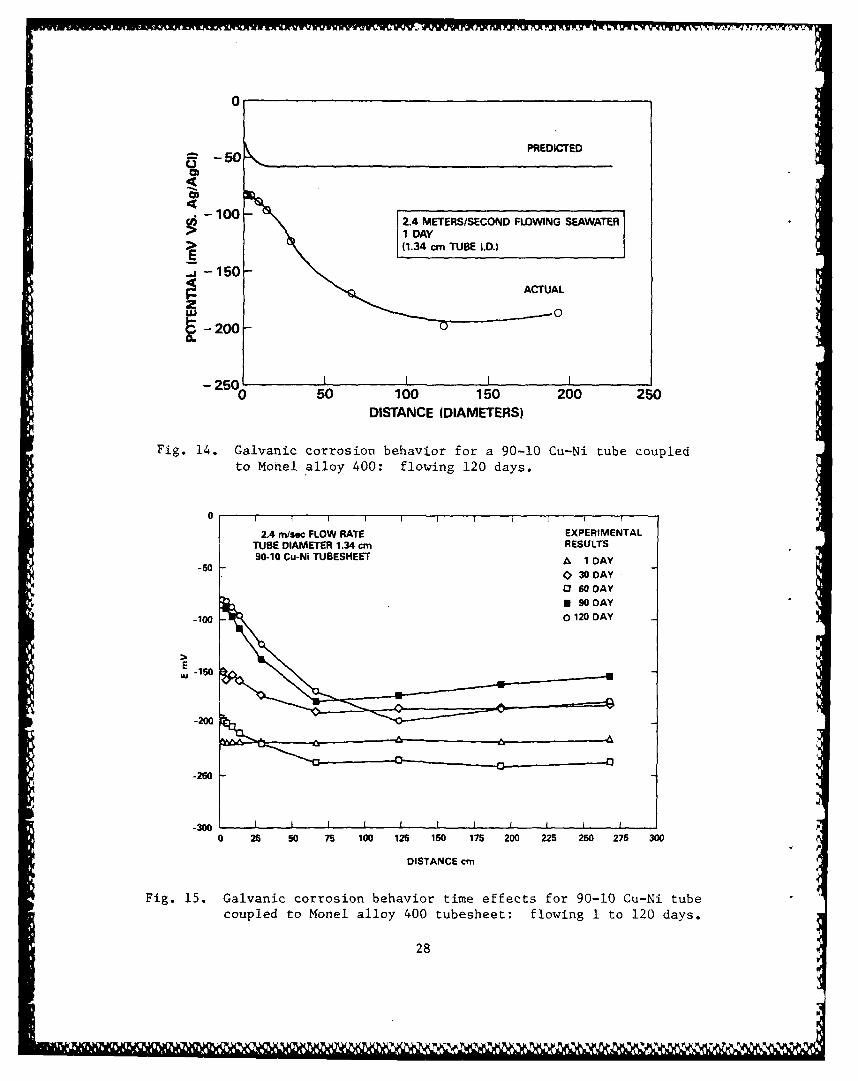
14. Galvanic corrosion behavior for a 90-10 Cu-Ni tube coupled to
Monel alloy 400: flowing 120 days .......................................... 28I
iv
FIGURES (Continued)
Page
15. Galvanic corrosion behavior time effects for 90-10 Cu-Ni
tube coupled to Monel alloy tubesheet: flowing 1 to 120 days ............. 28
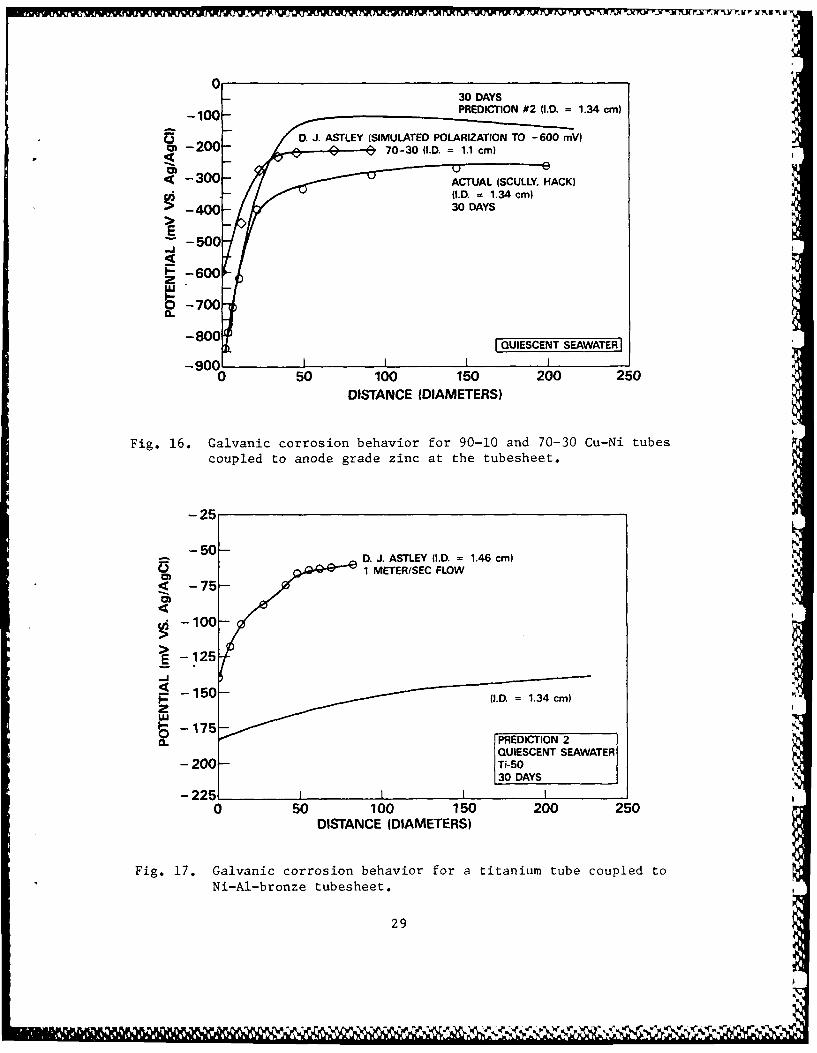
16. Galvanic corrosion behavior for 90-10 and 70-30 Cu-Ni tubes
coupled to anode grade zinc at the tubesheet .............................. 29
17. Galvanic corrosion behavior for a titanium tube coupled to
Ni-Al-bronze tubesheet ....................................................... 29
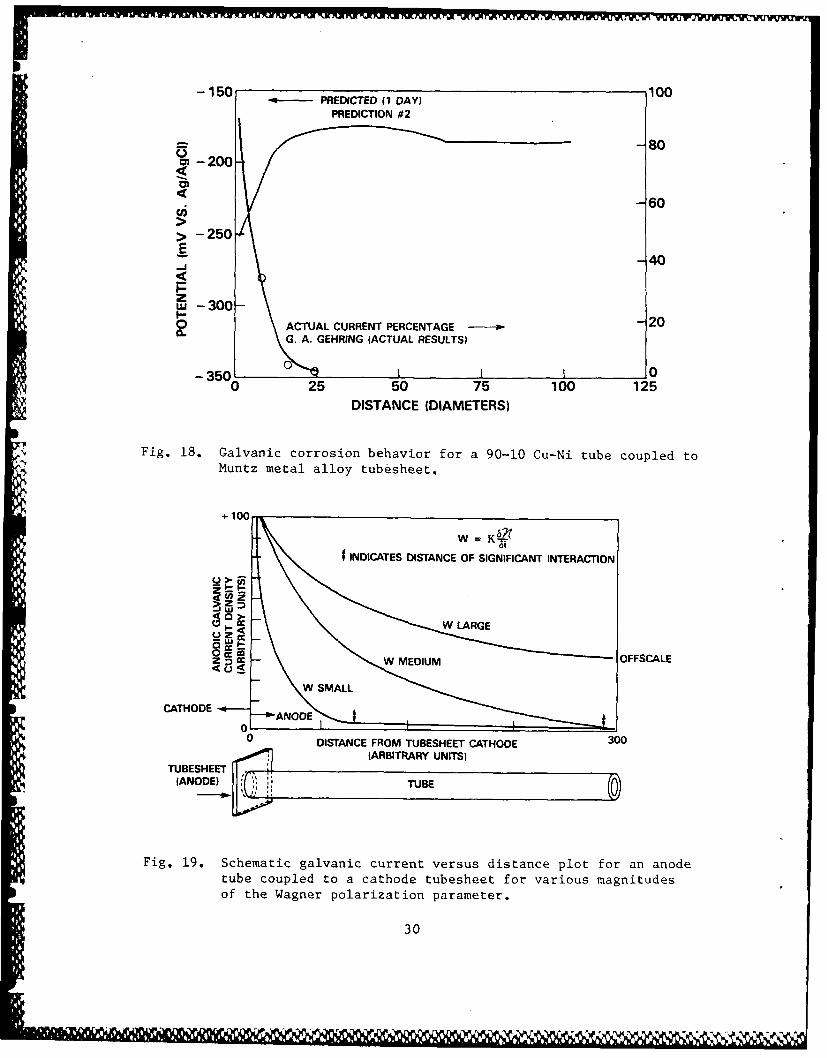
18. Galvanic corrosion behavior for a 90-10 Cu-Ni tube coupled
to Muntz metal alloy tubesheet ............................................... 30
19. Schematic galvanic current versus distance plot for an anode
tube coupled to a cathode tubesheet for various magnitudes of the
Wagner polarization parameter ................... ............................... 30
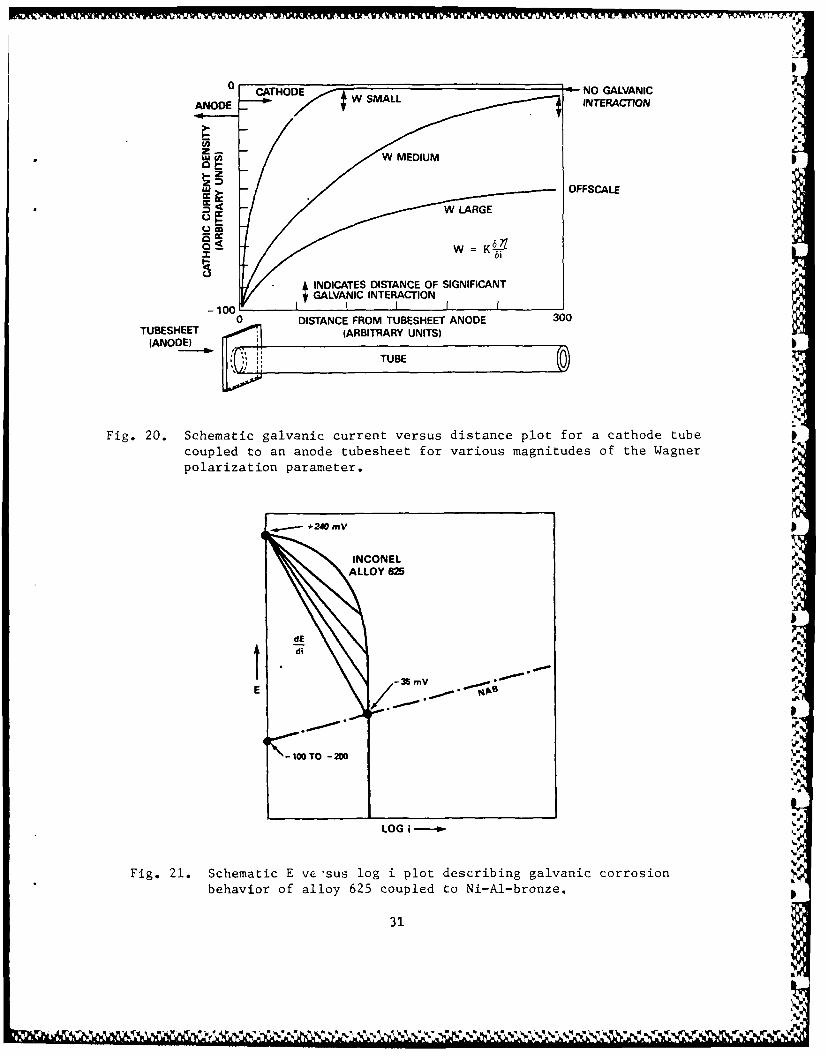
20. Schematic galvanic current versus distance plot for a cathode
o tube coupled to an anode tubesheet for various magnitudes of the
Wagner polarization parameter ................................................ 31
21. Schematic E versus log i plot describing galvanic corrosion
behavior of alloy 625 coupled to Ni-Al bronze ............................. 31
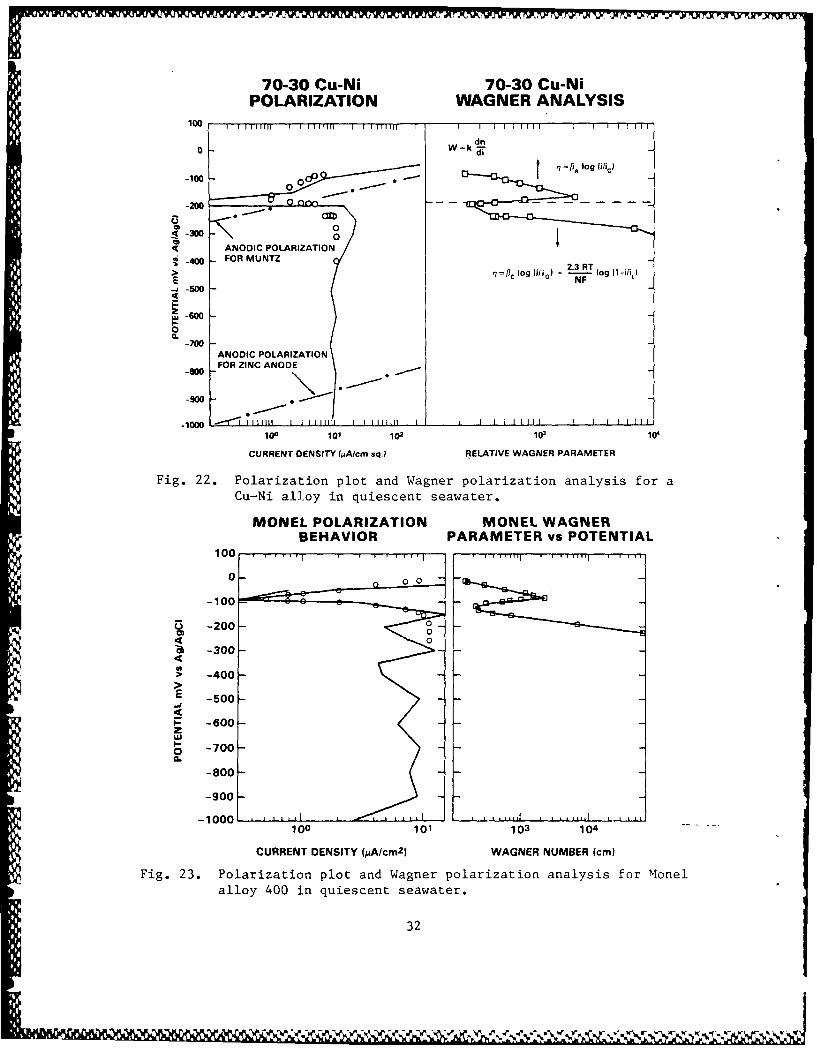
22. Polarization plot and Wagner polarization analysis for a
Cu-Ni alloy in quiescent seawater ............................................ 32
23. Polarization plot and Wagner polarization analysis for Monel
alloy 400 in quiescent seawater .............................................. 32
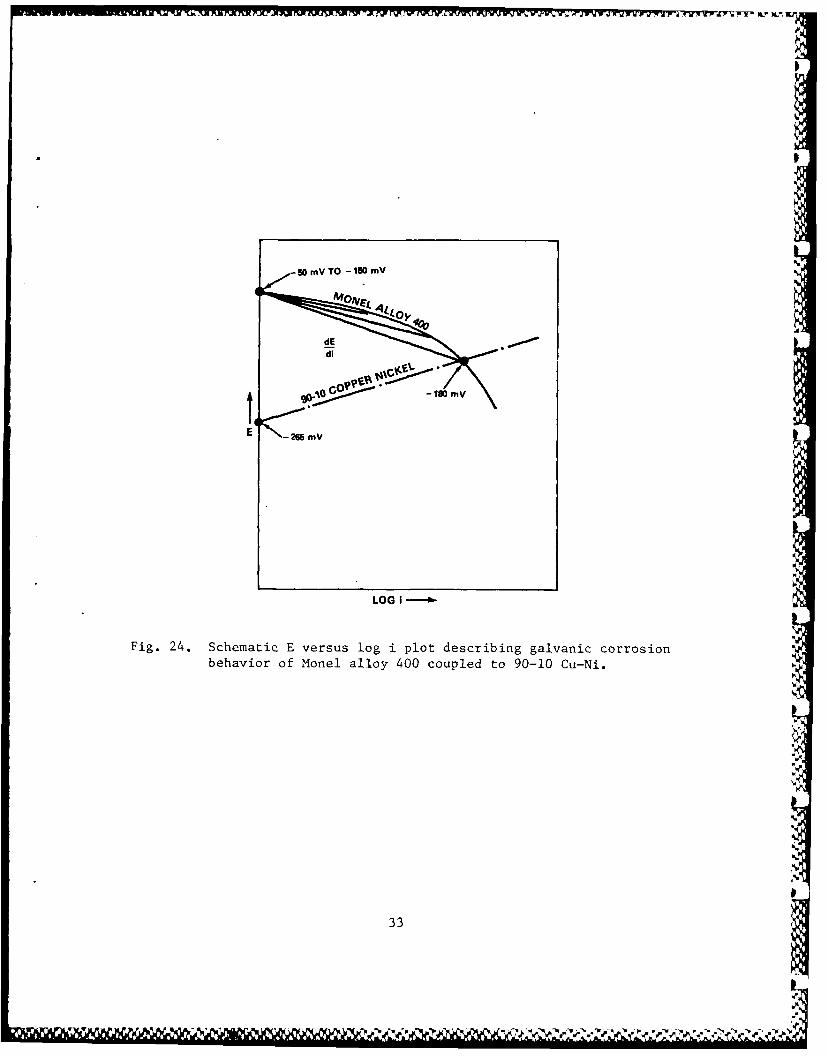
24. Schematic E versus log i plot describing galvanic corrosion
behavior of Monel alloy 400 coupled to 90-10 Cu-Ni ........................ 33
V
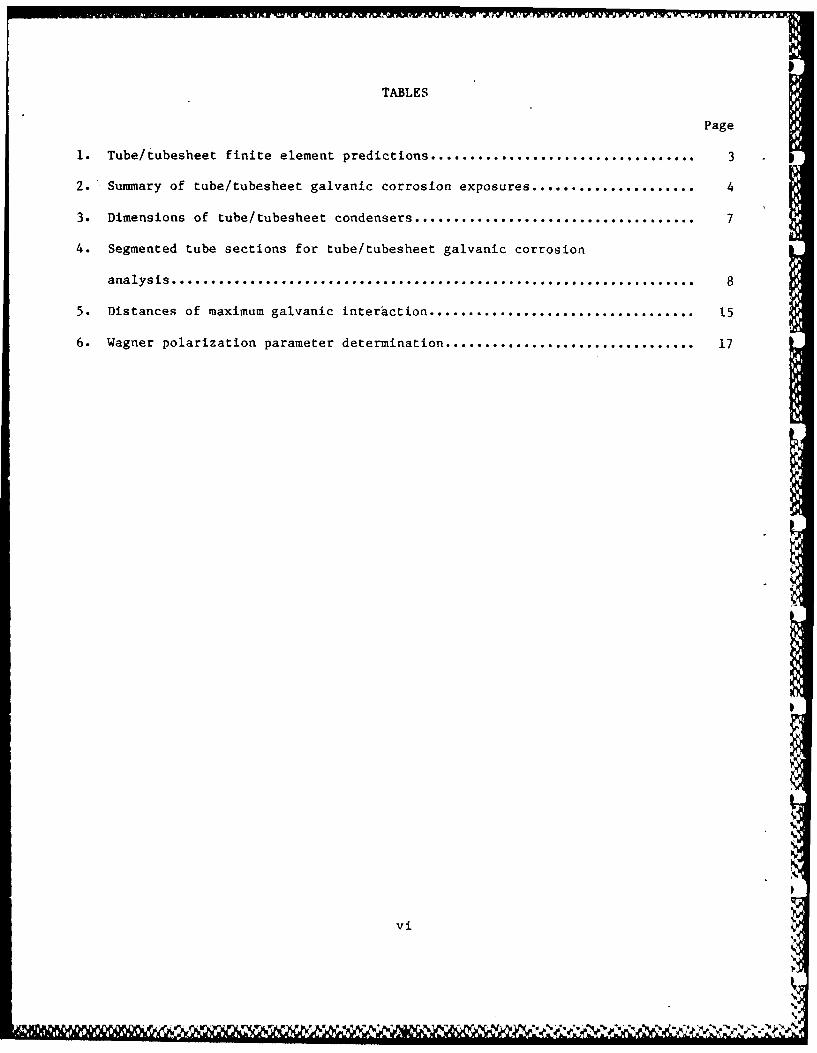
TABLE S
Page
1. Tube/tubesheet finite element predictions.................................... 3-
2.- Summary of tube/tubesheet galvanic corrosion exposures ........................ 4
3. Dimensions of tube/tubesheet condensers...................................... 7
4. Segmented tube sections for tube/tubesheet galvanic corrosion
analysis...................................................................... 8
5. Distances of maximum galvanic interaction.................................... 15
6. Wagner polarization parameter determination.................................. 17
vi
%'
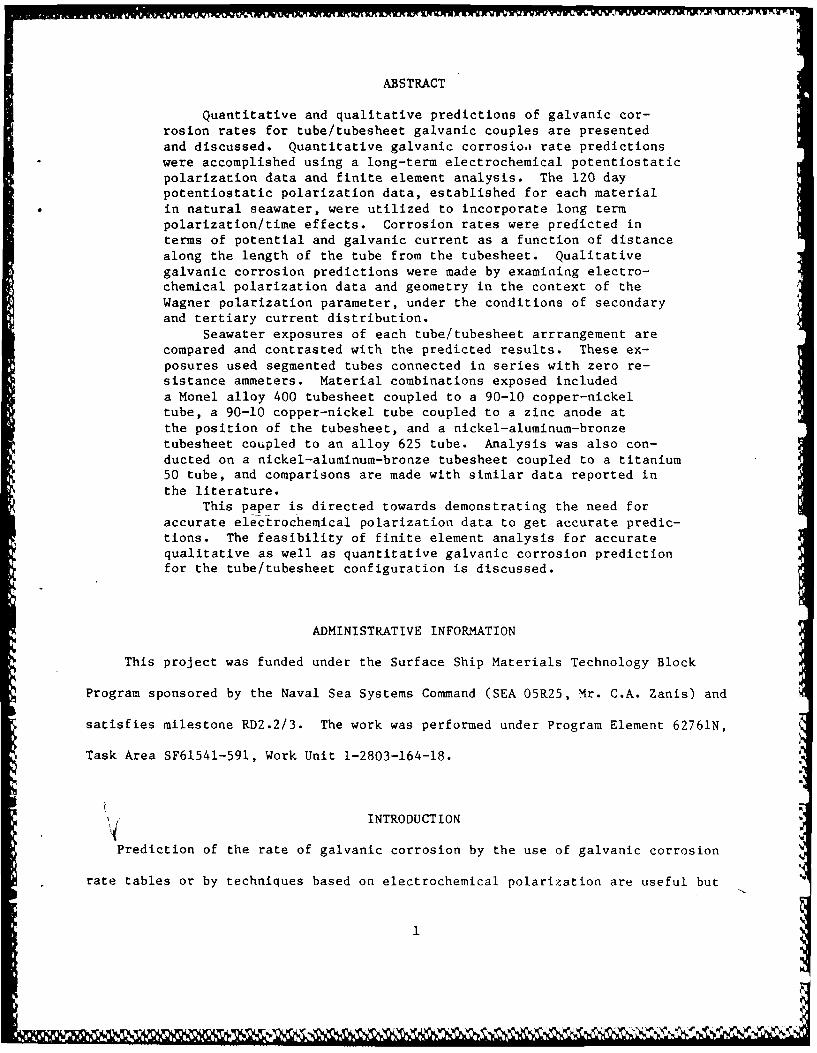
ABSTRACT
Quantitative and qualitative predictions of galvanic cor-
rosion rates for tube/tubesheet galvanic couples are presented
and discussed. Quantitative galvanic corrosioa rate predictionswere accomplished using a long-term electrochemical potentiostatic
polarization data and finite element analysis. The 120 daypotentiostatic polarization data, established for each material
in natural seawater, were utilized to incorporate long term
polarization/time effects. Corrosion rates were predicted interms of potential and galvanic current as a function of distance
along the length of the tube from the tubesheet. Qualitative
galvanic corrosion predictions were made by examining electro-chemical polarization data and geometry in the context of theWagner polarization parameter, under the conditions of secondary
and tertiary current distribution.Seawater exposures of each tube/tubesheet arrrangement are
compared and contrasted with the predicted results. These ex-posures used segmented tubes connected in series with zero re-
sistance ammeters. Material combinations exposed includeda Monel alloy 400 tubesheet coupled to a 90-10 copper-nickeltube, a 90-10 copper-nickel tube coupled to a zinc anode at
the position of the tubesheet, and a nickel-aluminum-bronzetubesheet coupled to an alloy 625 tube. Analysis was also con-
ducted on a nickel-aluminum-bronze tubesheet coupled to a titanium50 tube, and comparisons are made with similar data reported inthe literature.
This paper is directed towards demonstrating the need foraccurate electrochemical polarization data to get accurate predic-tions. The feasibility of finite element analysis for accurate
qualitative as well as quantitative galvanic corrosion predictionfor the tube/tubesheet configuration is discussed.
ADMINISTRATIVE INFORMATION
This project was funded under the Surface Ship Materials Technology Block
Program sponsored by the Naval Sea Systems Command (SEA 05R25, Mr. C.A. Zanis) and
satisfies milestone RD2.2/3. The work was performed under Program Element 62761N,
Task Area SF61541-591, Work Unit 1-2803-164-18.
INTRODUCTION
Prediction of the rate of galvanic corrosion by the use of galvanic corrosion
rate tables or by techniques based on electrochemical polarization are useful but
1
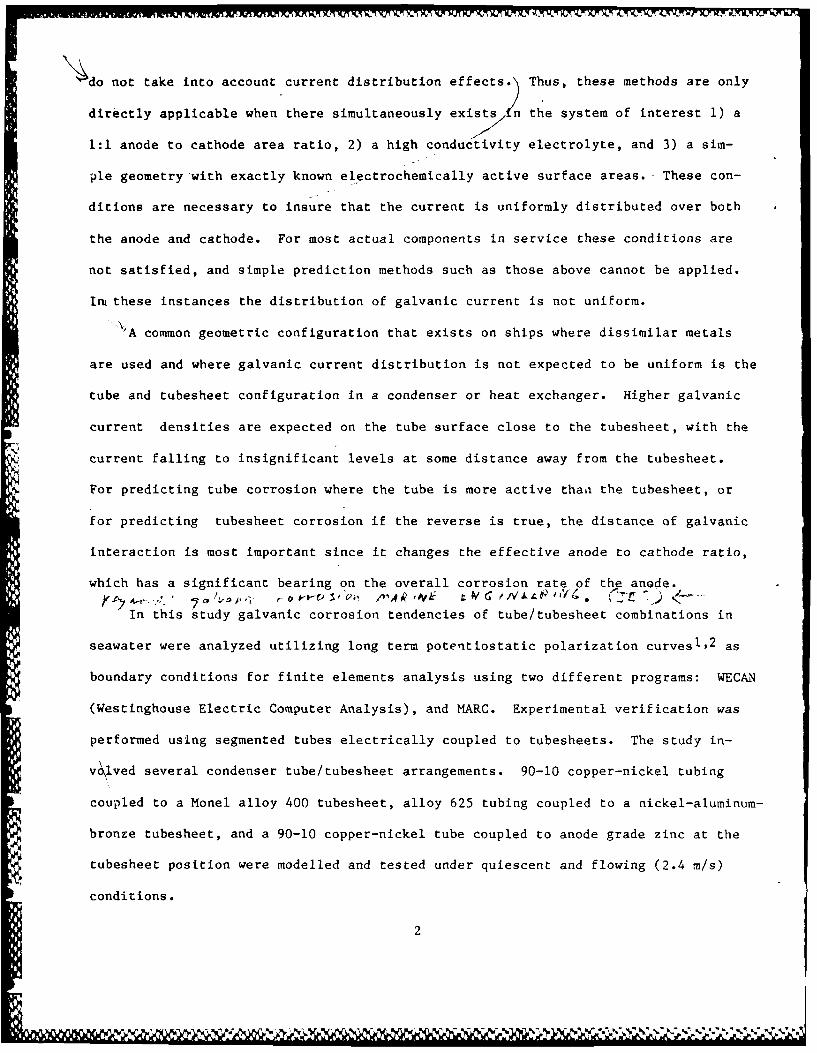
\_ do not take into account current distribution effects.) Thus, these methods are only
directly applicable when there simultaneously exists (K1 the system of interest 1) a
1:1 anode to cathode area ratio, 2) a high c-onduc'tivity electrolyte, and 3) a sim-
pie geometry with exactly known electrochemically active surface areas.- These con-
ditions are necessary to insure that the current is uniformly distributed over both
the anode and cathode. For most actual components in service these conditions are
not satisfied, and simple prediction methods such as those above cannot be applied.
In% these instances the distribution of galvanic current is not uniform.
-A common geometric configuration that exists on ships where dissimilar metals
are used and where galvanic current distribution is not expected to be uniform is the
tube and tubesheet configuration in a condenser or heat exchanger. Higher galvanic
current densities are expected on the tube surface close to the tubesheet, with the
current falling to insignificant levels at some distance away from the tubesheet.
For predicting tube corrosion where the tube is more active than the tubesheet, or
for predicting tubesheet corrosion if the reverse is true, the distance of galvanic
interaction is most important since it changes the effective anode to cathode ratio,
which has a significant bearing on the overall corrosion rate of the anode.
In this study galvanic corrosion tendencies of tube/tubesheet combinations in
seawater were analyzed utilizing long term potentiostatic polarization curvesl, 2 as
boundary conditions for finite elements analysis using two different programs: WECAN
(Westinghouse Electric Computer Analysis), and MARC. Experimental verification was
performed using segmented tubes electrically coupled to tubesheets. The study in-
volved several condenser tube/tubesheet arrangements. 90-10 copper-nickel tubing
coupled to a Monel alloy 400 tubesheet, alloy 625 tubing coupled to a nickel-aluminum-
bronze tubesheet, and a 90-10 copper-nickel tube coupled to anode grade zinc at the
tubesheet position were modelled and tested under quiescent and flowing (2.4 m/s)
conditions.
2
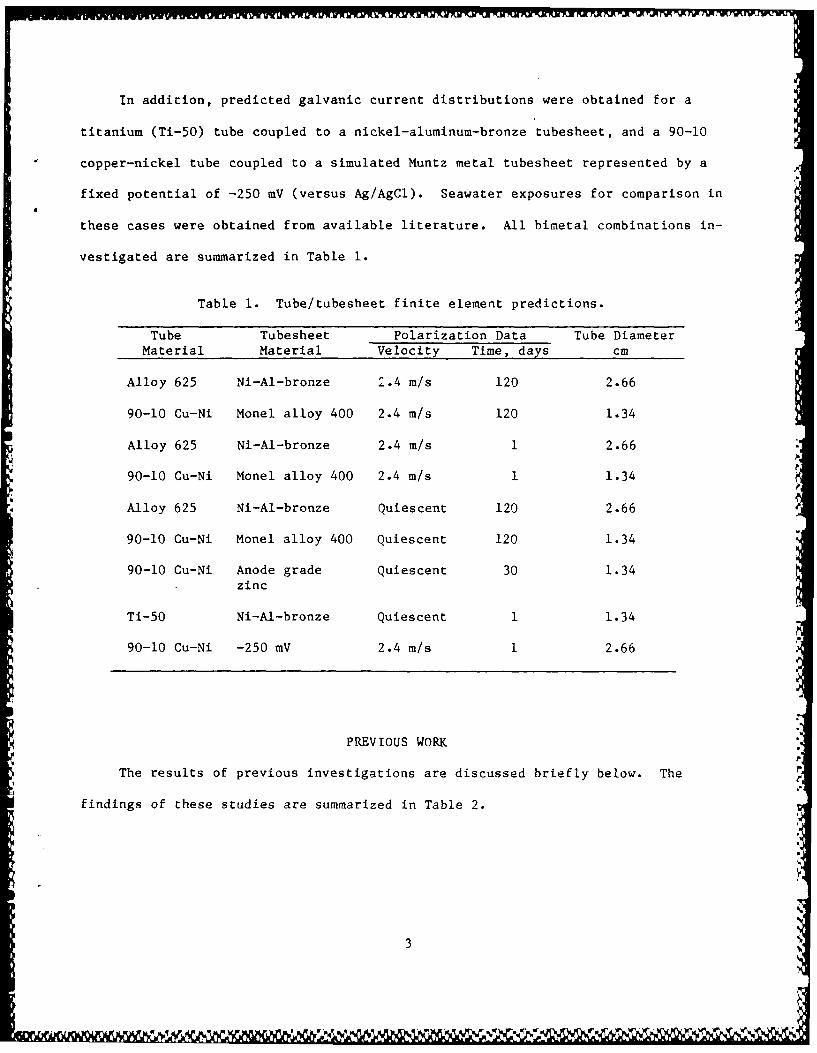
In addition, predicted galvanic current distributions were obtained for a
titanium (Ti-50) tube coupled to a nickel-aluminum-bronze tubesheet, and a 90-10
copper-nickel tube coupled to a simulated Muntz metal tubesheet represented by a
fixed potential of -250 mV (versus Ag/AgCl). Seawater exposures for comparison in
these cases were obtained from available literature. All bimetal combinations in-
vestigated are summarized in Table 1.
Table 1. Tube/tubesheet finite element predictions.
Tube Tubesheet Polarization Data Tube DiameterMaterial Material Velocity Time, days cm
Alloy 625 Ni-Al-bronze 2.4 m/s 120 2.66
90-10 Cu-Ni Monel alloy 400 2.4 m/s 120 1.34
Alloy 625 Ni-Al-bronze 2.4 m/s 1 2.66
90-10 Cu-Ni Monel alloy 400 2.4 m/s 1 1.34
Alloy 625 Ni-Al-bronze Quiescent 120 2.66
90-10 Cu-Ni Monel alloy 400 Quiescent 120 1.34
90-10 Cu-Ni Anode grade Quiescent 30 1.34zinc
Ti-50 Ni-Al-bronze Quiescent 1 1.34
90-10 Cu-Ni -250 mV 2.4 m/s 1 2.66
PREVIOUS WORK
The results of previous investigations are discussed briefly below. The
findings of these studies are summarized in Table 2.
3
I I I I
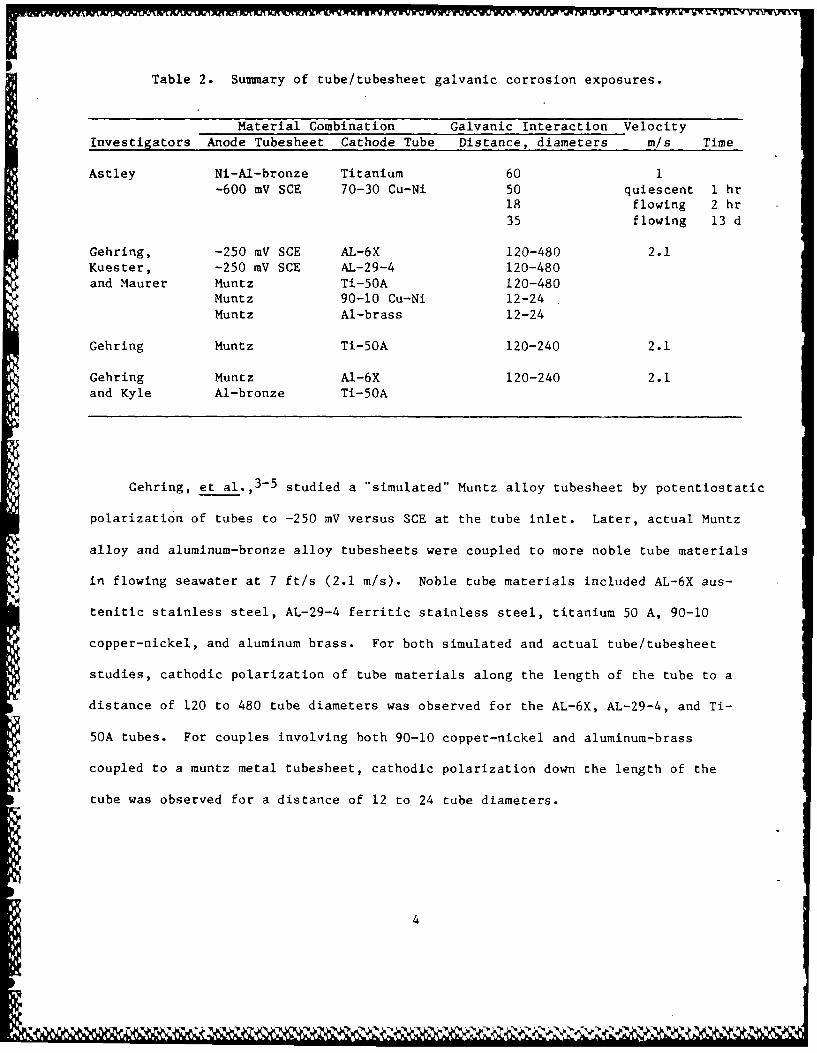
Table 2. Summary of tube/tubesheet galvanic corrosion exposures.
Material Combination Galvanic Interaction VelocityInvestigators Anode Tubesheet Cathode Tube Distance, diameters r/s Time
Astley Ni-Al-bronze Titanium 60 1-600 mV SCE 70-30 Cu-Ni 50 quiescent I hr
18 flowing 2 hr35 flowing 13 d
Gehring, -250 mV SCE AL-6X 120-480 2.1Kuester, -250 mV SCE AL-29-4 120-480and Maurer Muntz Ti-50A 120-480
Muntz 90-10 Cu-Ni 12-24Muntz Al-brass 12-24
Gehring Muntz Ti-50A 120-240 2.1
Gehring Muntz AI-6X 120-240 2.1and Kyle Al-bronze Ti-50A
Gehring, et al., 3- 5 studied a "simulated" Muntz alloy tubesheet by potentiostatic
polarization of tubes to -250 mV versus SCE at the tube inlet. Later, actual Muntz
alloy and aluminum-bronze alloy tubesheets were coupled to more noble tube materials
in flowing seawater at 7 ft/s (2.1 m/s). Noble tube materials included AL-6X aus-
tenitic stainless steel, AL-29-4 ferritic stainless steel, titanium 50 A, 90-10
copper-nickel, and aluminum brass. For both simulated and actual tube/tubesheet
studies, cathodic polarization of tube materials along the length of the tube to a
distance of 120 to 480 tube diameters was observed for the AL-6X, AL-29-4, and Ti-
50A tubes. For couples involving both 90-10 copper-nickel and aluminum-brass
coupled to a muntz metal tubesheet, cathodic polarization down the length of the
tube was observed for a distance of 12 to 24 tube diameters.
4
-36
D.J. Astley studied a titanium tube coupled to a nickel-aluminum-bronze plate
in seawater flowing at 1 m/s. 6 The length of titanium tube that was cathodically
polarized was 60 tube diameters. In a separate study, a 70-30 copper-nickel tube was
potentiostatically polarized to -600 mV at the tube inlet, simulating cathodic pro-
tection. Under quiescent conditions the length of tube receiving cathodic polariza-
tion after one hour was 50 tube diameters. Under flowing conditions after two hours,
the length of tube receiving cathodic polarization was 18 tube diameters, but in-
creased to 35 diameters after 13 days.
In summary, the galvanic interaction distance from all studies was found to vary
from several tube diameters to several hundred depending upon the materials' polariza-
tion behavior, the geometry, and the electrolyte.
NUMBERICAL ANALYSIS FOR GALVANIC CORROSION
Use of finite element and boundary element techniques has shown great promise
for predicting potential and current distributions for galvanic corrosion, crevice
corrosion, and cathodic protection. 7 -1 4 These techniques are computationally intense,
and require powerful computing capabilities for all but the most simple geometries.
They require as input the geometry of the configuration of interest and the con-
ductivity of the electrolyte through which current flows. Boundary conditions on
free or insulated surfaces are that current cannot flow through the surface, creating
a "reflection" effect. At metal surfaces, the polarization characteristics of the
metal involved, at the approprieate flow and exposure duration, are used as the
boundary conditions. Output from these analyses are potential and current density as
a function of position along the structure.
The intent of this study is to demonstrate that tube/tubesheet galvanic corrosion
behavior as predicted by finite element analysis depends significantly on the accuracy
of long term polarization data and open circuit potentials used for each material in
the couple, as well as on the geometry and solution conductivity.
5
It
EXPERIMENTAL
TUBE/TUBESHEET EXPOSURE APPARATUS AND PROCEDURE
Two tube/tubesheet combinations were tested, both at quiescent and under flowing
(2.4 m/s) conditions. The tubesheet was simulated by a ring of material mounted
around,-but insulated from, the tube end. This ring was coated on all surfaces ex-
cept that surface which would face the waterbox in a real condenser. The tube was cut
into segments, each insulated from the others, which were shortest close to the tube-
sheet. The tube segments were electrically connected to each other and to the tube-
sheet ring with zero-resistance ammeters. Holes were drilled through the tube wall
periodically to facilitate installation of micro-reference electrodes for potential
measurements. Natural seawater, filtered and maintained at 25*C, was placed in
contact with the inside of the tube and the uncoated face of the tubesheet. Cur-
rent and potential profiles were recorded regularly over a 120 day period. At the
conclusion of the quiescent exposure of the copper-nickel tube, this tube was con-
nected to a sacrificial zinc anode and the new current and potential profiles mon-
itored over an additional 30 days under quiescent conditions. The experimental set-
up is illustrated in Figs. 1 and 2. The two material combinations used were: Alloy
625 tube with Ni-Al-bronze tubesheet, and 90-10 Cu-Ni tube with Monel alloy 400
tubesheet. Dimensions of the tubes and tubesheet rings are listed in Table 3, and
the dimensions of the tube segments are listed in Table 4.
POLARIZATION PROCEDURES AND REYNOLDS NUMBER COMPARISONS
Data from 120 day polarization experiments on condenser materials in natural sea-
water, as described elsewherel 2 were utilized as boundary conditions in the finite
element analysis programs. In that study, individual samples were held at a constant
potential for 120 days. Applied currents were monitored for the duration of the ex-
posure. In the case of the 2.4 m/s flowing seawater polarization data, a Reynolds
6
number of 30500 was obtained, indicative of turbulent conditions. For the 1.34-cm-
diampter-tube configuration described above, an approximately identical Reynolds num-
ber was obtained. For the case of the 2.66-cm-diameter tube described above, a some-
what different Reynolds number was obtained, however turbulent flow was still main-
tained. In addition the maximum change in Nusselt number was estimated to be less
than 1.75. This indicates that mass transport conditions are quite similar.
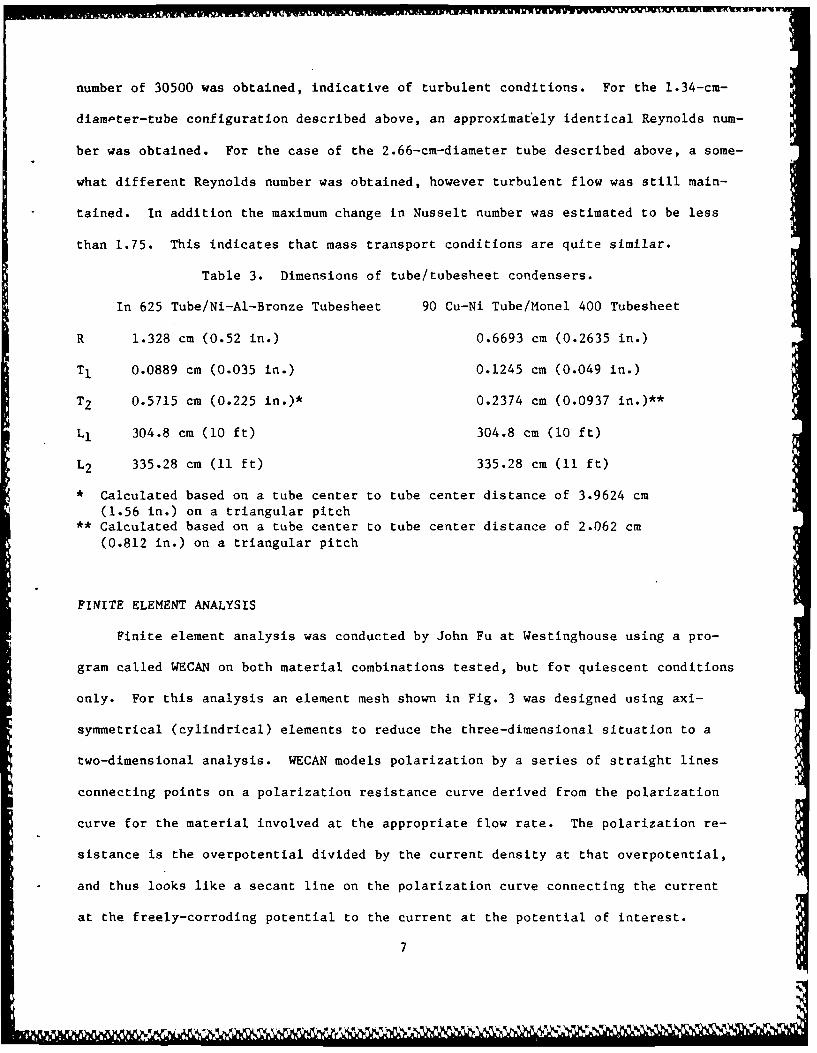
Table 3. Dimensions of tube/tubesheet condensers.
In 625 Tube/Ni-Al-Bronze Tubesheet 90 Cu-Ni Tube/Monel 400 Tubesheet
R 1.328 cm (0.52 in.) 0.6693 cm (0.2635 in.)
TI 0.0889 cm (0.035 in.) 0.1245 cm (0.049 in.)
T2 0.5715 cm (0.225 in.)* 0.2374 cm (0.0937 in.)**
L1 304.8 cm (10 ft) 304.8 cm (10 ft)
L2 335.28 cm (11 ft) 335.28 cm (11 ft)
* Calculated based on a tube center to tube center distance of 3.9624 cm
(1.56 in.) on a triangular pitch** Calculated based on a tube center to tube center distance of 2.062 cm
(0.812 in.) on a triangular pitch
FINITE ELEMENT ANALYSIS
Finite element analysis was conducted by John Fu at Westinghouse using a pro-
gram called WECAN on both material combinations tested, but for quiescent conditions
only. For this analysis an element mesh shown in Fig. 3 was designed using axi-
symmetrical (cylindrical) elements to reduce the three-dimensional situation to a
two-dimensional analysis. WECAN models polarization by a series of straight lines
connecting points on a polarization resistance curve derived from the polarization
curve for the material involved at the appropriate flow rate. The polarization re-
sistance is the overpotential divided by the current density at that overpotential,
and thus looks like a secant line on the polarization curve connecting the current
at the freely-corroding potential to the current at the potential of interest.
7
.. . . . . . ..
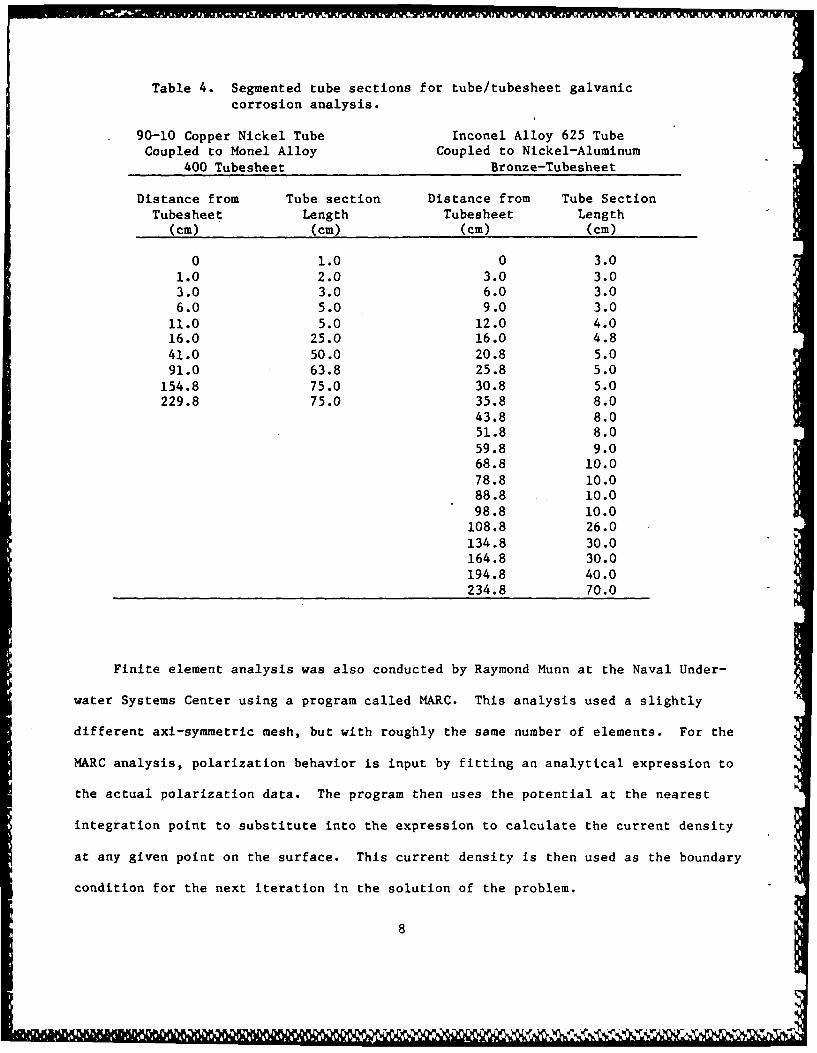
Table 4. Segmented tube sections for tube/tubesheet galvaniccorrosion analysis.
90-10 Copper Nickel Tube Inconel Alloy 625 TubeCoupled to Monel Alloy Coupled to Nickel-Aluminum
400 Tubesheet Bronze-Tubesheet
Distance from Tube section Distance from Tube SectionTubesheet Length Tubesheet Length
(cm) (cm) (cm) (cm)
0 1.0 0 3.01.0 2.0 3.0 3.03.0 3.0 6.0 3.06.0 5.0 9.0 3.0
11.0 5.0 12.0 4.016.0 25.0 16.0 4.841.0 50.0 20.8 5.091.0 63.8 25.8 5.0
154.8 75.0 30.8 5.0229.8 75.0 35.8 8.0
43.8 8.051.8 8.059.8 9.068.8 10.078.8 10.0
88.8 10.098.8 10.0108.8 26.0134.8 30.0164.8 30.0194.8 40.0234.8 70.0
Finite element analysis was also conducted by Raymond Munn at the Naval Under-
water Systems Center using a program called MARC. This analysis used a slightly
different axi-symmetric mesh, but with roughly the same number of elements. For the
MARC analysis, polarization behavior is input by fitting an analytical expression to
the actual polarization data. The program then uses the potential at the nearest
integration point to substitute into the expression to calculate the current density
at any given point on the surface. This current density is then used as the boundary
condition for the next iteration in the solution of the problem.
8 IIII % A .... ...
RE SULTS
ALLOY 625-Ni-Al-BRONZE CONFIGURATION
The WECAN analysis for the 120 day quiescent case is compared to 120 day ex-
perimental data in Fig. 4. There is considerable scatter in the current densities
measured, probably due to crevice corrosion of the alloy 625 observed at the con-
clusion of the test. Considering the scatter, agreement is good between predicted
and measured current densities. Qualitative agreement of potential data was con-
sidered to be good for the following reason. The interaction distance, the distance
after which the effect of the tubesheet on potential and current is minimal, is sim-
ilar between the predicted and measured data. This distance is about 150 cm, which
is about 60-tube-diameters. Therefore, it can be concluded that a large area of
cathode is present in this case. A large corrosion rate was predicted for the
Ni-Al-bronze and this finding was actually observed once the cell was disassembled.
There is, however, some difference between the actual potentials observed and those
predicted. This is because the polarization data utilized in the analysis does not
have the same open circuit potential for the alloy 625 as the tube material, thus
shifting the whole predicted curve below the measured data. Figure 5 illustrates
the potential versus time behavior for alloy 625 in quiescent seawater. Note the
fluctuations possible even for one sample in quiescent seawater. These fluctuations
were considered to be an indication of localized corrosion which was later observed.
The MARC analysis for the 120 day quiescent case is shown in Fig. 6. Since the
same polarization data was used in this analysis, the same difficulty in the predic-
tion of potential exists. In spite of this, the interaction distance is about 60
diameters, in agreement with the WECAN analysis and measured potential values as
well as the measured experimental currents.
9
WmMINU f l AMWAfLa s 1 fap
Only MARC was used to analyze this material combination under flowing (2.4 m/s)
conditions. Analyses were run using polarization data after one day as well as 120
days. The 1 day data is shown in Fig. 7 and the 120 day as Fig. 8. There is marginal
qualitative agreement as to the distances of galvanic interaction in both cases. As
with the quiescent data, the freely-corroding potential of alloy 625 used in the analy-
sis appears not to match that actually observed. Figure 8 shows that the interaction
distance has decreased 20 diameters due to the flow. This distance is similar between
the computer prediction and the measured potentials. Although the I day prediction in
Fig. 7 (interaction distances of 15 diameters) is similar to the 120 day prediction in
Fig. 8, (interaction distance of 25 diameters) the measured potentials are somewhat
different. In Fig. 9 the measured tube/tubesheet potential profiles can be seen as
they develop over time. The galvanic interaction is initially low (1 day) when the
potential difference between the Ni-Al-bronze and the alloy 625 is small, as shown in
Fig. 10, and accordingly the galvanic current is low. Whdn the open circuit potential
of the alloy 625 increases, the interaction distance increases. However, the galvanic
corrosion is more severe at 70 days in this case than with the quiescent case since
the cathodic mass transport limiting current density on the alloy 625 is greater
under flowing conditions than in the quiescent case. In summary, the tube potentials
start out low after I day, then increase to a maximum value after 40 days. Then they
decrease until 70 days, after which they behave erratically. The systematic shifts
in tube/tubesheettreflect the time/potential history of the alloys when
freely corroding, as
shown in Fig. 10. After I day the freely corroding potentials of the alloy 625 and
the bronze are similar and relatively low, but the alloy 625 potential rises after a
few days, creating higher galvanic currents and higher coupled potentials. After day
70 the alloy 625 potential may have behaved erratically, and the Ni-Al-bronze has
1O
corroded sufficiently to cause the remaining copper surface to exhibit greater pas-
sivity, as observed.2 This explails the confusing time behavior of the 2.4 m/s tube/
tubesheet couple reasonable well and points to the necessity for careful consideration
of time effects.
90-10 Cu-Ni/MONEL ALLOY 400 CONFIGURATION
The WECAN analysis of this material combination under quiescent conditions at 120
days is presented in Fig. 11. The analysis of this material combination is complicated
by the similarity in freely-corroding potentials of the two materials. The predicted
interaction distance based on current density is about 10 cm or 8 diameters. The
measured interaction distance was closer to 130 cm or 100 diameters after 120 days.
The explanation for this behavior seems to be associated with the gradual passivation
of the Cu-Ni material which is initially anodically polarized near the tube entrance.
The development of a film on this material then promotes the throwing of galvanic
current a greater distance down the length of tube. This large discrepancy should be
considered in light of the fact that all of the current is at least a factor of 3 be-
low the average general corrosion current for freely-corroding 90-10 Cu-Ni, and
therefore both the measured and predicted galvanic effects are insignificant. The
difference between predicted and observed potentials once again appears large, but
all potentials lie within the observed range of freely-corroding potentials fot the
copper-nickel. Thus, the differences are insignificant. Since the increases in anode
surface area minimizes the extent of galvanic corrosion, WECAN was successful in pre-
dicting an insignificant galvanic corrosion problem.
11
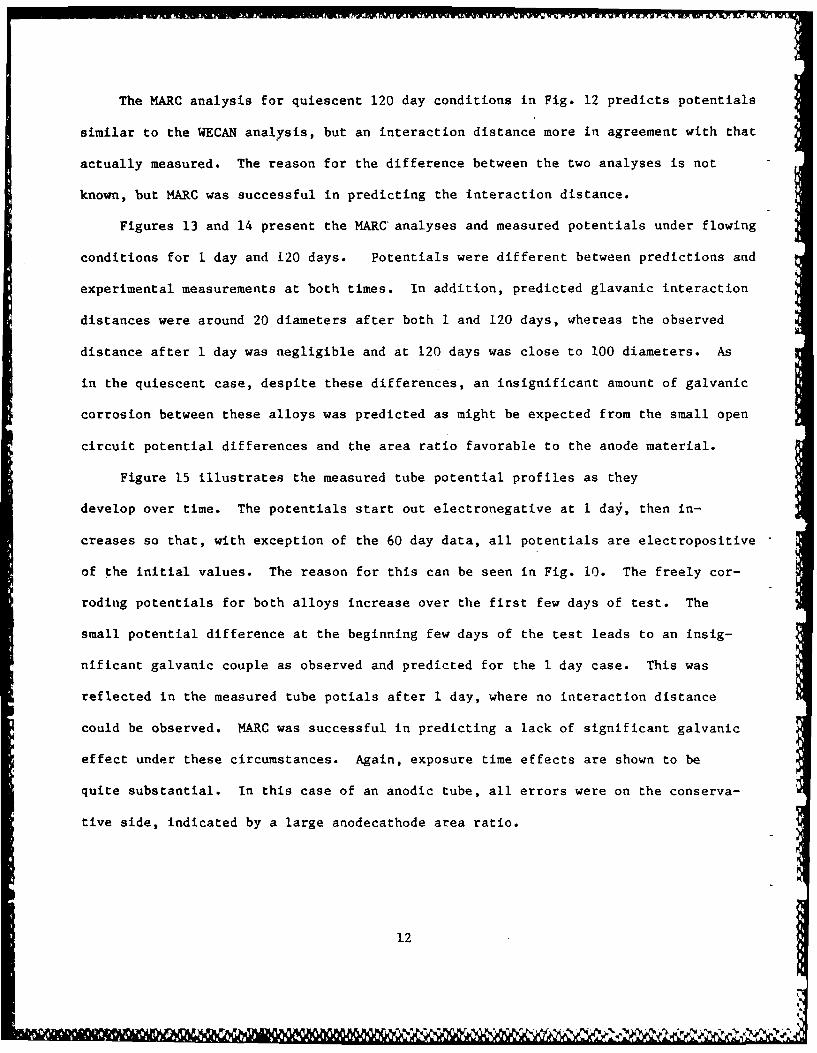
The MARC analysis for quiescent 120 day conditions in Fig. 12 predicts potentials
similar to the WECAN analysis, but an interaction distance more in agreement with that
actually measured. The reason for the difference between the two analyses is not
known, but MARC was successful in predicting the interaction distance.
Figures 13 and 14 present the MARC analyses and measured potentials under flowing
conditions for I day and 120 days. Potentials were different between predictions and
experimental measurements at both times. In addition, predicted glavanic interaction
distances were around 20 diameters after both I and 120 days, whereas the observed
distance after 1 day was negligible and at 120 days was close to 100 diameters. As
in the quiescent case, despite these differences, an insignificant amount of galvanic
corrosion between these alloys was predicted as might be expected from the small open
circuit potential differences and the area ratio favorable to the anode material.
Figure 15 illustrates the measured tube potential profiles as they
develop over time. The potentials start out electronegative at 1 day, then in-
creases so that, with exception of the 60 day data, all potentials are electropositive
of the initial values. The reason for this can be seen in Fig. 10. The freely cor-
roding potentials for both alloys increase over the first few days of test. The
small potential difference at the beginning few days of the test leads to an insig-
nificant galvanic couple as observed and predicted for the 1 day case. This was
reflected in the measured tube potials after 1 day, where no interaction distance
could be observed. MARC was successful in predicting a lack of significant galvanic
effect under these circumstances. Again, exposure time effects are shown to be
quite substantial. In this case of an anodic tube, all errors were on the conserva-
tive side, indicated by a large anodecathode area ratio.
12
%,?A 1
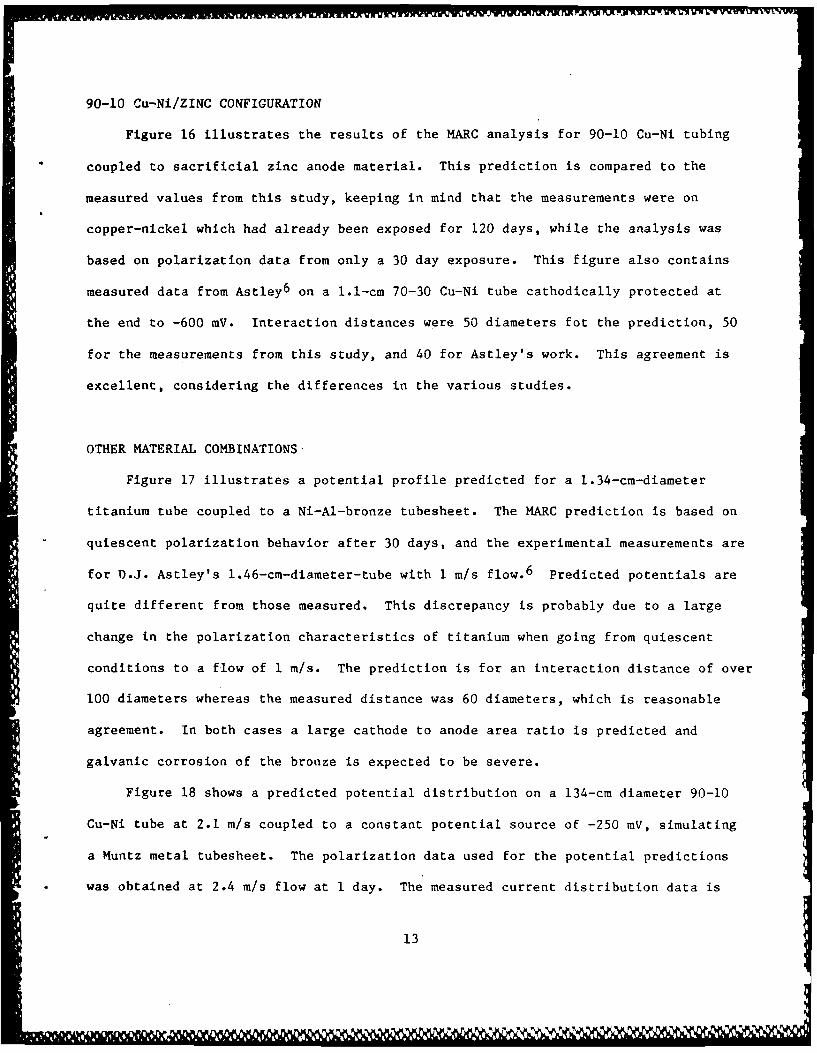
90-10 Cu-Ni/ZINC CONFIGURATION
Figure 16 illustrates the results of the MARC analysis for 90-10 Cu-Ni tubing
coupled to sacrificial zinc anode material. This prediction is compared to the
measured values from this study, keeping in mind that the measurements were on
copper-nickel which had already been exposed for 120 days, while the analysis was
based on polarization data from only a 30 day exposure. This figure also contains
measured data from Astley6 on a 1.1-cm 70-30 Cu-Ni tube cathodically protected at
the end to -600 mV. Interaction distances were 50 diameters fot the prediction, 50
for the measurements from this study, and 40 for Astley's work. This agreement is
excellent, considering the differences in the various studies.
OTHER MATERIAL COMBINATIONS
Figure 17 illustrates a potential profile predicted for a 1.34-cm-diameter
titanium tube coupled to a Ni-Al-bronze tubesheet. The MARC prediction is based on
quiescent polarization behavior after 30 days, and the experimental measurements are
for D.J. Astley's 1.46-cm-diameter-tube with I m/s flow.6 Predicted potentials are
quite different from those measured. This discrepancy is probably due to a large
change in the polarization characteristics of titanium when going from quiescent
conditions to a flow of I m/s. The prediction is for an interaction distance of over
100 diameters whereas the measured distance was 60 diameters, which is reasonable
agreement. In both cases a large cathode to anode area ratio is predicted and
galvanic corrosion of the bronze is expected to be severe.
Figure 18 shows a predicted potential distribution on a 134-cm diameter 90-10
Cu-Ni tube at 2.1 m/s coupled to a constant potential source of -250 mV, simulating
a Muntz metal tubesheet. The polarization data used for the potential predictions
was obtained at 2.4 m/s flow at I day. The measured current distribution data is
13
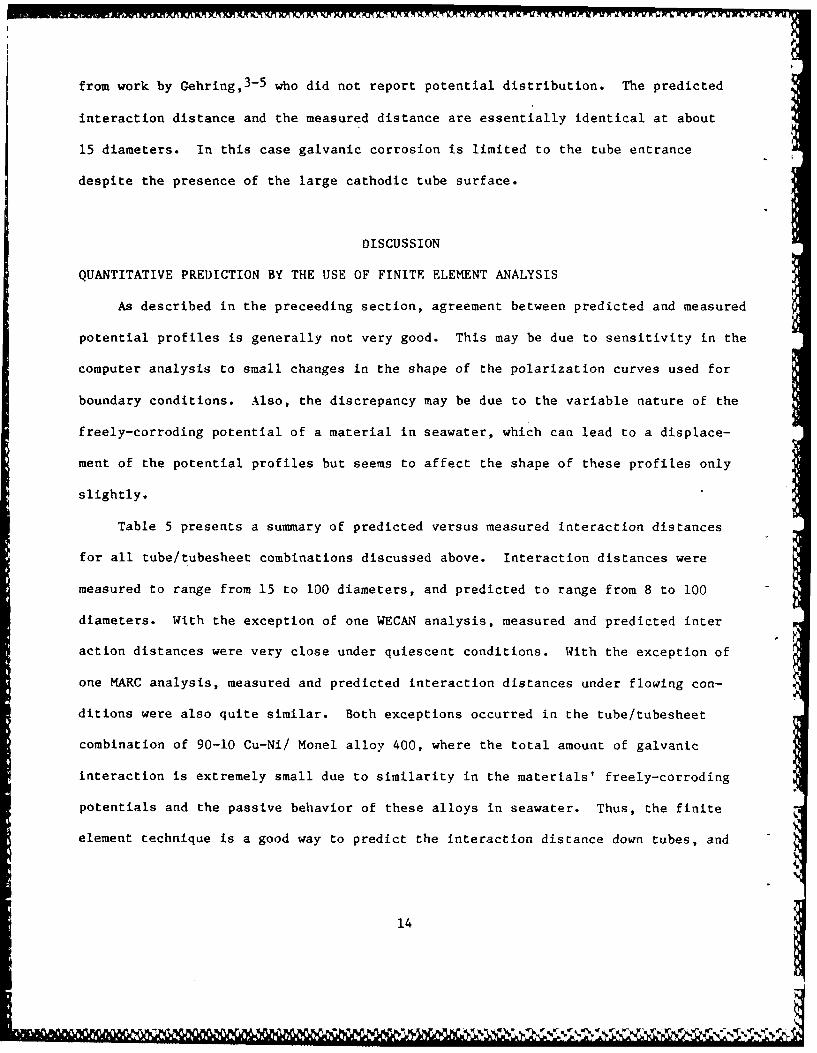
from work by Gehring,3- 5 who did not report potential distribution. The predicted
interaction distance and the measured distance are essentially identical at about
15 diameters. In this case galvanic corrosion is limited to the tube entrance
despite the presence of the large cathodic tube surface.
DISCUSSION
QUANTITATIVE PREDICTION BY THE USE OF FINITE ELEMENT ANALYSIS
As described in the preceeding section, agreement between predicted and measured
potential profiles is generally not very good. This may be due to sensitivity in the
computer analysis to small changes in the shape of the polarization curves used for
boundary conditions. Also, the discrepancy may be due to the variable nature of the
freely-corroding potential of a material in seawater, which can lead to a displace-
ment of the potential profiles but seems to affect the shape of these profiles only
slightly.
Table 5 presents a summary of predicted versus measured interaction distances
for all tube/tubesheet combinations discussed above. Interaction distances were
measured to range from 15 to 100 diameters, and predicted to range from 8 to 100
diameters. With the exception of one WECAN analysis, measured and predicted inter
action distances were very close under quiescent conditions. With the exception of
one MARC analysis, measured and predicted interaction distances under flowing con-
ditions were also quite similar. Both exceptions occurred in the tube/tubesheet
combination of 90-10 Cu-Ni/ Monel alloy 400, where the total amount of galvanic
interaction is extremely small due to similarity in the materials' freely-corroding
potentials and the passive behavior of these alloys in seawater. Thus, the finite
element technique is a good way to predict the interaction distance down tubes, and
14
p I
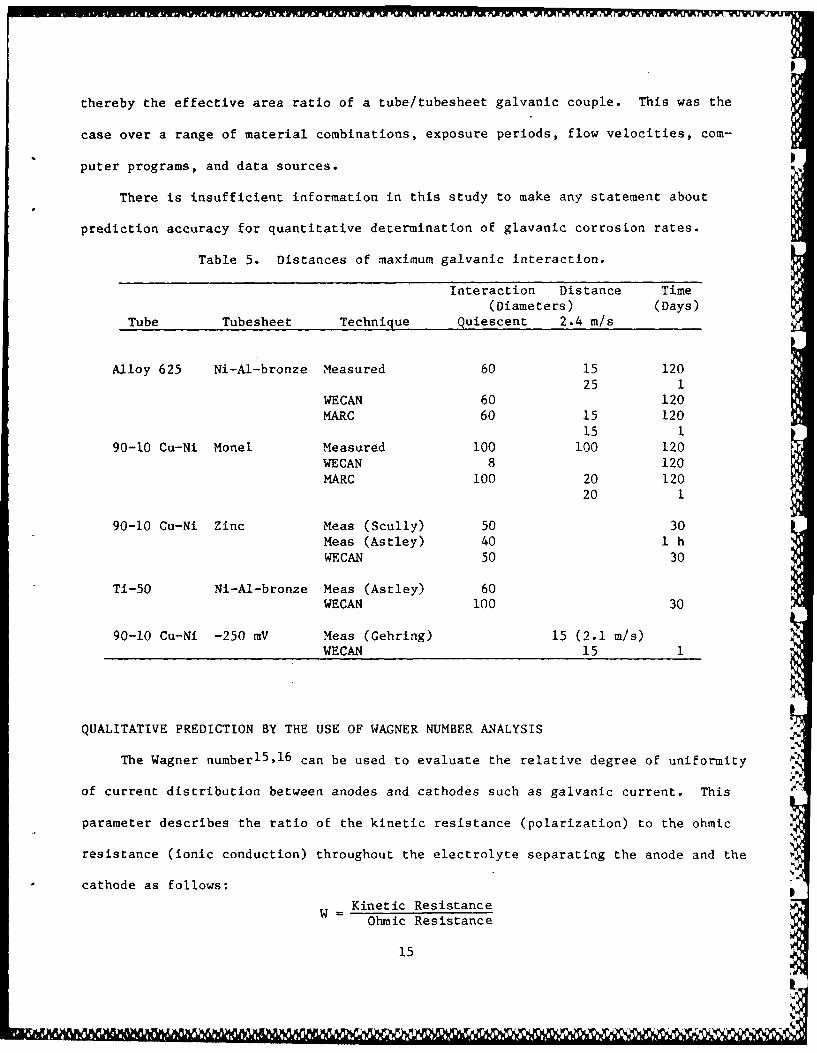
thereby the effective area ratio of a tube/tubesheet galvanic couple. This was the
case over a range of material combinations, exposure periods, flow velocities, com-
puter programs, and data sources.
There is insufficient information in this study to make any statement about
prediction accuracy for quantitative determination of glavanic corrosion rates.
Table 5. Distances of maximum galvanic interaction.
Interaction Distance Time(Diameters) (Days)
Tube Tubesheet Technique Quiescent 2.4 m/s
Alloy 625 Ni-Al-bronze Measured 60 15 12025 1
WECAN 60 120MARC 60 15 120
15 1
90-10 Cu-Ni Monel Measured 100 100 120WECAN 8 120MARC 100 20 120
20 1
90-10 Cu-Ni Zinc Meas (Scully) 50 30Meas (Astley) 40 1 hWECAN 50 30
Ti-50 Ni-Al-bronze Meas (Astley) 60WECAN 100 30
90-10 Cu-Ni -250 mV Meas (Gehring) 15 (2.1 m/s)WECAN 15 1
QUALITATIVE PREDICTION BY THE USE OF WAGNER NUMBER ANALYSIS
The Wagner numberl5,1 6 can be used to evaluate the relative degree of uniformity
of current distribution between anodes and cathodes such as galvanic current. This
parameter describes the ratio of the kinetic resistance (polarization) to the ohmic
resistance (ionic conduction) throughout the electrolyte separating the anode and the
cathode as follows:
Kinetic ResistanceW = Ohmic Resistance
15
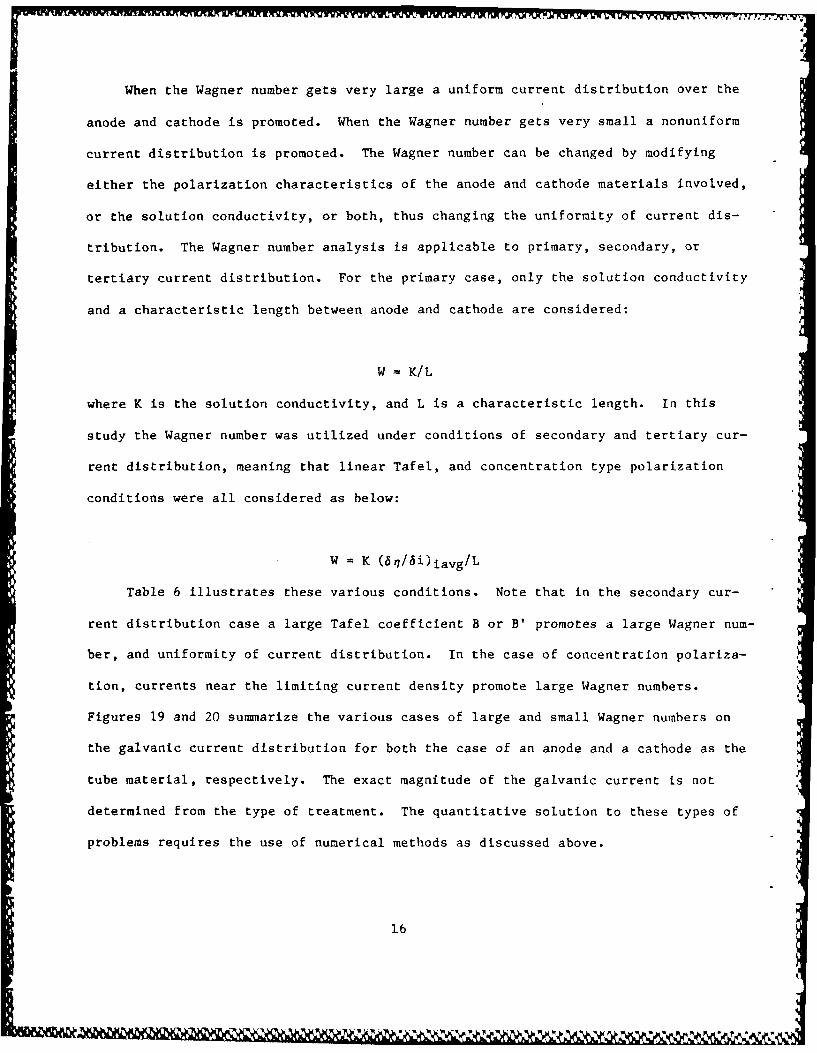
When the Wagner number gets very large a uniform current distribution over the
anode and cathode is promoted. When the Wagner number gets very small a nonuniform
current distribution is promoted. The Wagner number can be changed by modifying
either the polarization characteristics of the anode and cathode materials involved,
or the solution conductivity, or both, thus changing the uniformity of current dis-
tribution. The Wagner number analysis is applicable to primary, secondary, or
tertiary current distribution. For the primary case, only the solution conductivity
and a characteristic length between anode and cathode are considered:
W = K/L
where K is the solution conductivity, and L is a characteristic length. In this
study the Wagner number was utilized under conditions of secondary and tertiary cur-
rent distribution, meaning that linear Tafel, and concentration type polarization
conditions were all considered as below:
W = K (6F7/bi)iavg/L
Table 6 illustrates these various conditions. Note that in the secondary cur-
rent distribution case a large Tafel coefficient B or B' promotes a large Wagner num-
ber, and uniformity of current distribution. In the case of concentration polariza-
tion, currents near the limiting current density promote large Wagner numbers.
Figures 19 and 20 summarize the various cases of large and small Wagner numbers on
the galvanic current distribution for both the case of an anode and a cathode as the
tube material, respectively. The exact magnitude of the galvanic current is not
determined from the type of treatment. The quantitative solution to these types of
problems requires the use of numerical methods as discussed above.
lb
L aw!-,.URM 1
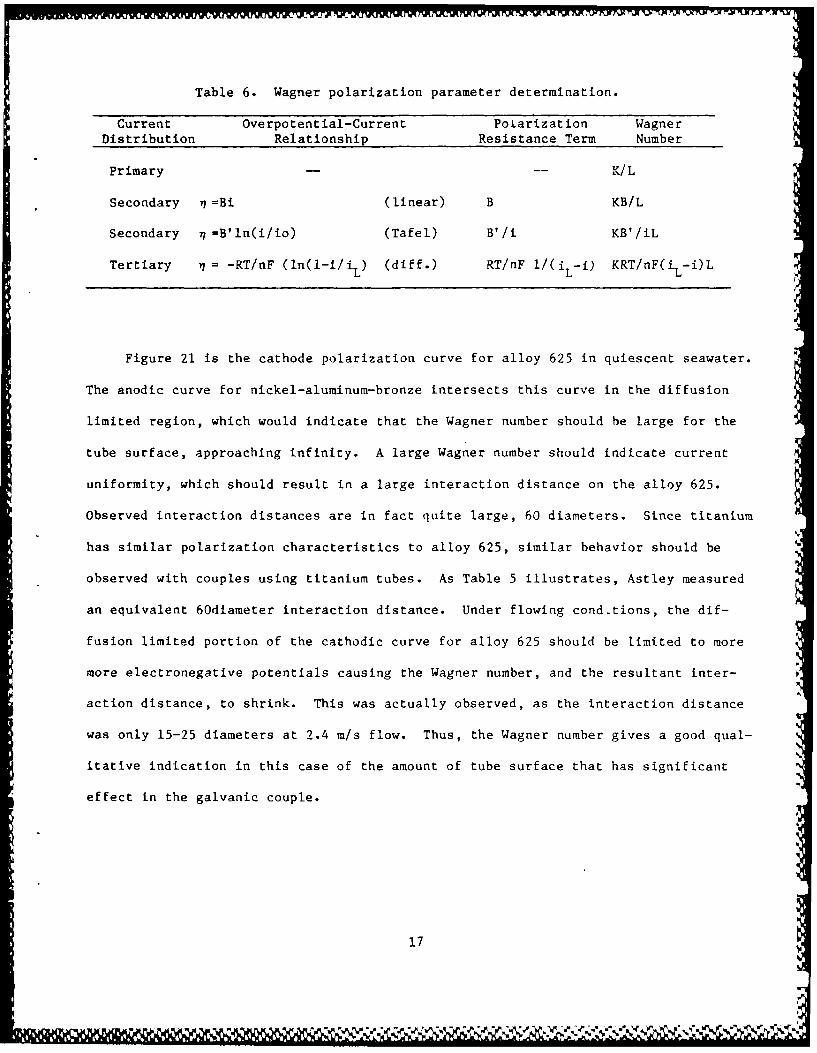
Table 6. Wagner polarization parameter determination.
Current Overpotential-Current Polarization WagnerDistribution Relationship Resistance Term Number
Primary -- K/L
Secondary 77=Bi (linear) B KB/L
Secondary ?I=B'ln(i/io) (Tafel) B'/i KB'/iL
Tertiary v = -RT/nF (In(I-i/i L) (diff.) RT/nF 1/(iL-i ) KRT/nF(iL-i)L
Figure 21 is the cathode polarization curve for alloy 625 in quiescent seawater.
The anodic curve for nickel-aluminum-bronze intersects this curve in the diffusion
limited region, which would indicate that the Wagner number should be large for the
tube surface, approaching infinity. A large Wagner number should indicate current
uniformity, which should result in a large interaction distance on the alloy 625.
Observed interaction distances are in fact quite large, 60 diameters. Since titanium
has similar polarization characteristics to alloy 625, similar behavior should be
observed with couples using titanium tubes. As Table 5 illustrates, Astley measured
an equivalent 60diameter interaction distance. Under flowing cond.tions, the dif-
fusion limited portion of the cathodic curve for alloy 625 should be limited to more
more electronegative potentials causing the Wagner number, and the resultant inter-
action distance, to shrink. This was actually observed, as the interaction distance
was only 15-25 diameters at 2.4 m/s flow. Thus, the Wagner number gives a good qual-
itative indication in this case of the amount of tube surface that has significant
effect in the galvanic couple.
17
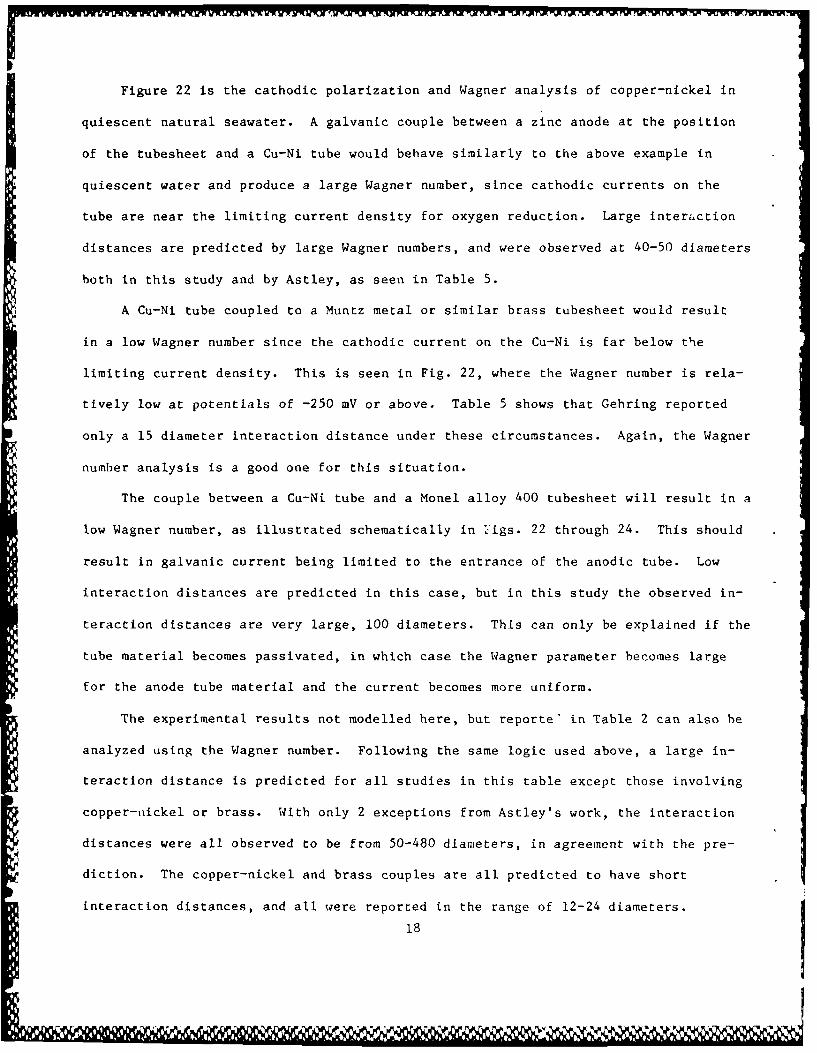
Figure 22 is the cathodic polarization and Wagner analysis of copper-nickel in
quiescent natural seawater. A galvanic couple between a zinc anode at the position
of the tubesheet and a Cu-Ni tube would behave similarly to the above example in
quiescent water and produce a large Wagner number, since cathodic currents on the
tube are near the limiting current density for oxygen reduction. Large interaction
distances are predicted by large Wagner numbers, and were observed at 40-50 diameters
both in this study and by Astley, as seen in Table 5.
A Cu-Ni tube coupled to a Muntz metal or similar brass tubesheet would result
in a low Wagner number since the cathodic current on the Cu-Ni is far below the
limiting current density. This is seen in Fig. 22, where the Wagner number is rela-
tively low at potentials of -250 mV or above. Table 5 shows that Gehring reported
only a 15 diameter interaction distance under these circumstances. Again, the Wagner
number analysis is a good one for this situation.
The couple between a Cu-Ni tube and a Monel alloy 400 tubesheet will result in a
low Wagner number, as illustrated schematically in :7igs. 22 through 24. This should
result in galvanic current being limited to the entrance of the anodic tube. Low
interaction distances are predicted in this case, but in this study the observed in-
teraction distances are very large, 100 diameters. This can only be explained if the
tube material becomes passivated, in which case the Wagner parameter becomes large
for the anode tube material and the current becomes more uniform.
The experimental results not modelled here, but reporte' in Table 2 can also he
analyzed using the Wagner number. Following the same logic used above, a large in-
teraction distance is predicted for all studies in this table except those involving
copper-,iickel or brass. With only 2 exceptions from Astley's work, the interaction
distances were all observed to be from 50-480 diameters, in agreement with the pre-
diction. The copper-nickel and brass couples are all predicted to have short
interaction distances, and all were reported in the range of 12-24 diameters.
18
v'.
The above analyses indicate how good a predictor the Wagner number is for esti-
mating in teraction distances in tube/tubesheet galvanic couples. Although quan-
titative prediction is not possible using this analysis, qualitative information can
be gained, which is useful for determining the effects of exposure variables on in-
teraction distance. This can be accomplished by examining the effects of these
variables on polarization behavior and determining Wagner numbers as a function of
potential.
CONCLUSIONS
Quantitative predictions of galvanic corrosion by finite element methods can be
accomplished by predicting distances of galvanic interaction provided that long term
electrochemical polarization data and open circuit potential behavior are carefully
considered and incorporated into such analysis. Without consideration of potential-
current-time effects resulting predictions may be misleading or in error. Qualitative
indications of galvanic corrosion interaction distances may be obtained through utili-
zation of the Wagner number analyzed in the case of the primary or secondary current
distribution. Consideration of potential-current-time effects are still required and
no quantitative data may be yielded through this method.
ACKNOWLEDGEMENTS
The authors would like to thank the staff of the LaQue Center for Corrosion>F
Technology for conducting experimental verifications. They would also like to thank
Dr. J. Fu, formerly of Westinghouse R&D Center and Mr. Raymond Munn of Naval Under-
water Systems Command for their finite element analysis work.
19
tK
4 c.S
I.-)
LU0
Ii0I0['*j
Q4
(~1 a
C.) -4
2 0
LLI
LUULU CA
LiiU
LU 4
202
kII
R TUBE SHEET
END SURFACE OFTHE CONDENSER
SSURFACE
L2 21
V P P~4~-. V V~ ?P~jV0
KR Tb+T
TUBESHEET
ii~ 9 ELEMENTS
-TUBE SHEET WALL
42 ELEMENTS
Fig. 3. Finite element mesh with axisymmetric elements used toreduce 3D geometry to 2D.
22
0.8 I0.4
z 0 0LC E -0.4 20
z -1.2 o,,.,0 0 ACTUALW 1.2 00"#-- PREDICTION
M -1.8 6 0 TUBE DIAMETER: 2.60 cmS 25000
2W0 0rj 150 00
100 000 ---z 50
-j 000 OBSERVED RANGE0 IN OPEN CIRCUIT
(L -50POTENTIALE-100 I
-1500 so 100 150 200 250 300
DISTANCE FROM Ni Al BRONZE TUBE SHEET, cm
Fig. 4. Current and potential distribution on alloy 625 tubeafter 120 days.
400 1 --7
- INCONEL 625~200
(A
E-j
90-10 COPPER-NICKEL
NI-AL-BRONZE ..... .....
-400' j0 20 40 60 80 100 120
EXPOSURE TIME (days)
Fig. 5. Potential versus time behavior for alloy 625 andNi-Al-bronze in quiescent seawater.
23
L W j~R l' %WA
100245 QUIESCENT SEAWATER
TUBE I.D. = 2.66 cm- ACTUAL DATA 120 DAYS 80
0_ 185-. (120 DAYS)
4< 125--60
> 6PREDICTION #2 (120 DAYS)
5 -- -40
LU -55I-0 2.- 20
-115 - ACTUAL CURRENT (120 DAYS)
PERCENT
-15 25 50 75 100 125 150DISTANCE (DIAMETERS)
Fig. 6. Galvanic corrosion behavior for an alloy 625 tubecoupled to Ni-Al-bronze: quiescent 120 days.
225 - PREDICTION #2 (1 DAY)
< 125
2.4 METERS/SECOND FLOWING SEAWATER25 (1 DAY)
> TUBE I.D. = 2.66 cmE
4 -75
zLUI!-a. -175 - ACTUAL (1 DAY)
-275 I0 25 50 75 100 125 150
DISTANCE (DIAMETERS)
Fig. 7. Galvanic corrosion behavior for alloy 625 tube coupledto Ni-Al-bronze tubesheet: flowing 1 day.
24
iV
275
PREDICTION #2S225 120 DAYS
175
ACTUAL> 125 - 120 DAYS
725 75z
.25
9 252.4 METERS/SECOND FLOWINGEERI(2.66 cm TUBE I.D.)
-25 - TUEHE 1 1 1A
0 25 50 75 100 125 150DISTANCE (DIAMETERS)
Fig. 8. Galvanic corrosion behavior for alloy 625 tube coupled
to Ni-Al-bronze tubesheet: flowing 120 days.
; -50
2.4 ISECFLOWRATEEXPERIMENTAL
200 RESULTS
NAB~ ~ ~ ~ TUEHT&1DAY150 - 0 400DAY
0 700DAY
rj100 10 120 DAY
> 0 INTERACTION H-504
-100 L
-200 ]0 25 50 75 100 125 150 175 200 225 250 275 300
DISTANCE cm
Fig. 9. Galvanic corrosion behavior time effects for alloy 625 tube
coupled to Ni-Al-bronze tubesheet: flowing 1 to 120 days.
25
400 1 1 1
INCONEL 625
~200
0-
-400NE 400I
0 20 40 60 80 100 120EXPOSURE TIME (days)
Fig. 10. Potential versus time behavior for tube and tubesheetmaterials in flowing seawater.
1.8
1.4z 1.2 -0 ACTUAL
E 1.0 --- PREDICTION_'J. 0.8 MMUNIFORM CORROSION
0.6 RATE FOR 90-10cc 0. TUBE DIAMETER: 1.34 cm
S0.2 0o 0--100
J -150OBSERVED RANGE
0 0 IN OPEN CIRCUIT00
-300 1 1 1 10 s0 100 150 200 250 300
DISTANCE FROM MONEL TUBE SHEET. cm
Fig. 11. Current and potential distribution on 90-10 Cu-Ni tubeafter 120 days in quiescent seawater.
26
-75
SPREDICTION 2 (120 DAYS)(<-125-
-175 QUIESCENT SEAWATER120 DAYSI.D. = 1.34 cm
8 -2250.. ACTUAL
120 DAYS°
- 275-0 50 100 150 200 250
DISTANCE (DIAMETERS)
Fig. 12. Galvanic corrosion behavior for a 90-10 Cu-Ni tube coupledto Monel alloy 400: quiescent 120 days.
- 2002.4 METERS/SECOND FLOWING SEAWATER1 DAY(1.34 cm TUBE I.D.)
n OACTUAL (1 DAY)
E PREDICTED (1 DAY)-j
I-I'U
-250I I I0 50 100 150 200 250DISTANCE (DIAMETERS)
Fig. 13. Galvanic corrosion behavior for a 90-10 Cu-Ni tube coupledto Monel alloy 400: flowing 1 day.
27
0
100- 2.4 METERS/SECOND FLOWING SEAWATER
-25 " S-10 5 0 5 0 5
DISTANCE~ (DAMTES
Fig.14. alvaic crrosonbhavir fo a 9-10Cu-NA ue ope
-50 100 1502002
-0
-300~ 30 DAYI I
0 2 5 75 10 15 10 520 22 120 27Y 30
DISTANCE cm
Fig. 15. Galvanic corrosion behavior time effects for 90-10 Cu-Ni tubecoupled to Monel alloy 400 tubesheet: flowing 1 to 120 days.
28
030 DAYS
-100- PREDICTION #2 (I.D. = 1.34 cm)
D. J. ASTLEY (SIMULATED POLARIZATION TO -600 mV)200 70-30 (I.D. = 1.1 cm)
-300 ACTUAL (SCULLY, HACK)-4001 30 DAYS
-50
1- -6002IL
-700
-800. QUIESCENT SEAWATER
-900 1 1 1 10 50 100 150 200 250
DISTANCE (DIAMETERS)
Fig. 16. Galvanic corrosion behavior for 90-10 and 70-30 Cu-Ni tubescoupled to anode grade zinc at the tubesheet.
-25
D50 . J. ASTLEY (I.D. = 1.46 cm)
0 1 METERISEC FLOW
0
-100-
- 125
U 150 ,ID. 1.3 4 c m)
a.PREDICTION 2 ,
QUIESCENT SEAWATER
- 200- Ti-5030 DAYS
- 225 10 50 100 150 200 250 y
DISTANCE (DIAMETERS)
Fig. 17. Galvanic corrosion behavior for a titanium tube coupled to
Ni-Al-bronze tubesheet.
22
- 150 1001- PREDICTED (1 DAY)
PREDICTION #2
-80QO -200
-60
> - 250
E -40
I--Z,-.- 300-1-- -20O ACTUAL CURRENT PERCENTAGE
0. G. A. GEHRING (ACTUAL RESULTS)
-350 I 1 025 50 75 100 125
DISTANCE (DIAMETERS)
Fig. 18. Galvanic corrosion behavior for a 90-10 Cu-Ni tube coupled toMuntz metal alloy tubesheet.
+10o
W = KL _ INDICATES DISTANCE OF SIGNIFICANT INTERACTION
W =ARGEi
SW MDOFFSCALE
CATHODE
0_-0 DISTANCE FROM TUBESHEET CATHODE 300
(ARBITRARY UNITS)TUBESHEET TUB0
IANODE) TUBE
Fig. 19. Schematic galvanic current versus distance plot for an anodetube coupled to a cathode tubesheet for various magnitudesof the Wagner polarization parameter.
30
0 AHD -- NO GALVANIC
ANODE W SMALL INTERACTION
OFFSCALE
ccI
w W LARGE
W w= K 7
IDCTSDISTANCE OF SIGNIFICANT
GALVANIC INTERACTION-100 I I 1 1
0 DISTANCE FROM TUBESHEET ANODE 300TUBESHEET (ARBITRARY UNITS)
(ANODE)
TUBE0
Fig. 20. Schematic galvanic current versus distance plot for a cathode tube
coupled to an anode tubesheet for various magnitudes of the Wagner
polarization parameter.
~-+240 mV
INCONELALLOY 625
4 dE
I -35 mv
low
100 TO -200
LOG i--
Fig. 21. Schematic E ve sus log i plot describing galvanic corrosion
behavior of alloy 625 coupled to Ni-Al-bronze.
31
70-30 Cu-Ni 70-30 Cu-NiPOLARIZATION WAGNER ANALYSIS
100
4L
0 W=kn
-200 = C
3000ANODIC POLARIZATION0
> Y?=P log 01
;0o) + 7- .lo , 1
"L1
j-N -50
W -
-700ANODIC POLARIZATION
-0-FOR ZINC ANODE
-1000100 10' 102 101 10,
CURRENT DENSITY ?pA/cm sq.) RELATIVE WAGNER PARAMETER
Fig. 22. Polarization plot and Wagner polarization analysis for aCu-Ni alloy in quiescent seawater.
MONEL POLARIZATION MONEL WAGNERBEHAVIOR PARAMETER vs POTENTIAL
-10
-900- 00 __ _ _ _ _ _ _ _ _ _ _ _
1000 10 O 0
CURN DENSIT (-Ac~ ANE UBR(
Fig 23. 0 Poaiainpo n anrpoaiainaayi o oalo 0 nqiecn ewtr
0 -7032
-50 mV TO -150 -V
di
E -2< m
LOG i--
Fig. 24. Schematic E versus log i plot describing galvanic corrosionbehavior of Monel alloy 400 coupled to 90-10 Cu-Ni.
33f
-N -9
REFERENCES
1. Hack, H.P. and J.R. Scully, "Galvanic Corrosion Prediction Using Long-Term Poten-
tiostatic Polarization Curves," Corrosion, Vol. 42, No. 2, p. 79 (1976).
2. Scully, J.R. H.P. Hack, and G.D. Tipton, Corrosion, Vol. 42, No. 8, p. 462 (1986).
3. Gehring, G.A., C.K. Kuester, and J.R. Maurer, Corrosion/80, Chicago, Paper 32
(1980).
4. Gehring G.A. Jr., "Galvanic Corrosion of Selected Tubesheet/Tube Couples under
Simulated Seawater Condenser Conditions," Corrosion/81, Toronto, Canada (Apr 1981).
5. Gehring, G.A. and R.J. Kyle, Jr., "Galvanic Corrosion in Steam Surface Condensers
Tubed with Either Stainless Steel or Titanium," Corrosion/82, Houston, TX
(Mar 1982).
6. Astley, D.J., "A Method for Calculating the Extent of Galvanic Corrosion and
Cathodic Protection in Metal Tubes Assuming Undirectional Current Flow," Corrosion
Science, Vol. 23, No. 8, pp. 801-832 (1983).
7. Fu, J.W., Technical Note, "A Finite Element Analysis of Corrosion Cells," Corrosion,
Vol. 38, No. 5, p. 295 (May 1982).
8. Fu, J.W., "A Finite Element Analysis of Corrosion Cells with Mathematical as Well
as Experimental Verifications," Scientific Paper 80-IDZ-MEEIC-PI.
9. Fu, J.W. and J.S.K. Chow, "Cathodic Protectio.n Designs Using on Integral Equation
Numerical Method," Materials Performance, p. 9. (Oct 1982).
10. Kasper, R.G. and M.G. April, "Electrogalvanic Finite Element Analysis of Partially
Protected Marine Structures," Corrosion, Vol. 39, No. 5, p. 181 (May 1983)
l1. Strommen, R. and A. Rodland, "Computerized Techniques Applied in Design of Offshore
Cathodic Protection System," Materials Performance, p. 15 (;pr 1981).
12. Munn, R.S., "A Mathematical Model for Galvanic Anode Cathodic Protection System,"
Materials Performance, p. 29 (Aug 1q82).
35
13. Decarlo, E.A., "Computer Aided Cathodic Protection Design Technique for Complex
Offshore Structures," Corrosion/82, Paper 165, Houston, TX (22-26 Mar 1982).
14. Doig, P. and P.E.J. Flewitt, "A Finite Differenct Numerical Analysis of Galvanic
Corrosion for Semi-Infinite Linear Coplanar Electrodes," J. Electrochem, Soc.,
p. 2057 (Dec 1979).
15. Wagner, C., J. Electrochem. Soc., Vol. 98, No. 116 (1951).
16. Wagner, C. and W. Traud, Z. Electrochem. Bc-Bunsenges Phys. Chem., p. 44 (1938).
36
-00900 MK
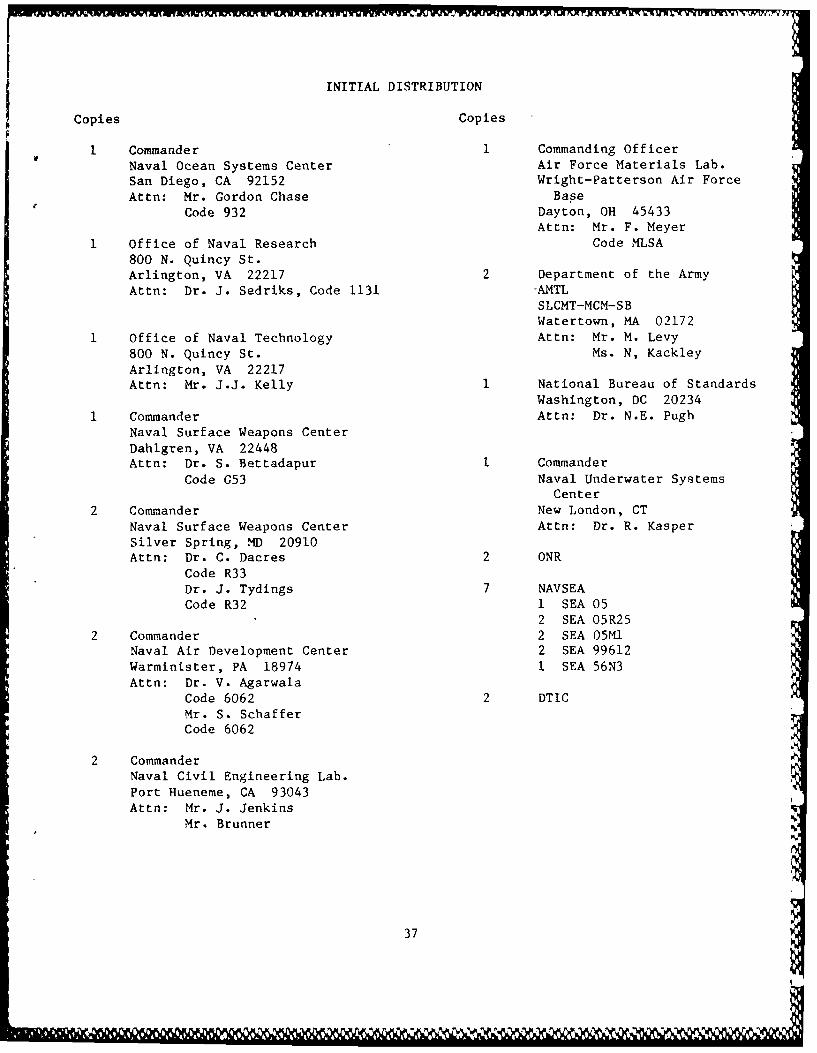
INITIAL DISTRIBUTION
Copies Copies
1 Commander 1 Commanding Officer
Naval Ocean Systems Center Air Force Materials Lab.San Diego, CA 92152 Wright-Patterson Air Force
Attn: Mr. Gordon Chase Base
Code 932 Dayton, OH 45433Attn: Mr. F. Meyer
Office of Naval Research Code MLSA
800 N. Quincy St.Arlington, VA 22217 2 Department of the Army
Attn: Dr. J. Sedriks, Code 1131 -AMTL
SLCMT-MCM-SBWatertown, MA 02172
Office of Naval Technology Attn: Mr. M. Levy
800 N. Quincy St. Ms. N, Kackley
Arlington, VA 22217Attn: Mr. J.J. Kelly 1 National Bureau of Standards
Washington, DC 20234
Commander Attn: Dr. N.E. Pugh
Naval Surface Weapons Center
Dahlgren, VA 22448Attn: Dr. S. Bettadapur 1 Commander
Code G53 Naval Underwater SystemsCenter
2 Commander New London, CT
Naval Surface Weapons Center Attn: Dr. R. KasperSilver Spring, MD 20910Attn: Dr. C. Dacres 2 ONR
Code R33
Dr. J. Tydings 7 NAVSEACode R32 1 SEA 05
2 SEA 05R25
2 Commander 2 SEA 05MINaval Air Development Center 2 SEA 99612
Warminister, PA 18974 1 SEA 56N3
Attn: Dr. V. Agarwala
Code 6062 2 DTIC
Mr. S. Schaffer
Code 6062
2 CommanderNaval Civil Engineering Lab.
Port Hueneme, CA 93043Attn: Mr. J. Jenkins
Mr. Brunner
37
DISTRIBUTION (Continued)
CENTER DISTRIBUTION
Copies Code
1 012 (Caplan)
1 1508
1 28
1 2801
3 2803
1 2809
5 281
5 2813 (Morton)
10 2813 (Hack)
1 284
1 2841
1 522.2 (TIC)
2 5231
38
.~~ ~ ~ . ...
-~~ ~ ~ - ---1