Embed Size (px)
Citation preview
O. P. SiO. P. SiO. P. SiO. P. Sinnnngh, J. P. Gupta,gh, J. P. Gupta,gh, J. P. Gupta,gh, J. P. Gupta,
& A. H. Warsi& A. H. Warsi& A. H. Warsi& A. H. Warsi
1
Weather and climate is associated with every aspect of our day to day life. It have affect
over Human beings, animals, birds, insects, flora and fauna. It affects our lives socially,
economically, medically etc. Apart from general weather information provided by India
Meteorological department, the general public, decision makers and media have become conscious
about the climate and the extreme weather conditions of a place. This book deals with climate of
Lucknow. A Meteorological Observatory in Lucknow was established during British period on
October 6, 1894 within the city. Later on the observatory was shifted in Amausi area (Krishna
Nagar) on February 1, 1948 and finally shifted to Amausi airport (Chaudhari Charan Singh airport)
on 29 November, 1972. Daily meteorological data of this observatory has been utilized to arrive at
the climatology of Lucknow where as daily meteorological data of observatory functioning since
beginning is used to find the extreme events.
The book contains monthly summaries of four seasons and also the annual summaries.
In each season the averages and extremes of temperatures, humidity, rainfall and wind has been
included. The probability of occurrence of various weather phenomena are also described in detail
which is very essential for planning for disaster and its mitigation. At the same time weather
conditions on national holidays viz. Republic day, Independence Day, Gandhi Jayanti have also
discussed in the book.
We are also thankful to National Data Centre Pune,Technical Section of M· C· Lucknow
specially Sh· Moti Lal, Sh. Bachcha Singh, Mrs. Ritu Bose, Mrs A. V. Sharma and Sh. R. P. Kuril,
Mrs. Kalpana Shrivastava, Sh. Sanjeev Chauhan for providing data on the subject·
Lucknow O.P. Singh, J. P. Gupta
19 January, 2012 & A. H. Warsi
2
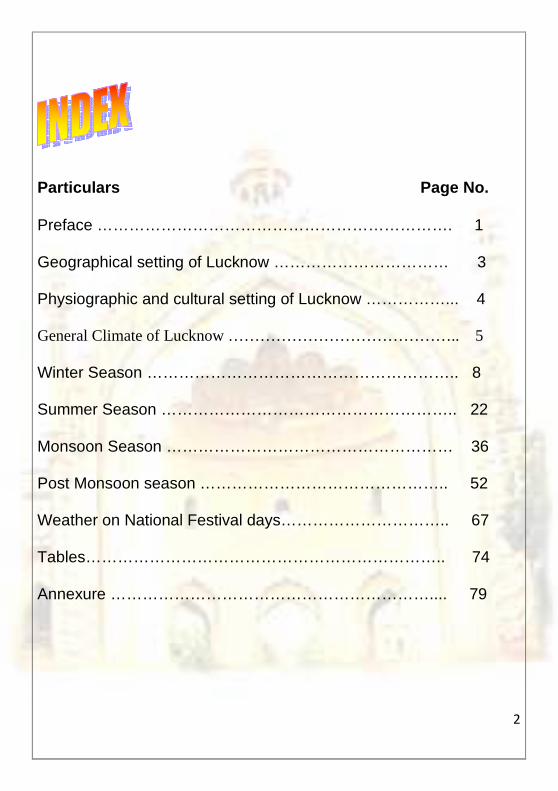
Particulars Page No.
Preface …………………………………………………………. 1
Geographical setting of Lucknow …………………………… 3
Physiographic and cultural setting of Lucknow ……………... 4
General Climate of Lucknow …………………………………….. 5
Winter Season ………………………………………………….. 8
Summer Season ……………………………………………….. 22
Monsoon Season ……………………………………………… 36
Post Monsoon season ……………………………………….. 52
Weather on National Festival days………………………….. 67
Tables………………………………………………………….. 74
Annexure …………………………………………………….... 79

3
GGGGeographical Settingeographical Settingeographical Settingeographical Setting of Lucknowof Lucknowof Lucknowof Lucknow Lucknow, the capital of Uttar Pradesh is situated 123 mts above sea level. It is situated
on 26.30 & 27.10 North latitude and 80.30 & 81.13 East longitude. Lucknow covers an
area of 3,244 sq.km. It is surrounded on the eastern side by District Barabanki, on the
western side by district Unnao, on the southern side by Raebareli and on the northern side
by Sitapur and Hardoi districts.
Fig. 1. City map of Lucknow

4
Physiographic and cultural setting of LucknowPhysiographic and cultural setting of LucknowPhysiographic and cultural setting of LucknowPhysiographic and cultural setting of Lucknow
River Gomti flows through the city. Some of the tributaries of this river are Kukrail,
Loni, Beta etc. Sai river flows from the south of the city and in the east enters district
Raebareli. Lucknow is accessible from every part of India through Air, Rail and Road. It is
directly connected with New Delhi, Patna, Calcutta, Mumbai, Varanasi and other major
cities by Chaudhari Charan Singh airport. Similarly city is linked to north, east, south and
west through rail and road links. The population of district Lucknow as per census 2001 is
36,81,416 lacs.
Lucknow is the capital of Uttar Pradesh, a multicultural city. Historically it is known as the
Awadh. Famous for Courtly Manners (Tahzeeb), Beautiful Gardens, Qauwwali, Chikankari
Embroidery, Kabobs, Poetry, Music, and Fine Cuisine patronized by the Nawabs. Lucknow
is popularly known as the The City of Nawabs. It is also known as the Golden City of the
East, Shiraz-i-Hind and The Constantinople of India.
Today, Lucknow is among the top ten fastest growing non-metropolitan cities of India.
Lucknow also an emerging hub for producers of goods and services with very promising
potential. Lucknow has been a mandi town of mangoes, melons, and grains grown in the
surrounding areas. Sugarcane-growing plantations and sugar industries are also in close
proximity. This attracted Mohan Meakin Brewery to set up a unit based on molasses in the
city. Meakins was incorporated in 1855 and is Asia's first commercial brewery.
5
General Climate of General Climate of General Climate of General Climate of LucknowLucknowLucknowLucknow
Lucknow-The capital of Uttar Pradesh is a land locked city. The distance from the sea
gives Lucknow an extreme type of continental climate with the prevalence of continental air
during major parts of the year. Only during the four months from June to September does
the air of oceanic origin penetrate to this region and causes increased humidity, cloudiness
and rain. About 75 % of the total rainfall is realized during these four months. The year can
be broadly divided in to four seasons. The cold season starts from December and extends
up to end of February. This is followed by the hot weather season which lasts till about
first fortnight of June when monsoon arrives over the region. The monsoon continue till
September. The two post monsoon months of October and November constitute a
transition season from monsoon to winter conditions.
The summers in Lucknow are very hot and winters very cold. The temperature
may rise up to about 46 degree Celsius in summers, though the average temeperature is
around 38-39 degree Celsius. There are about 4-6 days of heat wave when the maximum
temperature of a day rises to 4-6 Celsius above normal values. Though the winters are not
bitterly cold on most of the days, the temperature may fall to 3-4 degree Celsius for a few
days in winters when the cold winds from the Himalayan region makes the winters chilly.
The winters are also marked by mist and fog in the mornings. However, the Sun is often
seen in the afternoons.
6
A Meteorological Observatory in Lucknow was established during British
period on October 6, 1894 within the city. Later on the observatory was shifted in Amausi area (Krishna Nagar) on February 1, 1948 and finally shifted to Amausi airport (Chaudhari Charan Singh airport) on 29 November, 1972. Daily meteorological data of this observatory has been utilized to arrive at the climatology of Lucknow where as daily meteorological data of observatory functioning since beginning is used to find the extreme events The climatology of rainfall, temperature, humidity and wind described in the following sections are based on 30 years period of 1971-2000.The extremes of temperature and rainfall described are from the year 1901 to 2010. The data of weather phenomena are for a 30 years period of 1981 to 2010.
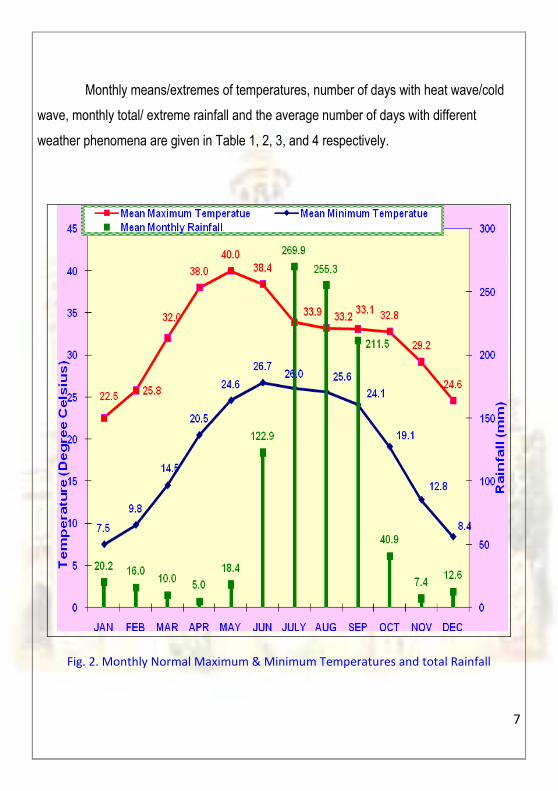
The annual march of maximum/minimum temperatures and rainfall is given in Fig. 2. It shows that temperature are at their peak during the months of May and June. Though the temperature start falling in the month of July, the fall is gradual till October. The maximum temperature decreases sharply from the month October and the minimum temperature decreases sharply from the month of September with January being the coldest month. The normal rainfall increases from the month of June with the onset of pre-monsoon rainfall activity in the first fortnight and the onset of South West monsoon in the second fortnight of the month. July and August are the rainiest months however good amount of rainfall occurred in the month of September while retreating the monsoon. Monsoon withdraws towards the end of September. The rainfall decreases drastically from the month of October. April is the driest month of the year.
7
Monthly means/extremes of temperatures, number of days with heat wave/cold
wave, monthly total/ extreme rainfall and the average number of days with different
weather phenomena are given in Table 1, 2, 3, and 4 respectively.
Fig. 2. Monthly Normal Maximum & Minimum Temperatures and total Rainfall
8
The winter season in Lucknow starts in the month of December and lasts
up to February. Likewise the country Uttar Pradesh also Celebrates Republic Day
during the season on 26 January the date on which constitution of India came in
to force in 1950. Magnificent Republic Day Parade takes places From K. D. Singh
Babu Stadium to Ravindralaya (Charbagh). Main functions are organized at
Vidhan Sabha where The Governor who is the head of the state takes the salute
of Armed forces, State Police Forces, different wings of N.C.C. etc. Tableaus of
various organization spreading the message are also the part of attraction.
Christmas and New Year celebrations are the other main attractions of the
Season.
Though the winters are not bitterly cold on most of the days, the
temperature may fall to 3-4 degree Celsius on few days in the season when cold
winds from Himalayas prevails over the region making the winter chilly. The
winters are also marked by mist and fog during night and in the mornings.
Though the Sun is often out in the afternoons on most of the days, fog lasting for
many hours in the day is not uncommon during 15 December to 20 January.
9
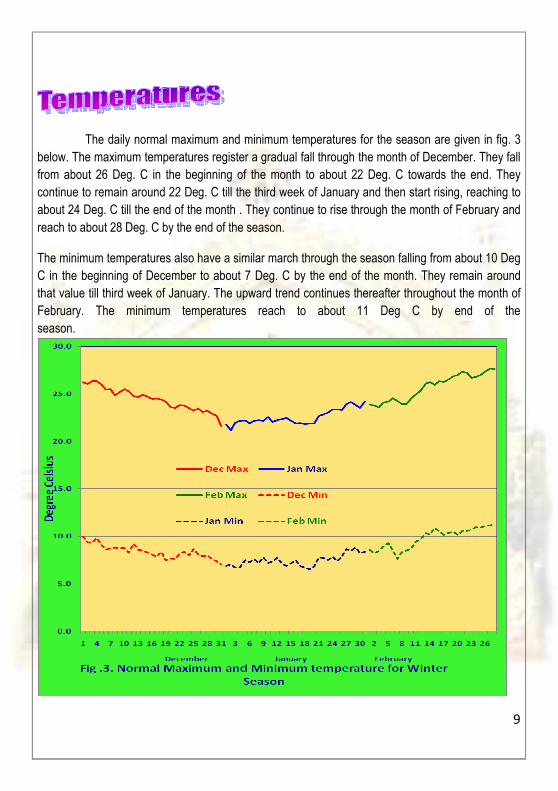
The daily normal maximum and minimum temperatures for the season are given in fig. 3
below. The maximum temperatures register a gradual fall through the month of December. They fall
from about 26 Deg. C in the beginning of the month to about 22 Deg. C towards the end. They
continue to remain around 22 Deg. C till the third week of January and then start rising, reaching to
about 24 Deg. C till the end of the month . They continue to rise through the month of February and
reach to about 28 Deg. C by the end of the season.
The minimum temperatures also have a similar march through the season falling from about 10 Deg
C in the beginning of December to about 7 Deg. C by the end of the month. They remain around
that value till third week of January. The upward trend continues thereafter throughout the month of
February. The minimum temperatures reach to about 11 Deg C by end of the
season.
10
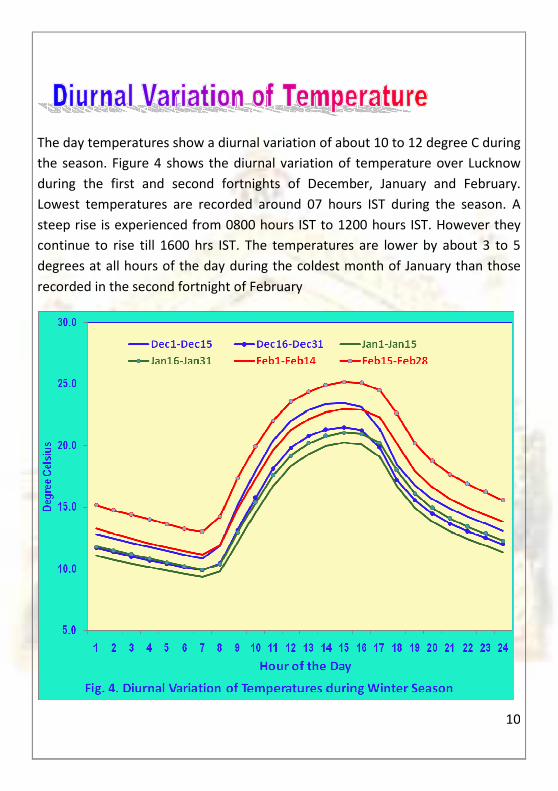
The day temperatures show a diurnal variation of about 10 to 12 degree C during
the season. Figure 4 shows the diurnal variation of temperature over Lucknow
during the first and second fortnights of December, January and February.
Lowest temperatures are recorded around 07 hours IST during the season. A
steep rise is experienced from 0800 hours IST to 1200 hours IST. However they
continue to rise till 1600 hrs IST. The temperatures are lower by about 3 to 5
degrees at all hours of the day during the coldest month of January than those
recorded in the second fortnight of February
11
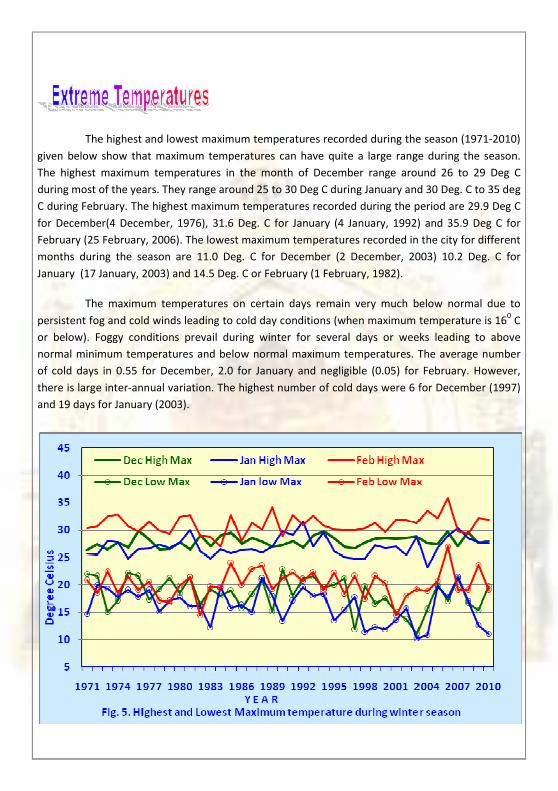
The highest and lowest maximum temperatures recorded during the season (1971-2010)
given below show that maximum temperatures can have quite a large range during the season.
The highest maximum temperatures in the month of December range around 26 to 29 Deg C
during most of the years. They range around 25 to 30 Deg C during January and 30 Deg. C to 35 deg
C during February. The highest maximum temperatures recorded during the period are 29.9 Deg C
for December(4 December, 1976), 31.6 Deg. C for January (4 January, 1992) and 35.9 Deg C for
February (25 February, 2006). The lowest maximum temperatures recorded in the city for different
months during the season are 11.0 Deg. C for December (2 December, 2003) 10.2 Deg. C for
January (17 January, 2003) and 14.5 Deg. C or February (1 February, 1982).
The maximum temperatures on certain days remain very much below normal due to
persistent fog and cold winds leading to cold day conditions (when maximum temperature is 160 C
or below). Foggy conditions prevail during winter for several days or weeks leading to above
normal minimum temperatures and below normal maximum temperatures. The average number
of cold days in 0.55 for December, 2.0 for January and negligible (0.05) for February. However,
there is large inter-annual variation. The highest number of cold days were 6 for December (1997)
and 19 days for January (2003).
12
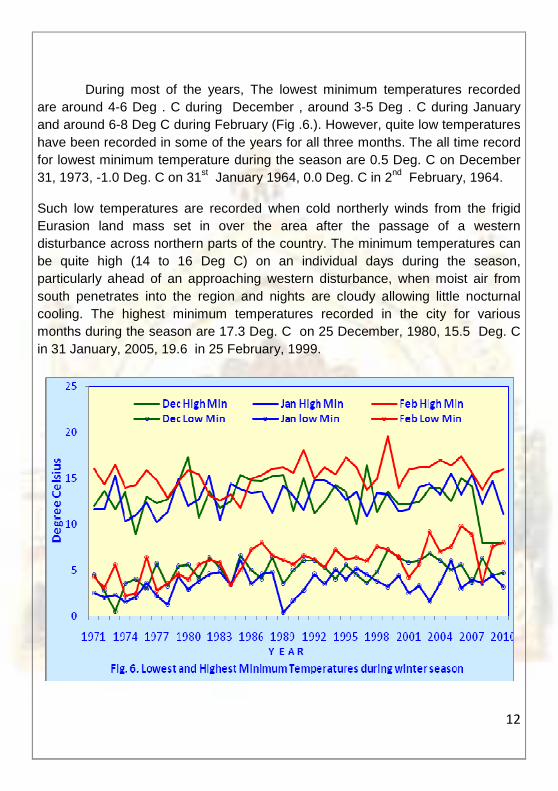
During most of the years, The lowest minimum temperatures recorded are around 4-6 Deg . C during December , around 3-5 Deg . C during January and around 6-8 Deg C during February (Fig .6.). However, quite low temperatures have been recorded in some of the years for all three months. The all time record for lowest minimum temperature during the season are 0.5 Deg. C on December 31, 1973, -1.0 Deg. C on 31st January 1964, 0.0 Deg. C in 2nd February, 1964.
Such low temperatures are recorded when cold northerly winds from the frigid Eurasion land mass set in over the area after the passage of a western disturbance across northern parts of the country. The minimum temperatures can be quite high (14 to 16 Deg C) on an individual days during the season, particularly ahead of an approaching western disturbance, when moist air from south penetrates into the region and nights are cloudy allowing little nocturnal cooling. The highest minimum temperatures recorded in the city for various months during the season are 17.3 Deg. C on 25 December, 1980, 15.5 Deg. C in 31 January, 2005, 19.6 in 25 February, 1999.
13
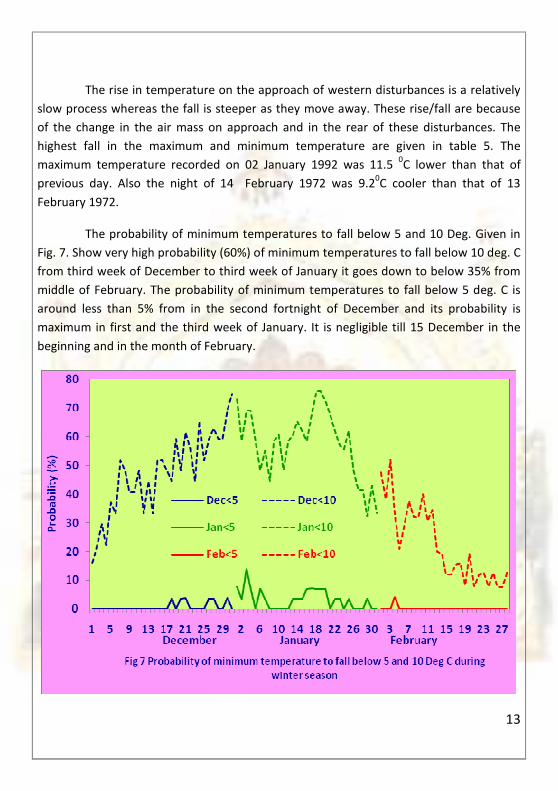
The rise in temperature on the approach of western disturbances is a relatively
slow process whereas the fall is steeper as they move away. These rise/fall are because
of the change in the air mass on approach and in the rear of these disturbances. The
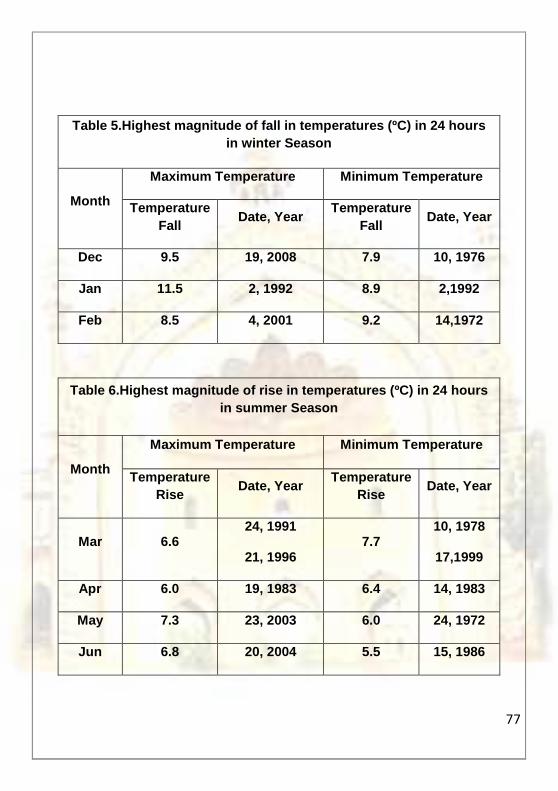
highest fall in the maximum and minimum temperature are given in table 5. The
maximum temperature recorded on 02 January 1992 was 11.5 0C lower than that of
previous day. Also the night of 14 February 1972 was 9.20C cooler than that of 13
February 1972.
The probability of minimum temperatures to fall below 5 and 10 Deg. Given in
Fig. 7. Show very high probability (60%) of minimum temperatures to fall below 10 deg. C
from third week of December to third week of January it goes down to below 35% from
middle of February. The probability of minimum temperatures to fall below 5 deg. C is
around less than 5% from in the second fortnight of December and its probability is
maximum in first and the third week of January. It is negligible till 15 December in the
beginning and in the month of February.
14
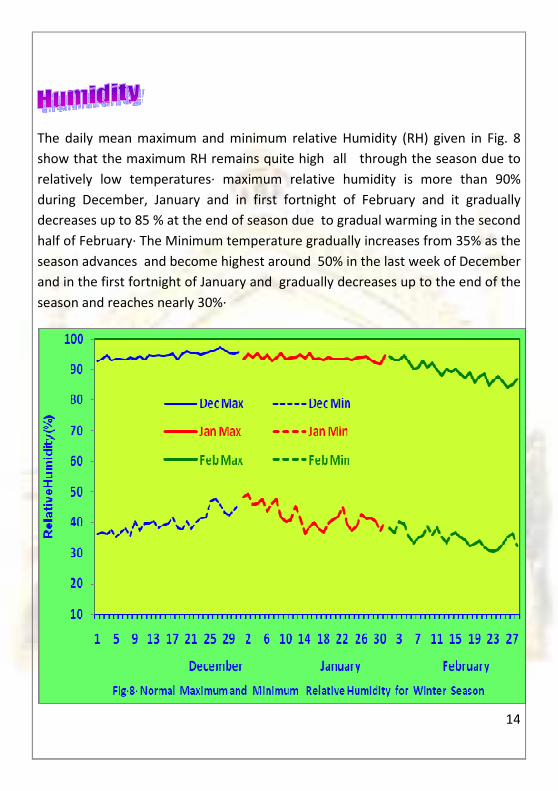
The daily mean maximum and minimum relative Humidity (RH) given in Fig. 8
show that the maximum RH remains quite high all through the season due to
relatively low temperatures∙ maximum relative humidity is more than 90%
during December, January and in first fortnight of February and it gradually
decreases up to 85 % at the end of season due to gradual warming in the second
half of February∙ The Minimum temperature gradually increases from 35% as the
season advances and become highest around 50% in the last week of December
and in the first fortnight of January and gradually decreases up to the end of the
season and reaches nearly 30%∙
15
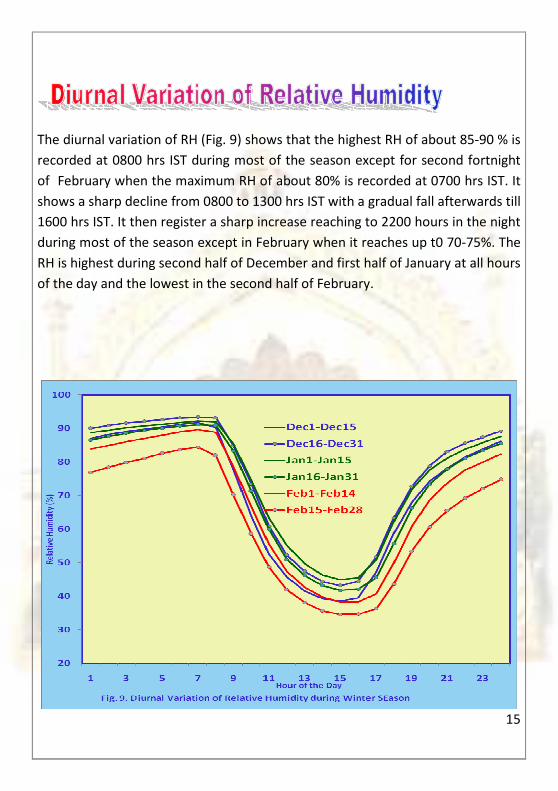
The diurnal variation of RH (Fig. 9) shows that the highest RH of about 85-90 % is
recorded at 0800 hrs IST during most of the season except for second fortnight
of February when the maximum RH of about 80% is recorded at 0700 hrs IST. It
shows a sharp decline from 0800 to 1300 hrs IST with a gradual fall afterwards till
1600 hrs IST. It then register a sharp increase reaching to 2200 hours in the night
during most of the season except in February when it reaches up t0 70-75%. The
RH is highest during second half of December and first half of January at all hours
of the day and the lowest in the second half of February.
16
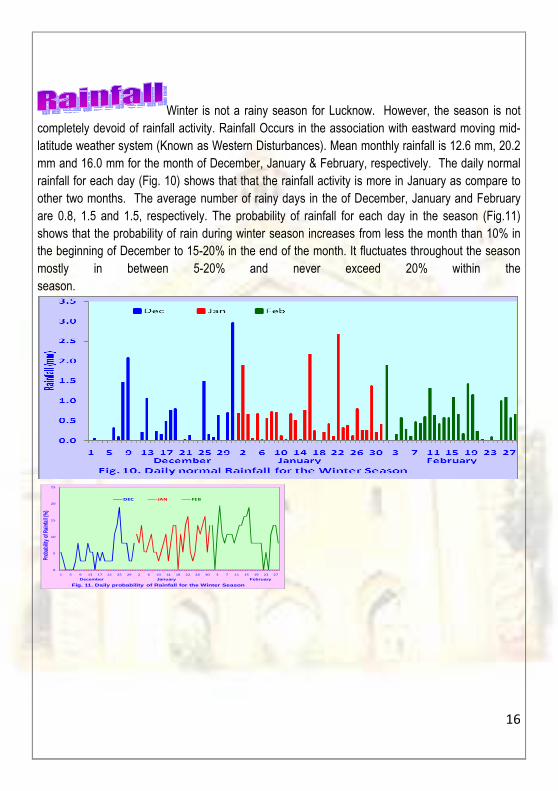
Winter is not a rainy season for Lucknow. However, the season is not
completely devoid of rainfall activity. Rainfall Occurs in the association with eastward moving mid-
latitude weather system (Known as Western Disturbances). Mean monthly rainfall is 12.6 mm, 20.2
mm and 16.0 mm for the month of December, January & February, respectively. The daily normal
rainfall for each day (Fig. 10) shows that that the rainfall activity is more in January as compare to
other two months. The average number of rainy days in the of December, January and February
are 0.8, 1.5 and 1.5, respectively. The probability of rainfall for each day in the season (Fig.11)
shows that the probability of rain during winter season increases from less the month than 10% in
the beginning of December to 15-20% in the end of the month. It fluctuates throughout the season
mostly in between 5-20% and never exceed 20% within the
season.
0
5
10
15
20
25
1 5 9 13 17 21 25 29 2 6 10 14 18 22 26 30 3 7 11 15 19 23 27
Prob
ability
of R
ainfal
l (%)
December Janua ry February
Fig. 11. Daily probability of Rainfall for the Winter Seaso n
DEC JAN FEB
17
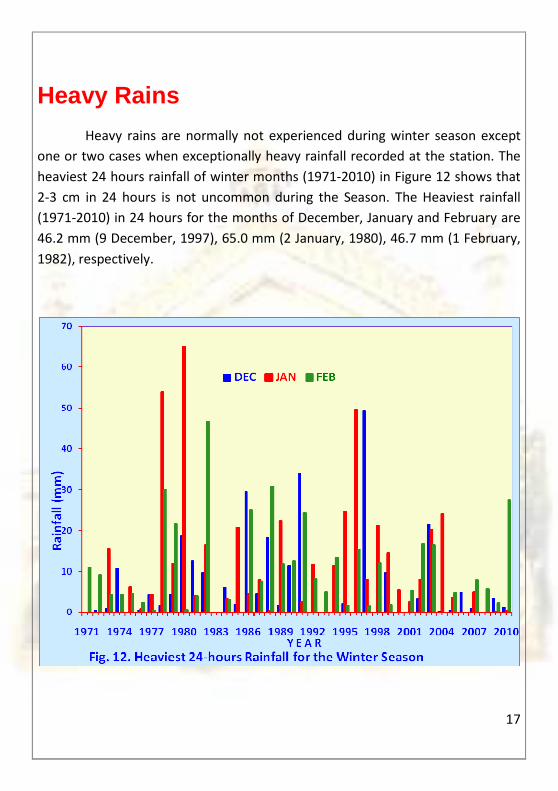
Heavy Rains
Heavy rains are normally not experienced during winter season except
one or two cases when exceptionally heavy rainfall recorded at the station. The
heaviest 24 hours rainfall of winter months (1971-2010) in Figure 12 shows that
2-3 cm in 24 hours is not uncommon during the Season. The Heaviest rainfall
(1971-2010) in 24 hours for the months of December, January and February are
46.2 mm (9 December, 1997), 65.0 mm (2 January, 1980), 46.7 mm (1 February,
1982), respectively.
18
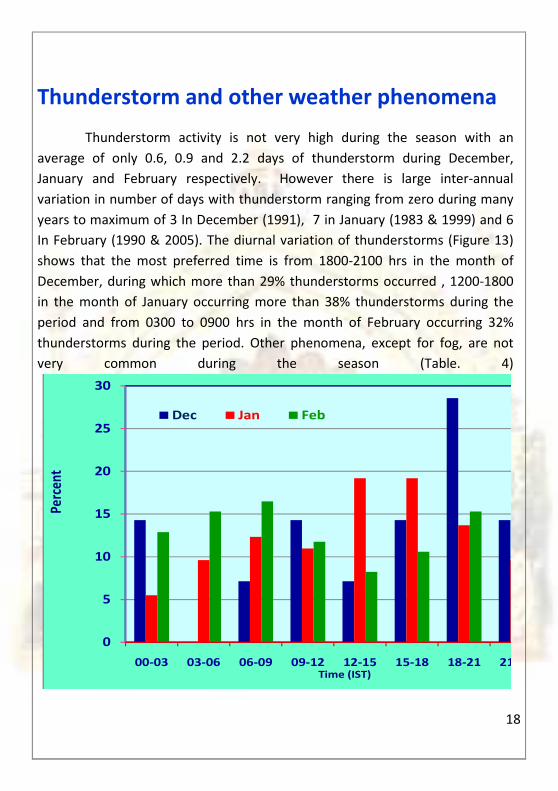
Thunderstorm and other weather phenomena
Thunderstorm activity is not very high during the season with an
average of only 0.6, 0.9 and 2.2 days of thunderstorm during December,
January and February respectively. However there is large inter-annual
variation in number of days with thunderstorm ranging from zero during many
years to maximum of 3 In December (1991), 7 in January (1983 & 1999) and 6
In February (1990 & 2005). The diurnal variation of thunderstorms (Figure 13)
shows that the most preferred time is from 1800-2100 hrs in the month of
December, during which more than 29% thunderstorms occurred , 1200-1800
in the month of January occurring more than 38% thunderstorms during the
period and from 0300 to 0900 hrs in the month of February occurring 32%
thunderstorms during the period. Other phenomena, except for fog, are not
very common during the season (Table. 4)
0
5
10
15
20
25
30
00-03 03-06 06-09 09-12 12-15 15-18 18-21 21
Pe
rcen
t
Time (IST)
Dec Jan Feb
19
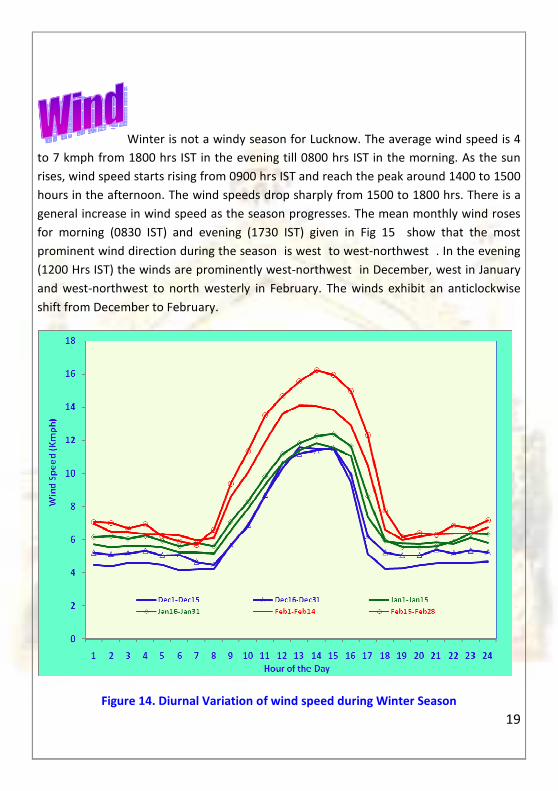
Winter is not a windy season for Lucknow. The average wind speed is 4
to 7 kmph from 1800 hrs IST in the evening till 0800 hrs IST in the morning. As the sun
rises, wind speed starts rising from 0900 hrs IST and reach the peak around 1400 to 1500
hours in the afternoon. The wind speeds drop sharply from 1500 to 1800 hrs. There is a
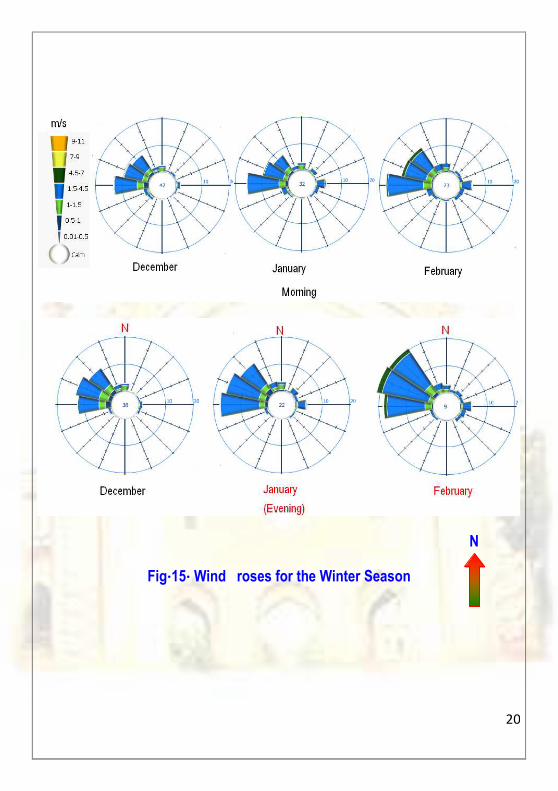
general increase in wind speed as the season progresses. The mean monthly wind roses
for morning (0830 IST) and evening (1730 IST) given in Fig 15 show that the most
prominent wind direction during the season is west to west-northwest . In the evening
(1200 Hrs IST) the winds are prominently west-northwest in December, west in January
and west-northwest to north westerly in February. The winds exhibit an anticlockwise
shift from December to February.
Figure 14. Diurnal Variation of wind speed during Winter Season
20
N
Fig∙15∙ Wind roses for the Winter Season
21
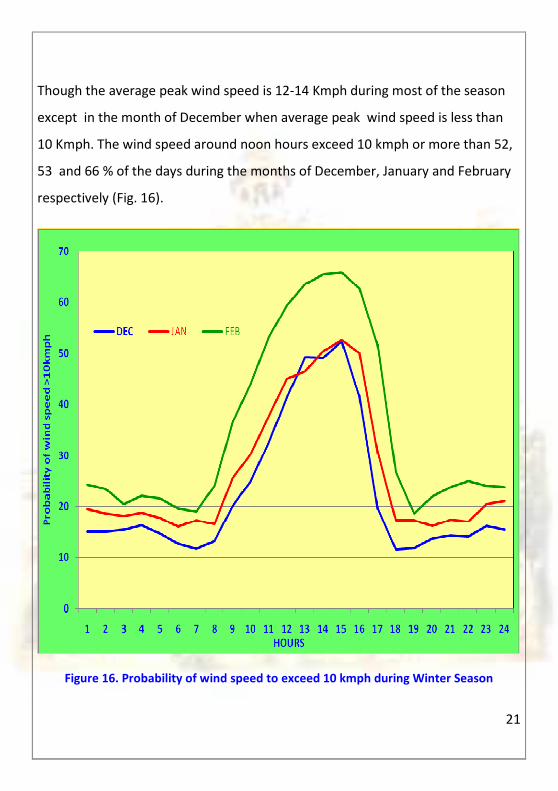
Though the average peak wind speed is 12-14 Kmph during most of the season
except in the month of December when average peak wind speed is less than
10 Kmph. The wind speed around noon hours exceed 10 kmph or more than 52,
53 and 66 % of the days during the months of December, January and February
respectively (Fig. 16).
Figure 16. Probability of wind speed to exceed 10 kmph during Winter Season
22
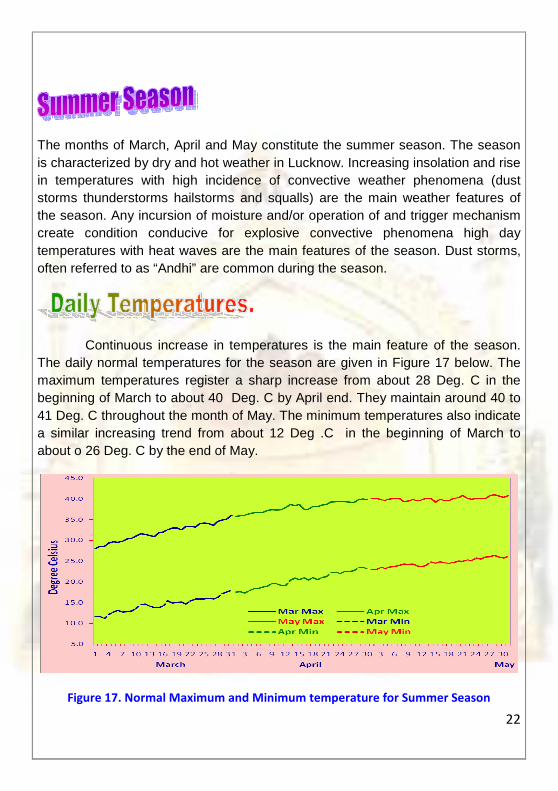
The months of March, April and May constitute the summer season. The season is characterized by dry and hot weather in Lucknow. Increasing insolation and rise in temperatures with high incidence of convective weather phenomena (dust storms thunderstorms hailstorms and squalls) are the main weather features of the season. Any incursion of moisture and/or operation of and trigger mechanism create condition conducive for explosive convective phenomena high day temperatures with heat waves are the main features of the season. Dust storms, often referred to as “Andhi” are common during the season.
Continuous increase in temperatures is the main feature of the season. The daily normal temperatures for the season are given in Figure 17 below. The maximum temperatures register a sharp increase from about 28 Deg. C in the beginning of March to about 40 Deg. C by April end. They maintain around 40 to 41 Deg. C throughout the month of May. The minimum temperatures also indicate a similar increasing trend from about 12 Deg .C in the beginning of March to about o 26 Deg. C by the end of May.
Figure 17. Normal Maximum and Minimum temperature for Summer Season
23
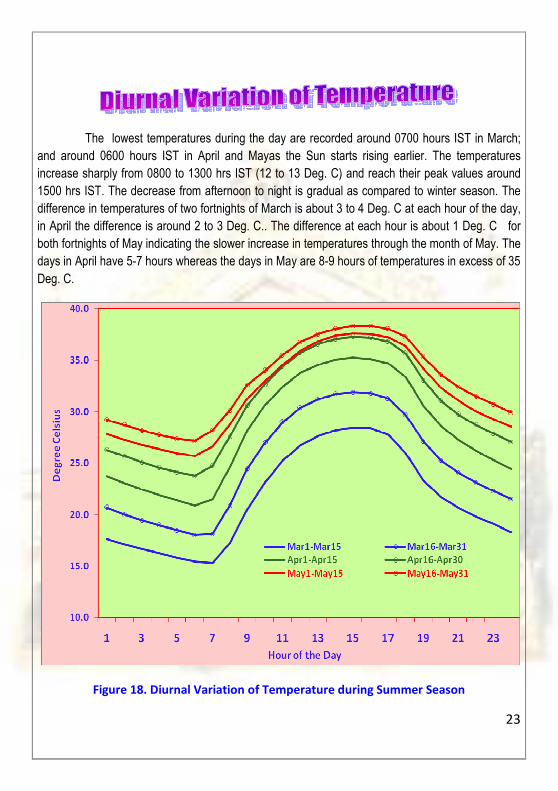
The lowest temperatures during the day are recorded around 0700 hours IST in March;
and around 0600 hours IST in April and Mayas the Sun starts rising earlier. The temperatures
increase sharply from 0800 to 1300 hrs IST (12 to 13 Deg. C) and reach their peak values around
1500 hrs IST. The decrease from afternoon to night is gradual as compared to winter season. The
difference in temperatures of two fortnights of March is about 3 to 4 Deg. C at each hour of the day,
in April the difference is around 2 to 3 Deg. C.. The difference at each hour is about 1 Deg. C for
both fortnights of May indicating the slower increase in temperatures through the month of May. The
days in April have 5-7 hours whereas the days in May are 8-9 hours of temperatures in excess of 35
Deg. C.
Figure 18. Diurnal Variation of Temperature during Summer Season
24
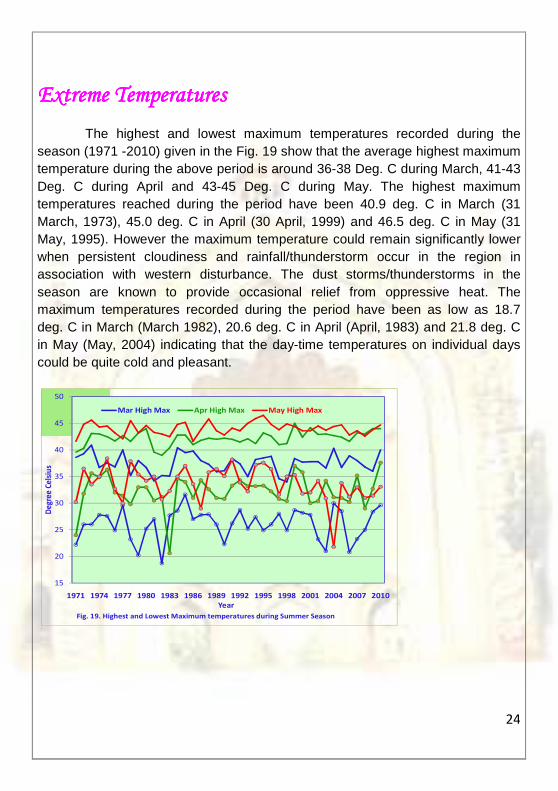
Extreme TemperatuExtreme TemperatuExtreme TemperatuExtreme Temperaturesresresres
The highest and lowest maximum temperatures recorded during the season (1971 -2010) given in the Fig. 19 show that the average highest maximum temperature during the above period is around 36-38 Deg. C during March, 41-43 Deg. C during April and 43-45 Deg. C during May. The highest maximum temperatures reached during the period have been 40.9 deg. C in March (31 March, 1973), 45.0 deg. C in April (30 April, 1999) and 46.5 deg. C in May (31 May, 1995). However the maximum temperature could remain significantly lower when persistent cloudiness and rainfall/thunderstorm occur in the region in association with western disturbance. The dust storms/thunderstorms in the season are known to provide occasional relief from oppressive heat. The maximum temperatures recorded during the period have been as low as 18.7 deg. C in March (March 1982), 20.6 deg. C in April (April, 1983) and 21.8 deg. C in May (May, 2004) indicating that the day-time temperatures on individual days could be quite cold and pleasant.
15
20
25
30
35
40
45
50
1971 1974 1977 1980 1983 1986 1989 1992 1995 1998 2001 2004 2007 2010
De
gre
e C
els
ius
Year
Fig. 19. Highest and Lowest Maximum temperatures during Summer Season
Mar High Max Apr High Max May High Max
25
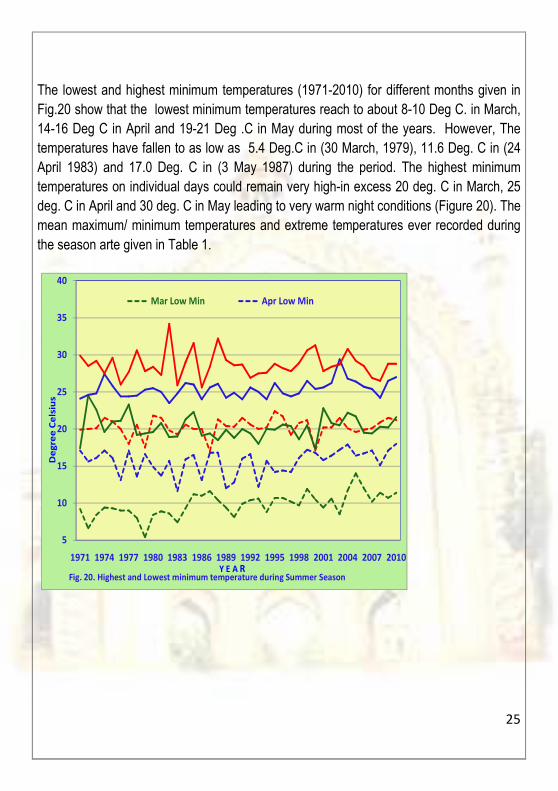
The lowest and highest minimum temperatures (1971-2010) for different months given in
Fig.20 show that the lowest minimum temperatures reach to about 8-10 Deg C. in March,
14-16 Deg C in April and 19-21 Deg .C in May during most of the years. However, The
temperatures have fallen to as low as 5.4 Deg.C in (30 March, 1979), 11.6 Deg. C in (24
April 1983) and 17.0 Deg. C in (3 May 1987) during the period. The highest minimum
temperatures on individual days could remain very high-in excess 20 deg. C in March, 25
deg. C in April and 30 deg. C in May leading to very warm night conditions (Figure 20). The
mean maximum/ minimum temperatures and extreme temperatures ever recorded during
the season arte given in Table 1.
5
10
15
20
25
30
35
40
1971 1974 1977 1980 1983 1986 1989 1992 1995 1998 2001 2004 2007 2010
De
gre
e C
els
ius
Y E A RFig. 20. Highest and Lowest minimum temperature during Summer Season
Mar Low Min Apr Low Min
26
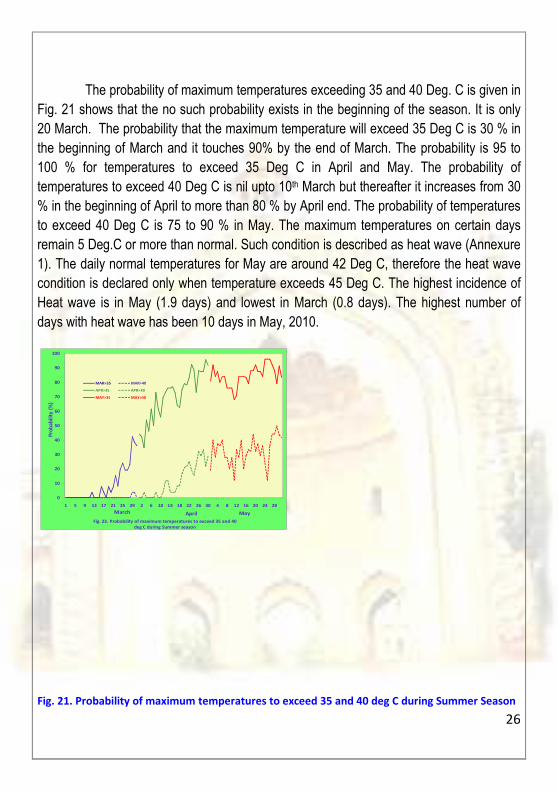
The probability of maximum temperatures exceeding 35 and 40 Deg. C is given in
Fig. 21 shows that the no such probability exists in the beginning of the season. It is only
20 March. The probability that the maximum temperature will exceed 35 Deg C is 30 % in
the beginning of March and it touches 90% by the end of March. The probability is 95 to
100 % for temperatures to exceed 35 Deg C in April and May. The probability of
temperatures to exceed 40 Deg C is nil upto 10th March but thereafter it increases from 30
% in the beginning of April to more than 80 % by April end. The probability of temperatures
to exceed 40 Deg C is 75 to 90 % in May. The maximum temperatures on certain days
remain 5 Deg.C or more than normal. Such condition is described as heat wave (Annexure
1). The daily normal temperatures for May are around 42 Deg C, therefore the heat wave
condition is declared only when temperature exceeds 45 Deg C. The highest incidence of
Heat wave is in May (1.9 days) and lowest in March (0.8 days). The highest number of
days with heat wave has been 10 days in May, 2010.
0
10
20
30
40
50
60
70
80
90
100
1 5 9 13 17 21 25 29 2 6 10 14 18 22 26 30 4 8 12 16 20 24 28
MAR>35 MAR>40
APR>35 APR>40
MAY>35 MAY>40
March April May
Pro
ba
bil
ity
(%)
Fig. 23. Probability of maximum temperatures to exceed 35 and 40
deg C during Summer season
Fig. 21. Probability of maximum temperatures to exceed 35 and 40 deg C during Summer Season
27
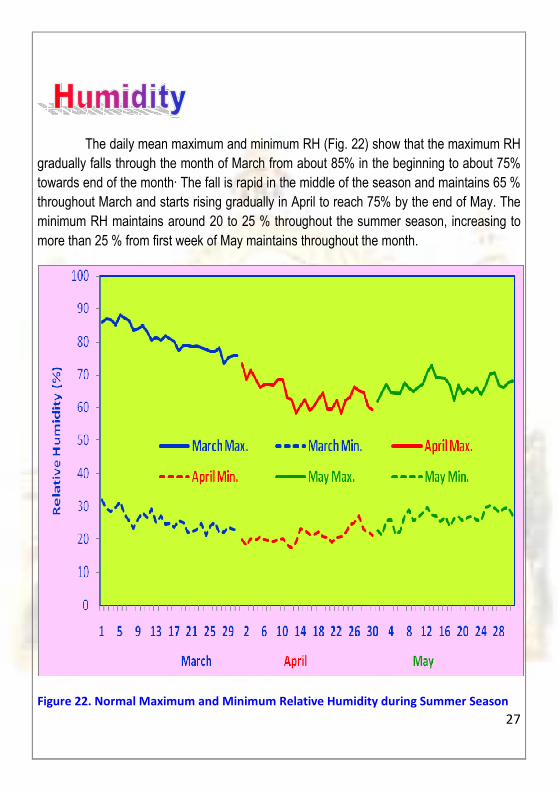
The daily mean maximum and minimum RH (Fig. 22) show that the maximum RH
gradually falls through the month of March from about 85% in the beginning to about 75%
towards end of the month· The fall is rapid in the middle of the season and maintains 65 %
throughout March and starts rising gradually in April to reach 75% by the end of May. The
minimum RH maintains around 20 to 25 % throughout the summer season, increasing to
more than 25 % from first week of May maintains throughout the month.
Figure 22. Normal Maximum and Minimum Relative Humidity during Summer Season
28
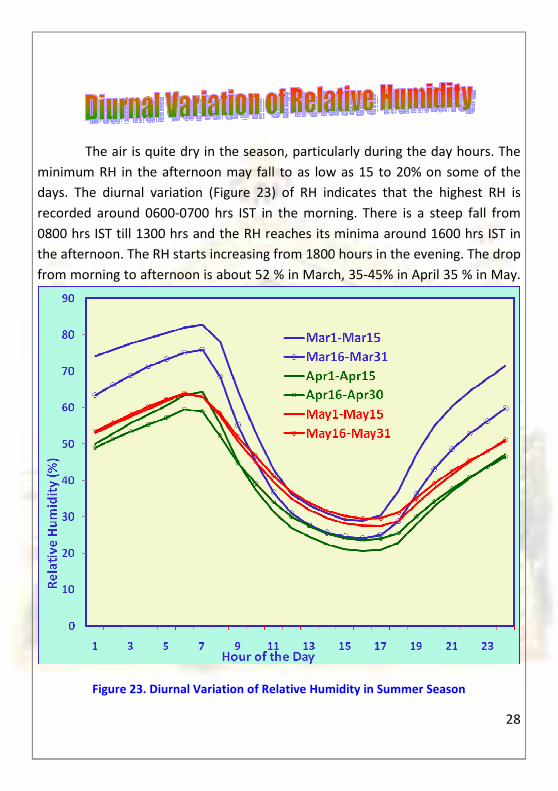
The air is quite dry in the season, particularly during the day hours. The
minimum RH in the afternoon may fall to as low as 15 to 20% on some of the
days. The diurnal variation (Figure 23) of RH indicates that the highest RH is
recorded around 0600-0700 hrs IST in the morning. There is a steep fall from
0800 hrs IST till 1300 hrs and the RH reaches its minima around 1600 hrs IST in
the afternoon. The RH starts increasing from 1800 hours in the evening. The drop
from morning to afternoon is about 52 % in March, 35-45% in April 35 % in May.
Figure 23. Diurnal Variation of Relative Humidity in Summer Season
29
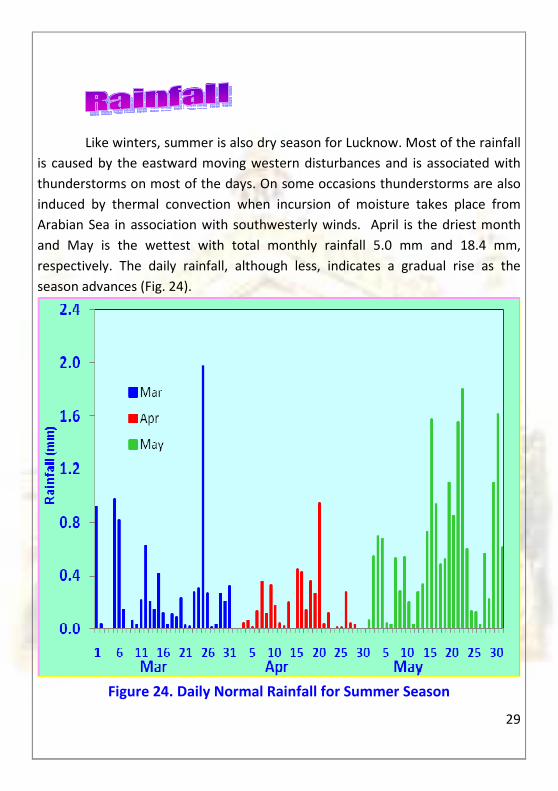
Like winters, summer is also dry season for Lucknow. Most of the rainfall
is caused by the eastward moving western disturbances and is associated with
thunderstorms on most of the days. On some occasions thunderstorms are also
induced by thermal convection when incursion of moisture takes place from
Arabian Sea in association with southwesterly winds. April is the driest month
and May is the wettest with total monthly rainfall 5.0 mm and 18.4 mm,
respectively. The daily rainfall, although less, indicates a gradual rise as the
season advances (Fig. 24).
Figure 24. Daily Normal Rainfall for Summer Season
30
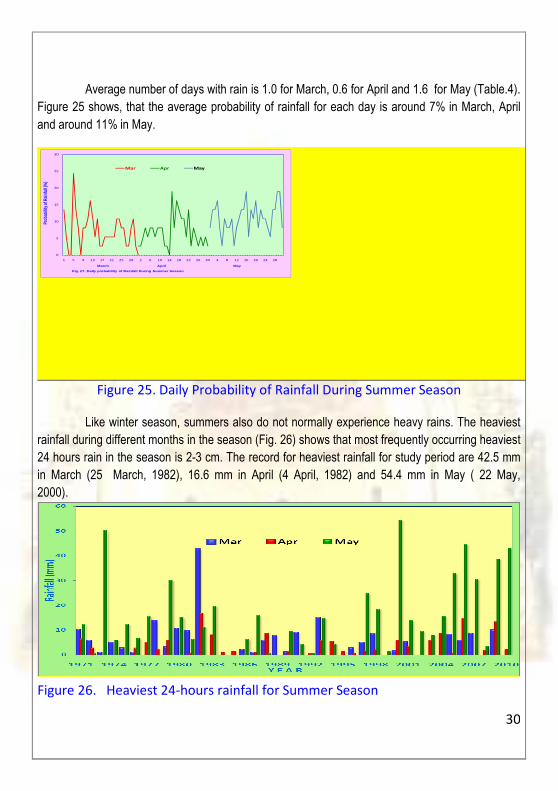
Average number of days with rain is 1.0 for March, 0.6 for April and 1.6 for May (Table.4).
Figure 25 shows, that the average probability of rainfall for each day is around 7% in March, April
and around 11% in May.
0
5
10
15
20
25
30
1 5 9 13 17 21 25 29 2 6 10 14 18 22 26 30 4 8 12 16 20 24 28
Prob
abilit
y of R
ainfal
l (%)
March Ap ril May
Fig. 27. Daily probability of Rainfall During Summe r Season
Mar Apr May
Figure 25. Daily Probability of Rainfall During Summer Season
Like winter season, summers also do not normally experience heavy rains. The heaviest
rainfall during different months in the season (Fig. 26) shows that most frequently occurring heaviest
24 hours rain in the season is 2-3 cm. The record for heaviest rainfall for study period are 42.5 mm
in March (25 March, 1982), 16.6 mm in April (4 April, 1982) and 54.4 mm in May ( 22 May,
2000).
Figure 26. Heaviest 24-hours rainfall for Summer Season
31
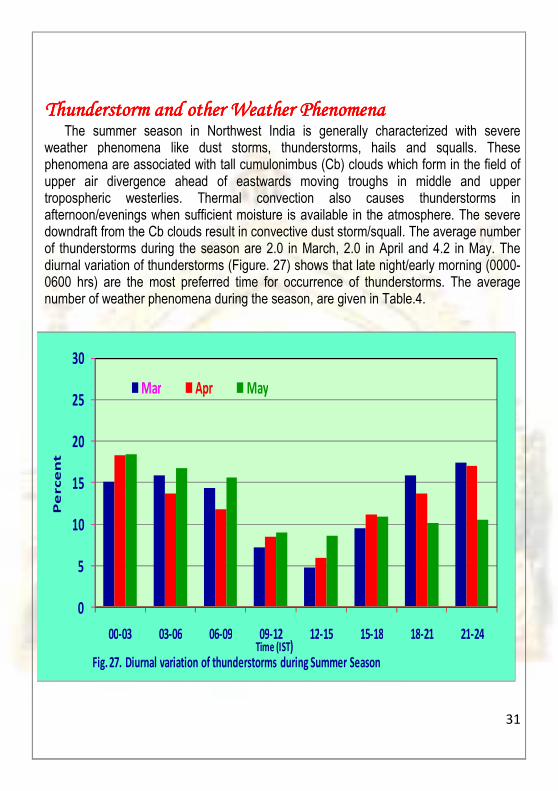
Thunderstorm and other Weather PhenomenaThunderstorm and other Weather PhenomenaThunderstorm and other Weather PhenomenaThunderstorm and other Weather Phenomena The summer season in Northwest India is generally characterized with severe weather phenomena like dust storms, thunderstorms, hails and squalls. These phenomena are associated with tall cumulonimbus (Cb) clouds which form in the field of upper air divergence ahead of eastwards moving troughs in middle and upper tropospheric westerlies. Thermal convection also causes thunderstorms in afternoon/evenings when sufficient moisture is available in the atmosphere. The severe downdraft from the Cb clouds result in convective dust storm/squall. The average number of thunderstorms during the season are 2.0 in March, 2.0 in April and 4.2 in May. The diurnal variation of thunderstorms (Figure. 27) shows that late night/early morning (0000-0600 hrs) are the most preferred time for occurrence of thunderstorms. The average number of weather phenomena during the season, are given in Table.4.
0
5
10
15
20
25
30
00-03 03-06 06-09 09-12 12-15 15-18 18-21 21-24
Pe
rce
nt
Time (IST)Fig. 27. Diurnal variation of thunderstorms during Summer Season
Mar Apr May
32
Impact of Thunderstorms/Dust storms on temperaturesImpact of Thunderstorms/Dust storms on temperaturesImpact of Thunderstorms/Dust storms on temperaturesImpact of Thunderstorms/Dust storms on temperatures
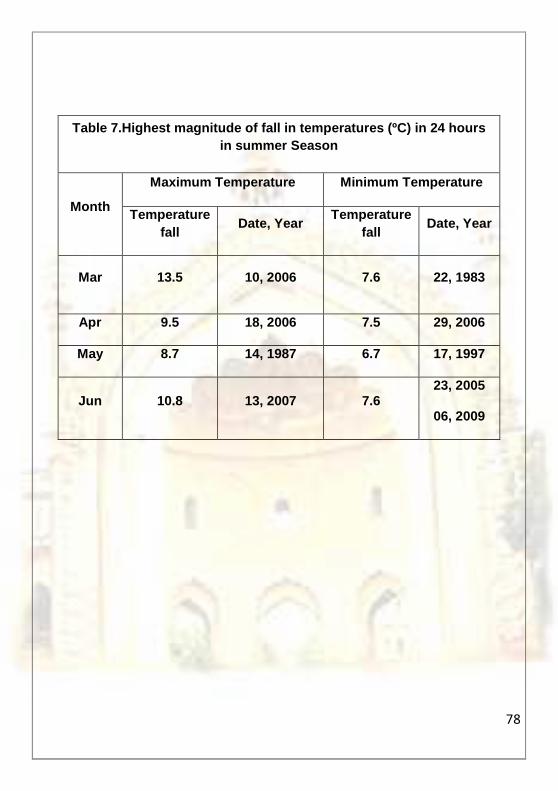
The dust storms/thunderstorms, though known for causing loss of life and property and other inconveniences, do provide relief from the oppressive heat of the summer season. On an average, there are two or three occasions when the maximum/minimum temperatures fall by 4-50 C in 24 hours due to these thunderstorm activities. The maximum temperature on 10 March 2006 was 13.5 oC lower than that of previous night also the night of 22 March 1983 was 7.6 oC cooler than that of previous night. The highest fall in maximum and minimum temperatures during different months are given in table 7.
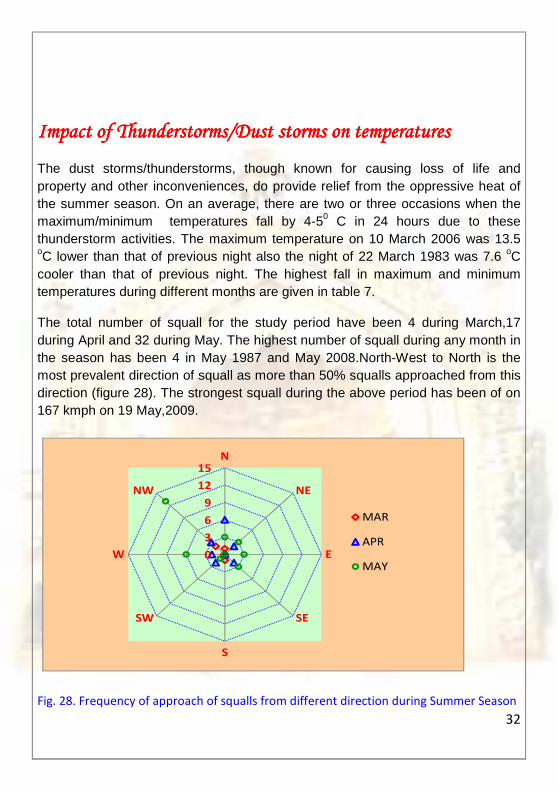
The total number of squall for the study period have been 4 during March,17 during April and 32 during May. The highest number of squall during any month in the season has been 4 in May 1987 and May 2008.North-West to North is the most prevalent direction of squall as more than 50% squalls approached from this direction (figure 28). The strongest squall during the above period has been of on 167 kmph on 19 May,2009.
0
3
6
9
12
15N
NE
E
SE
S
SW
W
NW
MAR
APR
MAY
Fig. 28. Frequency of approach of squalls from different direction during Summer Season
33
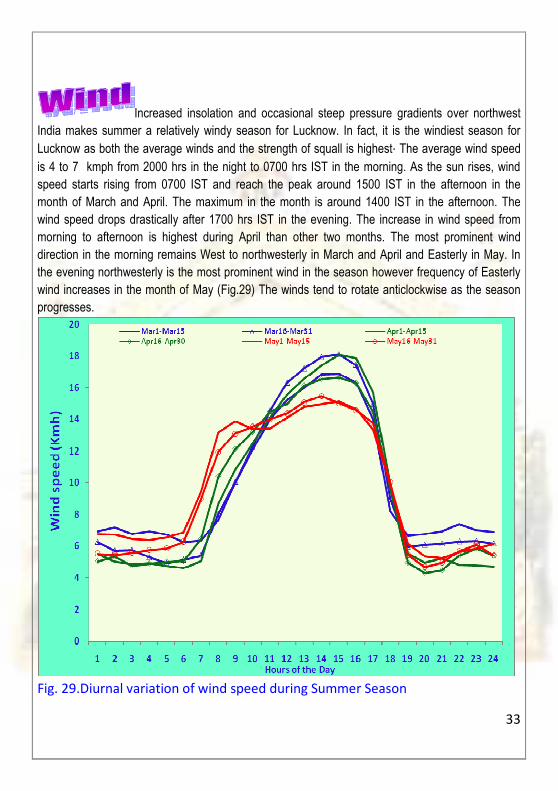
Increased insolation and occasional steep pressure gradients over northwest
India makes summer a relatively windy season for Lucknow. In fact, it is the windiest season for
Lucknow as both the average winds and the strength of squall is highest∙ The average wind speed
is 4 to 7 kmph from 2000 hrs in the night to 0700 hrs IST in the morning. As the sun rises, wind
speed starts rising from 0700 IST and reach the peak around 1500 IST in the afternoon in the
month of March and April. The maximum in the month is around 1400 IST in the afternoon. The
wind speed drops drastically after 1700 hrs IST in the evening. The increase in wind speed from
morning to afternoon is highest during April than other two months. The most prominent wind
direction in the morning remains West to northwesterly in March and April and Easterly in May. In
the evening northwesterly is the most prominent wind in the season however frequency of Easterly
wind increases in the month of May (Fig.29) The winds tend to rotate anticlockwise as the season
progresses.
Fig. 29.Diurnal variation of wind speed during Summer Season
34
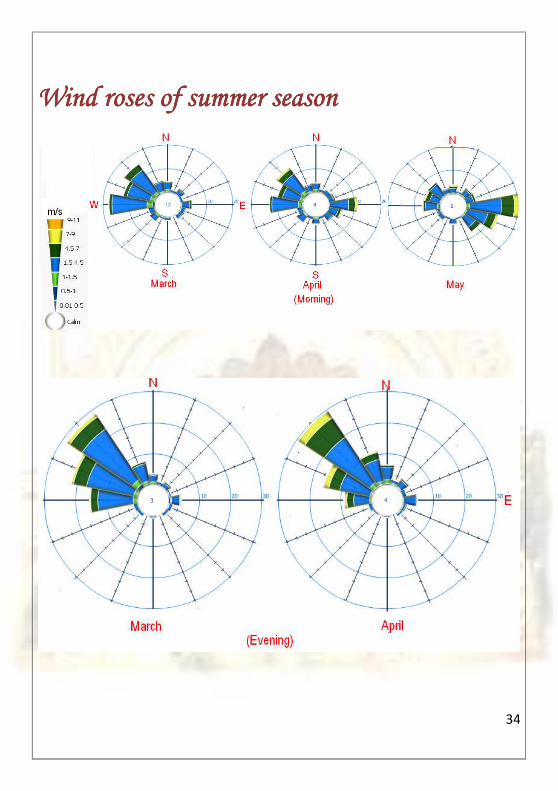
Wind roses oWind roses oWind roses oWind roses of summer seasonf summer seasonf summer seasonf summer season
35
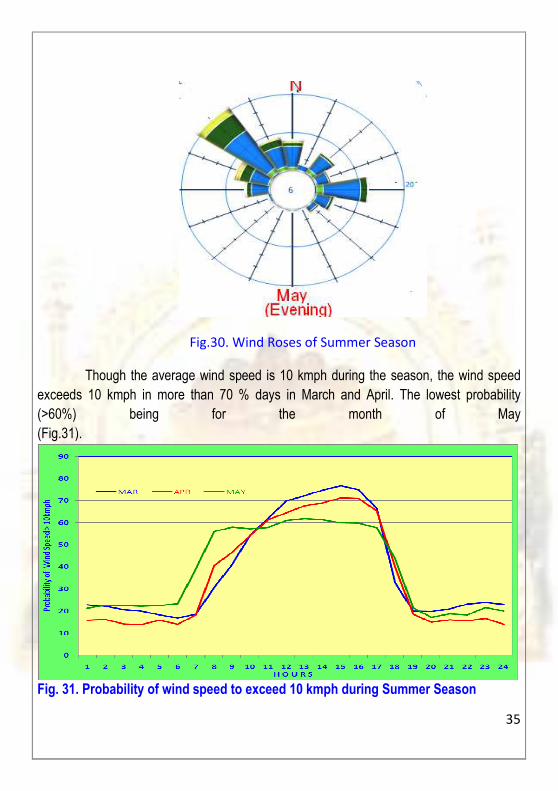
Fig.30. Wind Roses of Summer Season
Though the average wind speed is 10 kmph during the season, the wind speed
exceeds 10 kmph in more than 70 % days in March and April. The lowest probability
(>60%) being for the month of May
(Fig.31).
Fig. 31. Probability of wind speed to exceed 10 kmph during Summer Season
36
Monsoon SeasonMonsoon SeasonMonsoon SeasonMonsoon Season
This is the main rainy season for most parts of India including Lucknow.
Frequent rainfall/thunderstorms, occasional heavy rains are characteristic features of
this season.
Onset and withdrawal of Monsoon.
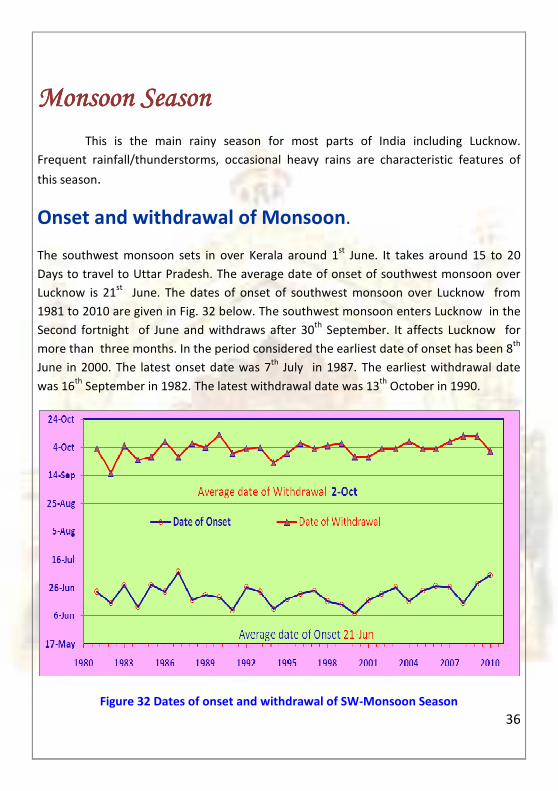
The southwest monsoon sets in over Kerala around 1st
June. It takes around 15 to 20
Days to travel to Uttar Pradesh. The average date of onset of southwest monsoon over
Lucknow is 21st
June. The dates of onset of southwest monsoon over Lucknow from
1981 to 2010 are given in Fig. 32 below. The southwest monsoon enters Lucknow in the
Second fortnight of June and withdraws after 30th
September. It affects Lucknow for
more than three months. In the period considered the earliest date of onset has been 8th
June in 2000. The latest onset date was 7th
July in 1987. The earliest withdrawal date
was 16th
September in 1982. The latest withdrawal date was 13th
October in 1990.
Figure 32 Dates of onset and withdrawal of SW-Monsoon Season
37
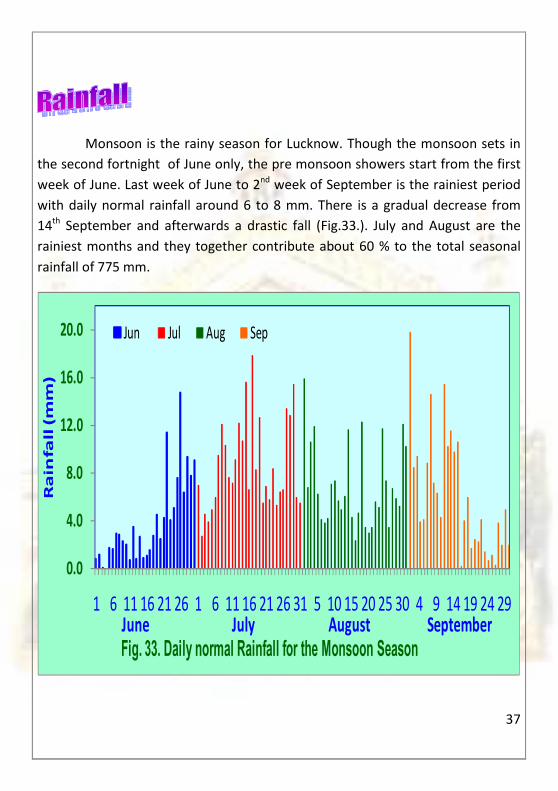
Monsoon is the rainy season for Lucknow. Though the monsoon sets in
the second fortnight of June only, the pre monsoon showers start from the first
week of June. Last week of June to 2nd
week of September is the rainiest period
with daily normal rainfall around 6 to 8 mm. There is a gradual decrease from
14th
September and afterwards a drastic fall (Fig.33.). July and August are the
rainiest months and they together contribute about 60 % to the total seasonal
rainfall of 775 mm.
0.0
4.0
8.0
12.0
16.0
20.0
1 6 11 16 21 26 1 6 11 16 21 26 31 5 10 15 20 25 30 4 9 14 19 24 29
Ra
infa
ll (
mm
)
June July August September
Fig. 33. Daily normal Rainfall for the Monsoon Season
Jun Jul Aug Sep
38
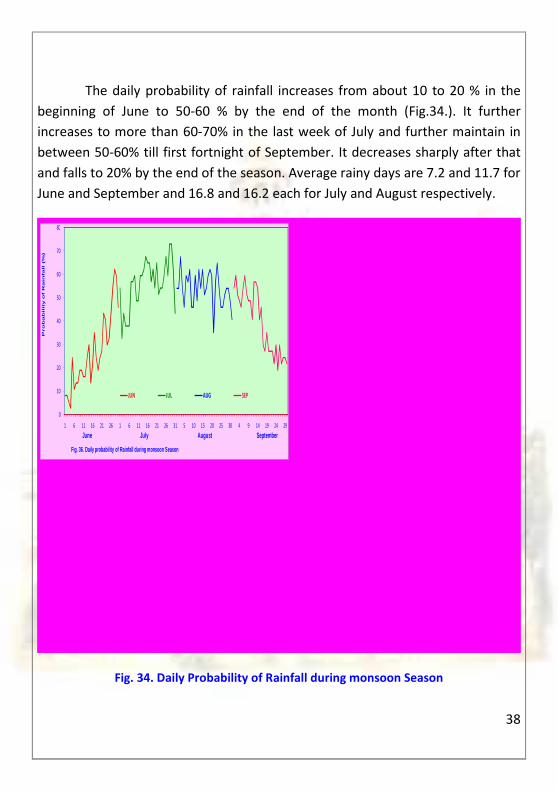
The daily probability of rainfall increases from about 10 to 20 % in the
beginning of June to 50-60 % by the end of the month (Fig.34.). It further
increases to more than 60-70% in the last week of July and further maintain in
between 50-60% till first fortnight of September. It decreases sharply after that
and falls to 20% by the end of the season. Average rainy days are 7.2 and 11.7 for
June and September and 16.8 and 16.2 each for July and August respectively.
0
10
20
30
40
50
60
70
80
1 6 11 16 21 26 1 6 11 16 21 26 31 5 10 15 20 25 30 4 9 14 19 24 29
Probability o
f R
ain
fall (
%)
June July August September
Fig. 36. Daily probability of Rainfall during monso on Season
JUN JUL AUG SEP
Fig. 34. Daily Probability of Rainfall during monsoon Season
39
Heavy RainfallHeavy RainfallHeavy RainfallHeavy Rainfall
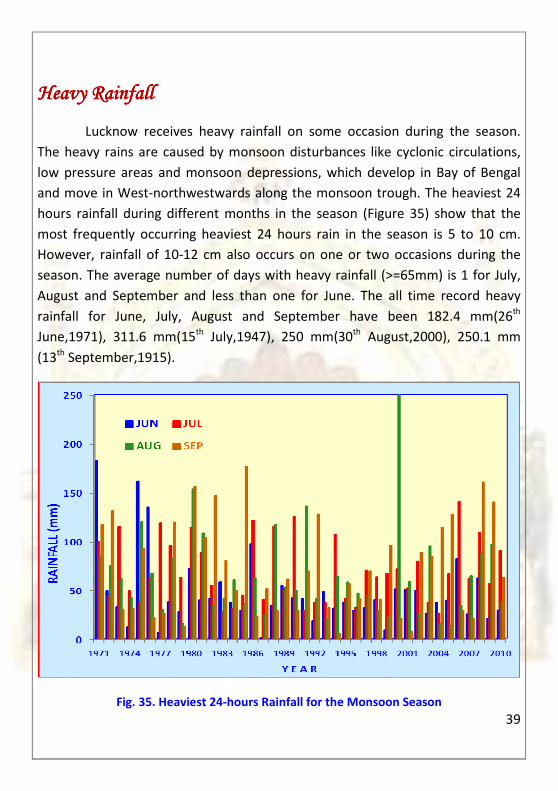
Lucknow receives heavy rainfall on some occasion during the season.
The heavy rains are caused by monsoon disturbances like cyclonic circulations,
low pressure areas and monsoon depressions, which develop in Bay of Bengal
and move in West-northwestwards along the monsoon trough. The heaviest 24
hours rainfall during different months in the season (Figure 35) show that the
most frequently occurring heaviest 24 hours rain in the season is 5 to 10 cm.
However, rainfall of 10-12 cm also occurs on one or two occasions during the
season. The average number of days with heavy rainfall (>=65mm) is 1 for July,
August and September and less than one for June. The all time record heavy
rainfall for June, July, August and September have been 182.4 mm(26th
June,1971), 311.6 mm(15th
July,1947), 250 mm(30th
August,2000), 250.1 mm
(13th
September,1915).
Fig. 35. Heaviest 24-hours Rainfall for the Monsoon Season
40
Thunderstorm and other weatheThunderstorm and other weatheThunderstorm and other weatheThunderstorm and other weather Phenomenar Phenomenar Phenomenar Phenomena
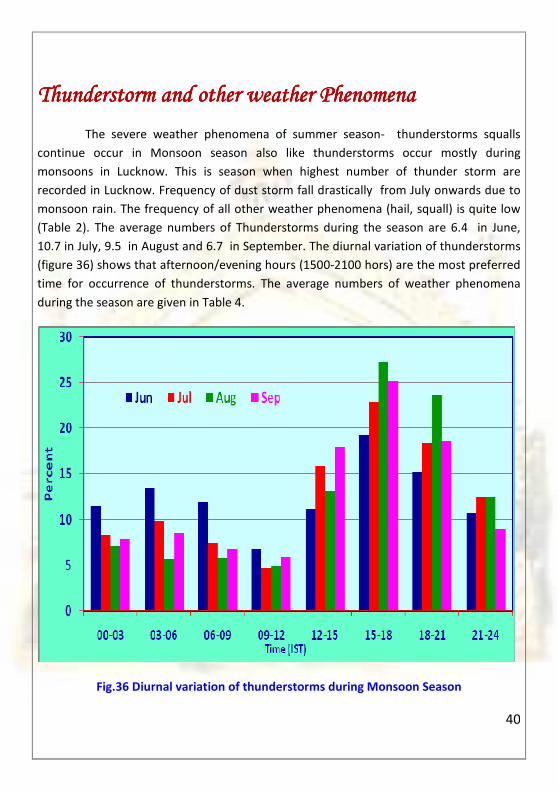
The severe weather phenomena of summer season- thunderstorms squalls
continue occur in Monsoon season also like thunderstorms occur mostly during
monsoons in Lucknow. This is season when highest number of thunder storm are
recorded in Lucknow. Frequency of dust storm fall drastically from July onwards due to
monsoon rain. The frequency of all other weather phenomena (hail, squall) is quite low
(Table 2). The average numbers of Thunderstorms during the season are 6.4 in June,
10.7 in July, 9.5 in August and 6.7 in September. The diurnal variation of thunderstorms
(figure 36) shows that afternoon/evening hours (1500-2100 hors) are the most preferred
time for occurrence of thunderstorms. The average numbers of weather phenomena
during the season are given in Table 4.
Fig.36 Diurnal variation of thunderstorms during Monsoon Season
41
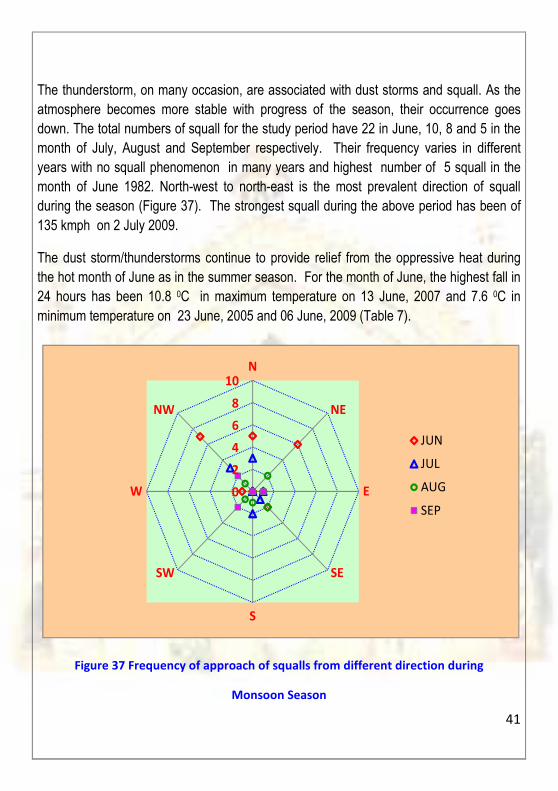
The thunderstorm, on many occasion, are associated with dust storms and squall. As the
atmosphere becomes more stable with progress of the season, their occurrence goes
down. The total numbers of squall for the study period have 22 in June, 10, 8 and 5 in the
month of July, August and September respectively. Their frequency varies in different
years with no squall phenomenon in many years and highest number of 5 squall in the
month of June 1982. North-west to north-east is the most prevalent direction of squall
during the season (Figure 37). The strongest squall during the above period has been of
135 kmph on 2 July 2009.
The dust storm/thunderstorms continue to provide relief from the oppressive heat during
the hot month of June as in the summer season. For the month of June, the highest fall in
24 hours has been 10.8 0C in maximum temperature on 13 June, 2007 and 7.6 0C in
minimum temperature on 23 June, 2005 and 06 June, 2009 (Table 7).
0
2
4
6
8
10N
NE
E
SE
S
SW
W
NW
JUN
JUL
AUG
SEP
Figure 37 Frequency of approach of squalls from different direction during
Monsoon Season
42
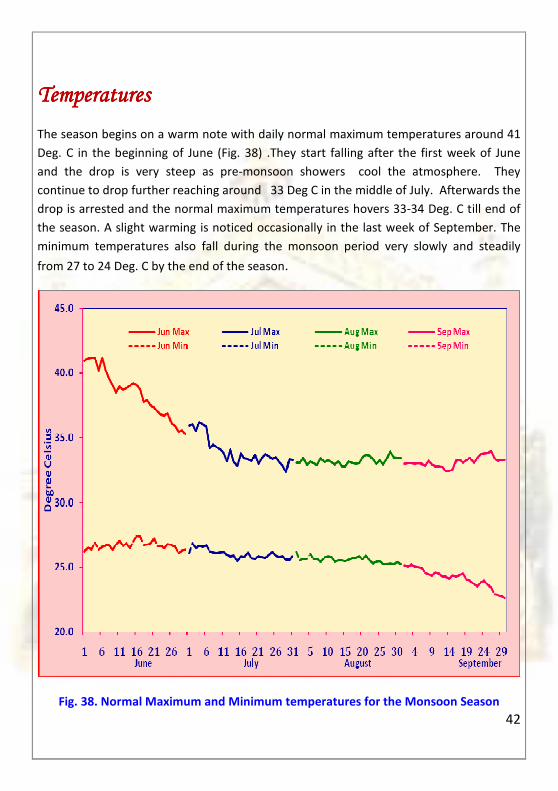
TemperaturesTemperaturesTemperaturesTemperatures
The season begins on a warm note with daily normal maximum temperatures around 41
Deg. C in the beginning of June (Fig. 38) .They start falling after the first week of June
and the drop is very steep as pre-monsoon showers cool the atmosphere. They
continue to drop further reaching around 33 Deg C in the middle of July. Afterwards the
drop is arrested and the normal maximum temperatures hovers 33-34 Deg. C till end of
the season. A slight warming is noticed occasionally in the last week of September. The
minimum temperatures also fall during the monsoon period very slowly and steadily
from 27 to 24 Deg. C by the end of the season.
Fig. 38. Normal Maximum and Minimum temperatures for the Monsoon Season
43
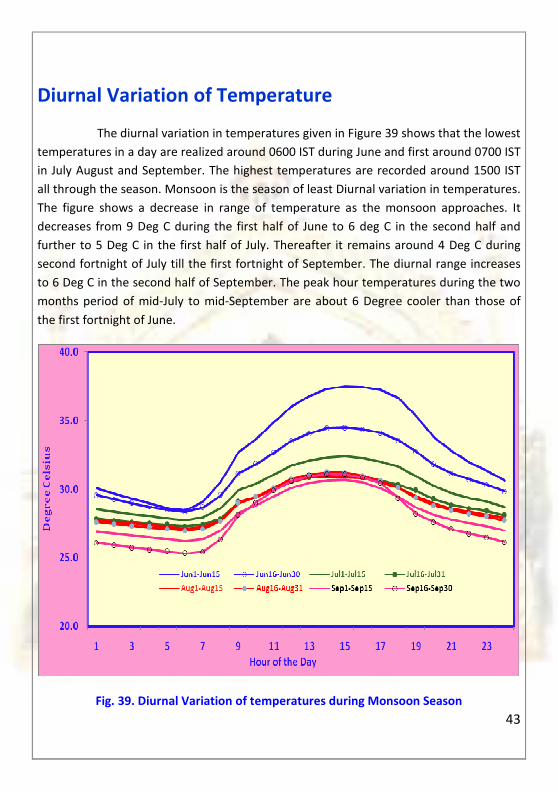
Diurnal Variation of Temperature
The diurnal variation in temperatures given in Figure 39 shows that the lowest
temperatures in a day are realized around 0600 IST during June and first around 0700 IST
in July August and September. The highest temperatures are recorded around 1500 IST
all through the season. Monsoon is the season of least Diurnal variation in temperatures.
The figure shows a decrease in range of temperature as the monsoon approaches. It
decreases from 9 Deg C during the first half of June to 6 deg C in the second half and
further to 5 Deg C in the first half of July. Thereafter it remains around 4 Deg C during
second fortnight of July till the first fortnight of September. The diurnal range increases
to 6 Deg C in the second half of September. The peak hour temperatures during the two
months period of mid-July to mid-September are about 6 Degree cooler than those of
the first fortnight of June.
Fig. 39. Diurnal Variation of temperatures during Monsoon Season
44
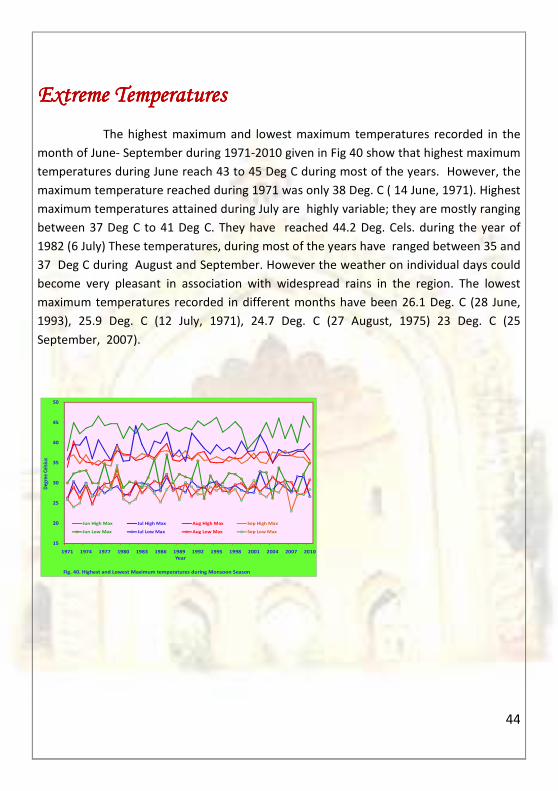
Extreme TemperaturesExtreme TemperaturesExtreme TemperaturesExtreme Temperatures
The highest maximum and lowest maximum temperatures recorded in the
month of June- September during 1971-2010 given in Fig 40 show that highest maximum
temperatures during June reach 43 to 45 Deg C during most of the years. However, the
maximum temperature reached during 1971 was only 38 Deg. C ( 14 June, 1971). Highest
maximum temperatures attained during July are highly variable; they are mostly ranging
between 37 Deg C to 41 Deg C. They have reached 44.2 Deg. Cels. during the year of
1982 (6 July) These temperatures, during most of the years have ranged between 35 and
37 Deg C during August and September. However the weather on individual days could
become very pleasant in association with widespread rains in the region. The lowest
maximum temperatures recorded in different months have been 26.1 Deg. C (28 June,
1993), 25.9 Deg. C (12 July, 1971), 24.7 Deg. C (27 August, 1975) 23 Deg. C (25
September, 2007).
15
20
25
30
35
40
45
50
1971 1974 1977 1980 1983 1986 1989 1992 1995 1998 2001 2004 2007 2010
Deg
ree
Cel
siu
s
Year
Fig. 40. Highest and Lowest Maximum temperatures during Monsoon Season
Jun High Max Jul High Max Aug High Max Sep High Max
Jun Low Max Jul Low Max Aug Low Max Sep Low Max
45
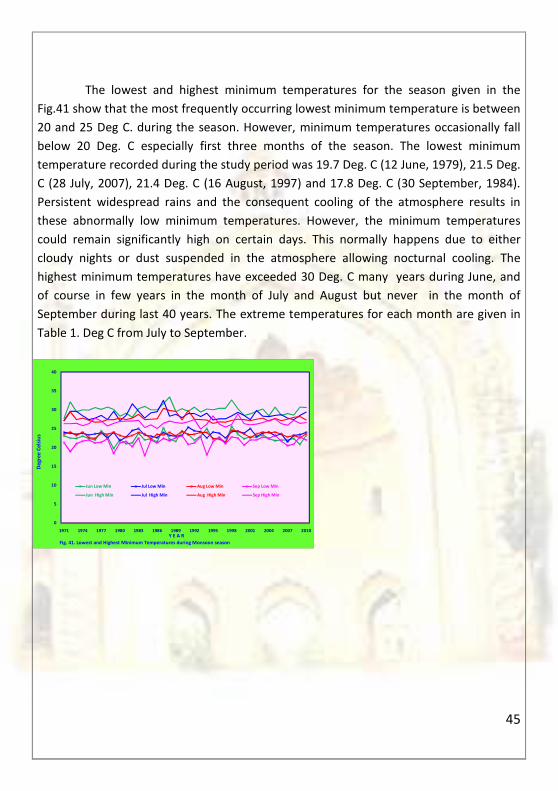
The lowest and highest minimum temperatures for the season given in the
Fig.41 show that the most frequently occurring lowest minimum temperature is between
20 and 25 Deg C. during the season. However, minimum temperatures occasionally fall
below 20 Deg. C especially first three months of the season. The lowest minimum
temperature recorded during the study period was 19.7 Deg. C (12 June, 1979), 21.5 Deg.
C (28 July, 2007), 21.4 Deg. C (16 August, 1997) and 17.8 Deg. C (30 September, 1984).
Persistent widespread rains and the consequent cooling of the atmosphere results in
these abnormally low minimum temperatures. However, the minimum temperatures
could remain significantly high on certain days. This normally happens due to either
cloudy nights or dust suspended in the atmosphere allowing nocturnal cooling. The
highest minimum temperatures have exceeded 30 Deg. C many years during June, and
of course in few years in the month of July and August but never in the month of
September during last 40 years. The extreme temperatures for each month are given in
Table 1. Deg C from July to September.
0
5
10
15
20
25
30
35
40
1971 1974 1977 1980 1983 1986 1989 1992 1995 1998 2001 2004 2007 2010
De
gre
e C
els
ius
Y E A R
Fig. 41. Lowest and Highest Minimum Temperatures during Monsoon season
Jun Low Min Jul Low Min Aug Low Min Sep Low Min
Jun High Min Jul High Min Aug High Min Sep High Min
46
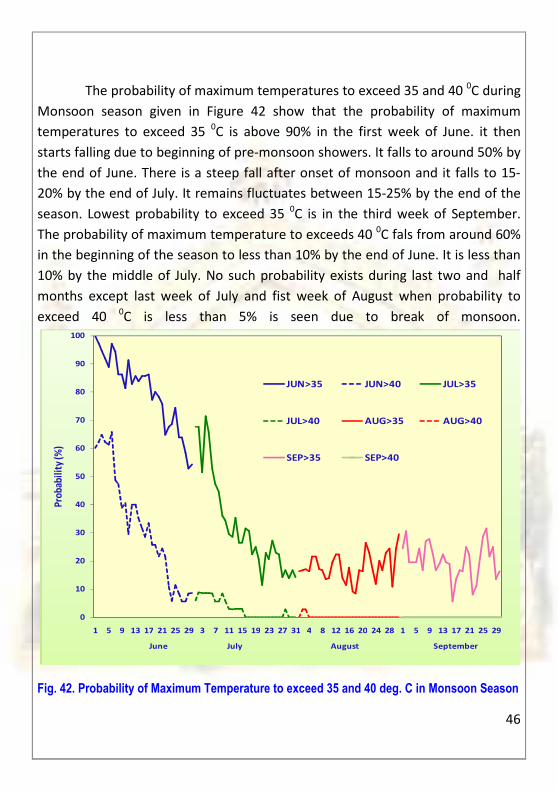
The probability of maximum temperatures to exceed 35 and 40 0C during
Monsoon season given in Figure 42 show that the probability of maximum
temperatures to exceed 35 0C is above 90% in the first week of June. it then
starts falling due to beginning of pre-monsoon showers. It falls to around 50% by
the end of June. There is a steep fall after onset of monsoon and it falls to 15-
20% by the end of July. It remains fluctuates between 15-25% by the end of the
season. Lowest probability to exceed 35 0C is in the third week of September.
The probability of maximum temperature to exceeds 40 0C fals from around 60%
in the beginning of the season to less than 10% by the end of June. It is less than
10% by the middle of July. No such probability exists during last two and half
months except last week of July and fist week of August when probability to
exceed 40 0C is less than 5% is seen due to break of monsoon.
0
10
20
30
40
50
60
70
80
90
100
1 5 9 13 17 21 25 29 3 7 11 15 19 23 27 31 4 8 12 16 20 24 28 1 5 9 13 17 21 25 29
Pro
bab
ilit
y (%
)
June July August September
Fig. 44. Probability of maxumum temperature to exceed 35 and 40 deg. C in Monsoon Season
JUN>35 JUN>40 JUL>35
JUL>40 AUG>35 AUG>40
SEP>35 SEP>40
Fig. 42. Probability of Maximum Temperature to exceed 35 and 40 deg. C in Monsoon Season
47
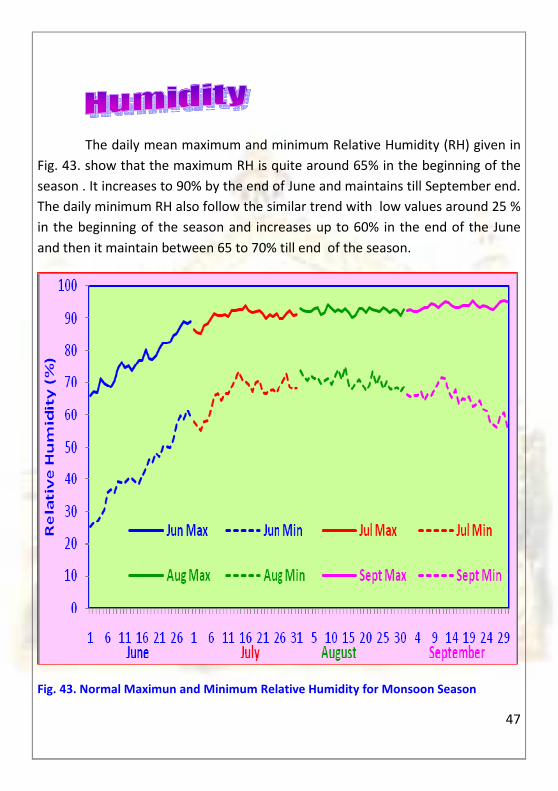
The daily mean maximum and minimum Relative Humidity (RH) given in
Fig. 43. show that the maximum RH is quite around 65% in the beginning of the
season . It increases to 90% by the end of June and maintains till September end.
The daily minimum RH also follow the similar trend with low values around 25 %
in the beginning of the season and increases up to 60% in the end of the June
and then it maintain between 65 to 70% till end of the season.
Fig. 43. Normal Maximun and Minimum Relative Humidity for Monsoon Season
48
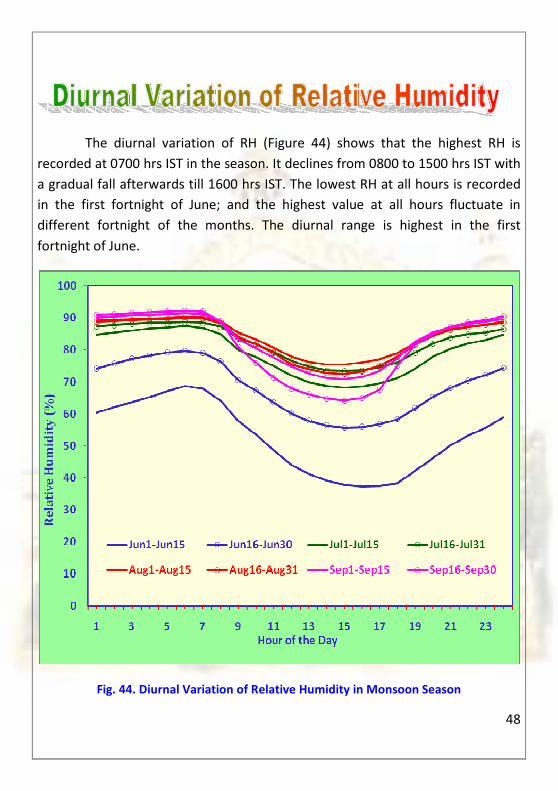
The diurnal variation of RH (Figure 44) shows that the highest RH is
recorded at 0700 hrs IST in the season. It declines from 0800 to 1500 hrs IST with
a gradual fall afterwards till 1600 hrs IST. The lowest RH at all hours is recorded
in the first fortnight of June; and the highest value at all hours fluctuate in
different fortnight of the months. The diurnal range is highest in the first
fortnight of June.
Fig. 44. Diurnal Variation of Relative Humidity in Monsoon Season
49
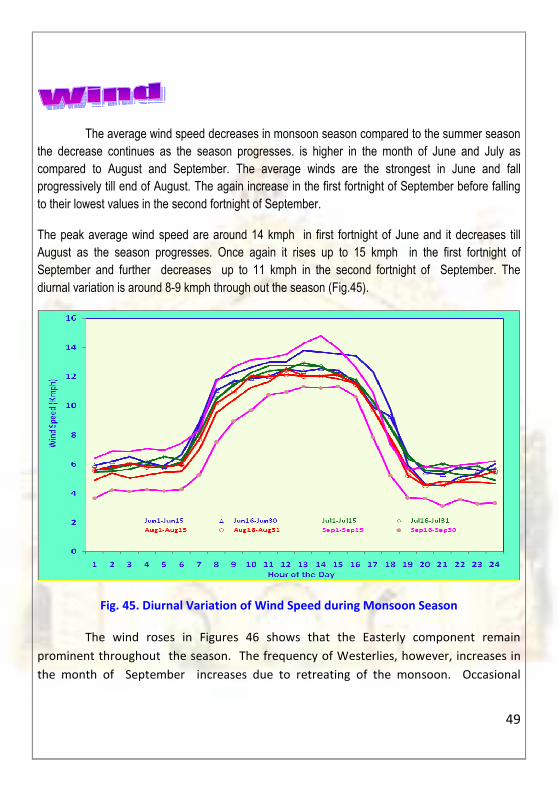
The average wind speed decreases in monsoon season compared to the summer season
the decrease continues as the season progresses. is higher in the month of June and July as
compared to August and September. The average winds are the strongest in June and fall
progressively till end of August. The again increase in the first fortnight of September before falling
to their lowest values in the second fortnight of September.
The peak average wind speed are around 14 kmph in first fortnight of June and it decreases till
August as the season progresses. Once again it rises up to 15 kmph in the first fortnight of
September and further decreases up to 11 kmph in the second fortnight of September. The
diurnal variation is around 8-9 kmph through out the season (Fig.45).
Fig. 45. Diurnal Variation of Wind Speed during Monsoon Season
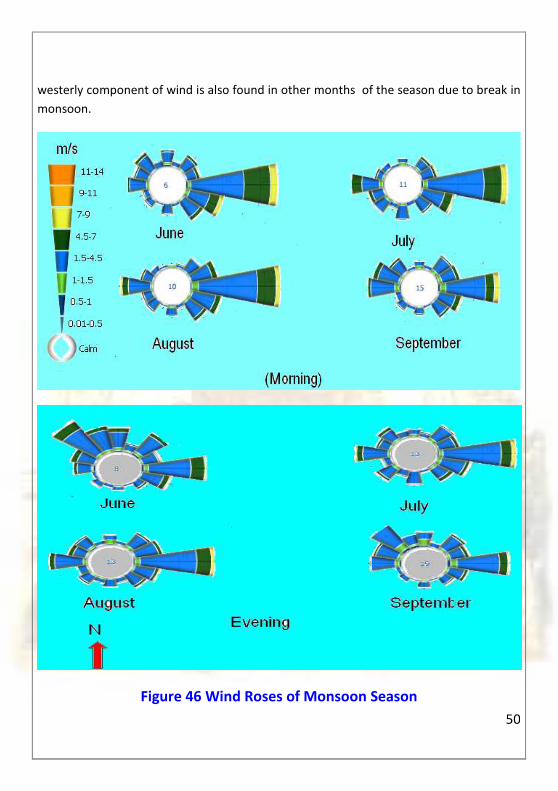
The wind roses in Figures 46 shows that the Easterly component remain
prominent throughout the season. The frequency of Westerlies, however, increases in
the month of September increases due to retreating of the monsoon. Occasional
50
westerly component of wind is also found in other months of the season due to break in
monsoon.
Figure 46 Wind Roses of Monsoon Season
51
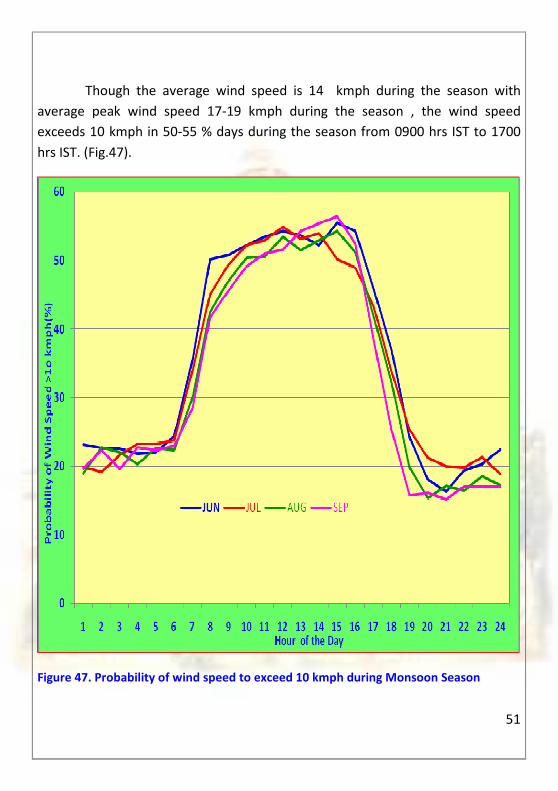
Though the average wind speed is 14 kmph during the season with
average peak wind speed 17-19 kmph during the season , the wind speed
exceeds 10 kmph in 50-55 % days during the season from 0900 hrs IST to 1700
hrs IST. (Fig.47).
Figure 47. Probability of wind speed to exceed 10 kmph during Monsoon Season
52
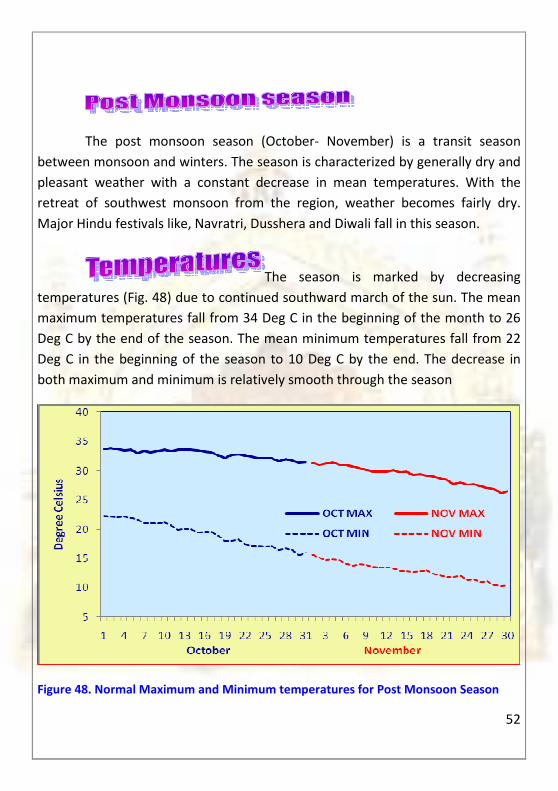
The post monsoon season (October- November) is a transit season
between monsoon and winters. The season is characterized by generally dry and
pleasant weather with a constant decrease in mean temperatures. With the
retreat of southwest monsoon from the region, weather becomes fairly dry.
Major Hindu festivals like, Navratri, Dusshera and Diwali fall in this season.
The season is marked by decreasing
temperatures (Fig. 48) due to continued southward march of the sun. The mean
maximum temperatures fall from 34 Deg C in the beginning of the month to 26
Deg C by the end of the season. The mean minimum temperatures fall from 22
Deg C in the beginning of the season to 10 Deg C by the end. The decrease in
both maximum and minimum is relatively smooth through the season
Figure 48. Normal Maximum and Minimum temperatures for Post Monsoon Season
53
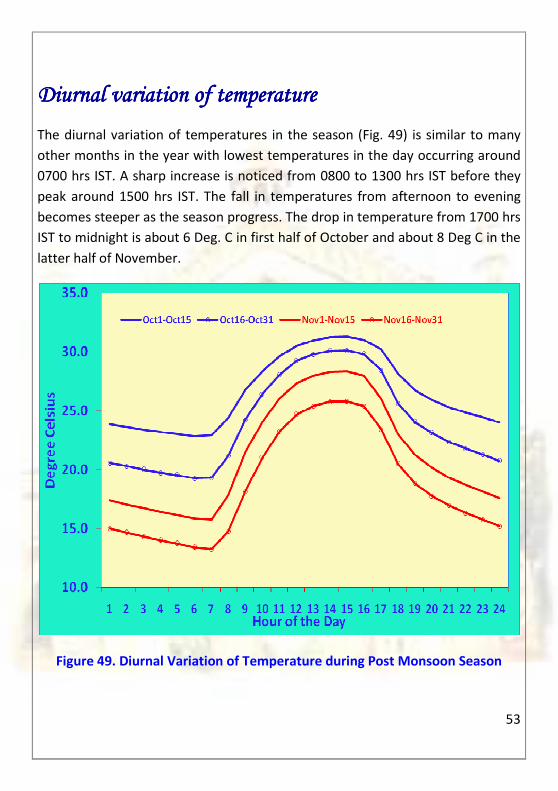
Diurnal variation of temperaDiurnal variation of temperaDiurnal variation of temperaDiurnal variation of temperature ture ture ture
The diurnal variation of temperatures in the season (Fig. 49) is similar to many
other months in the year with lowest temperatures in the day occurring around
0700 hrs IST. A sharp increase is noticed from 0800 to 1300 hrs IST before they
peak around 1500 hrs IST. The fall in temperatures from afternoon to evening
becomes steeper as the season progress. The drop in temperature from 1700 hrs
IST to midnight is about 6 Deg. C in first half of October and about 8 Deg C in the
latter half of November.
Figure 49. Diurnal Variation of Temperature during Post Monsoon Season
54
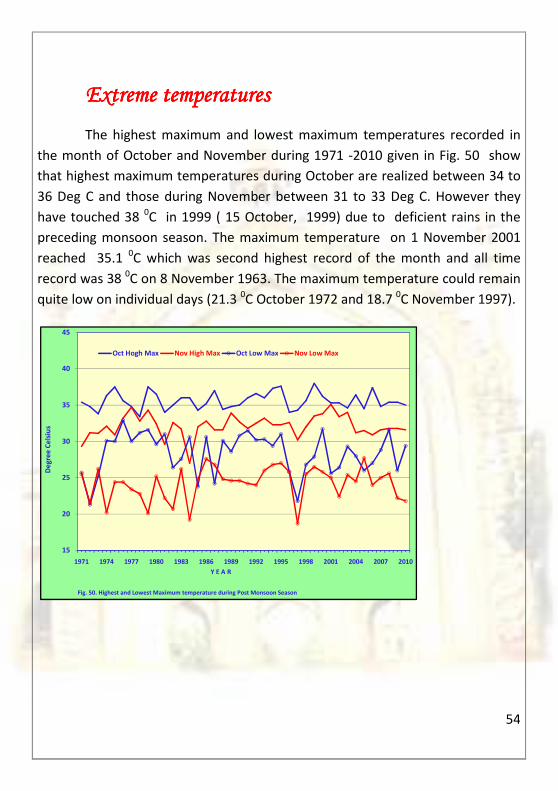
Extreme temperaturesExtreme temperaturesExtreme temperaturesExtreme temperatures
The highest maximum and lowest maximum temperatures recorded in
the month of October and November during 1971 -2010 given in Fig. 50 show
that highest maximum temperatures during October are realized between 34 to
36 Deg C and those during November between 31 to 33 Deg C. However they
have touched 38 0C in 1999 ( 15 October, 1999) due to deficient rains in the
preceding monsoon season. The maximum temperature on 1 November 2001
reached 35.1 0C which was second highest record of the month and all time
record was 38 0C on 8 November 1963. The maximum temperature could remain
quite low on individual days (21.3 0C October 1972 and 18.7
0C November 1997).
15
20
25
30
35
40
45
1971 1974 1977 1980 1983 1986 1989 1992 1995 1998 2001 2004 2007 2010
De
gre
e C
els
ius
Y E A R
Fig. 50. Highest and Lowest Maximum temperature during Post Monsoon Season
Oct Hogh Max Nov High Max Oct Low Max Nov Low Max
55
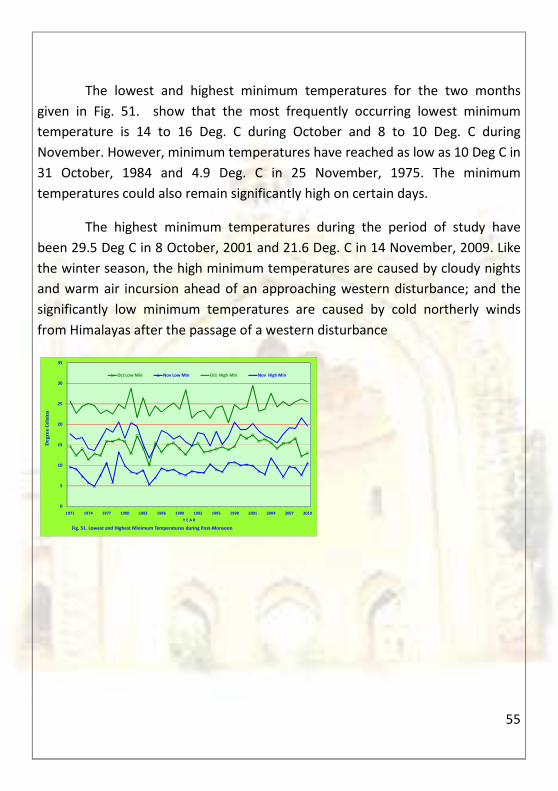
The lowest and highest minimum temperatures for the two months
given in Fig. 51. show that the most frequently occurring lowest minimum
temperature is 14 to 16 Deg. C during October and 8 to 10 Deg. C during
November. However, minimum temperatures have reached as low as 10 Deg C in
31 October, 1984 and 4.9 Deg. C in 25 November, 1975. The minimum
temperatures could also remain significantly high on certain days.
The highest minimum temperatures during the period of study have
been 29.5 Deg C in 8 October, 2001 and 21.6 Deg. C in 14 November, 2009. Like
the winter season, the high minimum temperatures are caused by cloudy nights
and warm air incursion ahead of an approaching western disturbance; and the
significantly low minimum temperatures are caused by cold northerly winds
from Himalayas after the passage of a western disturbance
0
5
10
15
20
25
30
35
1971 1974 1977 1980 1983 1986 1989 1992 1995 1998 2001 2004 2007 2010
De
gre
e C
els
ius
Y E A R
Fig. 51. Lowest and Highest Minimum Temperatures during Post-Monsoon
Oct Low Min Nov Low Min Oct High Min Nov High Min
56
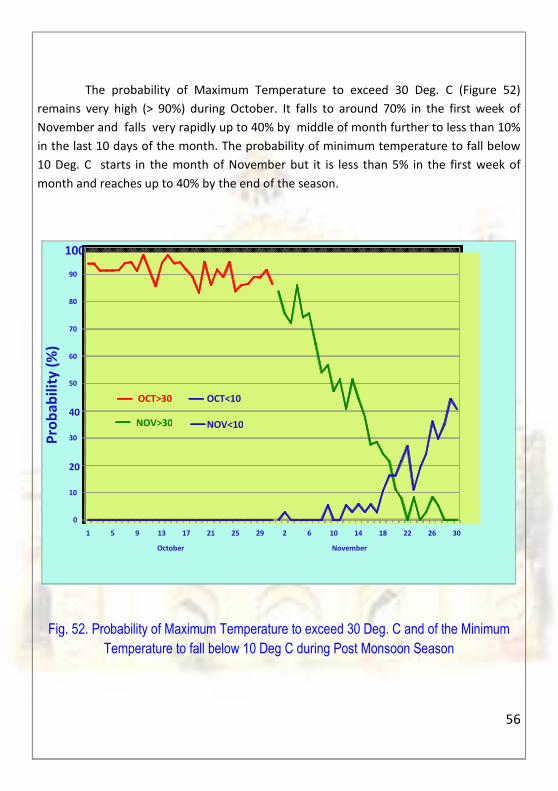
The probability of Maximum Temperature to exceed 30 Deg. C (Figure 52)
remains very high (> 90%) during October. It falls to around 70% in the first week of
November and falls very rapidly up to 40% by middle of month further to less than 10%
in the last 10 days of the month. The probability of minimum temperature to fall below
10 Deg. C starts in the month of November but it is less than 5% in the first week of
month and reaches up to 40% by the end of the season.
Fig. 52. Probability of Maximum Temperature to exceed 30 Deg. C and of the Minimum
Temperature to fall below 10 Deg C during Post Monsoon Season
0
10
20
30
40
50
60
70
80
90
100
1 5 9 13 17 21 25 29 2 6 10 14 18 22 26 30
Pro
ba
bil
ity
(%
)
October November
OCT>30 OCT<10
NOV>30 NOV<10
57
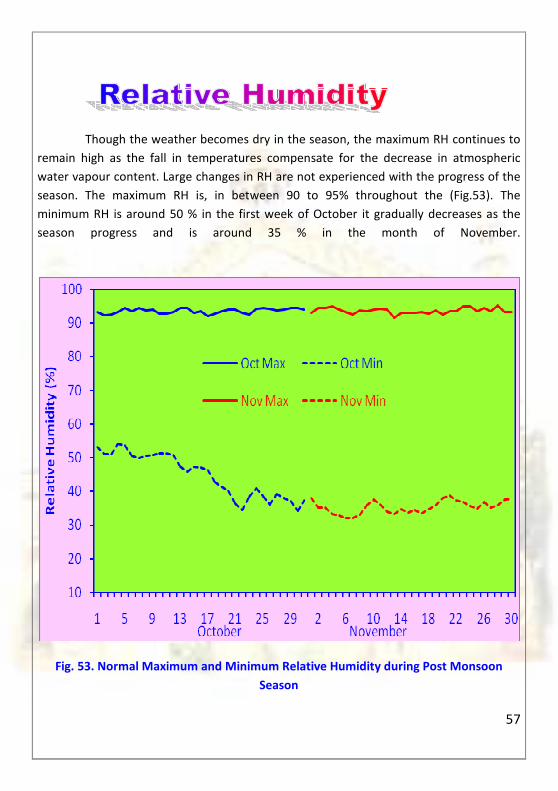
Though the weather becomes dry in the season, the maximum RH continues to
remain high as the fall in temperatures compensate for the decrease in atmospheric
water vapour content. Large changes in RH are not experienced with the progress of the
season. The maximum RH is, in between 90 to 95% throughout the (Fig.53). The
minimum RH is around 50 % in the first week of October it gradually decreases as the
season progress and is around 35 % in the month of November.
Fig. 53. Normal Maximum and Minimum Relative Humidity during Post Monsoon
Season
58
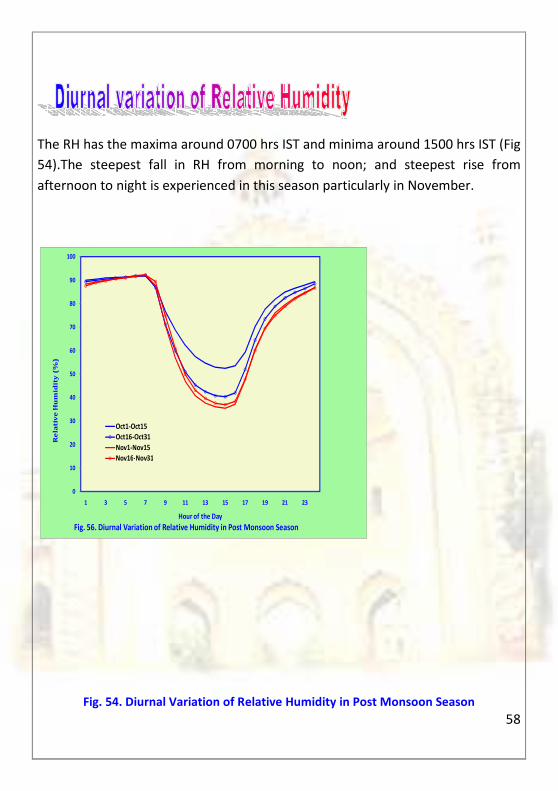
The RH has the maxima around 0700 hrs IST and minima around 1500 hrs IST (Fig
54).The steepest fall in RH from morning to noon; and steepest rise from
afternoon to night is experienced in this season particularly in November.
0
10
20
30
40
50
60
70
80
90
100
1 3 5 7 9 11 13 15 17 19 21 23
Re
lati
ve
Hu
mid
ity
(%
)
Hour of the Day
Fig. 56. Diurnal Variation of Relative Humidity in Post Monsoon Season
Oct1-Oct15
Oct16-Oct31
Nov1-Nov15
Nov16-Nov31
Fig. 54. Diurnal Variation of Relative Humidity in Post Monsoon Season
59
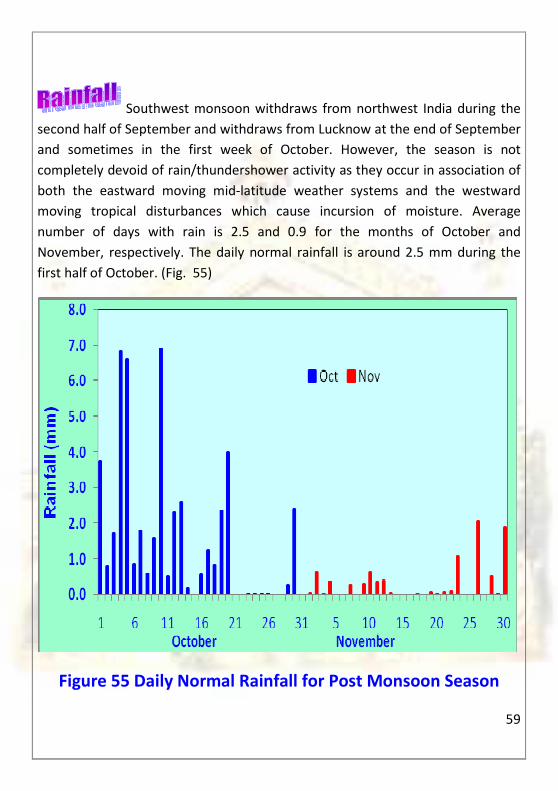
Southwest monsoon withdraws from northwest India during the
second half of September and withdraws from Lucknow at the end of September
and sometimes in the first week of October. However, the season is not
completely devoid of rain/thundershower activity as they occur in association of
both the eastward moving mid-latitude weather systems and the westward
moving tropical disturbances which cause incursion of moisture. Average
number of days with rain is 2.5 and 0.9 for the months of October and
November, respectively. The daily normal rainfall is around 2.5 mm during the
first half of October. (Fig. 55)
Figure 55 Daily Normal Rainfall for Post Monsoon Season
60
Subsequently there is a decrease and the normal rainfall is less than 0.5
mm per day on most of the days the average monthly total rainfall is 40.9 mm
and 7.4 mm for the months of October and November, respectively.
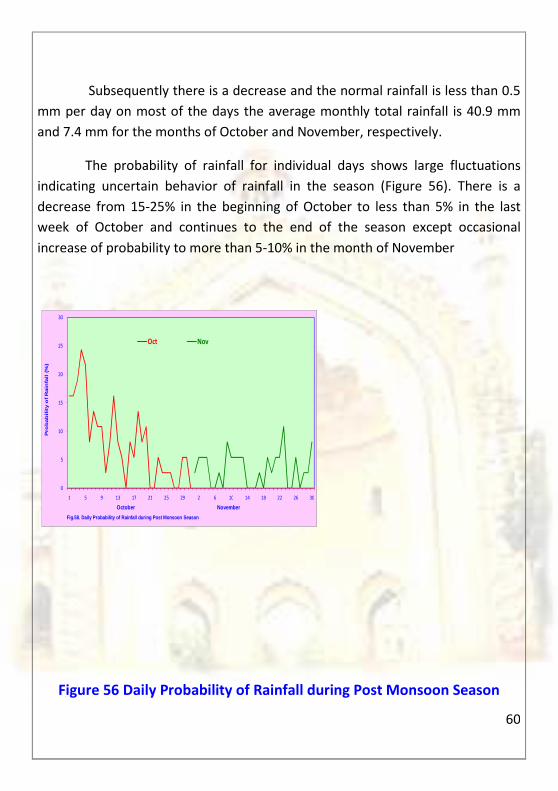
The probability of rainfall for individual days shows large fluctuations
indicating uncertain behavior of rainfall in the season (Figure 56). There is a
decrease from 15-25% in the beginning of October to less than 5% in the last
week of October and continues to the end of the season except occasional
increase of probability to more than 5-10% in the month of November
0
5
10
15
20
25
30
1 5 9 13 17 21 25 29 2 6 10 14 18 22 26 30
Pro
bab
ility o
f R
ain
fall (
%)
October November
Fig.58. Daily Probability of Rainfall during Post M onsoon Season
Oct Nov
Figure 56 Daily Probability of Rainfall during Post Monsoon Season
61
Heavy RainfallHeavy RainfallHeavy RainfallHeavy Rainfall
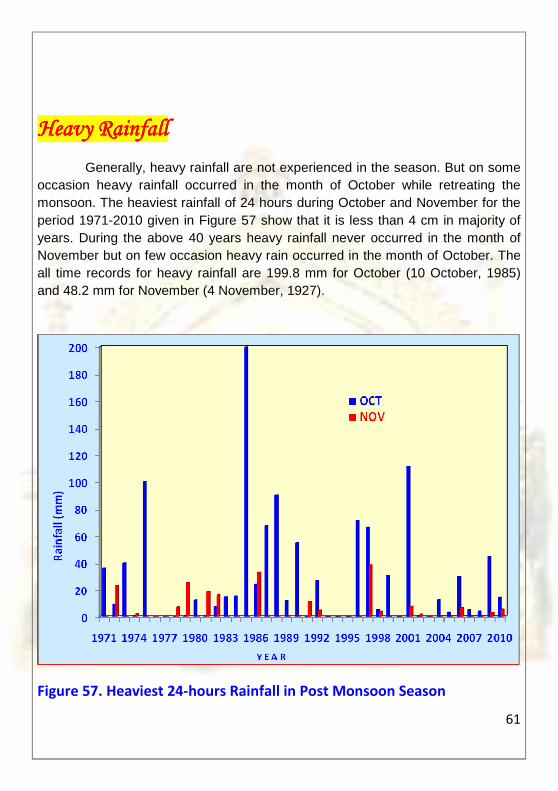
Generally, heavy rainfall are not experienced in the season. But on some occasion heavy rainfall occurred in the month of October while retreating the monsoon. The heaviest rainfall of 24 hours during October and November for the period 1971-2010 given in Figure 57 show that it is less than 4 cm in majority of years. During the above 40 years heavy rainfall never occurred in the month of November but on few occasion heavy rain occurred in the month of October. The all time records for heavy rainfall are 199.8 mm for October (10 October, 1985) and 48.2 mm for November (4 November, 1927).
Figure 57. Heaviest 24-hours Rainfall in Post Monsoon Season
62
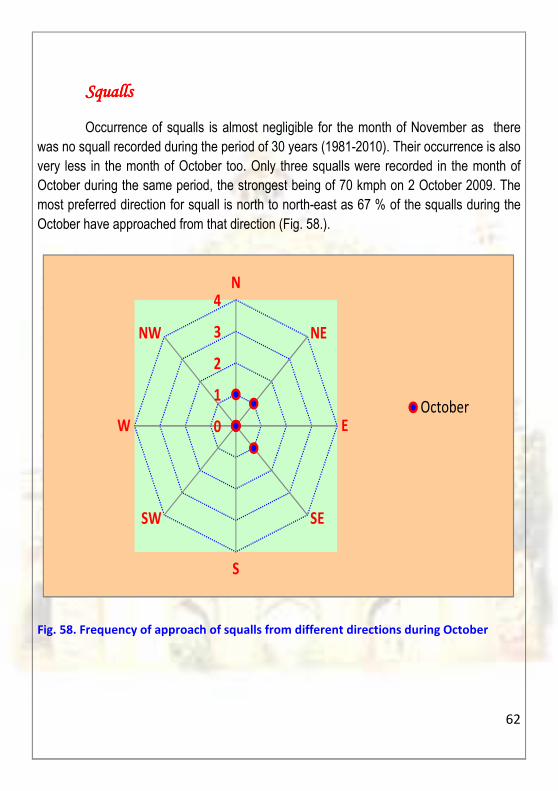
SquallsSquallsSquallsSqualls
Occurrence of squalls is almost negligible for the month of November as there
was no squall recorded during the period of 30 years (1981-2010). Their occurrence is also
very less in the month of October too. Only three squalls were recorded in the month of
October during the same period, the strongest being of 70 kmph on 2 October 2009. The
most preferred direction for squall is north to north-east as 67 % of the squalls during the
October have approached from that direction (Fig. 58.).
0
1
2
3
4N
NE
E
SE
S
SW
W
NW
October
Fig. 58. Frequency of approach of squalls from different directions during October
63
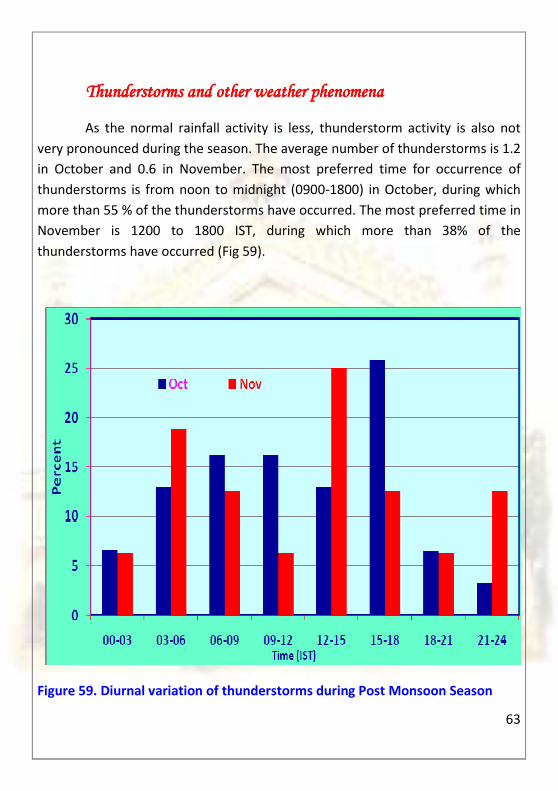
TTTThunderstorms and other weatherhunderstorms and other weatherhunderstorms and other weatherhunderstorms and other weather phenomenaphenomenaphenomenaphenomena
As the normal rainfall activity is less, thunderstorm activity is also not
very pronounced during the season. The average number of thunderstorms is 1.2
in October and 0.6 in November. The most preferred time for occurrence of
thunderstorms is from noon to midnight (0900-1800) in October, during which
more than 55 % of the thunderstorms have occurred. The most preferred time in
November is 1200 to 1800 IST, during which more than 38% of the
thunderstorms have occurred (Fig 59).
Figure 59. Diurnal variation of thunderstorms during Post Monsoon Season
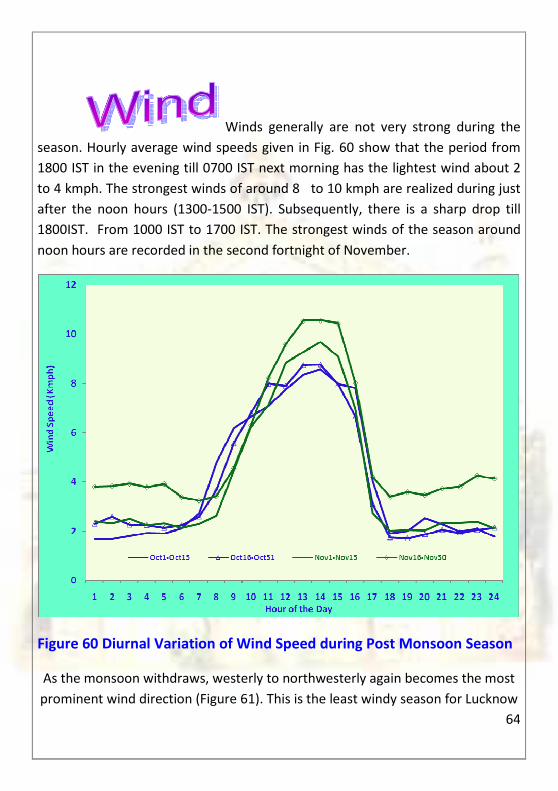
64
Winds generally are not very strong during the
season. Hourly average wind speeds given in Fig. 60 show that the period from
1800 IST in the evening till 0700 IST next morning has the lightest wind about 2
to 4 kmph. The strongest winds of around 8 to 10 kmph are realized during just
after the noon hours (1300-1500 IST). Subsequently, there is a sharp drop till
1800IST. From 1000 IST to 1700 IST. The strongest winds of the season around
noon hours are recorded in the second fortnight of November.
Figure 60 Diurnal Variation of Wind Speed during Post Monsoon Season
As the monsoon withdraws, westerly to northwesterly again becomes the most
prominent wind direction (Figure 61). This is the least windy season for Lucknow
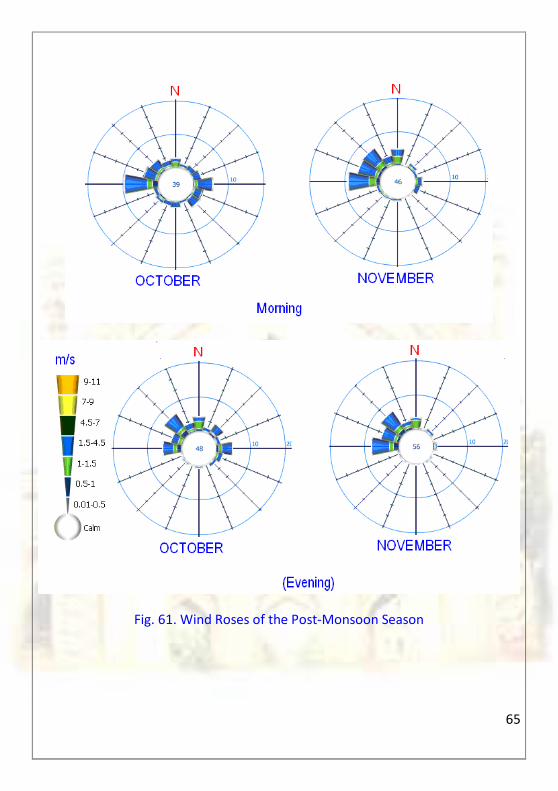
65
Fig. 61. Wind Roses of the Post-Monsoon Season
66
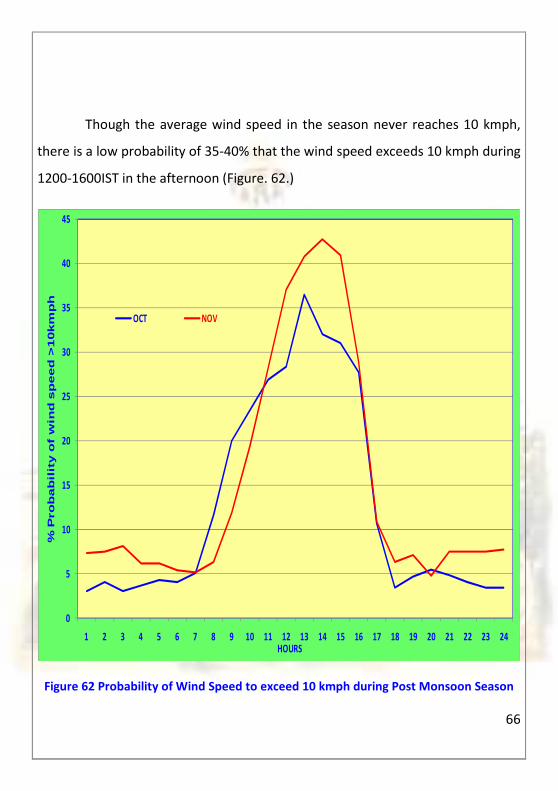
Though the average wind speed in the season never reaches 10 kmph,
there is a low probability of 35-40% that the wind speed exceeds 10 kmph during
1200-1600IST in the afternoon (Figure. 62.)
0
5
10
15
20
25
30
35
40
45
1 2 3 4 5 6 7 8 9 10 11 12 13 14 15 16 17 18 19 20 21 22 23 24
% P
robability o
f w
ind s
peed >
10km
ph
HOURS
Fig. 64. Probability of wind speed to exceed 10 kmph during Post-Monsoon Season
OCT NOV
Figure 62 Probability of Wind Speed to exceed 10 kmph during Post Monsoon Season
67
Weather on National Festival DaysWeather on National Festival DaysWeather on National Festival DaysWeather on National Festival Days
The Independence Day (15 August), Republic Day (26 January) and Gandhi
Jayanti (02 October) are the National Festivals of India which are celebrated with great
patriotic fervor all over the country. The main functions of the state on these days are
held in the State Capital-Lucknow. The general weather conditions of these days are
described in the following section.
Independence Day (15Independence Day (15Independence Day (15Independence Day (15thththth August)August)August)August)
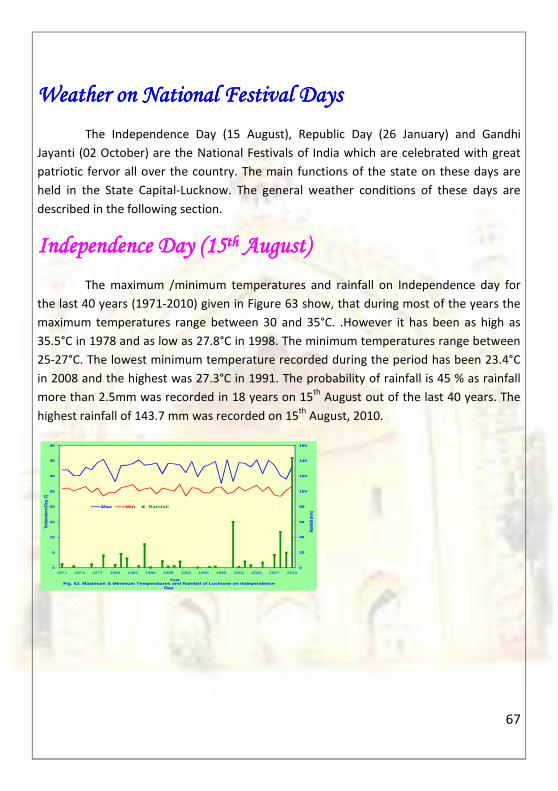
The maximum /minimum temperatures and rainfall on Independence day for
the last 40 years (1971-2010) given in Figure 63 show, that during most of the years the
maximum temperatures range between 30 and 35°C. .However it has been as high as
35.5°C in 1978 and as low as 27.8°C in 1998. The minimum temperatures range between
25-27°C. The lowest minimum temperature recorded during the period has been 23.4°C
in 2008 and the highest was 27.3°C in 1991. The probability of rainfall is 45 % as rainfall
more than 2.5mm was recorded in 18 years on 15th
August out of the last 40 years. The
highest rainfall of 143.7 mm was recorded on 15th
August, 2010.
0
20
40
60
80
100
120
140
160
0
5
10
15
20
25
30
35
40
1971 1974 1977 1980 1983 1986 1989 1992 1995 1998 2001 2004 2007 2010
Rainf
all (m
m)
Temp
eratu
re (D
eg. C
)
YearFig. 63. Maximum & Minimum Temperatures and Rainfal l of Lucknow on Independence
Day
Max Min Rainfall
68
Diurnal Variation of temperatures on Independence DayDiurnal Variation of temperatures on Independence DayDiurnal Variation of temperatures on Independence DayDiurnal Variation of temperatures on Independence Day
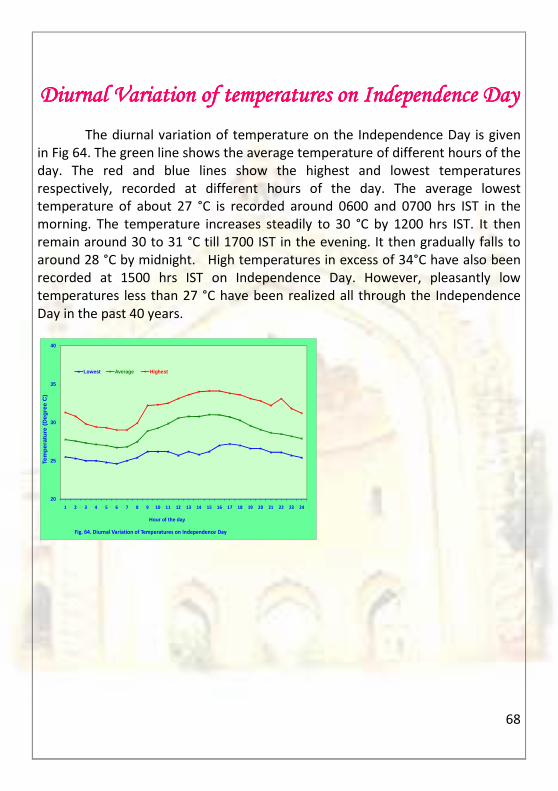
The diurnal variation of temperature on the Independence Day is given
in Fig 64. The green line shows the average temperature of different hours of the
day. The red and blue lines show the highest and lowest temperatures
respectively, recorded at different hours of the day. The average lowest
temperature of about 27 °C is recorded around 0600 and 0700 hrs IST in the
morning. The temperature increases steadily to 30 °C by 1200 hrs IST. It then
remain around 30 to 31 °C till 1700 IST in the evening. It then gradually falls to
around 28 °C by midnight. High temperatures in excess of 34°C have also been
recorded at 1500 hrs IST on Independence Day. However, pleasantly low
temperatures less than 27 °C have been realized all through the Independence
Day in the past 40 years.
20
25
30
35
40
1 2 3 4 5 6 7 8 9 10 11 12 13 14 15 16 17 18 19 20 21 22 23 24
Tem
pera
ture
(D
egr
ee
C)
Hour of the day
Fig. 64. Diurnal Variation of Temperatures on Independence Day
Lowest Average Highest
69
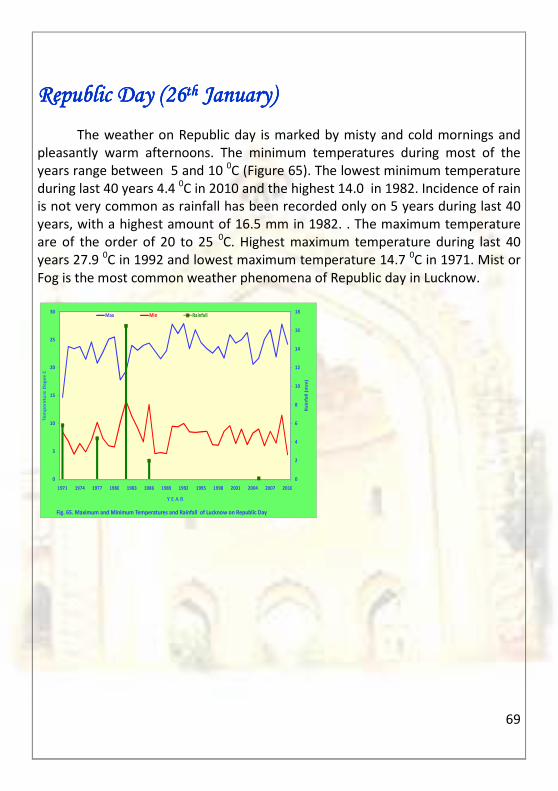
Republic Day (26Republic Day (26Republic Day (26Republic Day (26thththth January)January)January)January)
The weather on Republic day is marked by misty and cold mornings and
pleasantly warm afternoons. The minimum temperatures during most of the
years range between 5 and 10 0C (Figure 65). The lowest minimum temperature
during last 40 years 4.4 0C in 2010 and the highest 14.0 in 1982. Incidence of rain
is not very common as rainfall has been recorded only on 5 years during last 40
years, with a highest amount of 16.5 mm in 1982. . The maximum temperature
are of the order of 20 to 25 0C. Highest maximum temperature during last 40
years 27.9 0C in 1992 and lowest maximum temperature 14.7
0C in 1971. Mist or
Fog is the most common weather phenomena of Republic day in Lucknow.
0
2
4
6
8
10
12
14
16
18
0
5
10
15
20
25
30
1971 1974 1977 1980 1983 1986 1989 1992 1995 1998 2001 2004 2007 2010
Ra
infa
ll (
mm
)
Te
mp
era
ture
De
ge
e C
Y E A R
Fig. 65. Maximum and Minimum Temperatures and Rainfall of Lucknow on Republic Day
Max Min Rainfall
70
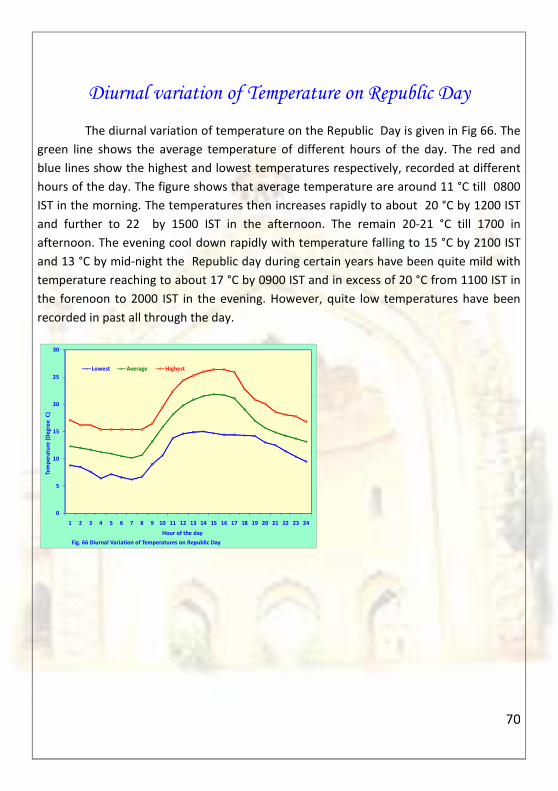
Diurnal variation of Temperature on Republic Day
The diurnal variation of temperature on the Republic Day is given in Fig 66. The
green line shows the average temperature of different hours of the day. The red and
blue lines show the highest and lowest temperatures respectively, recorded at different
hours of the day. The figure shows that average temperature are around 11 °C till 0800
IST in the morning. The temperatures then increases rapidly to about 20 °C by 1200 IST
and further to 22 by 1500 IST in the afternoon. The remain 20-21 °C till 1700 in
afternoon. The evening cool down rapidly with temperature falling to 15 °C by 2100 IST
and 13 °C by mid-night the Republic day during certain years have been quite mild with
temperature reaching to about 17 °C by 0900 IST and in excess of 20 °C from 1100 IST in
the forenoon to 2000 IST in the evening. However, quite low temperatures have been
recorded in past all through the day.
0
5
10
15
20
25
30
1 2 3 4 5 6 7 8 9 10 11 12 13 14 15 16 17 18 19 20 21 22 23 24
Tem
pe
ratu
re (
De
gre
e
C)
Hour of the day
Fig. 66 Diurnal Variation of Temperatures on Republic Day
Lowest Average Highest
71
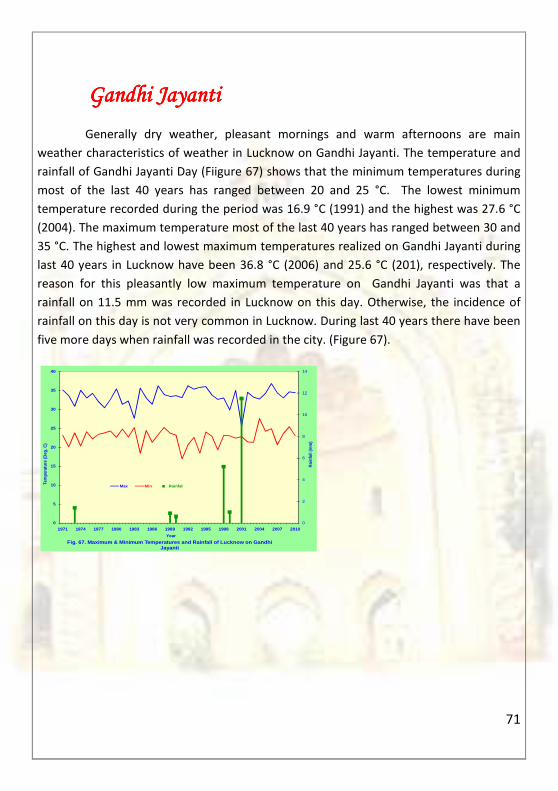
Gandhi JayantiGandhi JayantiGandhi JayantiGandhi Jayanti
Generally dry weather, pleasant mornings and warm afternoons are main
weather characteristics of weather in Lucknow on Gandhi Jayanti. The temperature and
rainfall of Gandhi Jayanti Day (Fiigure 67) shows that the minimum temperatures during
most of the last 40 years has ranged between 20 and 25 °C. The lowest minimum
temperature recorded during the period was 16.9 °C (1991) and the highest was 27.6 °C
(2004). The maximum temperature most of the last 40 years has ranged between 30 and
35 °C. The highest and lowest maximum temperatures realized on Gandhi Jayanti during
last 40 years in Lucknow have been 36.8 °C (2006) and 25.6 °C (201), respectively. The
reason for this pleasantly low maximum temperature on Gandhi Jayanti was that a
rainfall on 11.5 mm was recorded in Lucknow on this day. Otherwise, the incidence of
rainfall on this day is not very common in Lucknow. During last 40 years there have been
five more days when rainfall was recorded in the city. (Figure 67).
0
2
4
6
8
10
12
14
0
5
10
15
20
25
30
35
40
1971 1974 1977 1980 1983 1986 1989 1992 1995 1998 2001 2004 2007 2010
Rai
nfal
l (m
m)
Tem
pera
ture
(Deg
. C)
Year
Fig. 67. Maximum & Minimum Temperatures and Rainfal l of Lucknow on Gandhi Jayanti
Max Min Rainfall
72
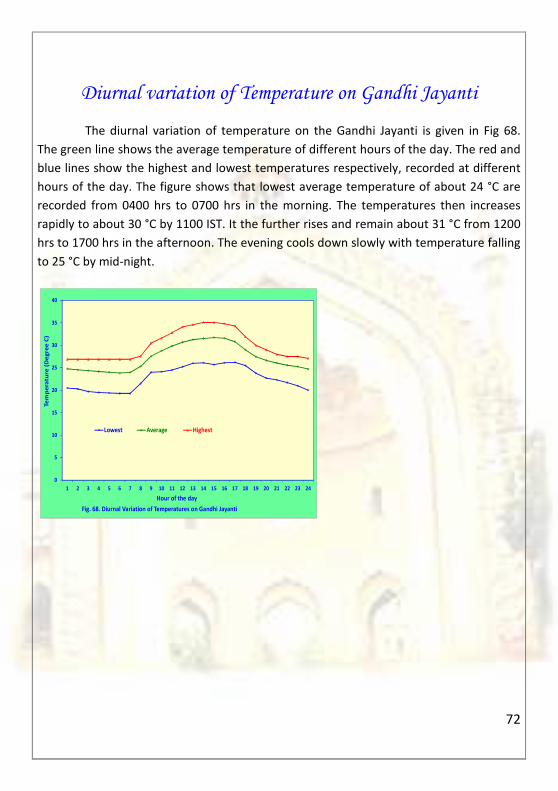
Diurnal variation of Temperature on Gandhi Jayanti
The diurnal variation of temperature on the Gandhi Jayanti is given in Fig 68.
The green line shows the average temperature of different hours of the day. The red and
blue lines show the highest and lowest temperatures respectively, recorded at different
hours of the day. The figure shows that lowest average temperature of about 24 °C are
recorded from 0400 hrs to 0700 hrs in the morning. The temperatures then increases
rapidly to about 30 °C by 1100 IST. It the further rises and remain about 31 °C from 1200
hrs to 1700 hrs in the afternoon. The evening cools down slowly with temperature falling
to 25 °C by mid-night.
0
5
10
15
20
25
30
35
40
1 2 3 4 5 6 7 8 9 10 11 12 13 14 15 16 17 18 19 20 21 22 23 24
Te
mp
era
ture
(D
eg
ree
C)
Hour of the day
Fig. 68. Diurnal Variation of Temperatures on Gandhi Jayanti
Lowest Average Highest
73
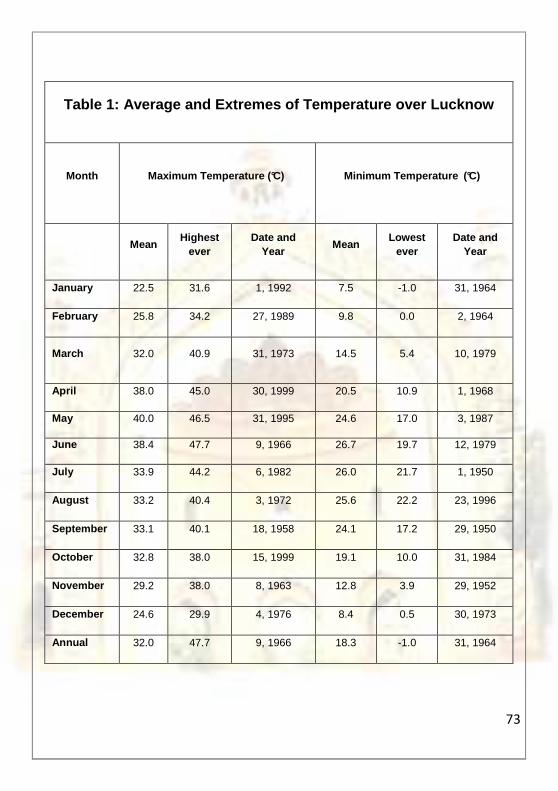
Table 1: Average and Extremes of Temperature over L ucknow
Month Maximum Temperature (°C) Minimum Temperature (°C)
Mean Highest
ever Date and
Year Mean
Lowest ever
Date and Year
January 22.5 31.6 1, 1992 7.5 -1.0 31, 1964
February 25.8 34.2 27, 1989 9.8 0.0 2, 1964
March 32.0 40.9 31, 1973 14.5 5.4 10, 1979
April 38.0 45.0 30, 1999 20.5 10.9 1, 1968
May 40.0 46.5 31, 1995 24.6 17.0 3, 1987
June 38.4 47.7 9, 1966 26.7 19.7 12, 1979
July 33.9 44.2 6, 1982 26.0 21.7 1, 1950
August 33.2 40.4 3, 1972 25.6 22.2 23, 1996
September 33.1 40.1 18, 1958 24.1 17.2 29, 1950
October 32.8 38.0 15, 1999 19.1 10.0 31, 1984
November 29.2 38.0 8, 1963 12.8 3.9 29, 1952
December 24.6 29.9 4, 1976 8.4 0.5 30, 1973
Annual 32.0 47.7 9, 1966 18.3 -1.0 31, 1964
74
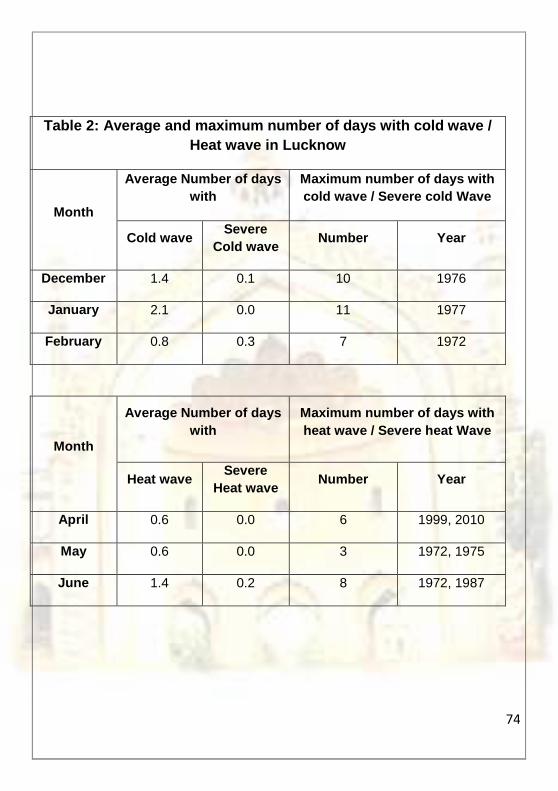
Table 2: Average and maximum number of days with co ld wave / Heat wave in Lucknow
Month
Average Number of days with
Maximum number of days with cold wave / Severe cold Wave
Cold wave Severe
Cold wave Number Year
December 1.4 0.1 10 1976
January 2.1 0.0 11 1977
February 0.8 0.3 7 1972
Month
Average Number of days with
Maximum number of days with heat wave / Severe heat Wave
Heat wave Severe
Heat wave Number Year
April 0.6 0.0 6 1999, 2010
May 0.6 0.0 3 1972, 1975
June 1.4 0.2 8 1972, 1987
75
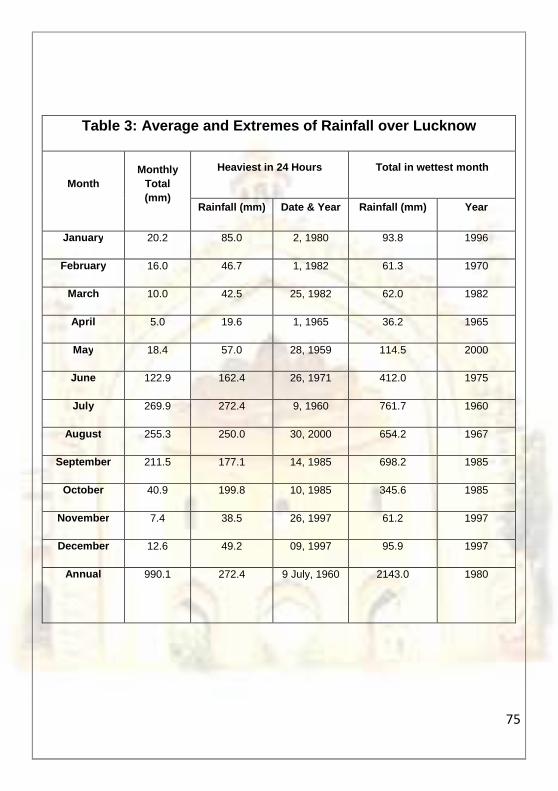
Table 3: Average and Extremes of Rainfall over Luck now
Month Monthly
Total (mm)
Heaviest in 24 Hours Total in wettest month
Rainfall (mm) Date & Year Rainfall (mm) Year
January 20.2 85.0 2, 1980 93.8 1996
February 16.0 46.7 1, 1982 61.3 1970
March 10.0 42.5 25, 1982 62.0 1982
April 5.0 19.6 1, 1965 36.2 1965
May 18.4 57.0 28, 1959 114.5 2000
June 122.9 162.4 26, 1971 412.0 1975
July 269.9 272.4 9, 1960 761.7 1960
August 255.3 250.0 30, 2000 654.2 1967
September 211.5 177.1 14, 1985 698.2 1985
October 40.9 199.8 10, 1985 345.6 1985
November 7.4 38.5 26, 1997 61.2 1997
December 12.6 49.2 09, 1997 95.9 1997
Annua l 990.1 272.4 9 July, 1960 2143.0 1980
76
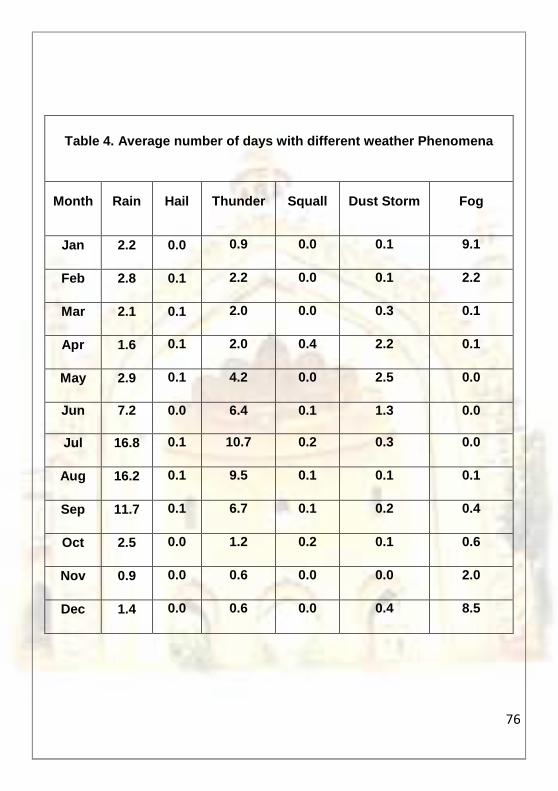
Table 4. Average number of days with different weat her Phenomena
Month Rain Hail Thunder Squall Dust Storm Fog
Jan 2.2 0.0 0.9 0.0 0.1 9.1
Feb 2.8 0.1 2.2 0.0 0.1 2.2
Mar 2.1 0.1 2.0 0.0 0.3 0.1
Apr 1.6 0.1 2.0 0.4 2.2 0.1
May 2.9 0.1 4.2 0.0 2.5 0.0
Jun 7.2 0.0 6.4 0.1 1.3 0.0
Jul 16.8 0.1 10.7 0.2 0.3 0.0
Aug 16.2 0.1 9.5 0.1 0.1 0.1
Sep 11.7 0.1 6.7 0.1 0.2 0.4
Oct 2.5 0.0 1.2 0.2 0.1 0.6
Nov 0.9 0.0 0.6 0.0 0.0 2.0
Dec 1.4 0.0 0.6 0.0 0.4 8.5
77
Table 5.Highest magnitude of fall in temperatures ( ºC) in 24 hours in winter Season
Month
Maximum Temperature Minimum Temperature
Temperature Fall
Date, Year Temperature
Fall Date, Year
Dec 9.5 19, 2008 7.9 10, 1976
Jan 11.5 2, 1992 8.9 2,1992
Feb 8.5 4, 2001 9.2 14,1972
Table 6.Highest magnitude of rise in temperatures ( ºC) in 24 hours in summer Season
Month
Maximum Temperature Minimum Temperature
Temperature Rise
Date, Year Temperature
Rise Date, Year
Mar 6.6 24, 1991
21, 1996 7.7
10, 1978
17,1999
Apr 6.0 19, 1983 6.4 14, 1983
May 7.3 23, 2003 6.0 24, 1972
Jun 6.8 20, 2004 5.5 15, 1986
78
Table 7.Highest magnitude of fall in temperatures ( ºC) in 24 hours in summer Season
Month
Maximum Temperature Minimum Temperature
Temperature fall
Date, Year Temperature
fall Date, Year
Mar 13.5 10, 2006 7.6 22, 1983
Apr 9.5 18, 2006 7.5 29, 2006
May 8.7 14, 1987 6.7 17, 1997
Jun 10.8 13, 2007 7.6 23, 2005
06, 2009
79
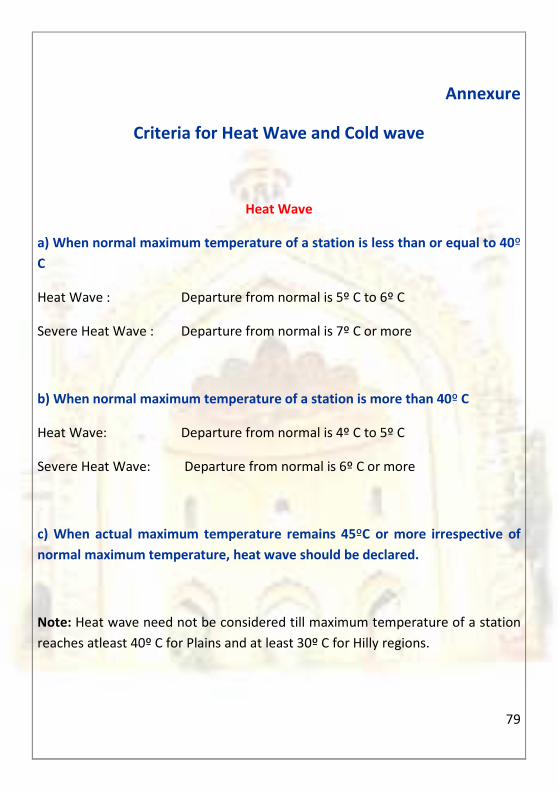
Annexure
Criteria for Heat Wave and Cold wave
Heat Wave
a) When normal maximum temperature of a station is less than or equal to 40º
C
Heat Wave : Departure from normal is 5º C to 6º C
Severe Heat Wave : Departure from normal is 7º C or more
b) When normal maximum temperature of a station is more than 40º C
Heat Wave: Departure from normal is 4º C to 5º C
Severe Heat Wave: Departure from normal is 6º C or more
c) When actual maximum temperature remains 45ºC or more irrespective of
normal maximum temperature, heat wave should be declared.
Note: Heat wave need not be considered till maximum temperature of a station
reaches atleast 40º C for Plains and at least 30º C for Hilly regions.
80
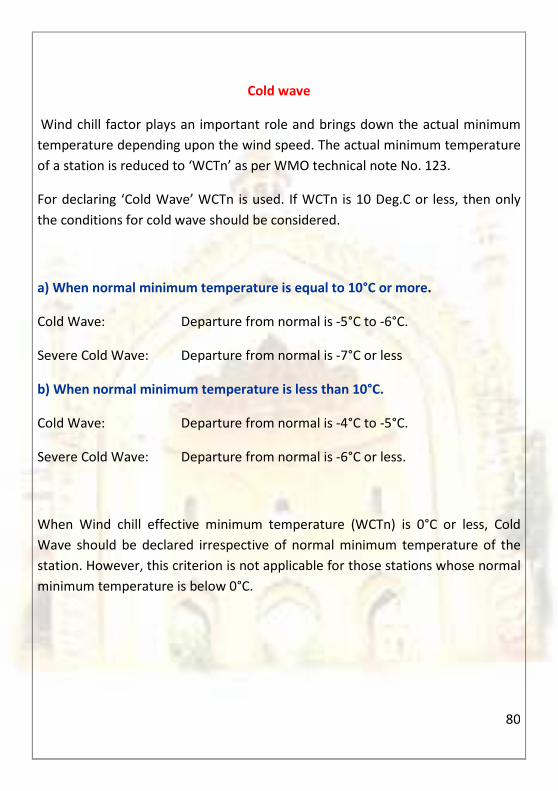
Cold wave
Wind chill factor plays an important role and brings down the actual minimum
temperature depending upon the wind speed. The actual minimum temperature
of a station is reduced to ‘WCTn’ as per WMO technical note No. 123.
For declaring ‘Cold Wave’ WCTn is used. If WCTn is 10 Deg.C or less, then only
the conditions for cold wave should be considered.
a) When normal minimum temperature is equal to 10°C or more.
Cold Wave: Departure from normal is -5°C to -6°C.
Severe Cold Wave: Departure from normal is -7°C or less
b) When normal minimum temperature is less than 10°C.
Cold Wave: Departure from normal is -4°C to -5°C.
Severe Cold Wave: Departure from normal is -6°C or less.
When Wind chill effective minimum temperature (WCTn) is 0°C or less, Cold
Wave should be declared irrespective of normal minimum temperature of the
station. However, this criterion is not applicable for those stations whose normal
minimum temperature is below 0°C.